structural dynamic stability of noah’s ark - … · 504 m. f. horstemeyer, j. sherburn, d. polk,...
TRANSCRIPT

Structural Dynamic Stability of Noah’s Ark
Mark F. Horstemeyer, Ph.D., 1292 Chapel Hill Rd., Starkville, MS 39759Jesse Sherburn, M.S., 203 John Wesley Rd., Starkville, MS 39759Dean Polk, M.S., 123 Monrovia Cove Lane, Madison, AL 35757Andy Bryant, B.S., 209 Willow Bend, Starkville, MS 39759
AbstractIf the Genesis Flood was a catastrophic event that induced large scale wind driven waves, then
the ark that carried Noah and his family needed to be very stable upon large, sometimes random loads. This particular study has several research components that give greater insight into the structural dynamic stability of the ark: (1) a combined numerical-experimental modal analysis on a 1/200th scale ark structure quantifying the first three fundamental resonance frequencies and associated mode shapes: 528 Hz in pitch bending, 800 Hz in yaw bending, and 1000 Hz in torsion; (2) a computational modal analysis that links the 1/200th scale ark structure with the full scale structure of Noah’s Ark showing that the first fundamental frequency ranges from 1–4.5 Hz below the range of human resonances that typically range between 5–10 Hz; and (3) a 1/200th scale ark experimental study on turbulent, random loads with waves that scaled as high as 500 ft (152 m) showing that Noah’s Ark would be stable even under these extreme loads. This combined computational-experimental study clearly shows the stability of the ark under extremely large scale, deleterious conditions.
KeywordsNatural frequency, Dynamic analysis, Vibration, Stability, Finite element analysis, Noah’s Ark, Resonance
In A. A. Snelling (Ed.) (2008). Proceedings of theSixth International Conference on Creationism (pp. 503–510).Pittsburgh, PA: Creation Science Fellowship andDallas, TX: Institute for Creation Research.
IntroductionIn designing a structural entity such as Noah’s
Ark, one must consider the strength and the stiffness of the materials, which is related to the natural frequencies, where the designer is concerned about resonances. For resonant frequencies, strength is unrelated except to give an upper limit to what can be endured. In this particular study, we focus mainly on the stiffness, which really can be interpreted as examining the natural frequencies. The natural frequencies can affect the dynamic stability of the ark if random waves excite those modes, and the natural frequencies can excite human body resonances thus causing discomfort, nausea, and/or motion sickness. One type of dynamical motion of a structure relates to the vibration that a structure experiences. The structure will essentially balance around its equilibrium position, and this can occur with simple applied frequencies or under a multitude of frequencies at the same time, sometimes called random vibrations. In either case, understanding these different structural responses are important when designing a structural component or system. The resonant frequencies of a structure are of particular importance, because once an applied load approaches the resonant frequency of the structure, greatly enhanced displacements can occur that
can fracture the structure. A famous catastrophic event such as this occurred on the Tacoma Narrows Bridge in Washington in the 1940 when 42 mph (67 km/h) winds struck the bridge. This type of structural failure can be understood by considering the coupled aerodynamic and structural system, which requires rigorous mathematical analysis to reveal the degrees of freedom of the particular structure and the set of design loads imposed. Once the fundamental natural frequencies were realized from the winds inducing local vortices, great displacements were amplified and the bridge fell due to the large overloads. Different frequencies and their associated mode shapes arise depending on the mass and stiffness distribution of any structure. To date, these values for Noah’s Ark have not been solved for according to the authors’ knowledge.
Whitcomb and Morris (1961) qualitatively discussed the structural stability of the ark in their classic book The Genesis Flood. Later, Morris (1975) by way of a simple analytical calculation on the ark stability used energy methods to show that the geometric dimensions of the ark make it stable up to 90 degrees in the roll direction. Woodmorappe (1996) further studied many aspects of the ark but not the details of fundamental resonances and the associated structural stability. To date, neither computational studies nor smaller

M. F. Horstemeyer, J. Sherburn, D. Polk, & A. Bryant 504
scale experiments have been performed to analyze the structural stability of the ark under catastrophic conditions that induce turbulent water behavior and the subsequent ark response. Since we do not really know the mechanical or physical properties of gopher wood, we have performed a coupled numerical-experimental study that extends these previous works in order to provide further understanding of Noah’s Ark.
The multiscale analysis methodology goes as follows: first a 1/200th scale ark was built of white oak and studied for its natural frequencies and associated mode shapes; second, finite element analysis of this structure was performed to calibrate the model with the experimental effort with white oak; third, different wood types and size alterations to the biblical ark dimensions could be used to help quantify the life size ark structural dynamic stability, and third random vibrations can be applied to the 1/200th scale ark to study the relative stability of large scale waves that could be realized with the large scale ark as described in the Bible.
Numerical-Experimental Modal Analysis of Subscale Ark
A modal analysis is an experimental method of determining the resonant frequency of a structure. A 1/200th scale ark after the Genesis 6: “the length of the ark shall be 300 cubits, the breadth of it 50 cubits, and the height of it 30 cubits.” If one is to assume that a cubit is 18 inches (45.7 cm), we reproduced a prototype ark that was scaled 200 times smaller. For our study, an accelerometer was placed upon the 1/200th scale ark to determine the acceleration-time response once an input acceleration was applied. The frequency response function is the output divided by the input response of the accelerometer. Once the frequency response function is formulated to the frequency domain through a Fast Fourier Transform (FFT), the peaks are the resonance frequencies and can be routinely determined in a structure. Figure 1 illustrates the experimental set-up used for the ark.
The model ark used in this study was a 1/200th scale model of the one described in Genesis 6 and was made of white oak. The Genesis 6 description of the wood was “gopher” wood, which is not known today. In Woodmorappe’s (1996) analysis, teak may have been the ancient gopher wood, because it has been found in ancient Babylon and has the ability to resist deterioration with acceptable strength. However, gopher wood is not constrained to the location where the ark finally rested. The ark could have been built anywhere in the pre-Flood continent. Also, gopher wood became an obscure term without any relevant connection to modern terminology. As such, we really do not know what gopher wood is to this day. Since
we know the analytical form of the first fundamental natural frequency (resonance) of an idealized beam, our hope was to ascertain the results for the white oak and then scale up the results and evaluate the answers with respect to other wood materials. The simplest analytical beam natural frequency equation is given by the following:
(1)
Where E is the elastic modulus of the material, m is the mass of the material, and ρ is the density of the material; the ratio E/ρ is given in many handbooks for various wood types. I is the cross-sectional moment of inertia and has to do with the resistance to bending, and L is the length of the beam, and A is the cross-sectional area. From equation (1), the natural frequency will scale according to L-2; hence, one can easily see that the 1/200th subscale model will have a much larger resonant frequency than the true ark of Noah’s time.
Finite element meshes were developed for the 1/200th scale ark model and a full size ark. The finite element code used for the simulations was ABAQUS (2006), which is a thermomechanical, implicit nonlinear code that can be used for modal analysis as well as deformation, stress, and failure analysis. The mesh used in both the subscale and full scale analysis is shown in Figure 2 comprising 2,408 shell elements. Solid continuum elements were also used, but the answer was identical to the shell response so the shell elements were chosen for their increase in computational speed. This analysis has more resolution than the Hong et al. (1994) analysis which employed a linear code at the time.
In the subscale experiments, the first several
Figure 1. Natural frequency test set-up of 1/200th scale model ark with impulse hammer, accelerometer, and free-free boundary conditions using bungee cords.
ωρ1 3 2
12 1 12= =
EImL L
E IA

505Structural Dynamic Stability of Noah’s Ark
natural frequencies and their associated mode shapes were determined via experiments and finite element analysis. The experimental testing was completed in a fabricated plywood box placed on a solid concrete floor.The free boundary conditions needed for the modal analysis used two bungee cords connected to the sides as shown in Figure 1. The experimental equipment included an impulse hammer, an accelerometer, and a data acquisition system. The hammer was lightly tapped on the ark, and the accelerometer collected the ark’s acceleration. The hammer also sent data to the computer of the impulse given to the ark. These two signals were combined and through a Fast Fourier Transform gave a frequency response function.
The peaks in the frequency response functions revealed the resonance frequencies. The first bending mode, often referred to as the first fundamental frequency or resonance frequency, was 514 Hz. This relates to the first bending mode shape (pitch) shown in Figure 2 in the finite element analysis, which gave a resonant frequency for this mode at 528.5 Hz. The percentage difference from the numerical finite element analysis and experiment was approximately a 3% difference. A mesh refinement study was performed with the finite element analysis in order to ensure convergence of the results. Table 1 summarizes the number of elements used versus the first fundamental natural frequency. Clearly, as the number of elements increased, the first fundamental resonance converged on 528.5 Hz.
The second experimental resonant peak occurred at 799 Hz and was the second bending resonant frequency occurring in the yaw direction. The finite element simulation in Figure 3 illustrates this mode shape at a frequency of 740 Hz giving about a 7%
difference from the experiment. The two different bending moment mode shapes arose from the first to the second, because the cross sectional area of the model ark was rectangular. The third mode shape shown in Figure 4, although not determined experimentally, was 1003 Hz from the finite element simulation and was a purely torsional mode. Table 2 summarizes the comparison of the numerical and experimental results. The close comparisons of the subscale finite element simulations to the experiments is encouraging and provides credence to extending the finite element simulations to the actual larger scale ark dimensions.
Comparison to Different Types of WoodClearly the wood type determines the resonance
frequency of a wooden structure as illustrated from equation (1). The modulus to density ratio is given for many trees in the Wood Handbook (1999). White oak was the baseline 1/200th scale ark model material used in this study. It is a common structural material used in the USA and has easily quantifiable experimental physical and mechanical properties. When examining upper and lower bound cases for
(a) (b)
Figure 2. 1/200th subscale finite element simulation of first bending (pitch) mode shape at 530 Hz compares favorably with the experimental result of 514 Hz. (a) is the initial condition and (b) is the first bending mode shape (multiplied 10,000 for illustrative purposes).
Mode 1 (pitch)
Mode 2 (yaw)
Mode 3 (torsion)
FEA model 528 Hz 740 Hz 1003 HzExperimental values 514 Hz 799 Hz —Percentage difference 3% 7% —
Table 2. Comparison of the 1/200th scale Ark model showing the experimental modal frequencies and mode shapes compared to the finite element analysis.
# Elements Frequency (Hz)
Percentage Difference
606 525 6.8%2408 530.4 3.4%9730 528.4 ~0%
38658 528.6 —
Table 1. Mesh refinement study of finite element analysis related to the first fundamental resonant frequency of 1/200th scale Ark model.
(a) (b)
Figure 3. 1/200th subscale finite element simulation of second bending (yaw) mode shape at 740 Hz compares favorably with the experimental result of 799 Hz. (a) is the initial condition and (b) is the second bending mode shape (multiplied 10,000 for illustrative purposes).
(a) (b)
Figure 4. 1/200th subscale finite element simulation of third mode shape (torsion) at 1003 Hz. (a) is the initial condition and (b) is the third mode shape (multiplied 10,000 for illustrative purposes).

M. F. Horstemeyer, J. Sherburn, D. Polk, & A. Bryant 506
the modulus to density ratio, two wood types arise: Indian Rosewood and Noble Fir. As such, in the FEA work, we not only examined White Oak, but we examined the Indian Rosewood and Noble Fir as well. The identity of the wood that was used in Noah’s Ark, called gopher wood in Genesis 6, is still unknown. Woodmorappe (1996) suggests that teak may have been the gopher wood. We have also included this material in our FEA studies as well.
The parametric results examining the different materials are shown in Table 3. Note the range difference between the Indian Rosewood and Noble Fir are almost three times, yet the first fundamental resonance frequency is fairly close. The range of resonance frequencies for the full scale ark between the different materials was 2.7 to 4.5 Hz. These small frequencies arise, because of the large length of the Ark and the large mass (recall equation 1). It is highly likely that gopher wood would be in this range as well. We also note from Table 3 that the strengths are not that much different from each other. All of these arguments point to the fact that gopher wood may not have been a special wood required to make the ark be successful as the other wood types seem to give fairly close results to each other.
Comparison of Mass Changes in the Ark
Equation 1 clearly shows a direct relationship of the mass to the resonance frequency of the structure. As such, we examined two limiting cases (lightweight and heavyweight) for the resonance frequencies of the
1/200th scale ark and then compared them to the full scale ark. To determine the lightweight and heavyweight scenarios, we arbitrarily added water to the experimental 1/200th scale ark. We then introduced large random waves to provide a more
turbulent environment for the ark to examine if the natural frequencies could be excited to a level that instabilities could be realized in the ark.
The free-standing weight of the 1/200th scale ark was 3 lbs. (1.362 kg), and the displacement in the water was approximately 0.25 inches (6.34 mm) as measured experimentally. Figure 5 shows that using Archimedes principle for weight in water (considering buoyancy), the lightweight subscale model weighed 1.11 lb. We also added some water to the subscale ark to “simulate” the animals, food, water, etc. The displacement is also shown in Figure 5 to be 1.75 inches (44.4 mm) (approximately 7.82 lbs or 3.55 kg). Waves were randomly applied to both the lightweight and heavyweight ark in order to study the stability that the ark supplied from such “large” scale waves. An 18 ft (5.5 m) by 36 ft (11 m) swimming pool was used, and the 1/200th scale ark was placed in the center of the swimming pool in which the water was at a depth of 5 ft (1.5 m). A large board was used to instigate large, random waves, and a professional photographer videotaped the subscale ark motion. A measurement scale was placed on the side of the ark to calibrate the size of the waves.
With our lightweight and heavyweight subscale designs, we wanted to analyze the natural frequencies and mode shapes for the subscale and full scale models. The subscale models employed the weights measured and calibrated from the 1/200th scale ark. Table 4 summarizes the results garnered from the finite element analysis. As noted
Wood Modulus (MPa)
Density (kg/m3)
Strength (kPa)
Modulus/Density
Mass of Ark (kg)
1/200th scale ark ω1 (Hz)
Full Scale Ark (Hz)
Indian Rosewood
8200 840.1 31200 9.76 9.90E+06 NA 2.7
White Oak, Bur
7100 716.9 41800 9.90 8.45E+06 528 2.7
Teak 9400 616.0 41100 15.26 7.26E+06 NA 3.3Noble Fir 11900 436.8 42100 27.24 5.36E+06 NA 4.5
Table 3. Comparison of wood types and scaling to the full size dimensions using FEA.
1.75 inches
0.25 inches
Waterline
Lightweight ark(1.11 lbs)
Heavyweight ark(7.82 lbs)
Figure 5. Comparison of lightweight (1.11 lbs in water) and heavyweight (7.82 lbs in water showing the water line on the 1/200th scale ark model.

507Structural Dynamic Stability of Noah’s Ark
earlier, the lightweight subscale model experienced a first fundamental frequency of 514 Hz, but the heavyweight subscale ark experienced a resonance frequency of 200 Hz. This much lower value can be qualitatively expected if one thinks about equation (1). As the mass increased, the natural frequency decreased. When extrapolated to the full size ark of Noah, the natural frequencies were 2.7 Hz and 1.02 Hz for the lightweight and heavyweight, respectively. Interestingly, Woodmorappe (1996) estimated some additional weight from the baseline lightweight version by adding weight for food, water, waste, etc. for a total of 17,000 tons similar to the estimates by Hong et al. (1994) of 17,000 tons for a lightweight vessel and 21,000 tons for a heavyweight vessel. When these numbers were added and calculated to the full scale finite element simulation, the first fundamental resonance frequency was 1.73 Hz. The reader should reflect on this result. The full scale 2.7 Hz and 1.02 Hz limits were determined from large scale finite element simulations based upon the subscale experimental weights and structure; hence, the weights are arbitrary. The Woodmorappe value was solely determined from Woodmorappe’s detailed mass analysis. As such, the closeness of the results is very encouraging since they came from independent sources.
Wall Thickness VariationsAnother unknown parameter that could affect the
natural frequency and dynamic stability of the ark is the wall thickness of the structural components. The thickness not only plays a role in the mass of the structure but probably more importantly the moment of inertia is directly affected. Hong et al. (1994) assumed a 0.30 m wall thickness in their study. We included
that value as a lower bound in our simulations. Table 5 shows some interesting trends. The first bending mode (pitch) had a maximum of 5.4% difference in resonant frequency when comparing the 0.30 to 2.10 m wall thicknesses. The changes were slightly higher for the yaw bending mode with a maximum of 11.4% change. Although these differences were discernible, clearly the greatest change in the wall thickness changes affected the torsional mode: with the same thickness changes as the bending modes, the maximum frequency in the torsional mode changed to 61%. Clearly, the wall thickness changes affected the torsional mode more than the mass and wood type changes.
Number of FloorsThe final parameter varied in the finite element
analysis was adding floor levels to the ark. The FEA ark model was hollow and contained no levels. Genesis 6:16 states “. . . with lower, second, and third stories shall you make it,” so it is clear in that the ark contained separate floors. Two levels were added and compared to the case with no extra levels. Table 6 summarizes the results. Although one would think that adding the two floors would stiffen the ark and raise the natural frequency, the added mass actually decreased the natural frequency for the first three fundamental modes. The first mode decreased by approximately 15% but the second and third modes essentially experienced less than 1% increase in the fundamental frequency.
Could Random Wave Vibrations Induce the Resonances to Cause Ark Turnover?
If the natural frequency is realized in the ark during random wave excitation, some other phenomena could also be excited. These phenomena include slamming and whipping. Slamming in modern ships can occur in rough weather, when the bow breaks free of the water only to re-enter quickly, which can excite “whipping” of the hull. Whipping is a hull vibration with a fundamental two-noded frequency. The conditions for the occurrence of slam impact were first proposed by Szebeheley and Todd (1955) and later used by Tick (1958) in the development of his theory for predicting the number of slams per unit time. Ochi (1964) and Ochi and Motter (1973) performed studies showing
the relation between occurrence and severity of ship slamming at sea and the associated hull response. Jiao (1996) showed schematically and mathematically how the whipping and wave-induced stresses
1/200th Scale Ark First Mode
Full Scale Ark First Mode
Lightweight (1/200th scale) experiment 514 Hz 2.7 Hz
Heavyweight (1/200th scale) experiment
200 Hz 1.02 Hz
Woodmorappe (2003) estimation of greatest weight
NA 1.73 Hz
Table 4. Comparisons of weight changes on modal frequencies in Ark.
Thickness (m)
Mode 1 (pitch bending)
Percentage Difference
Mode 2 (yaw bending)
Percentage Difference
Mode 3 (torsion)
Percentage Difference
0.9 thickness 2.6525 NA 3.4828 NA 3.9969 NA1.2 thickness 2.6866 1.3% 3.6495 4.8% 4.8345 21%1.5 thickness 2.7231 2.7% 3.6879 5.9% 5.3849 35%1.8 thickness 2.7135 2.3% 3.6676 5.3% 5.546 39%2.1 thickness 2.7444 3.5% 3.7074 6.4% 5.6775 42%
Table 5. Changes in wall thickness using full scale FEA.

M. F. Horstemeyer, J. Sherburn, D. Polk, & A. Bryant 508
One final topic related to the mass effect is worth noting. Morris (1971) performed a simple analytical study that showed using an energy-stability method that the ark’s geometry should keep the ark upright up to 90 degrees in the roll direction. Professional videotaping was taken of the lightweight and heavyweight designs and Figures 6–11 show the initial still water conditions along side some pictures that show “large” waves splashing against the subscale ark. Figure 6–8 show the lightweight case, and Figures 9–11 show the heavyweight case. After examining many waves from the video footage, these illustrative pictures demonstrate the extreme resistance that the ark could withstand. Figures 7–8 show peak waves of 32 inches (0.81 m) and 34 inches (0.86 m) striking the subscale model, which
were correlated. The slamming wave typically generates the first peak of a compressive (sagging) whipping stress on the deck as the wave-induced stress passes from hogging to sagging. Probably most importantly, Jiao showed how the natural frequency of the structure was associated with hogging and sagging displacements, stresses, and fatigue damage levels as demonstrated on the Wolverine State, a ship in which he focused his study. Due to time and space limitations, the calculations for slamming displacements, stresses, and fatigue damage will not be pursued in this writing; however, we note that the structural fundamental natural frequencies need to be quantified first before these other quantities can be solved. As such, we will pursue the displacements, stresses, and fatigue damage in another study.
Figure 6. Free standing lightweight 1/200th scale ark model before waves. The marker on the lower right of the ark is a 1 inch marker. The weight of the vessel was 1.11 lbs. The depth from the bottom of the boat to the water line was 0.5 inches.
Figure 7. 1/200th scale ark model showing high wave action for the lighter weight model. The white lines demark the trough and peak of a wave. In this picture, the size is 34 inches relating to a 566 ft wave. The ark did not tip over in any of the circumstances.
Figure 8. 1/200th scale ark model showing high wave action for the lighter weight model. The white lines demark the trough and peak of a wave. In this picture, the size is 32 inches relating to a 533 ft wave. Again, the ark did not tip over in any of the circumstances.
Figure 9. 1/200th scale ark model showing the baseline for the heavier weight model. The weight of the vessel with the extra water simulating food, animals, etc. was 7.82 lbs. The depth from the bottom of the boat to the water line was 1.75 inches.
509Structural Dynamic Stability of Noah’s Ark
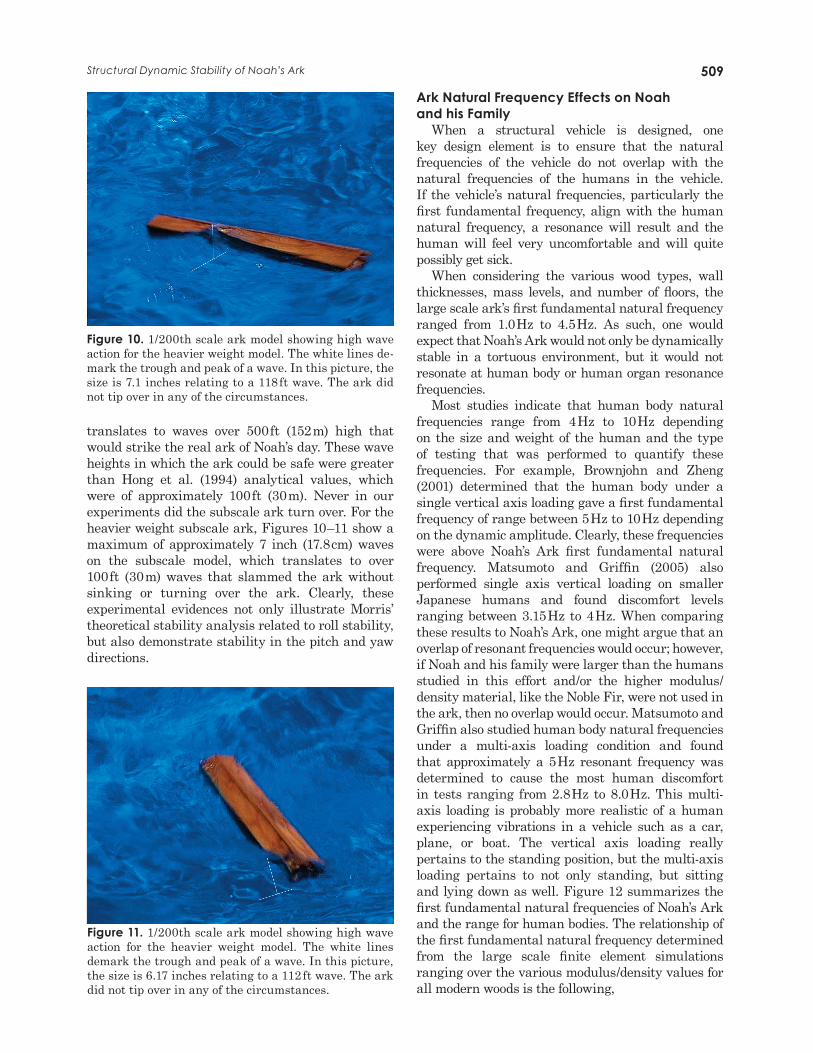
translates to waves over 500 ft (152 m) high that would strike the real ark of Noah’s day. These wave heights in which the ark could be safe were greater than Hong et al. (1994) analytical values, which were of approximately 100 ft (30 m). Never in our experiments did the subscale ark turn over. For the heavier weight subscale ark, Figures 10–11 show a maximum of approximately 7 inch (17.8 cm) waves on the subscale model, which translates to over 100 ft (30 m) waves that slammed the ark without sinking or turning over the ark. Clearly, these experimental evidences not only illustrate Morris’ theoretical stability analysis related to roll stability, but also demonstrate stability in the pitch and yaw directions.
Ark Natural Frequency Effects on Noah and his Family
When a structural vehicle is designed, one key design element is to ensure that the natural frequencies of the vehicle do not overlap with the natural frequencies of the humans in the vehicle. If the vehicle’s natural frequencies, particularly the first fundamental frequency, align with the human natural frequency, a resonance will result and the human will feel very uncomfortable and will quite possibly get sick.
When considering the various wood types, wall thicknesses, mass levels, and number of floors, the large scale ark’s first fundamental natural frequency ranged from 1.0 Hz to 4.5 Hz. As such, one would expect that Noah’s Ark would not only be dynamically stable in a tortuous environment, but it would not resonate at human body or human organ resonance frequencies.
Most studies indicate that human body natural frequencies range from 4 Hz to 10 Hz depending on the size and weight of the human and the type of testing that was performed to quantify these frequencies. For example, Brownjohn and Zheng (2001) determined that the human body under a single vertical axis loading gave a first fundamental frequency of range between 5 Hz to 10 Hz depending on the dynamic amplitude. Clearly, these frequencies were above Noah’s Ark first fundamental natural frequency. Matsumoto and Griffin (2005) also performed single axis vertical loading on smaller Japanese humans and found discomfort levels ranging between 3.15 Hz to 4 Hz. When comparing these results to Noah’s Ark, one might argue that an overlap of resonant frequencies would occur; however, if Noah and his family were larger than the humans studied in this effort and/or the higher modulus/density material, like the Noble Fir, were not used in the ark, then no overlap would occur. Matsumoto and Griffin also studied human body natural frequencies under a multi-axis loading condition and found that approximately a 5 Hz resonant frequency was determined to cause the most human discomfort in tests ranging from 2.8 Hz to 8.0 Hz. This multi-axis loading is probably more realistic of a human experiencing vibrations in a vehicle such as a car, plane, or boat. The vertical axis loading really pertains to the standing position, but the multi-axis loading pertains to not only standing, but sitting and lying down as well. Figure 12 summarizes the first fundamental natural frequencies of Noah’s Ark and the range for human bodies. The relationship of the first fundamental natural frequency determined from the large scale finite element simulations ranging over the various modulus/density values for all modern woods is the following,
Figure 10. 1/200th scale ark model showing high wave action for the heavier weight model. The white lines de-mark the trough and peak of a wave. In this picture, the size is 7.1 inches relating to a 118 ft wave. The ark did not tip over in any of the circumstances.
Figure 11. 1/200th scale ark model showing high wave action for the heavier weight model. The white lines demark the trough and peak of a wave. In this picture, the size is 6.17 inches relating to a 112 ft wave. The ark did not tip over in any of the circumstances.

M. F. Horstemeyer, J. Sherburn, D. Polk, & A. Bryant 510
(2)
It is clear that human resonant frequencies were greater than the first fundamental natural frequency induced from Noah’s Ark as gopher wood’s modulus/density was probably lower than 21 MPa-m3/kg. In Genesis 6:14, God told Noah to “make an ark of gopher wood.” It is highly probable then that Noah and his family did not get motion sickness from the resonances arising from the ark.
SummaryThis computational-experimental study is the
first of its kind to show the natural frequencies and associated mode shapes of Noah’s Ark and the subsequent effects of those frequencies on the dynamic stability of the ark and the effects of those frequencies on the human body. A 1/200th scale ark model made of white oak was created and used to determine the first three natural frequencies and their associated modes (pitch bending, yaw bending, and torsion). Finite element analysis was used to validate the 1/200th scale model and then used to extrapolate to the full scale ark. Parametric studies were performed on the mass, type of wood, number of floors, and wall thicknesses were performed. Although we could not identify gopher wood from modern woods from this
ω ρ1
0 5
0 84=
.
.
Estudy, clearly the first fundamental natural frequency of Noah’s Ark ranged from 1.0 Hz to 4.5 Hz regardless of the wood type, number of floors, thickness of the walls, and weight of the ark. These first fundamental natural frequencies were smaller than the natural frequencies of humans, thus no discomfort or motion sickness would arise from Noah’s Ark design. Finally, random wave water tests on the 1/200th scale ark model were performed to show the stability of the real size ark could withstand waves up to 500 ft (152 m).
AcknowledgmentThe authors would like to thank Lowell Thompson
for making the 1/200th scale ark for this study.
ReferencesBrownjohn, J. M., & Zheng, X. (2001). Discussion of human
resonant frequency. SPIE second international conference on experimental mechanics (Vol. 4317, pp. 469–474).
Hibbitt, Karlson, Sorenson, Inc. (2006). ABAQUS V6.5.Hong, S. W., Na, S. S., Hyun, B. S., Hong, S. Y., Gong, D. S.,
Kang, K. J., Suh, S. H., Lee, K. H., & Je, Y. G. (1994). Safety Investigations of Noah’s Ark in a seaway. Creation Ex Nihilo Technical Journal, 8(1), 26–36.
Jiao, G. (1996). Probabilistic prediction of extreme stress and fatigue damage for ships in slamming conditions. Marine Structures, 9, 759–785.
Matsumoto, Y., & Griffin, M. J. (2005). Nonlinear subjective and biodynamic responses to continuous and transient whole body vibration in the vertical direction. Journal of Sound and Vibration, 287(4–5), 919–937.
Morris, H. M. (1975). The Ark of Noah. In G. F. Howe (Ed.), Speak to the earth: Creation studies in geoscience (pp. 294–299). Nutley, New Jersey: Presbyterian and Reformed Publishing Company.
Ochi, M. K. (1964). Prediction of occurrence and severity of ship slamming at sea. 5th Symposium on Naval Hydrodynamics, Bergen, Norway.
Ochi, M. K., & Motter, L. (1973). Prediction of slamming characteristics and hull response for ship design. Annual Meeting of the Society of Naval Architects & Marine Engineers, New York.
Szebeheley, V. G., & Todd, M. A. (1955). Ship slamming in head seas. David Taylor Model Basin Report 913.
Tick, L. J. (1958). Certain probabilities associated with bow submergence and ship slamming in irregular sea. Journal of Ship Research, 2, 30–36.
Whitcomb, J. C., & Morris, H. M. (1961). The Genesis Flood. Phillipsburgh, New Jersey: P&R Publishing.
Wood Handbook: Wood as an Engineering Material (1999). General Technical Report FPL-GTR-113, Forest Products Laboratory, USDA: Madison, Wisconsin.
Woodmorappe, J. (1996). Noah’s Ark: A feasibility study. El Cajon, California: Institute for Creation Research
human bodyfirst fundamentalnatural frequency
frequency domainof overlap of wood
types for Noah’s Arkand a human body
Noah’s Arkfirst fundamentalnatural frequency
0 10 20 30 40 50
10
8
6
4
2
0
Modulus/density
First
Fund
amen
tal N
atura
l Fre
quen
cy (H
z) 12
Figure 12. A comparison of the first fundamental natural frequency with the modulus/density ratio of various wood types showing the relationship of Noah’s Ark potential frequency range and the human body frequency range. This suggests that the modulus/density ratio of gopher wood was probably below 21 MPa-m3/kg.