structural group analysis for soot reduction tendency of ... · combustion and flame 154 (2008)...
TRANSCRIPT
Combustion and Flame 154 (2008) 191–205www.elsevier.com/locate/combustflame
Structural group analysis for soot reduction tendencyof oxygenated fuels
P. Pepiot-Desjardins a,!, H. Pitsch a, R. Malhotra b, S.R. Kirby c,A.L. Boehman c
a Department of Mechanical Engineering, Stanford University, CA, USAb Chemical Science and Technology Laboratory, SRI International, Menlo Park, CA, USA
c The Energy Institute, Pennsylvania State University, PA, USA
Received 14 August 2007; received in revised form 17 March 2008; accepted 22 March 2008
Available online 29 April 2008
Abstract
Oxygenated additives are known to reduce soot formation in diesel engines. Numerous studies, both experimen-tal and numerical, have reported that the reduction of particulate emissions depends on the molecular structure ofthe additives. In this paper, a structural group contribution approach is proposed to interpret experimental obser-vations on the effect of oxygenated additives on the sooting propensities of hydrocarbon fuels. The statisticallybased method makes it possible to distinguish between chemical effects caused by the presence of oxygenatedgroups in the fuel mixture and mere dilution of the original fuel by the additive. The analysis was carried out onseveral experimental databases encompassing both premixed and nonpremixed configurations that include a newextensive set of smoke point measurements for mixtures of a given fuel with several oxygenated molecules. Thecurrent approach unifies the conclusions on the relative efficiency of the various oxygenated functionalities such asalcohols, esters, ethers, and carbonyl groups and provides a potential explanation for the seemingly contradictorytrends exhibited by some raw experimental data.! 2008 The Combustion Institute. Published by Elsevier Inc. All rights reserved.
Keywords: Oxygenated fuels; Smoke points; Group contribution method
1. Introduction
1.1. Background and previous observations
Numerous studies have shown that using oxy-genated molecules as additives to conventional dieselfuel can considerably reduce the amount of partic-
* Corresponding author.E-mail address: [email protected]
(P. Pepiot-Desjardins).
ulate matter (PM) in the exhaust, with additionalpotential benefits on NOx emissions. The chemicalmechanisms involved in the soot reduction processesare still not well understood. Among the unansweredquestions is the role of the specific structure of theoxygenate molecule. Although the fuel compositionhas been proven to have a first-order influence onsoot production [1–3], conflicting observations havebeen made about the relative impacts of differentoxygenated functional groups. Miyamoto et al. [4,5]showed that the Bosch Smoke (BS) number in theexhaust of a diesel engine was a decreasing func-
0010-2180/$ – see front matter ! 2008 The Combustion Institute. Published by Elsevier Inc. All rights reserved.doi:10.1016/j.combustflame.2008.03.017

192 P. Pepiot-Desjardins et al. / Combustion and Flame 154 (2008) 191–205
tion of the oxygen mass fraction in the fuel and thatthe slope of this function was fairly insensitive to thetype of oxygenated molecule used as additive. How-ever, Natarajan et al. [6] mentioned that the BS num-ber correlated with exhaust PM, and not necessarilywith in-cylinder soot production. Multiple studies ofdiesel–oxygenate blends in engines have been con-ducted [6–13], all showing a reduction of particulatematter emissions. The extent of these reductions de-pended on the oxygen content of the blends, the typeof oxygenate used, and the operating conditions of theengine. Overall, the authors consistently noted thatfuel properties other than oxygen content should playa role in the soot formation mechanism.
Mueller et al. [14,15] tested DBM and tripropy-lene glycol methyl ether (TPGME) in a constant-volume combustion vessel and a single-cylinder DIdiesel engine and found that the amount of soot pro-duced by the diesel/TPGME blend was half that ofthe DBM/diesel blend. These results were confirmedby numerical simulations with detailed chemical ki-netic mechanisms conducted in the same studies. Thesimulations indicated that nearly a third of the oxy-gen contained in the DBM additive was unavailablefor soot precursor reduction, and additionally, thisadditive had a high propensity to form acetylene,a well-known soot precursor. Recently, Westbrooket al. [16] performed simulations of rich premixedhomogeneous mixtures of n-heptane and oxygenatesand found that all additives tested reduced the con-centration of soot precursors, but with different effi-ciencies. For the same mass fraction of oxygen, esterswere less effective than alcohols or ethers. This re-sult was explained using the decomposition patternof the additives. The two oxygen atoms in esters arelinked to the same carbon atom and are more likelyto form CO2, whereas if the oxygen atoms are fur-ther apart, each of them remains bonded to a differ-ent carbon, preventing these carbons from becomingavailable for soot precursors. Szybist et al. [17] con-firmed these observations about ester decompositionwith engine studies. On the other hand, Pfefferle andco-workers [18–20] showed in a series of methanediffusion flame experiments that when oxygenates areused as dopants added in very small quantities to thefuel stream, the concentration of soot precursors in theflame actually increases. This surprising difference ofbehavior between diffusion and premixed flames ledWestbrook et al. [16] to conclude that soot produc-tion in diesel engines is primarily a premixed com-bustion problem. Another explanation demonstratedby this study is that methane is a relatively cleanfuel, producing very few soot precursors. It will beshown below that adding oxygenates, even in verysmall quantities, that have longer and more compli-cated hydrocarbon structures will introduce traces of
larger decomposition products prone to convert intosoot precursors.
The observed reduction or increase of PM emis-sions or soot precursor concentrations can be at-tributed to various phenomena aside from the modi-fication of the chemistry during the combustion pro-cess, including for instance the cetane number, boil-ing characteristics, or viscosity [21]. Also, many ex-periments have been conducted using non-negligibleamounts of oxygenated additives, from a few percentto sometimes 30% or more oxygen mass fraction inthe fuel. Depending on the oxygenate molecule, theseoxygen mass fractions can translate into a large liquidvolume or mole fraction of additives in the base fu-els. Oxygenates are mostly linear or slightly branchedparaffins containing oxygen moieties, whereas con-ventional diesel fuel is a mixture of several hundredhydrocarbon molecules containing about 20% aro-matics that are well known for their very strong soot-ing tendencies. Replacing part of these aromatics byparaffinic chains will decrease soot production, inde-pendent of the quantity or nature of the oxygen con-tained in the additive. To appraise the efficiency of theadded oxygen, this dilution effect of replacing highlysooting molecules with clean-burning hydrocarbonsmust be decoupled from the role of the oxygen itself.
1.2. Group contribution method
Identifying the chemical and physical processesinvolved in soot formation at the molecular levelrequires very detailed and exhaustive experimentalmeasurements, such as those of Bönig et al. [22] andXu et al. [23], that can be used to validate soot for-mation modeling, as done for example in the work ofAppel et al. [24]. However, this level of detail is avail-able only in a limited number of studies, most oftenin simple, well-controlled configurations. To obtain abroader picture of the efficiency of oxygenated addi-tives, a large number of different molecules and dif-ferent conditions must be explored, and systematicmethods of interpreting the resulting large volumeof data are needed. In the present work, a statisti-cal approach based on group contribution theory isproposed as one such method. It does not make anattempt to explain the role of the individual processescontributing to soot formation, such as polycyclic aro-matic hydrocarbons formation, nucleation, or surfacegrowth and oxidation. Instead, the proposed methodaims at interpreting the experimental data in termsof macroscopic variables such as the structure of themolecules or the amount of oxygen in the fuel. Thisapproach can be used as a screening procedure toidentify the most important characteristics of an effi-cient additive and provide guidelines to set up mean-ingful, more detailed experiments.

P. Pepiot-Desjardins et al. / Combustion and Flame 154 (2008) 191–205 193
Group contribution methods [25,26] have beenused extensively to estimate chemical and physi-cal properties of compounds. Different categories ofgroups can be defined to describe the structure of amolecule. The early work of Benson et al. [27,28]defines a group as a polyvalent atom with all of its lig-ands. Joback and Reid [29] consider the type of bondsa polyvalent atom has with its neighbors regardlessof the neighbors themselves. The structure-orientedlumping introduced by Quann and Jaffe [30] repre-sents individual hydrocarbon molecules as vectors ofincremental structural features. The topological for-malism and connectivity indices described in Kier andHall [31] were used to estimate the physical proper-ties of polymers in [32]. Once a structural descriptionof the molecules is chosen, the contributions of thegroups to a given physical or chemical property areestimated through various correlation techniques us-ing available experimental or numerical data. Thefitting techniques can be as simple as a linear regres-sion for simple additivity rules [33], or more com-plex, such as polynomial fitting [34], the UNIFACgroup contribution method [35,36], artificial neuralnetworks [37], or multilevel estimation methods [38].It is interesting to note that the validity of the groupcontribution method for the given set of data can berigorously assessed a posteriori using the results ofthe data fitting.
The reliability of a group contribution method de-pends largely on the quantity and quality of the avail-able data. A majority of the studies on oxygenated ad-ditives mentioned above consider only small samplesof oxygenated molecules. Moreover, sooting tenden-cies are measured using different techniques, over dif-ferent types of engines and operating conditions. Assuch, those data are not exploitable for a simple statis-tical analysis. In this work, a database of smoke pointmeasurements of base fuel/oxygenate blends suitablefor such an analysis is created. Smoke point is a goodsurrogate for actual diesel engine emissions, as its in-verse, the threshold sooting index (TSI), correlatesvery well with actual PM emissions [39]. In the fol-lowing, the experimental setup and acquisition tech-nique for this previously unpublished database willbe described briefly. The smoke point measurementswill serve as a basis for presenting the group contri-bution method adopted in this work and the type ofvaluable information that can be extracted from theresults. To broaden the scope of this analysis, twoadditional databases are examined in a similar way,namely the simulated soot precursor levels in richhomogeneous reactors using n-heptane/oxygenate/airblends from Westbrook et al. [16], and the series ofdoped methane diffusion flames from Pfefferle andco-workers [18–20]. Although the number of data islimited, and the experimental and modeling uncer-
tainties are non-negligible, results consistently showthat oxygen has a beneficial effect on soot emissions,in contrast to some previous claims. Clear trends canbe drawn for each of these experimental sets, withether and alcohol functional groups being more ef-fective than esters for the same quantity of oxygenin the fuel mixture. An interesting feature highlightedby this work is the very high efficiency of ketone andaldehyde groups, although these kinds of moleculeshave seldom been used in actual engine tests, and rig-orous comparison of the carbonyl group to other func-tional groups such as alcohol, ester, or ether seems tobe missing in the literature.
2. Experimental database
Smoke point measurements were performed onan ASTM D1322 standard [40] smoke point testlamp manufactured by Petrolab. A black-painted steelframe was used to house the lamp and reduce airdisturbances during measurements. Test proceduresfollowed the ASTM D1322. Kerosene standard wasmeasured prior to any test samples to calibrate the re-sults obtained. At least three readings of the flameheight were taken for each sample and then aver-aged and corrected by the standard measurement.Fuel blends of two base fuels doped with variousoxygenated molecules were prepared to provide arange of atomic oxygen concentrations from 0 to20 wt%. The smoke point of the first desired basefuel, n-heptane, was found to be very high (45 mm).It would, therefore, have been impractical as a basefuel for a study investigating potential improvements,and thus increases, in smoke point. Instead, 35 vol%toluene was blended with n-heptane and used asa base fuel. The second base fuel was an ultra-low-sulfur BP15 diesel fuel. The various moleculesscreened are described in Tables 1 and 2. Alcohol,ether, ester, ketone, and aldehyde functional groupsare represented, along with mixed alcohol–ether andester–ether molecules.
The threshold sooting index (TSI) introduced byCalcote and Manos [41] was used instead of thesmoke point to analyze the experimental results. TSIis a linear function of the reciprocal of the smokepoint (SP) involving the molecular weight (MW) ofthe molecule:
(1)TSI = a
!MWSP
"+ b.
The a and b constants are fitted using two referencecompounds so that the TSI can be used universally, in-dependent of the apparatus used. The values a = 3.32and b = "1.47 proposed by Gill and Olson [42] areused to convert the smoke point measurements into

194 P. Pepiot-Desjardins et al. / Combustion and Flame 154 (2008) 191–205
Table 1Oxygenated molecules screened in the smoke point experiments—Part I
Name Shortname
Formula Structure Functionalgroups
MW[g/mol]
!liq[kg/L]
n-Heptane NC7 C7H16 Alkane 100 0.68
Toluene TOL C7H8 Aromatic 92 0.86
Methanol MeOH CH4O Alcohol 32 0.787
Ethanol EtOH C2H6O Alcohol 46 0.787
Butanol ButOH C4H10O Alcohol 74 0.81
Hexanol HexOH C6H14O Alcohol 102 0.81
Octanol OctOH C8H18O Alcohol 130 0.824
Diethyl ether DEE C4H10O Ether 74 0.71
Dimethoxymethane DMM C3H8O2 Ether 76 0.86
Diglyme DEGDE C6H14O3 Ether 134 0.95
Monomethyl ether DEGME C5H12O3 Ether, alcohol 120 1.04
2,2-Dimethoxypropane 2,2DMP C5H12O2 Ether 104 0.85
Methyl acetate MA C3H6O2 Ester 74 0.932
Ethyl acetate EA C4H8O2 Ester 88 0.897
Methyl propanoate MP C4H8O2 Ester 88 0.91
Ethyl propanoate EP C5H10O2 Ester 102 0.884
Methyl butanoate MB C5H10O2 Ester 102 0.893
Ethyl butanoate EB C6H12O2 Ester 116 0.874
Diethyl carbonate DC C5H10O3 Ester 118 0.97
TSI. The introduction of the molecular weight offsetsthe minor flame height increase caused by the in-creased fuel molecular weight, which requires a largerair/fuel volume ratio for stoichiometric combustion.TSI was preferred over smoke point because of itssimple mixing rule [42],
(2)TSImix =#
k
XkTSIk.
In this equation, TSImix is the TSI of the mixture, andXk and TSIk are the mole fraction and the TSI of the
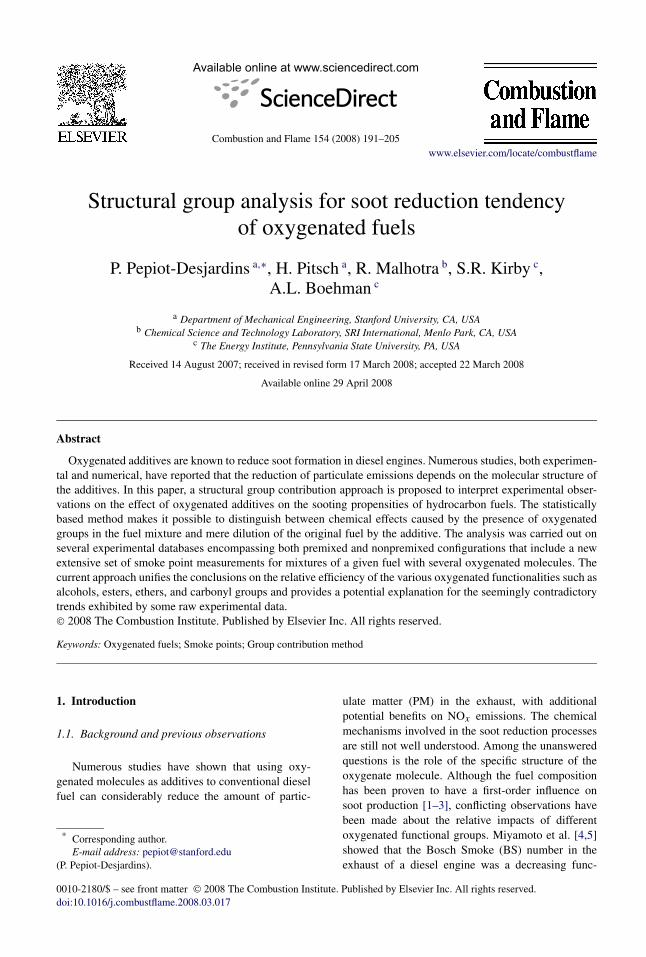
pure component k, respectively. A fuel with a strongsooting tendency will have a small smoke point andconversely a large TSI. The experimentally measuredTSIs are presented in Figs. 1 and 2.
The larger the amount of oxygen in the mixtureis, the smaller the TSI is. For the same mass frac-tion of oxygen in the mixture, very different lev-els of improvement can be obtained. Additives suchas aldehydes or long-chain alcohols are seeminglythe most effective compared to other types of func-tional groups such as esters or ethers. However, part

P. Pepiot-Desjardins et al. / Combustion and Flame 154 (2008) 191–205 195
Table 2Oxygenated molecules screened in the smoke point experiments—Part II
Name Shortname
Formula Structure Functionalgroups
MW[g/mol]
!liq[kg/L]
Acetone Acetone C3H6O Ketone 58 0.79
2-Pentanone 2PentCO C5H10O Ketone 86 0.802
3-Pentanone 3PentCO C5H10O Ketone 86 0.815
Cyclohexanone CHexCO C6H10O Ketone 98 0.942
Butanal ButCOH C4H8O Aldehyde 72 0.80
Pentanal PentCOH C5H10O Aldehyde 86 0.805
Hexanal HexCOH C6H12O Aldehyde 100 0.81
of the TSI improvement comes from the replace-ment of some of the highly sooting aromatic compo-nents in the base mixture by linear substituted alka-nes that burn cleaner. The importance of this dilutioneffect is illustrated by the following example. Con-sider the sooting tendency of three mixtures: the puren-heptane/toluene base fuel, a mixture of base fueland a certain volume of hexanol corresponding toYO = 4.1%, and a mixture of base fuel and the samevolume of n-heptane. Resulting TSI and mass frac-tion of carbon from straight aliphatic chains, YC,lin,are shown in Table 3 for the three mixtures. In this ta-ble, VA is the additive volume fraction, XNC7 , XTOL,and XOH are the mole fractions of n-heptane, toluene,and hexanol, respectively. TSIs for the base fuel andhexanol/base fuel mixture are taken directly from ex-periments. The TSI of the n-heptane-substituted mix-ture is evaluated using the TSI mixing rule shown inEq. (2). The hexanol mixture has a TSI value 20%lower than the initial n-heptane/toluene base fuel.However, the n-heptane-substituted mixture presentsa 12.5% improvement compared to the initial fuel,solely because part of the toluene has been replacedby a straight-chain alkane. The mass fraction of car-bon contained in the aliphatic part of the mixture issimilar for hexanol- and n-heptane-substituted mix-tures, so that the difference of TSIs between thesemixtures can be attributed to the sole presence ofoxygen. Thus, the oxygen in the alcohol molecule ac-counts for about a third of the total TSI improvementonly, and the remaining contribution comes from thedilution of toluene by alkanes.
The decoupling between dilution and oxygen ef-fects can be done directly only for a few simple cases,such as the previous example, when data for alkaneswith the same structure as the oxygenated moleculeare available. The goal of the present work is to usestructural group analysis to quantify in a systematicfashion the effect of each oxygenated moiety on thesooting tendency of a fuel, independent of the hydro-carbon part of the molecule. This analysis will pro-vide two additional outcomes: first, it will give a strat-egy to estimate the sooting tendency of a molecule forwhich no experimental data are known. Second, it willprovide theoretical insights into how to combine hy-drocarbon parts and oxygen moieties in a molecule toget the largest reduction in sooting tendency for theconfigurations considered in the study.
3. Interpretation of smoke point database usinga statistical approach
3.1. Group additivity theory
The group additivity theory introduced by Ben-son et al. [27,28] was developed initially to estimatethermodynamic properties of molecules for which nodata were available. This technique considers nearest-neighbor interactions to estimate group contributions.The molecule is decomposed into groups defined aspolyvalent atoms with all their ligands. This groupdefinition is adopted here, and the groups are rep-resented following Benson’s notation. The polyva-lent atom is written in bold face, and its ligands are

196 P. Pepiot-Desjardins et al. / Combustion and Flame 154 (2008) 191–205
Fig. 1. Experimental threshold soot indices for oxygenates/n-heptane/toluene mixtures.
specified between brackets, after a dash. For exam-ple, a carbon atom linked to an oxygen atom andthree hydrogens is written as C-(O)(H)3. The base fu-els, either the n-heptane/toluene mixture or the BP15diesel fuel, are treated as a single lumped group.The groups are defined in Table 4. As stated in [27],the carbonyl group is treated as a single group, andthe methyl groups C-(C)(H)3, C-(O)(H)3, and C-(CO)(H)3 are not distinguished. Also, the limitednumber of molecules and types of groups available inthe TSI database requires that some groups be com-bined into generic or multiatom groups, such as theester group.
Two main classes can be identified: the end-groups, such as C-(C)(H)3 (#3), that appear at the endof a chain, and the midgroups, such as C-(C)2(H)2
(#6), that refer to polyvalent atoms appearing insidea chain. This distinction is important, since an oxy-genated end-group efficiency cannot be compared tothe efficiency of a hydrocarbon midgroup. The for-mer cannot be substituted for the latter. Also recordedin Table 4 is the number of occurrences of each groupin the database. The larger this number is, the higheris the confidence in the group contribution. A fewspecific groups appear in a single molecule only, andtherefore are associated with a higher uncertainty asto their contribution.
The TSI mixing rule, which was defined for mul-ticomponent fuel mixtures in Eq. (2), can be extendedeasily to the group level. The TSI of a mixture isexpressed as a linear combination of the TSI contribu-tion of each group in the mixture with a weighting fac-
P. Pepiot-Desjardins et al. / Combustion and Flame 154 (2008) 191–205 197
Fig. 2. Experimental threshold soot indices for oxygenates/diesel mixtures.
Table 3Illustration of the importance of the dilution effect
Additive VA XNC7 XTOL XOH YC,lin[%]
TSI
None 0.0 0.5738 0.4261 0.0 57.38 13.61a
Hexanol 0.2448 0.4295 0.3190 0.2514 66.91 10.86a
n-Heptane 0.2448 0.6687 0.3313 0.0 66.86 11.90b
a Experimental data.b Estimated using Eq. (2).
tor proportional to the mole fraction of the moleculeand the number of groups in this molecule:
(3)$TSI =nS#
i=1
Xi
%nG,i#
j=1
Nj,iCTSIj
&
.
In this equation, $TSI is the estimated TSI of the mix-ture, nS is the number of species in the mixture, nG,i
is the number of groups in species i, Nj,i is the num-ber of group of type j in species i, and CTSI
j is thecontribution of group j to TSI.
The coefficients CTSIj for each group are com-
puted through least-squares fitting of the experimentaldata, expressed as the optimization problem
(4)min"2 =nexp#
k=1
!TSIexp
k " $TSIk#k
"2,
where the standard deviation #k is estimated from themultiple measurements of each mixture k.
It must be emphasized that the assumption madein this analysis is that the data on threshold soot-ing indices can be described with good accuracy byEq. (3), which is based on the structural contributionsof the fuel only. This assumption will be validatedby comparing the actual data with the estimated val-
Table 4Structure, occurrences, and contribution of the groups in theTSI correlation study
Group ID Type Occurrences Contribution
Hept./tol. 0 Base fuel 77 13.5295a
Diesel 1 Base fuel 10 31.2279b
C-(C)(H)3C-(O)(H)3C-(CO)(H)3
3 End 148 1.4827
O-(C)(H) 4 End 19 0.2772CO-(C)(H) 5 End 9 "2.9917C-(C)2(H)2 6 Mid 59 0.3186C-(C)(O)(H)2 7 Mid 70 0.2624C-(C)(CO)(H)2 8 Mid 41 "0.5947C-(O)2(H)2 9 Mid 6 0.9712O-(C)2 10 Mid 42 "0.8028CO-(C)2 11 Mid 15 "1.728COO-(C)2 12 Mid 23 "1.8438COOO-(C)2 13 Mid 4 0.2111C-(C)2(O)2 15 Mid 3 1.5502Ring 16 Mid 2 6.1196
a TSIexp = 13.61.b TSIexp = 30.98.
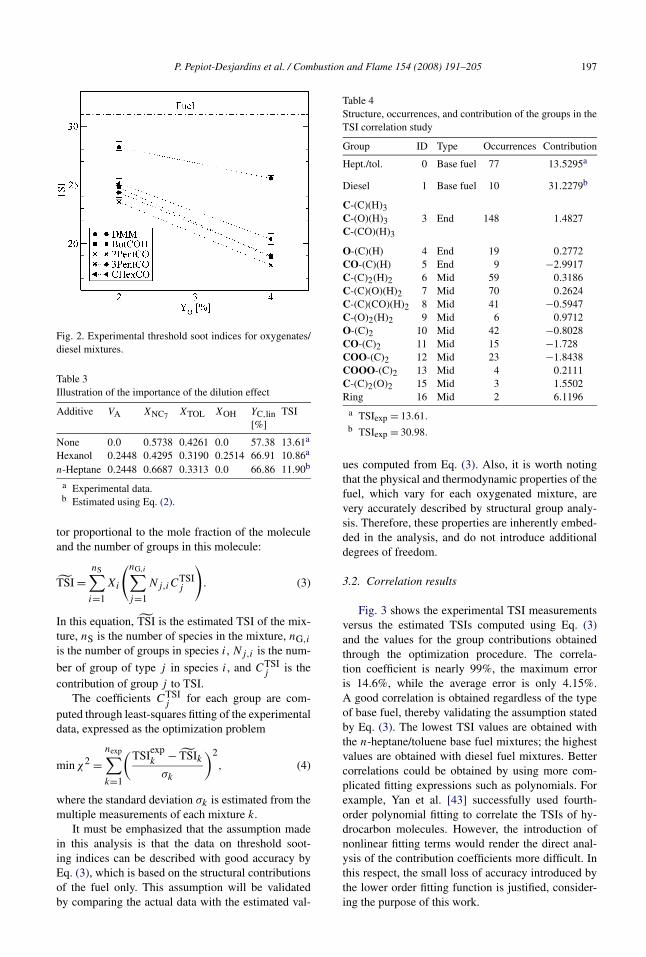
ues computed from Eq. (3). Also, it is worth notingthat the physical and thermodynamic properties of thefuel, which vary for each oxygenated mixture, arevery accurately described by structural group analy-sis. Therefore, these properties are inherently embed-ded in the analysis, and do not introduce additionaldegrees of freedom.
3.2. Correlation results
Fig. 3 shows the experimental TSI measurementsversus the estimated TSIs computed using Eq. (3)and the values for the group contributions obtainedthrough the optimization procedure. The correla-tion coefficient is nearly 99%, the maximum erroris 14.6%, while the average error is only 4.15%.A good correlation is obtained regardless of the typeof base fuel, thereby validating the assumption statedby Eq. (3). The lowest TSI values are obtained withthe n-heptane/toluene base fuel mixtures; the highestvalues are obtained with diesel fuel mixtures. Bettercorrelations could be obtained by using more com-plicated fitting expressions such as polynomials. Forexample, Yan et al. [43] successfully used fourth-order polynomial fitting to correlate the TSIs of hy-drocarbon molecules. However, the introduction ofnonlinear fitting terms would render the direct anal-ysis of the contribution coefficients more difficult. Inthis respect, the small loss of accuracy introduced bythe lower order fitting function is justified, consider-ing the purpose of this work.

198 P. Pepiot-Desjardins et al. / Combustion and Flame 154 (2008) 191–205
Fig. 3. Correlation between experimental TSIs and TSIs sim-ulated using Eq. (3). Error bars correspond to experimentaluncertainties.
The value of the group coefficients are shown inTable 4. The contributions from the base fuels are de-termined by the fitting procedure, but in both casesthese contributions are very close to the experimentalvalues. The very good agreement for the base fuelsconfirms that the linear mixing rule is appropriate forTSI.
The three groups in the end-group subset, namelymethyl (#3), alcohol (#4), and aldehyde (#5) groups,are interchangeable, and therefore, can be comparedwith each other. Clearly, replacing a methyl groupwith either of the two oxygenated groups results in asubstantial improvement in the sooting tendency. Thealdehyde group has the greatest impact, as its con-tribution is largely negative. This beneficial effect isamplified if the adjacent midgroup is considered. In-deed, the variety of oxygenated molecules makes itpossible to distinguish between a C atom sitting nextto another C (#6), an O (#7), or a carbonyl group (#8).Results show that a C atom next to an alcohol group(i.e., #7 next to #4), has a smaller coefficient than a Catom in a hydrocarbon chain (i.e., #6 next to #3), andthat a C atom next to a carbonyl group (i.e., #8 next to#5) even has a negative contribution to the TSI of themixture.
The contribution of the midgroups should be com-pared to the value of the midgroup C-(C)2(H)2 (#6).All oxygenated midgroups have beneficial effects onthe TSI, with the ester group having the most negativecontribution. However, if the contributions are givenper O atom, the carbonyl group in ketones is clearlythe most powerful, its effect being amplified by thenegative contribution of the group C-(C)(CO)(H)2(#8), to which the carbonyl group is linked most of-ten. The next most efficient group is the ether group,closely followed by the ester group. The diester group
(#13), present in this study in diethyl carbonate, onlyintroduces a slight improvement in sooting tendency.Having two ether groups close together with only oneC atom between them offsets part of the benefits ofthe oxygen, because of the relatively large positivecontribution of the group C-(O)2(H)2 (#9) comparedto the small contribution of C-(C)(O)(H)2 (#7). Thiseffect was observed by Cheng and Dibble [44], whoperformed experiments with DMM and DEE. For thesame oxygen mass fraction in the diesel blend, DMM,which contains group #9, was slightly less efficient atdecreasing PM emissions than DEE, which containsgroup #7. However, DEE contains half the amount ofoxygen of DMM, and thus requires twice the amountof additive for a similar PM reduction.
Branching tends to increase sooting tendency sig-nificantly. Replacing a midgroup C-(C)2(H)2 (#6)with the branching group C-(C)2(O)2 (#15) multi-plies the contribution of the group by 5; introducing aring (#16), as in cyclohexanone, multiplies this contri-bution by nearly 20. Although the number of experi-ments available for these types of groups is small, theeffect is large enough to allow the conclusion, sup-ported by previous work (for example, Gomez et al.[45]), that branched molecules have a stronger ten-dency to produce soot than linear ones.
3.3. Comparison between dilution effect and oxygenefficiency
In this section, the relative magnitudes of the di-lution and oxygen effects are discussed. The groupsare distributed into three distinct sets: the hydro-carbon groups, {H} = {3,6,15,16}, the oxygenatedend-groups, {OE} = {4,5}, and the oxygenated mid-groups, {OM } = {7,8,9,10,11,12,13}. The changein TSI due to dilution can be defined as the improve-ment that comes from the replacement of a part of thebase fuel by the additive, in which all oxygen groupshave been replaced by the corresponding end or mid-hydrocarbon groups (groups #3 or #6). This changecan be written as
$TSID = XA
! #
j#{H}NA,jCi +
#
j#{OE}NA,jC3
(5)+#
j#{OM }NA,jC6 " Cfuel
".
The TSI improvement due to oxygen can be definedas the difference between the contribution from theoxygenated groups and the contribution from the cor-responding hydrocarbon groups. This term is evalu-ated through the expression
$TSIO = XA
! #
j#{OE}NA,j (Ci " C3)
P. Pepiot-Desjardins et al. / Combustion and Flame 154 (2008) 191–205 199
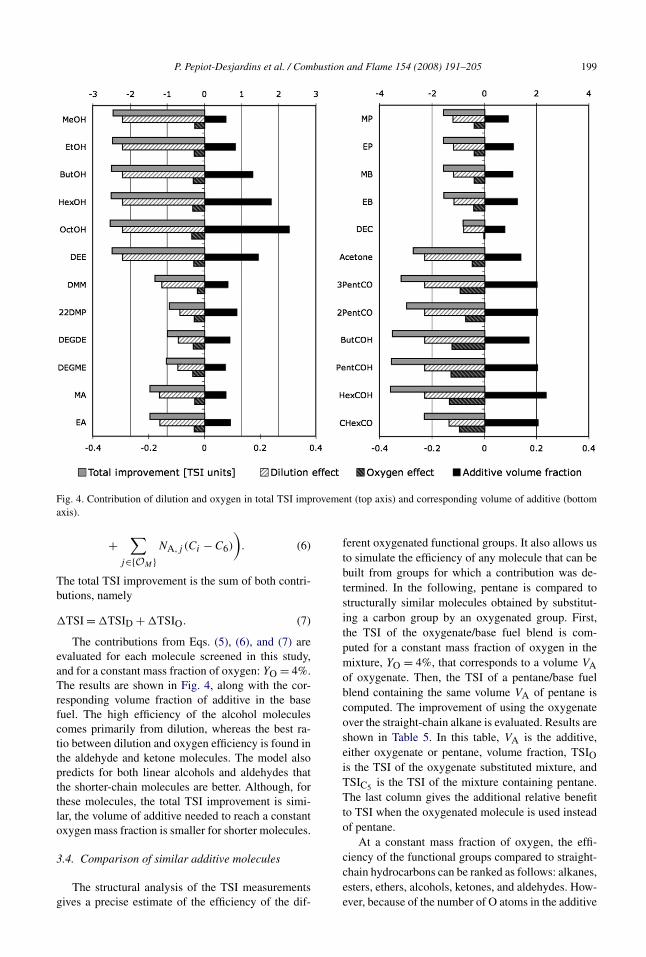
Fig. 4. Contribution of dilution and oxygen in total TSI improvement (top axis) and corresponding volume of additive (bottomaxis).
(6)+#
j#{OM }NA,j (Ci " C6)
".
The total TSI improvement is the sum of both contri-butions, namely
(7)$TSI = $TSID + $TSIO.
The contributions from Eqs. (5), (6), and (7) areevaluated for each molecule screened in this study,and for a constant mass fraction of oxygen: YO = 4%.The results are shown in Fig. 4, along with the cor-responding volume fraction of additive in the basefuel. The high efficiency of the alcohol moleculescomes primarily from dilution, whereas the best ra-tio between dilution and oxygen efficiency is found inthe aldehyde and ketone molecules. The model alsopredicts for both linear alcohols and aldehydes thatthe shorter-chain molecules are better. Although, forthese molecules, the total TSI improvement is simi-lar, the volume of additive needed to reach a constantoxygen mass fraction is smaller for shorter molecules.
3.4. Comparison of similar additive molecules
The structural analysis of the TSI measurementsgives a precise estimate of the efficiency of the dif-
ferent oxygenated functional groups. It also allows usto simulate the efficiency of any molecule that can bebuilt from groups for which a contribution was de-termined. In the following, pentane is compared tostructurally similar molecules obtained by substitut-ing a carbon group by an oxygenated group. First,the TSI of the oxygenate/base fuel blend is com-puted for a constant mass fraction of oxygen in themixture, YO = 4%, that corresponds to a volume VAof oxygenate. Then, the TSI of a pentane/base fuelblend containing the same volume VA of pentane iscomputed. The improvement of using the oxygenateover the straight-chain alkane is evaluated. Results areshown in Table 5. In this table, VA is the additive,either oxygenate or pentane, volume fraction, TSIOis the TSI of the oxygenate substituted mixture, andTSIC5 is the TSI of the mixture containing pentane.The last column gives the additional relative benefitto TSI when the oxygenated molecule is used insteadof pentane.
At a constant mass fraction of oxygen, the effi-ciency of the functional groups compared to straight-chain hydrocarbons can be ranked as follows: alkanes,esters, ethers, alcohols, ketones, and aldehydes. How-ever, because of the number of O atoms in the additive

200 P. Pepiot-Desjardins et al. / Combustion and Flame 154 (2008) 191–205
Table 5Relative efficiency of oxygenated additives compared to pentane in TSI experiments
Additive Formula Structure VA TSIO TSIC5 Improvement
Butanol C4H10O 0.1739 11.04 11.70 "5.62%
Methoxypropane C4H10O 0.1900 11.06 11.53 "4.09%
Diethyl ether C4H10O 0.1933 11.04 11.50 "3.92%
Methyl butanoate C5H10O2 0.1089 11.99 12.37 "3.14%
Ethyl propanoate C5H10O2 0.1099 11.98 12.36 "3.11%
Pentanal C5H10O 0.2027 9.99 11.40 "12.33%
3-Pentanone C5H10O 0.2017 10.35 11.41 "9.28%
2-Pentanone C5H10O 0.2033 10.57 11.39 "7.26%
molecule, esters require about half the volume of ad-ditive to achieve the oxygen mass fraction. Actually,looking at a constant volume fraction of additive, es-ter molecules are slightly more efficient than ethers.
4. Analysis of other databases
The goal of this section is to extend the structuralgroup analysis to other published databases. Becausethe method requires a sufficiently large set of datato be applicable, few exploitable studies were found.The first one is a numerical study by Westbrook etal. [16] of soot precursor concentration in a homo-geneous, fuel-rich environment. The second one isa collection of methane diffusion flames doped withvarious oxygenated fuels by Pfefferle et al. [18–20].
4.1. Simulated data of soot precursor concentrationreduction in homogeneous configurations
Westbrook et al. [16] conducted a numerical studyof the effect of oxygenate additives on the formationof soot precursors in a rich, homogeneous reactor. Thebase fuel is n-heptane and the oxygenated moleculesused in the study are described in Table 6. The per-centage of initial carbon mass present in the sootprecursor species at the end of the simulation is com-puted as a function of the mass fraction of oxygenin the n-heptane/oxygenate mixture. These percent-ages steadily decrease as the oxygen mass fractionincreases. The slope of the decrease depends on thetype of oxygenate added to the initial n-heptane fuel.
The groups used for the structural analysis are pre-sented in Table 7 and are similar to those used above.The modeling assumption is written as:
(8)'MC,SP =nS#
i=1
Xi
!nG,i#
j=1
Nj,iCMC,SPj
",
where 'MC,SP is the estimated mass of carbon in the
soot precursor species, and CMC,SPj is the contribu-
tion of group j to MC,SP. The correlation resultsare shown in Fig. 5. The correlation parameter R2
is more than 0.997 with a maximum error of 8.4%and an average error of 2.0%. The errors are smallfor all mixtures included in the analysis, which con-firms the validity of the assumption stated in Eq. (8).The group contributions are indicated in Table 7. Theoxygenated groups overall reduce the quantity of sootprecursors produced in the mixture during ignition, asthey all have a negative contribution.
Comparison of the efficiency of each group can bedone by comparing pentane with oxygenates havinga similar structure, namely butanol, methoxypropane,and methyl butanoate. To do so, the mass of carbonin soot precursors is computed using Eq. (8) for richmixtures (% = 3) of n-heptane/oxygenate/air for aconstant mass fraction of oxygen in the fuel/oxygenatemixture: YO = 4%. Then an equal mole fraction ofpentane is substituted for the oxygenates and the massof carbon in the soot precursors is recomputed andcompared. The various mixtures have an initial massof carbon that differs by a few percent only. This ef-fect can be neglected when compared to the differenceof efficiencies observed. The improvement of using

P. Pepiot-Desjardins et al. / Combustion and Flame 154 (2008) 191–205 201
Table 6Oxygenated molecules screened in Westbrook et al.’s [16] numerical study of n-heptane autoignition
Name Short name Formula Structure Functional groups MW [g/mol]
Methanol MeOH CH4O Alcohol 32
Ethanol EtOH C2H6O Alcohol 46
Dimethyl ether DME C2H6O Ether 46
Dimethoxymethane DMM C3H8O2 Ether 76
Methyl butanoate MB C5H10O2 Ester 102
Tripropylene glycol methylether TPGME C10H22O4 Ether, alcohol 206
Diethyl carbonate DC C5H10O3 Ester 118
Dibutyl maleate DBM C12H20O4 Ester 228
Table 7Structure, occurrences, and contribution of the groups inWestbrook et al.’s [16] numerical study of n-heptane au-toignition
Group ID Type Occurrences Contribution
C-(C)(H)3C-(O)(H)3
3 End 50 2.03662
O-(C)(H) 4 End 9 "8.67932
C-(C)2(H)2C-(C)(O)(H)2C-(C)(CO)(H)2
6 Mid 51 6.45243
O-(C)2 10 Mid 17 "6.57876COO-(C)2 12 Mid 11 "5.03328COOO-(C)2 13 Mid 4 "10.45359C-(C)3(H) 14 Mid 9 5.20552C-(C)(CO)(H) 17 Mid 8 5.93949
oxygenates instead of alkane is summarized in Ta-ble 8. The alcohol group appears to be more efficientthan the ether group, which itself is more efficientthan the ester group for a given oxygen mass fraction.The same order is recovered when the mixtures arecompared at constant mole fraction of additive. Thisranking is consistent with the observations made onthe smoke point database.
4.2. Methane diffusion flames with oxygenateddopants
Pfefferle et al. [18–20] published a series of meth-ane-doped flames, in which products were measuredusing mass spectrometry. The following analysis cor-relates the maximum amount of aromatic species
Fig. 5. Correlation between experimental and simulated car-bon mass in soot precursors species in Westbrook et al.’s [16]numerical study of n-heptane autoignition.
Table 8Relative efficiency of oxygenated additives compared topentane in Westbrook et al.’s [16] numerical study of n-heptane autoignition
Additive Formula XA Improvement
Butanol C4H10O 0.01414 "16.65%Methoxypropane C4H10O 0.01414 "9.18%Methyl butanoate C5H10O2 0.00713 "4.15%
measured in the flame with the initial composition ofthe mixture. The aromatic species include benzene,toluene, phenylacetylene, styrene, and naphthalene.Due to experimental uncertainties, there are somediscrepancies between the maximum mole fraction

202 P. Pepiot-Desjardins et al. / Combustion and Flame 154 (2008) 191–205
Table 9Oxygenated molecules screened in Pfefferle et al.’s [18–20] study of CH4 diffusion flames
Name Short name Formula Structure Functional groups MW [g/mol]
Butane NC4 C4H10 Alkane 58
iso-Butane IC4 C4H10 Alkane 58
Butanol ButOH C4H10O Alcohol 74
2-Butanol 2ButOH C4H10O Alcohol 74
iso-Butanol iButOH C4H10O Alcohol 74
tert-Butanol tButOH C4H10O Alcohol 74
Methyl butanoate MB C5H10O2 Ester 102
Methyl isobutyrate MIB C5H10O2 Ester 102
Ethyl propanoate EP C5H10O2 Ester 102
Propyl acetate PA C5H10O2 Ester 102
iso-Propyl acetate IPA C5H10O2 Ester 102
n-Butyl methyl ether NBME C5H12O Ether 88
sec-Butyl methyl ether SBME C5H10O Ether 88
Methyl tert-butyl ether MTBE C5H10O Ether 88
Ethyl tert-butyl ether ETBE C6H14O Ether 102
tert-Amyl methyl ether TAME C6H14O Ether 102
of aromatic species in the undoped methane flamesthat serve as reference flames. To limit the effectof those uncertainties, the maximum mass of car-bon in aromatics in each experiment is rescaled sothat each undoped flame produces the same amountof soot precursors. This normalization step obviously
introduces some incertitude in the correlation proce-dure, which should be kept in mind in comparingthe results of this analysis with those of the previ-ous databases. The molecules used in the series ofexperiments are presented in Table 9. They includelinear and branched alkanes, alcohol, ether, and ester

P. Pepiot-Desjardins et al. / Combustion and Flame 154 (2008) 191–205 203
Table 10Structure, occurrences, and contribution of the groups inPfefferle et al.’s [18–20] study of CH4 diffusion flames
Group ID Type Occurrences Contribution
CH4 2 Basefuel
17 0.004512
C-(C)(H)3C-(O)(H)3C-(CO)(H)3
3 End 42 0.014381
O-(C)(H) 4 End 4 "0.154549
C-(C)2(H)2C-(C)(O)(H)2C-(C)(CO)(H)2
6 Mid 19 0.107717
O-(C)2 10 Mid 5 "0.099775
COO-(C)2 12 Mid 5 "0.087588
C-(C)3(H)C-(C)2(O)(H)C-(C)2(CO)(H)
14 Mid 6 0.334543
C-(C)3(O) 15 Mid 4 0.534714
molecules. The groups used in the analysis are simi-lar to those used above and are described in Table 10.The modeling assumption is written as
(9)'MC,Ar =nS#
i=1
Xi
%nG,i#
j=1
Nj,iCMC,Arj
&
,
where 'MC,Ar is the estimated maximum mass of car-bon in aromatic species, Xi is the mole fraction of
species i, and CMC,Arj is the contribution of group
j to MC,Ar. The resulting correlation is displayed inFig. 6 and group contributions are shown in Table 10.The correlation parameter is nearly 99%, the maxi-mum error is 3.1%, and the average error is less than2%. Hence, also for this set of experimental measure-ments, describing the data with the structural contri-butions of the fuel is shown to be a valid hypothesis.All oxygenated groups have a beneficial influence on(i.e., a negative contribution to) the amount of aro-matic species produced. This means that the over-all increase in aromatic concentration in the dopedflames is clearly due to the hydrocarbon part of theadditives. Also, the analysis once again points out thatthe more branched a molecule is, the higher the soot-ing tendency is, as both groups C-(C)2(X)(H) (#14)and C-(C)3(O) (#15) have a large positive coefficient.
The comparison between straight alkanes and oxy-genates is also conducted for this database. The com-parison is done for a constant carbon flux and a con-stant inert gas flow rate. Oxygenates are added sothat the oxygen flux is 1% of the carbon flux. Thenthe same flow rate, that is, the same mole fractionof oxygenates, is replaced by pentane. The amount
Fig. 6. Correlation between experimental and simulated car-bon mass in aromatic species in Pfefferle et al.’s [18–20]study of CH4 diffusion flames.
Table 11Relative efficiency of oxygenated additives compared topentane in Pfefferle et al.’s [18–20] study of CH4 diffusionflames
Additive Formula QCH4[cc/min]
QA[cc/min]
Improvement
Butanol C4H10O 316.8 3.3 "20.72%Methoxy-propane
C4H10O 316.8 3.3 "27.17%
Methylbutanoate
C5H10O2 321.75 1.65 "16.13%
of aromatics obtained when using the oxygenates iscompared to the case when pentane is added. Re-sults are presented in Table 11. For a constant oxygenflux, compared to pentane, ether shows a larger im-provement than alcohol, which itself is more efficientthan ester. This confirms the lower efficiency of es-ters compared to other oxygenated species, which wasfound in the analysis of the smoke point database andthe homogeneous reactor simulation database.
5. Conclusion
A statistical method has been used to analyzeseveral experimental databases. These databases in-cluded smoke point measurements of a large numberof n-heptane/toluene/oxygenate mixtures obtained aspart of this work, soot precursor concentrations inoxygenate-doped methane diffusion flames, and sootprecursor levels obtained from simulations of richpremixed homogeneous reactors. The structure of theoxygenated molecules have been correlated with theirsooting tendency with good accuracy. Two effectshave been identified and quantified: the effect of the

204 P. Pepiot-Desjardins et al. / Combustion and Flame 154 (2008) 191–205
oxygen moieties contained in the molecules, and thedilution effect, which replaces highly sooting com-ponents of the base fuel with cleaner hydrocarbons,or inversely, replaces clean-burning fuel with somemore complex and sooting molecules. This dilutioneffect explained the seemingly contradictory obser-vation that adding oxygenates to a methane diffusionflame actually increases the level of soot precursors inthe flame. Overall, all oxygenated groups were foundto reduce the sooting tendency of the base fuel to anextent that was shown to depend strongly on the na-ture of these groups. These conclusions have beenreached using primarily large oxygenated moleculeson specific sets of experimental data, and should notbe generalized more than the original experimentswould allow. For example, they may not be appli-cable to two studies by McEnally and Pfefferle [46]and McNesby et al. [47], which considered mixturesof ethylene and small oxygenated molecules such asethanol and dimethyl ether, which both showed anincreased sooting tendency when the oxygenate wasadded to the fuel. Further analysis involving detailedchemical arguments are warranted for these cases.
Acknowledgments
The authors thank Dr. Charles S. McEnally andProfessor Lisa D. Pfefferle for providing detailed ex-perimental data on doped methane diffusion flamesand Professor David M. Golden and Professor CraigT. Bowman for the interesting and fruitful discussionson group contribution methods. Funding through theGlobal Climate and Energy Project (GCEP) is grate-fully acknowledged.
References
[1] H. Ban, J.T. Farrell, Y. Hotta, K. Nakakita, S. Takasu,W. Weissman, SAE 2003-01-1914 (2003).
[2] K. Nakakita, S. Takasu, H. Ban, T. Ogawa, H. Naruse,Y. Tsukasaki, L.I. Yeh, SAE 982494 (1998).
[3] Y. Takatori, Y. Mandokoro, K. Akihama, K. Nakakita,Y. Tsukasaki, S. Iguchi, L.I. Yeh, A.M. Dean, SAE982495 (1998).
[4] N. Miyamoto, H. Ogawa, N.M. Nurun, K. Obata, T.Arima, SAE 980506 (1998).
[5] N. Miyamoto, H. Ogawa, M.N. Nabi, Int. J. EngineRes. 1 (2000) 71–85.
[6] M. Natarajan, E.A. Frame, D.W. Naegeli, T. Asmus, W.Clark, J. Garbak, M.A. Gonzales D., E. Liney, W. Piel,J.P. Wallace III, SAE 2001-01-3631 (2001).
[7] T.C. Zannis, D.T. Hountalas, D.A. Kouremenos, SAE2004-01-0097 (2004).
[8] M.A. Gonzales D., W. Piel, T. Asmus, W. Clark, J.Garbak, E. Liney, M. Natarajan, D.W. Naegeli, D.
Yost, E.A. Frame, J.P. Wallace III, SAE 2001-01-3632(2001).
[9] R.L. McCormick, J.D. Ross, M.S. Graboski, Environ.Sci. Technol. 31 (1997) 1144–1150.
[10] K. Tsurutani, Y. Takei, Y. Fujimoto, J. Matsudaira, M.Kumamoto, E. Sekiyu, SAE 952349 (1995).
[11] Y. Akasaka, Y. Sakurai, SAE 942023 (1994).[12] F.J. Liotta, D.M. Montalvo, SAE 932734 (1993).[13] T. Litzinger, M. Stoner, H. Hess, A.L. Boehman, Int. J.
Engine Res. 1 (2000) 57–70.[14] C.J. Mueller, G.C. Martin, SAE 2002-01-1631 (2002).[15] C.J. Mueller, W.J. Pitz, L.M. Pickett, G.C. Martin, D.L.
Siebers, C.K. Westbrook, SAE 2003-01-1791 (2003).[16] C.K. Westbrook, W.J. Pitz, H.J. Curran, J. Phys. Chem.
A 110 (2006) 6912–6922.[17] J.P. Szybist, A.L. Boehman, D.C. Haworth, H. Koga,
Combust. Flame 149 (2007) 112–128.[18] C.S. McEnally, L.D. Pfefferle, Int. J. Chem. Kinet. 36
(2004) 345–358.[19] C.S. McEnally, L.D. Pfefferle, Proc. Combust. Inst. 30
(2005) 1363–1370.[20] W.R. Schwartz, C.S. McEnally, L.D. Pfefferle, J. Phys.
Chem. A 110 (2006) 6643–6648.[21] K.H. Song, T.A. Litzinger, Combust. Sci. Technol. 178
(2006) 2249–2280.[22] M. Bönig, C. Feldermann, H. Jander, B. Lüers, G.
Rudolph, H.G. Wagner, Proc. Combust. Inst. 23 (1990)1581–1587.
[23] F. Xu, P.B. Sunderland, G.M. Faeth, Combust. Flame108 (1997) 471–493.
[24] J. Appel, H. Bockhorn, M. Frenklach, Combust. Flame121 (2000) 122–136.
[25] R.C. Reid, J.M. Prausnitz, B.E. Poling, The Propertiesof Gases and Liquids, Hill, New York, 1987.
[26] A. Nigam, M.T. Klein, Ind. Eng. Chem. Res. 32 (1993)1297–1303.
[27] S.W. Benson, J.H. Buss, J. Chem. Phys. 29 (1958) 546–572.
[28] S.W. Benson, Thermochemical Kinetics: Methods forthe Estimation of Thermochemical Data and Rate Pa-rameters, Wiley, New York, 1976.
[29] K.G. Joback, R.C. Reid, Chem. Eng. Commun. 57(1987) 233–243.
[30] R.J. Quann, S.B. Jaffe, Indust. Eng. Chem. Res. 31(1992) 2483–2497.
[31] L.B. Kier, L.H. Hall, Molecular Structure Description:The Electrotopological State, Academic Press, London,1999.
[32] J. Bicerano, Prediction of Polymer Properties, CRCPress, Technology & Industrial Arts, 2002.
[33] S.W. Benson, F.R. Cruickshank, D.M. Golden, G.R.Haugen, H.E. O’neal, A.S. Rodgers, R. Shaw, R.Walsh, Chem. Rev. 69 (1969) 279–324.
[34] T.A. Albahri, Ind. Eng. Chem. Res. 42 (2003) 657–662.[35] R. Wittig, J. Lohmann, J. Gmehling, Ind. Eng. Chem.
Res. 42 (2003) 183–188.[36] A. Fredenslund, J. Gmehling, P. Rasmussen, Vapor–
Liquid Equilibria Using UNIFAC, Elsevier, Amster-dam, 1977.
[37] T.A. Albahri, R.S. George, Ind. Eng. Chem. Res. 42(2003) 5708–5714.

P. Pepiot-Desjardins et al. / Combustion and Flame 154 (2008) 191–205 205
[38] J. Marrero, R. Gani, Fluid Phase Equilib. 183 (2001)183–208.
[39] Y. Yang, A.L. Boehman, R. Santoro, Combust. Flame149 (2007) 191–205.
[40] ASTM D1322, Annual Book of ASTM Standards,West Conshohocken, PA, 2000.
[41] H.F. Calcote, D.M. Manos, Combust. Flame 49 (1983)289–304.
[42] R.J. Gill, D.B. Olson, Combust. Sci. Technol. 40 (1984)307–315.
[43] S. Yan, E.G. Eddings, A.B. Palotas, R.J. Pugmire, A.F.Sarofim, Energy Fuels 19 (2005) 2408–2415.
[44] A. Cheng, R.W. Dibble, SAE 1999-01-3606 (1999).[45] A. Gomez, G. Sidebotham, I. Glassman, Combust.
Flame 58 (1984) 45–57.[46] C.S. McEnally, L.D. Pfefferle, Proc. Combust. Inst. 31
(2007) 603–610.[47] K.L. McNesby, A.W. Miziolek, T. Nguyen, F.C. Delu-
cia, R.R. Skaggs, T.A. Litzinger, Combust. Flame 142(2005) 413–427.