structural influences on the fast dynamics of … · structural influences on the fast dynamics...
TRANSCRIPT
Structural Influences on the Fast Dynamics of AlkylsiloxaneMonolayers on SiO2 Surfaces Measured with 2D IR SpectroscopyChang Yan, Rongfeng Yuan, Jun Nishida, and Michael D. Fayer*
Department of Chemistry, Stanford University, Stanford, California 94305, United States
*S Supporting Information
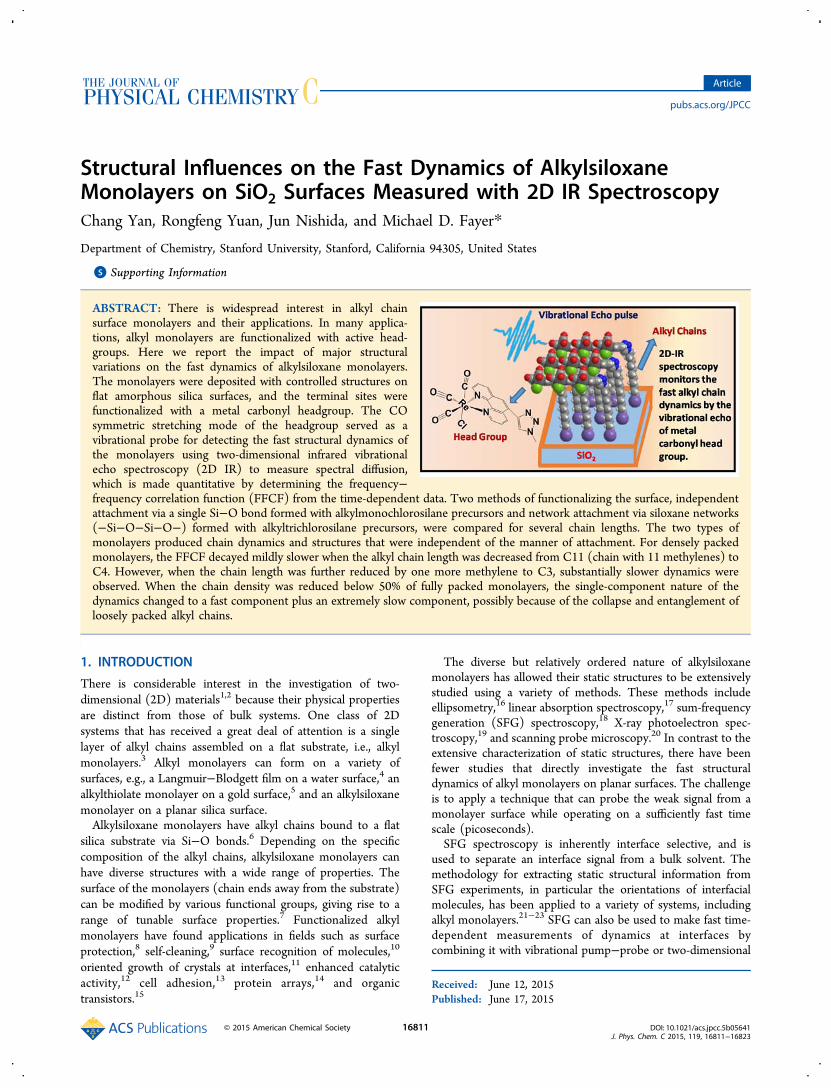
ABSTRACT: There is widespread interest in alkyl chainsurface monolayers and their applications. In many applica-tions, alkyl monolayers are functionalized with active head-groups. Here we report the impact of major structuralvariations on the fast dynamics of alkylsiloxane monolayers.The monolayers were deposited with controlled structures onflat amorphous silica surfaces, and the terminal sites werefunctionalized with a metal carbonyl headgroup. The COsymmetric stretching mode of the headgroup served as avibrational probe for detecting the fast structural dynamics ofthe monolayers using two-dimensional infrared vibrationalecho spectroscopy (2D IR) to measure spectral diffusion,which is made quantitative by determining the frequency−frequency correlation function (FFCF) from the time-dependent data. Two methods of functionalizing the surface, independentattachment via a single Si−O bond formed with alkylmonochlorosilane precursors and network attachment via siloxane networks(−Si−O−Si−O−) formed with alkyltrichlorosilane precursors, were compared for several chain lengths. The two types ofmonolayers produced chain dynamics and structures that were independent of the manner of attachment. For densely packedmonolayers, the FFCF decayed mildly slower when the alkyl chain length was decreased from C11 (chain with 11 methylenes) toC4. However, when the chain length was further reduced by one more methylene to C3, substantially slower dynamics wereobserved. When the chain density was reduced below 50% of fully packed monolayers, the single-component nature of thedynamics changed to a fast component plus an extremely slow component, possibly because of the collapse and entanglement ofloosely packed alkyl chains.
1. INTRODUCTION
There is considerable interest in the investigation of two-dimensional (2D) materials1,2 because their physical propertiesare distinct from those of bulk systems. One class of 2Dsystems that has received a great deal of attention is a singlelayer of alkyl chains assembled on a flat substrate, i.e., alkylmonolayers.3 Alkyl monolayers can form on a variety ofsurfaces, e.g., a Langmuir−Blodgett film on a water surface,4 analkylthiolate monolayer on a gold surface,5 and an alkylsiloxanemonolayer on a planar silica surface.Alkylsiloxane monolayers have alkyl chains bound to a flat
silica substrate via Si−O bonds.6 Depending on the specificcomposition of the alkyl chains, alkylsiloxane monolayers canhave diverse structures with a wide range of properties. Thesurface of the monolayers (chain ends away from the substrate)can be modified by various functional groups, giving rise to arange of tunable surface properties.7 Functionalized alkylmonolayers have found applications in fields such as surfaceprotection,8 self-cleaning,9 surface recognition of molecules,10
oriented growth of crystals at interfaces,11 enhanced catalyticactivity,12 cell adhesion,13 protein arrays,14 and organictransistors.15
The diverse but relatively ordered nature of alkylsiloxanemonolayers has allowed their static structures to be extensivelystudied using a variety of methods. These methods includeellipsometry,16 linear absorption spectroscopy,17 sum-frequencygeneration (SFG) spectroscopy,18 X-ray photoelectron spec-troscopy,19 and scanning probe microscopy.20 In contrast to theextensive characterization of static structures, there have beenfewer studies that directly investigate the fast structuraldynamics of alkyl monolayers on planar surfaces. The challengeis to apply a technique that can probe the weak signal from amonolayer surface while operating on a sufficiently fast timescale (picoseconds).SFG spectroscopy is inherently interface selective, and is
used to separate an interface signal from a bulk solvent. Themethodology for extracting static structural information fromSFG experiments, in particular the orientations of interfacialmolecules, has been applied to a variety of systems, includingalkyl monolayers.21−23 SFG can also be used to make fast time-dependent measurements of dynamics at interfaces bycombining it with vibrational pump−probe or two-dimensional
Received: June 12, 2015Published: June 17, 2015
Article
pubs.acs.org/JPCC
© 2015 American Chemical Society 16811 DOI: 10.1021/acs.jpcc.5b05641J. Phys. Chem. C 2015, 119, 16811−16823

infrared (2D IR) spectroscopy. The vibrational pump−probeSFG experiments can provide vibrational lifetimes andinformation on orientation relaxation, although the quantitativeanalysis of the data can be complicated.21,24 Notable examplesof the application of time-resolved SFG include the dynamics atthe water/air interface,25,26 the dynamics of carbon monoxideadsorbed on a platinum surface,27 and the dynamics of peptideson a gold surface.28
Time-resolved SFG methods have been applied to study theinfluence of shock waves on alkyl monolayers. Dlott and co-workers applied a shock wave followed by a variable time-delayed SFG probe to alkylthiolate monolayers on gold andobserved the shock-induced dynamics of the monolayer.29
Bonn and co-workers measured the vibrational lifetime andcoupling among modes in Langmuir monolayers using 2D IRSFG spectroscopy.30 SFG-FID spectroscopy was used tomeasure the free induction decay (FID) of methyl andmethylene groups in alkyl monolayers.31,32 The Fouriertransform of the FID gives the time-independent vibrationalspectrum. Benderskii and co-workers estimated the time scaleof the rotational dynamics of methyl groups on Si(111) surfacesby line width analysis of polarization-selective SFG spectra.33
Another approach for studying the fast structural dynamics ofmonolayers on a surface is to place a probe in the monolayerthat can generate a strong signal using a non-interface-selectivetechnique to observe the signal. Since the probe is only foundin the monolayer, the experiment becomes monolayer specific.For example, pyrene bound to a short alkyl chain embedded ina monolayer of longer chains was used in time-correlatedsingle-photon-counting fluorescence anisotropy experiments toobserve the restricted anisotropy decay occurring on amultinanosecond time scale.34
The utility of experiments that can measure the fast structuraldynamics of an alkyl monolayer arises because the chains are inconstant motion at room temperature. Although the chains arepinned to the surface, they can undergo tilting, bending, andhindered rotational motions. Such motions will cause head-groups to change position and orientation. In bulk solution, thenature of the solvent and its dynamics can play important rolesin chemistry. Solvent fluctuations are responsible for taking asystem to a transition state in processes such as chemicalreactions and electron transfer. In applications involvingfunctionalized alkyl chain monolayers, the active headgroupfrequently sits at the interface between the solvent and theunderlying alkyl chains. Then the dynamic interactions of theactive moiety with its environment will in part depend on thealkyl chain dynamics.Molecular dynamics (MD) simulations of 15 or 14
methylene alkyl chains terminated with methyl groups andbound to crystalline gold with thiolate linkages have beenpresented.35−37 These studies focused on structure but alsoprovide information on chain dynamics. Initially two modelswere used that only differed by the manner of attachment of thechains to the gold surface.35 Orientational dynamics of ∼5 psand many tens of picoseconds were obtained depending on themanner of attachment. Later simulations showed orientationaldynamics on the many tens of picoseconds time scale.37
Structural dynamics are often accompanied by time-depend-ent changes of vibrational frequencies, which are influenced bystructural and chemical environments. The time evolution ofvibrational frequencies, which is caused by structural evolutionof the vibrational oscillators’ environments, is called spectraldiffusion. 2D IR spectroscopy measures spectral diffusion, and
therefore can be used to study fast dynamics in condensedmatter systems under thermal equilibrium conditions.38,39
Examples of systems and processes that have been explicatedusing 2D IR spectroscopy include the dynamics of solvent−solute complexes in organic solutions,40 ultrafast tautomeriza-tion dynamics,41 conformation dynamics of macromolecules,42
dynamics of metal carbonyl complexes at a transition state43
and an excited state,44 dynamics of ice,45 structures of peptidesand proteins,46,47 and water dynamics at interfaces or in bulkand confined environments.48−50
Recently 2D IR vibrational echo spectroscopy has beenapplied to study the structural dynamics of alkyl chainmonolayers on amorphous silica51−54 and crystalline goldsurfaces.55 In the experimental study presented here, weexamined a number of alkyl chain systems on planaramorphous silica surfaces by 2D IR spectroscopy to understandthe influence of the chain properties on their structuraldynamics under thermal equilibrium conditions at roomtemperature. The chains were functionalized with a metalcarbonyl headgroup, which serves as the monolayer-specificvibrational probe that reports on the chain dynamics, and it alsomimics an active headgroup moiety that is present in manyapplications. We address three questions: (1) Does the mannerof chain attachment to the silica surface affect the chaindynamics? (2) To what extent do the lengths of the alkyl chainsinfluence the chain dynamics? (3) How does the density ofchains on the surface change the chain dynamics?To answer these questions, a variety of samples with different
alkyl chain structures were prepared and studied with 2D IRexperiments to observe the influence of the monolayerstructure on the alkyl chain dynamics. First, to address theeffect of the manner of chain attachment to the surface, twoattachment methods were employed. Independent chains wereattached directly to the silica surface by a single Si−O bondusing alkylmonochlorosilane as the precursor. The dynamics ofthese monolayers were compared to those of monolayersprepared with trichlorosilane precursors. The trichlorosilanesreact in solution with each other to form a polymeric network(−Si−O−Si−O−) that then attaches to the substrate via theremaining unreacted chloro groups. For these samples, the alkylchains emanate from the network layer that is itself bound tothe substrate. Second, the influence of the alkyl chain lengthwas studied by measuring spectral diffusion for alkyl chains withdifferent lengths, C11, C4, and C3, where the number is thenumber of methylenes. Finally, the influence of the chaindensity was studied by preparing samples ranging frommaximum coverage to ∼15% of the maximum chain density.The experimental results provide answers to the threequestions.To achieve the necessary sensitivity to observe the dynamics
of surface monolayers, a vibrational probe with a largetransition dipole was employed, i.e., a rhenium tricarbonylcomplex, fac-tricarbonylchloro(1,10-phenanthroline)rhenium-(I), referred to as RePhen(CO)3Cl. RePhen(CO)3Cl wasattached to the end of the alkyl chains away from the surface.The CO symmetric stretching mode has a strong vibrationaltransition, and its absorption frequency is well-separated fromother vibrational modes of the rest of the sample. These factorsmade it possible to obtain surface-specific 2D IR spectra withgood signal-to-noise ratios.52,53 The spectral diffusion of theRePhen(CO)3Cl headgroup reported on the dynamics of thealkyl chains. In addition, the carbonyl symmetric stretch has areasonably long vibrational lifetime (∼20 ps), which made it
The Journal of Physical Chemistry C Article
DOI: 10.1021/acs.jpcc.5b05641J. Phys. Chem. C 2015, 119, 16811−16823
16812

possible to observe the dynamics from <1 to ∼75 ps. Thisrange of times allowed relatively small differences in thestructural dynamics in alkylsiloxane monolayers to beobserved.54
2. EXPERIMENTAL METHODS2.1. Sample Fabrication. To avoid absorption of the mid-
infrared radiation by the silica substrate, the alkyl monolayerswere grown on a SiO2/CaF2 substrate. A 100 nm thick silicalayer was deposited on a 3 mm thick CaF2 optical window (1in. in diameter). The SiO2/CaF2 substrates were prepared by aplasma-enhanced chemical vapor deposition procedure de-scribed previously.54 To deposit monolayers of good qualitywithout forming multilayers, we followed the well-establishedmethod of immersing the substrates in a dilute solution ofbromoalkylchlorosilanes.56−58 After deposition, the terminalbromine atom was replaced by an azide group by a nucleophilicsubstitution. Finally the metal carbonyl vibrational probe, fac-tricarbonylchloro(1,10-phenanthroline)rhenium(I), was“clicked” on by the copper-catalyzed azide−alkyne cyclo-addition (CuAAC).59 The entire headgroup (Figure 1A)consists of the RePhen(CO)3Cl and the triazole ring formedduring the “click” chemistry. The details of synthesis for eachkind of monolayer sample can be found in the SupportingInformation.2.2. Infrared Absorption Spectroscopy and Induc-
tively Coupled Plasma Mass Spectrometry. Unpolarizedand polarization-resolved infrared absorption measurementswere applied with inductively coupled plasma mass spectrom-etry (ICP-MS) to determine the structure, headgrouporientation, and surface density of the functionalized monolayersamples. The FT-IR spectra of the monolayers were recordedwith 1 cm−1 resolution. Monolayers were cleaned by sonicationwith ethanol, and then the spectra were immediately measured.Multiple cleaning cycles in ethanol caused no change in the FT-IR or 2D IR results. We measured the absorption spectra withan unpolarized beam at an incident angle of 0° using air free ofCO2 and water vapor as the background. For polarization-resolved spectra, both s- and p-polarized spectra were taken foreach monolayer sample at an incident angle of 45° to thesurface using a bare SiO2/CaF2 wafer as the background. Theusage of the wafer as the background was to account for thedifference in reflectivity for the s- and p-polarized beams.The methodology for determining the transition dipole
moment orientation of a surface-bound vibrational mode bypolarization-resolved infrared absorption spectroscopy hadbeen described previously.51,52 We define θ as the polar anglebetween the transition dipole moment of the carbonylsymmetric stretching mode and the surface normal to thesubstrate. Since the alkylsiloxane monolayers do not have long-range orientational correlation, the azimuthal angle of thetransition dipole moment is randomly distributed from 0 to 2π.From eq 1 below, we can obtain the averaged orientationalorder parameter of the transition dipole moment. Assuming anarrowly peaked distribution of orientations (relatively smallcone of angles), the angle θ can be extracted from the orderparameter using eq 2 (see the Supporting Information).
α= + ⟨ ⟩− ⟨ ⟩
−⎛⎝⎜
⎞⎠⎟
AA
SS
13 sin
1s
p
2 1
(1)
θ⟨ ⟩ = ⟨ ⟩ −S 1/2(3 cos 1)2(2)
As and Ap are the peak areas of s- and p-polarized spectra. ⟨S⟩ isthe averaged orientational order parameter. α is the beam’sincident angle.Using the transition dipole moment orientation and the
integrated extinction coefficient, we can determine the surfacedensity of the monolayer headgroups, Γsurf (molecules/cm
2).The extinction coefficient of the metal carbonyl headgroup wasshown to be sensitive to subtle changes in chemicalenvironments such as surrounding solvent molecules.53 There-fore, the extinction coefficient on a bare monolayer surfaceexposed to air could differ from the value of bulk solutions by asignificant amount. To calibrate the extinction coefficient, wedirectly determined the total amount of rhenium on the surfacefor C4 monolayer samples by ICP-MS analysis.51 The accuracyof the measurement stems from the high sensitivity of ICP-MSand the ultralow natural abundance of rhenium. εsurf is theintegrated molar extinction coefficient of the carbonylsymmetric stretching mode at the monolayer/air interfacewith the energy axis in inverse centimeters. Using the ICP-MSresults and eq 3, εsurf was determined to be 7.90 × 10⁶ cmmol−1.
εΓ = N
A
Rsurf Aunp
surf (3)
Γsurf is the surface density of headgroups, Aunp is the peak areaof the unpolarized spectra, NA is Avogadro’s constant, and R =(3/2) sin2 θ is the correction factor to account for thedifference between isotropic absorption and anisotropicabsorption. This extinction coefficient and eq 3 were used forcalculating the surface density of headgroups for othermonolayer samples.
2.3. 2D IR and HDTG Measurements. Both 2D IR andHDTG (heterodyne-detected transient grating) spectroscopieswere performed under BOXCARS geometry on the sameoptical platform. Midinfrared pulses with a duration of ∼170 fs,bandwidth of 90 cm−1, pulse energy of ∼5.5 μJ, and center at∼2025 cm−1 were generated at 1 kHz with an opticalparametric amplifier pumped by a regeneratively amplifiedTi:sapphire system. The infrared pulses selectively pumped thecarbonyl symmetric stretching mode without exciting othermodes. The echo signal pulse was combined with an externallocal oscillator (LO) pulse for heterodyne detection. Thecombined pulse passed through a monochromator equippedwith a liquid N2 cooled 32 pixel HgCdTe (MCT) arraydetector.2D IR and HDTG spectroscopies are both third-order
nonlinear time-resolved experiments. The theory and exper-imental design have been described in detail previously;52,60 abrief description is given here. Three infrared pulses (denotedas pulses 1, 2, and 3 in temporal sequence) that selectivelyexcite the carbonyl symmetric stretching mode are focused andoverlapped spatially on the monolayer surface. The time periodbetween pulse 1 and pulse 2 is denoted as τ, and the timeperiod between pulse 2 and pulse 3 is denoted as Tw. Thesetemporal intervals are controlled by precision delay lines. Theinteraction of the three pulses with the sample leads to theemission of an echo pulse in the wave-vector-matcheddirection.2D IR spectroscopy probes the dynamics of a chemical
system by measuring spectral diffusion, which is the timeevolution of the vibrational frequencies of the probe vibration.The vibrational absorption line is inhomogeneously broadened
The Journal of Physical Chemistry C Article
DOI: 10.1021/acs.jpcc.5b05641J. Phys. Chem. C 2015, 119, 16811−16823
16813

because of the range of intermolecular interactions of thevibrational probes with their surroundings. The change infrequencies with time (spectral diffusion) is caused by thestructural fluctuations of the sample. Qualitatively, the experi-ment works as follows: In effect, the first pulse of the vibrationalecho pulse sequence “labels” the initial vibrational probefrequencies (the ωτ horizontal axis in the 2D spectrum), andthe second pulse stores the information. Then, during Tw, thewaiting time between pulses 2 and 3, the structure of themonolayer evolves, causing the vibrational frequencies tochange. This period is ended by the arrival of the third pulse,which also stimulates the emission of the vibrational echo pulse.The echo contains information on the final frequencies of thevibrational oscillators (the ωm vertical axis in the 2D spectrum).When Tw is short, the structure of the monolayer is relativelyunchanged from when the vibrations were first labeled,producing final frequencies that differ little from the startingfrequencies. At longer Tw, the monolayer structure has hadmore time to evolve, and the final frequencies are lesscorrelated with the initial frequencies. The loss of correlationas Tw increases is manifested as a change in the shape of the 2DIR spectrum. At short Tw, the 2D IR spectrum is elongatedalong the diagonal (the 45° line with positive slope that bisectsthe vertical and horizontal frequency axes). As Tw increases andfrequencies are less correlated, the shape of the spectrumbecomes more circular. If all of the environments are sampledwithin the experimental time window, which is limited by thevibrational lifetime, the spectrum becomes round. Thus, thestructural dynamics of the monolayer, that is, the alkyl chaindynamics, can be obtained from the change in the shape of the2D IR spectra as a function of Tw.Quantitatively, the dynamical information is extracted from
these 2D line shape changes via the center line slope (CLS)technique, which has been shown to be the equivalent of thenormalized frequency−frequency correlation function(FFCF).61,62 The CLS provides the time constants for thevarious components of the spectral diffusion and their relativeamplitudes. In the CLS decay, the deviation from 1 at Tw = 0 isa normalized measure of the homogeneous line width. A widerhomogeneous line width produces a larger deviation from 1 forthe initial value of the CLS.61,62 Combining the CLS data withthe linear absorption spectrum yields the FFCF, including thehomogeneous dephasing contribution to the absorptionspectrum and the absolute amplitudes of the spectral diffusioncomponents. The time constants in the CLS and the FFCF arethe same.61,62
The FFCF can be written as a sum of exponentials:
∑δω δω τ= ⟨ ⟩ = Δ −C t t t( ) ( ) (0) exp( / )i
i i2
(4)
Here δω(t) = ω(t) − ⟨ω⟩ is the instantaneous frequencyfluctuation, Δi is the frequency fluctuation amplitude of the ithinhomogeneous contribution to the line shape, and τi is thecorrelation time of component i (equal to the ith exponentialtime constant from the CLS decay). If one of the componentsof the frequency fluctuations meets the condition Δiτi < 1, thecomponent is motionally narrowed. In this case, Δi and τicannot be determined separately, and a homogeneouscomponent with pure dephasing line width Γ* = Δi
2τi = 1/(πT2*) contributes to the FFCF. T2 = 1/(πΓ) is the totalhomogeneous dephasing time (with Γ the homogeneous linewidth). The total homogeneous dephasing time is given by
= * + +T T T T1 1 1
21
32 2 1 or (5)
where T1 is the vibrational lifetime and Tor is the orientationalrelaxation time. In the surface experiments, the chains arepinned to the surface, and the orientational contribution to thehomogeneous line width is negligible. In addition, thevibrational lifetime is long and contributes <0.25 cm−1 to thehomogeneous line width. Therefore, the homogeneous linewidths are dominated by pure dephasing. The totalhomogeneous dephasing time T2 and the values of Δi inunits of frequency are obtained from the experimental datafrom a simultaneous fit to the CLS decay and the experimentallinear absorption line shape.61,62
Most of the data presented below are described well by asingle-exponential decay for the spectral diffusion part of thenormalized FFCF (CLS), which characterizes the sampling ofthe inhomogeneous portion of the absorption line shape. Thereis also the homogeneous contribution. We take the exponentialtime constant(s) to characterize the time scale of the dynamicsrather than associating it with a single structural motion. It isimportant to note that the CLS decay is an experimentalobservable which is independent of a model of the dynamics. Itis therefore amenable to comparison with MD simulations, anddoes not require using a multiexponential model like thatembodied in eq 4. Simulations have been compared to theresults of 2D IR experiments for a variety of systems.48,63−66
In the HDTG experiment that measures the vibrationallifetime, τVR, τ is fixed at zero, and only Tw is scanned. Thespatial and temporal overlap of pulses 1 and 2 produces anoptical interference pattern, i.e., alternating regions of light anddark that produce alternating spatial regions of excited andunexcited molecular vibrations. This sinusoidal variation in thepopulation density of excited states acts as a diffraction gratingfor the incoming pulse 3.67−69 The diffracted pulse, which isheterodyne detected in the same manner as the vibrationalecho, is the signal. As the vibrations decay to the ground state,the diffraction grating decays, and the signal decays. Becausethe absorption of the sample is very small (∼0.5 mOD),HDTG spectroscopy was chosen over the pump−probemethod for its higher sensitivity.51 At short time, there is asmall contribution to the decay from restricted orientationalmotions, which can provide additional information.54 Here onlythe lifetimes are of interest, which were extracted from the longtime portions of the HDTG decays.
3. RESULTS AND DISCUSSION3.1. Network and Independently Attached Mono-
layers. In this section the question of possible differences inchain dynamics and structure resulting from two methods ofattaching the chains to the amorphous SiO2 surface areaddressed. When monolayers are prepared using trichlorosi-lanes, e.g., C11−SiCl3, on substrates, the trichlorosilanes reactin solution to form an extended polymeric network prior toattachment to the surface.57 The result is that the chainsemanate from interlinked networks at the bottom of themonolayer with the network layer attached to the SiO2 surface.We denote this type of monolayer as the network monolayer,and use the abbreviation “net”. Figure 1B shows a schematicillustration for C11net chains. C4net and C3net were prepared andmeasured as well. For the detailed structure of the headgroup,refer to Figure 1A. In contrast, when chains are deposited onthe substrate using monochlorodimethylsilanes, e.g., C11−
The Journal of Physical Chemistry C Article
DOI: 10.1021/acs.jpcc.5b05641J. Phys. Chem. C 2015, 119, 16811−16823
16814

Si(CH3)2Cl, under base conditions, the chains are independ-ently attached to the surface.58 The base-catalyzed reactionscheme was used to obtain a chain density similar to that of thenetwork monolayers. We refer to these samples asindependently attached base catalyzed, and use the abbreviation“ind”. An illustration for C11 independently attached chains(C11ind) is shown in Figure 1C.The manner of attachment might influence the chain
dynamics because of a difference in the structural flexibility ofthe material below the alkyl chains. In both attachmentmethods, the alkyl chains are bound to an Si atom. In the directattachment, the Si atom is bound to the solid surface, whichlocally is similar to crystalline SiO2. While there are phononmodes of the solid as well as surface modes, these modes willnot produce significant chain structural motions. In contrast, inthe network attachment, the alkyl chains are bound to anominally two-dimensional layer that is fixed to the surfacethrough sporadic bonds. The 2D network could undergo moresubstantial structural fluctuations than the SiO2 solid surface. Ifthe 2D network undergoes buckling or butterfly-type structuralchanges, such fluctuations could result in chains undergoing up
and down and tilting movements that would not occur withdirect attachment to the more structurally rigid solid.For all of the samples, infrared linear absorption spectra of
the C−H region of the alkyl chains give the antisymmetric andsymmetric stretching mode frequencies of the methylene(−CH2−) groups at 2854 and 2925 cm−1, respectively. Theshift of the symmetric stretching frequency from the all-transvalue (2918 cm−1) indicates the existence of gauche defectswithin the monolayer of alkyl chains, which is normal foralkylsiloxane monolayers.3,70,71 For the independently attachedmonolayers, we also detected the very weak absorptions ofantisymmetric and symmetric stretching modes of methyl(−CH3) groups at 2873 and 2962 cm−1, from the two methylgroups associated with the silicon atom at the bottom of thealkyl chains.70,71
The carbonyl symmetric stretching mode (∼2025 cm−1) andthe two antisymmetric stretching modes (∼1921 and 1898cm−1) of the headgroup were observed for all of thefunctionalized monolayers. Owing to the large transitiondipole, the carbonyl peaks had a larger absorbance (∼0.7mOD) and smoother line shapes than C−H peaks. Weperformed all of the time-resolved experiments on thesymmetric mode because it is well separated in the spectrumfrom the two antisymmetric peaks, which overlap substantiallyand would make data analysis difficult.51 Table 1 gives time-independent parameters for the symmetric stretching mode.The full width at half-maximum (fwhm) of the absorptionspectra of all of the samples is 17−18 cm−1.
To determine the surface density of the headgroups for theanisotropic monolayers from the absorption band area, theorientation of the mode’s transition dipole is required. Thecarbonyl symmetric stretching mode’s transition dipole has aclearly defined direction. The angle θ is the polar angle betweenthe transition dipole vector of the carbonyl symmetricstretching mode and the surface normal of the substrate. Wemeasured θ by polarization-resolved infrared absorptionexperiments (see section 2.2 and the Supporting Information).As shown in Table 1, θ is in the range of 62° ± 5° for all thesamples. For the C11, C4, and C3 chains, there is no systematicdifference in the orientation of the headgroups betweennetwork and independent attachment to the surface.The surface density of headgroups, Γsurf (see Table 1), was
determined using the θ value and the calibration with the ICP-MS measurement. Generally, the surface density of alkyl chains
Figure 1. Schematic illustrations of the functionalized alkylsiloxanemonolayers. The −R represents the methyl group, and −HGrepresents the headgroup. (A) Structure of the headgroup (bluesquare). (B) C11 monolayers with network attachment. (C) C11monolayers with independent attachment. (D) Mixed monolayers of50% C11 and 50% C3 chains with network attachment. (E) C11monolayers of low chain density (15%) with independent attachment.
Table 1. Infrared Absorption Spectrum Parametersa
samplepeak freq(cm−1)
fwhm(cm−1) θ (deg)
Γsurf(1014 cm−2)
C11net 2023 ± 0.5 17 ± 0.5 63 ± 3 8.6 ± 0.5C4net 2025 ± 0.5 18 ± 0.5 64 ± 3 8.2 ± 0.5C3net 2025 ± 0.5 17 ± 0.5 63 ± 3 7.6 ± 0.5C11ind 2024 ± 0.5 17 ± 0.5 62 ± 3 6.8 ± 0.5C4ind 2026 ± 0.5 18 ± 0.5 57 ± 3 6.7 ± 0.5C3ind 2028 ± 0.5 17 ± 0.5 67 ± 3 3.3 ± 0.5C11−C3net(50%) 2026 ± 0.5 17 ± 0.5 63 ± 5 5.4 ± 0.5C11−C3net(25%) 2029 ± 0.5 18 ± 0.5 58 ± 5 3.0 ± 0.5C11ind(base-free) 2031 ± 0.5 17 ± 0.5 1.4 ± 0.5
afwhm = full width at half-maximum of the absorption band, θ = polarangle between the carbonyl symmetric stretch transition dipole andthe surface normal, and Γsurf = surface density of metal carbonylheadgroups.
The Journal of Physical Chemistry C Article
DOI: 10.1021/acs.jpcc.5b05641J. Phys. Chem. C 2015, 119, 16811−16823
16815

in independently attached monolayers will be lower than that ofnetwork monolayers.72 This can be attributed to the differencein the monolayer deposition mechanism. During deposition ofnetwork monolayers, the alkyltrichlorosilanes first partiallypolymerize into floating monolayer patches in solution andthen the networks attach to the silica substrate.3 In contrast, theindependently attached monolayers are formed by the directreaction between surface hydroxyl groups on silica and themonochlorosilanes without polymerization. As a result, thesurface density of independently attached monolayers is limitedby the density of hydroxyl groups on the silica surface. By usinga base-catalyzed reaction scheme, we formed independentlyattached monolayers which utilized the surface hydroxyl groupsto the maximum extent.58 Nonetheless, the Γsurf of C11ind is∼80% of that of C11net. In section 3.3 below, we show that, forchain densities >50%, the density does not significantly affectthe dynamics. Therefore, in spite of some difference in surfacedensities, it is still appropriate to compare the results for thenetwork and independent monolayers. However, the head-group density of C3ind is significantly lower than that of C3net.This difference is likely due to less efficient substitution of Cl byazide compared to Br used in the headgroup attachment of allof the other monolayers. The reduction in headgroup densitydoes not necessarily mean that the chain density is reduced.The CO symmetric stretch vibrational lifetimes for the
network and independently attached monolayers measuredwith HDTG experiments are listed in the τVR column of Table2. The lifetimes are all ∼20 ps with no systematic variationamong the samples.
Figure 2 shows a series of 2D IR spectra taken at two Twvalues, 0.5 and 25 ps. In the top left panel, the dashed line is thediagonal. Figure 2A shows the spectra for C11net, and Figure 2Bshows the spectra for C11ind. At short time (0.5 ps), the spectraare substantially elongated along the diagonal. As timeincreases, the spectra become less elongated. As discussed insection 2.3, the dynamical information is contained in thechange in shape of the spectra as Tw increases. The main bands(red, positive going) arise from the 0−1 vibrational transition.In some of the panels a portion of a blue band (negative going)below the 0−1 band can be seen. These bands are from the 1−2 transition. A full spectrum is shown in the SupportingInformation). The data analysis is performed on the 0−1 band.The spectra in parts A and B are qualitatively the same, whichindicates that there is no significant difference in the dynamicsof the network and independently attached monolayers.The change in shape with Tw can be quantified using the
CLS method, which in turn gives the FFCF (section 2.3).61,62
Figure 3 displays CLS decay curves obtained from a series ofspectra like those shown in Figure 2. In each panel, the data arefor network attached (black points) and independentlyattached (red points) monolayers. The solid curves throughthe data (black, network; red, independent) are single-exponential fits. From the data and the linear absorptionspectra, the FFCFs are obtained. The FFCF parameters arelisted in Table 2. In parts A and B of Figure 3, for C11 and C4chains, respectively, the network and independent monolayers
Table 2. Results of Dynamical Measurement for Networkand Independently Attached Alkyl Monolayersa
sample τVR (ps) Γ (cm−1) T2 (ps) Δ1 (cm−1) τ1 (ps)
C11net 21.6 ± 1 2.8 3.8 15.5 ± 0.5 34 ± 1C4net 17.7 ± 1 2.0 2.7 17.0 ± 0.5 42 ± 2C3net 19.5 ± 1 1.5 2.0 16.2 ± 0.5 66 ± 2C11ind 19.7 ± 1 2.3 3.1 15.8 ± 0.5 33 ± 1C4ind 20.0 ± 1 1.5 2.0 17.3 ± 0.5 42 ± 2C3ind 19.3 ± 1 2.7 3.7 15.6 ± 0.5 74 ± 3
aBecause FFCF decays as a single exponential, Δ1 is the totalinhomogeneous width. The total absorption line shape is theconvolution of the homogeneous Lorentzian line with width Γ andthe inhomogeneous line with width Δ1.
Figure 2. (A) 2D IR spectra of C11net. (B) 2D IR spectra of C11ind.The spectra are shown for two Tw values: 0.5 and 25 ps.
Figure 3. Center line slope decay curves (normalized FFCF) extractedfrom 2D IR spectra comparing network monolayers (black) vsindependently attached monolayers (red) with various chain lengths:(A) C11net and C11ind, (B) C4net and C4ind, (C) C3net and C3ind. Thesolid curves (black, network; red, independent) are exponential fits tothe data.
The Journal of Physical Chemistry C Article
DOI: 10.1021/acs.jpcc.5b05641J. Phys. Chem. C 2015, 119, 16811−16823
16816

display identical dynamics as shown by the τ1 (spectraldiffusion) values in Table 2. For the C3 data and fits in Figure3C, the network data are slightly faster than the independentdata; however, the decays are almost within the error bars (seeTable 2). The small difference may be attributed to the verylow headgroup density of C3ind as discussed above.All of the decays were fit with single exponentials without
offsets (an exponential without an additive constant). An offsetin the fit would indicate a much slower process that falls outsideof the time window that is limited by the vibrational lifetime.The data in Figure 3A show clearly that no offset is needed. At75 ps, the C11net decay is down to a value of 0.067, very closeto zero and still dropping.The inhomogeneous widths, Δ1 in Table 2, are essentially the
same for each chain length pair of network and independentlyattached monolayers. However, the homogeneous widths, Γ,and the corresponding homogeneous dephasing times, T2,jump around a good deal. These values are difficult to extractwithout significant error because the absorption spectra aredominated by the inhomogeneous width and there isuncertainty in the absorption line width of ∼1 cm−1. However,looking at Figure 3, the initial CLS values, for Tw extrapolatedto 0, are all ∼0.85, which indicates that all of the samples havesimilar homogeneous line widths.One might have anticipated that the difference in the nature
of the surface functionalization, network attachment vs eachchain independently attached to the surface, would make asignificant difference in the monolayer structure and dynamics.Nonetheless, for the same length of the alkyl chains, C11, C4,or C3, the FT-IR results show that the orientations of theheadgroup transition dipoles are the same within error for bothattachment methods. The 2D IR results show that, for eachchain length, the dynamics are the same independent of thesurface attachment method.In examining the structure and dynamics of the different
monolayer samples, it is important to recall that the chains arefirst attached to the surface and then the headgroups areattached to the surface-bound chains. Thus, the bulkyheadgroups do not influence how the chains form the surfacemonolayers. The headgroup and triazole ring are rigid and onlyhave vibrational modes that do not contribute to spectraldiffusion. Vibrations, which are quantized motions, do notresult in sampling different frequencies in the inhomogeneousline, which is necessary to cause spectral diffusion. Therefore,the spectral diffusion originates from the alkyl chain dynamics.Previously, it was shown that the headgroup orientation andstructural dynamics of the functionalized monolayers did notdepend on the surface density of the headgroups when thedensity of the alkyl chains remained unchanged but only afraction of them were terminated with the headgroups.52 Thisfact also indicates that the possible constraints imposed by theheadgroups do not have a major influence on the comparisonsof the chain dynamics.These considerations indicate that the spectral diffusion is
associated with collective and individual motions of the alkylchains. It is important to note that the vapor-deposited SiO2surface is not crystalline. The independent attachment of alkylchains (monochlorosilane precursors) does not form a uniformlattice-like packing structure like, for example, alkylthiolatemonolayers on a crystalline gold surface.5 The quasi-polymericnetwork formed with the alkyltrichlorosilane precursors willalso not produce a lattice-like packing of chains.3 Thus, thepacked chains in network or independently attached alkylsilox-
ane monolayers have gauche defects, as demonstrated by theshift of the methylene C−H stretching frequency from the all-trans frequency (see above). The disorder of the chains willresult in free volume within the monolayer structure and theability of the structure to fluctuate among many local and moreglobal configurations. These chain fluctuations involvingmotions of individual chains and groups of chains will producespectral diffusion. The spectral diffusion dynamical data andFT-IR measurements of the headgroup transition dipoledirection are experimentally indistinguishable for independentchains directly attached or a network of chains collectivelyattached, demonstrating that different manners of chainattachment to the silica surface yield chain packing structuresand dynamics that are virtually identical.
3.2. Monolayers with Different Chain Lengths. Insection 3.1 it was shown that the headgroup orientations forC11, C4, and C3 monolayers were similar, within the range of62 ± 5°. For both the network and independently attachedmonolayers, Γsurf showed a small decrease as the chain lengthdecreased (see Table 1). We attribute the small decrease in theheadgroup surface density to changes in the packing of theshorter alkyl chains. The much smaller Γsurf for C3ind wasdiscussed in section 3.1. As noted previously52 and discussedfurther in section 3.3, small changes in the headgroup densitydo not influence the dynamics measured with 2D IR.We first compare the 2D IR data for C11net, C4net, and C3net.
Previously it was noted that there is a significant slowing of thespectral diffusion in going from a C11 to a C3 chain.54 Here thedata have higher quality, and there are additional data for theC4 chains. Table 2 gives the spectral diffusion times, τ1, forC11net, C4net, and C3net, which are 34, 42, and 66 ps. In goingfrom C11 to C4, a reduction of seven methylenes, the spectraldiffusion slows by ∼25%. However, in going from C4 to C3, achange of one methylene, the spectral diffusion slows by anadditional 60%. Therefore, in going from C11 to C4, a largechange in chain length only causes a relatively mild slowing ofthe chain dynamics, but a further reduction in chain length byone methylene makes a large difference. The data for theindependently attached chains show the same trend, with theC11ind, C4ind, and C3ind samples having spectral diffusion timesof 33, 42, and 74 ps, respectively (see Table 2).These results indicate that the chain structural fluctuations
are more restricted for the methylene units near the silicasubstrate than for the portions of the chains that are furtheraway from the substrate surface. It has been established that thetop parts of the alkyl monolayers are generally more randomlypacked and have more structural freedom due to the lack ofconstraints,3 which is consistent with the dynamical resultsobtained here. The net result is that the chain dynamics and thenature of chain packing are little changed once the chainsbecome sufficiently long, >C3. It is informative that there is alarge change in going from C4 to C3. C4 seems to be a dividingpoint where the upper portions of the chains that are freer toundergo fast fluctuations start to be affected by the restrictionsin the lower portions of the chains. Because of the lack ofstarting materials, we could not examine chain lengths betweenC4 and C11. Chain lengths between C4 and C11 are notavailable with terminal-brominated alkyltrichlorosilanes oralkylmonochlorosilanes. However, the relatively small differ-ence in the spectral diffusion time constants in going from C11to C4 suggests that, for lengths between these two, thedynamics will be very similar.
The Journal of Physical Chemistry C Article
DOI: 10.1021/acs.jpcc.5b05641J. Phys. Chem. C 2015, 119, 16811−16823
16817

3.3. Monolayers with Decreasing Surface Density ofthe C11 Chain. To study the impact of the chain density onthe monolayer dynamics, a series of mixed network monolayerswith different C11 chain densities were prepared. In thesemonolayers, a controlled fraction of C3 chains replaced the C11chains as spacers. The C3 chains were terminated with methylgroups, and only C11 chains were functionalized with the metalcarbonyl headgroups. Thus, the 2D IR experiments wereobserving the monolayer dynamics through the C11 chainvibrational probes. By using the C3 chains, the total alkyl chaindensity on the substrate is not reduced. However, for the C11chains, above the third methylene from the surface, the chainswill be less tightly packed. As shown above in section 3.2, for afully functionalized C11 surface, a good deal of the dynamicsoccurs above the first three methylenes.Mixed network monolayers were prepared with two C11
concentrations, C11−C3net(50%) and C11−C3net(25%), wherethe percentage gives the fraction of C11 trichlorosilanes amongall the trichlorosilanes in solution during the monolayerdeposition. Mixed monolayers are free from phase segregationof the different chain lengths as long as the ratio of the numberof the two types of chains is not extreme.73,74 The homogeneityof mixed monolayers was verified by FT-IR spectra discussedbelow. Attempts to prepare C11−C3net(10%) were notreproducible, and the monolayers formed were inhomoge-neous. To prepare a monolayer with C11 chains less than 25%of full density, a different type of sample was made. Directattachment of independent chains using monochlorosilane asthe precursor but without adding the base catalyst generatedC11 monolayers with ∼15% of the chain density of the C11netmonolayers. These samples are called C11ind(base-free).Schematic illustrations of the C11−C3net(50%) and theC11ind(base-free) are shown in Figure 1D,E.Figure 4A displays the C−H stretching region of the FT-IR
spectra of monolayers with different C11 chain densities. Thepink line is the spectrum of a SiO2/CaF2 wafer withoutmonolayer deposition, showing that absorption caused byadventitiously adsorbed organic materials was very small. FromC11net to C11ind(base-free), as the long C11 chain density wasdecreased, the absorbance of the methylene peaks was reduced.The antisymmetric and symmetric stretching modes of methylgroups at 2873 and 2962 cm−1 for C11−C3net(50%) and C11−C3net(25%) monolayers are apparent. These peaks areattributed to the methyl-terminated C3 chains.Figure 4B displays the carbonyl symmetric stretch region of
the FT-IR spectrum. The reduction of the C11 chain densityhas two effects on the spectrum. First, because the headgroupsin this series of monolayers were only attached to the C11chains, the peak area decreased as the C11 chain densitydecreased. Second, the peak position shifted to the blue as theheadgroup coverage was reduced. The vibrational frequency ofthe headgroup is sensitive to its chemical environments.53
There was no change in chemical composition of the samplesexcept for the surface concentration of the headgroups. Thechange in the headgroup frequency shows that the interactionsof the headgroups with their environments change with thechain density. One possibility is that the headgroups interactdifferently with the alkyl portions of the surrounding chains asthe C11 density goes down. Another possibility is a shift of thevibrational frequency caused by the vibrational Stark effect.75,76
The headgroups have a significant dipole moment. Eachheadgroup will experience an electric field that is the vectorsum of the fields originating from the other headgroups as well
as from the alkyl chains. As the headgroup density decreases,the resulting electric field at a particular headgroup will, onaverage, decrease, reducing the Stark effect contribution to thevibrational frequency, producing a frequency shift. The centerfrequencies of the various samples are given in Table 1. Thegradual shift of the frequency with the headgroup density alsosupports the studies that show mixtures of chain lengths do notsegregate.73,74 If the C11 chains in the C11−C3 mixtures (noheadgroups on the C3 chains) form C11 clusters, there wouldbe no or little change in the Stark effect or other changedintermolecular interactions and no frequency shift. Similarspectral shifts caused by the Stark effect have been described forthe infrared spectra of vibrations immersed in differentsolvents.77 As discussed further below, the Stark effect canalso be the coupling mechanism that produces spectral diffusionfrom the alkyl chain motions. As the monolayer structurefluctuates, time-dependent electric fields will be produced thatcan cause spectral diffusion.64,78−80
Although the chain density varied, θ was still in the range of62° ± 5°. However, the 58° angle for the C11−C3net(25%)monolayers could be caused by a change in the distribution ofangles. The angle obtained from the polarized FT-IRmeasurements is actually determined by both the tilt angle ofthe transition dipoles relative to the surface normal and thecone of angles around the average tilt angle. For moderatelynarrow cones, the angle is basically the tilt angle. However, asthe cone angle becomes wide, the measurement does notuniquely determine the tilt angle.81 It is reasonable to proposethat a significant reduction of the C11 chain density leads to agreater distribution of the individual chain structures, resultingin a broader cone of angles with possibly a different average
Figure 4. Unpolarized infrared absorption spectra. (A) C−Hstretching region of C11net (black), C11−C3net(50%) (red), C11−C3net(25%) (blue), C11ind(base-free) (green), and backgroundsubstrate (pink). (B) Symmetric carbonyl stretching region of theheadgroup vibrational probe. The colors are for the same samples as in(A).
The Journal of Physical Chemistry C Article
DOI: 10.1021/acs.jpcc.5b05641J. Phys. Chem. C 2015, 119, 16811−16823
16818
value, which will alter the value of θ. The θ values are given inTable 1. The value for the C11ind(base-free) monolayer is notlisted, because its absorbance was too low to conduct a reliablepolarization-resolved measurement.The Γsurf value for C11−C3net(50%) is slightly higher than
half of the value for C11net. This is due to the fact that everyazide group on the C11 chains of C11−C3net(50%) monolayerswas consumed during functionalization, which is not the casefor C11net monolayers because of excluded area caused by thelarge size of the headgroup.52,74 The Γsurf value for C11−C3net(25%) is very close to half of the value for C11−C3net(50%). The trend in the surface density of the headgroupssupports that the mixed monolayers of the C3 and C11 chainscontrol the C11 chain density as designed without clustering ofthe C11 chains. The θ value of C11−C3net(25%) was usedwhen the headgroup surface density for C11ind(base-free) wascalculated. The Γsurf value for this monolayer is about half ofthat for C11−C3net(25%).The plots of the CLS decays for the four samples, C11net
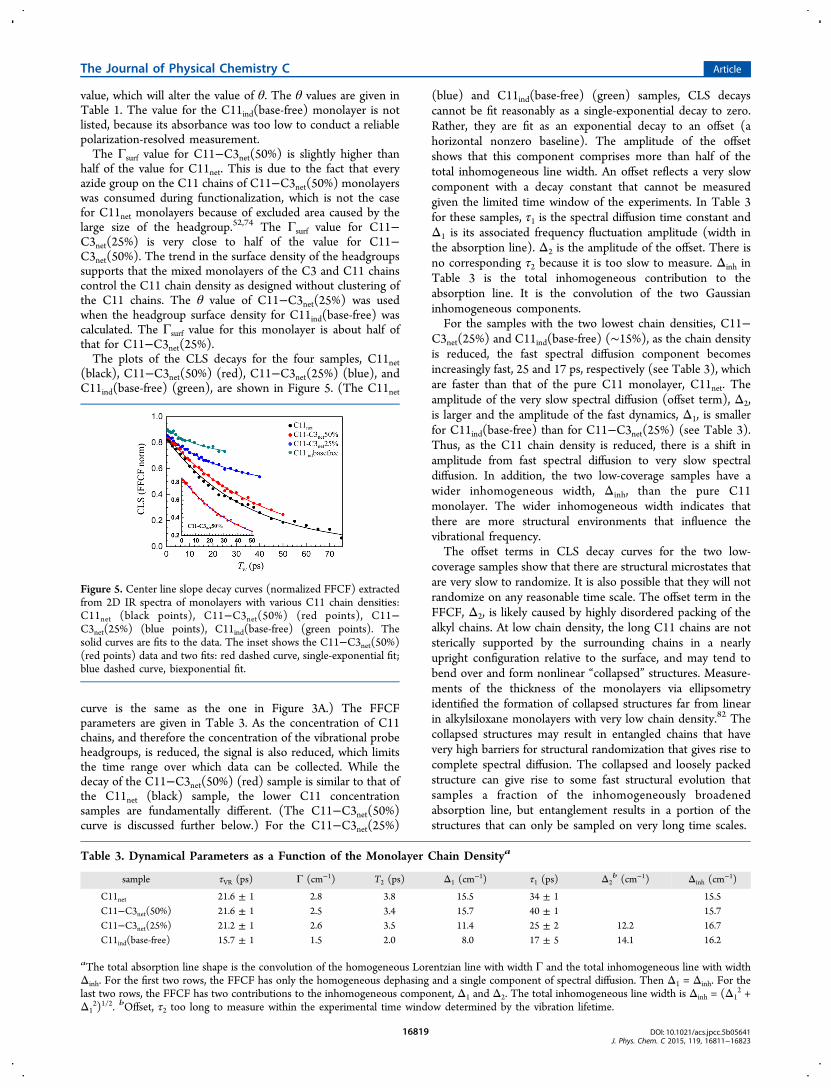
(black), C11−C3net(50%) (red), C11−C3net(25%) (blue), andC11ind(base-free) (green), are shown in Figure 5. (The C11net
curve is the same as the one in Figure 3A.) The FFCFparameters are given in Table 3. As the concentration of C11chains, and therefore the concentration of the vibrational probeheadgroups, is reduced, the signal is also reduced, which limitsthe time range over which data can be collected. While thedecay of the C11−C3net(50%) (red) sample is similar to that ofthe C11net (black) sample, the lower C11 concentrationsamples are fundamentally different. (The C11−C3net(50%)curve is discussed further below.) For the C11−C3net(25%)
(blue) and C11ind(base-free) (green) samples, CLS decayscannot be fit reasonably as a single-exponential decay to zero.Rather, they are fit as an exponential decay to an offset (ahorizontal nonzero baseline). The amplitude of the offsetshows that this component comprises more than half of thetotal inhomogeneous line width. An offset reflects a very slowcomponent with a decay constant that cannot be measuredgiven the limited time window of the experiments. In Table 3for these samples, τ1 is the spectral diffusion time constant andΔ1 is its associated frequency fluctuation amplitude (width inthe absorption line). Δ2 is the amplitude of the offset. There isno corresponding τ2 because it is too slow to measure. Δinh inTable 3 is the total inhomogeneous contribution to theabsorption line. It is the convolution of the two Gaussianinhomogeneous components.For the samples with the two lowest chain densities, C11−
C3net(25%) and C11ind(base-free) (∼15%), as the chain densityis reduced, the fast spectral diffusion component becomesincreasingly fast, 25 and 17 ps, respectively (see Table 3), whichare faster than that of the pure C11 monolayer, C11net. Theamplitude of the very slow spectral diffusion (offset term), Δ2,is larger and the amplitude of the fast dynamics, Δ1, is smallerfor C11ind(base-free) than for C11−C3net(25%) (see Table 3).Thus, as the C11 chain density is reduced, there is a shift inamplitude from fast spectral diffusion to very slow spectraldiffusion. In addition, the two low-coverage samples have awider inhomogeneous width, Δinh, than the pure C11monolayer. The wider inhomogeneous width indicates thatthere are more structural environments that influence thevibrational frequency.The offset terms in CLS decay curves for the two low-
coverage samples show that there are structural microstates thatare very slow to randomize. It is also possible that they will notrandomize on any reasonable time scale. The offset term in theFFCF, Δ2, is likely caused by highly disordered packing of thealkyl chains. At low chain density, the long C11 chains are notsterically supported by the surrounding chains in a nearlyupright configuration relative to the surface, and may tend tobend over and form nonlinear “collapsed” structures. Measure-ments of the thickness of the monolayers via ellipsometryidentified the formation of collapsed structures far from linearin alkylsiloxane monolayers with very low chain density.82 Thecollapsed structures may result in entangled chains that havevery high barriers for structural randomization that gives rise tocomplete spectral diffusion. The collapsed and loosely packedstructure can give rise to some fast structural evolution thatsamples a fraction of the inhomogeneously broadenedabsorption line, but entanglement results in a portion of thestructures that can only be sampled on very long time scales.
Figure 5. Center line slope decay curves (normalized FFCF) extractedfrom 2D IR spectra of monolayers with various C11 chain densities:C11net (black points), C11−C3net(50%) (red points), C11−C3net(25%) (blue points), C11ind(base-free) (green points). Thesolid curves are fits to the data. The inset shows the C11−C3net(50%)(red points) data and two fits: red dashed curve, single-exponential fit;blue dashed curve, biexponential fit.
Table 3. Dynamical Parameters as a Function of the Monolayer Chain Densitya
sample τVR (ps) Γ (cm−1) T2 (ps) Δ1 (cm−1) τ1 (ps) Δ2
b (cm−1) Δinh (cm−1)
C11net 21.6 ± 1 2.8 3.8 15.5 34 ± 1 15.5C11−C3net(50%) 21.6 ± 1 2.5 3.4 15.7 40 ± 1 15.7C11−C3net(25%) 21.2 ± 1 2.6 3.5 11.4 25 ± 2 12.2 16.7C11ind(base-free) 15.7 ± 1 1.5 2.0 8.0 17 ± 5 14.1 16.2
aThe total absorption line shape is the convolution of the homogeneous Lorentzian line with width Γ and the total inhomogeneous line with widthΔinh. For the first two rows, the FFCF has only the homogeneous dephasing and a single component of spectral diffusion. Then Δ1 = Δinh. For thelast two rows, the FFCF has two contributions to the inhomogeneous component, Δ1 and Δ2. The total inhomogeneous line width is Δinh = (Δ1
2 +Δ1
2)1/2. bOffset, τ2 too long to measure within the experimental time window determined by the vibration lifetime.
The Journal of Physical Chemistry C Article
DOI: 10.1021/acs.jpcc.5b05641J. Phys. Chem. C 2015, 119, 16811−16823
16819

Returning to the C11−C3net(50%) sample, the data are fitwith a single exponential, in contrast to the lower densitysamples. However, the decay time constant, 40 ps, is somewhatslower than the 34 ps decay time constant of the samples withfull C11 coverage, C11net. One possibility is that the C11−C3net(50%) samples do develop faster and slower componentsto the CLS decay, but the change is too small to observe. Theinset in Figure 5 shows the C11−C3net(50%) data (red points)and two fits. The red dashed curve is the single-exponentialdecay that yields 40 ps as in the main portion of the sample.The blue dashed curve is a biexponential fit with time constantsof 30 and 45 ps, where one time constant was fixed at 30 ps andthe other allowed to float. This curve is indistinguishable fromthe single-exponential fit. This fit has a component that is fasterthan the fit to the C11net data and a component that is slower,like the lower density samples, but unlike the lower densitysamples, the slow and fast components are not different enoughto resolve. If the fast component is fixed at a value much below30 ps, the fit yields its amplitude as essentially zero, and returns∼40 ps for the other decay, which is basically the single-exponential fit to the data. The net result is that reduction fromfull coverage to 50% coverage does not have a large effect onthe dynamics. Only when the chain density becomes evenlower are obvious changes in the dynamics and inhomogeneousline widths observed.
4. CONCLUDING REMARKSWe have investigated a series of functionalized alkylsiloxanemonolayers by infrared linear absorption spectroscopy andnonlinear time-resolved 2D IR spectroscopy. The infraredlinear absorption spectroscopy combined with ICP-MS verifiedthat the monolayer samples had good quality and high surfacedensity. The rhenium carbonyl headgroup, which mimics theheadgroups found in many applications, served as thevibrational probe for investigating the fast structural dynamicsof the monolayers using 2D IR to measure spectral diffusion.Spectral diffusion is produced by the structural evolution of a
system that causes vibrational chromophores to sampledifferent frequencies within the inhomogeneously broadenedabsorption spectrum because the frequency is coupled to thestructure. A coupling mechanism has been used in MDsimulations to successfully reproduce the experimental data ofsystems such as proteins, water, and room temperature ionicliquids is the vibrational Stark effect.63,64,78−80,83 As thestructure of a system evolves in time, the electric field producedby all of the constituents of the system projected onto thevibrational transition dipole fluctuates because of the changingpositions of the various moieties. These electric fieldfluctuations cause the vibrational frequency to fluctuate throughthe Stark effect. In a simulation, the partial charges on all of thecomponents of the system produce a resultant time-dependentelectric field along the vibration’s transition dipole. The time-dependent electric field produces the frequency fluctuationsthat are measured in a 2D IR experiment as spectral diffusion.This method has been remarkably successful in reproducing theFFCF of complex systems.63,64,79,80,83 The time dependence isindependent of the value of the Stark coupling constant, whichcan be adjusted to reproduce the absorption spectrum linewidth. In a number of cases where the Stark coupling constantis known from experiments, the simulations have resulted inStark constants that are consistent with the independentlymeasured values, which supports the validity of the Starkmechanism for spectral diffusion.64,83
Preliminary simulations of C11 chains with the RePhen-(CO)3Cl headgroup and triazole ring on crystalline SiO2 havebeen performed.84 The fluctuating electric field with Starkcoupling model was used, and the preliminary FFCF isreasonable but somewhat slower than the experimental resultsfor the amorphous silica substrate. While these preliminaryresults cannot be directly compared to the experimental resultson amorphous SiO2, they do provide insights into the nature ofthe dynamics. The headgroups reside at the top of themonolayer. Chains do not bend over and bury the headgroupsin the alkyl region of the monolayer. The decay of the FFCF isproduced by motions of the alkyl chains. These motions causethe headgroups to move. There are frequent partial rotations ofthe methylenes as well as gauche−trans isomerizations, andconcerted isomerizations of several methylene groups along thealkyl chains. These motions cause the headgroups to move upand down to some extent and produce some angularfluctuations of the headgroups but do not necessarily resultin large changes in the headgroup orientation. The entire chainsbend back and forth from motions at the points of attachmentto the SiO2 crystal. 2D IR experiments on crystalline gold willbe compared quantitatively to simulations on crystalline gold,which are in progress.84 In addition to simulating the FFCF,various single-chain orientation and position correlationfunctions as well as collective correlation functions will becalculated. These simulations will provide a detailed under-standing of the chain motions that are responsible for the decayof the FFCF.In the results presented above, two methods of forming
alkylsiloxane monolayers on SiO2 surfaces were studied. Onemethod used monochlorosilane with the assistance of a basecatalyst to form monolayers where independent chains aredirectly attached to the silica surface. The other method usedtrichlorosilane as the precursor where trichlorosilanes react insolution to form networks of interlinked chains. The chainnetworks then attach to the surface. Polarized FT-IR absorptionexperiments showed that the manner of attachment did notchange the direction of the IR transition dipole of the COstretching mode of the metal carbonyl headgroup. The lack of achange of the transition dipole directions indicates that themethod of attachment does not have a significant impact on thestructure of monolayers above the silica surface. The 2D IRexperiments showed that the chain dynamics were independentof the manner of attachment for several alkyl chain lengths.The influence of the alkyl chain lengths on the monolayer
dynamics was also investigated for three chain lengths, C11, C4,and C3, for both methods of attachment. The same trend wasobserved with either manner of attachment. In going from C11to C4, a reduction of seven methylene moieties, the dynamicsslowed mildly, from 34 to 42 ps. However, the reduction of thechain length by one more methylene to C3 slowed thedynamics to ∼70 ps. These results indicate that motions of thechains near the substrate are significantly slower than thosefurther away, and that the chain structural fluctuations are notgreatly sensitive to the chain length once the chain issufficiently long.Finally, the influence of the chain density on the monolayer
structural dynamics was investigated for a series of monolayerswith decreasing C11 chain density. Two samples were preparedwith lower C11 chain density, 50% C11 and 25% C11, bycofunctionalizing the surface with C11 and C3 chains. Only theC11 chains had the vibrational probe. Another sample wasprepared with an even lower surface density of C11 chains,
The Journal of Physical Chemistry C Article
DOI: 10.1021/acs.jpcc.5b05641J. Phys. Chem. C 2015, 119, 16811−16823
16820

∼15% of that of the fully packed monolayers, by using themonochlorosilane precursor without the assistance of the basecatalyst. Going from 100% C11 to 50% C11 had only a minoreffect on the monolayer structural dynamics. However, for 25%and 15%, there was a fundamental change in the nature of thedynamics. While the 100% samples displayed spectral diffusionwith single-exponential time dependence, the 25% and 15%samples yielded spectral diffusion with two components, onethat is faster than the 100% C11 monolayer dynamics and onethat is very slow, too slow to measure in the experimental timewindow determined by the vibrational lifetime. It was suggestedthat the change in dynamics is caused by collapsed chainstructures that are very different from those of high-chain-density samples. The collapsed structures can still have faststructural dynamics that sample a fraction of the inhomoge-neously broadened absorption line, but a large portion of thecollapsed structures have high barriers for structural random-ization that occurs on long time scales.The experiments reported here were made possible by
applicability of 2D IR spectroscopy to monolayers. They haveprovided information on the relationship between themonolayer structure and dynamics for alkylsiloxane monolayerson a SiO2 surface.
■ ASSOCIATED CONTENT*S Supporting InformationDescriptions of the preparation of monolayer samples,procedures of the ICP-MS measurements, details of extractingthe polar angle of the transition dipole, θ, of the carbonylsymmetric stretching mode, and a 2D IR spectrum showingboth 0−1 and 1−2 bands of the headgroup are included. TheSupporting Information is available free of charge on the ACSPublications website at DOI: 10.1021/acs.jpcc.5b05641.
■ AUTHOR INFORMATIONCorresponding Author*E-mail: [email protected] authors declare no competing financial interest.
■ ACKNOWLEDGMENTSWe thank Professor Thomas E. Markland and WilliamPfalzgraff for sharing with us their preliminary moleculardynamics simulation results and insightful discussions on themechanism of the monolayer dynamics. We thank ProfessorChristopher E. D. Chidsey for sharing his knowledge on thepreparation and structures of monolayers. We are also gratefulfor Professor T. Daniel P. Stack and Samuel Fretz’s advice onthe synthesis of the rhenium carbonyl complex headgroup. Wealso thank the Stanford Nanofabrication Facility for help andequipment that enabled us to prepare the SiO2-coated CaF2substrates. This material is based upon work supported by theAir Force Office of Scientific Research (AFOSR) under AFOSRGrant Number FA9550-12-1-0050. C.Y. and J.N. also thank theStanford Graduate Fellowship program for graduate fellow-ships.
■ REFERENCES(1) Miro, P.; Audiffred, M.; Heine, T. An Atlas of Two-DimensionalMaterials. Chem. Soc. Rev. 2014, 43, 6537−6554.(2) Kissel, P.; Murray, D. J.; Wulftange, W. J.; Catalano, V. J.; King, B.T. A Nanoporous Two-Dimensional Polymer by Single-Crystal-to-Single-Crystal Photopolymerization. Nat. Chem. 2014, 6, 774−778.
(3) Ulman, A. Formation and Structure of Self-AssembledMonolayers. Chem. Rev. 1996, 96, 1533−1554.(4) Maoz, R.; Sagiv, J. On the Formation and Structure of Self-Assembling Monolayers. I. A Comparative ATR-Wettability Study ofLangmuir−Blodgett and Adsorbed Films on Flat Substrates and GlassMicrobeads. J. Colloid Interface Sci. 1984, 100, 465−496.(5) Love, J. C.; Estroff, L. A.; Kriebel, J. K.; Nuzzo, R. G.; Whitesides,G. M. Self-Assembled Monolayers of Thiolates on Metals as a Form ofNanotechnology. Chem. Rev. 2005, 105, 1103−1169.(6) Sagiv, J. Organized Monolayers by Adsorption. 1. Formation andStructure of Oleophobic Mixed Monolayers on Solid-Surfaces. J. Am.Chem. Soc. 1980, 102, 92−98.(7) Haensch, C.; Hoeppener, S.; Schubert, U. S. ChemicalModification of Self-Assembled Silane Based Monolayers by SurfaceReactions. Chem. Soc. Rev. 2010, 39, 2323−2334.(8) Hsieh, S. C.; Chao, W. J.; Lin, P. Y.; Hsieh, C. W. Influence ofMolecular Packing on the Corrosion Inhibition Properties of Self-Assembled Octadecyltrichlorosilane Monolayers on Silicon. Corros. Sci.2014, 80, 427−433.(9) Song, Y.; Nair, R. P.; Zou, M.; Wang, Y. Q. SuperhydrophobicSurfaces Produced by Applying a Self-Assembled Monolayer to SiliconMicro/Nano-Textured Surfaces. Nano Res. 2009, 2, 143−150.(10) Onclin, S.; Mulder, A.; Huskens, J.; Ravoo, B. J.; Reinhoudt, D.N. Molecular Printboards: Monolayers of β-Cyclodextrins on SiliconOxide Surfaces. Langmuir 2004, 20, 5460−5466.(11) Turgeman, R.; Gershevitz, O.; Palchik, O.; Deutsch, M.; Ocko,B. M.; Gedanken, A.; Sukenik, C. N. Oriented Growth of Zno Crystalson Self-Assembled Monolayers of Functionalized Alkyl Silanes. Cryst.Growth Des. 2004, 4, 169−175.(12) Taguchi, T.; Isozaki, K.; Miki, K. Enhanced Catalytic Activity ofSelf-Assembled-Monolayer-Capped Gold Nanoparticles. Adv. Mater.2012, 24, 6462−6467.(13) Liu, D.; Lie, Y.; Shao, H.; Jiang, X. Using Azobenzene-Embedded Self-Assembled Monolayers To Photochemically ControlCell Adhesion Reversibly. Angew. Chem., Int. Ed. 2009, 48, 4406−4408.(14) Turchanin, A.; Tinazli, A.; El-Desawy, M.; Großmann, H.;Schnietz, M.; Solak, H. H.; Tampe, R.; Golzhauser, A. Molecular Self-Assembly, Chemical Lithography, and Biochemical Tweezers: A Pathfor the Fabrication of Functional Nanometer-Scale Protein Arrays.Adv. Mater. 2008, 20, 471−477.(15) Ma, H.; Acton, O.; Hutchins, D. O.; Cernetic, N.; Jen, A. K.-Y.Multifunctional Phosphonic Acid Self-Assembled Monolayers onMetal Oxides as Dielectrics, Interface Modification Layers andSemiconductors for Low-Voltage High-Performance Organic Field-Effect Transistors. Phys. Chem. Chem. Phys. 2012, 14, 14110−14126.(16) Allara, D. L.; Parikh, A. N.; Rondelez, F. Evidence for a UniqueChain Organization in Long-Chain Silane Monolayers Deposited onTwo Widely Different Solid Substrates. Langmuir 1995, 11, 2357−2360.(17) Tripp, C. P.; Hair, M. L. An Infrared Study of the Reaction ofOctadecyltrichlorosilane with Silica. Langmuir 1992, 8, 1120−1126.(18) Liu, Y.; Wolf, L. K.; Messmer, M. C. A Study of Alkyl ChainConformational Changes in Self-Assembled n-OctadecyltrichlorosilaneMonolayers on Fused Silica Surfaces. Langmuir 2001, 17, 4329−4335.(19) Lagutchev, A. S.; Song, K. J.; Huang, J. Y.; Yang, P. K.; Chuang,T. J. Self-Assembly of Alkylsiloxane Monolayers on Fused SilicaStudied by XPS and Sum Frequency Generation Spectroscopy. Chem.Phys. 1998, 226, 337−349.(20) Vallant, T.; Brunner, H.; Mayer, U.; Hoffmann, H.; Leitner, T.;Resch, R.; Friedbacher, G. Formation of Self-Assembled Octadecylsi-loxane Monolayers on Mica and Silicon Surfaces Studied by AtomicForce Microscopy and Infrared Spectroscopy. J. Phys. Chem. B 1998,102, 7190−7197.(21) Wang, H. F.; Gan, W.; Lu, R.; Rao, Y.; Wu, B. H. QuantitativeSpectral and Orientational Analysis in Surface Sum FrequencyGeneration Vibrational Spectroscopy (SFG-VS). Int. Rev. Phys.Chem. 2005, 24, 191−256.
The Journal of Physical Chemistry C Article
DOI: 10.1021/acs.jpcc.5b05641J. Phys. Chem. C 2015, 119, 16811−16823
16821

(22) Richmond, G. L. Molecular Bonding and Interactions atAqueous Surfaces as Probed by Vibrational Sum Frequency Spectros-copy. Chem. Rev. 2002, 102, 2693−2724.(23) Eisenthal, K. B. Liquid Interfaces Probed by Second-Harmonicand Sum-Frequency Spectroscopy. Chem. Rev. 1996, 96, 1343−1360.(24) Gengeliczki, Z.; Rosenfeld, D. E.; Fayer, M. D. Theory ofInterfacial Orientational Relaxation Spectroscopic Observables. J.Chem. Phys. 2010, 132, 244703.(25) Zhang, Z.; Piatkowski, L.; Bakker, H. J.; Bonn, M. UltrafastVibrational Energy Transfer at the Water/Air Interface Revealed byTwo-Dimensional Surface Vibrational Spectroscopy. Nat. Chem. 2011,3, 888−893.(26) Inoue, K.-i.; Nihonyanagi, S.; Singh, P. C.; Yamaguchi, S.;Tahara, T. 2D Heterodyne-Detected Sum Frequency GenerationStudy on the Ultrafast Vibrational Dynamics of H2O and HOD Waterat Charged Interfaces Dynamics of H2O and HOD Water at ChargedInterfaces. J. Chem. Phys. 2015, 142, 212431.(27) Xiong, W.; Laaser, J. E.; Mehlenbacher, R. D.; Zanni, M. T.Adding a Dimension to the Infrared Spectra of Interfaces UsingHeterodyne Detected 2D Sum-Frequency Generation (HD 2D SFG)Spectroscopy. Proc. Natl. Acad. Sci. U.S.A. 2011, 108, 20902−20907.(28) Laaser, J. E.; Skoff, D. R.; Ho, J. J.; Joo, Y.; Serrano, A. L.;Steinkruger, J. D.; Gopalan, P.; Gellman, S. H.; Zanni, M. T. Two-Dimensional Sum-Frequency Generation Reveals Structure andDynamics of a Surface-Bound Peptide. J. Am. Chem. Soc. 2014, 136,956−962.(29) Patterson, J. E.; Lagutchev, A.; Huang, W.; Dlott, D. D. UltrafastDynamics of Shock Compression of Molecular Monolayers. Phys. Rev.Lett. 2005, 94, 015501.(30) Bredenbeck, J.; Ghosh, A.; Nienhuys, H. K.; Bonn, M. Interface-Specific Ultrafast Two-Dimensional Vibrational Spectroscopy. Acc.Chem. Res. 2009, 42, 1332−1342.(31) Bordenyuk, A. N.; Jayathilake, H.; Benderskii, A. V. CoherentVibrational Quantum Beats as a Probe of Langmuir−BlodgettMonolayers. J. Phys. Chem. B 2005, 109, 15941−15949.(32) Nihonyanagi, S.; Eftekhari-Bafrooei, A.; Borguet, E. UltrafastVibrational Dynamics and Spectroscopy of a Siloxane Self-AssembledMonolayer. J. Chem. Phys. 2011, 134, 084701.(33) Malyk, S.; Shalhout, F. Y.; O’Leary, L. E.; Lewis, N. S.;Benderskii, A. V. Vibrational Sum Frequency Spectroscopic Inves-tigation of the Azimuthal Anisotropy and Rotational Dynamics ofMethyl-Terminated Silicon(111) Surfaces. J. Phys. Chem. C 2013, 117,935−944.(34) Karpovich, D. S.; Blanchard, G. J. Dynamics of a TetheredChromophore Imbedded in a Self-Assembled Monolayer. Langmuir1996, 12, 5522−5524.(35) Hautman, J.; Klein, M. L. Simulation of a Monolayer of AlkylThiol Chains. J. Chem. Phys. 1989, 91, 4994−5001.(36) Hautman, J.; Klein, M. L. Molecular-Dynamics Simulation of theEffects of Temperature on a Dense Monolayer of Long-ChainMolecules. J. Chem. Phys. 1990, 93, 7483−7492.(37) Mar, W.; Klein, M. L. Molecular-Dynamics Study of the Self-Assembled Monolayer Composed of S(CH2)14CH3 Molecules Usingan All-Atoms Model. Langmuir 1994, 10, 188−196.(38) Cho, M. H. Coherent Two-Dimensional Optical Spectroscopy.Chem. Rev. 2008, 108, 1331−1418.(39) Fayer, M. D. Dynamics of Liquids, Molecules, and ProteinsMeasured with Ultrafast 2D IR Vibrational Echo Chemical ExchangeSpectroscopy. Annu. Rev. Phys. Chem. 2009, 60, 21−38.(40) Zheng, J. R.; Kwak, K.; Asbury, J.; Chen, X.; Piletic, I. R.; Fayer,M. D. Ultrafast Dynamics of Solute-Solvent Complexation Observedat Thermal Equilibrium in Real Time. Science 2005, 309, 1338−1343.(41) Li, D.; Fedeles, B. I.; Singh, V.; Peng, C. S.; Silvestre, K. J.; Simi,A. K.; Simpson, J. H.; Tokmakoff, A.; Essigmann, J. M. TautomerismProvides a Molecular Explanation for the Mutagenic Properties of theAnti-HIV Nucleoside 5-Aza-5,6-dihydro-2′-deoxycytidine. Proc. Natl.Acad. Sci. U.S.A. 2014, 111, 3252−3259.
(42) King, J. T.; Arthur, E. J.; Brooks, C. L., III; Kubarych, K. J.Crowding Induced Collective Hydration of Biological Macromoleculesover Extended Distances. J. Am. Chem. Soc. 2014, 136, 188−194.(43) Cahoon, J. F.; Sawyer, K. R.; Schlegel, J. P.; Harris, C. B.Determining Transition-State Geometries in Liquids Using 2D-IR.Science 2008, 319, 1820−1823.(44) Kiefer, L. M.; King, J. T.; Kubarych, K. J. Dynamics of RheniumPhotocatalysts Revealed through Ultrafast Multidimensional Spectros-copy. Acc. Chem. Res. 2015, 48, 1123−1130.(45) Perakis, F.; Widmer, S.; Hamm, P. Two-Dimensional InfraredSpectroscopy of Isotope-Diluted Ice Ih. J. Chem. Phys. 2011, 134,204505.(46) Shim, S. H.; Gupta, R.; Ling, Y. L.; Strasfeld, D. B.; Raleigh, D.P.; Zanni, M. T. Two-Dimensional IR Spectroscopy and IsotopeLabeling Defines the Pathway of Amyloid Formation with Residue-Specific Resolution. Proc. Natl. Acad. Sci. U.S.A. 2009, 106, 6614−6619.(47) Remorino, A.; Korendovych, I. V.; Wu, Y.; DeGrado, W. F.;Hochstrasser, R. M. Residue-Specific Vibrational Echoes Yield 3DStructures of a Transmembrane Helix Dimer. Science 2011, 332,1206−1209.(48) Asbury, J. B.; Steinel, T.; Stromberg, C.; Corcelli, S. A.;Lawrence, C. P.; Skinner, J. L.; Fayer, M. D. Water Dynamics:Vibrational Echo Correlation Spectroscopy and Comparison toMolecular Dynamics Simulations. J. Phys. Chem. A 2004, 108,1107−1119.(49) Ramasesha, K.; De Marco, L.; Mandal, A.; Tokmakoff, A. WaterVibrations Have Strongly Mixed Intra- and Intermolecular Character.Nat. Chem. 2013, 5, 935−940.(50) Piletic, I. R.; Tan, H.-S.; Fayer, M. D. Dynamics of NanoscopicWater: Vibrational Echo and Infrared Pump−Probe Studies of ReverseMicelles. J. Phys. Chem. B 2005, 109, 21273−21284.(51) Rosenfeld, D. E.; Gengeliczki, Z.; Smith, B. J.; Stack, T. D. P.;Fayer, M. D. Structural Dynamics of a Catalytic Monolayer Probed byUltrafast 2D IR Vibrational Echoes. Science 2011, 334, 634−639.(52) Rosenfeld, D. E.; Nishida, J.; Yan, C.; Gengeliczki, Z.; Smith, B.J.; Fayer, M. D. Dynamics of Functionalized Surface MolecularMonolayers Studied with Ultrafast Infrared Vibrational Spectroscopy.J. Phys. Chem. C 2012, 116, 23428−23440.(53) Rosenfeld, D. E.; Nishida, J.; Yan, C.; Kumar, S. K. K.; Tamimi,A.; Fayer, M. D. Structural Dynamics at Monolayer-Liquid InterfacesProbed by 2D IR Spectroscopy. J. Phys. Chem. C 2013, 117, 1409−1420.(54) Nishida, J.; Yan, C.; Fayer, M. D. Dynamics of MolecularMonolayers with Different Chain Lengths in Air and Solvents Probedby Ultrafast 2D IR Spectroscopy. J. Phys. Chem. C 2014, 118, 523−532.(55) Kraack, J. P.; Lotti, D.; Hamm, P. 2D Attenuated TotalReflectance Infrared Spectroscopy Reveals Ultrafast VibrationalDynamics of Organic Monolayers at Metal-Liquid Interfaces. J.Chem. Phys. 2015, 142, 212413.(56) Wasserman, S. R.; Tao, Y. T.; Whitesides, G. M. Structure andReactivity of Alkylsiloxane Monolayers Formed by Reaction ofAlkyltrichlorosilanes on Silicon Substrates. Langmuir 1989, 5, 1074−1087.(57) Haensch, C.; Hoeppener, S.; Schubert, U. S. Chemical SurfaceReactions by Click Chemistry: Coumarin Dye Modification of 11-Bromoundecyltrichlorosilane Monolayers. Nanotechnology 2008, 19,035703.(58) Fadeev, A. Y.; McCarthy, T. J. Trialkylsilane MonolayersCovalently Attached to Silicon Surfaces: Wettability Studies IndicatingThat Molecular Topography Contributes to Contact Angle Hysteresis.Langmuir 1999, 15, 3759−3766.(59) Meldal, M.; Tornoe, C. W. Cu-Catalyzed Azide−AlkyneCycloaddition. Chem. Rev. 2008, 108, 2952−3015.(60) Park, S.; Kwak, K.; Fayer, M. D. Ultrafast 2D-IR VibrationalEcho Spectroscopy: A Probe of Molecular Dynamics. Laser Phys. Lett.2007, 4, 704−718.
The Journal of Physical Chemistry C Article
DOI: 10.1021/acs.jpcc.5b05641J. Phys. Chem. C 2015, 119, 16811−16823
16822

(61) Kwak, K.; Park, S.; Finkelstein, I. J.; Fayer, M. D. Frequency-Frequency Correlation Functions and Apodization in Two-Dimen-sional Infrared Vibrational Echo Spectroscopy: A New Approach. J.Chem. Phys. 2007, 127, 124503.(62) Kwak, K.; Rosenfeld, D. E.; Fayer, M. D. Taking Apart the Two-Dimensional Infrared Vibrational Echo Spectra: More Information andElimination of Distortions. J. Chem. Phys. 2008, 128, 204505.(63) Terranova, Z. L.; Corcelli, S. A. Molecular DynamicsInvestigation of the Vibrational Spectroscopy of Isolated Water in anIonic Liquid. J. Phys. Chem. B 2014, 118, 8264−8272.(64) Bagchi, S.; Boxer, S. G.; Fayer, M. D. Ribonuclease S DynamicsMeasured Using a Nitrile Label with 2D IR Vibrational EchoSpectroscopy. J. Phys. Chem. B 2012, 116, 4034−4042.(65) Dunbar, J. A.; Arthur, E. J.; White, A. M.; Kubarych, K. J.Ultrafast 2D-IR and Simulation Investigations of Preferential Solvationand Cosolvent Exchange Dynamics. J. Phys. Chem. B 2015, 119, 6271−6279.(66) Smith, A. W.; Lessing, J.; Ganim, Z.; Peng, C. S.; Tokmakoff, A.;Roy, S.; Jansen, T. L. C.; Knoester, J. Melting of a β-Hairpin PeptideUsing Isotope-Edited 2D IR Spectroscopy and Simulations. J. Phys.Chem. B 2010, 114, 10913−10924.(67) Fayer, M. D. Dynamics of Molecules in Condensed Phases:Picosecond Holographic Grating Experiments. Annu. Rev. Phys. Chem.1982, 33, 63−87.(68) Deeg, F. W.; Fayer, M. D. Analysis of Complex MolecularDynamics in an Organic Liquid by Polarization Selective Subpico-second Transient Grating Experiments. J. Chem. Phys. 1989, 91, 2269−2279.(69) Fourkas, J. T.; Fayer, M. D. The Transient Grating: AHolographic Window to Dynamic Processes. Acc. Chem. Res. 1992, 25,227−233.(70) Snyder, R. G.; Strauss, H. L.; Elliger, C. A. C−H StretchingModes and the Structure of n-Alkyl Chains. 1. Long, DisorderedChains. J. Phys. Chem. 1982, 86, 5145−5150.(71) Macphail, R. A.; Strauss, H. L.; Snyder, R. G.; Elliger, C. A. C−H Stretching Modes and the Structure of n-Alkyl Chains. 2. Long, All-Trans Chains. J. Phys. Chem. 1984, 88, 334−341.(72) Stevens, M. J. Thoughts on the Structure of AlkylsilaneMonolayers. Langmuir 1999, 15, 2773−2778.(73) Offord, D. A.; Griffin, J. H. Kinetic Control in the Formation ofSelf-Assembled Mixed Monolayers on Planar Silica Substrates.Langmuir 1993, 9, 3015−3025.(74) Collman, J. P.; Devaraj, N. K.; Eberspacher, T. P. A.; Chidsey, C.E. D. Mixed Azide-Terminated Monolayers: A Platform for ModifyingElectrode Surfaces. Langmuir 2006, 22, 2457−2464.(75) Andrews, S. S.; Boxer, S. G. Vibrational Stark Effects of NitrilesI. Methods and Experimental Results. J. Phys. Chem. A 2000, 104,11853−11863.(76) Hush, N. S.; Reimers, J. R. Vibrational Stark Spectroscopy. 1.Basic Theory and Application to the CO Stretch. J. Phys. Chem. 1995,99, 15798−15805.(77) Levinson, N. M.; Fried, S. D.; Boxer, S. G. Solvent-InducedInfrared Frequency Shifts in Aromatic Nitriles Are QuantitativelyDescribed by the Vibrational Stark Effect. J. Phys. Chem. B 2012, 116,10470−10476.(78) Williams, R. B.; Loring, R. F.; Fayer, M. D. VibrationalDephasing of Carbonmonoxy Myoglobin. J. Phys. Chem. B 2001, 105,4068−4071.(79) Geissler, P. L. Water Interfaces, Solvation, and Spectroscopy.Annu. Rev. Phys. Chem. 2013, 64, 317−337.(80) Corcelli, S.; Lawrence, C. P.; Skinner, J. L. Combined ElectronicStructure/Molecular Dynamics Approach for Ultrafast InfraredSpectroscopy of Dilute HOD in Liquid H2O and D2O. J. Chem.Phys. 2004, 120, 8107−8117.(81) Nishida, J.; Fayer, M. D. Theory of Third-Order SpectroscopicMethods To Extract Detailed Molecular Orientational Dynamics forPlanar Surfaces and Other Uniaxial Systems. J. Chem. Phys. 2014, 140,144702.
(82) Angst, D. L.; Simmons, G. W. Moisture Absorption Character-istics of Organosiloxane Self-Assembled Monolayers. Langmuir 1991,7, 2236−2242.(83) Merchant, K. A.; Noid, W. G.; Akiyama, R.; Finkelstein, I.;Goun, A.; McClain, B. L.; Loring, R. F.; Fayer, M. D. Myoglobin-COSubstate Structures and Dynamics: Multidimensional VibrationalEchoes and Molecular Dynamics Simulations. J. Am. Chem. Soc.2003, 125, 13804−13818.(84) Pfalzgraff, W. C.; Markland, T. E. Private communication, 2015.
The Journal of Physical Chemistry C Article
DOI: 10.1021/acs.jpcc.5b05641J. Phys. Chem. C 2015, 119, 16811−16823
16823