structure and assoclatlon - south west nrm understanding of cotnmunity structures, ... blake (1938),...
TRANSCRIPT

Reprinted from the AUSTRALIAN JOURNAL OF BOTANY
STRUCTURE AND ASSOClATlON IN THE MULGA (ACACIA ANEURA) LANDS
OF SOUTH-WESTERN QUEENSLAND
Results of a detailed botanical survey in two nlulga (Acacia anesro) areas of senii- arid south-western Queensland arc presented. Two 20 mile belt transects permanently identified for future relocation were used to record woody vegetation. The results for cach of the study areas are interpreted by means of association analysis. Several site groups were recognized, in which increasing elevation from the flats to the ridges seems to be the main factor consistent with con~munity changes.
The density of seedling and young niulga is considered inadequate for future drought reserves at one site. No large spccics groups exist on either site, and both areas represent small niosaics. It is suggested that microtopography is an iniporLant deter- ~ninant of species distribution in the sites studied.
In Queensland, nlulga (Amcin n?ietrr.n F. Muell.) associations occupy some 55 million acres, with their greatest expression in the semiarid south-western portion of the State. An understanding of cotnmunity structures, their fluctuations with climate, and their reactions to grazing is regarded as a prerequisite to full utilization and maintenance of arid zone resources (Whyte 1956). Quantitative data on the population dynamics of Queensland semiarid comn~unities are meagre.
Generalized descriptions or mulga and mulga communities were presented by Blake (1938), Beadle (1948), Everisl (1949), and Holland and Moore (1962). These authors, however, rarely gave detailed frequency and density data on the species composition of specific sites. This renders the observation of vegetation change impossible.
Conceru over the deterioration of ground cover and the future productivity of mulga country has been expressed by Ratcliffe (1937), Wood (1950), and more recently by landholders and public authorities. In particular, two large holdings in south- western Queensland, viz. Humeburn (21 6 sq miles in area) and Tobermory (420 sq miles), were recently placed under maxintunl stocking rate provisions. As a result two similar studies were initiated in 1965 to exatnine the structure of the vegetation on these two siles, so that changes could be measured and analysed in future surveys.
This paper describes some species and community affinities OF each of the sites.
' Departmcnl of Primary Industries, Charleville Pastoral Laboratory, Charleville, Qld. 4470.
540 W. H. BURROWS AND I. F. BEALE
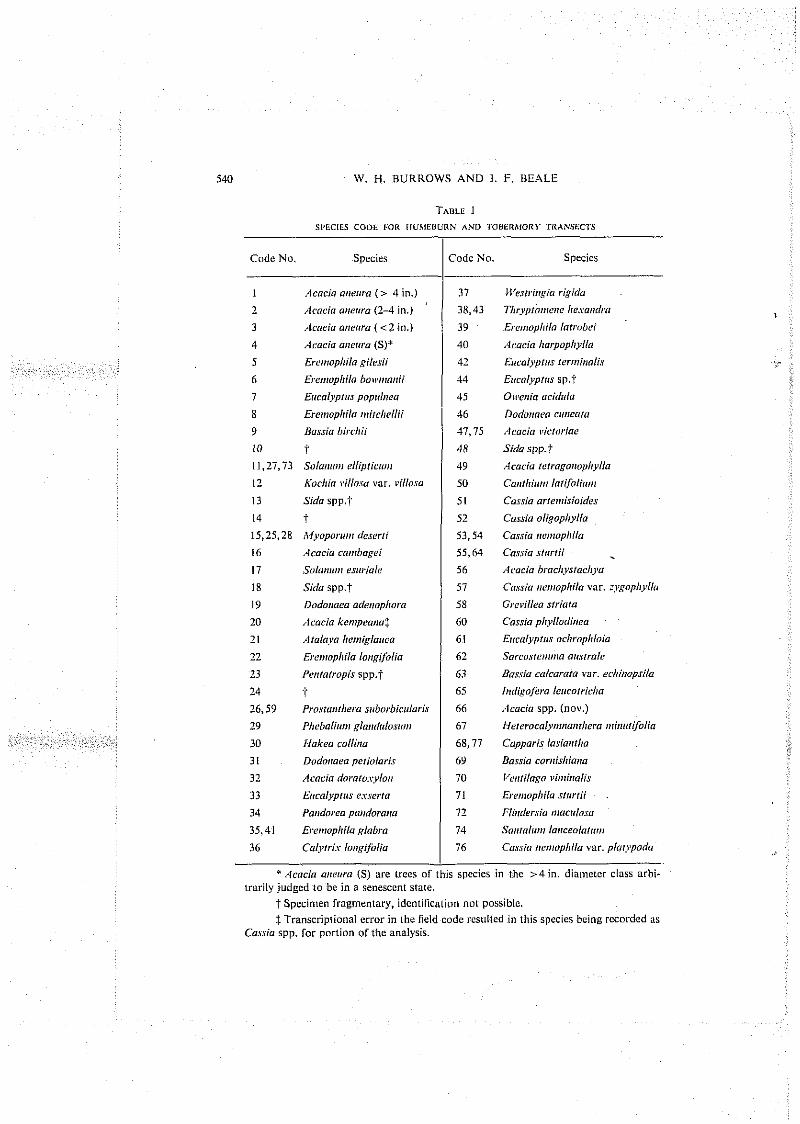
TABLE I SL'ECIES CODE E01< IlUhlEUURN A N 0 'I'OUERhiORY IRANSECTS
Code No. Spccies Code No. Species
I ilcocia a~learo ( > 4 in.) 7 - Acacia airel,ro (2-4 in.)
3 ~lcucia oncara (< 2 in.)
4 Acaeio arzeltro (S)'
5 Ere,,,oplrila g i l e~ i i
6 Ere,nophilo bow,rzor,ii
7 Ec,calyprris popal~reo
8 Ero?mphila ~r~ i rc l~e l l i i
9 Bossia birchii
10 t 11,27,73 Solortarrt elliplicrr,r,
12 Kochio i~illosa var. villoso
13 Sida spp.t
14 I 15,?5,28 1\lyopor.811,, de,scr.ri
l,Verrri,rpia rigid0
Ti~ryplor,renc he.ro,rlr,r
E~.o,,ophilo larrobei
Aeocia harpop/lj~lla
Ettcolyprr,.~ lcn~rinol i .~
Et~calypres sp.1
O~ve,~io ocidulo
Dodo?~,no'm~ clmeolu
Aeoeio ~,iclor.ioe
Sida spp.t
Acocio rclra~orropl~ylla
Co,,thitrm lori/olile,!
Cossio arrerr~isiaidus
Cassia oligoplzyllcr
Cas.ria ,tcr?zopl~ilo
I6 Acocio ca,rrbogei
17 Sulrtna,,, use~.iole
18 Sida spp.t
19 Dndo,,aea ade,ropl,oru
20 Acacia kernpeo,m$
21 Araloyo ho~~iplancu
22 Ero~!oplcilo longifolio
1 3 Pci!ralropis spp.t
24 i 26,59 Pro,stu,trkera srrborbicrrlrrris
29 Pl~cbnlitei~ glond1,1os11111
30 Hokeo colliifo
31 Dodorzaeo peliolaris
32 Aeoeia domlo.tylo,t
33 Er,calypras exverro
34 Pu~~doreo pa~~dorairu
35,41 Ere,,zophilo globro
36 Co1yrri.v lorr~~ifulio
55,64 Cacrio slurrii . 56 Acoeio bracl,ysloci,j,u
57 Cassiu ,re,,rophilo var. : ,vgopl~j~l l~~
58 Gi.ctdllro striala
60 Cossio p/~.vllodir~clco
6 1 Et~calyprrrs ocl~rophloio
62 Sorcoslon~~ro or,.vrrolc
63 Boarsin calcaralu var. ecl,i~~opsiln
65 11~~1igoJ'c~o I c ~ ~ c o r ~ i c l ~ a
66 .Icocio spp. (nov.)
67 Hercr.ocoly~rn~onfI~era nri~errifblin
68,77 Capparis losia~~thn
69 Bassio conrisltiona
70 Verrliloso ~'irrtir!olis
71 E~.e,rzophilo slarrii . 72 Hinrlersia sracalo~o
74 Sa~rralro~~ lor~ccolalsnz
76 Cassia iror~oplrilo var. plorypodo
* Acocia o~tuera (S) are trees of this spccies in the > 4 in. diameter class arbi- lrarily judged to be in a senescent state.
t Specimen fragmentary, identification no1 possible. $Transcriptional error in the field code resulted in this species being recorded as
Cossio spp. lor portion of the analysis.

STRUCTURE AND ASSOCIATION IN MULGA LANDS 541
11. DCSCICIPTION OF SITES
Wlerieb~~rtl is situated 100 miles south-west of Charleville on the Paroo River, lias an average rainfall (22 years) of 13.29 in. (range 3.07-23.79 in.), with a summer luean of 7.73 in. (range 1.83-12.55 in.) and a winter mean of 5.56in. (range 0.27-13.76 in.). The lowest elevation is c. 630 ft above mean sea level, and increases in height up to 50-100 ft occur along the transect. The topographical and soil features largely correspond to those mapped by lsbell rf 01. (1967) as gently to strongly undulating tablelands, tableland remnants, and plains -a t low elevation - broken by some steeper hilly areas; the chief soils are neutral red earths mantled by siliceous and/or ironstone gravels. Blake (1938) classifies the vegetation as acacia scrub formation-mulga scrub. The main vegelatioiial characteristics are an upper storey of Acocio orleura and E~rcol~yt~cu which may attain heights of 25-35 ft, and a prominent understorey of Eremoplrilo and Doclorlam 3-10 ft in height.
Tober11rur.v is situated 160 miles west-south-west of Charleville on the Grey Range. It has an average rainfall (38 years) of 9.88 in. (range 1 .00-28.68 in.), with a summer mean of 6.25 in. (range 0.80-23.33 in.) and a winter mean of 3.6in. (range 0.20-14.12 in.). The lowest elevation is c. 530 ft above mean sea level, and increases in lieight up Lo 150-200 ft occur along the transect. The soils are similar to those found at Humeburn, but there are significant areas of crusty loamy soils with an alkaline reaction trend throughoul the profile. The latter soils are associated with flat areas fringing drainage lines. Topographically the Tobermory site is more rugged than that at Hurneburn. lsbell ct a/. (1967) mapped corresponding areas as hills, ranges of hills, low hilly ridges, or dissected tableland remnants: the soils are chiefly shallow loams, ~~sual ly containing or covered by siliceous gravel, with many rock outcrops and boulders of siliceous or ferruginous material. Blake (1938) classifies the vegetation as acacia scrub formation-mulga scrub interspersed by a shrub steppe formation. Generally the vegetation is more sparse and stunted than at Hutneburn, and Acncia orreuro rarely exceeds 15-25 ft. Various species of Cassia are prominent in the shrub understorey.
111. METHODS
(a) Vegetatiorl Recorrls
A permanent record of the vegetation was obtained by means of a discontinuous belt transect based on the method of Parker and Savage (1944). Frequency, plant density, and plant position were recorded. Four paddocks were traversed on each of the properties, and their location and transect details are given in Appendix 1.
The total distance traversed was c. 20 miles on each property. The transect is 10 links wide and for purposes of analysis was broken into quadrats each 250 links long, so that each quadrat has an area of 2500 sq links (0.025 acre). There were 625 such quadrats for Humeburn and 640 for Tobermory.
The transects are permanently positioned by means of steel fence posts driven in every 5 chains along their entire length. The method of recording was to draw a 500 link surveyor's chain in a straight line between the posts and then record species present in a band 5 links wide on either side of the chain. Recordings were made of perennial woody species only, grasses and other herbaceous species being ignored.

542 W. H. BURROWS AND I. F. BEALE
Since interest centred around n~ulga (Acacia atiarro), this species was divided into classes of > 4 in., 2-4 in., and < 2 in. diameter, measured a foot above ground level. A further class was distinguished by recording those lnulga trees in the > 4 in. diameter class which werejudged to he in a senescent state. These divisions respectively approxiniate the four growth forms, "umbrella mulga", "whipstick mulga", "low mulga", and "tall mulga", previously recognized and described by Everist (1949). However, "tall mulga" trees which were not senescent were included in the > 4 i n . classification. Seedlings were placed in the < 2 in. class.
-
Fig. I.-Results of normal association analysis of Humeburn quadrats; 46 species in 625 quadrats, eachO.025 acre. The figurc abovc thc line is the code number oflhcspccics on which the division is made: lower figure is the number of quadrats contained in each ann of thc division. Figures in
lower circles are the index numbers of each sile group.
Black and white photographs were taken along the direction of the transect a t 5-chain intervals with the camera focused from the top of each steel post to the next. Colour photographs were taken a t 20 chain intervals by the same method.
The Humehurn records were made in July-August 1965, and the Tobermory records in September 1965.
(b) Ana/j~sis
Two methods of monothetic analysis were employed to examine the transect data so that site groups are defined by species frequency: (i) normal association analysis (Williams and Larnhert 1959), which divides a group of corn~llunities into subgroups; (ii) inverse association analysis (Williams and Lambert 1961), which uses the association matrix to divide the species into groups.
Each site was treated separately for analysis of species frequency and analysis O F species groups.
4 ' . - 8 : i l
[email protected] ..-----. @ ...- a ;.... 0- .----- @ ......--------------- @ -'"I-29 .,,# - r.: Crni,,, 4 ~. .
1,1 2 , -!-I9 8:: -
." ." ". .!" -29
-,, - 6
A 2 1 , 2, .x:, -~ 72, 2s
i,!
, .- i l 6 - .- . .I<, - 29 .. 6 Gra,i,'N

STRUCTURE AND ASSOCIATION IN MULGA LANDS 543
All the species recorded in the transects are listed and coded in Table 1.
Several species occur more than once in the code. This is due to one or Inore specimens being o f such a fragmentary nature a t the time of the survey that positive identification could not be made in the field. The code numbers allotted to each species (apart fro111 the first eight) are sequential as they first appeared along the transect. The first eight species were known to be sufficiently common t o be coded before readings commenced. Species 47-77 were exclusive to Tohermory; twenty-one species were coinman to both sites.
3 (in. 10 1 -" - 6 i l l @ 5 2 -
Fig. 2.-Results of nornml association analysis of Tobermory quadrats; 51 species in 640 quadrats, each 0.025 acre. Conventions as in Fig. I .
The Hu~neburn frequency data (Fig. I), as presented, is divided by normal association analysis into eight slte groups a t x'> 50. Below this level, the species cluster to a number of small divisions for which interpretat~on is not justified.
The characteristics of the Humeburn site groups are shown in the key on Figure 1. A positive sign (+) indicates the presence and a negative sign (-) the absence of a species; e.g. "site group I " could contain a number of species, but is characterized by the absence of Pl~ehal i~in~ gloriflc~losunr. Erenioj>hiln bolv~riorlii, Doflor~aen adetloplroro, Acncio conrbqei, and Arocio o1lelrr.a ( < 2 in.). Site group 2 is characterized by the presence of Acacia aneurn ( 1 2 in.) and the absence o r Pliebalirrn~ glandrilosrini, Ereniophila boll~ir~oilii, Dodonoen nderlophora, and Acario cari~bngei. While the characteristics of the site groups are thus strictly defined, the presence o r absence of other species in any particular quadrat is also implied.
W. H. BURROWS AND I. F. BEALE
TABLE 7 HUMEBURN SITE CIIOUI'S,
sprcicr.
18. S;do spp.
n. ~ ~ i ~ , ~ ~ ~ ~ , ~ , ' . .T~ ,~ ; , I I~
40. Arvrin iinrpupl!~iI<t
16. Avori,, cmnbo~ri
24. (Not idcntiRed)
14. (Not identified)
12. K"~l,i,2 ,,fIi".7,, WIT. t~I!i,?~<#
44. E,,r"l~~p,,s sp.
21. Arriie~is bc~8rislnian
13. Siilrr mp.
10. (Nor identified)
0. FJt,r.<;n birrlzii
15. A I ~ ~ ~ ~ ~ c I P z , ? ? ~ ,1'..5c,rti
2. Acnuin onc~zro (2-4in.l
45. Os.<,nin oci<lirln
42. Eunbptnr icm~inuli.?
6. E,cnl"pbiirr bo,l',,innii
26. Prorlnnllrcro i8,bori~im~iorir
4. Acoul<z on<~!,rn (S)
8. E r ~ ~ r ~ ~ ~ ~ l ~ l i # ~ ~ ~ i ~ c l r ~ I l i i
3. Auurin nncarn ( < t i n . )
7. Li,cnlypnn popal,icv8
5. Erc.,,~npb;ln gilerii
I I. S<~;O!>Z,!>? eIliprir!r~8!
20. Aroci" hkc,,,rnm,in
I. Am<.;" a,in,rir ( > 4 in.)
18, Tlrr.~plamc~~rr~ lic?nncirn
33, E r ~ r ~ z o ~ ~ l ~ i i ~ ~ ~lr,f>r!8
22. Ercn?opBil~ l ~ ~ n 8 i f i l i ~ ,
31. Do,lolo,iuc.o prriobrii
32. Acnrio ,;olnm(o.v~~lo,~
33. Er,cr,l~,pnrr crrcrrv
37. I l r e s ~ r i n g l ~ ~ rig;</#>
21. Pen,nrr,2pi.r rpp.
19. Dorlo,mro a~lmophonr
46. Dur;c,narr r,,nruru
39. Er~~,,rophill lnlr<,bri
36. Cn1yrrl.v lorr8ifol;u
34. P,,,,<~O~C" p,rnrl"rr,no
30. Hnkro cullbin
29. PI~~ l~n lBmz rln,!~A~loriral
* Species with more t h a n
code n u m b e r used.
SiiOWING TOTAL NUMBER OP SPECIES IN THE COMBINED QUADRATS
Sit= Croupst -
3 - I 5 6 7 4 R
(10) (158) (125) (1821 (42) (28) (60) (20)
2 - - - - - .- - I - - - - - - - 2 - - - - - I -
24 - - - - - 3 - - I - - - - - - - I - - - - - - - I - - - - - - - - I - - - - - - I I - - - - - - I I - - - - - - 5 - I - - - - 19 4 2 - - - - 19 I1 21 2 - - - - - 48 111 19 IS - - - - - - - - - - I
- - - 3 I - - - - - - 4113 1001 456 - - - 2 - 50 10 9 10 - - 32 311 29 7 8 - 24 -
5 13 3 2 1 ~ i n 7 3 I 89 - 8 732 - I048 283 IS5 I00 5
I I 21 I6 34 I 8 IS 3
- 417ik9n 488-i-l0a 347-i8a 1021+7,! 29- in Ic13+4n I
- 42 21 23 4 9 28 2
- 2 I4 54 5 I9 50 - - 28 48 - 77 I3 24 I2
- 5s - 6 6 2 - 2
- - 1 20 4 I8 I 21
- - I I3 - 7 10 - - - I 2 13 4 3 3 - - I - - - I 5 - - - I - - - I 9
- - 14 - - - - 1 8
- - - - I - - - - - - - - 6 3 6 684-i-31, 78-+-la
- - - - - - 21 - - - - - - - - i
- - - - - - - 6
- - - - - - - I
- - - - - - - 9
- - - - - - - I26
one code n u m b e r h a v e been c o m b i n e d and the numerically lowcsl
t Figures in parenthesis arc t h e nuti~bcr ol quadrats in which the site group occurs. t ! I , Band of seedlings (> 100) which were not counted.
STRUCTURE AND ASSOCIATION IN MULGA LANDS 545
TADLL 3 TOBERMORY SlTL GROUPS SHOWING TOTAL NUMBER Or SPCCICS IN THE COhlElNED QUADRATS
8. E,e",",,lt~l,, , , ,~ ,~ l ,~ l / i i
74. S"n,"l,m, lo,ee"l",l,n,
75. A<"CO l~ielori,,c
70. ~~vnr i loxo rintir~nlis
76. Cusrir, n~n~opbil,, v~r . plrrzypoilr~
72, r i i n d ~ ~ r r i a rnon,lorn
73. Sulvnirm ~ l l i p l i c ~ ~ ? ~
I I. Sulo,~!mr rllipricz,e#
28. ~ l ~ ~ ~ ~ ~ ~ ~ ~ , ~ ~ rlcrcrri
71. E n c n ~ n ~ i ~ i l n rrurti i
69. Otmrio ronlirhionn
G I . E t ~ c a l ~ i ~ ~ , i s o c i ~ r ~ ~ ~ l ~ l ~ i c ~
58. Crci~ilica slrivro
68. Coppvrir insinnrlia
49. Aruci,, ,r,,oK",a,iriryNn
I . Alur in vrlrl,rv 1,4 in.] 21. Atnlo).o henriglnncn
6. Ercn~onhiln hoa'rnnnii
63. Doriio r'8lmrnm v i l i arliinoprilri
16. Amciu rvtnbapci
48. Sida spp.
54. Cussi<r ncr,loplriln
53. Cnrrir, nanlupliilri
56. Arocio bmc l , j~nr~r i~ j~n
51. ~01.rio vrremisi<>irl<s
55. Cvsriv rnrni i
57. Cnrrin nc~tt,,ic~pirii<t vunr. :~~*.n~,llyNn
2. Arocirr onnlm (2-4 in.) 3. Ac,,ci" NIlrlrra ( < 2 in.1
31. Darimrrmrn pcriulorir
52. Cu.r.~iri olignpl?jdlrr
64. Ca.r.~i,r srurri
20. Ac.licia kcarpc~ao
50. Clmlhiu!,8 ia(ifblim?t
62. San.arrrm,?io ocrrrrnlr
5. Ernnolrbih gilc~rli
42. Ezruaiypou rrrrrzi#~nlir
GO. C<8.!.7irz p l ~ ~ N n r l i , ~ ~ ~
Z2. Erc!r~oplriio Io r !g i f i~ / i~~
4, ,l<ocio unrirrn (Sl 7. Ez,<"lyp,,o pop,,lnr.
47. ~ r n r i o rirmri,rr
19. D"il0""~" o,l<~?<n~li"r"
65. h~ilisnjc,m 1rrrrurrir.bn
29. Plilebniirrrn b.lonrl8rluri8nl
67. H ~ ~ l r n r n l ~ ~ ~ ~ n ~ r ~ ~ I ~ c ~ o ??~i!z!rtifoli~l
32. .4rorio durulovybr~
23. Pcnmfro~ir spp.
59. Prarlnnlbrrn s~iborl,iri8brii
26. Prurrrr,rlliero rubarhii.iri,,rir
66. Arari,, snp. 1nov.l
* Figures in p a r e n t h e s i s are
155) (2171 1231 16) 1411 (70) (1261 161) (3) (381
I I - - I _ - - - - - I - - - - 2 - - - - - 2 - - - - I - - _ - 3 - - - - - - - - - - 2 - - - - - - - - - z - - - - -
2 - - - - - I - - _
- 1 1 - 7 1 - 7 - - 12 I I - I - - - - - - I3 I05 - - 1 9 - 1 1 3 - -
1 3 5 - - 2 - 49 4 - - 1 3 6 - 2 2 - - - - I - 6 - 7 3 - - - - 1
I I _ - 3 4 - 2 1 - 4 7 - 2 - I
- Crl I - 2 15 - 91 - 2 I 1 3 - 14 1 4 - - -
- - - 17 - 415 277 110 - 88 34 7 - 3 - - 5 I - -
I90 - 1 - 23 26 - I - t 3 6 - - I 1 6 1 - 1 1 3
I 5 4 - - 3 4 2 1 3 4 . - 1 4 - 2 8 1 8 2 - - - - 25 24 2 8 84 23 3 10 95
- - 63 6 25 31 43 8 7 55 - 1 9 - 1 7 1 1 2 - 3 - 6 2 - 8 - 4 - 3 7 - I S - - 1 2 1 9 3 2 - I - - - 10 - - 335 158 - 14 - - - - - - - - - 262
- - - 4 91 I7 30 7 - 2 - 3 I - - - 12 3 - - - z - - - 6 7 I - 3 - 1 - 1 - I - 3 - I - I I - - - - I 1 I - I - - - 3 294 97 - - - 6 3 1 I - - & - - I2 - - - I - 3 - - 4 - I I - - - - - - - - 1 2 - - - I - - - 1 2 - - -
- - - - - - 4 2 - - - - - - 1 3 2 - - 1 - - - - - 3 - - - 21 - - - - - 5 - - I 21 - - - - - 2 - - - - - - - - - 5 - - 4 9 - - - - - - I - - -
- - - I - - - _ - _ - - - - - - - - - 2
- - - - - - - - - 6
the n u m b e r ol quadrats i n w h i c h Ihc site g o u p occurs.
546 W. H. BURROWS AND I. F. BEALE
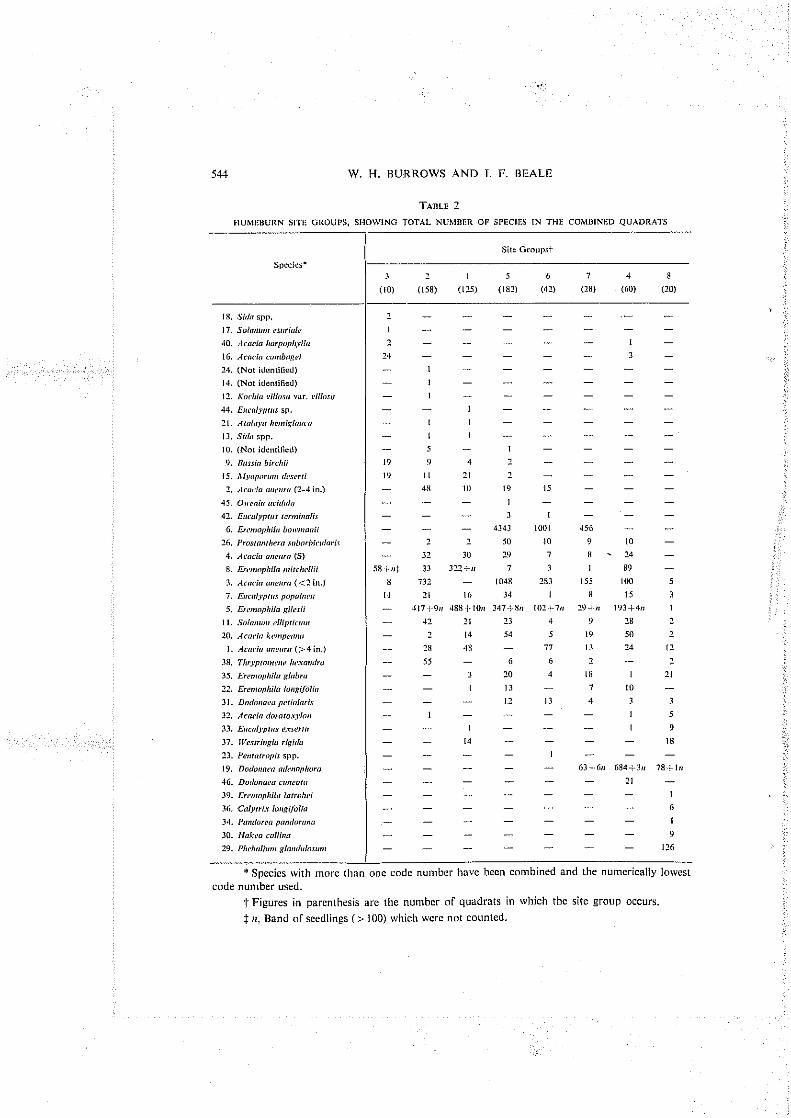
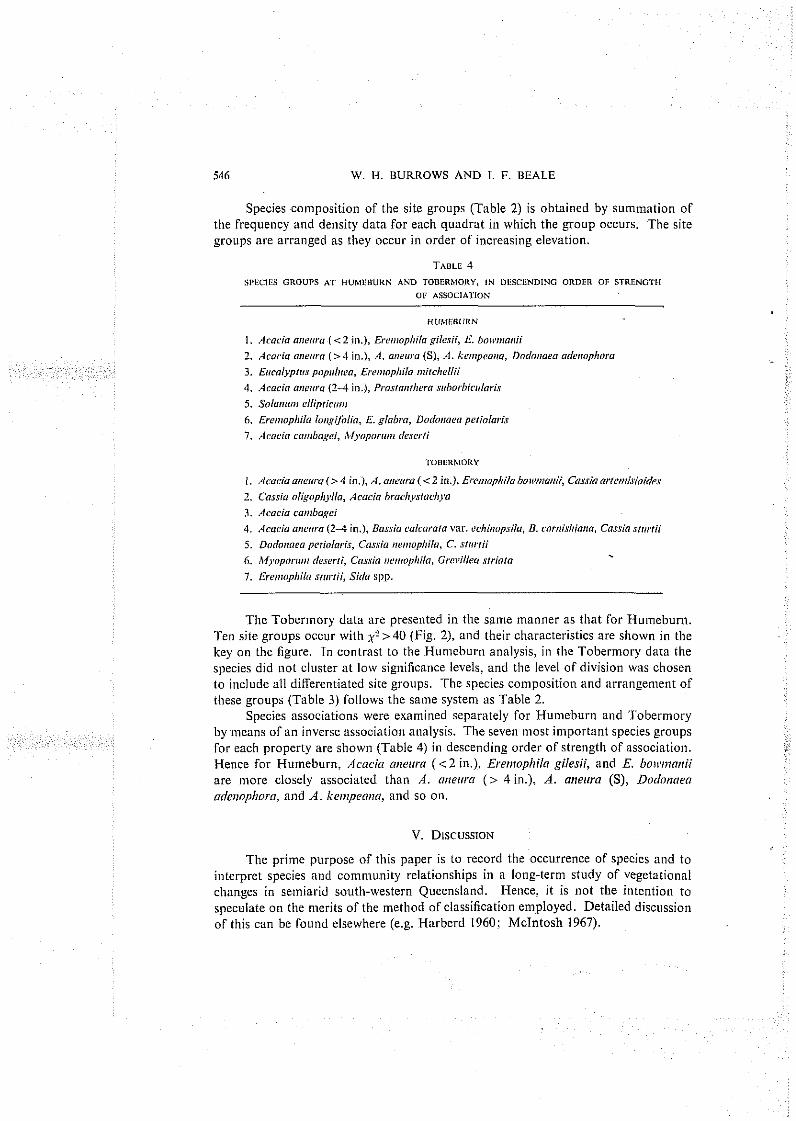
Species composition of the site groups (Table 2) is obtained by summation O F the frequency and density data for each quadrat in which the group occurs. The site groups are arranged as they occur in order of increasing elevation.
TABLE 4 SPECIES GROUPS A T HUMERURN A N D TOHERMORY, I N DESCENDING ORDER OF STRENOT11
OF ASSOCIATION
HUMERURN
1 . Arocin n,,e,rru ( < 2 in.), Eru,nophila gileiii, E . hotc,,,,a,,ii
2. Acacia o,?e,,ro (>4 in.), A. orreern (S), A. korgpeorro, Dorlo,rocn nrle,lopi,oro
3 . Efrralsplrrs popr!lrzeo, Ere,rzophila ~airchellii
4. Acnein a,tcsr'a (2-4 in.), Prosm,,rheru .sehorbic~rlnr.ir
5. SoIa,rron ciliplioer,
6. E~.e,,,ophiia Irr,~gij~lin, E. gliloI,'.a, Dorl~~noeo petiolar'is
7. ,Icocio cnrnbogci, ~\lyopors,rt deser'li
I . Acociaar,mra (> 4 in.) , 11. atrertra (< 2 in.), Era~,ophila bo~~rn~onii, C~~.v.ri~~ar/r,,ti.~ioicIe,r 2. Cnrsia oligop/l~.lln, Acacia hrflcl~sslacl~so
3. Aeocia ra~t~bqpei
4. Acacio n,,e,,ra (2-4 in.), Bnssio culcar'olo var. echi,mpsilu, B. corni.sl~ia,~a. Cassia srnr'fii
5 . Dorlo,toco p~tiolnri.~, Cnrsia rrer,zophila, C. rrertii
6. ilfyoporre~~ rlesurli, Cn.v.rio ,!u,,~npbiln, G~.e,aiNea srriorn .
7. Ere~rzopi,ilrr nar'rii, Sida spp.
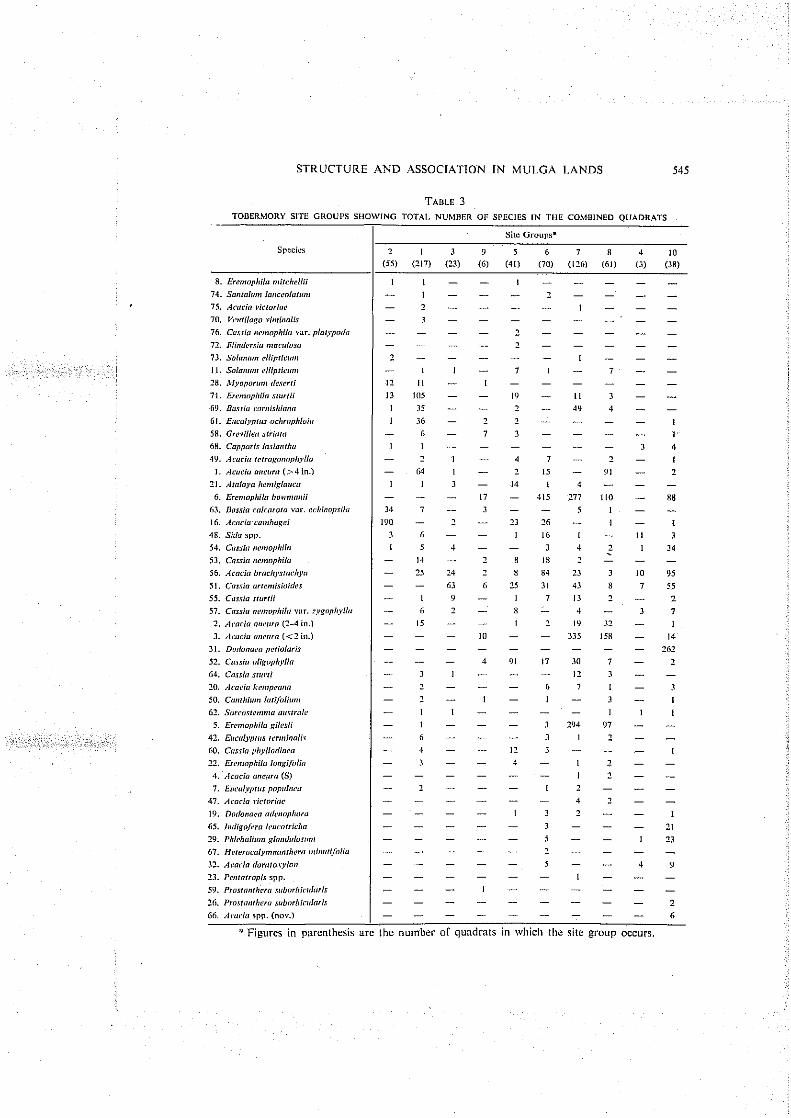
The Tobermory data are presented in the same manner as that for Humeburn. Ten site groups occur with X'>40 (Fig. 2), and their characteristics are shown in the key on the figure. In contrast to the Humeburn analysis, in the Tobermory data the species did not cluster a t low significance levels, and the level of division was chosen to include all differentiated site groups. The species composition and arrangement of these groups (Table 3) follows the same system as Table 2.
Species associations were examined separately for Humeburn and Tobermory by means of an inverse association analysis. The seven most important species groups for each property are shown (Table 4) in descending order of strength of association. Hence for Humeburn, Acacia mlelwa ( 1 2 in.), E ~ e n ~ o p l ~ i l n gilesii, and E, bo1tv17airii
are more closely associated than A . rrrlellra ( > 4in.). A. a n e ~ i r n (S), Dodonaen
a d e ~ ~ o p l ~ o r a , and A. l i e ~ i ~ p e o n a , and so on.
The prime purpose of this paper is to record the occurrence of species and to interpret species and community relationships in a long-term study of vegetational changes in semiarid south-western Queensland. Hence, it is not the intention to speculate on the merits of the method of classification employed. Detailed discussion of this can be found elsewhere (e.g. Harberd 1960; McIntosh 1967).

STRUCTURE AND ASSOCIATlON IN MULCA LANDS 547
fig. 3.-Dcnse thicket of Dorln!roen oderenophoro (6-8 fl high) beneath a canopy or Aerrcin o,resrn a1 Humeburn.
Fig. 4.-Understorey of E?or,,,pi,ilrr bos~rr~u~rii (2-3 f t high) in sparse rnulga at Humeburn. Broad-leafed trcc in lclt background is E,rcn/yprrts pr,psbren.

W. H. BURROWS AND I . F. BEALE
Fig. 5.-View from ihe top of a scarp at Tobcrmory. ..lcaeio a,ler!ra trees on the Hat arc 10-25 fi high.
Flg. 6.-Opcn nature of thc vcgciallon at Tobcrmory, showing the pauclty of ground flora. ilcocta o,rerrra trees in the background are 10-15 ft h~gh.

STRUCTURE AND ASSOCIATION IN MULCA LANDS 549
Consideration of the frequency data for Humeburn reveals an interesting pattern. A suggested _eradation for the various site groups is as follows:
(3) +-(I) -P (2) -:- (5), (6) *- (7) -:- (4) -;* (8).
Site group 3 occurs in depressions and along drainage lines while group 8 is found on the top of scarps practically devoid of surface soils, and with the parent rock often exposed. The remaining groups are representalive of a rising elevation between these two extremes. This rise in elevation is associated with a change in species composition (Table 2). Earlier, Holland and Moore (1962) observed (bat topography and soil texture have a marked limiting elTect on certain of the dominants within relatively small areas. In their study, Acrrcifi milrhngei was found ~nainly on red-brown earths and desert loarns, where the moisture status is more favourable than on the heavy-textured soils of the plains, especially in the upper 2 rt or the profile.
Site groups 5 and 6 are very similar in species composition, the prime difference being the absence of Acocirr mreurn ( > 4 in.) from the former group. As mulga is often felled to feed starving sl~eep during droughts, selectivc thi~ining in the past may accounl for this absence of the larger trees in group 5. The presence of old cut stumps in the latter group supports this reasoning. The habitats occupied by groups 4 and 7 are also much alike. It is found that group 4 is partly characterized by a dense thicket of Dorlorzoefr oclenop/rorrr, wllich possibly excluded Ereirropliiln bol~?tlmlii (Fig. 3).
It will be seen that E~icalj,pt~o l~o/r~ilr~eo is the most widely distributed species and occurred in all site groups. Its regular occurrence in mulga com~llunities elsewhere no doubt influenced Beadle (1948) and Holland and Moore (1962) i n their cljssificatio~l or the conlrnunities they describe as E~rcaljy~t~is l~ull~rltzen/Acncin nnelircr associations. Despite its ubiquitous nature, however, the number of E. j~op~ibren pIa111s at Hunleburn is quile low in relation to thal of several other species, e.g. Ereirlo~~/li/o gilesii and E. bo~l~rnairii. Hence a consideration of density data as well as frequency is necessary in classifyillg communities in this area.
Thespeciescomposilionasshow~~ for each com~~iunity typeis, with fewexceptions, what would be expected fro111 field observations. Thus Brrssirr hirchii occurred mainly in site group 3. Alj~r~por~rrii ileserti is found in groups 1, 2. 3, and 5 where additional water accuniulates, while Ducl(1nnea r~~ler~ol~horn is restricted to groups 7, 4, and 8, From which water rapidly runs oRafter rain. This situation could change with greater sampling inte~~sity but the possibility seems remote. It is clear lhat in tllis case the analysis has revealed groups which n~erge into one another in a continuous pattern. In semiarid Queensland, where moisture is the major limiting factor for plant growtli, this familiar pattern could be a general rule of species distribution.
A noteworlhy inconsistency is evident in the species composition table. This is the presence of Acncin lmr~~~l~lryl ln and A. ccririhngei in site group 4. A check along the transect has revealed that these species have not unaccountably grown on the ridges, but rather that seed of Dorlorraen nderiuphorn has been washed down and gerl~~inated on the banks of a watercourse where Acocin har~lr~~l/lj~//n and A. corrlhngei occur. As the presence of D. nrlerioplrorn is one of the characteristics of site group 4, illis explains the apparent juxtaposition of Acacia harpophglln and A . rori~hngci.
While the site group structure at Hunieburn is a relatively simple I~ierarchy, that at Tobermory is more complex. The latter transect is situated on the Grey Range, which has a landscape more dissected by ravines and drainage lines than that a t

550 W. H. BURROWS AND I . F. l3EALE
Humeburn (Fig. 5). As these dissections could occur at variable elevations, species which are found at lower levels are in some quadrats associated wit11 those of the ridges.
A suggested arrangement of the groups based 011 relief is given below:
(2) +(I ) -+ (3) +(9) + (51, (61, (71, (8) +(4) -+-(lo).
Species compositio~i (Fable 3) shows the heterogeneity of the various groups. I t is apparent that the trend towards species continuity evident for Humeburn is less well defined here, although a general rise in elevation is reflected to a certain extent in species composition from group 2 to group 10.
The broad distribution of many of the Tobermory species amongst several site groups is attributable to two factors:
(a) The dissected nature of the landscape which, coupled with quadrat lengtli (250 links), allows species occurring on the plains to be found in the same quadrat as those of the slopes.
(h ) If periods of prolonged moisture stress have influenced the selection of woody perennial plants found in this 10-inch rainfall area, tlien the ability to survive high moisture stress may not be unique to the plants of any particular habitat. Stated otherwise, plant distribution appears to be influenced by competitive ability in above-rainfall years and not ability to survive droughts, provided no other factors such as soil fertility, animals, fire, etc. are operative.
Examination of the individual data for Humeburn and Tobermory showed tliat Acacia a~rezu'a ( < 2 in.) is present in 595 quadrats or 47% of the 1265 sampled. An appreciable portion of the traverse covered neutral to slightly alkaline soils, whereas A. arletrra occurs as a dominant only on acid soils (Holland and Moore 1962). At first glance, it would therefore appear that regeneration of mulga is satisfactory in areas where it is expected to occur. However, inspection of the species composition (Tables 2, 3) and quadrat density figures (not shown) reveals a different picturc.
At Humeburn it was found that 2331 Acacia a~tero.a ( < 2 in.) were present in 397 quadrats. This represents an averagz density of 235*12 per acre in the quadrats in which it occurs. For Tober~nory the density is 104h8 per acre. In another study (Burrows and Beale, in press) on diameter and production relations in mulga further north and east from Tobermory, it was found tliat there were 360 per acre of this diameter class at one site and 1450 per acre a t another site.
A hundred seedling trees per acre is considered marginal for sare regeneratioo. Losses from deal11 and grazing at Tober~nory can be expected to further reduce the stand to less than the 70 mature trees per acre indicated by Everist (1949) for another area as the optimum density for adequate drought reserve. The more open nature of the vegetation at Tobermory is illustrated in Figure 6.
The one readily discernible feature in each of the community a~ialyses is a gradation of the comniunities in terms of rising elevation and perhaps decreasing soil depth. This in turn may indicate a separate grouping of the more xeropllytic plants on the ridges, as against relatively mesophytic plants along the depressions. As earlier explained, however, inconsistencies may occur, especially at Tobermory. Edaphic or management factors cannot, on the basis of this survey, be directly related to

STRUCTURE AND ASSOClATlON IN MULGA LANDS 551
community differences. Such i~lfluences as have already been mentioned may have been ]nore apparent if annual and gra~nineous species had also been recorded."
These comments are supported by examination of the seven most important species groups (Tahle 4) which occurred at Humeburn and Tobermory respectively. Goodall (1965) found that the association between Acncin species on the one hand and shrubs on the other is very highly significant, but is not shared by all shrub species equally. I t will be noted that the species groups are not large. Usually this is indicative of a highly disturbed situation, with the disturbing factor in this case considered to he variable moisture availability. "Single species" groups appear at both Hunieburn and Tobermory. These species are nol positively associated with any other species. Blake (1938) has stated tliat of all the trees and shrubs in western Queensland: Acacia cnr7rbn~ei enjoys the widest range of habitats. The occurrence of this species as a single species group at Tobermory adds credence io this statement.
The only group cotnmon to both areas is Acncin nneura (< 2 in.) with Ereittophilo bo~i~rtinriii. Species of Ereriroplriln occur frequently over large areas in western Queensland, both in the open and also as an understorey i n sparse niulga (Fig. 4). Their close association in this survey with Acacia ortelira ( < 2 in.) indicates that these shrubs are capable of increasing in density in areas cleared of niulga trees. It seems reasonable to assume that mulga is not acting as an aggressor species, and that the inulga seedlings are residual germinations of a former dominant overstorey. From these observations, aloilg with examination of the species coinposition for both sites (Tables 2, 3), the long-term variatioli in range condition at Humebur~i andTobermory may well be reflected in changes in the density of E. gilesiiand E. bo~vrtinnii. Short-term variations could be best observed by examination of annual and gramineous species.
The analyses of the iransects on both areas indicate that site heterogeneity is the overriding factor corntiion to Hunlehurn and Tobermory. The vegetation of both sites is indicative of a mosaic. I t is not expected that future short-term recordings of the transecl will reflect marked changes in perennial species composition. However, the densities oT the more palatable species could fluctuate markedly and would depend on climzitic conditions and grazing pressure and management.
Results oT the survey have revealed that very large-scale vegetatiotr groups in this semiarid environment have a very small-scale structure which is based on microtopography. A similar explanation was given by Slatyer (1961) for the grove-intergrove distribution or vegetation in central Australia. It is suggested that lnicrolopograplly is a tilajor influeilce determining species distributio~i within the sites studied. Nevertheless, the effect soil pH and other edaphic factors exert on distribution patterns within the area deserves further attention.
VI. ACI(NOM'LEUG~IENTS The authors wish to express their gratitude to Dr. J. P. Ehersohn of the
Department of Primary lndustries Tor his helpfill suggestions: to Dr. W. T. Willinms of the Division of Computing Research. CSlRO for advice and the statistical analyses: and to Mr. L. Pedley of the Queensland Herbarium for niany plant identifications. Financial assistance for this study was provided by the Wool Research Trust Fund.
* Because mulga is non-randomly dislributcd, large lransccts were requircd for adequate sampling. Inclusion of shorter-lived species \vould have been excessively time-co large ttansects.
.-Dimension and production relations of ~nulsa (Acacia roc. 11th int. Grassld'Congr., Surfers'