structure and characterisation of hydroxyethylcellulose
TRANSCRIPT

RSC Advances
PAPER
Ope
n A
cces
s A
rtic
le. P
ublis
hed
on 0
8 Fe
brua
ry 2
018.
Dow
nloa
ded
on 3
/16/
2022
10:
39:3
4 A
M.
Thi
s ar
ticle
is li
cens
ed u
nder
a C
reat
ive
Com
mon
s A
ttrib
utio
n 3.
0 U
npor
ted
Lic
ence
.
View Article OnlineView Journal | View Issue
Structure and ch
aSchool of Pharmacy, University of Reading
6AD, UK. E-mail: [email protected] Spallation Neutron Source, Science and
Appleton Laboratory, Harwell Science and IncTechnion – Israel Institute of Technolog
Engineering, Israel
† Electronic supplementary informa10.1039/c7ra08716k
Cite this: RSC Adv., 2018, 8, 6471
Received 7th August 2017Accepted 29th January 2018
DOI: 10.1039/c7ra08716k
rsc.li/rsc-advances
This journal is © The Royal Society of C
aracterisation ofhydroxyethylcellulose–silica nanoparticles†
Edward D. H. Mansfield, a Yash Pandya, a Ellina A. Mun,a Sarah E. Rogers, b
Inbal Abutbul-Ionita,c Dganit Danino,c Adrian C. Williams a
and Vitaliy V. Khutoryanskiy *a
Functionalising nanoparticles with polymers has gained much interest in recent years, as it aids colloidal
stability and manipulation of surface properties. Here, polymer-coated thiolated silica nanoparticles were
synthesised by self-condensation of 3-mercaptopropyltrimethoxysilane in the presence of
hydroxyethylcellulose. These nanoparticles were characterised by dynamic light scattering, small angle
neutron scattering, Nanoparticle Tracking Analysis, Raman spectroscopy, FT-IR spectroscopy,
thermogravimetric analysis, Ellman's assay, transmission electron microscopy and cryo-transmission
electron microscopy. It was found that increasing the amount of hydroxyethylcellulose in the reaction
mixture increased the nanoparticle size and reduced the number of thiol groups on their surface.
Additionally, by utilising small angle neutron scattering and dynamic light scattering, it was demonstrated
that higher concentrations of polymer in the reaction mixture (0.5–2% w/v) resulted in the formation of
aggregates, whereby several silica nanoparticles are bridged together with macromolecules of
hydroxyethylcellulose. A correlation was identified between the aggregate size and number of particles
per aggregate based on size discrepancies observed between DLS and SANS measurements. This
information makes it possible to control the size of aggregates during a simple one-pot synthesis;
a prospect highly desirable in the design of potential drug delivery systems.
1 Introduction
Silica nanoparticles, ranging from 1 to 100 nm, have foundnumerous applications in various technical areas includingdrug delivery, engineering, and cosmetics.1,2 They can be usedin adhesive formulations to enhance the thermal stability andmechanical strength of joints, or in beverage and water treat-ment technologies where they are employed as occulants.Silica particles also improve the cleaning effect of some deter-gent formulations. Other technical applications include catal-ysis, coatings and polishing materials. More recently, thesematerials have been used in biomedical areas such as diag-nostics and drug delivery.3,4
Thiol-functionalised silica nanoparticles have attractedparticular attention due to the opportunities afforded by theSH-functional groups present on their surface. Thiolated silicais highly effective in removing mercury from aqueous
, Whiteknights, Reading, Berkshire, RG6
ac.uk
Technology Facilities Council, Rutherford
novation Campus, Didcot, OX11 0QX, UK
y, Faculty of Biotechnology and Food
tion (ESI) available. See DOI:
hemistry 2018
solutions,5,6 used as a support to prepare palladium-containingcatalysts,7 and as intermediate materials to prepare modiedstationary phases for chromatography.8 The ease of function-alisation of these particles, for example uorescent labelling,also provides opportunities for in vivo imaging and cell cultureexperiments.9
Thiolated silica nanoparticles can be easily synthesised byusing 3-mercaptopropyltrimethoxysilane (MPTS) as a precursor,which undergoes either self-condensation or co-condensationwith tetraethyl orthosilicate in water–ethanol mixtures, cata-lysed by the addition of a base.10,11 Recently we reporteda modied synthetic approach,12,13 using self-condensation ofMPTS in dimethyl sulphoxide which resulted in highly stable,monodisperse, sub-100 nm nanoparticles that adhered toocular tissues through disulphide bridge formation withcysteine residues present on the mucosal surface. The presenceof thiol groups on the surface of these nanoparticles also allowsfacile functionalisation via reactions with maleimide, iodoace-tamide, and alkyne derivatives. Successful functionalisation ofMPTS nanoparticles has been demonstrated through theiruorescent labelling, PEGylation,14 and POZylation.15
The synthesis of silica nanoparticles with prolonged stabilityagainst aggregation in aqueous media is important for theirapplications in a number of areas. To this end, one approach isto functionalise the surface of the particle with polymers, such
RSC Adv., 2018, 8, 6471–6478 | 6471

RSC Advances Paper
Ope
n A
cces
s A
rtic
le. P
ublis
hed
on 0
8 Fe
brua
ry 2
018.
Dow
nloa
ded
on 3
/16/
2022
10:
39:3
4 A
M.
Thi
s ar
ticle
is li
cens
ed u
nder
a C
reat
ive
Com
mon
s A
ttrib
utio
n 3.
0 U
npor
ted
Lic
ence
.View Article Online
as with PEG.16–18 However, PEG precursors used for covalentattachment to silica surfaces are oen relatively expensive.
In the present study, we have successfully synthesised thio-lated silica nanoparticles with a protective layer of hydrox-yethylcellulose in a one-pot reaction whilst maintaining a highnumber of free thiol groups for further functionalisation. Theseparticles have been fully characterised using various analyticaltechniques. Depending on the concentration of hydrox-yethylcellulose in the reaction mixture, it was possible toprepare either individual silica nanoparticles coated with poly-mer chains or aggregates of nanoparticles, bridged togetherwith polymer chains.
2 Experimental methods2.1 Materials
3-Mercaptopropyltrimethoxysilane (MPTS), hydroxyethyl-cellulose (HEC, 90 kDa), L-cysteine hydrochloride, monop-otassium phosphate (KH2PO4), sodium phosphate dibasic(Na2HPO4), deuterium oxide (D2O) and 5,50-dithiobis(2-nitrobenzoic acid) (DTNB/Ellman's reagent) were obtainedfrom Sigma-Aldrich (UK). Dimethyl sulphoxide (DMSO), andsodium hydroxide (NaOH) were from Fisher Scientic Ltd. Allother reagents used were of analytical grade and purchasedfrom Sigma-Aldrich (UK) unless otherwise stated.
2.2 Nanoparticle synthesis
Nanoparticles were synthesised according to the protocol ofIrmukhametova et al.withminormodications.12,13 Solutions of0.1%, 0.5%, 1% and 2%w/v HEC were prepared in 20 mL DMSOin glass vials, and le to stir overnight at room temperature.Then, 0.75 mL of MPTS and 0.5 mL NaOH (0.5 M) were added toeach HEC solution and le to stir for a further 24 hours at roomtemperature. The mixtures were bubbled through with air forthe entire duration of the reaction to facilitate the formation ofdisulphide bridges.12,13 Samples were then puried by dialysis,using cellulose membranes with a molecular weight cut-off of12–14 kDa (Medicell Int. Ltd., UK). Samples were dialysedagainst 5 L deionised water (changed every 2 hours) for 48hours. Following synthesis, 1 mL of each nanoparticle suspen-sion was frozen, and placed in a Heto PowerDry LL3000 freeze-dryer to obtain a solid sample used for further analyses. Theyields of nanoparticles were determined gravimetrically aerparticles purication using dialysis and subsequentlyophilisation.
2.3 Ellman's assay
Ellman's assay was used to determine the concentration of thiolgroups on the surface of nanoparticles.12,13,19 Freeze-driednanoparticles were rehydrated in a solution of phosphatebuffer (pH 8, 0.5 M) at 0.3 mg mL�1. The particles were le toincubate for 1 hour prior to the assay. Following this, 500 mLaliquots of particle dispersions were placed in Eppendorf tubes(5 for each concentration of HEC), to which 500 mL of DTNBsolution (0.3 mg mL�1) was added. Samples were le to incu-bate for 2 hours. Alongside this, standards of cysteine–HCl were
6472 | RSC Adv., 2018, 8, 6471–6478
used in the concentration range 25 to 225 mmol L�1. Again,samples were prepared in phosphate buffer, and treated exactlythe same as the test samples. Following the incubation, 200 mLfrom each Eppendorf tube was placed into a single well of a 96well-plate. 3 samples were taken from each Eppendorf. Absor-bance at 420 nm was then measured using a BioTek Epoch platereader, and the concentration of free thiol calculated based onthe absorbance generated from the standards. Data are pre-sented as mean � standard deviation of the 5 aliquots taken foreach HEC concentration.
2.4 Dynamic light scattering
Dynamic light scattering (DLS) was used to measure thehydrodynamic diameter and polydispersity of the synthesizednanoparticles. Samples were diluted by a factor of 1 : 10 intodeionised water, to form a clear suspension, placed into low-volume cuvettes (Fisher Scientic), and measured using a Zeta-sizer nano-ZS instrument at 25 �C, with a refractive index of1.471. Individual recordings were measured three times, forthree repeat readings. Data are presented as mean � standarddeviation for the three repeats.
2.5 Nanoparticle tracking analysis
Nanoparticle tracking analysis (NTA) employed a NanoSightLM10, with a LM14 top-plate attached, syringe pump, anda 533 nm laser (Malvern Instruments, UK). Prior to the experi-ments, 10 000 fold dilutions were made for each nanoparticlesuspension into ultrapure water (18 MU cm�1). Samples werethen injected into the top-plate using a NTA syringe pump, andkept at a constant ow of 20 AU for all recordings. 3� 60 secondvideos were recorded for each sample and repeated 3 times foreach sample. All recordings were made at 25 �C, and theviscosity was that of water (0.89 cP). The mean and standarddeviation were then calculated from the triplicates.
2.6 Raman spectroscopy
Freeze dried nanoparticles were placed in glass vials and FT-Raman spectra were recorded for each sample using a FT-Raman NXR 9600 Raman spectrophotometer (Thermo Scien-tic). 2000 scans were recorded and averaged for each sample ata resolution of 4 cm�1.
2.7 Thermogravimetric analysis
Thermogravimetric analysis (TGA) was performed with a TGAQ50 (TA instruments, UK). Dry samples were placed into cleanceramic pans, and thermal decay measured from roomtemperature (25 �C to 1000 �C), at a temperature ramp of 10 �Cper minute in a dynamic nitrogen environment (20 mL min�1
ow). Data was analysed using TA universal analysis soware,and presented at% weight change as a function of temperature.
2.8 FT-IR spectroscopy
Fourier transformed infra-red (FR-IR) transmittance spectrawere recorded for freeze dried samples of nanoparticles usinga FT-IR Spectrum 100 (Perkin Elmer) spectrophotometer.
This journal is © The Royal Society of Chemistry 2018

Paper RSC Advances
Ope
n A
cces
s A
rtic
le. P
ublis
hed
on 0
8 Fe
brua
ry 2
018.
Dow
nloa
ded
on 3
/16/
2022
10:
39:3
4 A
M.
Thi
s ar
ticle
is li
cens
ed u
nder
a C
reat
ive
Com
mon
s A
ttrib
utio
n 3.
0 U
npor
ted
Lic
ence
.View Article Online
Spectra are the average of 32 scans, over a range of 500–4000 cm�1 at a resolution of 4 cm�1.
2.9 Transmission and cryo-transmission electronmicroscopy
TEM images of the HEC coated nanoparticles were obtainedwith the use of a Philips CM20 Analytical TEM at 80 kV accel-erating voltage. Samples were prepared by placing a drop ofnanoparticles in aqueous suspension onto carbon coated gridsfor 1 minute and then exposed to a 1% uranyl acetate solutionbefore being dried and placed in the instrument.
Vitried specimens were prepared at a controlled temperatureand at water saturation in the Vitrobot (FEI, Netherlands), andkept in liquid nitrogen until examination. Cryo-TEM analysis wasdone with a Tecnai T12 G2 TEM (FEI, Netherlands) operating at120 kV. Images were recorded digitally on a Gatan UltraScan 1000camera using the DigitalMicrograph soware (Gatan, U.K.).Images are recorded in the low-dose imaging mode to minimizebeam exposure and electron-beam radiation damage.20,21
Fig. 1 Size distributions for silica nanoparticles functionalised with 0%w/v HEC (dark blue), 0.1% w/v HEC (red), 0.5% w/v HEC (green), 1% w/vHEC (purple), and 2% w/v HEC (blue). (a) Shows data generated fromdynamic light scattering, whilst (b) shows data generated from NTA.
2.10 Small angle neutron scattering (SANS)
A 2 mL dispersion of each type of HEC-functionalised nano-particle and parent thiolated silica nanoparticles was dialysedagainst D2O using a dialysis membrane, with a molecularweight cut off of 2 kDa (Medicell International, UK). D2O wasreplaced every 3 hours with a total of three times to ensure closeto complete dispersion in D2O.
SANS experiments used the Sans2d neutron diffractometerat ISIS, UK. The instrument set up and incident wavelengthemployed a Q range of 0.004–0.4 A�1. Q is dened in eqn (1);
Q ¼4p sin
q
2l
(1)
where q is the scattering angle of the neutron beam, and l
incidence wavelength. Data were collected on a 3He detector, setat 4 m from the sample, and offset by 150 mm vertically and180mm laterally. All samples were placed into 2mmpath-lengthquartz cuvettes without any further dilution from stock. Eachraw scattering data set was corrected for the detector efficiencies,sample transmission and background scattering before beingreduced using instrument specic soware, Mantid,22 andplaced on an absolute scale using a reference material (a solidblend of hydrogenous and perdeuterated polystyrene). Allsamples were measured for the time required to obtain data ofhigh statistical precision. Data were then modelled using theSASview programme (see ESI† for details).
Initially the parent thiolated silica sample (Y1) was modelledto a sphere only, as it was synthesised without the presence ofany polymer, and therefore provided baseline informationincluding the scattering length density (SLD) and radius of theparticle core, which was used for further analyses. Followingthis, the parent particle was also tted to a core–shell model,along with the remaining data for samples decorated with HEC(Y2–Y5). Data obtained from particle characterisation (includingradius, polydispersity and density) were used for the tting.
This journal is © The Royal Society of Chemistry 2018
3 Results and discussion3.1 Particle size characteristics
Thiolated silica nanoparticles were synthesised in the presenceof hydroxyethylcellulose (HEC), a known thickening agent. Thisled to the formation of nanoparticles varying in size and withaltered surface functionality dependent on the concentration ofHEC used, but retained a high concentration of free thiolgroups available for further functionalisation, e.g. for uores-cent labelling. Immediately following synthesis, particles weresized using three techniques; dynamic light scattering (DLS),nanoparticle tracking analysis (NTA), and TEM.
DLS is a well-established and widely used technique fordetermining the size and polydispersity of nanoparticles withina sample. The size distribution proles for the silica nano-particles (parent and HEC-functionalised) are in Fig. 1a withnumerical values in Table 1. As can be seen, increasing theconcentration of HEC added to the reaction mixture increasesthe particles hydrodynamic radius, suggesting the hydrox-yethylcellulose is responsible for this effect.
A complimentary particle sizing technique, NTA, was alsoused. NTA maps the movement of individual particles overa given time and generates a diffusion coefficient based on thenumber of pixels the particles cross.23 From this diffusioncoefficient, a particle size is obtained using the Stokes–Einsteinequation (eqn (2));
RSC Adv., 2018, 8, 6471–6478 | 6473

Table 1 Summary of the characteristics of silica nanoparticles functionalised with varying concentrations of HEC. Data show the means �standard deviation
Sample% massof HEC (w/v)
Yield(%)
Hydrodynamicradius, nm (DLS) PDI (DLS)
Hydrodynamicradius, nm (NTA)
Particleradius,nm (TEM)a
Graingb
density(mg nm�2)
Surface thiolcontent(mmol g�1)
Y1 0 58 � 2 25 � 1 0.102 37 � 1 15 — 552 � 185Y2 0.1 61 � 3 27 � 2 0.143 50 � 5 19 0.058 348 � 41Y3 0.5 60 � 1 54 � 2 0.210 59 � 3 19 0.064 267 � 83Y4 1 62 � 3 97 � 11 0.236 78 � 3 17 0.202 189 � 24Y5 2 65 � 4 190 � 30 0.241 99 � 4 20 0.144 207 � 20
a Exemplary TEM images are shown in Fig. SI1. b It should be noted that graing density calculations used the surface area of an individualnanoparticle obtained by TEM analysis, as this was most accurate to the raw particle size. It should also be noted, that given the likely presenceof free HEC in the dispersion, there may be some error in these calculations.
RSC Advances Paper
Ope
n A
cces
s A
rtic
le. P
ublis
hed
on 0
8 Fe
brua
ry 2
018.
Dow
nloa
ded
on 3
/16/
2022
10:
39:3
4 A
M.
Thi
s ar
ticle
is li
cens
ed u
nder
a C
reat
ive
Com
mon
s A
ttrib
utio
n 3.
0 U
npor
ted
Lic
ence
.View Article Online
Dc ¼ kBT
6phr(2)
where kB is the Boltzmann constant, T is the temperature (K), his the viscosity (kg s) of the suspension solution, and r is theparticle radius. By combining DLS and NTA data, it is possibleto provide a greater accuracy of particle size. It is worth notingthat although both DLS and NTA determine the particles rH, themethod used to determine the values is different.
DLS is a light scattering technique where a laser is shonethrough a suspension of particles which causes the laser light toscatter (Rayleigh scattering). Fluctuations in the scattering, dueto particles moving under Brownian motion, are measured atspecic time intervals, which are then tted to an autocorrela-tion function. A diffusion coefficient is then determined usingMie theory (based on this autocorrelation function and therefractive index of the sample), followed by a particle size usingthe Stokes–Einstein equation.
NTA on the other hand is a particle tracking technique, andallows for a diffusion coefficient to be measured by analysingthe movement of individual particles in a specic environment.By tracking individual particles, undergoing random Brownianmotion from frame to frame, the average spatial displacementof the particles per unit time can be calculated, and thisdisplacement can be related to the hydrodynamic diameter ofthe particles through the Stokes–Einstein equation (eqn (2)).Although translational Brownian motion is a three-dimensionalprocess, it is possible to use a one, two, or three dimensionaldiffusion coefficient to determine a particles hydrodynamicdiameter as described by eqn (3):
4
ðx; yÞ2 ¼ Dxyt ¼ 4kBTt
3phd(3)
It should be noted that there is no assumption of 2-dimen-sional movement of particles. All particles are assumed to bemoving freely in all 3 dimensions while the measurement issampling the projection of each x, y and z component of thatmovement onto the xy observation plane.
As can be seen from the size distributions, there arediscrepancies between the results generated by each sizingtechnique. These are quantied by changes in the average sizes
6474 | RSC Adv., 2018, 8, 6471–6478
observed (Table 1). The decrease in concentration observed byNTA is likely due to the increasing size of particles, which formaggregates. The larger aggregates are formed in solutions withgreater concentrations of HEC, where the macromolecules mayact as bridges to bind individual thiolated silica nanoparticles.The larger size of these aggregates leads to a smaller number insuspension, which reduces their total concentration measuredby NTA.
Table 1 shows additional DLS and NTA data, along with theparticle yield produced and concentration of reactive thiolgroups on their surface (as determined by Ellman's assay). Ascan be seen, yields from the synthesis were relatively similar,and no signicant difference was noted (p > 0.05). This could berelated to the presence of free HEC, which could not be removedby dialysis. In terms of sizing (based on the z-average producedby DLS and the mean particle size from NTA), there isa discrepancy. This is due to the way the data is collected in eachcase. The z-average from DLS is a mean particle size based onthe intensity, and is bias towards a larger particle size (due toincreased scattering from larger particles compared to smallerparticles); however, the mean particle size recorded by NTA isthe mean of all the particles measured, and therefore shows nobias towards polydisperse samples. Fig. 1 shows the sizedistributions for both DLS and NTA (a and b respectively),showing a range of the particle sizes in the suspension. Thepeak of each curve respectively corresponds to the hydrody-namic size quoted in the table.
It is also apparent from Table 1 that polydispersity index(PDI) increases as more HEC is added to the reaction mixture(from 0.102 with no HEC to 0.241 with 2% HEC). This suggestseither particle aggregation or free HEC was present in theparticle dispersion.
3.2 Particle surface characteristics
The surface functionality of the particles was assessed usingFTIR, Raman spectroscopy and TGA. Fig. 2 shows the thermaldecomposition of the raw unfunctionalised nanoparticles, thepolymer alone, and the functionalised particles. As expected,increasing the amount of HEC in the reaction mixture increasesthe weight loss from the sample, demonstrating that more HECis present. The silica synthesised in the presence of 0.1% w/v
This journal is © The Royal Society of Chemistry 2018

Fig. 3 FT-IR spectra of nanoparticles prepared from reactionmixtureswith different HEC content.
Fig. 4 FT-Raman spectra of nanoparticles prepared from reactionmixtures with different HEC content. Spectrum of pure HEC is alsoincluded for comparison.
Fig. 2 Thermal decomposition of thiolated and HEC-functionalisednanoparticles, and pure HEC measured using TGA.
Paper RSC Advances
Ope
n A
cces
s A
rtic
le. P
ublis
hed
on 0
8 Fe
brua
ry 2
018.
Dow
nloa
ded
on 3
/16/
2022
10:
39:3
4 A
M.
Thi
s ar
ticle
is li
cens
ed u
nder
a C
reat
ive
Com
mon
s A
ttrib
utio
n 3.
0 U
npor
ted
Lic
ence
.View Article Online
HEC (red) has a similar thermal decomposition to the unfunc-tionalised silica (blue), as would be expected. However the %weight loss for this sample appears lower at the extremetemperatures than the unfunctionalised silica. From Table 1, itis clear that both Y1 and Y2 are of similar sizes. Therefore, itcould be possible that only a few macromolecules of HEC arebound to silica surface in the case of Y2.
By calculating the weight loss in each sample and subtract-ing it from the mass difference in the unfunctionalised silicananoparticles, it is possible to determine the graing density ofHEC in the particle dispersion (Table 1). It can be seen thatincreasing the amount of HEC in the reaction mixture increasesthe graing density on the particle surface. The exception tothis is Y5, where (when compared to Y4) a decrease in graingdensity can be observed, from 0.202 to 0.144 mg nm�2. Althoughthe % mass loss increases in the 2% HEC, the graing densityappears lower. A likely reason for this is that the HEC is moredensely incorporated into the internal structure of the particles,and thus more protected from thermal degradation comparedto HEC bound loosely on the particle surface.
FT-IR and FT-Raman spectroscopies conrm the presence ofHEC in the particle suspension. Spectra are shown for both FT-IR and Raman in Fig. 3 and 4, respectively.
As shown in Fig. 3, adding HEC into the reaction mixtureintroduces a broad band in the region of 3200 cm�1 to3600 cm�1. This is attributable to the O–H groups present inHEC. As the concentration of HEC in the nanoparticlesincreases, a second band at 2880 cm�1 and 2900 cm�1 becomesmore distinctive and provides further evidence that increasingthe amount of HEC in the reaction mixture increases polymerloading onto the nanoparticles. Another feature evident in thespectra for nanoparticles that contain HEC (as well as pureHEC) is the band at around 1640 cm�1, attributable to boundwater within the cellulose.24 The large peak observed at 1000–1200 cm�1 arises from the Si–O–Si linkage, as seen in otherpublications using the same particles.14,15
Fig. 4 shows FT-Raman spectra of HEC-functionalised silicananoparticles. These data demonstrate the presence of boththiol groups (at 2559 cm�1) and disulphide bonds (at 490 cm�1)in the nanoparticles synthesised from MPTS. It also exhibits
This journal is © The Royal Society of Chemistry 2018
many more similarities to the spectra recorded for uncoatedorganosilica as reported in previous work.14,15 The presence ofdisulphide bonds results from thiol groups being oxidisedduring the synthesis procedure.12,13
The Raman spectra were normalised to the maximumintensity of the C–H band. This allows the data from each of thebatches to be overlaid to facilitate comparisons between nano-particles synthesised with varying concentrations of HEC. Fig. 4illustrates that the spectra differed signicantly between theshis of 1500 cm�1 and 0 cm�1. These differences appear tofollow a trend that may be caused by the increasing amount ofHEC. The differences are especially pronounced between1500 cm�1 and 1000 cm�1. Indeed, it was found that as theintensity of –SH groups decreases, the intensity of aliphatic C–C
RSC Adv., 2018, 8, 6471–6478 | 6475

Fig. 5 Scattering cross-sections for Y1, Y2, Y3, Y4, and Y5. The insertdemonstrates differences in sizes observed by DLS, TEM, and SANS.
RSC Advances Paper
Ope
n A
cces
s A
rtic
le. P
ublis
hed
on 0
8 Fe
brua
ry 2
018.
Dow
nloa
ded
on 3
/16/
2022
10:
39:3
4 A
M.
Thi
s ar
ticle
is li
cens
ed u
nder
a C
reat
ive
Com
mon
s A
ttrib
utio
n 3.
0 U
npor
ted
Lic
ence
.View Article Online
stretches increases. Given that C–C exists mostly in the HEC,and SH in the silica, this conrms this hypothesis.
From the spectroscopic and thermal data, it is clear that theparticle size increase resulting from increasing amounts of HECin the reaction is due to the presence of this polysaccharide onthe particle surface, or bound into the particle core. As thevolume of the nanoparticle precursor is the same, it appears thatthe HEC macromolecules are binding into the core of theparticle, causing a larger cluster for which the particles can formaround. By doing so, the concentration of surface thiol groups islower (shown by a smaller peak at 2550 cm�1 in the FT-Ramanspectra, and molar concentration shown by Ellman's assay).
3.3 Particle structure
Small angle neutron scattering (SANS) provided information onthe internal and external structure of the nanoparticles, alongwith their sizes and potential interactions. Previously we havecharacterised silica nanoparticles functionalised with poly(-ethylene glycol) and poly(2-oxazoline)s using SANS, in order toconrm their structure.14,25 Here we used SANS to assess howthe addition of HEC inuences the particle size and core–shellstructure. The scattering cross-sections for Y1–Y5 are shown inFig. 5, and the ts (along with details on the form factors used)can be viewed in the ESI (Fig. SI2†). It should be noted that theSANS experiments used a different batch of nanoparticles thanthose summarised in Table 1, however, no signicant differencewas found between the size and coverage data between the twopopulations (P > 0.05). Given the uncertainty of how the silica
Table 2 Core radius and shell thickness of HEC-functionalised silica naalong with the calculated number of particles per aggregate as describe
SampleCore radius(nm)
Shell thickness(nm)
Y1 15.2 0.5Y2 17.2 0.5Y3 17.9 3.0Y4 14.6 3.0Y5 17.5 3.4
6476 | RSC Adv., 2018, 8, 6471–6478
and HEC are interacting (e.g. HEC functionalised onto thesurface, or through the core), the SLD for the core and shell werele as oating variables in the tting process.
Table 2 provides a summary of the sizes for each populationof particles used in this study, based on modelling the SANSdata to a core–shell sphere (see ESI† for a full breakdown). Dataobtained from previous characterisation techniques (TEM forthe core particle size, and DLS for the hydrodynamic size, Table1), was used as a guideline in the tting process. The core-radiusand shell thickness parameters were obtained directly frommodelling the SANS data. The total diameter was calculated byadding together the radius and shell thickness (to obtain totalradius), and multiplied by 2. The values calculated matched thevalues obtained by TEM (Table 1), conrming their accuracy.The value for number of particles per aggregate was estimatedfrom the aggregate volume (by DLS) divided by volume ofhydrated particles at each HEC concentration (from SANS dataplus an estimated 20 nm for the hydration layer around eachparticle). Further details (and caveats) of the estimation can befound in the ESI.† For the purposes of this discussion, “aggre-gate size” refers to the hydrodynamic diameter obtained by DLS,and “particle size” refers to the size calculated from SANSmodelling.
Comparing the particle sizes obtained for the unfunction-alised silica (i.e. particles with no HEC present, Y1), generatedby TEM/SANS to that of DLS, a discrepancy of 19 nm can beobserved (31 nm in SANS/TEM, and 50 nm in DLS). Previouslywe have reported this to be due to the hydration shellsurrounding the particle; DLS provides a radius of hydration,whereas SANS and TEM will provide the raw particle size (i.e.size without the hydration shell). A hydration shell thickness of10 nm, similar to the value obtained here, was observed.14,25
From the DLS data and TEM images for the remainingsamples (Y2–Y5), it is clear that the particles synthesised withincreasing amounts of HEC have a tendency to form largeraggregates. It is possible that, given the increasing amount ofHEC in the solution, that several particles are interacting witha single HEC chain, which acts as a bridge, thus leading toincreased aggregation. By correlating the DLS and SANS data, itis possible to determine the number of particles per aggregate(taking into account a 10 nm radius hydration shell aroundeach particle (Table 2, and ESI†)). Interestingly, a relationshipwas found between aggregate size (and the consequent numberof particles per aggregate) and the mass of HEC used in thereaction (Fig. SI3†).
noparticles as determined by fitting SANS data to a core–shell model,d in ESI
Total diameter(nm)
Estimated particlesper aggregate
31 135 141 635 4442 230
This journal is © The Royal Society of Chemistry 2018
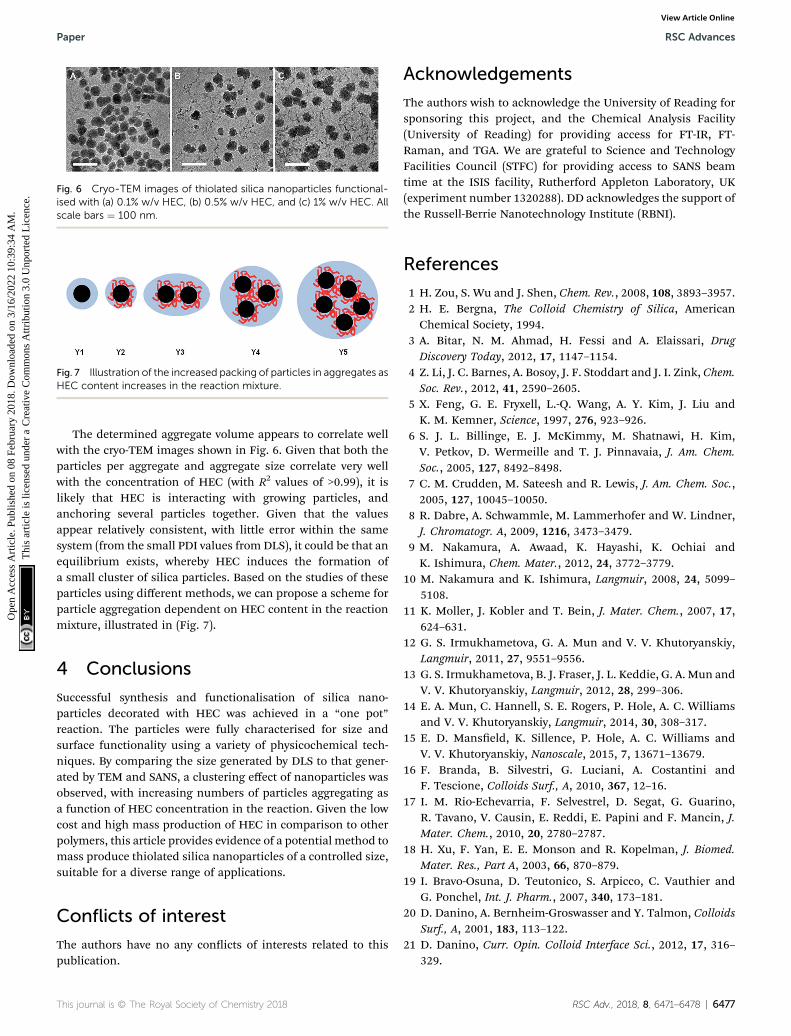
Fig. 6 Cryo-TEM images of thiolated silica nanoparticles functional-ised with (a) 0.1% w/v HEC, (b) 0.5% w/v HEC, and (c) 1% w/v HEC. Allscale bars ¼ 100 nm.
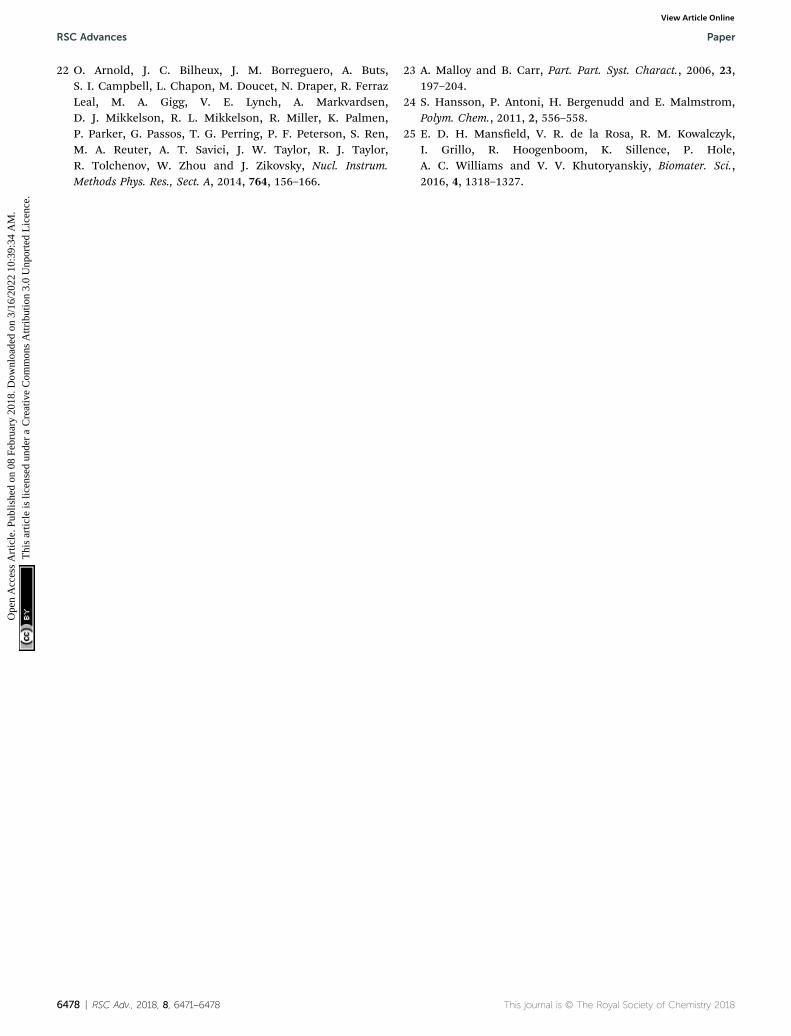
Fig. 7 Illustration of the increased packing of particles in aggregates asHEC content increases in the reaction mixture.
Paper RSC Advances
Ope
n A
cces
s A
rtic
le. P
ublis
hed
on 0
8 Fe
brua
ry 2
018.
Dow
nloa
ded
on 3
/16/
2022
10:
39:3
4 A
M.
Thi
s ar
ticle
is li
cens
ed u
nder
a C
reat
ive
Com
mon
s A
ttrib
utio
n 3.
0 U
npor
ted
Lic
ence
.View Article Online
The determined aggregate volume appears to correlate wellwith the cryo-TEM images shown in Fig. 6. Given that both theparticles per aggregate and aggregate size correlate very wellwith the concentration of HEC (with R2 values of >0.99), it islikely that HEC is interacting with growing particles, andanchoring several particles together. Given that the valuesappear relatively consistent, with little error within the samesystem (from the small PDI values from DLS), it could be that anequilibrium exists, whereby HEC induces the formation ofa small cluster of silica particles. Based on the studies of theseparticles using different methods, we can propose a scheme forparticle aggregation dependent on HEC content in the reactionmixture, illustrated in (Fig. 7).
4 Conclusions
Successful synthesis and functionalisation of silica nano-particles decorated with HEC was achieved in a “one pot”reaction. The particles were fully characterised for size andsurface functionality using a variety of physicochemical tech-niques. By comparing the size generated by DLS to that gener-ated by TEM and SANS, a clustering effect of nanoparticles wasobserved, with increasing numbers of particles aggregating asa function of HEC concentration in the reaction. Given the lowcost and high mass production of HEC in comparison to otherpolymers, this article provides evidence of a potential method tomass produce thiolated silica nanoparticles of a controlled size,suitable for a diverse range of applications.
Conflicts of interest
The authors have no any conicts of interests related to thispublication.
This journal is © The Royal Society of Chemistry 2018
Acknowledgements
The authors wish to acknowledge the University of Reading forsponsoring this project, and the Chemical Analysis Facility(University of Reading) for providing access for FT-IR, FT-Raman, and TGA. We are grateful to Science and TechnologyFacilities Council (STFC) for providing access to SANS beamtime at the ISIS facility, Rutherford Appleton Laboratory, UK(experiment number 1320288). DD acknowledges the support ofthe Russell-Berrie Nanotechnology Institute (RBNI).
References
1 H. Zou, S. Wu and J. Shen, Chem. Rev., 2008, 108, 3893–3957.2 H. E. Bergna, The Colloid Chemistry of Silica, AmericanChemical Society, 1994.
3 A. Bitar, N. M. Ahmad, H. Fessi and A. Elaissari, DrugDiscovery Today, 2012, 17, 1147–1154.
4 Z. Li, J. C. Barnes, A. Bosoy, J. F. Stoddart and J. I. Zink, Chem.Soc. Rev., 2012, 41, 2590–2605.
5 X. Feng, G. E. Fryxell, L.-Q. Wang, A. Y. Kim, J. Liu andK. M. Kemner, Science, 1997, 276, 923–926.
6 S. J. L. Billinge, E. J. McKimmy, M. Shatnawi, H. Kim,V. Petkov, D. Wermeille and T. J. Pinnavaia, J. Am. Chem.Soc., 2005, 127, 8492–8498.
7 C. M. Crudden, M. Sateesh and R. Lewis, J. Am. Chem. Soc.,2005, 127, 10045–10050.
8 R. Dabre, A. Schwammle, M. Lammerhofer and W. Lindner,J. Chromatogr. A, 2009, 1216, 3473–3479.
9 M. Nakamura, A. Awaad, K. Hayashi, K. Ochiai andK. Ishimura, Chem. Mater., 2012, 24, 3772–3779.
10 M. Nakamura and K. Ishimura, Langmuir, 2008, 24, 5099–5108.
11 K. Moller, J. Kobler and T. Bein, J. Mater. Chem., 2007, 17,624–631.
12 G. S. Irmukhametova, G. A. Mun and V. V. Khutoryanskiy,Langmuir, 2011, 27, 9551–9556.
13 G. S. Irmukhametova, B. J. Fraser, J. L. Keddie, G. A. Mun andV. V. Khutoryanskiy, Langmuir, 2012, 28, 299–306.
14 E. A. Mun, C. Hannell, S. E. Rogers, P. Hole, A. C. Williamsand V. V. Khutoryanskiy, Langmuir, 2014, 30, 308–317.
15 E. D. Manseld, K. Sillence, P. Hole, A. C. Williams andV. V. Khutoryanskiy, Nanoscale, 2015, 7, 13671–13679.
16 F. Branda, B. Silvestri, G. Luciani, A. Costantini andF. Tescione, Colloids Surf., A, 2010, 367, 12–16.
17 I. M. Rio-Echevarria, F. Selvestrel, D. Segat, G. Guarino,R. Tavano, V. Causin, E. Reddi, E. Papini and F. Mancin, J.Mater. Chem., 2010, 20, 2780–2787.
18 H. Xu, F. Yan, E. E. Monson and R. Kopelman, J. Biomed.Mater. Res., Part A, 2003, 66, 870–879.
19 I. Bravo-Osuna, D. Teutonico, S. Arpicco, C. Vauthier andG. Ponchel, Int. J. Pharm., 2007, 340, 173–181.
20 D. Danino, A. Bernheim-Groswasser and Y. Talmon, ColloidsSurf., A, 2001, 183, 113–122.
21 D. Danino, Curr. Opin. Colloid Interface Sci., 2012, 17, 316–329.
RSC Adv., 2018, 8, 6471–6478 | 6477
RSC Advances Paper
Ope
n A
cces
s A
rtic
le. P
ublis
hed
on 0
8 Fe
brua
ry 2
018.
Dow
nloa
ded
on 3
/16/
2022
10:
39:3
4 A
M.
Thi
s ar
ticle
is li
cens
ed u
nder
a C
reat
ive
Com
mon
s A
ttrib
utio
n 3.
0 U
npor
ted
Lic
ence
.View Article Online
22 O. Arnold, J. C. Bilheux, J. M. Borreguero, A. Buts,S. I. Campbell, L. Chapon, M. Doucet, N. Draper, R. FerrazLeal, M. A. Gigg, V. E. Lynch, A. Markvardsen,D. J. Mikkelson, R. L. Mikkelson, R. Miller, K. Palmen,P. Parker, G. Passos, T. G. Perring, P. F. Peterson, S. Ren,M. A. Reuter, A. T. Savici, J. W. Taylor, R. J. Taylor,R. Tolchenov, W. Zhou and J. Zikovsky, Nucl. Instrum.Methods Phys. Res., Sect. A, 2014, 764, 156–166.
6478 | RSC Adv., 2018, 8, 6471–6478
23 A. Malloy and B. Carr, Part. Part. Syst. Charact., 2006, 23,197–204.
24 S. Hansson, P. Antoni, H. Bergenudd and E. Malmstrom,Polym. Chem., 2011, 2, 556–558.
25 E. D. H. Manseld, V. R. de la Rosa, R. M. Kowalczyk,I. Grillo, R. Hoogenboom, K. Sillence, P. Hole,A. C. Williams and V. V. Khutoryanskiy, Biomater. Sci.,2016, 4, 1318–1327.
This journal is © The Royal Society of Chemistry 2018