structure and function in single- chain nanoparticles
TRANSCRIPT

Structure and Function in Single-
Chain Nanoparticles
Author: Julen de la Cuesta Leone
Supervisor: Prof. José A. Pomposo
Donostia - San Sebastián, 2021


3
Contents
Chapter 1: Introduction ............................................................................................................... 7
1.1. Motivation .......................................................................................................................... 9
1.2. Polymers ............................................................................................................................ 9
1.3. Polymer conformations................................................................................................... 10
1.4. Polymer synthesis ........................................................................................................... 11
1.4.1. RAFT polymerization ............................................................................................... 11
1.5. Intrinsically conducting polymers .................................................................................. 12
1.6. Nanoscience and nanotechnology .................................................................................. 14
1.6.1. Nanoparticles ............................................................................................................ 15
1.6.2. Single-chain technology ........................................................................................... 15
1.7. Single chain nanoparticles (SCNPs) ............................................................................... 15
1.7.1. Synthesis of SCNPs ................................................................................................... 16
1.8. Applications of SCNPs ..................................................................................................... 18
1.8.1. Catalysis .................................................................................................................... 18
1.8.2. Sensing ...................................................................................................................... 19
1.8.3. Nanomedicine ........................................................................................................... 19
1.9. Luminescence .................................................................................................................. 21
1.9.1. Fluorescence ............................................................................................................. 21
1.10. Aggregation Induced Emission ..................................................................................... 22
1.10.1. Mechanism .............................................................................................................. 23
1.11. Structure of this thesis .................................................................................................. 23
1.12. References ..................................................................................................................... 24
Chapter 2: Experimental Techniques ........................................................................................ 29
2.1. Motivation ........................................................................................................................ 31
2.2. Size exclusion chromatography / Gel permeation chromatography ............................ 31
2.3. Nuclear magnetic resonance ........................................................................................... 33
2.4. Fourier transform infrared spectroscopy ...................................................................... 34
2.5. Ultraviolet-visible spectroscopy ..................................................................................... 35
2.6. Fluorescence spectroscopy ............................................................................................. 36
2.7. Dynamic light scattering ................................................................................................. 37
2.8. Transmission electron microscopy ................................................................................ 38
2.9. Elemental Analysis .......................................................................................................... 39
2.10. X-ray scattering ............................................................................................................. 40

4
2.10.1. Small angle X-ray scattering .................................................................................. 40
2.11. Thermogravimetric analysis ......................................................................................... 42
2.12. Inductively coupled plasma atomic emission spectroscopy ....................................... 43
2.13. Atomic force microscopy .............................................................................................. 44
2.14. Conductivity measurements ......................................................................................... 45
2.15. UV irradiation ................................................................................................................ 46
2.16. References ..................................................................................................................... 47
Chapter 3: Size of Elastic Single-Chain Nanoparticles in Solution and on Surfaces ................ 49
3.1. Motivation ........................................................................................................................ 51
3.2. Introduction ..................................................................................................................... 51
3.3. Theoretical section .......................................................................................................... 52
3.3.1. Model of elastic single-chain nanoparticles ............................................................ 52
3.3.2. Size, diffusion coefficient, apparent molar mass, and shrinking factor of elastic single-chain nanoparticles in solution .............................................................................. 54
3.3.3. Size of elastic single-chain nanoparticles on surfaces ............................................ 59
3.3.4. Summary of scaling laws for elastic single-chain nanoparticles ............................ 61
3.4. Results and discussion .................................................................................................... 62
3.4.1. Comparison to experimental results ....................................................................... 62
3.4.2. Size, diffusion coefficient, apparent molar mass, and shrinking factor of polystyrene single-chain nanoparticles in tetrahydrofuran ............................................ 62
3.4.3. Size of polystyrene single-chain nanoparticles on silanized wafer and mica
substrates ........................................................................................................................... 67
3.4.4. Stretching of polystyrene single-chain nanoparticles ............................................ 68
3.4.5. Comparison of model predictions to experimental data for other covalent-bonded
SCNPs .................................................................................................................................. 69
3.5. Concluding remarks ........................................................................................................ 71
3.6. References ....................................................................................................................... 72
Chapter 4: Enzyme-Mimetic Single-Chain Nanoparticles for the Synthesis of PEDOT........... 75
4.1. Motivation ........................................................................................................................ 77
4.2. Introduction ..................................................................................................................... 77
4.3. Experimental procedures ............................................................................................... 80
4.3.1. Materials ................................................................................................................... 80
4.3.2. Techniques ................................................................................................................ 80
4.3.3. Synthesis of OEGMA-AEMA copolymers ................................................................. 81
4.3.4. Synthesis of artificial iron-containing pseudo-enzymes ........................................ 82
4.3.5. Synthesis of PEDOT using artificial iron-containing pseudo-enzymes.................. 82
4.3.6. Synthesis of PEDOT using Fe(OAc)2 (as control reaction) ..................................... 83

5
4.4. Results and discussion .................................................................................................... 83
4.4.1. Synthesis of iron-containing self-folded single-chain nanoparticles as artificial pseudo-enzymes ................................................................................................................. 83
4.4.2. Synthesis and characterization of PEDOT using artificial iron-containing pseudo-enzymes .............................................................................................................................. 89
4.4.3. Characterisation of PEDOT Synthesised using Fe(OAc)2 (control reaction) ........ 94
4.5. Conclusions ...................................................................................................................... 95
4.6. References ....................................................................................................................... 95
Chapter 5: Fast and Efficient Synthesis of Highly Fluorescent Single-Chain Nanoparticles .. 99
5.1. Motivation ...................................................................................................................... 101
5.2. Introduction ................................................................................................................... 101
5.3. Experimental procedures ............................................................................................. 102
5.3.1. Materials ................................................................................................................. 102
5.3.2. Techniques .............................................................................................................. 103
5.3.3. Procedures .............................................................................................................. 104
5.4. Results and discussion .................................................................................................. 108
5.4.1. Control reaction with HPS ...................................................................................... 111
5.4.2. Fluorescent SCNP synthesis ................................................................................... 113
5.4.3. Fluorescence quantum yield determination. ........................................................ 120
5.5. Conclusions .................................................................................................................... 123
5.6. References ..................................................................................................................... 124
Chapter 6: Self-Reporting of Folding and Aggregation Phenomena in Single-Chain Nanoparticles ........................................................................................................................... 129
6.1. Motivation ...................................................................................................................... 131
6.2. Introduction ................................................................................................................... 131
6.3. Materials and Techniques ............................................................................................. 134
6.3.1. Materials ................................................................................................................. 134
6.3.2. Techniques .............................................................................................................. 135
6.3.3. Synthetic procedures ............................................................................................. 136
6.4. Results ............................................................................................................................ 138
6.4.1. Self-reporting of folding within a single polymer chain via Hantzsch reaction .. 138
6.4.2. Self-reporting of folding and aggregation within a single polymer chain by
orthogonal luminophores via Hantzsch reaction ........................................................... 150
6.4.3. Self-reporting of (intentionally induced) multi-SCNPs aggregation ................... 154
6.5. Conclusions .................................................................................................................... 159
6.6. References ..................................................................................................................... 160
Chapter 7: Conclusions ............................................................................................................ 163

6
7.1. Conclusions .................................................................................................................... 165
7.2. Publications ................................................................................................................... 166

Chapter 1: Introduction


Introduction
9
1.1. Motivation
Trying to mimic the outstanding functionalities of enzymes and intrinsically disordered
proteins (IDPs) the research field of folding functionalized synthetic polymers to single-
chain polymer nanoparticles (SCNPs) has flourished in recent years. The folded
conformations of SCNPs produce robust SCNPs when stabilized by covalent interactions.
Conversely, when folding results from noncovalent interactions such as hydrogen bonds,
host-guest interactions, metal complexation, π-π stacking and hydrophobic interactions,
dynamic SCNPs are obtained. Even if current single-chain technology still lacks the nature´s
exquisite degree of control to generate 3D-proteins, some SCNPs already mimic the
outstanding properties of antimicrobial polypeptides, as well as both the size and function
of structural proteins, IDPs and metallo-enzymes.
The motivation of this Thesis is to deepen the understanding of single-chain polymer
nanoparticles (SCNPs) as complex soft nano-objects with potential applications in a variety
of fields, specially catalysis and sensing. In particular, this work covers different aspects
related to the structure and properties of SCNPs such as: i) the development of a theoretical
model of elastic SCNPs allowing to understand the behavior of these nanoparticles in
solution and on surfaces; ii) the design of SCNPs as advanced nanoreactors for the synthesis
of a relevant intrinsically conducting polymer such as poly(ethylenedioxythiophene),
PEDOT; iii) the design of highly fluorescent SCNPs by photoactivation of copolymers
containing diazo functional groups and an aggregation induced emission (AIE) fluorophore decorated with azide moieties; and iv) the synthesis of SCNPs containing orthogonal
fluorophores for self-reporting intramolecular compaction and, when present or externally
induced, intermolecular aggregation.
Since the research carried out in this Thesis is a multidisciplinary research that covers
different disciplines such as polymer chemistry, polymer physics, nanoscience,
nanotechnology and luminescence, in next sections we briefly introduce several concepts
relevant to understand the results reported in Chapters 3 - 6. Additionally, all the
experimental techniques employed in this work are described in Chapter 2.
1.2. Polymers
Polymers are large molecules (macromolecules) formed by the repetition of smaller
subunits (monomers) [1]. Polymers include synthetic materials like plastics, natural
compounds like rubber and biopolymers like proteins and DNA. They are synthetized by
the polymerization reaction of their constituent units.
Polymers are classified according to their architecture. Linear polymers consist of a single chain with two ends. Branched polymers include side chains, or branches, attached to the
main chain. Sometimes these branches are cross-linked forming a network polymer.
Copolymers are polymers formed by 2 or more different monomers. They have different
structures based on how the monomers are arranged in the chain. Alternating copolymers
have regularly alternating monomers. Periodic copolymers have the monomer units
arranged in a repeating sequence. Random copolymers have different monomers
distributed randomly. Block copolymers have homopolymer subunits. Grafted copolymers
have side chains of different composition than the main chain.

Chapter 1
10
The structure of polymers can be amorphous or semi-crystalline. Amorphous polymers lack
long range order and are arranged randomly. Semi-crystalline polymers are partially
ordered with crystalline structures separated by amorphous regions. A polymer cannot be
100% crystalline.
In polymers individual chains do not have the same number of repeating units and in
consequence they have different molar masses. Normally an average is calculated. The
molar mass distribution describes the relation between the number of polymer chains and
the mass of the polymer. The most common methods to calculate the average are the
number average and the weight average.
The number average molar mass (Mn) is the arithmetic mean of the molar masses. It is
calculated by dividing the sum of all polymer masses by the number of polymer chains.
(1.1)
𝑀𝑛 =∑𝑁𝑖𝑀𝑖
∑𝑁𝑖
The weight average molar mass (Mw) represents an average over the weight of the polymer.
Larger molecules have a larger contribution than smaller molecules. Some properties are
dependent on molecular size.
(1.2)
𝑀𝑤 =∑𝑁𝑖𝑀𝑖
2
∑𝑁𝑖𝑀𝑖
The dispersity index Đ > 1 is the ratio between Mw and Mn. If Đ is high the polymer has a
broad size distribution.
The hydrodynamic radius (Rh) of a solute particle is the radius of a hypothetical equivalent
hard sphere that diffuses at the same speed than the solute. The movement of the solute
particles is resisted by the viscosity of the solution. The hydrodynamic radius takes into
account all the molecules attracted to the solute and solvating it. These molecules hinder
the mobility of the particle.
The radius of gyration (Rg) of a polymer is the average distance from any point in the
polymer to its centre of mass. The value of Rg depends on the molar mass, the architecture
and the quality of the solvent. It is worth mentioning that polymers swell in good solvents
and shrink in bad ones.
1.3. Polymer conformations
Polymers are made of repeating units. A simple model of polymers consists of a chain of N
repeating segments of length l. In an ideal chain the segments can be oriented in any
direction and the parts of the chain units do not interact with each other. In this case the
polymer can be described as a random walk in three dimensions [1, 2].

Introduction
11
The end-to-end distance vector is given by the sum of the vectors corresponding to all
individual segments.
(1.3)
�⃗� = ∑{𝑟1⃗⃗⃗ , …… , 𝑟𝑛⃗⃗ ⃗}
The length and number of the individual segments of the model does not necessarily correspond with the length and number of monomers.
The end-to-end distance in a random walk can be approximated by the following scaling
law:
(1.4)
𝑅~𝑁𝜈
Where the ν is the Flory exponent, which is ν = 1/2 for an ideal chain. However, in real
chains the excluded volume must be taken into account, and the chain is best modelled as a
self-avoiding random walk. In this case the value of the exponent is ν = 3/5.
The Flory exponent of a polymer depends on its solubility. In a good solvent the chain swells
to maximize interaction with the solvent, corresponding to the self-avoiding random walk
with ν = 3/5. Meanwhile, in a poor solvent the polymer chain collapsed into a solid sphere
where ν = 1/3. In the so-called θ-solvent the polymer behaves as an ideal chain with ν =
1/2.
1.4. Polymer synthesis
Many methods have been developed along time for the synthesis of (co)polymers with
narrow molecular weight distribution (Đ → 1) such as anionic, cationic, and controlled
radical polymerization techniques. Among them, the most useful, versatile and easy to use
is the reversible addition fragmentation chain transfer (RAFT) polymerization technique.
1.4.1. RAFT polymerization
Reversible addition fragmentation chain transfer polymerization is a type of reversible
deactivation radical polymerization. It uses a chain transfer agent, normally a
thiocarbonylthio compound, to control the molecular weight and the polydispersity of the
polymer chain during synthesis [3]. It was first reported in the Commonwealth Scientific
and Industrial Research Organization (CSIRO) of Australia in 1998 [4] and it has since
become one of the most versatile and powerful polymerization techniques for the synthesis
of complex polymeric architectures.
A RAFT polymerization system consists of an initiator, a chain transfer agent (CTA), the
monomers and the solvent. The mechanism consists of six steps: In step 1 the initiator reacts

Chapter 1
12
with the monomer forming a radical. This radical reacts with more monomer molecules,
propagating a growing polymer-radical chain (step 2). In step 3, the propagating polymer
chain reacts reversibly with the CTA, stopping the growth of the chain and releasing a
radical. In step 4, the released radical adds new monomers to a propagating polymer chain.
In the next step the main equilibrium is reached, where the CTA agent is exchanged between
polymer chains allowing chains that have not undergone termination to share the radicals,
allowing equal opportunities for growth. The last step involves the reaction of two radicals
terminating chain growth [5].
Scheme 1.1. Schematic representation of the RAFT polymerization mechanism with a thiocarbonylthio chain-transfer agent [6].
1.5. Intrinsically conducting polymers
Conductive polymers or intrinsically conducting polymers are organic polymers that
conduct electricity [7]. Electrical conductivity is the fundamental property of materials that
quantify how strongly it conducts electric currents. A high conductivity means that a
material allows electric currents. Conductivity is the inverse of electrical resistivity.
Electrical resistance is the opposition an object shows to the flow of an electrical current
and its SI unit is the ohm (Ω). It depends on the properties of the material and it is
proportional to the length of the conductor and inversely proportional to its cross section.
Resistivity is defined as the electrical resistance produced by an object of unit cross section
per unit length.

Introduction
13
(1.5)
𝜌 = 𝑅𝐴
𝑙
Where ρ is the resistivity, R is the resistance, A the cross section area and l the length. The
SI unit of the resistivity is the ohm metre (Ω·m). This means that resistivity (like its
reciprocal conductivity) is an intrinsic property of the conducting material and does not
depend on the shape of the conducting object. Conductivity (σ) is given as the inverse of
resistivity and its SI unit is the Siemens per metre (S/m).
(1.6)
𝜎 =1
𝜌
Historically, polymers were considered insulators of electricity. Later it was discovered that
some conjugated polymers could conduct electricity nearly as well as metals. These conducting polymers combine the electrical properties of metals with advantages of
polymers such as lighter weight, greater workability, resistance to corrosion and lower cost.
Polymers are more easily processed than metals: large surfaces can be covered by spin
coated polymers, they can be deformed reversibly and they can be shaped into complex
multi polymer architectures. Some of their potential applications are organic light emitting
diodes, organic solar cells and biosensors [8].
The first breakthrough in the field of electrically conducting polymers happened in 1977
when Alan J. Heeger, Alan G. MacDiarmid and Hideki Shirakawa [9] demonstrated that
polyacetylene increased its electrical conductivity after treatment with oxidizing or
reducing agents. They were awarded the Nobel Prize in Chemistry in 2000 for the discovery
and study of conducting polymers. That discovery led to the research and study of
conducting polymers.
Electrically conducting polymers have a molecular character and lack long range order. This character causes the electronic motion across macromolecules to be one-dimensional. In
traditional polymers the valence electrons form molecular bonds between sp3 hybridized
electronic orbitals. These sigma bonds have low mobility and do not contribute to the
electrical conductivity of the polymer. In conjugated polymers, with a backbone of
alternating single and double bonds, it is different. The backbone of the polymer is formed
by sp2 hybridized carbon atoms. These atoms have a valence electron in a pz orbital
orthogonal to the sigma bonds. These pz orbitals form π bonds between them. When π bonds
are conjugated the electrons are delocalized. The conducting properties of these polymers
arise from this π-conjugation after the introduction of an electrical charge. When the
polymer is doped by oxidation (or reduction) these electrons (or holes) become highly
mobile and the polymer becomes conductive.

Chapter 1
14
Figure 1.1. Scheme of conducting polymer p-doped polyacetylene.
The conductivity of conducting polymers is similar to that of semiconductors. The main
difference is the susceptibility of conducting polymers to structural distortion. The dopant,
normally a charged molecule, stabilizes the backbone and neutralizes the charge. The
dopant introduces a charge carrier in the system by removing or adding electrons from the
polymer chain. It is energetically favourable to localize the charge and surround it with a
relaxation or structural distortion, forming a polaron and stabilizing the structure. The
structure change displaces the valence and conductivity bands of the molecule, shifting the
Highest Occupied Molecular Orbital (HOMO) upward and the Lowest Unoccupied Molecular
Orbital (LUMO) downward and increasing the conductivity. The polaron can travel through
the polymer chain, conducting electricity. If two polarons are near each other they can lower
their energy sharing their lattice distortion. If the attraction becomes large enough they
become bound and surrounded by the distortion, forming a bipolaron [10].
There are two types of doping processes: p-doping, where the polymer is oxidized and has
a positive charge because of the loss of electrons, and n-doping, where the polymer is
reduced and has a negative charge due to the acceptance of electrons. There is a
proportional relationship between the amount of dopant used and the conductivity of the
doped polymer. The doping is reversible and an electrical potential applied through the
system causes the polymer to switch between conductive and insulating redox states.
Dopants can be separated into two categories according to their molecular size: small
dopants like Cl- and large dopants like poly(sodium 4-styrenesulfonate), PSS. Small dopants
leave and re-enter the polymer with electrical stimulation. Large dopants affect the material
properties dramatically and they are immobile and more integrated with the polymer [10,
11].
1.6. Nanoscience and nanotechnology
Nanoscience is the science of structures and materials at the nanoscale level, with sizes
intermediate between the largest molecules and the smallest structures that can be
fabricated by photolithography, that is, objects with dimensions ranging between 1 nm and
100 nm [12]. The prefix nano in nanoscience and nanotechnology comes from the Greek
word for dwarf and is the SI prefix for one billionth (10-9). One nanometre is 10-9 meters
[13].
The first reference to the concepts associated with nanoscience was the talk by physicist
Richard Feynman “There’s plenty of room at the bottom” in 1959, where he discussed the
possibility of manipulation of individual atoms.
Properties at the nanometric scale differ significantly from those at larger scales [14],
resulting in many promising applications. Nanoscience has important applications in the

Introduction
15
fields of physics, chemistry and biology. In chemistry the nanoscale is associated with
micelles, colloids, polymer molecules or phase separated regions of block copolymers.
Meanwhile in physics nanoscience is associated with quantum effects and the behaviour of
photons and electrons on nanostructures. In the field of biology and biochemistry
nanostructures such as the components of the cell (DNA, proteins) or viruses are important.
Structures considered nanostructures include buckyballs, nanotubes, quantum dots,
colloids, etc.
On the other hand, nanotechnology is the building and manipulation of these
nanostructures for practical applications.
1.6.1. Nanoparticles
Nanoparticles (NPs) are one of the most important applications of nanotechnology. They
are defined by IUPAC as particulate materials of any size which have at least two dimensions
below 100 nm [15]. Due to their small size and high surface area to volume ratio they have
physical, chemical and optical properties different from those of bulk materials. Those
properties are dependent on the shape and size of the nanoparticle.
Nanoparticles can be classified into various categories [16], including “hard” inorganic NPs
and “soft” organic NPs. Hard nanoparticles include carbon based NPs (fullerenes, carbon
nanonotubes), metallic NPs (gold NPs), ceramic NPs, and semiconductor NPs (quantum
dots), while soft nanoparticles include polymeric NPs and lipid-based NPs.
1.6.2. Single-chain technology
In recent years, inside the field of nanoscience, a new discipline has emerged: single chain
technology. This field consists of soft nanoparticles based on polymers with ultra-small
sizes in the range of 3 to 30 nm. The ability to control the synthesis of soft nanoparticles
appeared at the beginning of the 21st century. Since then, the discipline has expanded and
many different applications have been found [17].
Single chain technology deals with the synthesis of soft nano-objects from single polymers
chains. These structures are inspired by natural macromolecules [18]. Nano-objects
synthesized in this way include dynamic [19], letter-shaped [20] or unsymmetrical [21]
single rings, and complex multi-ring objects. Moreover, copolymer chains of different sizes
and masses have been folded into single-chain nanoparticles [22], tadpoles [23]
(monotailed SCNPs), dumbbells [24] and hairpins [25].
1.7. Single chain nanoparticles (SCNPs)
The most important products of single-chain technology are single-chain polymeric
nanoparticles (SCNPs). SCNPs are a class of nanoparticles that consist of a single polymer
chain folded by crosslinking between reactive pendant groups [26, 27]. Intramolecular
cross-linking in linear single polymer chains was first reported by Kuhn and Balmer in 1962
[28]. SCNPs are the smallest nano-objects that can be prepared from a linear polymer

Chapter 1
16
through intra-chain collapse. They have potential applications as enzyme mimics, sensors,
catalytic systems, etc. These SCNPs are synthesized by the folding and collapse of a single
polymer chain into a nanoparticle via covalent or non-covalent bonds.
SCNPs can show sparse or globular morphologies. Sparse SCNPs are synthesized in dilute
good solvent conditions, where compaction is relatively inefficient, since it involves cross-
linking events separated by short distances. Globular SCNPs have a high degree of
compaction caused by cross-links forming long-range loops [25]. These are synthesized by
the folding/collapse of amphiphilic random copolymers or by the addition of relatively long
cross-linkers.
1.7.1. Synthesis of SCNPs
The synthesis of SCNPs often consists of 3 steps: the synthesis of a precursor polymer from
monomers, the functionalization of the polymer with functional groups suitable for the
reaction, and the folding or collapse of the polymer chain [29].
1.7.1.1. Precursor synthesis Precursor synthesis consists of the addition of complementary (reactive and inert)
monomers into a polymer chain in a controlled manner forming a linear chain. For the
synthesis of precursor polymers, it is important to find a polymerization technique that
results in polymers with a narrow molar mass (and size) distribution. In chain growth
polymerizations the occurrence of irreversible termination reactions in propagating chains
results in “dead” polymer chains with very different chain lengths [30]. Controlled Radical
Polymerization (CRP), also known as living radical polymerization or reversible
deactivation radical polymerization (RDRP), processes allow a facile construction of
polymers with low dispersity values and controlled architectures (stars, branches,
dendrimers…) even in the presence of a broad range of monomer functional groups. A
common feature in CRP is the existence of an equilibrium between free radical and
deactivated species. The exchange between active and growing radicals and dormant
species results in a slow but simultaneous growth of all chains [29]. As the reaction with a
chain transfer agent is reversible the propagating chains are considered as “living”. Some of
the most common CPR techniques employed in the synthesis of precursor polymers are
reversible addition fragmentation chain transfer (RAFT) [4], atom transfer radical
polymerization (ATRP) [31], nitroxide mediated radical polymerization (NMP) [32] or ring
opening polymerization (ROP) [33].
The precursor polymers used in the experiments carried out in this thesis were synthesized
by RAFT polymerization.
1.7.1.2. Precursor functionalization Sometimes precursor polymers lack the functional groups necessary for the intra-chain
cross-linking that forms SCNPs. In these cases an additional step called polymer
functionalization is needed. In this step the functional groups of the polymer are modified
to produce suitable functional groups for cross-linking [29]. The aim of polymer

Introduction
17
functionalization is the selective modification of a polymer under mild conditions avoiding
side-reactions.
Some of the most efficient and used polymer functionalization reactions are the following:
thiol-ene/thiol-yne additions (click reactions); modification of epoxides, anhydrides,
oxazolines and isocyanates by reaction with amines/alcohols/thiols [34] (click reactions);
modification of active esters by reaction with amines; thiol-disulphide exchange [35]; Diels-
Alder reaction [36] (click reaction); Michael-type addition; Copper-catalyzed azide alkyne
cycloaddition (CuAAC); Modification of ketones and aldehydes with amines / alkoxyamines
/ hydrazines; azidation [37] (nucleophilic substitution); and the transfer of diazo groups
[38].
1.7.1.3. Intra-chain folding/collapse The final step in the synthesis of SCNPs is the folding/collapse of the polymer. The formation
of SCNPs is achieved by collapsing the polymer chain and stabilizing the resulting
nanoparticle by intramolecular cross-linking in a process analogous to many folding
processes of natural biomacromolecules. Reactive functional groups from the polymer
chain react with each other to form cross-links. The cross-linking reactions are normally
carried out at low concentrations to avoid intermolecular cross-linking and the formation
of aggregates.
There are several approaches to generate intra-chain collapse. The bonding interactions of
the crosslinks can be classified as covalent or non-covalent [39, 40].
Covalent folding SCNPs are cross-linked irreversibly by covalent bonds. Many of these reactions follow the
“click-chemistry” approach, where simple, specific and high-yield reactions form carbon
heteroatom bonds [41]. There are three main strategies to form intramolecular covalent
bonds: intra-chain homocoupling, intra-chain heterocoupling or cross-linker induced
collapse.
Intra-chain homocoupling
In the homofunctional chain collapse method the chain is functionalized with self-
complementary groups like double bonds. These functional groups react with each other
(e.g. via radical-radical coupling reactions) collapsing the chain.
Intra-chain heterocoupling
The heterobifunctional chain collapse approach is similar to homocoupling but requires two
different complementary functional groups on the same chain instead of a single one.
Copper-catalyzed azide alkyne cycloaddition (CuAAC, click chemistry) [42] is a good
example.

Chapter 1
18
Cross-linker-induced Collapse
In the cross-linker mediated chain collapse strategy, functional groups in the polymer chain
do not react directly with one another. The polymer is functionalized with suitable
functional groups to react with the end-groups of a small cross-linker molecule. When the
external cross-linker is added it reacts with 2 or more polymer functional groups, forming
a bridge [43]. Examples include SCNP synthesis via Michael addition [44, 45], amide
formation [46] and thiol-ene/thiol-yne additions [47].
Non-covalent folding Non-covalent interactions, also called supramolecular interactions, are interactions
between atoms of an intensity much weaker than covalent bonds. Non-covalent bonds are
responsible for the structure of biomacromolecules such as proteins and they can be used
in the construction of artificial macromolecular structures [48]. Some examples are
hydrogen bonds, hydrophobic interactions, π-π stacking, metal coordination [49-51], van der Waals forces or ionic interactions. These interactions are reversible and the strength of
the bonds is dependent on many factors such as temperature, pressure, concentration, etc.
A result of this is that the structure of the complexes they form depends on solvent polarity,
concentration, pH, temperature, etc. [52]. This versatility allows the formation of complex,
dynamic and responsive structures.
Dynamic covalent bonds Dynamic covalent bonds are covalent bonds that are stable under certain conditions but can
be broken and reformed under specific external factors such as temperature, pH, light or
catalysts [53, 54]. They combine the strength of covalent bonds and the reversibility of non-
covalent bonds under certain conditions. For example, disulphides are stable under acidic
and neutral conditions and exchange under basic conditions while hydrazones are stable
under neutral and basic conditions and hydrolyse under acidic conditions [55]. Examples of dynamic covalent interactions include disulphide bonds [56], imine derivatives [56, 57],
hydrazones [58], enamines [59], acetals/hemiacetals [60], etc. Dynamic covalent bonds are
common in natural macromolecules (e.g. disulphide bonds in proteins) and are promising
for the fabrication of artificial nanoparticles that change their structure in response to
external stimuli [58].
1.8. Applications of SCNPs
SCNPs have potential applications in a wide range of fields [39, 61]. Despite the field being
relatively recent, the experiments that have been carried out show promising results.
1.8.1. Catalysis
One of the most promising applications of SCNPs is their use as catalysts. The folding of
bioinspired polymers is reminiscent of the folding of proteins and SCNPs mimic roughly
their structure [29]. Proteins are constituted by one or several folded peptides that function

Introduction
19
under unique conformations. A complex and delicate self-folded structure and dynamic
adaptability endows proteins with various functions. One of the most important of these
functions is enzyme catalysis, where the reaction time is increased up to a factor of 109,
which means enzymes are the most efficient catalysts known in nature. Many enzymes have
an active site that consists of a hydrophobic nano-cavity stabilized by hydrophobic
interactions where catalysis takes place. The folded structure of the enzyme provides a
unique environment for the catalytic site and is responsible for its specificity. This structure
is maintained by hydrogen bonds, hydrophobic interactions and disulphide bonds. As a
result, the design of artificial enzymes with high catalytic efficiency has been subject to
many studies and they are the source of inspiration for artificial SCNPs with catalytic
properties [62, 63].
There are two approaches to build artificial enzymes. The first approach consists on copying
the structure of the active catalytic centres of the enzyme. Sparse SCNPs mimic the
morphology of Intrinsically Disordered Proteins (IDPs). The structure of IDPs is a “pearl
necklace” conformation consisting of many small active pockets that can bind several
ligands, such as ions, small molecules, other proteins or nucleic acids. Sparse SCNPs with
this conformation are endowed with transient-binding activity.
The second approach is to mimic the morphology of proteins. The spatial conformation of
the active centre is very important in enzymatic catalysis and, in consequence, the strategy
of imitating the structure has attracted much attention. Globular SCNPs mimic native
proteins by creating a large hydrophobic pocket by self-assembly of amphiphilic
copolymers [61]. Metal ions can be placed in the pocket to provide it with catalytic activity
[64].
Those characteristics of proteins are mimicked by self-folding polymers, which take the
form of SCPNs. SCPNs mimic the whole enzyme taking into account both the conformation
and the chemical entity of the reactive centre [65].
SCNPs that mimic the catalytic activity of carboxylases [66], polymerases [67], reductases
[67], oxidases [49], etc. have been synthesized.
1.8.2. Sensing
SCNPs have promising applications as sensors and biosensors. Changes in the optical
properties of SCNP solutions in the presence substances such as metal ions [68] or proteins
[69] allow their easy, visual detection.
1.8.3. Nanomedicine
Nanomedicine is the application of nanotechnology for diagnosis monitoring and therapy of
physical and pathological processes [70].
1.8.3.1. Drug delivery SCNPs are promising nanomaterials for drug delivery applications. Nanoparticles can
protect drugs from the action of enzymes and their size is large enough to avoid rapid

Chapter 1
20
clearance in the kidneys and be retained in the body in a range of physiological media long
enough to have the desired effect. Insoluble or toxic drugs could be encapsulated into
biocompatible SCNPs, providing several advantages [71]. Functionalized polymers would
deliver the encapsulated drug to their target before releasing it in a controlled way, reducing
the toxicity of the drug and improving its effectivity. Experiments have been performed with
SCNPs as drug delivery nanocarriers for amino acids [72], peptides [73], vitamins [44] and
anti-cancer drugs [74].
1.8.3.2. Imaging Nanoparticles have promising applications in the medical imaging field as contrast agents
or luminescent markers. For example, metal-complexed SCNPs have been used as contrast
agents for Magnetic Resonance Imaging [75].
Fluorescence has long been used in many applications in biology, biochemistry and
medicine; for example, biomarker analysis, immunoassays and diagnostic imaging. Small organic molecules suffer from limitations regarding their wavelength range, brightness,
photo-stability and fluorescence self-quenching. The toxicity of some organic fluorophores
has limited their application for in vitro and in vivo optical imaging.
Fluorescent nanoparticles are a possible solution to the limitations of small organic
fluorescent dyes. Fluorescent nanoparticles often contain multiple fluorophores, leading to
brighter photoluminescent emission compared to the low absorption coefficients of
individual organic fluorophore molecules. The encapsulation of the fluorophore into the
nanoparticle increases its stability and reduces photo-bleaching and toxicity. Proper
selection of the nature of the particle can improve biocompatibility compared to small
organic fluorescent molecules. The possibility to combine imaging and drug delivery in the
same system is a unique characteristic of fluorescent nanoparticles.
Fluorescent nanoparticle systems based on block copolymer micelles and cross-linked
polymer networks, quantum dots (QDs), π-conjugated polymers, and dendrimers have been evaluated as optical imaging systems. However, despite the successful use of fluorescent
nanoparticles for optical imaging, some problems remain to be solved. The large size of
these particles prevents them from traversing intact cell membranes efficiently,
appropriate tuning of absorption and photoluminescence emission wavelengths is difficult
and, in the case of inorganic nanoparticles, the issue is non-degradability and in vivo
accumulation of large particles [76].
In recent years, several methods have been developed to endow SCNPs with fluorescent
characteristics. The folding of linear polymer chains into a collapsed state provides dense
zones where π-conjugated fluorophore molecules can be packed.
Four different pathways have been developed to endow SCNPs with fluorescent properties:
precursor pre-functionalization with fluorophore, fluorophore entrapment / in situ
generation, SCNP post-functionalization with fluorophore, and fluorophore generation
through SCNP formation [77].
Precursor pre-functionalization with fluorophore: The precursor polymer is functionalized
with a fluorescent moiety before crosslinking into an SCNP.
Fluorophore entrapment / in situ generation: Fluorophore molecules are entrapped into
the dense local packaging zones of the polymer or fluorophores are synthesized in the
packaging zones taking advantage of the local environment.

Introduction
21
SCNP post-functionalization with fluorophore: Cross-linked SCNPs are functionalized by
reacting with fluorescent moieties.
Fluorophore generation through SCNP formation: The cross-linking reaction generates
fluorophores inside the SCNP. For example synthesis of fluorescent SCNPs via photoinduced
nitrile imine mediated tetrazole-ene cycloaddition [78].
1.9. Luminescence
Luminescescence is the emission of light by a substance not resulting from heat. It can be
caused by chemical reactions (chemoluminescence), ionizing radiation
(radioluminescence), mechanical action (mechanoluminescence), electric currents
(electroluminescence) or light (photoluminescence) [79].
Photoluminescence is caused by the absorption of photons by a molecule. It is initiated
when the absorption of photons causes the excitation of electrons to a higher energy level
in an atom. This phenomenon is known as photoexcitation. The electrons then return to the
ground state via several relaxation processes that include the emission of photons. Part of
the energy can be dissipated through non-radiative pathways such as vibrations, resulting
in the emission of lower energy, and longer wavelength, photons. The phenomena that
produce this result are fluorescence and phosphorescence.
Phosphorescence is a process where the electronic spin changes and electrons are
promoted to a triplet excited state. The only transitions back to the ground singlet state are
through “forbidden” mechanisms. These “forbidden” transitions can happen but are
kinetically unfavoured, resulting in a slower decay to the ground state. The lifetime of the
excited state is of the order of seconds to minutes, which means that phosphorescence
persists after the exciting source is removed as an afterglow.
1.9.1. Fluorescence
Fluorescence was first described by George Gabriel Stokes [80] in 1852, when he observed
the ability of fluorspar and uranium glass to change invisible ultraviolet light into visible
blue light. Fluorescence is a type of photoluminescence where an electron in the singlet
ground state is promoted to the singlet-excited state. The electronic transition does not
change the electron spin and the transition back to the ground state is allowed. The excited
state is short lived (<10-5 s). Vibrations dissipate part of the energy and the electron returns
to the ground state emitting a longer wavelength photon. Fluorescence ceases immediately
after the photoexcitation of the fluorescent material stops [81].
Fluorescence is common in nature. It appears in many different animals and some plants. It
can also be seen in some minerals and in atmospheric phenomena like auroras. Among the
practical applications of fluorescence are fluorescent lamps, the use of fluorescent dyes
(fluorophores) in sensing [82] and imaging, as markers in biological applications [83], and
fluorescence spectroscopy.
Fluorophores are chemical compounds that emit light under light excitation. Usually they
contain aromatic rings or conjugated double bonds with conjugated π electrons in them.

Chapter 1
22
Intrinsically fluorescent molecules can be used alone as tracers, dyes or indicators, while
others can be bound covalently to otherwise non-fluorescent systems as markers for
spectroscopy and imaging applications. The emission range of organic fluorophores goes
from UV light to the near infrared. Some of the most common fluorophores include
fluorescein, rhodamine, coumarin or cyanine [84].
The fluorescence quantum yield is the parameter used to measure the efficiency of
fluorescent emission. It is defined as the ratio of the number of photons emitted by a
fluorophore to the number of photons absorbed. It represents the probability that a given
excited fluorophore will produce an emitted photon.
(1.7)
𝑄𝑢𝑎𝑛𝑡𝑢𝑚 𝑌𝑖𝑒𝑙𝑑 =𝑁𝑢𝑚𝑏𝑒𝑟 𝑜𝑓 𝑝ℎ𝑜𝑡𝑜𝑛𝑠 𝑒𝑚𝑖𝑡𝑡𝑒𝑑
𝑁𝑢𝑚𝑏𝑒𝑟 𝑜𝑓 𝑝ℎ𝑜𝑡𝑜𝑛𝑠 𝑎𝑏𝑠𝑜𝑟𝑏𝑒𝑑
The quantum yield of a fluorophore is calculated by building a calibration curve using
multiple standards of a compound with known fluorescence quantum yield. The integrated
area of fluorescence is plotted against the absorbance for different concentrations of the
fluorophore [85].
1.10. Aggregation Induced Emission
In most biomedical applications luminophores are used in aqueous media in physiological
environments where the intrinsically hydrophobic aromatic components like phenyl rings
responsible for the luminescence are insoluble, causing the formation of nanoaggregates
[86]. Aggregation can result in changes in the emissivity of the molecule.
In 1954 Förster and Kasper discovered that the fluorescence of pyrene was weakened with
increasing solute concentration [87]. This phenomenon is known as aggregation caused
quenching (ACQ). This effect is common in simple aromatic compounds according to the
summary Photophysics of Aromatic Molecules (Birks, 1970) [88]. These conventional
fluorescent molecules emit strongly in the isolated state. In the aggregated state, however,
fluorophores interact with adjoining molecules in their immediate vicinity. The aromatic
rings of adjoining molecules experience intermolecular π-π stacking interactions, causing
these fluorophores to decay from the excited state to the ground state via non-radiative
pathways, resulting in the quenching of fluorescent emission [86].
Fluorescence is caused mostly by electronic conjugation of π bands. One strategy to increase
the yield of organic luminescence has been to increase π conjugation by adding more
aromatic rings. The resulting molecules have increased fluorescence efficiency but often
suffer a severe ACQ effect [89]. ACQ is detrimental to most applications. In biological
applications for example, these molecules are in an aqueous medium (physiological
medium) resulting in aggregation. Even when attaching polar functional groups to the
fluorophore to increase their solubility and make them hydrophilic, the resulting
compounds -despite being water soluble- tend to form aggregates due to the intrinsic
hydrophobicity of the luminescent part, filled with π conjugated aromatic rings [89]. As ACQ
is deleterious on most practical applications, different strategies were followed to deal with

Introduction
23
this problem. Most of them tried to avoid aggregation, but some followed a different
strategy.
In 2001, Tang and co-workers discovered a luminogen system in which aggregation
resulted in an increase of fluorescence rather than a decrease [90]. These compounds were
non emissive in dilute solutions but became fluorescent in concentrated solutions or solid
films. Because the emission was induced by aggregates, the process was named Aggregation
Induced Emission (AIE).
1.10.1. Mechanism
The first AIE luminogen was hexaphenyl silole (HPS). Unlike conventional luminophores,
such as disk-shaped perylene [89], HPS is propeller shaped and non-planar. In a diluted
solution the aromatic rings of the luminophore rotate freely, dissipating the energy of the
excited state and causing the molecule to return to the ground state via non-radiative ways,
rendering it non-luminescent. In the aggregate state the π-π stacking that causes ACQ is
avoided by the propeller shape of HPS, while intramolecular rotations are restricted by
steric hindrance caused by the presence of other molecules in a crowded space. As a result
HPS is emissive in the aggregated state [89].
Scheme 1.2. Representation of the 3D structure of aggregation induced emission luminophore hexaphenyl silole.
1.11. Structure of this thesis
The present Chapter has summarized several concepts relevant for the understanding of
the results reported in Chapters 3-6.
Chapter 2 explains the techniques and instruments used in the characterization of polymers,
SCNPs, and products used or synthesized in this thesis.
Chapter 3 introduces a new model for the calculation of the size, apparent molar mass, and
shrinking factor of elastic SCNPs based on the length of the polymer chain, the monomer
fraction and the solvent quality. The model is used to understand the size of SCNPs on
different surfaces.
Chapter 1
24
In Chapter 4 we present the synthesis of enzyme-mimicking, iron containing, water soluble
SCNPs comprised of poly (oligo (ethylene glycol) methyl ether methacrylate-co-2-
acetoacetoxy ethyl methacrylate) [poly(OEGMA-co-AEMA)] copolymers by metal
coordination. These SCNPs will be used -for the first time- as catalysts for the synthesis of
intrinsically conducting polymer PEDOT: PSS dispersions via oxidative polymerization.
Chapter 5 shows the synthesis and characterization of fluorescent SCNPs by photoactivation
of poly (methyl methacrylate-co-2-acetoacetoxy ethyl methacrylate) [poly(MMA-co-
AEMA)] copolymers functionalized with diazo functional groups. Fluorescence emission is
produced by the addition of an aggregation induced emission (AIE) fluorophore with azide
moieties. Crosslinking in the SCNP is achieved by the cleavage of azide and diazo groups by
irradiating them with UV light.
Chapter 6 presents a route for synthesis and characterization of fluorescent poly(MMA-co-
AEMA) SCNPs based on the Hantzsch pyridine synthesis reaction. Orthogonal fluorophores
will allow for the reporting of both the folding and the aggregation of these SCNPs.
Intramolecular compaction and SCNP formation is identified by the formation of fluorescent
Hantzsch esters, while the addition of AIE luminophores with fluorescence at redshifted
wavelengths allows for the detection of intermolecular aggregation.
Finally, Chapter 7 summarizes the major conclusions of this thesis.
1.12. References
[1] P.J. Flory, Principles of polymer chemistry, Cornell University Press1953. [2] S.M. Bhattacharjee, A. Giacometti, A. Maritan, Flory theory for polymers, Journal of Physics: Condensed Matter, 25 (2013) 503101. [3] S. Perrier, 50th Anniversary Perspective: RAFT Polymerization—A User Guide, Macromolecules, 50 (2017) 7433-7447. [4] J. Chiefari, Y.K. Chong, F. Ercole, J. Krstina, J. Jeffery, T.P.T. Le, R.T.A. Mayadunne, G.F. Meijs, C.L. Moad, G. Moad, Living free-radical polymerization by reversible addition− fragmentation chain transfer: the RAFT process, Macromolecules, 31 (1998) 5559-5562. [5] G. Moad, J. Chiefari, Y.K. Chong, J. Krstina, R.T.A. Mayadunne, A. Postma, E. Rizzardo, S.H. Thang, Living free radical polymerization with reversible addition – fragmentation chain transfer (the life of RAFT), Polymer International, 49 (2000) 993-1001. [6] G. Moad, Y.K. Chong, A. Postma, E. Rizzardo, S.H. Thang, Advances in RAFT polymerization: the synthesis of polymers with defined end-groups, Polymer, 46 (2005) 8458-8468. [7] G. Inzelt, Conducting polymers: a new era in electrochemistry, Springer Science & Business Media2012. [8] A.K. Bakhshi, G. Bhalla, Electrically conducting polymers: Materials of the twentyfirst century, Journal of Scientific and Industrial Research, 63(09) (2004) 715-728. [9] H. Shirakawa, E.J. Louis, A.G. MacDiarmid, C.K. Chiang, A.J. Heeger, Synthesis of electrically conducting organic polymers: halogen derivatives of polyacetylene, (CH), Journal of the Chemical Society, Chemical Communications, (1977) 578-580. [10] P. Chandrasekhar, Conducting polymers, fundamentals and applications, Springer1999. [11] R. Balint, N.J. Cassidy, S.H. Cartmell, Conductive polymers: Towards a smart biomaterial for tissue engineering, Acta Biomaterialia, 10 (2014) 2341-2353. [12] G.M. Whitesides, Nanoscience, Nanotechnology, and Chemistry, Small, 1 (2005) 172-179.

Introduction
25
[13] C.P. Poole Jr, F.J. Owens, Introduction to nanotechnology, John Wiley & Sons2003. [14] A.P. Dowling, Development of nanotechnologies, Materials Today, 7 (2004) 30-35. [15] M. Vert, Y. Doi, K.-H. Hellwich, M. Hess, P. Hodge, P. Kubisa, M. Rinaudo, F. Schué, Terminology for biorelated polymers and applications (IUPAC Recommendations 2012), Pure and Applied Chemistry, 84 (2012) 377-410. [16] I. Khan, K. Saeed, I. Khan, Nanoparticles: Properties, applications and toxicities, Arabian Journal of Chemistry, 12 (2019) 908-931. [17] J.A. Pomposo, Single-Chain Polymer Nanoparticles: Synthesis, Characterization, Simulations, and Applications, John Wiley & Sons2017. [18] M. Gonzalez-Burgos, A. Latorre-Sanchez, J.A. Pomposo, Advances in single chain technology, Chemical Society Reviews, 44 (2015) 6122-6142. [19] Y. Inoue, P. Kuad, Y. Okumura, Y. Takashima, H. Yamaguchi, A. Harada, Thermal and Photochemical Switching of Conformation of Poly(ethylene glycol)-Substituted Cyclodextrin with an Azobenzene Group at the Chain End, Journal of the American Chemical Society, 129 (2007) 6396-6397. [20] B.V.K.J. Schmidt, N. Fechler, J. Falkenhagen, J.-F. Lutz, Controlled folding of synthetic polymer chains through the formation of positionable covalent bridges, Nature Chemistry, 3 (2011) 234-238. [21] Z. Ge, Y. Zhou, J. Xu, H. Liu, D. Chen, S. Liu, High-Efficiency Preparation of Macrocyclic Diblock Copolymers via Selective Click Reaction in Micellar Media, Journal of the American Chemical Society, 131 (2009) 1628-1629. [22] D. Mecerreyes, V. Lee, C.J. Hawker, J.L. Hedrick, A. Wursch, W. Volksen, T. Magbitang, E. Huang, R.D. Miller, A Novel Approach to Functionalized Nanoparticles: Self-Crosslinking of Macromolecules in Ultradilute Solution, Advanced Materials, 13 (2001) 204-208. [23] J. Tao, G. Liu, Polystyrene-block-poly(2-cinnamoylethyl methacrylate) Tadpole Molecules, Macromolecules, 30 (1997) 2408-2411. [24] R.K. Roy, J.-F. Lutz, Compartmentalization of Single Polymer Chains by Stepwise Intramolecular Cross-Linking of Sequence-Controlled Macromolecules, Journal of the American Chemical Society, 136 (2014) 12888-12891. [25] J. Romulus, M. Weck, Single-Chain Polymer Self-Assembly Using Complementary Hydrogen Bonding Units, Macromolecular Rapid Communications, 34 (2013) 1518-1523. [26] A.M. Hanlon, C.K. Lyon, E.B. Berda, What Is Next in Single-Chain Nanoparticles?, Macromolecules, 49 (2016) 2-14. [27] R. Chen, E.B. Berda, 100th Anniversary of Macromolecular Science Viewpoint: Re-examining Single-Chain Nanoparticles, ACS Macro Letters, 9 (2020) 1836-1843. [28] W. Kuhn, G. Balmer, Crosslinking of single linear macromolecules, Journal of Polymer Science, 57 (1962) 311-319. [29] A. Sanchez-Sanchez, I. Pérez-Baena, J.A. Pomposo, Advances in Click Chemistry for Single-Chain Nanoparticle Construction, Molecules, 18 (2013) 3339-3355. [30] N. Corrigan, K. Jung, G. Moad, C.J. Hawker, K. Matyjaszewski, C. Boyer, Reversible-deactivation radical polymerization (Controlled/living radical polymerization): From discovery to materials design and applications, Progress in Polymer Science, 111 (2020) 101311. [31] J.-S. Wang, K. Matyjaszewski, Controlled/"living" radical polymerization. atom transfer radical polymerization in the presence of transition-metal complexes, Journal of the American Chemical Society, 117 (1995) 5614-5615. [32] C.J. Hawker, A.W. Bosman, E. Harth, New Polymer Synthesis by Nitroxide Mediated Living Radical Polymerizations, Chemical Reviews, 101 (2001) 3661-3688. [33] D.M. Lynn, S. Kanaoka, R.H. Grubbs, Living Ring-Opening Metathesis Polymerization in Aqueous Media Catalyzed by Well-Defined Ruthenium Carbene Complexes, Journal of the American Chemical Society, 118 (1996) 784-790. [34] J.B. Beck, K.L. Killops, T. Kang, K. Sivanandan, A. Bayles, M.E. Mackay, K.L. Wooley, C.J. Hawker, Facile Preparation of Nanoparticles by Intramolecular Cross-Linking of Isocyanate Functionalized Copolymers, Macromolecules, 42 (2009) 5629-5635.

Chapter 1
26
[35] J.-H. Ryu, R.T. Chacko, S. Jiwpanich, S. Bickerton, R.P. Babu, S. Thayumanavan, Self-Cross-Linked Polymer Nanogels: A Versatile Nanoscopic Drug Delivery Platform, Journal of the American Chemical Society, 132 (2010) 17227-17235. [36] T.A. Croce, S.K. Hamilton, M.L. Chen, H. Muchalski, E. Harth, Alternative o-Quinodimethane Cross-Linking Precursors for Intramolecular Chain Collapse Nanoparticles, Macromolecules, 40 (2007) 6028-6031. [37] M. González-Burgos, A. Alegría, A. Arbe, J. Colmenero, J.A. Pomposo, An unexpected route to aldehyde-decorated single-chain nanoparticles from azides, Polymer Chemistry, 7 (2016) 6570-6574. [38] G.M. Green, N.P. Peet, W.A. Metz, Polystyrene-Supported Benzenesulfonyl Azide: A Diazo Transfer Reagent That Is Both Efficient and Safe, The Journal of Organic Chemistry, 66 (2001) 7930-7930. [39] C.K. Lyon, A. Prasher, A.M. Hanlon, B.T. Tuten, C.A. Tooley, P.G. Frank, E.B. Berda, A brief user's guide to single-chain nanoparticles, Polymer Chemistry, 6 (2015) 181-197. [40] O. Altintas, C. Barner-Kowollik, Single Chain Folding of Synthetic Polymers by Covalent and Non-Covalent Interactions: Current Status and Future Perspectives, Macromolecular Rapid Communications, 33 (2012) 958-971. [41] H.C. Kolb, M.G. Finn, K.B. Sharpless, Click Chemistry: Diverse Chemical Function from a Few Good Reactions, Angewandte Chemie International Edition, 40 (2001) 2004-2021. [42] L. Oria, R. Aguado, J.A. Pomposo, J. Colmenero, A Versatile “Click” Chemistry Precursor of Functional Polystyrene Nanoparticles, Advanced Materials, 22 (2010) 3038-3041. [43] M.K. Aiertza, I. Odriozola, G. Cabañero, H.-J. Grande, I. Loinaz, Single-chain polymer nanoparticles, Cellular and Molecular Life Sciences, 69 (2012) 337-346. [44] A. Sanchez-Sanchez, S. Akbari, A. Etxeberria, A. Arbe, U. Gasser, A.J. Moreno, J. Colmenero, J.A. Pomposo, “Michael” Nanocarriers Mimicking Transient-Binding Disordered Proteins, ACS Macro Letters, 2 (2013) 491-495. [45] O. Galant, M. Davidovich-Pinhas, C.E. Diesendruck, The Effect of Intramolecular Cross-Linking on Polymer Interactions in Solution, Macromolecular Rapid Communications, 39 (2018) 1800407. [46] A. Sanchez-Sanchez, J.A. Pomposo, Efficient Synthesis of Single-Chain Polymer Nanoparticles <i>via</i> Amide Formation, Journal of Nanomaterials, 2015 (2015) 723492. [47] I. Perez-Baena, I. Asenjo-Sanz, A. Arbe, A.J. Moreno, F. Lo Verso, J. Colmenero, J.A. Pomposo, Efficient Route to Compact Single-Chain Nanoparticles: Photoactivated Synthesis via Thiol–Yne Coupling Reaction, Macromolecules, 47 (2014) 8270-8280. [48] J.-M. Lehn, Dynamers: dynamic molecular and supramolecular polymers, Progress in Polymer Science, 30 (2005) 814-831. [49] A. Sanchez-Sanchez, A. Arbe, J. Colmenero, J.A. Pomposo, Metallo-Folded Single-Chain Nanoparticles with Catalytic Selectivity, ACS Macro Letters, 3 (2014) 439-443. [50] A. Sanchez-Sanchez, A. Arbe, J. Kohlbrecher, J. Colmenero, J.A. Pomposo, Efficient Synthesis of Single-Chain Globules Mimicking the Morphology and Polymerase Activity of Metalloenzymes, Macromolecular Rapid Communications, 36 (2015) 1592-1597. [51] S. Mavila, C.E. Diesendruck, S. Linde, L. Amir, R. Shikler, N.G. Lemcoff, Polycyclooctadiene Complexes of Rhodium(I): Direct Access to Organometallic Nanoparticles, Angewandte Chemie International Edition, 52 (2013) 5767-5770. [52] A. Sanchez-Sanchez, J.A. Pomposo, Single-Chain Polymer Nanoparticles via Non-Covalent and Dynamic Covalent Bonds, Particle & Particle Systems Characterization, 31 (2014) 11-23. [53] T. Maeda, H. Otsuka, A. Takahara, Dynamic covalent polymers: Reorganizable polymers with dynamic covalent bonds, Progress in Polymer Science, 34 (2009) 581-604. [54] P. Chakma, D. Konkolewicz, Dynamic Covalent Bonds in Polymeric Materials, Angewandte Chemie International Edition, 58 (2019) 9682-9695. [55] A. Wilson, G. Gasparini, S. Matile, Functional systems with orthogonal dynamic covalent bonds, Chemical Society Reviews, 43 (2014) 1948-1962.

Introduction
27
[56] B.T. Tuten, D. Chao, C.K. Lyon, E.B. Berda, Single-chain polymer nanoparticles via reversible disulfide bridges, Polymer Chemistry, 3 (2012) 3068-3071. [57] A.W. Jackson, D.A. Fulton, Making polymeric nanoparticles stimuli-responsive with dynamic covalent bonds, Polymer Chemistry, 4 (2013) 31-45. [58] B.S. Murray, D.A. Fulton, Dynamic Covalent Single-Chain Polymer Nanoparticles, Macromolecules, 44 (2011) 7242-7252. [59] A. Sanchez-Sanchez, D.A. Fulton, J.A. Pomposo, pH-responsive single-chain polymer nanoparticles utilising dynamic covalent enamine bonds, Chemical Communications, 50 (2014) 1871-1874. [60] D. Drahoňovský, J.-M. Lehn, Hemiacetals in Dynamic Covalent Chemistry: Formation, Exchange, Selection, and Modulation Processes, The Journal of Organic Chemistry, 74 (2009) 8428-8432. [61] A. Latorre-Sánchez, J.A. Pomposo, Recent bioinspired applications of single-chain nanoparticles, Polymer International, 65 (2016) 855-860. [62] J.A. Pomposo, Bioinspired single-chain polymer nanoparticles, Polymer International, 63 (2014) 589-592. [63] J. Rubio-Cervilla, E. González, J.A. Pomposo, Advances in Single-Chain Nanoparticles for Catalysis Applications, Nanomaterials, 7 (2017) 341. [64] H. Rothfuss, N.D. Knöfel, P.W. Roesky, C. Barner-Kowollik, Single-Chain Nanoparticles as Catalytic Nanoreactors, Journal of the American Chemical Society, 140 (2018) 5875-5881. [65] M. Huo, N. Wang, T. Fang, M. Sun, Y. Wei, J. Yuan, Single-chain polymer nanoparticles: Mimic the proteins, Polymer, 66 (2015) A11-A21. [66] R. Zeng, L. Chen, Q. Yan, CO2-Folded Single-Chain Nanoparticles as Recyclable, Improved Carboxylase Mimics, Angewandte Chemie International Edition, 59 (2020) 18418-18422. [67] I. Perez-Baena, F. Barroso-Bujans, U. Gasser, A. Arbe, A.J. Moreno, J. Colmenero, J.A. Pomposo, Endowing Single-Chain Polymer Nanoparticles with Enzyme-Mimetic Activity, ACS Macro Letters, 2 (2013) 775-779. [68] M.A.J. Gillissen, I.K. Voets, E.W. Meijer, A.R.A. Palmans, Single chain polymeric nanoparticles as compartmentalised sensors for metal ions, Polymer Chemistry, 3 (2012) 3166-3174. [69] A. Latorre-Sanchez, J.A. Pomposo, A simple, fast and highly sensitive colorimetric detection of zein in aqueous ethanol via zein–pyridine–gold interactions, Chemical Communications, 51 (2015) 15736-15738. [70] A.K. Mishra, Nanomedicine for drug delivery and therapeutics, John Wiley & Sons2013. [71] J. Rubio-Cervilla, E. González, J.A. Pomposo, Applications of Single-Chain Polymer Nanoparticles, in: J.A. Pomposo (Ed.) Single-Chain Polymer Nanoparticles: Synthesis, Characterization, Simulations, and Applications., Wiley-VCH, Weinheim, Germany, 2017, pp. 341-400. [72] G. Njikang, G. Liu, L. Hong, Chiral Imprinting of Diblock Copolymer Single-Chain Particles, Langmuir, 27 (2011) 7176-7184. [73] S.K. Hamilton, E. Harth, Molecular Dendritic Transporter Nanoparticle Vectors Provide Efficient Intracellular Delivery of Peptides, ACS Nano, 3 (2009) 402-410. [74] R.J. Passarella, D.E. Spratt, A.E. van der Ende, J.G. Phillips, H. Wu, V. Sathiyakumar, L. Zhou, D.E. Hallahan, E. Harth, R. Diaz, Targeted Nanoparticles That Deliver a Sustained, Specific Release of Paclitaxel to Irradiated Tumors, Cancer Research, 70 (2010) 4550. [75] I. Perez-Baena, I. Loinaz, D. Padro, I. García, H.J. Grande, I. Odriozola, Single-chain polyacrylic nanoparticles with multiple Gd(iii) centres as potential MRI contrast agents, Journal of Materials Chemistry, 20 (2010) 6916-6922. [76] X. Zhang, S. Wang, L. Xu, L. Feng, Y. Ji, L. Tao, S. Li, Y. Wei, Biocompatible polydopamine fluorescent organic nanoparticles: facile preparation and cell imaging, Nanoscale, 4 (2012) 5581-5584.

Chapter 1
28
[77] J. De-La-Cuesta, J.A. Pomposo, Photoactivation of Aggregation-Induced Emission Molecules for Fast and Efficient Synthesis of Highly Fluorescent Single-Chain Nanoparticles, ACS Omega, 3 (2018) 15193-15199. [78] J. Willenbacher, K.N.R. Wuest, J.O. Mueller, M. Kaupp, H.-A. Wagenknecht, C. Barner-Kowollik, Photochemical Design of Functional Fluorescent Single-Chain Nanoparticles, ACS Macro Letters, 3 (2014) 574-579. [79] B. Valeur, M.N. Berberan-Santos, A Brief History of Fluorescence and Phosphorescence before the Emergence of Quantum Theory, Journal of Chemical Education, 88 (2011) 731-738. [80] G.G. Stokes, XXX. On the change of refrangibility of light, Philosophical Transactions of the Royal Society of London, 142 (1852) 463-562. [81] J.R. Lakowicz, Introduction to Fluorescence, in: J.R. Lakowicz (Ed.) Principles of Fluorescence Spectroscopy, Springer US, Boston, MA, 2006, pp. 1-26. [82] J.R. Lakowicz, Fluorescence Sensing, in: J.R. Lakowicz (Ed.) Principles of Fluorescence Spectroscopy, Springer US, Boston, MA, 2006, pp. 623-673. [83] M. Chalfie, Green Fluorescent Protein, Photochemistry and Photobiology, 62 (1995) 651-656. [84] J. Rietdorf, Microscopy techniques, 2005. [85] A.M. Brouwer, Standards for photoluminescence quantum yield measurements in solution (IUPAC Technical Report), Pure and Applied Chemistry, 83 (2011) 2213-2228. [86] J. Mei, N.L.C. Leung, R.T.K. Kwok, J.W.Y. Lam, B.Z. Tang, Aggregation-Induced Emission: Together We Shine, United We Soar!, Chemical Reviews, 115 (2015) 11718-11940. [87] T. Förster, K. Kasper, Ein Konzentrationsumschlag der Fluoreszenz des Pyrens, Zeitschrift für Elektrochemie, Berichte der Bunsengesellschaft für physikalische Chemie, 59 (1955) 976-980. [88] J.B. Birks, Photophysics of aromatic molecules, 1970. [89] Y. Hong, J.W.Y. Lam, B.Z. Tang, Aggregation-induced emission, Chemical Society Reviews, 40 (2011) 5361-5388. [90] J. Luo, Z. Xie, J.W.Y. Lam, L. Cheng, H. Chen, C. Qiu, H.S. Kwok, X. Zhan, Y. Liu, D. Zhu, B.Z. Tang, Aggregation-induced emission of 1-methyl-1,2,3,4,5-pentaphenylsilole, Chemical Communications, (2001) 1740-1741.

Chapter 2: Experimental Techniques


Experimental Techniques
31
2.1. Motivation
In this Chapter, the techniques and instruments used in the characterization of polymers,
single-chain polymer nanoparticles, and products used or synthesized in this thesis are explained.
2.2. Size exclusion chromatography / Gel permeation chromatography
Size exclusion chromatography (SEC) is a chromatographic method that separates
molecules according to their size. It was first developed in 1955 by Lathe and Ruthven [1].
Gel permeation chromatography (GPC) is a type of SEC introduced by J.C. Moore of the Dow
Chemical Company in 1964 [2] to separate polymers. Soon it was discovered that this
method provided good molar mass distribution (Mw) information for polymers. Because of
this GPC is widely used for polymer characterization.
GPC is used primarily for the analysis of large molecules such as polymers and proteins. This
technique separates molecules based on the hydrodynamic radius of the analyte. The
differentiation takes place in a porous column which typically consists of a hollow tube
tightly packed with polymer beads containing microscopic pores of different sizes called the
stationary phase. The smaller molecules become trapped in the pores more easily and spend
more time there, needing longer times to elute. This increases their retention time. Large
molecules are too big to enter the pores and are eluted quickly, separating them from the
smaller ones.
Theoretically, in the SEC mode of separation the analyte molecules do not interact with the
surface of the stationary phase. Due to this lack of interactions, the separation of the analyte
depends only on the hydrodynamic volume of the solute rather than the chemical or
electrostatic interactions between the phases.
The concentration by weight of the polymer is monitored continuously with a detector. The
concentration in each part of the chromatogram can be measured by refractive index (RI),
UV or light scattering detectors. The molar mass of the polymer is measured either directly
by a multi-angle laser light scattering (MALLS) detector or indirectly by calibrating the
column. A chromatogram is generated, which consists of a weight distribution of the
polymer as a function of the retention time. The shape of the peak depends on the dispersity
(Ɖ) of the polymer: disperse samples (Ɖ >> 1) form wide peaks, while when the peaks are
narrow the sample is near monodisperse (Ɖ ≈ 1).
Refractive index detectors measure changes in the refractive index of the solution. Changes
in the refractive index of the solution (n) are proportional to the solute concentration (c)
according to
(2.1)
𝑛 ∝ 𝑛0 + 𝑐(𝑛𝑝 − 𝑛0)
where np is the refractive index of the solute and n0 the refractive index of the solvent.

Chapter 2
32
A method to calculate the molecular mass distribution of polymer samples is to construct a
calibration curve, which is created by plotting the molar mass of monodisperse standards
of known molecular weight vs. the retention time in the column. Using this curve, the
molecular weight of the sample can be interpolated from its retention time.
MALLS is used to determine the absolute molecular weight of polymers. This technique
allows to measure the mass and size of molecules independently of the retention time and
without need for calibration. The intensity of the scattered light (Is) is dependent on the
molar mass (M), the solute concentration (c), and the differential refractive index (dn/dc)
of the solute
(2.2)
𝐼𝑠 ∝ 𝑀𝑐 (𝑑𝑛
𝑑𝑐)2
The hydrodynamic volume (Vh) and the hydrodynamic radius (Rh) of the polymer can be
measured with the help of viscometers according to the Einstein viscosity relation [3]
(2.3)
𝑉ℎ =𝑀[𝜂]
2.5𝑁𝐴
where [η] is the viscosity of the solution and NA is Avogadro’s number.
The relation between viscosity and molar mass is given by the Mark-Howink-Sakurada
equation
(2.4)
[𝜂] = 𝐾𝑀𝛼
where K and α are constants specific to the solvent- polymer system that give information
about the conformation of the polymer. These parameters be calculated plotting [η] and M.
GPC can be used for the monitoring of the formation of SCNPs. Polymeric nanoparticles have
a smaller hydrodynamic radius compared to the precursor polymer due to the collapse of
the polymer chain upon intra-chain crosslinking. The formation of SCNPs is indicated by an
increase in the retention time compared to the precursor polymer [4].
The samples were dissolved in THF and filtered before injecting them in the chromatograph.
GPC measurements were performed in an Agilent 1200 GPC-SEC Analysis system equipped
with Wyatt light scattering miniDawnTreos, a ViscoStar II differential viscometer and a
Optilab rEX Refractive Index Detector (Figure 2.1).

Experimental Techniques
33
Figure 2.1. GPC equipment used in this work.
2.3. Nuclear magnetic resonance
Nuclear magnetic resonance (NMR) is a spectroscopic technique in which atomic nuclei in
a strong magnetic field are perturbed by a weak oscillating magnetic field, resulting in the
production of an electromagnetic signal with a frequency dependent on the magnetic field
on the nucleus.
Nuclear particles like protons and neutrons have a spin. In nuclei with an odd number of
protons or neutrons the spins pf the particles are not cancelled, resulting in an overall
nuclear spin. In the absence of an external magnetic field, all spin states have the same
energy. However, when an external magnetic field is applied, spin states aligned with the
magnetic field are more stable and have less energy than anti-aligned states. The difference
between both energy levels is proportional to the intensity of the magnetic field.
A weak oscillating magnetic field in the form of radio waves induces the excitation of the
nuclei and a transition between the spin energy levels, producing an electromagnetic signal.
The resonance frequency is directly proportional to the magnetic field around the nucleus.
This magnetic field is shielded by the magnetic fields induced by other nuclei and electrons
in the molecule, giving information about the chemical environment of atoms.
The resonant frequency of the signals change with the intensity of the applied magnetic
field. To eliminate this dependence a reference frequency is employed, that corresponds to
that observed for tetramethylsilane. The chemical shift (δ) of the analyte relative to the
reference frequency is calculated in equation (2.5), where ν is the resonant frequency of the
analyte and ν0 the frequency of the reference [5].
(2.5)
𝛿 =𝜈 − 𝜈0
𝜈0
The nuclei most commonly used in NMR are 1H and 13C.
1H NMR spectra were recorded at r.t. on a Bruker spectrometer operating at 400 MHz
(Figure 2.2), using CDCl3 as a solvent and tetramethylsilane as internal reference.

Chapter 2
34
Figure 2.2. NMR equipment used in this work.
2.4. Fourier transform infrared spectroscopy
Fourier transform infrared spectroscopy (FTIR) is a spectroscopy technique used to
measure the absorption of a sample in the infrared (IR) range of the spectrum. Absorption
in the IR range is due to the transition between different vibrational energy levels of the
molecule. Only the vibration modes that change the dipole moment are active. The
frequencies of the vibrations are related to the strength of the bond and the mass of the
atoms forming the bond.
In FTIR measurements, the sample is irradiated simultaneously with the entire range of
frequencies, reducing the time needed for the experiment. The sample is commonly mixed
with a non-absorbing salt (usually KBr) to form a pellet that is crossed by the light beam.
The development of attenuated total reflection (ATR) allowed to simplify the sample
preparation procedure. In ATR the sample is placed in direct contact with a crystal. The light
passes through the crystal reflecting on the sample and producing evanescent waves that
extend into the sample, and after multiple reflections the light is collected. After collection
the light passes through an interferometer (normally a Michelson interferometer), where
the beam is separated into 2 by a beam-splitter, reflected back by 2 mirrors and directed
toward the detector. One of the mirrors is fixed while the other is moving, resulting in a
difference in the optical path length that changes with time. This produces an interferogram
where each wavelength is periodically blocked or transmitted due to wave interference,
with a maximum at the zero retardation position where interference is constructive in all
wavelengths. The detector receives a different spectrum each moment and a computer
converts the raw data into the actual spectrum through a Fourier transform mathematical
process [6].
FTIR spectra were recorded in a FT-IR JASCO 6360 (130-400K) infrared spectrometer
(Figure 2.3).
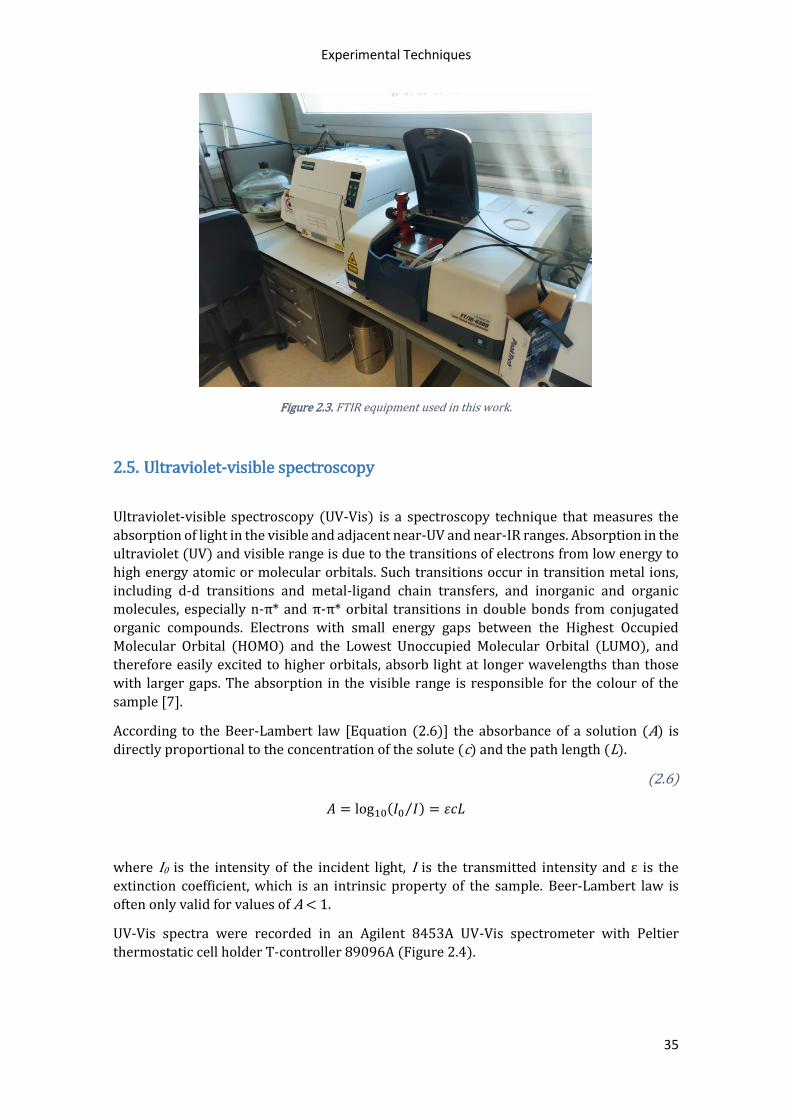
Experimental Techniques
35
Figure 2.3. FTIR equipment used in this work.
2.5. Ultraviolet-visible spectroscopy
Ultraviolet-visible spectroscopy (UV-Vis) is a spectroscopy technique that measures the
absorption of light in the visible and adjacent near-UV and near-IR ranges. Absorption in the
ultraviolet (UV) and visible range is due to the transitions of electrons from low energy to
high energy atomic or molecular orbitals. Such transitions occur in transition metal ions,
including d-d transitions and metal-ligand chain transfers, and inorganic and organic molecules, especially n-π* and π-π* orbital transitions in double bonds from conjugated
organic compounds. Electrons with small energy gaps between the Highest Occupied
Molecular Orbital (HOMO) and the Lowest Unoccupied Molecular Orbital (LUMO), and
therefore easily excited to higher orbitals, absorb light at longer wavelengths than those
with larger gaps. The absorption in the visible range is responsible for the colour of the
sample [7].
According to the Beer-Lambert law [Equation (2.6)] the absorbance of a solution (A) is
directly proportional to the concentration of the solute (c) and the path length (L).
(2.6)
𝐴 = log10(𝐼0 𝐼⁄ ) = 휀𝑐𝐿
where I0 is the intensity of the incident light, I is the transmitted intensity and ε is the
extinction coefficient, which is an intrinsic property of the sample. Beer-Lambert law is
often only valid for values of A < 1.
UV-Vis spectra were recorded in an Agilent 8453A UV-Vis spectrometer with Peltier
thermostatic cell holder T-controller 89096A (Figure 2.4).

Chapter 2
36
Figure 2.4. UV-Vis equipment used in this work.
2.6. Fluorescence spectroscopy
Fluorescence spectroscopy is a spectroscopic technique that analyses samples based on
their fluorescent properties.
Fluorescence spectroscopy, like UV-Vis spectroscopy, is based on the electronic transitions,
but it is focused on the emission rather than the absorption of light. Within each electronic
level there are different vibrational levels. When a fluorescent molecule absorbs a photon
of a certain wavelength an electron is promoted to a higher energy level and the molecule
adopts a higher vibrational energy state. Then the molecules collide with other molecules
causing them to lose energy and return to the lowest vibrational energy state inside the
excited state. When the excited molecule returns to the ground state it emits a photon with
a longer wavelength than the absorbed one. This process can be visualized in a Jablonsky
energy diagram (Figure 2.5) [8].
Figure 2.5. Representation of a Jablonsky diagram.

Experimental Techniques
37
This change in the frequency of emitted photons is called Stokes shift and occurs in most
fluorophore solutions. It is caused by the rapid decay of excited electrons to the lowest
vibrational level of the excited state. The shift is measured as the difference between the
wavelengths of the maxima of the excitation and emission spectra. This phenomenon blocks
excitation light from reaching the detector, allowing higher precision measurements.
Excitation of a fluorophore with a single wavelength of maximum absorption while scanning
all wavelengths produces the emission spectrum and scanning through the absorption
spectrum while recording the emission intensity at a single wavelength (usually the
wavelength of maximum emission intensity) generates the excitation spectrum. The
emission spectrum for many common fluorophores looks like the mirror image of the
excitation spectrum due to the similarity of the vibrational levels of the ground state and
the excited state. The emission spectrum is independent of the excitation energy
(wavelength) as a consequence of rapid internal conversion from higher initial excited
states to the lowest vibrational energy level of the excited state [9].
In a fluorescence spectrometer, a light from the source passes through a monochromator to
select the excitation wavelength. The light is directed toward the fluorophore sample
producing fluorescence. The intensity of fluorescence is measured by a detector placed at a
90º angle to avoid interference from the excitation light [10].
Fluorescence spectra were recorded at r.t. on an Agilent Cary Eclipse spectrometer at an
excitation wavelength of 365 nm (Figure 2.6).
Figure 2.6. Fluorescence spectroscopy equipment used in this work.
2.7. Dynamic light scattering
Dynamic light scattering (DLS) is a technique used to determine the distribution of sizes of
small particles in suspension and polymer solutions, dispersions and emulsions.

Chapter 2
38
In order to measure the sample a monochromatic light source, normally a laser, is shot
through the sample. When the light hits small particles it scatters in all directions if the
particles are small in relation to the wavelength. The diffracted light from all the molecules
interferes, either constructively or destructively, creating interference patterns. Then, this
scattered light is recorded by a detector at a fixed angle. The Brownian motion of the small
molecules in the sample causes the scattering intensities of a monochromatic light to vary
with time, giving information about the time scale of movement of the scatters. These
fluctuations are then recorded by the autocorrelator that compares the intensity of light at
each point over time and from this information a correlation function is created. After a
short time interval the intensity is virtually unchanged and the correlation remains high. At
longer time delays, however, the correlation decays exponentially, meaning that after a long
period there is no correlation between the intensity of the initial and final states. Small
particles cause the intensity of the scattered light to fluctuate in shorter time-scales, while
larger particles have more difficulty for diffusion and change the intensity slower [11]. According to the Stokes-Einstein equation [equation (2.7)], the diffusion coefficient (D) is
inversely proportional to the radius (R) of the particle.
(2.7)
𝐷 =𝑘𝐵𝑇
6𝜋𝜂𝑅
Where η is the viscosity, kB the Boltzmann constant and T the absolute temperature [12].
DLS measurements were performed in a Malvern Zetasizer Nano apparatus (Figure 2.7).
Figure 2.7. DLS equipment used in this work.
2.8. Transmission electron microscopy

Experimental Techniques
39
Transmission electron microscopy (TEM) is a microscopy technique in which a beam of
electrons is transmitted through a thin sample to form an image. The transmission electron
microscope was developed by Knoll and Ruska in 1932, for which Ruska was awarded the
Nobel Prize in 1986. In TEM, electrons from an electron gun are focused into a narrow beam
by magnetic lenses and directed toward the sample. Transmitted electrons reach a
fluorescent screen where an image is projected. The image contrasts depends on the density
of the sample material. High atom densities and atoms with high atomic numbers produce
more scattering events that result in fewer electrons reaching the detector. TEM allows to
take images with a resolution much higher than that of optical microscopes due to electrons
having a De Broglie wavelength orders of magnitude smaller than that of visible light,
allowing them to take images with atom level resolution [13].
TEM measurements were performed using a high-resolution transmission electron
microscope TECNAI G220 TWIN (Figure 2.8). The measurements were carried out using an
accelerating voltage of 200 kV under low dose conditions.
Figure 2.8. TEM equipment used in this work.
2.9. Elemental Analysis
Elemental Analysis (EA) is a process where presence and the proportions of chemical
elements present in a sample are measured. In organic chemistry, the most common type of
EA is CHNS analysis, where mass fractions of carbon, hydrogen, nitrogen, and sulphur are
determined. The technique for CHNS analysis is usually combustion analysis, where the
sample is burned and the combustion products; CO2, H2O, NO, and SO2; are collected and
weighted. The composition of the sample is calculated from the obtained product masses
[14].

Chapter 2
40
EA measurements were performed in a Euro EA3000 elemental analyser (CHNS) (Figure
2.9).
Figure 2.9. EA equipment used in this work.
2.10. X-ray scattering
X-ray scattering is a family of techniques used to study the structure, composition and
physical properties of materials. Scattering is produced by the movement of the electronic
cloud in atoms caused by incident electromagnetic waves, resulting in the re-radiation of
these waves. These techniques are based on the observation and measurement of the
scattering intensity of an X-ray beam hitting a sample as a function of the incident and
scattering angle.
X-ray scattering can be elastic, where the energy of incident and scattered photons does not
change, or inelastic, where energy is transferred from the X-rays to the sample. Elastic X-
ray scattering techniques are classified according to their scattering angle. As the scattering
angle provides information about the reciprocal space, the variation of electronic density at
nanometre length scales cause the beams to scatter at low angles, while at atomic size scales
it scatters at high angles [15].
2.10.1. Small angle X-ray scattering
Small angle X-Ray scattering (SAXS) is a small angle scattering technique used to
characterize nanostructures with a resolution of nanometres. It can be used to determine
the size, distribution and shape of nanoparticles and macromolecules [16]. It measures the

Experimental Techniques
41
scattering caused on an X-ray beam when travelling through the sample at small angles
(0.1º to 10º).
The first principles of SAXS were developed by Guinier in the 1930s for the study of metallic
alloys [17]. In 1955 Guinier and Fournet demonstrated that the method yields not just
information on the sizes and shapes of particles but also on the internal structure of
disordered and partially ordered systems [18]. In the 1960s the method become important
for the study of biological macromolecules and in the 1970s a breakthrough was achieved
with the use of synchrotron radiation as the X-ray source, which provided a higher X-ray
flux [19].
In a SAXS instrument a monochromatic beam of X-rays travels through the sample. Most of
the X-rays do not interact with the sample, but some are scattered. A scattering pattern is
formed in the detector, which is situated behind the sample. The high intensity produced by
the main beam is blocked in order to detect the weak scattered intensity. The 2D data
collected on the detector is reduced by converting the position of each pixel in the image
into scattering angle 2θ or scattering vector q according to
(2.8)
𝑞 = (4𝜋 sin𝜃) 𝜆⁄
where λ is the wavelength of the X-rays. The intensity of the scattering is plotted as a
function of q [15]. The scattering intensity I(q) is the product of the from factor P(q), which depends on the size and shape of the particles, and the structure factor S(q), which
depends on the interactions between particles. In the case of SCNPs in solution, SAXS is
employed for a precise determination of the values of radius of gyration, Rg, and scaling
exponent, ν.
If 𝑈 =(2𝜈+1)(2𝜈+2)
6𝑞2𝑅𝑔
2
and 𝛾(𝑎, 𝑥) = ∫ 𝑡𝑎−1𝑥
0𝑒𝑥𝑝(−𝑡)𝑑𝑡
the generalized Gaussian coil function [20] is given by:
(2.9)
𝑃(𝑞) =1
𝜈𝑈1 2𝜈⁄𝛾 (
1
2𝜈, 𝑈) −
1
𝜈𝑈1 𝜈⁄𝛾 (
1
𝜈, 𝑈)
SAXS measurements were performed on a Rigaku PSAXS-L SAXS instrument (Figure 2.10).

Chapter 2
42
Figure 2.10. SAXS equipment used in this work
2.11. Thermogravimetric analysis
Thermogravimetric analysis (TGA) is a technique that measures the mass change of a
material as a result of changes in temperature. It is used to determine characteristics of a
materials that loss or gain mass due to decomposition, oxidation or loss of volatiles. Its
applications are the analysis of degradation mechanisms and kinetics, and the
determination of organic and inorganic content of a sample [21].
TGA measurements were performed in a Q500, TA Instruments Thermogravimetric
analyser (Figure 2.11).

Experimental Techniques
43
Figure 2.11. TGA equipment used in this work.
2.12. Inductively coupled plasma atomic emission spectroscopy
Inductively coupled plasma atomic emission spectroscopy (ICP-AES) is an analytical
technique used for the detection of chemical elements, often metal atoms in solution. This
technique uses inductively coupled plasma to excite atoms and ions that then emit light at
characteristic wavelengths.
In a plasma source, a gas (usually argon) is ionized forming a plasma. The free electrons are
accelerated by an electromagnetic field, producing more ions and heating the plasma to
6000-10000K. Then, the sample is introduced into the flame. The heat of the plasma breaks
the chemical bonds of the sample molecules, and the free atoms are excited into excited
electronic states. When the excited electrons return to the ground state, they emit photons
of a frequency characteristic to each element. This light is detected by a spectrometer [22].
ICP-AES was performed on an Agilent 7700X spectrometer (Figure 2.12).

Chapter 2
44
Figure 2.12. ICP-AES equipment used in this work.
2.13. Atomic force microscopy
Atomic force microscopy (AFM) is a type of scanning probe microscopy that allows to see
surfaces with a resolution in the order of fractions of a nanometre.
The atomic force microscope was developed by Binnig, Quate, and Gerber at IBM labs in
1985 [23]. AFM consists of a cantilever with a very sharp tip. This tip scans the surface of
the sample. When the tip approaches a surface interactions (Van der Waals, electric…)
between the tips and the sample cause the cantilever to deflect toward or away from the
sample. A laser beam is reflected on the cantilever towards a detector. Cantilever deflections
cause the direction of the reflected beam to change. These changes allow a feedback-loop
mechanism to adjust the height of the tip over the surface, creating a topographic map of
the surface [24, 25].
AFM measurements were performed using a Multimode AFM, equipped with a Nanoscope
V controller (Bruker) (Figure 2.13).

Experimental Techniques
45
Figure 2.13. AFM equipment used in this work.
2.14. Conductivity measurements
The 4-point-probe is the standard method for the measurement of electric resistivity in thin
films. The probe consists in four equally spaced conducting tips placed on a line on the
sample film. An electric current is applied between the outer probes and the current is
measured by a voltmeter connected to the inner probes [26, 27].
Conductivity of thin films was measured using a 4-point probe setup (HFS600-P, Linkam)
(Figure 2.14) and an Alpha impedance analyser (Novocontrol).

Chapter 2
46
Figure 2.14. A 4-point probe setup.
2.15. UV irradiation
UV irradiation experiments were performed with UV irradiation experiments were
performed in i) a Hamamatsu LightningCure spot light source Model LC8 L9588 (Figure
2.15) and ii) a Penn PhD Photoreactor M2 (Penn Photon Devices, LLC). The equipment
consisted of a Hg−Xe Lamp equipped with an A9616-05 filter (the transmittance
wavelength was 300−400 nm with the maximum at 365 nm; the transmitted intensity was
80%) and the corresponding UV-light guide. The intensity of the UV light was 3.5 W/cm2.

Experimental Techniques
47
Figure 2.15. UV light source equipment used in this work.
2.16. References
[1] G.H. Lathe, C.R.J. Ruthven, The separation of substances and estimation of their relative molecular sizes by the use of columns of starch in water, Biochemical Journal, 62 (1956) 665-674. [2] J.C. Moore, Gel permeation chromatography. I. A new method for molecular weight distribution of high polymers, Journal of Polymer Science Part A: General Papers, 2 (1964) 835-843. [3] M.P.J. Dohmen, A.M. Pereira, J.M.K. Timmer, N.E. Benes, J.T.F. Keurentjes, Hydrodynamic Radii of Polyethylene Glycols in Different Solvents Determined from Viscosity Measurements, Journal of Chemical & Engineering Data, 53 (2008) 63-65. [4] A. Latorre-Sánchez, A. Alegría, F. Lo Verso, A.J. Moreno, A. Arbe, J. Colmenero, J.A. Pomposo, A Useful Methodology for Determining the Compaction Degree of Single-Chain Nanoparticles by Conventional SEC, Particle & Particle Systems Characterization, 33 (2016) 373-381. [5] R.K. Harris, Nuclear magnetic resonance spectroscopy, John Wiley and Sons Inc.,New York, NY, United States, 1986. [6] O. Faix, Fourier Transform Infrared Spectroscopy, in: S.Y. Lin, C.W. Dence (Eds.) Methods in Lignin Chemistry, Springer Berlin Heidelberg, Berlin, Heidelberg, 1992, pp. 83-109. [7] B.M. Weckhuysen, Ultraviolet-visible spectroscopy, in: J. van Bokhoven, T. Ressler, F.M. de Groot, A. Knop-Gericke (Eds.) In-situ Spectroscopy of Catalysts, American Scientific Publishers2004, pp. 255-270. [8] J.R. Lakowicz, Introduction to fluorescence, Principles of fluorescence spectroscopy, Springer1999, pp. 1-23.

Chapter 2
48
[9] B. Herman, V.E. Centonze Frohlich, J.R. Lakowicz, D.B. Murphy, K.R. Spring, M.W. Davidson, Fluorescence microscopy: basic concepts in fluorescence, Florida State University, 2003, pp. 2017. [10] A. Sharma, S.G. Schulman, Introduction to fluorescence spectroscopy, Wiley Analytical Science, New York, 1999. [11] W.I. Goldburg, Dynamic light scattering, American Journal of Physics, 67 (1999) 1152-1160. [12] M. Sartor, Dynamic light scattering to determine the radius of small beads in Brownian motion in a solution, University of California San Diego, 2003, pp. 1-21. [13] D.B. Williams, C.B. Carter, The Transmission Electron Microscope, in: D.B. Williams, C.B. Carter (Eds.) Transmission Electron Microscopy: A Textbook for Materials Science, Springer US, Boston, MA, 1996, pp. 3-17. [14] F. Pregl, Quantitative micro-analysis of organic substances, Nobel Lectures, World Scientific Publishing Co., 1923. [15] T. Li, A.J. Senesi, B. Lee, Small Angle X-ray Scattering for Nanoparticle Research, Chemical Reviews, 116 (2016) 11128-11180. [16] B. Chu, B.S. Hsiao, Small-Angle X-ray Scattering of Polymers, Chemical Reviews, 101 (2001) 1727-1762. [17] A. Guinier, La diffraction des rayons X aux très petits angles : application à l'étude de phénomènes ultramicroscopiques, Ann. Phys., 11 (1939) 161-237. [18] A. Guinier, G. Fournet, K.L. Yudowitch, Small-angle scattering of X-rays, (1955). [19] D.I. Svergun, M.H.J. Koch, Small-angle scattering studies of biological macromolecules in solution, Reports on Progress in Physics, 66 (2003) 1735-1782. [20] B. Hammouda, Small-Angle Scattering From Branched Polymers, Macromolecular Theory and Simulations, 21 (2012) 372-381. [21] S. Vyazovkin, Thermogravimetric Analysis, Characterization of Materials2012, pp. 1-12. [22] T.J. Manning, W.R. Grow, Inductively coupled plasma-atomic emission spectrometry, The chemical educator, 2 (1997) 1-19. [23] G. Binnig, C.F. Quate, C. Gerber, Atomic Force Microscope, Physical Review Letters, 56 (1986) 930-933. [24] D. Rugar, P. Hansma, Atomic force microscopy, Physics today, 43 (1990) 23-30. [25] P. Eaton, P. West, Atomic force microscopy, Oxford university press2010. [26] J.C. Li, Y. Wang, D.C. Ba, Characterization of Semiconductor Surface Conductivity by Using Microscopic Four-Point Probe Technique, Physics Procedia, 32 (2012) 347-355. [27] A.P. Schuetze, W. Lewis, C. Brown, W.J. Geerts, A laboratory on the four-point probe technique, American Journal of Physics, 72 (2004) 149-153.

Chapter 3: Size of Elastic Single-Chain
Nanoparticles in Solution and on Surfaces


Size of Elastic Single-Chain Nanoparticles in Solution and on Surfaces
51
3.1. Motivation
To understand the complexity of single-chain polymer nanoparticles (SCNPs) as intricate
soft nano-objects with potential applications in a variety of fields we can make use of
physical models of different complexity degrees. In this Chapter, a simple model of SCNPs
that allows one to reproduce the structure of these nano-objects both in solution and on
surfaces is developed. The model deals with SCNPs with covalent (permanent) intra-chain
bonds.
3.2. Introduction
The folding of individual synthetic polymer chains (precursors) to single-chain polymer
nanoparticles (SCNPs) is reminiscent of protein folding to its functional, native state and is
attracting significant interest in recent years [1-3]. The self-folding process can be driven
by different intramolecular interactions such as noncovalent, covalent, and dynamic
covalent bonds by using well-defined precursors decorated with appropriate functional
groups and experimental conditions such that inter-chain coupling events are minimized to
a large extent [4-13]. The resulting SCNPs are useful soft nano-objects with potential
applications in nanomedicine [14-17], biosensing [18, 19], and catalysis [20-23], among
other different fields. [24-39] Theoretical models providing a connection between both the
amount of functional groups, x, and precursor molar mass, M, with the size of the resulting
SCNPs are of great interest to establish useful structure−property relationships. In
particular, relevant parameters for end-use applications such as surface area, intrinsic
viscosity, and diffusion coefficient do depend on SCNP size.
Recently, a model providing the expected size reduction upon folding single chains of size
R0 to SCNPs of size R by means of reversible interactions (noncovalent bonds) as a function
of x and M has been introduced [40]. This simple model affords a valuable a priori
estimation of the size reduction upon folding single chains to conventional SCNPs via
reversible interactions (∼7% of average deviation of calculated data from experimental
ones; 72 SCNPs and 22 reversible interactions analysed). In spite of such advance in
providing useful structure-property relationships for developing practical applications of
responsive SCNPs, to the best of our knowledge no equivalent model has been yet reported
for the case of covalent-bonded SCNPs.
When compared to reversible SCNPs, the structure of covalent-bonded SCNPs includes permanent intramolecular cross-links that affect to a large extent the final compaction
degree achieved [40, 41] and provide them with superior thermal stability. Hence, covalent-
bonded SCNPs in solution with similar nature, M, and x than reversible SCNPs do display,
on average, a higher level of chain compaction [40]. In this work, we introduce a simple
model of covalent-bonded SCNPs by considering these intra-chain cross-linked nano-
objects as elastic unimolecular networks composed of elastic strands connected by cross-
links [42]. We derive scaling law expressions for the size, diffusion coefficient, apparent
molar mass, and shrinking factor of elastic SCNPs in good, theta, and bad solvents. Also, we
obtain scaling laws for the height of elastic SCNPs deposited on both low- and high-surface
free energy substrates.

Chapter 3
52
3.3. Theoretical section
3.3.1. Model of elastic single-chain nanoparticles
We consider a SCNP precursor of total degree of polymerization N and root-mean-square
size R0 containing two different monomers distributed randomly along the chain: reactive
monomers of type A and unreactive monomers of type B. The number fraction of A
monomers in the precursor is x. Let us assume that the precursor follows a scaling law such
as [42]:
(3.1)
𝑅0 ≈ 𝑎0𝑁𝜈0
where a0 is proportional to the monomer size and ν0 is the corresponding scaling exponent.
For the precursor in good solvent conditions, ν0 = νF = 3/5 = 0.6 (0.588 according to
renormalization group theory) [42].
Upon SCNP formation in a solvent at high dilution via intra-chain covalent bonds, the A
monomers are expected to dimerise to produce cross-links of type A-A. By working at very
high dilution, the nature of the cross-linking should be intramolecular due to isolation of
each individual chain under such conditions. Each resulting SCNP can be regarded as a
network of elastic strands connected by cross-links (see Figure 3.1).
Figure 3.1. Schematic illustration of an elastic single-chain nanoparticle (SCNP) regarded as a network of elastic strands connected by crosslinks.
The free energy (F) of such SCNP of size R is decomposed into two contributions: (i) an
elastic free energy (Fel) arising from the presence of the elastic strands and (ii) an excluded
volume contribution (Fex) from the balance of monomer− monomer and monomer−solvent
interactions, such as:

Size of Elastic Single-Chain Nanoparticles in Solution and on Surfaces
53
(3.2)
𝐹 = 𝐹𝑒𝑙 + 𝐹𝑒𝑥
The elastic free energy can be expressed as:
(3.3)
𝐹𝑒𝑙
𝑘𝐵𝑇≈
3
2
𝑅2
𝑅02 + 𝐾𝑅2 = (
3
2𝑅0+ 𝐴𝑥)𝑅2
where kB is the Boltzmann constant, T the absolute temperature, and K an effective constant
related to the elasticity of the unimolecular network. We assume that K is proportional to x
where A is the corresponding proportionality constant.
When x → 0, equation (3.3) reduces to the Flory expression for a linear chain [42]. For elastic
SCNPs equation (3.3) becomes:
(3.4)
𝐹𝑒𝑙
𝑘𝐵𝑇≈ 𝐾𝑅2 = 𝐴𝑥𝑅2
by assuming 𝐾 ≫ 3/(2𝑅02), which is a good approximation (see section 3.4.4). An
expression similar to equation (3.4) was originally introduced by Vilgis [44] for the case of
soft micro-gels in the presence of excluded volume interactions.
The excluded volume contribution to the free energy can be expressed as a virial expansion
of ρ [43]:
(3.5)
𝐹𝑒𝑥𝑘𝐵𝑇
≈𝑁
2(𝜌𝐵 + 𝜌2𝐶 + ⋯)
where 𝜌 ∝ 𝑁/𝑅3 and B, C, ... are effective second, third, ... virial coefficients of the monomer
interaction. The first term in equation (3.5) corresponds to the excluded volume coefficient
(B > 0 in a good solvent, B = 0 in a θ-solvent, and B < 0 in a bad solvent). The second term
in equation (3.5) accounts for three-body interactions (C > 0).
The equilibrium configuration of the elastic SCNP is obtained by minimizing equation (3.2)
with respect to R, so:
(3.6)
2𝐴𝑥𝑅 − 3(𝐵𝑁2
2𝑅4+
𝐶𝑁3
𝑅7 ) = 0

Chapter 3
54
Equation (3.6) will be used in next section to derive useful expressions relating the relative
amount of reactive monomers, x, and precursor molecular weight, M, with the size, R, and
diffusion coefficient, D, of elastic SCNPs in solvents of different quality.
3.3.2. Size, diffusion coefficient, apparent molar mass, and shrinking factor of elastic
single-chain nanoparticles in solution
3.3.2.1. Good solvent conditions
Size In good solvent (B > 0) the third term in equation (3.6) can be neglected, so we obtain the
following scaling law for the size of the elastic SCNP:
(3.7)
𝑅 = 𝑎1𝑥−1 5⁄ 𝑁2 5⁄ = 𝑏1𝑥
−1 5⁄ 𝑀2 5⁄ = 𝑏1𝑥𝜔1𝑀𝜈1
where 𝑎1 ≡ (3𝐵
4𝐴) 1/5, 𝑏1 ≡ (
3𝐵
4𝐴𝑚02)
1/5, 𝑚0 =
𝑀
𝑁, and M is the molar mass. Consequently, the
elastic SCNP has a scaling exponent (ν1 = 2/5 = 0.4) smaller than that of a linear chain in a
good solvent (ν0 ≈ 3/5 = 0.6). The same value of scaling exponent was previously derived
for the case of soft micro-gels in the presence of excluded volume interactions [44]. A ratio
of radius of gyration (Rg) to hydrodynamic radius (Rh) very close to 1 is expected for chains
having ν = 0.4 (see Figure 3.2).
The Rg/Rh ratio as a function of ν can be estimated from [45, 46]:
(3.8)
𝑅𝑔 =𝑏
√(2𝜈 + 1)(2𝜈 + 2)𝑁𝜈
(3.9)
𝑅ℎ =𝜋(1 − 𝜈)(2 − 𝜈)𝑏
2√6𝜋𝑁𝜈
(3.10)
𝑅𝑔
𝑅ℎ=
2√6
(1 − 𝜈)(2 − 𝜈)√𝜋(2𝜈 + 1)(2𝜈 + 2)
where b is the segment length. It is worth of mention that for compact globules (ν = 1/3)
the exact value of Rg/Rh is 3/5 ≈ 0.775.

Size of Elastic Single-Chain Nanoparticles in Solution and on Surfaces
55
Figure 3.2 illustrates the values of Rg/Rh ratio for ν = 3/5, ν = 1/2, and ν = 1/3. Both for ν = 2/5 = 0.4 and ν = 3/8 = 0.375 a value of Rg/Rh ratio very close to 1 is expected.
Figure 3.2. Rg/Rh ratio as a function of the scaling exponent ν.
Hence, equation (3.7) should be valid for Rg as well as for Rh data. It is worth of mention that
the size of elastic SCNPs scales with the relative amount of reactive monomers, x, with an
exponent ω1 = -1/5 = -0.2. According to equation (3.7), the size of the elastic SCNP depends
on the ratio of the excluded volume coefficient B to the effective elastic constant A, with a
value of scaling exponent of 1/5.
Diffusion coefficient By assuming Rg/Rh ≈ 1, we can use the Stokes-Einstein equation [42] to obtain an
expression for the diffusion coefficient (D) of elastic SCNPs in good solvent as a function of
x and M, such as:
(3.11)
𝐷 =𝑘𝐵𝑇
6𝜋𝜂𝑅 = 𝑑1𝑥
1/5𝑁−2/5 = 𝑒1𝑥1/5𝑀−2/5
where 𝑑1 ≡ (𝑘𝐵𝑇
6𝜋𝜂𝑎1), 𝑒1 ≡ (
𝑘𝐵𝑇
6𝜋𝜂𝑏1), and η is the viscosity of the solvent.
0,5
1
1,5
2
2,5
0,35 0,4 0,45 0,5 0,55 0,6
Elastic SCNP in
good solvent
RG / R
H

Chapter 3
56
Apparent molar mass Size exclusion chromatography (SEC) allows determining the apparent molar mass of
SCNPs, referred to the molar mass of linear polymer standards. In SEC experiments,
macromolecules are separated according to their respective hydrodynamic radius [47]. The
hydrodynamic size of a linear polymer standard is related to its molar mass according to:
(3.12)
𝑅ℎ ≈ 𝑐0𝑀𝜈0
where c0 is a constant. According to equations (3.7) and (3.12), an elastic SCNP of size R
prepared from a precursor of molar mass M and relative amount of reactive monomers x
will have a SEC apparent molecular weight (Mapp) given by [48]:
(3.13)
𝑏1𝑥𝜔1𝑀𝜈1 ≈ 𝑐0𝑀𝑎𝑝𝑝
𝜈0
and hence:
(3.14)
𝑀𝑎𝑝𝑝 = 𝑓1𝑥𝛼1𝑀𝛽1
where 𝑓1 ≡ (𝑏1
𝑐0)1 𝜈0⁄
, 𝛼1 = 𝜔1/𝜈0, and 𝛽1 = 𝜈1/𝜈0. For ν0 = 3/5, we obtain α1 = -1/3 ≈ -0.33
and β1 = 2/3 ≈ 0.67 so equation (3.14) becomes:
(3.15)
𝑀𝑎𝑝𝑝 = 𝑓1𝑥−1 3⁄ 𝑀2 3⁄
Shrinking factor The shrinking factor is defined as ⟨𝐺⟩ = 𝑀𝑎𝑝𝑝/𝑀. Consequently, by using equation (3.14),
we obtain:
(3.16)
⟨𝐺⟩ = 𝑓1𝑥𝛼1𝑀𝛽1−1
For ν0 = 3/5 equation (3.16) becomes:
(3.17)
⟨𝐺⟩ = 𝑓1𝑥−1 3⁄ 𝑀−1 3⁄

Size of Elastic Single-Chain Nanoparticles in Solution and on Surfaces
57
3.3.2.2. Theta solvent conditions
Size In a theta solvent, the second term in equation (3.6) vanishes (B = 0) so we obtain the
following expression for the size of the elastic SCNP:
(3.18)
𝑅 = 𝑎2𝑥−1 8⁄ 𝑁3 8⁄ = 𝑏2𝑥
−1 8⁄ 𝑀3 8⁄ = 𝑏2𝑥𝜔2𝑀𝜈2
where 𝑎2 ≡ (3𝐶
2𝐴 )
1 8⁄
and 𝑏2 ≡ (3𝐶
2𝐴𝑚03)
1/8. As expected, a smaller scaling law exponent (ν2
= 3/8 = 0.375) is obtained for the elastic SCNP in theta solvent than that in good solvent. In this case, the size of elastic SCNPs scales with x with a smaller exponent ω2 = 1/8 = -0.125.
Equation (3.18) should be also valid for Rg as well as for Rh data (see Figure 3.2). In this case,
the size of the elastic SCNP depends on the ratio of the coefficient of three-body interactions
C to the effective elastic constant A, with a value of scaling exponent of 1/8.
Diffusion coefficient By assuming Rg/Rh ≈ 1, the diffusion coefficient of an elastic SCNP in theta solvent is given
by:
(3.19)
𝐷 =𝑘𝐵𝑇
6𝜋𝜂𝑅 = 𝑑2𝑥
1/8𝑁−3/8 = 𝑒2𝑥1/8𝑀−3/8
where 𝑑2 ≡ (𝑘𝐵𝑇
6𝜋𝜂𝑎2) and 𝑒2 ≡ (
𝑘𝐵𝑇
6𝜋𝜂𝑏2).
Apparent molar mass For an elastic SCNP in theta solvent, Mapp is given by:
(3.20)
𝑀𝑎𝑝𝑝 = 𝑓2𝑥𝛼2𝑀𝛽2
where 𝑓2 ≡ (𝑏2
𝑐0)1 𝜈0⁄
, 𝛼2 = 𝜔2/𝜈0, and 𝛽2 = 𝜈2/𝜈0. For ν0 = 3/5, we obtain α2 = -5/24 ≈ -
0.21 and β2 = 5/8 ≈ 0.63 so equation (3.20) becomes:
(3.21)
𝑀𝑎𝑝𝑝 = 𝑓2𝑥−5 24⁄ 𝑀5 8⁄
Shrinking factor The shrinking factor of an elastic SCNP in theta solvent is given by:

Chapter 3
58
(3.22)
⟨𝐺⟩ = 𝑓2𝑥𝛼2𝑀𝛽2−1
For ν0 = 3/5 equation (3.22) becomes:
(3.23)
⟨𝐺⟩ = 𝑓2𝑥−5 24⁄ 𝑀−3 8⁄
3.3.2.3. Bad solvent conditions
Size In bad solvent B < 0, so the size of the elastic SCNP can be approximated by:
(3.24)
𝑅 = 𝑎3𝑁1 3⁄ = 𝑏3𝑀
1 3⁄ = 𝑏3𝑀𝜈3
where 𝑎3 ≡ (3𝐶
|𝐵| )
1 3⁄
and 𝑏3 ≡ (3𝐶
|𝐵|𝑚0)1/3
. In this case, the size of elastic SCNPs scales with
N with the expected exponent for globules (ν3 = 1/3 ≈ 0.33), and no dependence of R on x
is predicted.
Diffusion coefficient
It is well-known that for compact globules 𝑅𝑔/𝑅ℎ = √3/5 ≈ 0.775, so the diffusion
coefficient of an elastic SCNP in bad solvent becomes:
(3.25)
𝐷 =𝑘𝐵𝑇
6𝜋𝜂𝑅 = 𝑑3𝑁
−1/3 = 𝑒3𝑀−1/3
where 𝑑3 ≡ (√3𝑘𝐵𝑇
6√5𝜋𝜂𝑎3) and 𝑒3 ≡ (
√3𝑘𝐵𝑇
6√5𝜋𝜂𝑏3).
Apparent molar mass For an elastic SCNP in bad solvent, Mapp is given by:
(3.26)
𝑀𝑎𝑝𝑝 = 𝑓3𝑀𝛽3
where 𝑓3 ≡ (𝑏3
𝑐0)1 𝜈0⁄
and 𝛽3 = 𝜈3/𝜈0. For ν0 = 3/5, we obtain β3 = 5/9 ≈ 0.56 so equation
(3.26) becomes:

Size of Elastic Single-Chain Nanoparticles in Solution and on Surfaces
59
(3.27)
𝑀𝑎𝑝𝑝 = 𝑓3𝑀5 9⁄
Shrinking factor The shrinking factor of an elastic SCNP in bad solvent is given by:
(3.28)
⟨𝐺⟩ = 𝑓3𝑀𝛽3−1
For ν0 = 3/5 equation (3.28) becomes:
(3.29)
⟨𝐺⟩ = 𝑓3𝑀−4 9⁄
3.3.3. Size of elastic single-chain nanoparticles on surfaces
3.3.3.1. Low-surface free energy substrate Let us consider the case of an elastic SCNP deposited onto a very low-surface free energy
substrate. The SCNP is expected to take a compact, globular conformation onto this surface,
which allows minimizing the contact between the SCNP and the low-surface energy
substrate. The volume of the SCNP should be:
(3.30)
𝑉 =𝑀
𝜌0𝑁𝐴=
4
3𝜋𝑅3
where ρ0 is the bulk density. Consequently, the height (H = 2R) of the SCNP will be given by
[49]:
(3.31)
𝐻 = 𝑏4𝑀1/3
where 𝑏4 = (6
𝜋𝜌0𝑁𝐴)1/3
.
3.3.3.2. High-surface free energy substrate When compared to the previous case, now the elastic SCNP is expected to spread to some
extent over the surface. Let us assume that the SCNP over the substrate adopt a
conformation equivalent to that in the melt [50, 51]. Generalization of equation (3.2) to d
dimensions for melt and theta solvent conditions gives:

Chapter 3
60
(3.32)
𝐹
𝑘𝐵𝑇≈ 𝐴𝑥𝑅2 +
𝐶𝑁3
2𝑅2𝑑
and by minimization of equation (3.32) to:
(3.33)
2𝐴𝑥𝑅 −𝑑𝐶𝑁3
2𝑅2𝑑+1= 0
Consequently,
(3.34)
𝑅 = (𝑑𝐶
2𝐴)1 (2𝑑+2)⁄
𝑥−1 (2𝑑+2)⁄ 𝑁3 (2𝑑+2)⁄
We obtain an estimation of the lateral spreading by using equation (3.18) in two dimensions
(d = 2) such as:
(3.35)
𝑅𝐼𝐼 ∝ 𝑥−1 (2𝑑+2)⁄ 𝑀3 (2𝑑+2)⁄ ∝ 𝑥1 6⁄ 𝑀3/6
Since the volume of the elastic SCNP in the high-surface free energy substrate, 𝑉 ≈ 𝐻 (𝜋𝑅𝐼𝐼2 ),
should be equal to the volume of the SCNP in a low-surface free energy substrate [equation
(3.30)], we obtain:
(3.36)
𝐻 = 𝑔1 𝑥1/3
where 𝑔1 ≡ [𝑚0
𝜋𝜌0𝑁𝐴(𝐶
𝐴)1/3
] is a constant.
3.3.3.3. Single-chain nanoparticle stretching From equation (3.4) we obtain the force (f) versus stretching (z) equation of elastic SCNPs
such as:
(3.37)
𝑓 =∂𝐹el
∂𝑧≈ (2𝑘B𝑇𝐴𝑥)𝑧 = 𝐾s𝑧

Size of Elastic Single-Chain Nanoparticles in Solution and on Surfaces
61
where Ks is the effective (x-dependent) spring coefficient. Equation (3.37 could be used to
determine the constant A from experimental f vs z curves by AFM of covalent-bonded SCNPs
with different amount of reactive groups, x. To the best of our knowledge, such experiments
have not been performed yet. For the case of a linear chain (x → 0), the classical result
corresponding to the freely jointed chain (FJC) model [52] is obtained from equation (3.3):
(3.38)
𝑓 =∂𝐹el
∂𝑧≈ (
3𝑘B𝑇
𝑅02 )𝑧
3.3.4. Summary of scaling laws for elastic single-chain nanoparticles
A summary of the scaling law expressions for elastic SCNP in solution and on solid
substrates is given in Table 3.1, as derived by assuming ν0 = 3/5.
Table 3.1. Summary of Scaling Law Expressions for Elastic SCNPs (See Text).
Solution
Magnitude Good solvent Theta solvent Bad solvent
Size R ∝ x–1/5M2/5 R ∝ x–1/8M3/8 R ∝ M1/3
Diffusion coefficient D ∝ x1/5M–2/5 D ∝ x1/8M–3/8 D ∝ M–1/3
Apparent molar mass Mapp ∝ x–1/3M2/3 Mapp ∝ x–5/24M5/8 Mapp ∝ M5/9
Shrinking factor ⟨G⟩ ∝ x–1/3M–1/3 ⟨G⟩ ∝ x–5/24M–3/8 ⟨G⟩ ∝ M–4/9
Solid Substrate
Low Surface Free Energy High Surface Free Energy
Height H ∝ M1/3 H ∝ x1/3
Nanoparticle Stretching
Spring Coefficient Ks ∝ x

Chapter 3
62
3.4. Results and discussion
3.4.1. Comparison to experimental results
The most accurate compilation of size data for covalent-bonded SCNPs is due to Hawker and
co-workers [49, 53] corresponding to polystyrene (PS)-SCNPs (see Table 3.2 and Table 3.3).
The intra-chain cross-linking process was carried out at high temperature (250 °C) by using
precursors with highly reactive benzocyclobutene functional groups. In particular, a large
set of size data in solution (THF as solvent) was reported corresponding to precursors of
narrow molecular weight distribution (1.09 ≤ Đ ≤ 1.26), different amount of reactive
groups (0.025 ≤ x ≤ 0.3), and varying precursor molar mass (44 ≤ M ≤ 235 kDa) [53]. Size
characterization of the resulting covalent-bonded PS-SCNPs was carried out by SEC in THF.
Moreover, the absolute molar mass by static light scattering (SLS) of the PS-SCNPs of higher
molar mass (M = 230 kDa) was found to be in agreement, within experimental error, with
the molar mass by SEC of the corresponding linear precursor (M = 234 kDa), supporting
the formation of discrete nanoparticles each composed of a single chain. Concerning size
data on surfaces (mica and silanized wafer substrates), they cover data from precursors of
Đ between 1.04 and 1.91, molar mass between 33.0 and 211 kDa, and amount of reactive
groups between 0.025 and 0.60 [49].
In section 3.4.2, we perform a comparison of the experimental data from Table 3.2 with
model predictions corresponding to elastic SCNPs in good, theta, and bad solvent
conditions. For the same system, a similar comparison of experimental and theoretical H
data corresponding to SCNPs deposited on low and high-energy substrates (Table 3.3) is
carried out in section 3.4.3. Comparison of model predictions to experimental data for
SCNPs different from those given in Table 3.2 and Table 3.3 is performed in section 3.4.5.
Relevant information about the conformation of SCNPs in solution and on solid substrates
can be found in refs [41] and [49], respectively.
3.4.2. Size, diffusion coefficient, apparent molar mass, and shrinking factor of
polystyrene single-chain nanoparticles in tetrahydrofuran
We investigate the ability of the elastic SCNP model corresponding to good, theta, and bad
solvent conditions [equations (3.14), (3.20) and (3.26), respectively] to reproduce the Mapp
data from Table 3.2 as a function of x and M, by using the values in equation (3.12)
corresponding to PS standards in THF (c0 = 1.44 × 10⁻², ν0 = 0.561) [54]. Best fitting of the
Mapp data to equation (3.14) corresponding to elastic SCNPs in good solvent gives f1 = 5.95,
b1 = c0 f1ν0 = 3.92 × 10⁻², and B/A = (4/3)(b15m02) = 1.33 × 10⁻³. Average deviation of data
calculated from Mapp = 5.95x-0.357M0.713 and experimental Mapp data was only 4.2% (see
Figure 3.3 A). Conversely, best-fitting the Mapp data to equations (3.20) and (3.26),
corresponding to theta and bad solvent conditions, gives average deviation of calculated
and experimental Mapp data of 13.0% and 33.4%, respectively (Figure 3.3 B, C). Hence, as
illustrated in Figure 3.3, the observed experimental trend is only reproduced with
reasonable accuracy by the elastic SCNP model for the case of good solvent conditions, as it
is expected for the case of THF solutions. The description is fairly achieved in terms of a
single model parameter (the ratio of the excluded volume coefficient B to the effective
elastic constant A).

Size of Elastic Single-Chain Nanoparticles in Solution and on Surfaces
63
Table 3.2. Summary of Size Data for PS–SCNPs in THF [53].
Precursors SCNPs
x M (kDa) Ð Mapp (kDa) <G> R a (nm) D b (nm2/ s)
0.025 44.0 1.09 41.7 0.95 5.6 85
0.050 44.5 1.08 38.2 0.86 5.4 88
0.10 45.5 1.09 29.1 0.64 4.6 103
0.15 43.5 1.10 20.7 0.48 3.8 125
0.20 44.0 1.07 18.5 0.42 3.6 132
0.0125 110.5 1.15 103.0 0.93 9.3 51
0.025 113.0 1.12 94.5 0.84 8.9 53
0.050 109.0 1.14 79.3 0.73 8.1 59
0.075 108.0 1.15 59.8 0.55 6.9 69
0.10 112.0 1.10 56.0 0.50 6.6 (6.2) 72 (77)
0.15 110.0 1.16 44.2 0.40 5.8 82
0.20 111.0 1.11 42.8 0.39 5.7 83
0.25 112.0 1.12 40.5 0.36 5.5 86
0.0125 231.0 1.23 189.8 0.82 13.2 36
0.025 235.0 1.25 174.0 0.74 12.5 38
0.050 228.0 1.22 109.0 0.48 9.6 49
0.075 230.0 1.19 98.0 0.43 9.1 52
0.10 233.0 1.26 91.5 0.39 8.7 (9.5) 55 (50)
0.125 231.0 1.24 81.0 0.35 8.2 58
0.15 235.0 1.23 80.3 0.34 8.1 59
0.20 230.0 1.21 66.0 0.29 7.3 65

Chapter 3
64
Precursors SCNPs
x M (kDa) Ð Mapp (kDa) <G> R a (nm) D b (nm2/ s)
0.25 229.0 1.24 62.0 0.27 7.0 (6.4) 68 (74)
0.3 234.0 1.23 63.5 0.27 7.1 32
aCalculated from [53]. Rh (nm) = 1.44 × 10⁻²M0.561. Data from DLS are shown in parentheses.
bCalculated from D = kBT/6πηRh. Data from DLS are shown in parentheses.

Size of Elastic Single-Chain Nanoparticles in Solution and on Surfaces
65
Figure 3.3. Mapp data of PS-SCNPs in THF (solid green circles: M = 232 kDa; solid red squares: M = 111 kDa; and solid blue circles: M = 44 kDa).[53] The same data are described by the elastic SCNPs model (solid green, red, and blue lines, respectively), assuming the case of good solvent conditions (A), theta solvent conditions (B), and bad solvent conditions (C). The experimental trend is only reproduced by the elastic SCNP model for good solvent conditions in terms of a single model parameter.

Chapter 3
66
Figure 3.4 provides a comparison of calculated size, diffusion coefficient, and shrinking
factor to experimental data reported in Table 3.2 according to the elastic SCNP model for
good solvent conditions.
Figure 3.4. Comparison of calculated size (Rh) (A), diffusion coefficient (D) (B), and shrinking factor (⟨G⟩) (C) from the elastic SCNP model corresponding to good solvent conditions to experimental data from Table 3.2.[53] Closed symbols and continuous lines have the same meaning as in Figure 3.3. Open symbols correspond to data from dynamic light scattering (DLS) experiments.

Size of Elastic Single-Chain Nanoparticles in Solution and on Surfaces
67
3.4.3. Size of polystyrene single-chain nanoparticles on silanized wafer and mica
substrates
A comparison of predictions from the elastic SCNP model and experimental size data for PS-
SCNPs [48] deposited onto substrates of different surface free energy is illustrated in Figure
3.5. On a low-free energy substrate such as the silanized wafer surface, PS-SCNPs with x = 0.2 and 0.6 behave as solid globules, a result previously reported by Dukette et al. [49]. It is
worth of mention that departure from the globular conformation is observed for PS-SCNPs
with very low amount of reactive functional groups (x = 0.025).
Table 3.3. Summary of Size Data for PS–SCNPs on Silanized Wafer and Mica Substrates [49].
PS-SCNPs H (nm)
x M (kDa) Ð Silanized Wafer Substrate Mica Substrate
0.025 24.5 1.14 2.6 1.8
0.025 60.1 1.16 3.0 2.4
0.025 158 1.40 4.0 2.6
0.20 41.0 1.04 4.0 1.6
0.20 78.0 1.14 4.8 3.0
0.20 211 1.32 9.3 2.8
0.60 33.0 1.91 5.4 4.3
Figure 3.5 B shows the ability of the elastic SCNP model to reproduce the experimental
behaviour of PS-SCNPs deposited onto a high-surface energy substrate such as mica [49] in
terms of a single parameter (related to the ratio of the third virial coefficient C to the
effective elastic constant A). Best fitting of the data in Figure 3.5 B to equation (3.36) gives
g1 = 5.81, C/A = 7.3 × 10⁻⁷, and C ≈ 3.47 × 10⁻⁵ by using A ≈ 47.6 (see section 3.4.4).

Chapter 3
68
Figure 3.5. Comparison of theoretical predictions from the elastic SCNP model to experimental size data of PS-SCNPs48 (solid blue circles: x = 0.025; solid red squares: x = 0.20; and solid green circles: x = 0.60) on (A) low- and (B) high-surface free energy substrates (see text and Table 4). Solid green, red, and blue lines are the predicted behaviour for x = 0.025, 0.20, and 0.60, respectively.
3.4.4. Stretching of polystyrene single-chain nanoparticles
Here we use the elastic SCNP model to estimate the force (f) versus stretching (z) curves
for PS-SCNPs at low values of z.

Size of Elastic Single-Chain Nanoparticles in Solution and on Surfaces
69
From equations (3.3) (with x = 0) and (3.5) (B > 0) and taking into account that Rg/Rh ≈
1.86 for ν = 3/5, we obtain:
(3.39)
𝐵 ≈2
𝑏2(1.86 × 𝑐0)
5𝑚03
where 𝑏 ≈ 0.7 [55], 𝑐0 = 1.44 × 10⁻², and 𝑚0 = 104 so 𝐵 ≈ 6.33 × 10⁻² for PS in THF.
By using B/A = 1.33 × 10⁻³ (see section 3.4.2) and B ≈ 6.33 × 10⁻², the estimated value of A
is 47.6, which guarantees the condition 𝐾 = 𝐴𝑥 ≫ 3/(2𝑅02) [see equation (3.4)] even for the
lower values of M and x of Table 3.2 and Table 3.3.
Figure 3.6 shows the predicted force (f) versus stretching (z) curves for PS-SCNPs of
different values of x in the regime of low deformations according to equation (3.37). The
corresponding values of the effective spring constant are Ks = 9.8, 19.6, 39.2, 117.5, and
235.0 for x = 0.025, 0.05, 0.10, 0.30, and 0.60, respectively.
Figure 3.6. Predicted force (f) versus stretching (z) curves for PS− SCNPs of different values of x at low deformation.
3.4.5. Comparison of model predictions to experimental data for other covalent-
bonded SCNPs
3.4.5.1. SCNP Size in Good Solvent Conditions We are interested to investigate the predictive possibilities of the model for covalent-
bonded PS-SCNPs obtained from other different cross-linking techniques and also for
0
100
200
300
400
500
600
700
800
0 1 2 3
x=0.025x=0.05x=0.10x=0.30x=0.60
f (p
N)
z (nm)

Chapter 3
70
covalent-bonded SCNPs of other chemical composition (e.g., methacrylate- and acrylate-
based SCNPs).
Figure 3.7 provides a comparison of experimental Rh data and calculated ones from Rh (nm)
= 3.92 × 10⁻² x-1/5M2/5 (see section 3.4.2.) for SCNPs in good solvent conditions.
Experimental RH data were taken from ref. [41] corresponding to covalent-bonded PS-
SCNPs obtained by several crosslinking techniques different from benzocyclobutene
dimerization as well as covalent-bonded poly(methyl methacrylate) (PMMA)- and
poly(alkyl acrylate) (PAA)-based SCNPs. The overall average standard deviation between
calculated and experimental size data is 11%, which is quite reasonable by taking into
account that both the effective excluded volume coefficient B and the effective elastic
constant A could change depending on the specific chemical nature of the reactive functional
groups and monomer repeat units (styrene vs (meth)acrylate), the overall chain rigidity,
etc. When only PS-SCNPs are compared, the average standard deviation between calculated
and experimental data reduces to 8.5%.
Figure 3.7. Comparison of experimental Rh data [40] and calculated ones (Rh (nm) = 3.92x−1/5M2/5, see text) for covalent-bonded PS-SCNPs obtained from several cross-linking techniques different from benzocyclobutene dimerization, as well as covalent-bonded polymethyl methacrylate (PMMA)- and polyalkyl acrylate (PAA)-based SCNPs.
3.4.5.2. SCNP size on high-surface free energy substrates A comparison of experimental H data from AFM experiments over mica substrate and
calculated ones from H (nm) = 5.81x1/3 (see section 3.4.3.) is provided in Table 3.4. It is
worth of mention that only a reduced number of covalent-bonded SCNPs have been
investigated by AFM on mica substrate [16, 49, 56-59]. In spite of the scarce data available,
a reasonable agreement is found between predictions and experimental results for
covalent-bonded PS-SCNPs obtained by cross-linking techniques different from
0
5
10
15
20
0 5 10 15 20
PSPMMAPAA
RH
ca
l (n
m)
RH
exp (nm)

Size of Elastic Single-Chain Nanoparticles in Solution and on Surfaces
71
benzocyclobutene dimerization [56-58] as well as for covalent-bonded poly(tert-butyl
methacrylate) (PtBMA) [59] and poly(methacrylic acid) (PMAA) [16] SCNPs.
Table 3.4. Comparison of Experimental H Data (Hexp) and Calculated Ones (Hcal) for Covalent-Bonded PS–SCNPs Obtained from Cross-Linking Techniques Different from Benzocyclobutene Dimerization as Well as for Covalent-Bonded PtBMA– and PMAA–SCNPs.
SCNP Typea x Hexp(nm) Hcal(nm)b Ref.
PS 0.09 3.0 2.6 [56]
PS 0.10 1.6, 3.8 2.7 [57]
PS 0.10 1.7 2.7 [58]
PMAA 0.10 2.0 2.7 [16]
PtBMA 0.17 3.5 3.2 [59]
aPtBMA = poly(tert-butyl methacrylate); PMAA = poly(methacrylic acid).
bCalculated from H (nm) = 5.81x1/3 (see text).
3.5. Concluding remarks
A simple model of covalent-bonded SCNPs has been developed by considering these soft
nano-objects as a network of strands, which behave as elastic springs, connected by
crosslinks. Based on this model, scaling law expressions for the size, diffusion coefficient,
apparent molar mass, and shrinking factor of elastic SCNPs in good, theta, and bad solvents
have been derived as well as scaling laws for the height of elastic SCNPs deposited on both
low- and high-surface free energy substrates.
The elastic SCNP model for good solvent conditions reproduces with reasonable accuracy
the experimental size, diffusion coefficient, apparent molar mass, and shrinking factor of PS SCNPs in THF as a function of x and M, in terms of a single model parameter (the ratio of the
effective excluded volume coefficient B to the effective elastic constant A). The predictions
of the elastic SCNP model are found to be in excellent agreement with (i) the approximately
constant height of PS-SCNPs of different M on high-surface energy substrates and (ii) the
dependence of the height of PS-SCNPs on M, with a theoretical exponent of 1/3 for the case
of low-surface energy substrates. Force versus stretching curves for PS-SCNPs of different
values of x at low deformation would allow determining experimentally the effective elastic
constant A.
To summarize, the simple elastic SCNP model introduced in this Chapter provides a useful
framework for connecting the amount of reactive groups and precursor molar mass with
the size upon intra-chain cross-linking for a variety of covalent-bonded SCNPs both in
solvents of different quality and on substrates of different surface free energy.

Chapter 3
72
3.6. References
[1] J.A. Pomposo, Single-Chain Polymer Nanoparticles: Synthesis, Characterization, Simulations, and Applications, John Wiley & Sons2017. [2] M. Huo, N. Wang, T. Fang, M. Sun, Y. Wei, J. Yuan, Single-chain polymer nanoparticles: Mimic the proteins, Polymer, 66 (2015) A11-A21. [3] J.A. Pomposo, Bioinspired single-chain polymer nanoparticles, Polymer International, 63 (2014) 589-592. [4] S. Mavila, O. Eivgi, I. Berkovich, N.G. Lemcoff, Intramolecular Cross-Linking Methodologies for the Synthesis of Polymer Nanoparticles, Chemical Reviews, 116 (2016) 878-961. [5] A.M. Hanlon, C.K. Lyon, E.B. Berda, What Is Next in Single-Chain Nanoparticles?, Macromolecules, 49 (2016) 2-14. [6] O. Altintas, C. Barner-Kowollik, Single-Chain Folding of Synthetic Polymers: A Critical Update, Macromolecular Rapid Communications, 37 (2016) 29-46. [7] M. Gonzalez-Burgos, A. Latorre-Sanchez, J.A. Pomposo, Advances in single chain technology, Chemical Society Reviews, 44 (2015) 6122-6142. [8] C.K. Lyon, A. Prasher, A.M. Hanlon, B.T. Tuten, C.A. Tooley, P.G. Frank, E.B. Berda, A brief user's guide to single-chain nanoparticles, Polymer Chemistry, 6 (2015) 181-197. [9] A. Sanchez-Sanchez, J.A. Pomposo, Single-Chain Polymer Nanoparticles via Non-Covalent and Dynamic Covalent Bonds, Particle & Particle Systems Characterization, 31 (2014) 11-23. [10] M. Artar, E. Huerta, E.W. Meijer, A.R.A. Palmans, Dynamic Single Chain Polymeric Nanoparticles: From Structure to Function, Sequence-Controlled Polymers: Synthesis, Self-Assembly, and Properties, American Chemical Society2014, pp. 313-325. [11] A. Sanchez-Sanchez, I. Pérez-Baena, J.A. Pomposo, Advances in Click Chemistry for Single-Chain Nanoparticle Construction, Molecules, 18 (2013) 3339-3355. [12] O. Altintas, C. Barner-Kowollik, Single Chain Folding of Synthetic Polymers by Covalent and Non-Covalent Interactions: Current Status and Future Perspectives, Macromolecular Rapid Communications, 33 (2012) 958-971. [13] M.K. Aiertza, I. Odriozola, G. Cabañero, H.-J. Grande, I. Loinaz, Single-chain polymer nanoparticles, Cellular and Molecular Life Sciences, 69 (2012) 337-346. [14] Y. Bai, H. Xing, G.A. Vincil, J. Lee, E.J. Henderson, Y. Lu, N.G. Lemcoff, S.C. Zimmerman, Practical synthesis of water-soluble organic nanoparticles with a single reactive group and a functional carrier scaffold, Chemical Science, 5 (2014) 2862-2868. [15] A. Sanchez-Sanchez, S. Akbari, A.J. Moreno, F.L. Verso, A. Arbe, J. Colmenero, J.A. Pomposo, Design and Preparation of Single-Chain Nanocarriers Mimicking Disordered Proteins for Combined Delivery of Dermal Bioactive Cargos, Macromolecular Rapid Communications, 34 (2013) 1681-1686. [16] I. Perez-Baena, I. Loinaz, D. Padro, I. García, H.J. Grande, I. Odriozola, Single-chain polyacrylic nanoparticles with multiple Gd(iii) centres as potential MRI contrast agents, Journal of Materials Chemistry, 20 (2010) 6916-6922. [17] S.K. Hamilton, E. Harth, Molecular Dendritic Transporter Nanoparticle Vectors Provide Efficient Intracellular Delivery of Peptides, ACS Nano, 3 (2009) 402-410. [18] A. Latorre-Sanchez, J.A. Pomposo, A simple, fast and highly sensitive colorimetric detection of zein in aqueous ethanol via zein–pyridine–gold interactions, Chemical Communications, 51 (2015) 15736-15738. [19] M.A.J. Gillissen, I.K. Voets, E.W. Meijer, A.R.A. Palmans, Single chain polymeric nanoparticles as compartmentalised sensors for metal ions, Polymer Chemistry, 3 (2012) 3166-3174.

Size of Elastic Single-Chain Nanoparticles in Solution and on Surfaces
73
[20] C.A. Tooley, S. Pazicni, E.B. Berda, Toward a tunable synthetic [FeFe] hydrogenase mimic: single-chain nanoparticles functionalized with a single diiron cluster, Polymer Chemistry, 6 (2015) 7646-7651. [21] I. Perez-Baena, F. Barroso-Bujans, U. Gasser, A. Arbe, A.J. Moreno, J. Colmenero, J.A. Pomposo, Endowing Single-Chain Polymer Nanoparticles with Enzyme-Mimetic Activity, ACS Macro Letters, 2 (2013) 775-779. [22] E. Huerta, P.J.M. Stals, E.W. Meijer, A.R.A. Palmans, Consequences of Folding a Water-Soluble Polymer Around an Organocatalyst, Angewandte Chemie International Edition, 52 (2013) 2906-2910. [23] T. Terashima, T. Mes, T.F.A. De Greef, M.A.J. Gillissen, P. Besenius, A.R.A. Palmans, E.W. Meijer, Single-Chain Folding of Polymers for Catalytic Systems in Water, Journal of the American Chemical Society, 133 (2011) 4742-4745. [24] D. Mecerreyes, V. Lee, C.J. Hawker, J.L. Hedrick, A. Wursch, W. Volksen, T. Magbitang, E. Huang, R.D. Miller, A Novel Approach to Functionalized Nanoparticles: Self-Crosslinking of Macromolecules in Ultradilute Solution, Advanced Materials, 13 (2001) 204-208. [25] B. Zhu, J. Ma, Z. Li, J. Hou, X. Cheng, G. Qian, P. Liu, A. Hu, Formation of polymeric nanoparticles via Bergman cyclization mediated intramolecular chain collapse, Journal of Materials Chemistry, 21 (2011) 2679-2683. [26] J.A. Kaitz, C.M. Possanza, Y. Song, C.E. Diesendruck, A.J.H. Spiering, E.W. Meijer, J.S. Moore, Depolymerizable, adaptive supramolecular polymer nanoparticles and networks, Polymer Chemistry, 5 (2014) 3788-3794. [27] G. Li, F. Tao, L. Wang, Y. Li, R. Bai, A facile strategy for preparation of single-chain polymeric nanoparticles by intramolecular photo-crosslinking of azide polymers, Polymer, 55 (2014) 3696-3702. [28] Y. Liu, T. Pauloehrl, S.I. Presolski, L. Albertazzi, A.R.A. Palmans, E.W. Meijer, Modular Synthetic Platform for the Construction of Functional Single-Chain Polymeric Nanoparticles: From Aqueous Catalysis to Photosensitization, Journal of the American Chemical Society, 137 (2015) 13096-13105. [29] M. González-Burgos, A. Alegría, A. Arbe, J. Colmenero, J.A. Pomposo, An unexpected route to aldehyde-decorated single-chain nanoparticles from azides, Polymer Chemistry, 7 (2016) 6570-6574. [30] W. Fan, X. Tong, Q. Yan, S. Fu, Y. Zhao, Photodegradable and size-tunable single-chain nanoparticles prepared from a single main-chain coumarin-containing polymer precursor, Chemical Communications, 50 (2014) 13492-13494. [31] D.E. Whitaker, C.S. Mahon, D.A. Fulton, Thermoresponsive Dynamic Covalent Single-Chain Polymer Nanoparticles Reversibly Transform into a Hydrogel, Angewandte Chemie International Edition, 52 (2013) 956-959. [32] M.E. Mackay, T.T. Dao, A. Tuteja, D.L. Ho, B. Van Horn, H.-C. Kim, C.J. Hawker, Nanoscale effects leading to non-Einstein-like decrease in viscosity, Nature Materials, 2 (2003) 762-766. [33] L. Oria, R. Aguado, J.A. Pomposo, J. Colmenero, A Versatile “Click” Chemistry Precursor of Functional Polystyrene Nanoparticles, Advanced Materials, 22 (2010) 3038-3041. [34] M.E. Mackay, A. Tuteja, P.M. Duxbury, C.J. Hawker, B. Van Horn, Z. Guan, G. Chen, R.S. Krishnan, General Strategies for Nanoparticle Dispersion, Science, 311 (2006) 1740. [35] A. Tuteja, P.M. Duxbury, M.E. Mackay, Multifunctional Nanocomposites with Reduced Viscosity, Macromolecules, 40 (2007) 9427-9434. [36] J.K. Mistry, M.R. Van De Mark, Aziridine cure of acrylic colloidal unimolecular polymers (CUPs), Journal of Coatings Technology and Research, 10 (2013) 453-463. [37] J.A. Pomposo, A.R. de Luzuriaga, I. García, A. Etxeberria, J. Colmenero, A Nanotechnology Pathway to Arresting Phase Separation in Soft Nanocomposites, Macromolecular Rapid Communications, 32 (2011) 573-578. [38] A. Arbe, J.A. Pomposo, I. Asenjo-Sanz, D. Bhowmik, O. Ivanova, J. Kohlbrecher, J. Colmenero, Single Chain Dynamic Structure Factor of Linear Polymers in an All-Polymer Nano-Composite, Macromolecules, 49 (2016) 2354-2364.

Chapter 3
74
[39] Y. Zhang, H. Zhao, Surface-tunable colloidal particles stabilized by mono-tethered single-chain nanoparticles, Polymer, 64 (2015) 277-284. [40] J.A. Pomposo, J. Rubio-Cervilla, A.J. Moreno, F. Lo Verso, P. Bacova, A. Arbe, J. Colmenero, Folding Single Chains to Single-Chain Nanoparticles via Reversible Interactions: What Size Reduction Can One Expect?, Macromolecules, 50 (2017) 1732-1739. [41] J.A. Pomposo, I. Perez-Baena, F. Lo Verso, A.J. Moreno, A. Arbe, J. Colmenero, How Far Are Single-Chain Polymer Nanoparticles in Solution from the Globular State?, ACS Macro Letters, 3 (2014) 767-772. [42] M. Rubinstein, R.H. Colby, Polymer physics, Oxford University Press, New York, 2003. [43] P.G. De Gennes, Collapse of a polymer chain in poor solvents, J. Physique Lett., 36 (1975) 55-57. [44] T.A. Vilgis, Crosslinked polymer chains with excluded volume: A new class of branched polymers?, Macromolecular Theory and Simulations, 7 (1998) 59-63. [45] A.Z. Akcasu, M. Benmouna, Concentration Effects on the Dynamic Structure Factor in Polymer Solutions, Macromolecules, 11 (1978) 1193-1198. [46] B. Hammouda, SANS from homogeneous polymer mixtures: A unified overview, Polymer Characteristics, Springer Berlin Heidelberg, Berlin, Heidelberg, 1993, pp. 87-133. [47] S. Podzimek, Light scattering, size exclusion chromatography and asymmetric flow field flow fractionation: powerful tools for the characterization of polymers, proteins and nanoparticles, John Wiley & Sons2011. [48] J.A. Pomposo, I. Perez-Baena, L. Buruaga, A. Alegría, A.J. Moreno, J. Colmenero, On the Apparent SEC Molecular Weight and Polydispersity Reduction upon Intramolecular Collapse of Polydisperse Chains to Unimolecular Nanoparticles, Macromolecules, 44 (2011) 8644-8649. [49] T.E. Dukette, M.E. Mackay, B. Van Horn, K.L. Wooley, E. Drockenmuller, M. Malkoch, C.J. Hawker, Conformation of Intramolecularly Cross-Linked Polymer Nanoparticles on Solid Substrates, Nano Letters, 5 (2005) 1704-1709. [50] P.-G. De Gennes, Scaling concepts in polymer physics, Cornell university press1979. [51] J. Kumaki, Observation of polymer chain structures in two-dimensional films by atomic force microscopy, Polymer Journal, 48 (2016) 3-14. [52] P.J. Flory, Principles of polymer chemistry, Cornell University Press1953. [53] E. Harth, B.V. Horn, V.Y. Lee, D.S. Germack, C.P. Gonzales, R.D. Miller, C.J. Hawker, A Facile Approach to Architecturally Defined Nanoparticles via Intramolecular Chain Collapse, Journal of the American Chemical Society, 124 (2002) 8653-8660. [54] L.J. Fetters, N. Hadjichristidis, J.S. Lindner, J.W. Mays, Molecular Weight Dependence of Hydrodynamic and Thermodynamic Properties for Well‐Defined Linear Polymers in Solution, Journal of Physical and Chemical Reference Data, 23 (1994) 619-640. [55] A. Latorre-Sánchez, A. Alegría, F. Lo Verso, A.J. Moreno, A. Arbe, J. Colmenero, J.A. Pomposo, A Useful Methodology for Determining the Compaction Degree of Single-Chain Nanoparticles by Conventional SEC, Particle & Particle Systems Characterization, 33 (2016) 373-381. [56] O. Altintas, J. Willenbacher, K.N.R. Wuest, K.K. Oehlenschlaeger, P. Krolla-Sidenstein, H. Gliemann, C. Barner-Kowollik, A Mild and Efficient Approach to Functional Single-Chain Polymeric Nanoparticles via Photoinduced Diels–Alder Ligation, Macromolecules, 46 (2013) 8092-8101. [57] P. Wang, H. Pu, M. Jin, Single-chain nanoparticles with well-defined structure via intramolecular crosslinking of linear polymers with pendant benzoxazine groups, Journal of Polymer Science Part A: Polymer Chemistry, 49 (2011) 5133-5141. [58] P. Wang, H. Pu, J. Ge, M. Jin, H. Pan, Z. Chang, D. Wan, Fluorescence-labeled hydrophilic nanoparticles via single-chain folding, Materials Letters, 132 (2014) 102-105. [59] A. Ruiz de Luzuriaga, I. Perez-Baena, S. Montes, I. Loinaz, I. Odriozola, I. García, J.A. Pomposo, New Route to Polymeric Nanoparticles by Click Chemistry Using Bifunctional Cross-Linkers, Macromolecular Symposia, 296 (2010) 303-310.

Chapter 4: Enzyme-Mimetic Single-Chain
Nanoparticles for the Synthesis of PEDOT


Enzyme-Mimetic Single-Chain Nanoparticles for the Synthesis of PEDOT
77
4.1. Motivation
The use of single-chain polymer nanoparticles (SCNPs) as enzyme-mimic constructs has
attracted significant interest in recent years. In this Chapter, we investigate the design of
SCNPs as artificial iron-containing pseudo-enzymes for the synthesis of a relevant
intrinsically conducting polymer (ICP) such as poly(3,4-ethylenedioxythiophene), PEDOT.
This is the first report of the use of SCNPs as enzyme-mimetic nano-objects for the synthesis
of ICPs.
4.2. Introduction
Intrinsically conducting poly(3,4-ethylenedioxythiophene): polystyrenesulfonate (PEDOT:
PSS) films prepared upon water removal from PEDOT: PSS dispersions have attracted
significant interest for the development of transparent electrodes [1], as functional layers
in light emitting diodes [2], electrochromic devices [3] and solar cells [4], as well as for
biosensing [5] and regenerative medicine [6] applications.
Poly(3,4-ethylenedioxythiophene) (PEDOT) is a conjugated polymer. It is a polythiophene
derivative. It is formed by the polymerization of bicyclic monomer 3,4-
ethylenedioxythiophene (EDOT). The EDOT molecule consists of a thiophene ring and a
dioxyethylene group bridging across the 3 and 4 positions of the heterocyclic ring. PEDOT
is insoluble in water. In its oxidative state, PEDOT has a positive charge roughly every third
repeating unit, thus the conductivity is produced through hole transport.
PEDOT:PSS is a polymer mixture made of 2 polymers: PEDOT and PSS. It is a successful
conducting polymer with many practical applications (Scheme 4.1).
Scheme 4.1. Chemical structure of PEDOT: PSS.

Chapter 4
78
PEDOT:PSS consists of positively charged conjugated PEDOT and negatively charged
polystyrene sulfonate (PSS) [7]. PEDOT: PSS, unlike pure PEDOT, is dispersible in water and
forms a deep-blue opaque solution. It forms a continuous thin film on rigid or flexible
substrates by various solution processing techniques. PEDOT: PSS films are smooth and thin
films are almost transparent in the visible range. PEDOT: PSS exhibits a wide range of
electrical conductivities that range from 10-2 to 103 S cm-1. These conductivities of the
polymer are influenced by the conditions of the synthesis, processing additives and post-
treatment. PEDOT: PSS possesses good photo stability and electrical stability.
PEDOT:PSS has been utilized in a wide range of applications like antistatic coating, as
electrode in light-emitting diodes (LEDs), photovoltaics, memories, sensors, electrochromic
devices, field effect transistors and circuits in general [8]. One potential application is as
electrode in organic solar cells (OSC). The electrodes are the bottleneck of the processing of
OSCs. At least one electrode needs to be transparent in order to collect light. Currently the
standard transparent electrode is made of doped indium tin oxide (ITO). The high cost and
brittleness if ITO demands an alternative. PEDOT:PSS is promising as a substitute because
of its transparency in the visible range, high mechanical flexibility, excellent thermal
stability and can be produced through conventional solution processing [9].
However, PEDOT: PSS has a conductivity much lower than that of ITO (3000 S cm-1) but it
can be enhanced. Several treatments have been performed to enhance the conductivity by
3 orders of magnitude. These treatments include hydrophilic solvents like sorbitol [8],
methanol [9], DMSO [10], ethylene glycol, glycerol… and thermal annealing [8]. Screening
by polar solvents causes the excess PSS to dissolve and the system is rearranged forming a
higher PEDOT concentration film with higher conductivity. It has also been suggested that
increasing the crystallinity of PEDOT:PSS increases its conductivity [11].
There are two conduction mechanisms in PEDOT: PSS. One of them is dominated by
polarons and the other by bipolarons. Bipolarons are more efficient charge carriers and
PEDOT: PSS films have different conductivities according to which charge carrier
dominates. The higher charge density provided by bipolarons leads to higher conductivity.
Absorption of light by polarons produces a peak in the spectrum centered at ~795 nm.
Bipolarons produce a broad absorption in the near infrared that is centered at ~3600 cm-1
[12].
The first enzyme-mediated synthesis of a PEDOT: PSS dispersion was reported in 2007,
through the use of horseradish peroxidase in the presence of PSS as both water-soluble
template and charge-balancing dopant [13]. Traditional synthesis of PEDOT: PSS
dispersions involves the use of iron-containing salts and oxidants such as ammonium
persulfate. With the aim to introduce environmentally friendly alternatives over
conventional chemical catalyst, a variety of enzyme mediated synthesis of PEDOT: PSS have
been developed in recent years by introducing proteins containing iron in a heme complex
(horseradish peroxidase [1], soybean peroxidase [14], catalase and hemoglobin [12],
cytochrome c [15]) and hydrogen peroxide as an oxidant. The properties of the resulting
PEDOT: PSS films depend on the specific enzyme employed during the synthesis [16].
Interestingly, as demonstrated by Hira and Payne [17], even simple iron-binding proteins
showing non-enzymatic activity (e.g., transferrin) can been used as oxidants for the
synthesis of PEDOT: PSS dispersions. This fact significantly expands the library of
biomolecular oxidants available for the synthesis of PEDOT based films with a desired set
of properties, since nowadays over 800 different heme proteins are known [18].

Enzyme-Mimetic Single-Chain Nanoparticles for the Synthesis of PEDOT
79
Recently, the use of single-chain polymer nanoparticles (SCNPs) as enzyme-mimic
constructs has attracted significant interest [19-22]. It is worth mentioning that SCNPs
endowed with enzyme-mimetic morphology and activity often show increased stability
against thermal changes and reduced degradability when compared to natural enzymes
[23]. SCNPs are constructed via self-folding of a single linear polymer chain by means of
intra-chain covalent bonds or supramolecular interactions (e.g., hydrogen bonding,
dynamic covalent bonds, metal complexation) [24-34]. Two limiting morphologies have
been observed in SCNPs depending on the particular synthesis route employed and the
hydrophobic/hydrophilic balance of the SCNP precursor chain. A sparse morphology
resembling that displayed by intrinsically disordered proteins is often observed by means
of intra-chain folding/collapse of the precursor under good solvent conditions [35, 36].
Conversely, a globular morphology more akin to that found in enzymes is typically obtained
by single-chain self-folding in water of amphiphilic (neutral or charged) random
copolymers of appropriate composition and molecular weight [37-41].
Recently, SCNPs have been used as enzyme-mimetic nanoreactors for the synthesis of a
variety of chemical compounds [19], gold nanoparticles [42], quantum dots [43], and carbon
nano-dots [44], as well as for ring-opening polymerization (ROP) [45] and living radical
polymerization (LRP) [46, 47] processes. Hence, SCNPs containing entrapped B(C6F5)3
molecules were found to display polymerase-like activity toward tetrahydrofuran via ring-
opening polymerization in the presence of glycidyl phenyl ether that played the role of a co-
catalyst [45]. Additionally, Sanchez-Sanchez and coworkers reported the metalloenzyme-
mimic properties of copper (II)-containing SCNPs toward the controlled radical
polymerization of water-soluble vinyl-type monomers under reductive conditions [46].
Very recently, efficient living radical polymerization of various alkyl methacrylate
monomers using iron-containing SCNPs has been described by Azuma et al. [47].
However, to the best of our knowledge, the use of water-soluble self-folded metal-
containing SCNPs as robust enzyme-mimic nanoreactors for the synthesis of intrinsically
conducting polymers (ICPs) via step growth polymerization has not been investigated yet.
In this Chapter, we disclose the use of water-soluble self-folded metal-containing single-
chain nanoparticles (SCNPs) as robust enzyme-mimic nanoreactors for the synthesis of ICPs
via step-growth polymerization. As a proof of concept, we report the first enzyme-mimetic
synthesis of PEDOT: PSS dispersions at room temperature (r.t.) via oxidative
polymerization using self-folded iron-containing SCNPs as efficient artificial pseudo-
enzymes (Scheme 4.2).
Remarkably, this work paves the way to the synthesis of other types of intrinsically
conducting polymers (e.g., polyaniline, polypyrrole) for a variety of potential applications
using water-soluble SCNPs as robust enzyme-mimic nanoreactors operating at r.t.
Moreover, it expands the use of SCNPs as bioinspired catalysts from chain-growth
polymerization (i.e., ROP and LRP) to step-growth polymerization (i.e., polycondensation
via oxidative polymerization).

Chapter 4
80
Scheme 4.2. Synthesis of PEDOT: PSS by enzymes and artificial pseudo-enzymes.
4.3. Experimental procedures
4.3.1. Materials
Oligo(ethylene glycol) methyl ether methacrylate (OEGMA) (average Mn∼300 g/mol), 2-
acetoacetoxy ethyl methacrylate (AEMA) (95%), 3,4-ethylenedioxythiophene (EDOT)
(97%), poly(sodium 4- styrenesulfonate) (PSS) (average Mw∼77000 g/mol), iron(II)
acetate (Fe(OAc)2) (95%), 2,2-azobis(2-methylpropionitrile) (AIBN) (≥98%), hydrogen
peroxide (H2O2) (30 wt% solution in water, ACS reagent), horseradish peroxidase (HRP)
(type VI, essentially salt-free, lyophilized powder, ≥250 units/mg), poly(3,4-
ethylenedioxythiophene)-poly(styrenesulfonate) (PEDOT:PSS) (3.0-4.0% in H2O, high-
conductivity grade), 1,4-dioxane (anhydrous, 99.8%), N,N-dimethyl formamide (DMF)
(ACS reagent, 99.8%) and deuterated chloroform (CDCl3) (99.96 atom % D, containing
0.03% (v/v) tetramethylsilane, TMS) were purchased from Sigma-Aldrich.
Tetrahydrofuran (THF) (GPC grade), diethyl ether (Et2O) (ACS reagent, anhydrous, >
99.0%), hexane (anhydrous, 95 %), and hydrochloric acid (extra pure, 37% in water) were
supplied by Scharlau. 4-Cyanopentanoic acid dithiobenzoate (> 97%) was purchased from
Strem Chemicals. Deionized water obtained from a Thermo Scientific apparatus (Barnstead
TII Pure Water System) was employed in this work. AIBN was recrystallized from methanol.
OEGMA and AEMA were purified by passing through basic and neutral alumina,
respectively.
4.3.2. Techniques
Size exclusion chromatography (SEC) measurements were performed at 30 °C on an Agilent
1200 system equipped with PLgel 5 μm Guard and PLgel 5 μm MIXED-C columns and triple
detection: a differential refractive index (RI) detector (Optilab Rex, Wyatt), a multi-angle
laser light scattering (MALLS) detector (MiniDawn Treos, Wyatt), and a viscosimetric (VIS)

Enzyme-Mimetic Single-Chain Nanoparticles for the Synthesis of PEDOT
81
detector (ViscoStar-II, Wyatt). Data analysis was performed with ASTRA Software (version
6.1) from Wyatt. THF was used as eluent at a flow rate of 1 ml/min. A value of dn/dc = 0.115
was used for the precursor and the single-chain nanoparticles.
The freeze-drying system employed was a Telstar-Cryodos equipment.
1H nuclear magnetic resonance (NMR) spectra were recorded on a Bruker spectrometer
operating at 400 MHz, using CDCl3 as solvent. AEMA content was determined following the
procedure described in section 4.4.1. [46].
Fourier transform infra-red (FTIR) measurements were performed at r.t. on a Jasco 3600
FTIR spectrometer.
Dynamic Light Scattering (DLS) measurements were carried out at 25 °C in a Zetasizer
Nano-ZS apparatus.
Ultraviolet-visible (UV–vis) spectra were recorded on an Agilent 8453A apparatus
equipped with a Peltier thermostatic cell holder (T-controller 89090A).
Metal content was determined by inductively coupled plasma (ICP) atomic emission
spectroscopy performed on an Agilent 7700X spectrometer.
TGA Measurements were performed in a Q500, TA Instruments Thermogravimetric
analysis. The sample was heated from 25ºC to 800ºC in an inert atmosphere.
Atomic Force Microscopy (AFM) measurements were performed using a Multimode AFM,
equipped with a Nanoscope V controller (Bruker). All images were taken in tapping mode,
using Multi300Al-G probes (Budgetsensors). Samples for AFM were prepared by spin
coating (3000 rpm, 2 min) the PEDOT: PSS dispersions at 100 mg/ml concentration onto
glass slides, allowing to obtain thin films. Prior coating, the glass substrates were washed in
soapy solution with deionized water, rinsed with acetone and finally dried under a N2 flow.
Conductivity of PEDOT: PSS thin films was measured using a 4-point probe setup (HFS600-
P, Linkam) and an Alpha impedance analyzer (Novocontrol).
4.3.3. Synthesis of OEGMA-AEMA copolymers
In a typical procedure, OEGMA (1.54 ml, 5.4 mmol), AEMA (0.34 ml, 1.8 mmol), CPADB (20
mg, 7×10⁻² mmol) and AIBN (2.35 mg, 1.4×10⁻² mmol) were dissolved in 1,4-dioxane (3
ml). The reaction mixture was degassed by passing argon for 15 min. The copolymerization
reaction was carried out at 70 ºC for 24 h (Scheme 4.3). The resulting pink oil was isolated by precipitation in hexane. After that, the copolymer was redissolved in a minimal amount
of THF and added to a large excess of hexane (twice), the residual solvent was concentrated
and further drying at r.t. under dynamic vacuum. Poly(OEGMA-co-AEMA) copolymers were
obtained as pink oils with 24-44 mol% of AEMA content, as determined by 1H NMR
spectroscopy [46].

Chapter 4
82
Scheme 4.3. Representation of the synthesis of poly (OEGMA-co-AEMA) precursor copolymer P.
4.3.4. Synthesis of artificial iron-containing pseudo-enzymes
In a typical procedure, 1000 mg of an amphiphilic random copolymer of
oligo(ethyleneglycol) methyl ether methacrylate (OEGMA) and 2-acetoacetoxy ethyl
methacrylate (AEMA) prepared following the experimental procedures reported the
previous section [46] (P, Mw: 135 KDa, Ð: 1.10, AEMA content: 24 mol%) were dissolved in
1000 ml of THF at r.t. To this solution, 73.4 mg of Fe(OAc)2 dissolved in 1 mL of DMF were
added under stirring to induce intrachain folding/collapse via iron(II)/ (AEMA)2
complexation (see Scheme 4.5). After 24 h of reaction time, solvent exchange to water was
preformed and the mixture was dialyzed to remove unreacted Fe(OAc)2 and residual
organic compounds. The concentration of the final single-chain nanoparticles (NP) solution
in water was 0.96 mg/ml. Finally, a fraction of the NP solution was isolated via freeze-drying
for characterization and other fraction was keep in solution to be used as artificial iron-
containing pseudo-enzymes. The average number of iron atoms per individual single-chain
nanoparticle was found to be 48 by ICP atomic emission spectroscopy.
4.3.5. Synthesis of PEDOT using artificial iron-containing pseudo-enzymes
In a typical reaction, 0.512 mL of artificial iron-containing pseudo-enzymes aqueous
solution (0.49 mg of NP), 226.6 mg of poly(sodium 4-styrenesulfonate) (PSS) and 0.117 mL
of 3,4-ethylenedioxythiophene (EDOT) monomer were dissolved in water (20 ml) at r.t.
under an argon atmosphere. To this mixture, 0.112 ml of a hydrogen peroxide solution (30
wt% H2O2 solution in water) was added (Scheme 4.4). The oxidative polymerization of
EDOT was followed by UV–vis spectrometry by taken periodically samples from the
polymerization medium. After reaction completion, conducting films (containing the
artificial iron-containing pseudo-enzymes) were prepared from the resulting PEDOT: PSS
dispersions via solvent casting.

Enzyme-Mimetic Single-Chain Nanoparticles for the Synthesis of PEDOT
83
Scheme 4.4. Illustration of the synthesis of PEDOT: PSS.
4.3.6. Synthesis of PEDOT using Fe(OAc)2 (as control reaction)
In a typical reaction, 0.512 mL of a Fe(OAc)2 aqueous solution (23.73 mg of Fe(OAc)2), 226.6
mg of poly(sodium 4-styrenesulfonate) (PSS) and 0.117 ml of 3,4-ethylenedioxythiophene
(EDOT) monomer were dissolved in water (20 ml) at r.t. under an argon atmosphere. This
amount of Fe(OAc)2 is the equimolar quantity used in the PEDOT synthesis using SCNPs. To
this mixture, 0.112 ml of a hydrogen peroxide solution (30 wt% H2O2 solution in water) was
added. The oxidative polymerization of EDOT was followed by UV-vis spectrometry, until a
total time of 5 hours.
4.4. Results and discussion
4.4.1. Synthesis of iron-containing self-folded single-chain nanoparticles as artificial
pseudo-enzymes
SCNPs were synthesized from poly(OEGMA-co-AEMA) copolymers. 1H-NMR spectra of
copolymers synthesized in this Chapter correspond to those found in the literature.
OEGMA/AEMA ratios of the precursor polymers were calculated measuring the normalized
integrated areas of the peaks (Figure 4.1) of the NMR spectrum of the OEGMA-co-AEMA
copolymers.

Chapter 4
84
Figure 4.1. 1H NMR spectrum of poly(OEGMA-co-AEMA) precursor copolymer P.
Copolymer compositions and molecular weights of copolymers synthesized in this project
are shown on Table 4.1 below.
Table 4.1. Characterization data of poly(OEGMA-co-AEMA) precursor copolymers.
OEGMA/AEMA ratio Mw (kDa) Ð
56.2% OEGMA/43.8% AEMA 29.2 1.01
76.4% OEGMA/23.6% AEMA 134.6 1.10
Scheme 4.5 illustrates the synthetic approach followed in this work to produce iron(II)-
containing SCNPs as artificial pseudo-enzymes. Based on previous works [46], we
synthesized a high molecular weight (Mw = 135 kDa, Ð = 1.10) amphiphilic random
copolymer (P) composed of OEGMA (76 mol%) and AEMA (24 mol%) units to guarantee

Enzyme-Mimetic Single-Chain Nanoparticles for the Synthesis of PEDOT
85
the formation of single-chain core-shell globules in water with the hydrophobic AEMA units
placed in the core and the hydrophilic OEGMA moieties in the shell, by working at highly
diluted conditions (1 mg P/ ml). Metal complexation of AEMA units was carried out for 24
h at r.t. The resulting single-chain nanoparticles (NP) were purified from unreacted
Fe(OAc)2 and residual organic compounds by dialysis after solvent exchange to water, and
isolated for characterization via freeze-drying.
Scheme 4.5. Schematic illustration of the synthesis of self-folded iron (II)-containing single-chain nanoparticles (NP) as artificial pseudo-enzymes.
The efficient formation of self-folded iron-containing SCNPs was confirmed by combined
size exclusion chromatography (SEC) and dynamic light scattering (DLS) measurements. As
depicted in Figure 4.2, the iron-containing SCNPs NP showed an increase in retention time
(i.e. a reduction in hydrodynamic size) during SEC in THF when compared to the
amphiphilic random copolymer precursor P due to the formation of intra-chain
iron(II)/(AEMA)2 complexes in the former case.

Chapter 4
86
Figure 4.2. Size-exclusion chromatography (SEC) traces in THF showing the typical reduction in hydrodynamic size of an amphiphilic random poly(OEGMA-co-AEMA) copolymer (P) (red line) upon intra-chain iron(II) complexation to give single-chain nanoparticles (NP) (blue line).
The difference in hydrodynamic size of the iron-containing SCNPs when dissolved in water
(good solvent for OEGMA units, bad solvent for AEMA moieties) and in THF (good solvent
for both OEGMA and AEMA units) is shown in Figure 4.3, as determined by DLS
measurements. The conformational change taking place on passing from THF to H2O due to
a modification in solvophilic/solvophobic balance promoting the self-folding of P to
individual core-shell nanoparticles is illustrated schematically in Scheme 4.5. Further
compaction is induced by intrachain iron(II)/(AEMA)2 complexation. On average, self-
folded iron-containing SCNPs were found to contain 48 Fe atoms per single-chain
nanoparticle as determined by ICP atomic emission spectroscopy, which is a value similar
to that found in copper-containing globular SCNPs prepared from amphiphilic random
poly(OEGMA-co-AEMA) copolymers [46]. The above results support the efficient formation
in water of individual SCNPs containing Fe(II)/(AEMA)2 complexes placed in a hydrophobic
core, which is stabilized by an external hydrophilic shell.
7,5 8 8,5 9 9,5
PNP
Re
lative inte
nsity (
a.u
.)
time (min)

Enzyme-Mimetic Single-Chain Nanoparticles for the Synthesis of PEDOT
87
Figure 4.3. Dynamic light scattering (DLS) results showing the different size of single-chain nanoparticles NP in H2O, which is a good solvent for OEGMA units and a bad solvent for AEMA moieties (blue line) and in THF, which is a good solvent for both OEGMA and AEMA repeat units (red line).
TGA measurements of iron-containing SCNPs left a residue of 8.48% of the original mass
demonstrating SCNPs contain iron (Figure 4.4 B). The residual weight that can be assigned
to FeO species due to the black colour of the residues. The precursor P, which was taken as
a control, was totally decomposed at temperatures above 450ºC (Figure 4.4 A), so the
residues observed for NP can be only attributed to metal oxide species.
0
5
10
15
20
25
1 10 100
Nu
mb
er
(%)
Size (nm)
THFWater

Chapter 4
88
Figure 4.4. Thermogram of the decomposition of poly (OEGMA-co-AEMA) precursor copolymer P (A) and iron(II) containing SCNPs NP (B) by thermogravimetric analysis showing the reduction of the mass (red line) of SCNPs with temperature and the mass loss rate (blue line).

Enzyme-Mimetic Single-Chain Nanoparticles for the Synthesis of PEDOT
89
4.4.2. Synthesis and characterization of PEDOT using artificial iron-containing
pseudo-enzymes
The enzyme-mimetic synthesis of PEDOT at r.t. using self-folded iron(II)-containing single-
chain nanoparticles as artificial pseudo-enzymes is depicted in Scheme 4.6. We follow a
recipe similar to that used during the first reported enzymatic synthesis of PEDOT [13] but
totally replacing the horseradish peroxidase (HRP) enzyme by the self-folded iron(II)-
containing SCNPs NP as artificial pseudo-enzymes, at a concentration of 0.96 mg NP/mL,
(see Section 4.3.4 for technical details).
Scheme 4.6. Schematic illustration of enzyme-mimetic synthesis of PEDOT: PSS dispersions at r.t. using self-folded iron(II)-containing SCNPs as artificial pseudo-enzymes.
As illustrated in Figure 4.5, the initially transparent reaction medium takes a deep blue
colour upon formation of the PEDOT: PSS dispersion at 3 h of reaction time, showing the
ability of the self-folded iron(II)-containing SCNPs to perform as artificial pseudo-enzymes.
Figure 4.5. Evolution of the colour of the reaction mixture with reaction time during the enzyme-mimetic synthesis of PEDOT.
It should be noted that by using neat Fe(OAc)2 instead of NP, the resulting PEDOT: PSS
dispersion took a deep blue colour only after 5 h of reaction time. In Figure 4.6, we present

Chapter 4
90
photographs of the reaction flask as a function of time. We observed an evolution of the
solution’s colour with time, from light to dark blue.
Figure 4.6. Photographs of the reaction flask as a function of time, for PEDOT synthesis using Fe(OAc)2.
A comparison of the performance of the SCNPs versus HRP for the preparation of PEDOT:
PSS dispersions is shown in Figure 4.7, as determined by UV–vis spectroscopy. Although for
the HRP-mediated synthesis of PEDOT: PSS dispersions the reported optimum temperature
was 4 °C [13], we found that the reaction temperature can be increased to r.t. by working
under an inert argon atmosphere (Figure 4.7).
Figure 4.7. Comparison of the UV-vis spectra corresponding to PEDOT : PSS dispersions prepared at r.t. by using self-folded iron(II)-containing single-chain nanoparticles as artificial pseudo-enzymes (NP) or horseradish peroxidase (HRP) enzyme (also the spectrum obtained by using HRP at 4ºC is included for comparison).
Advantageously, the polymerization kinetics at r.t. is faster than at 4 °C. Remarkably, the
characteristics of the PEDOT: PSS dispersions and PEDOT: PSS films synthesized using NP
or HRP at r.t. for 3 h were very similar, as determined by UV–Vis (Figure 4.7) and FTIR
spectrometry (Figure 4.8), respectively.
300 400 500 600 700 800 900 1000
Reaction time: 3h
HRP 4 ºCNP r.t.HRP r.t.
Abso
rba
nce (
a.u
.)
Wavelength (nm)

Enzyme-Mimetic Single-Chain Nanoparticles for the Synthesis of PEDOT
91
Figure 4.8. FTIR spectra corresponding to PEDOT: PSS films prepared from the dispersions described in Figure 4.7.
Hence, the characteristic bipolaron absorption band around 800 nm was observed in both
the PEDOT: PSS dispersion prepared with the artificial pseudo-enzymes NP and the PEDOT:
PSS dispersion synthesized using the horseradish peroxidase, HRP, enzyme (Figure 4.7).
Such bipolaron absorption band which is a signature of the conductivity of the resulting
PEDOT was absent when the synthesis was performed using NP dissolved in THF instead of
water (see Figure 4.9).

Chapter 4
92
Figure 4.9. Comparison of the UV-vis spectra corresponding to PEDOT: PSS dispersions prepared with NP in water, and NP in THF.
Thin films prepared form PEDOT: PSS dispersions synthesized at r.t. for 3 h using NP as
artificial pseudo-enzymes were examined by atomic force microscopy (AFM) as illustrated
in Figure 4.10. The bare glass slide showed a roughness of about 2.15 nm (Figure 4.10 A)
that after coating with the PEDOT: PSS dispersion was significantly reduced to 0.35 nm
(Figure 4.10 B). AFM images also showed that there were not any important presence of
holes or discontinuities on the substrate after coating, indicating the homogeneous
coverage of the PEDOT: PSS thin films.
300 400 500 600 700 800 900 1000
Reaction time: 3h
NP in water r.t.NP in THF r.t.
Abso
rban
ce
(a
.u.)
Wavelength (nm)

Enzyme-Mimetic Single-Chain Nanoparticles for the Synthesis of PEDOT
93
Figure 4.10. AFM topography images (3 µm x 3 µm) of: (A) a bare glass slide, and (B) a PEDOT: PSS coated glass slide prepared from a PEDOT: PSS dispersion synthesized at r.t. for 3 h of reaction time by using self-folded iron(II)-containing single-chain nanoparticles NP as artificial pseudo-enzymes.
Using sharp tweezers, we performed a scratch on the PEDOT: PSS thin film and its thickness
was quantified via AFM by the step height presented in Figure 4.11, resulting in a film
thickness of 250 ± 4 nm. Conductivity measurements on the PEDOT: PSS coated glass slide
were performed using a 4 point probe setup. A mean electrical conductivity of σ = 1×10⁻⁴
S/cm was determined which was similar to that typically reported for PEDOT: PSS films
prepared from PEDOT: PSS dispersions synthesized using iron-containing proteins like
catalase (σ = 1.3×10⁻⁵ S/cm).

Chapter 4
94
Figure 4.11. Film thickness determination via AFM step height method.
4.4.3. Characterisation of PEDOT Synthesised using Fe(OAc)2 (control reaction)
In Figure 4.12 we show the UV-Vis spectrum after 5 h of synthesis time. The characteristic
bipolaron absorption band around 800 nm (signature of the conductivity) was observed,
indicating the successful synthesis of PEDOT: PSS.

Enzyme-Mimetic Single-Chain Nanoparticles for the Synthesis of PEDOT
95
Figure 4.12. UV-Vis spectrum of PEDOT: PSS prepared using Fe(OAc)2.
4.5. Conclusions
In this Chapter we report the use of water-soluble self-folded metal-containing single-chain
nanoparticles (SCNPs) as robust enzyme-mimic nanoreactors for the synthesis of
intrinsically conducting polymers (ICPs) via step-growth polymerization. As a proof of
concept, we performed the first enzyme-mimetic synthesis of poly(3,4-
ethylenedioxythiophene): polystyrenesulfonate (PEDOT: PSS) dispersions via oxidative
polymerization using self-folded iron(II)-containing SCNPs as efficient artificial pseudo-
enzymes. The synthesis, which can be easily carried out in water at r.t for 3 h under argon
atmosphere, provides with a PEDOT: PSS dispersion displaying the characteristic bipolaron
UV–vis absorption band at 800 nm from conducting PEDOT. Thin films prepared from this
PEDOT: PSS dispersion showed a value of electrical conductivity of σ = 1×10⁻⁴ S/cm, similar
to that typically reported for PEDOT: PSS films prepared from PEDOT: PSS dispersions
synthesized using iron-containing proteins like catalase (σ = 1.3×10⁻⁵ S/cm). This work
opens the door to the synthesis of other types of ICPs (e.g., polyaniline, polypyrrole) using
water-soluble metal-containing SCNPs as robust enzyme-mimic nanoreactors operating at
r.t, and expands the use of SCNPs as bioinspired catalysts from chain-growth polymerization
(i.e., ring-opening polymerization and living radical polymerization) to step-growth
polymerization (i.e., polycondensation via oxidative polymerization).
4.6. References
[1] Z. Yu, Y. Xia, D. Du, J. Ouyang, PEDOT:PSS Films with Metallic Conductivity through a Treatment with Common Organic Solutions of Organic Salts and Their Application as a
200 400 600 800 1000
Absorb
ance (
a.u
.)
Wavelength (nm)

Chapter 4
96
Transparent Electrode of Polymer Solar Cells, ACS Applied Materials & Interfaces, 8 (2016) 11629-11638. [2] I. Lee, G.W. Kim, M. Yang, T.-S. Kim, Simultaneously Enhancing the Cohesion and Electrical Conductivity of PEDOT:PSS Conductive Polymer Films using DMSO Additives, ACS Applied Materials & Interfaces, 8 (2016) 302-310. [3] D. Mecerreyes, R. Marcilla, E. Ochoteco, H. Grande, J.A. Pomposo, R. Vergaz, J.M. Sánchez Pena, A simplified all-polymer flexible electrochromic device, Electrochimica Acta, 49 (2004) 3555-3559. [4] Z. Hu, J. Zhang, Z. Hao, Y. Zhao, Influence of doped PEDOT:PSS on the performance of polymer solar cells, Solar Energy Materials and Solar Cells, 95 (2011) 2763-2767. [5] E. Moczko, G. Istamboulie, C. Calas-Blanchard, R. Rouillon, T. Noguer, Biosensor employing screen-printed PEDOT:PSS for sensitive detection of phenolic compounds in water, Journal of Polymer Science Part A: Polymer Chemistry, 50 (2012) 2286-2292. [6] K. Svennersten, M.H. Bolin, E.W.H. Jager, M. Berggren, A. Richter-Dahlfors, Electrochemical modulation of epithelia formation using conducting polymers, Biomaterials, 30 (2009) 6257-6264. [7] K. Sun, S. Zhang, P. Li, Y. Xia, X. Zhang, D. Du, F.H. Isikgor, J. Ouyang, Review on application of PEDOTs and PEDOT:PSS in energy conversion and storage devices, Journal of Materials Science: Materials in Electronics, 26 (2015) 4438-4462. [8] A.M. Nardes, M. Kemerink, M.M. de Kok, E. Vinken, K. Maturova, R.A.J. Janssen, Conductivity, work function, and environmental stability of PEDOT:PSS thin films treated with sorbitol, Organic Electronics, 9 (2008) 727-734. [9] D. Alemu, H.-Y. Wei, K.-C. Ho, C.-W. Chu, Highly conductive PEDOT:PSS electrode by simple film treatment with methanol for ITO-free polymer solar cells, Energy & Environmental Science, 5 (2012) 9662-9671. [10] L. Ouyang, C. Musumeci, M.J. Jafari, T. Ederth, O. Inganäs, Imaging the Phase Separation Between PEDOT and Polyelectrolytes During Processing of Highly Conductive PEDOT:PSS Films, ACS Applied Materials & Interfaces, 7 (2015) 19764-19773. [11] T. Takano, H. Masunaga, A. Fujiwara, H. Okuzaki, T. Sasaki, PEDOT Nanocrystal in Highly Conductive PEDOT:PSS Polymer Films, Macromolecules, 45 (2012) 3859-3865. [12] J.D. Morris, D. Khanal, J.A. Richey, C.K. Payne, Hemoglobin-mediated synthesis of PEDOT:PSS: enhancing conductivity through biological oxidants, Biomaterials Science, 3 (2015) 442-445. [13] V. Rumbau, J.A. Pomposo, A. Eleta, J. Rodriguez, H. Grande, D. Mecerreyes, E. Ochoteco, First Enzymatic Synthesis of Water-Soluble Conducting Poly(3,4-ethylenedioxythiophene), Biomacromolecules, 8 (2007) 315-317. [14] S. Nagarajan, J. Kumar, F.F. Bruno, L.A. Samuelson, R. Nagarajan, Biocatalytically Synthesized Poly(3,4-ethylenedioxythiophene), Macromolecules, 41 (2008) 3049-3052. [15] J.D. Morris, K.M. Wong, C.D. Peñaherrera, C.K. Payne, Mechanism of the biomolecular synthesis of PEDOT:PSS: importance of heme degradation by hydrogen peroxide, Biomaterials Science, 4 (2016) 331-337. [16] J.D. Morris, C.K. Payne, Tuning PEDOT:PSS conductivity with iron oxidants, Organic Electronics, 15 (2014) 1707-1710. [17] S.M. Hira, C.K. Payne, Protein-mediated synthesis of the conducting polymer PEDOT:PSS, Synthetic Metals, 176 (2013) 104-107. [18] J.J. Flores, C.K. Payne, J.D. Morris, Heme protein-mediated synthesis of PEDOT:PSS: enhancing conductivity by inhibiting heme degradation, RSC Advances, 7 (2017) 12017-12021. [19] J.A. Pomposo, Single-Chain Polymer Nanoparticles: Synthesis, Characterization, Simulations, and Applications, John Wiley & Sons2017. [20] J.A. Pomposo, Bioinspired single-chain polymer nanoparticles, Polymer International, 63 (2014) 589-592. [21] M. Huo, N. Wang, T. Fang, M. Sun, Y. Wei, J. Yuan, Single-chain polymer nanoparticles: Mimic the proteins, Polymer, 66 (2015) A11-A21.

Enzyme-Mimetic Single-Chain Nanoparticles for the Synthesis of PEDOT
97
[22] A. Latorre-Sánchez, J.A. Pomposo, Recent bioinspired applications of single-chain nanoparticles, Polymer International, 65 (2016) 855-860. [23] J. Rubio-Cervilla, E. González, J.A. Pomposo, Applications of Single-Chain Polymer Nanoparticles, in: J.A. Pomposo (Ed.) Single-Chain Polymer Nanoparticles: Synthesis, Characterization, Simulations, and Applications., Wiley-VCH, Weinheim, Germany, 2017, pp. 341-400. [24] S. Mavila, O. Eivgi, I. Berkovich, N.G. Lemcoff, Intramolecular Cross-Linking Methodologies for the Synthesis of Polymer Nanoparticles, Chemical Reviews, 116 (2016) 878-961. [25] O. Altintas, C. Barner-Kowollik, Single-Chain Folding of Synthetic Polymers: A Critical Update, Macromolecular Rapid Communications, 37 (2016) 29-46. [26] A.M. Hanlon, C.K. Lyon, E.B. Berda, What Is Next in Single-Chain Nanoparticles?, Macromolecules, 49 (2016) 2-14. [27] M. Gonzalez-Burgos, A. Latorre-Sanchez, J.A. Pomposo, Advances in single chain technology, Chemical Society Reviews, 44 (2015) 6122-6142. [28] C.K. Lyon, A. Prasher, A.M. Hanlon, B.T. Tuten, C.A. Tooley, P.G. Frank, E.B. Berda, A brief user's guide to single-chain nanoparticles, Polymer Chemistry, 6 (2015) 181-197. [29] A. Sanchez-Sanchez, J.A. Pomposo, Single-Chain Polymer Nanoparticles via Non-Covalent and Dynamic Covalent Bonds, Particle & Particle Systems Characterization, 31 (2014) 11-23. [30] M. Artar, E. Huerta, E.W. Meijer, A.R.A. Palmans, Dynamic Single Chain Polymeric Nanoparticles: From Structure to Function, Sequence-Controlled Polymers: Synthesis, Self-Assembly, and Properties, American Chemical Society2014, pp. 313-325. [31] A. Sanchez-Sanchez, I. Pérez-Baena, J.A. Pomposo, Advances in Click Chemistry for Single-Chain Nanoparticle Construction, Molecules, 18 (2013) 3339-3355. [32] O. Altintas, C. Barner-Kowollik, Single Chain Folding of Synthetic Polymers by Covalent and Non-Covalent Interactions: Current Status and Future Perspectives, Macromolecular Rapid Communications, 33 (2012) 958-971. [33] M.K. Aiertza, I. Odriozola, G. Cabañero, H.-J. Grande, I. Loinaz, Single-chain polymer nanoparticles, Cellular and Molecular Life Sciences, 69 (2012) 337-346. [34] B.S. Murray, D.A. Fulton, Dynamic Covalent Single-Chain Polymer Nanoparticles, Macromolecules, 44 (2011) 7242-7252. [35] A. Sanchez-Sanchez, S. Akbari, A.J. Moreno, F.L. Verso, A. Arbe, J. Colmenero, J.A. Pomposo, Design and Preparation of Single-Chain Nanocarriers Mimicking Disordered Proteins for Combined Delivery of Dermal Bioactive Cargos, Macromolecular Rapid Communications, 34 (2013) 1681-1686. [36] J.A. Pomposo, I. Perez-Baena, F. Lo Verso, A.J. Moreno, A. Arbe, J. Colmenero, How Far Are Single-Chain Polymer Nanoparticles in Solution from the Globular State?, ACS Macro Letters, 3 (2014) 767-772. [37] T. Terashima, T. Mes, T.F.A. De Greef, M.A.J. Gillissen, P. Besenius, A.R.A. Palmans, E.W. Meijer, Single-Chain Folding of Polymers for Catalytic Systems in Water, Journal of the American Chemical Society, 133 (2011) 4742-4745. [38] T. Akagi, P. Piyapakorn, M. Akashi, Formation of Unimer Nanoparticles by Controlling the Self-Association of Hydrophobically Modified Poly(amino acid)s, Langmuir, 28 (2012) 5249-5256. [39] M. Chen, C.J. Riddles, M.R. Van De Mark, Electroviscous Contribution to the Rheology of Colloidal Unimolecular Polymer (CUP) Particles in Water, Langmuir, 29 (2013) 14034-14043. [40] T. Terashima, T. Sugita, K. Fukae, M. Sawamoto, Synthesis and Single-Chain Folding of Amphiphilic Random Copolymers in Water, Macromolecules, 47 (2014) 589-600. [41] F. Lo Verso, J.A. Pomposo, J. Colmenero, A.J. Moreno, Simulation guided design of globular single-chain nanoparticles by tuning the solvent quality, Soft Matter, 11 (2015) 1369-1375.

Chapter 4
98
[42] J. He, L. Tremblay, S. Lacelle, Y. Zhao, Preparation of polymer single chain nanoparticles using intramolecular photodimerization of coumarin, Soft Matter, 7 (2011) 2380-2386. [43] G. Qian, B. Zhu, Y. Wang, S. Deng, A. Hu, Size-Tunable Polymeric Nanoreactors for One-Pot Synthesis and Encapsulation of Quantum Dots, Macromolecular Rapid Communications, 33 (2012) 1393-1398. [44] B. Zhu, S. Sun, Y. Wang, S. Deng, G. Qian, M. Wang, A. Hu, Preparation of carbon nanodots from single chain polymeric nanoparticles and theoretical investigation of the photoluminescence mechanism, Journal of Materials Chemistry C, 1 (2013) 580-586. [45] I. Perez-Baena, F. Barroso-Bujans, U. Gasser, A. Arbe, A.J. Moreno, J. Colmenero, J.A. Pomposo, Endowing Single-Chain Polymer Nanoparticles with Enzyme-Mimetic Activity, ACS Macro Letters, 2 (2013) 775-779. [46] A. Sanchez-Sanchez, A. Arbe, J. Kohlbrecher, J. Colmenero, J.A. Pomposo, Efficient Synthesis of Single-Chain Globules Mimicking the Morphology and Polymerase Activity of Metalloenzymes, Macromolecular Rapid Communications, 36 (2015) 1592-1597. [47] Y. Azuma, T. Terashima, M. Sawamoto, Self-Folding Polymer Iron Catalysts for Living Radical Polymerization, ACS Macro Letters, 6 (2017) 830-835.

Chapter 5: Fast and Efficient Synthesis of Highly
Fluorescent Single-Chain Nanoparticles


Fast and efficient synthesis of highly fluorescent Single-Chain Nanoparticles
101
5.1. Motivation
The development of highly fluorescent nanoparticles is of great interest for a variety of
practical applications including new generation biological sensors, innovative chemical
probes, improved optoelectronic devices, and intelligent materials. In this Chapter we
report an original method toward the fast and efficient synthesis of highly fluorescent
SCNPs based on the efficient use of aggregation-induced emission (AIE) cross-linking
fluorophores.
5.2. Introduction
Single-chain polymer nanoparticles (SCNPs) are soft nanomaterials constructed via intra-
chain cross-linking of individual precursor polymer chains [1-7], with promising prospects
for nanomedicine [8-11], catalysis [12-19], sensing [20, 21], and other different application
fields [22]. The SCNP local pockets formed upon chain collapse at high dilution provide a
unique (and tunable) environment for attachment -either temporally or permanently- of
active species, such as drugs, catalytic metal ions, or dyes [23, 24]. Moreover, SCNPs are
promising building blocks for the construction of new fluorescent probes with ultra-small
size, higher brightness, and better photostability than previous particle-based systems.
In general, fluorescent nano-probes are receiving enthusiastic pursuits from medical
scientists because of their promising potential applications in cell imaging, targeting,
tracing, and therapeutics [25]. Conventional luminescent nanoparticles are mainly based on
inorganic quantum dots [26], lanthanide ion doped nanomaterials [27], and metallic
nanoclusters [28] because of their excellent photostability with narrow emission, sub-
nanometer size, and superior upconversion performance, although potential toxicity issues
and poor biodegradability have largely hindered their common employment in biomedical
applications [29].
Even if the field of SCNPs is still very incipient, a variety of fluorescent SCNPs have been
synthesized through four different synthetic approaches based on common, traditional
fluorophores [30]: (i) functionalization of the SCNP precursor polymer with a conventional
fluorophore molecule before intra-chain cross-linking [31]; (ii) physical entrapment of an external traditional fluorophore molecule into non-fluorescent SCNPs [32] or in situ
generation of this fluorophore molecule inside the SCNP [33]; (iii) post-functionalization of
the SCNP surface via chemical reaction with appropriate, complementary reactive
fluorophore molecules [34]; and (iv) generation of fluorophore functional moieties through
intramolecular crosslinking [35].
In spite of recent advances in this field, to the best of our knowledge, the use of aggregation-
induced emission (AIE) cross-linking fluorophores [36] to endow SCNPs with fluorescent
properties has not been investigated yet. AIE compounds [37] are opposite to conventional
fluorescent probes which often suffer from the well-known (and deleterious) aggregation-
caused quenching (ACQ) effect [38]. On the contrary, AIE molecules- as first described by
Tang and co-workers [39] in 2001-are nearly non-emissive compounds in solution but
become highly fluorescent upon restriction of their intramolecular rotations (the so-called
RIR mechanism [37]). In short, AIE fluorophores usually show very weak fluorescence or
non-emissivity when molecularly dissolved in a good solvent, but are highly emissive when

Chapter 5
102
aggregated -or after molecular immobilization- because of the restriction of the
intramolecular rotation in the aggregate (immobilized) state leading the excitations to
decay radiatively. There are several practical applications of AIE compounds in biological
sensors, chemical probes, optoelectronic devices, and intelligent materials [36-38].
Currently, the development of fluorescent polymers and nanomaterials based on AIE probes
is a field of intense activity [40-54]. Hexaphenyl silole (HPS) is the archetypal form of AIE
luminogen. The HPS molecule consists of a silole core attached to six phenyl rings. Like in
other AIEgens the phenyls (rotors) can rotate against the silole ring (stator) via the single-
bond axes. In the solutions, the intramolecular rotation is active, which serves as a
relaxation channel for the excited state to decay. In the aggregates, the rotation is restricted
due to the physical constraint, which blocks the non-radiative path and activates the
radiative decay. HPS is soluble organic solvents like acetonitrile, tetrahydrofuran (THF) and
chloroform, but is insoluble in water [38].
This property can be generalized to other silole derivatives. Silole derivatives are non-polar
hydrophobic molecules. They contain no polar moieties such as donor and acceptor
functional groups. Some of these derivatives contain reactive functional groups that allow
them to attach to polymers forming fluorescent SCNPs. One example is 1,1-dimethyl-2,5-
bis(4-(azidomethyl)phenyl)-3,4-diphenylsilole (Silole-N3). The Silole-N3 molecule is similar
to HPS, but the two phenyl rings bound to the silicon are substituted by methyl groups and
two of the four phenyl rings are functionalized by azides. These azides are very reactive
under appropriate reaction conditions.
In this chapter, we will investigate a new photoactivation strategy developed for AIE cross-
linking molecules containing azide moieties allowing the fast and efficient synthesis at room
temperature (r.t.) of highly fluorescent SCNPs in solution showing excellent stability of the
fluorescence emission intensity over time. A further motivation of this work is the synthesis
of SCNPs showing fluorescent properties also in the solid state, i.e., free from ACQ effects
often observed for SCNPs based on traditional fluorophores.
5.3. Experimental procedures
5.3.1. Materials
Methyl methacrylate (MMA) (99%), (2-acetoacetoxy)ethyl methacrylate (AEMA) (95%),
2.2′-azo(2-methylpropionitrile) (AIBN) ( ≥98%), p-carboxybenzenesulphonazide (p-
CBSA) (97%), triethylamine (Et3N) (>99%), HPS (98%), 1,1-dimethyl-2,5-bis(4-
(azidomethyl)phenyl)-3,4-diphenylsilole (Silole-N3) (96%), ethyl acetate (EtOAc)
(anhydrous, 99.8%), diethyl ether (Et2O) (ACS reagent, anhydrous, >99.0%),
dichloromethane (CH2Cl2) (anhydrous, ≥99.8%), and deuterated chloroform (CDCl3)
(99.96 atom % D, containing 0.03% (v/v) tetramethylsilane) were purchased from Sigma-
Aldrich and used, unless specified, as received. 2-Cyanoprop-2-yl-dithiobenzoate (CPDB)
(≥97%) was purchased from Strem Chemicals. Methanol (MeOH) (synthesis grade) and
tetrahydrofuran (THF) (HPLC grade) were purchased from Scharlab. AIBN was
recrystallized from methanol. MMA was purified by distillation before use. AEMA was
purified by passing through alumina.

Fast and efficient synthesis of highly fluorescent Single-Chain Nanoparticles
103
5.3.2. Techniques
Experimental UV irradiation setup
UV irradiation experiments were performed using a Hamamatsu UV spot light source (LC8,
Hg−Xe Lamp, UV intensity: 3.5 W/cm2) equipped with an A9616-05 filter [transmittance
wavelength: 300−400 nm (λmax = 365 nm); transmitted intensity: 80%] and the
corresponding UV-light guide. The distance from the guide to the solution containing the
SCNP precursor was 10 cm. The open area during irradiation was 2 cm2. A picture of the
experimental setup is available in Figure 5.1.
Figure 5.1. Illustration of the experimental set-up employed for photoactivated synthesis of single-chain polymer nanoparticles (SCNPs) (SI from ref.[55]).
Characterization techniques
Size exclusion chromatography (SEC) measurements were performed at 30 °C on an Agilent
1200 system equipped with PLgel 5 μm Guard and PLgel 5 μm MIXED-C columns, and triple
detection: a differential refractive index detector (Optilab Rex, Wyatt), a MALLS detector
(MiniDawn Treos, Wyatt), and a viscosimetric (VIS) detector (ViscoStar-II, Wyatt). Data
analysis was performed with ASTRA Software (version 6.1) from Wyatt. THF was used as
an eluent at a flow rate of 1 ml/min. A value of dn/dc = 0.083 was used for precursors and
SCNPs.

Chapter 5
104
1H NMR spectra were recorded at r.t. on a Bruker spectrometer operating at 400 MHz, using
CDCl3 as a solvent. AEMA content was determined following the procedure described in the
results section 5.4 [56].
Fourier-transform infrared (FTIR) spectra were recorded at r.t. on a JASCO 3600 FTIR
spectrometer.
Elemental analysis (EA) measurements were performed in a Euro EA3000 elemental
analyser (CHNS).
Photoluminescence spectra were recorded at r.t. on an Agilent Cary Eclipse spectrometer at
an excitation wavelength of 364 nm.
Transmission electron microscopy (TEM) measurements were performed using a high-
resolution transmission electron microscope TECNAI G220 TWIN. The measurements were
carried out using an accelerating voltage of 200 kV under low dose conditions.
Ultraviolet-visible measurements were performed in an Agilent 8453A UV-Vis
spectrometer with Peltier thermostatic cell holder T-controller 89096A.
Fluorescence Quantum Yield Determination
The Fluorescence Quantum Yield (Φ) of fluorescent nanoparticles FNP was determined by
employing 2 different standards: Coumarin 1 in ethanol and 9,10-diphenylanthracene
(DPA) in ethanol. The standards were cross-calibrated. The absorbance and fluorescence of
FNP samples and standards were measured at different concentrations and Fluorescence
vs. Absorbance plots were built. Absorbance was measured by UV-Vis spectroscopy.
5.3.3. Procedures
5.3.3.1. Synthesis of the copolymer In a typical procedure [16], MMA (1 ml, 9.4 mmol), AEMA (0.6 ml, 3.1 mmol), CPDB (0.8 mg,
3×10⁻² mmol) and (AIBN) (1 mg, 3×10⁻² mmol) were dissolved in ethyl acetate (4.5 ml).
The reaction mixture was degassed by passing argon for 15 min. The copolymerization
reaction was carried out at 65 ºC for 18 h (see Scheme 5.1). The resulting poly(MMA-co-
AEMA) copolymer C was isolated by precipitation in methanol and further drying (C: weight
average molecular weight, Mw (SEC/ MALLS) = 189 kDa; polydispersity, Ð = 1.25; molar
fraction of AEMA units (1H NMR) = 32%, x = 0.32). Reaction conditions of the synthesis of copolymers are annotated in Table 5.1.

Fast and efficient synthesis of highly fluorescent Single-Chain Nanoparticles
105
Scheme 5.1. Representation of the synthesis of poly (MMA-co-AEMA) copolymer C.
Table 5.1. Amount of reagents (MMA, AEMA, CPDB, AIBN and EtOAc) used for the synthesis of poly(MMA-co-AEMA) copolymers and characterization data (Mw and AEMA content).
MMA (ml) 1 1 1
AEMA (ml) 0.6 0.6 0.6
CPDB (mg) 7.5 1.6 0.8
AIBN (mg) 1.4 1 1
EtOAc (ml) 3 4 4.5
Mw (kDa) 52.8 104.2 188.8
AEMA content (mol %)
26.6 28.3 31.9
MMA = Methyl methacrylate; AEMA = 2-acetoacetoxy)ethyl methacrylate; CPDB = 2-cyanoprop-2-
yl-dithiobenzoate; AIBN = 2.2′-azo(2-methylpropionitrile); EtOAc = ethyl acetate; Mw = molar mass;
AEMA content = percentage of AEMA monomers in the copolymers.
5.3.3.2. Functionalization of the precursor The whole functionalization reaction of copolymer C was performed protected from light.
In a typical procedure, a random copolymer of MMA and AEMA (485 mg, 0.77 mmol)
prepared according to the methodology reported in the previous section [16] (C: weight
average molecular weight, Mw (SEC/MALLS) = 189 kDa; polydispersity, Đ = 1.25; molar
fraction of AEMA units (1H NMR) = 32%, x = 0.32) was dissolved in CH2Cl2 (10 mL) at r.t.
Then, p-CBSA (250 mg, 1.1 mmol) and Et3N (0.4 mL, 2.87 mmol) were added, and the
mixture was maintained under stirring for 24 h (see Scheme 5.2). After reaction, the
solution was concentrated and precipitated in MeOH and the resulting nanoparticle

Chapter 5
106
precursor P was dried in a vacuum oven in the dark [P: Yield = 73%; Mw (SEC/MALLS) = 289 kDa; Đ = 1.24; molar fraction of α-diazo-β-ketoester units (EA) = 23%, y = 0.23; radius
of gyration, Rg (SEC/MALLS) = 17.9 ± 1.0 nm; hydrodynamic radius, Rh (SEC/VIS) = 11.4 ± 0.1 nm].
Scheme 5.2. Schematic illustration of the synthesis of precursors P.
5.3.3.3. Synthesis of single-chain polymer nanoparticles in the presence of HPS In a typical reaction, precursor P (6 mg, 9.5 × 10⁻³ mmol) and HPS (2.6 mg, 4.75 × 10⁻³
mmol, Scheme 5.3) were dissolved in CH2Cl2 (12 ml) at r.t. and the solution was subject to
UV light irradiation through an open area of 2 cm2 in the 300−400 wavelength range (λmax = 365 nm) for 60 min (Scheme 5.4). The resulting (non-fluorescent) SCNPs NP were
purified by precipitation in Et2O and further drying in a vacuum oven [NP: Yield = 72%, Mw (SEC/MALLS) = 290 kDa; Đ = 1.25; Rg (SEC/MALLS) = 7.3 ± 1.1 nm, Rh (SEC/VIS) = 9.5 ± 1.1 nm].
Scheme 5.3. Chemical structure of hexaphenyl silole (HPS).

Fast and efficient synthesis of highly fluorescent Single-Chain Nanoparticles
107
Scheme 5.4. Illustration of the synthesis of single-chain nanoparticles NP.
5.3.3.4. Synthesis of single-chain polymer nanoparticles in the presence of Silole-N3 In a typical reaction, precursor P (6 mg, 9.5 × 10⁻³ mmol) and Silole-N3 (2.5 mg, 4.75 × 10⁻³
mmol, Scheme 5.5) were dissolved in CH2Cl2 (12 mL) at r.t. and the solution was subject to
UV light irradiation (λmax = 365 nm) for 60 min (Scheme 5.6). The resulting highly
fluorescent SCNPs FNP were purified by precipitation in Et2O and further drying in a
vacuum oven [FNP: yield = 78%, Mw (SEC/MALLS) = 330 kDa; Đ = 1.26; Rg (SEC/MALLS) = 6.2 ± 2.0 nm, Rh (SEC/VIS) = 9.0 ± 0.3 nm; fluorescent quantum yield, Φ (in THF) = 0.065
(see section 5.4.3 for details)].
Scheme 5.5. Chemical structure of 1,1-dimethyl-2,5-bis(4-(azidomethyl)phenyl)-3,4-diphenylsilole (Silole-N3).
Scheme 5.6. Illustration of the synthesis of fluorescent single-chain nanoparticles FNP.

Chapter 5
108
5.4. Results and discussion
We investigate in this work a new strategy toward highly fluorescent SCNPs based on the
combined photoactivation of an AIE cross-linking compound containing azide functional
groups, Silole-N3, and a precursor P containing α-diazo-β-ketoester units (see Scheme 5.2).
Precursors P were prepared from copolymers C synthesized through reversible addition-
fragmentation chain-transfer reaction (RAFT polymerization). Due to the similar reactivity
of MMA and AEMA statistical copolymer ratios were obtained in all cases. Consequently, the
β-ketoester functional groups of the AEMA monomer were randomly distributed in these
copolymers [56]. 1H NMR spectra of copolymers were in agreement with the chemical
structure reported in the literature [16]. Copolymer composition was calculated based on
the MMA/AEMA ratio of copolymers as measured by 1H NMR. MMA/AEMA ratios were
taken from the normalized integrated areas of the e, d and f, b peaks (Figure 5.2 A) of the 1H
NMR spectra.
Concerning precursor P, it was prepared from C via diazo transfer reaction (as described in
the section 5.3.3.2: Functionalization of the precursor). Some broadening was observed in
the 1H NMR peaks of precursors P (Figure 5.2 B) compared to the copolymer C.

Fast and efficient synthesis of highly fluorescent Single-Chain Nanoparticles
109
Figure 5.2. 1H NMR spectra of C (A) and P (B), where C denotes the initial random copolymer of MMA and AEMA, and P is the precursor of the SCNPs prepared from C via diazo transfer reaction.
The elemental composition of copolymer C and precursor P containing α-diazo-β-ketoester
functional groups was determined by microanalysis. The measured elemental composition
was in all cases in good agreement with the theoretical one (Table 5.2).

Chapter 5
110
Table 5.2. Comparison of theoretical (theo) and experimental (exp) content of carbon, hydrogen and nitrogen of copolymer C and precursor P.
Sample Carbon (%) Hydrogen (%) Nitrogen (%)
Copolymer C (theo) 58.02 7.32 0
Copolymer C (exp) 57.86 7.20 0.01
Precursor P (theo) 54.70 6.45 6.17
Precursor P (exp) 54.78 6.47 4.37
Conversion of the diazo transfer reaction: (4.37 / 6.17) × 100 ≈ 71 %.
AIE compounds are a new kind of fluorophores that are nearly non-emissive molecules in
solution but become highly emissive when aggregated or are immobilized because of the
restriction of intramolecular rotations leading the excitations to decay radiatively [36-39].
We hypothesized that by generating a combination of both highly reactive nitrene [57]
species (from Silole-N3) and highly reactive carbene [58] species (from precursor P) via UV
irradiation, the probability of efficient immobilization of the AIE compound in the resulting
SCNP will increase considerably, when compared to the use of an AIE compound without
azide functional groups (hexaphenylsilole, HPS). To confirm this hypothesis, we performed
two complementary experiments (Figure 5.3).
Figure 5.3. Synthesis of single-chain nanoparticles from precursor P in the presence a non-functional AIE molecule (HPS) gives to essentially non-fluorescent materials (NP), whereas using a bifunctional aggregation induced emission (AIE) compound (Silole-N3) the resulting single-chain nanoparticles (FNP) displayed highly fluorescent properties.

Fast and efficient synthesis of highly fluorescent Single-Chain Nanoparticles
111
5.4.1. Control reaction with HPS
In a control experiment, we placed precursor P in the CH2Cl2 solvent at high dilution (0.5
mg/mL) in the presence of HPS (AIE compound without azide functional groups). We
employed a molar ratio of HPS to α-diazo-β-ketoester units of 1/2. As illustrated below,
even if efficient SCNP formation was observed by size exclusion chromatography (SEC) due to an increase in retention time upon chain compaction (Figure 5.4), the resulting SCNPs NP
were found to be essentially non-fluorescent nanomaterials (Figure 5.8).
Figure 5.4. Size exclusion chromatography (SEC) traces of P and NP showing an increase in retention time upon chain compaction, which supports the formation of SCNPs.
In this case, upon irradiation of the α-diazo-β-ketoester units of precursor P, highly reactive
carbene species were generated (see below) accompanied by N2 formation and further N2
release from the solution. The resulting carbenes -which have high tendency to react
through many different pathways [58]- promoted intra-chain cross-linking reactions
leading to the observed chain compaction.
Confirmation of successful photoinduced carbene generation from precursor P was
obtained through complementary Fourier transform infrared (FTIR) spectroscopy and
elemental analysis (EA) measurements, as illustrated in Figure 5.5 and summarized in Table
5.3.
7 7,5 8 8,5 9
Re
lative inte
nsity (
a.u
.)
Retention time (min)
P NP

Chapter 5
112
Figure 5.5. FTIR spectra of precursor P (in blue colour) and NP (in red colour) showing the complete disappearance of the infra-red vibration band associated to the diazo moieties located at ν ≈ 2200 cm-1 upon carbene formation during UV irradiation of P in the presence of HPS for 60 min. The FTIR spectrum of the initial copolymer of MMA and AEMA units C used to synthesize P is also included (in green colour) for comparison.
Table 5.3. Efficiency of Carbene Generation as Determined by Elemental Analysis (EA)
Sample Nitrogen (wt %)
P (exp) 4.37
NP (theo) 0.00a
NP (exp) 0.42b
a By assuming an efficiency of carbene generation of 100 %.
b Efficiency of carbene generation: [ (4.37 – 0.42) / 4.37 ] × 100 = 90.4 %.
Consequently, even if carbene generation was proved to be successful (efficiency of carbene
generation >90%), most of the subsequent carbene C−H insertion reactions [58] were
intra-chain reactions without allowing immobilization of a significant amount of external
HPS molecules. To the best of our knowledge, this is the first report of SCNPs (although
without fluorescence properties) synthesized through photo-activated carbene generation.
1H-NMR spectra of SCNPs showed broadening of the peaks due to crosslinking.
75
80
85
90
95
100
150020002500300035004000
%T
Wavenumber (cm-1
)

Fast and efficient synthesis of highly fluorescent Single-Chain Nanoparticles
113
Figure 5.6. 1H NMR spectrum SCNPs NP prepared from poly(MMA-co-AEMA) copolymers.
5.4.2. Fluorescent SCNP synthesis
On the other hand, when the synthesis was performed under exactly the same conditions
but replacing HPS by Silole-N3, single-chain polymer nanoparticles endowed with highly
fluorescent properties (FNP) were obtained (see Figure 5.3, Figure 5.7 and Figure 5.8).

Chapter 5
114
Figure 5.7. SEC traces of P and FNP showing an increase in retention time upon single-chain nanoparticle formation.
Figure 5.8. Fluorescence emission spectra of NP and FNP in solution (solvent: THF, concentration: 1 mg/ml).
These complementary experiments confirmed that the presence of the azide moiety in the
AIE compound -that generates highly reactive nitrene species upon UV irradiation- is
essential for FNP to display intense fluorescence emission. The progressive compaction of
precursor P in the presence of Silole-N3 upon increasing the UV irradiation time is shown in Figure 5.9, as determined by SEC experiments.
7 7,5 8 8,5 9
Re
lative inte
nsity (
a.u
.)
Retention time (min)
P FNP
400 450 500 550 600
PL inte
nsity (
a.u
.)
Wavelength (nm)
Non-fluorescent
(NP)
Fluorescent
(FNP)

Fast and efficient synthesis of highly fluorescent Single-Chain Nanoparticles
115
Figure 5.9. SEC/MALLS traces of precursor P upon UV irradiation in the presence of Silole-N3 for: 0 (black line), 15 (blue line), 30 (green line), 60 (yellow line) and 120 (red line) min. showing its progressive chain compaction upon formation of FNP.
The increase in retention time observed by SEC is a consequence of the reduction in
hydrodynamic size of precursor P because of intramolecular cross-linking [59] upon the
simultaneous generation of highly reactive nitrene and carbene species. The unimolecular
(single-chain) nature of FNP was confirmed through absolute Mw measurements, using
multi-angle laser light scattering (MALLS) detection during the SEC experiments [60] (see
Table 5.4).
6,5 7 7,5 8 8,5
Re
lative inte
nsity (
a.u
.)
Retention time (min)

Chapter 5
116
Table 5.4. Absolute weight average molecular weight, radius of gyration and hydrodynamic radius of precursor P as a function of UV Irradiation time, as determined by SEC with triple detection
UV irradiation time (min)
tr
(min)a
Mw
(105 Da)b
Rg
(nm)b
Rh
(nm)c
0 7.348 2.89 ± 0.1 17.9 ± 1.0 11.4 ± 0.1
15 7.381 2.75 ± 0.1 11.4 ± 1.2 10.0 ± 0.2
30 7.413 3.95 ± 0.1 12.6 ± 1.0 10.6 ± 0.1
60 7.561 3.3 ± 0.1 6.2 ± 2.0 9.0 ± 0.3
120 7.626 3.23 ± 0.1 ‐ 7.8 ± 0.5
aSEC retention time at peak maximum.
bAs determined by GPC with MALLS detection.
cAs determined by GPC with VIS detection.
Hence, upon SCNP formation, an increase in Mw was observed that can be attributed (within
the experimental uncertainty of the MALLS technique) to the progressive immobilization of
Silole-N3 molecules in the nanoparticles. Concomitantly, a reduction in both the average
values of radius of gyration (Rg) and hydrodynamic radius (Rh) of precursor P was observed
(Table 5.4), as a consequence of its collapse to SCNPs. This behaviour is in good agreement
with previous results reported in the literature [22].
Measurements of SCNPs with dynamic light scattering (DLS) measurements of precursor
polymers P and SCNPs show particle sizes in agreement with those measured by SEC
(Figure 5.10)

Fast and efficient synthesis of highly fluorescent Single-Chain Nanoparticles
117
Figure 5.10. Size distribution (volume distribution) of α-diazo-β-ketoester precursor P (A) and fluorescent SCNPs FNP after irradiation with UV light for 2h (B) in THF measured by dynamic light scattering.
Figure 5.11 A illustrates the fluorescent properties of the resulting FNP in the
tetrahydrofuran (THF) solution as determined by fluorescence spectroscopy (FS). The
maximum fluorescence emission was obtained for nanoparticles generated after 60 min of
UV irradiation time (Figure 5.11 B), and it was located at λem ≈ 455 nm by using λex = 364
nm, with a fluorescent quantum yield of Φ = 0.065 (see section 5.4.3: Fluorescence quantum
yield determination). Above this optimum photo-irradiation time during synthesis, a
decrease in fluorescence emission intensity was observed that could be a consequence
either of morphological transitions [61] or to photo-degradation of the AIE compound via
secondary reactions.

Chapter 5
118
Figure 5.11. A) Fluorescent properties of precursor P upon UV irradiation in the presence of Silole-N3 for: 0 (black line), 15 (blue line), 30 (green line), 60 (yellow line) and 120 (red line) min. B) The maximum fluorescence was observed for single-chain nanoparticles FNP synthesized after 60 min. of UV irradiation.
To determine if a change in morphology was taking place at long UV irradiation times,
SCNPs FNP obtained after 60 and 120 min of UV irradiation were visualized, after solvent
removal, by transmission electron microscopy (TEM). It is worth of mention that
characterization of SCNPs by TEM is a highly complicated task because of the change in
conformation often observed upon solvent removal, the unavoidable
nanoparticle−substrate interactions, and the presence of locally compact domains [62]. As
illustrated in Figure 5.12, no significant change in the (near-spherical) SCNP shape was
visible by TEM, so we can tentatively attribute the reduction in fluorescence emission
intensity after prolonged UV irradiation to competitive photo-degradation reactions.
Nevertheless, more studies-out of the scope of the current work-are required to confirm
this assumption.

Fast and efficient synthesis of highly fluorescent Single-Chain Nanoparticles
119
Figure 5.12. TEM images of isolated SCNPs FNP synthesized after 60 min (scale bar: 50 nm) and 120 min (scale bar: 100 nm) of UV irradiation time.
It is worth mentioning that purification of FNP from potentially unreacted Silole-N3
molecules was highly facilitated by the excellent solubility of Silole-N3 in Et2O (a precipitant
for FNP). In addition to efficient nitrene generation from the azide-containing AIE
compound, confirmation of successful carbene generation from α-diazo-β-ketoester units
upon UV irradiation of precursor P was obtained from FTIR spectroscopy measurements,
as illustrated in Figure 5.13. Hence, upon SCNP formation, the complete disappearance of
the FTIR vibration band associated with the diazo moieties (ν ≈ 2200 cm-1) was observed.
Figure 5.13. Illustration of the disappearance of the infrared vibration band associated with the diazo moieties (ν ≈ 2200 cm−1) of precursor P (green trace) after the formation of SCNP FNP (blue trace).
Finally, the excellent stability of the fluorescence emission intensity of the purified FNP over
time in solution is shown in Figure 5.14 A, whereas Figure 5.14 B illustrates the
photoluminescence (PL) spectrum of FNP in bulk.
0
20
40
60
80
1000150020002500300035004000
%T
Wavenumber (cm-1
)

Chapter 5
120
Figure 5.14. A) Stability of the fluorescence properties of purified FNP over storage time: red curve is the PL spectrum of FNP in THF as synthesized; blue curve is the PL spectrum of FNP in THF after one week of storage. B) Fluorescence spectrum of FNP in the solid state (λex = 364 nm).
5.4.3. Fluorescence quantum yield determination.
The fluorescence quantum yield of the sample was calculated using the following equation
[63]:
(5.1)
𝛷 = 𝛷𝑟(𝑚/𝑚𝑟) (𝑛2/𝑛𝑟
2)

Fast and efficient synthesis of highly fluorescent Single-Chain Nanoparticles
121
where Φr is the quantum yield of the standard (taken from the literature), m and mr are the
slopes of the Fluorescence vs. Absorbance plots of the sample and the standard respectively,
and n and nr are the refraction indexes of the sample and standard solvents.
Figure 5.15. Fluorescence vs. Absorbance plot of Coumarin 1 standard in ethanol. y=319432x. R2=0.9956.
Coumarin 1:
Theoretical Φr (in ethanol): 0.732 [64]
Slope (mr): 319432 (from Figure 5.15)
Refraction index of ethanol (nr): 1.3571
0
5000
10000
15000
20000
25000
30000
35000
0 0,02 0,04 0,06 0,08 0,1
Coumarin 1
y = 319432x
R2 = 0.9956
Flu
ore
scen
ce
Absorbance

Chapter 5
122
Figure 5.16. Fluorescence vs. Absorbance plot of 9,10-diphenylanthracene (DPA) standard in ethanol. y=370306x. R2=0.9931.
9, 10-diphenylanthracene (DPA):
Theoretical Φr (in ethanol): 0.90 [64]
Slope (mr): 370306 (from Figure 5.16)
Refraction index of ethanol (nr): 1.3571
0
5000
10000
15000
20000
25000
30000
35000
0 0,02 0,04 0,06 0,08 0,1
DPA
y = 370306x
R2 = 0.9931
Flu
ore
scen
ce
Absorbance

Fast and efficient synthesis of highly fluorescent Single-Chain Nanoparticles
123
Figure 5.17. Fluorescence vs. Absorbance plot of single-chain nanoparticles FNP in THF. y=26004x. R2=0.9936.
Single-chain nanoparticles FNP:
Slope (m): 26004 (from Figure 5.17)
Refraction index of THF (n): 1.407
Fluorescence quantum yield of FNP with Coumarin 1 standard: Φ = 0.063
Fluorescence quantum yield of FNP with DPA standard: Φ= 0.067
Average Φ(single-chain nanoparticles FNP in THF): 0.065 ± 0.002
5.5. Conclusions
This chapter reports a new, fast, and efficient method to produce SCNPs with intense
fluorescence emission in solution, which is based on the photoactivation of appropriate
aggregation induced emission (AIE) cross-linking molecules containing azide functional
groups. Hence, a new strategy based on photoactivation of appropriate AIE molecules
containing azide functional groups for the fast and efficient generation of SCNPs with
fluorescence emission in both solution and solid state is established. We have demonstrated
that by the generation of a combination of both highly reactive nitrene species (from an
azide-containing AIE cross-linking molecule, Silole-N3) and highly reactive carbene species
(from an appropriate polymeric precursor containing α-diazo-β-ketoester units, P) via UV
irradiation, the probability of efficient immobilization of the AIE compound in the resulting
0
500
1000
1500
2000
2500
0 0,02 0,04 0,06 0,08 0,1
Single-chain nanoparticles
FNP
y = 26004x
R2 = 0.9936
Flu
ore
scen
ce
Absorbance

Chapter 5
124
SCNP increases considerably, when compared to the use of an AIE compound without azide
functional groups. Confirmation of successful single-chain compaction upon UV irradiation
of precursor P in the presence of Silole-N3 at high dilution is obtained by SEC with multi-
detection, including MALLS detector (for absolute Mw and Rg values) and VIS detector (for
Rh data). The optimum UV irradiation time during the SCNP formation process is found to
be 60 min. The resulting fluorescent SCNPs FNP (Rh = 9 nm) show a maximum emission
peak in the THF solvent centred at λem ≈ 455 nm and excellent stability of the fluorescence
emission intensity over time, as determined by FS. Moreover, FNP retains its fluorescent
properties in the solid state. To conclude, this work opens a new avenue to endow a variety
of other nanostructured polymeric materials (e.g., block copolymers, microgels,
dendrimers, and micelles) with intense fluorescence emission based on the new strategy of
photo-activation of AIE molecules here disclosed.
5.6. References
[1] S. Mavila, O. Eivgi, I. Berkovich, N.G. Lemcoff, Intramolecular Cross-Linking Methodologies for the Synthesis of Polymer Nanoparticles, Chemical Reviews, 116 (2016) 878-961. [2] O. Altintas, C. Barner-Kowollik, Single-Chain Folding of Synthetic Polymers: A Critical Update, Macromolecular Rapid Communications, 37 (2016) 29-46. [3] C.K. Lyon, A. Prasher, A.M. Hanlon, B.T. Tuten, C.A. Tooley, P.G. Frank, E.B. Berda, A brief user's guide to single-chain nanoparticles, Polymer Chemistry, 6 (2015) 181-197. [4] M. Artar, E. Huerta, E.W. Meijer, A.R.A. Palmans, Dynamic Single Chain Polymeric Nanoparticles: From Structure to Function, Sequence-Controlled Polymers: Synthesis, Self-Assembly, and Properties, American Chemical Society2014, pp. 313-325. [5] M. Gonzalez-Burgos, A. Latorre-Sanchez, J.A. Pomposo, Advances in single chain technology, Chemical Society Reviews, 44 (2015) 6122-6142. [6] A. Sanchez-Sanchez, J.A. Pomposo, Single-Chain Polymer Nanoparticles via Non-Covalent and Dynamic Covalent Bonds, Particle & Particle Systems Characterization, 31 (2014) 11-23. [7] A. Sanchez-Sanchez, I. Pérez-Baena, J.A. Pomposo, Advances in Click Chemistry for Single-Chain Nanoparticle Construction, Molecules, 18 (2013) 3339-3355. [8] T.-K. Nguyen, S.J. Lam, K.K.K. Ho, N. Kumar, G.G. Qiao, S. Egan, C. Boyer, E.H.H. Wong, Rational Design of Single-Chain Polymeric Nanoparticles That Kill Planktonic and Biofilm Bacteria, ACS Infectious Diseases, 3 (2017) 237-248. [9] A. Sanchez-Sanchez, S. Akbari, A.J. Moreno, F.L. Verso, A. Arbe, J. Colmenero, J.A. Pomposo, Design and Preparation of Single-Chain Nanocarriers Mimicking Disordered Proteins for Combined Delivery of Dermal Bioactive Cargos, Macromolecular Rapid Communications, 34 (2013) 1681-1686. [10] I. Perez-Baena, I. Loinaz, D. Padro, I. García, H.J. Grande, I. Odriozola, Single-chain polyacrylic nanoparticles with multiple Gd(iii) centres as potential MRI contrast agents, Journal of Materials Chemistry, 20 (2010) 6916-6922. [11] S.K. Hamilton, E. Harth, Molecular Dendritic Transporter Nanoparticle Vectors Provide Efficient Intracellular Delivery of Peptides, ACS Nano, 3 (2009) 402-410. [12] H. Rothfuss, N.D. Knöfel, P.W. Roesky, C. Barner-Kowollik, Single-Chain Nanoparticles as Catalytic Nanoreactors, Journal of the American Chemical Society, 140 (2018) 5875-5881. [13] J. Rubio-Cervilla, E. González, J.A. Pomposo, Advances in Single-Chain Nanoparticles for Catalysis Applications, Nanomaterials, 7 (2017) 341.

Fast and efficient synthesis of highly fluorescent Single-Chain Nanoparticles
125
[14] N.D. Knöfel, H. Rothfuss, J. Willenbacher, C. Barner-Kowollik, P.W. Roesky, Platinum(II)-Crosslinked Single-Chain Nanoparticles: An Approach towards Recyclable Homogeneous Catalysts, Angewandte Chemie International Edition, 56 (2017) 4950-4954. [15] C.A. Tooley, S. Pazicni, E.B. Berda, Toward a tunable synthetic [FeFe] hydrogenase mimic: single-chain nanoparticles functionalized with a single diiron cluster, Polymer Chemistry, 6 (2015) 7646-7651. [16] A. Sanchez-Sanchez, A. Arbe, J. Colmenero, J.A. Pomposo, Metallo-Folded Single-Chain Nanoparticles with Catalytic Selectivity, ACS Macro Letters, 3 (2014) 439-443. [17] I. Perez-Baena, F. Barroso-Bujans, U. Gasser, A. Arbe, A.J. Moreno, J. Colmenero, J.A. Pomposo, Endowing Single-Chain Polymer Nanoparticles with Enzyme-Mimetic Activity, ACS Macro Letters, 2 (2013) 775-779. [18] E. Huerta, P.J.M. Stals, E.W. Meijer, A.R.A. Palmans, Consequences of Folding a Water-Soluble Polymer Around an Organocatalyst, Angewandte Chemie International Edition, 52 (2013) 2906-2910. [19] T. Terashima, T. Mes, T.F.A. De Greef, M.A.J. Gillissen, P. Besenius, A.R.A. Palmans, E.W. Meijer, Single-Chain Folding of Polymers for Catalytic Systems in Water, Journal of the American Chemical Society, 133 (2011) 4742-4745. [20] A. Latorre-Sanchez, J.A. Pomposo, A simple, fast and highly sensitive colorimetric detection of zein in aqueous ethanol via zein–pyridine–gold interactions, Chemical Communications, 51 (2015) 15736-15738. [21] M.A.J. Gillissen, I.K. Voets, E.W. Meijer, A.R.A. Palmans, Single chain polymeric nanoparticles as compartmentalised sensors for metal ions, Polymer Chemistry, 3 (2012) 3166-3174. [22] J.A. Pomposo, Single-Chain Polymer Nanoparticles: Synthesis, Characterization, Simulations, and Applications, John Wiley & Sons2017. [23] A. Latorre-Sánchez, J.A. Pomposo, Recent bioinspired applications of single-chain nanoparticles, Polymer International, 65 (2016) 855-860. [24] J.A. Pomposo, Bioinspired single-chain polymer nanoparticles, Polymer International, 63 (2014) 589-592. [25] X. He, J. Gao, S.S. Gambhir, Z. Cheng, Near-infrared fluorescent nanoprobes for cancer molecular imaging: status and challenges, Trends in Molecular Medicine, 16 (2010) 574-583. [26] X. Michalet, F.F. Pinaud, L.A. Bentolila, J.M. Tsay, S. Doose, J.J. Li, G. Sundaresan, A.M. Wu, S.S. Gambhir, S. Weiss, Quantum Dots for Live Cells, in Vivo Imaging, and Diagnostics, Science, 307 (2005) 538. [27] W. Yin, L. Zhou, Z. Gu, G. Tian, S. Jin, L. Yan, X. Liu, G. Xing, W. Ren, F. Liu, Z. Pan, Y. Zhao, Lanthanide-doped GdVO4 upconversion nanophosphors with tunable emissions and their applications for biomedical imaging, Journal of Materials Chemistry, 22 (2012) 6974-6981. [28] L. Shang, S. Brandholt, F. Stockmar, V. Trouillet, M. Bruns, G.U. Nienhaus, Effect of Protein Adsorption on the Fluorescence of Ultrasmall Gold Nanoclusters, Small, 8 (2012) 661-665. [29] Y. Zhang, Y. Bai, J. Jia, N. Gao, Y. Li, R. Zhang, G. Jiang, B. Yan, Perturbation of physiological systems by nanoparticles, Chemical Society Reviews, 43 (2014) 3762-3809. [30] J. De-La-Cuesta, E. González, J.A. Pomposo, Advances in Fluorescent Single-Chain Nanoparticles, Molecules, 22 (2017). [31] P. Wang, H. Pu, J. Ge, M. Jin, H. Pan, Z. Chang, D. Wan, Fluorescence-labeled hydrophilic nanoparticles via single-chain folding, Materials Letters, 132 (2014) 102-105. [32] C. Song, L. Li, L. Dai, S. Thayumanavan, Responsive single-chain polymer nanoparticles with host–guest features, Polymer Chemistry, 6 (2015) 4828-4834. [33] Y. Liu, T. Pauloehrl, S.I. Presolski, L. Albertazzi, A.R.A. Palmans, E.W. Meijer, Modular Synthetic Platform for the Construction of Functional Single-Chain Polymeric Nanoparticles: From Aqueous Catalysis to Photosensitization, Journal of the American Chemical Society, 137 (2015) 13096-13105.

Chapter 5
126
[34] A.P.P. Kröger, R.J.E.A. Boonen, J.M.J. Paulusse, Well-defined single-chain polymer nanoparticles via thiol-Michael addition, Polymer, 120 (2017) 119-128. [35] C. Heiler, J.T. Offenloch, E. Blasco, C. Barner-Kowollik, Photochemically Induced Folding of Single Chain Polymer Nanoparticles in Water, ACS Macro Letters, 6 (2017) 56-61. [36] B. Yang, X. Zhang, X. Zhang, Z. Huang, Y. Wei, L. Tao, Fabrication of aggregation-induced emission based fluorescent nanoparticles and their biological imaging application: recent progress and perspectives, Materials Today, 19 (2016) 284-291. [37] Y. Hong, J.W.Y. Lam, B.Z. Tang, Aggregation-induced emission, Chemical Society Reviews, 40 (2011) 5361-5388. [38] Y. Hong, J.W.Y. Lam, B.Z. Tang, Aggregation-induced emission: phenomenon, mechanism and applications, Chemical Communications, (2009) 4332-4353. [39] J. Luo, Z. Xie, J.W.Y. Lam, L. Cheng, H. Chen, C. Qiu, H.S. Kwok, X. Zhan, Y. Liu, D. Zhu, B.Z. Tang, Aggregation-induced emission of 1-methyl-1,2,3,4,5-pentaphenylsilole, Chemical Communications, (2001) 1740-1741. [40] X. Zhang, K. Wang, M. Liu, X. Zhang, L. Tao, Y. Chen, Y. Wei, Polymeric AIE-based nanoprobes for biomedical applications: recent advances and perspectives, Nanoscale, 7 (2015) 11486-11508. [41] X. Zhang, S. Wang, L. Xu, L. Feng, Y. Ji, L. Tao, S. Li, Y. Wei, Biocompatible polydopamine fluorescent organic nanoparticles: facile preparation and cell imaging, Nanoscale, 4 (2012) 5581-5584. [42] R. Jiang, H. Liu, M. Liu, J. Tian, Q. Huang, H. Huang, Y. Wen, Q.-y. Cao, X. Zhang, Y. Wei, A facile one-pot Mannich reaction for the construction of fluorescent polymeric nanoparticles with aggregation-induced emission feature and their biological imaging, Materials Science and Engineering: C, 81 (2017) 416-421. [43] D. Wei, Y. Xue, H. Huang, M. Liu, G. Zeng, Q. Wan, L. Liu, J. Yu, X. Zhang, Y. Wei, Fabrication, self-assembly and biomedical applications of luminescent sodium hyaluronate with aggregation-induced emission feature, Materials Science and Engineering: C, 81 (2017) 120-126. [44] R. Jiang, M. Liu, C. Li, Q. Huang, H. Huang, Q. Wan, Y. Wen, Q.-y. Cao, X. Zhang, Y. Wei, Facile fabrication of luminescent polymeric nanoparticles containing dynamic linkages via a one-pot multicomponent reaction: Synthesis, aggregation-induced emission and biological imaging, Materials Science and Engineering: C, 80 (2017) 708-714. [45] Q.-y. Cao, R. Jiang, M. Liu, Q. Wan, D. Xu, J. Tian, H. Huang, Y. Wen, X. Zhang, Y. Wei, Microwave-assisted multicomponent reactions for rapid synthesis of AIE-active fluorescent polymeric nanoparticles by post-polymerization method, Materials Science and Engineering: C, 80 (2017) 578-583. [46] L. Mao, M. Liu, R. Jiang, Q. Huang, Y. Dai, J. Tian, Y. Shi, Y. Wen, X. Zhang, Y. Wei, The one-step acetalization reaction for construction of hyperbranched and biodegradable luminescent polymeric nanoparticles with aggregation-induced emission feature, Materials Science and Engineering: C, 80 (2017) 543-548. [47] Q.-y. Cao, R. Jiang, M. Liu, Q. Wan, D. Xu, J. Tian, H. Huang, Y. Wen, X. Zhang, Y. Wei, Preparation of AIE-active fluorescent polymeric nanoparticles through a catalyst-free thiol-yne click reaction for bioimaging applications, Materials Science and Engineering: C, 80 (2017) 411-416. [48] Q. Wan, R. Jiang, L. Guo, S. Yu, M. Liu, J. Tian, G. Liu, F. Deng, X. Zhang, Y. Wei, Novel Strategy toward AIE-Active Fluorescent Polymeric Nanoparticles from Polysaccharides: Preparation and Cell Imaging, ACS Sustainable Chemistry & Engineering, 5 (2017) 9955-9964. [49] J. Tian, R. Jiang, P. Gao, D. Xu, L. Mao, G. Zeng, M. Liu, F. Deng, X. Zhang, Y. Wei, Synthesis and cell imaging applications of amphiphilic AIE-active poly(amino acid)s, Materials Science and Engineering: C, 79 (2017) 563-569. [50] Y. Liu, L. Mao, X. Liu, M. Liu, D. Xu, R. Jiang, F. Deng, Y. Li, X. Zhang, Y. Wei, A facile strategy for fabrication of aggregation-induced emission (AIE) active fluorescent polymeric

Fast and efficient synthesis of highly fluorescent Single-Chain Nanoparticles
127
nanoparticles (FPNs) via post modification of synthetic polymers and their cell imaging, Materials Science and Engineering: C, 79 (2017) 590-595. [51] D. Xu, M. Liu, H. Zou, Q. Huang, H. Huang, J. Tian, R. Jiang, Y. Wen, X. Zhang, Y. Wei, Fabrication of AIE-active fluorescent organic nanoparticles through one-pot supramolecular polymerization and their biological imaging, Journal of the Taiwan Institute of Chemical Engineers, 78 (2017) 455-461. [52] H. Huang, D. Xu, M. Liu, R. Jiang, L. Mao, Q. Huang, Q. Wan, Y. Wen, X. Zhang, Y. Wei, Direct encapsulation of AIE-active dye with β cyclodextrin terminated polymers: Self-assembly and biological imaging, Materials Science and Engineering: C, 78 (2017) 862-867. [53] S. Yu, D. Xu, Q. Wan, M. Liu, J. Tian, Q. Huang, F. Deng, Y. Wen, X. Zhang, Y. Wei, Construction of biodegradable and biocompatible AIE-active fluorescent polymeric nanoparticles by Ce(IV)/HNO3 redox polymerization in aqueous solution, Materials Science and Engineering: C, 78 (2017) 191-197. [54] Z. Long, M. Liu, R. Jiang, G. Zeng, Q. Wan, H. Huang, F. Deng, Y. Wan, X. Zhang, Y. Wei, Ultrasonic-assisted Kabachnik-Fields reaction for rapid fabrication of AIE-active fluorescent organic nanoparticles, Ultrasonics Sonochemistry, 35 (2017) 319-325. [55] I. Perez-Baena, I. Asenjo-Sanz, A. Arbe, A.J. Moreno, F. Lo Verso, J. Colmenero, J.A. Pomposo, Efficient Route to Compact Single-Chain Nanoparticles: Photoactivated Synthesis via Thiol–Yne Coupling Reaction, Macromolecules, 47 (2014) 8270-8280. [56] A. Sanchez-Sanchez, S. Akbari, A. Etxeberria, A. Arbe, U. Gasser, A.J. Moreno, J. Colmenero, J.A. Pomposo, “Michael” Nanocarriers Mimicking Transient-Binding Disordered Proteins, ACS Macro Letters, 2 (2013) 491-495. [57] S. Bräse, C. Gil, K. Knepper, V. Zimmermann, Organic Azides: An Exploding Diversity of a Unique Class of Compounds, Angewandte Chemie International Edition, 44 (2005) 5188-5240. [58] M.P. Doyle, R. Duffy, M. Ratnikov, L. Zhou, Catalytic Carbene Insertion into C−H Bonds, Chemical Reviews, 110 (2010) 704-724. [59] A. Latorre-Sánchez, A. Alegría, F. Lo Verso, A.J. Moreno, A. Arbe, J. Colmenero, J.A. Pomposo, A Useful Methodology for Determining the Compaction Degree of Single-Chain Nanoparticles by Conventional SEC, Particle & Particle Systems Characterization, 33 (2016) 373-381. [60] J.A. Pomposo, I. Perez-Baena, L. Buruaga, A. Alegría, A.J. Moreno, J. Colmenero, On the Apparent SEC Molecular Weight and Polydispersity Reduction upon Intramolecular Collapse of Polydisperse Chains to Unimolecular Nanoparticles, Macromolecules, 44 (2011) 8644-8649. [61] M. Huo, Q. Ye, H. Che, X. Wang, Y. Wei, J. Yuan, Polymer Assemblies with Nanostructure-Correlated Aggregation-Induced Emission, Macromolecules, 50 (2017) 1126-1133. [62] J.A. Pomposo, A.J. Moreno, A. Arbe, J. Colmenero, Local Domain Size in Single-Chain Polymer Nanoparticles, ACS Omega, 3 (2018) 8648-8654. [63] S. Ramesan, S. Vyas, Abid, Determination of Relative Fluorescence Quantum Yield Using The Agilent Cary Eclipse, Agilent Technologies, Inc., Solutions for Your Analytical Business, Markets and Applications Programs, 2016. [64] Methods for the determination of photoluminescence quantum yield, Nanoco Technologies Limited, Nanoco Technologies Limited, 2013.


Chapter 6: Self-Reporting of Folding and
Aggregation Phenomena in Single-Chain
Nanoparticles


Self-Reporting of Folding and Aggregation Phenomena in Single-Chain Nanoparticles
131
6.1. Motivation
Self-reporting fluorescence methods for monitoring folding and aggregation of proteins
have a long history in biochemistry. Placing orthogonal luminophores within individual
synthetic polymer chains for self-reporting both folding (i.e., its intramolecular compaction
to isolated single-chain nanoparticles, SCNPs) and unbidden aggregation (i.e., the
intermolecular association of SCNPs) remains a great challenge. In this Chapter, we
introduce a simple and efficient platform to identify both single-chain compaction and
intermolecular aggregation phenomena of discrete, individual synthetic polymer chains.
6.2. Introduction
The folding of some polypeptides, especially enzymes, into perfectly defined three-
dimensional (3D) architectures is critical to their function. The specific spatial arrangement
of residues ultimately dictates function in 3D-structured proteins [1]. Protein misfolding
and aggregation are involved in the onset of many neurodegenerative aged-related human
disorders. Well-known examples are Alzheimer´s, Parkinson´s and Huntington´s diseases
[2]. To better understand diseases and design drugs, a variety of methods -from biochemical
assays to time-resolved microscopy- have been developed to investigate protein folding [3]
and to monitor the self-assembly of defective proteins into pathogenic protein aggregates
[4]. Among them, photoluminescence techniques are highly valuable due to their high
sensitivity and the possibility to select, synthesize and optimize a diversity of
photoluminescence probes (luminophores). These compounds allow visualizing protein
folding, misfolding and aggregation in vitro and in living cells [5].
Trying to mimic the outstanding functionalities of proteins, the research field of folding
functionalized synthetic polymers to single-chain nanoparticles (SCNPs) has flourished in
recent years [6][7]. The folded conformations of SCNPs produce robust nano-objects when
stabilized by covalent bonds as surrogates of disulphide bonds in proteins [8, 9]. Conversely,
when folding of discrete, individual chains arises from noncovalent interactions such as
hydrogen bonds, host-guest interactions, metal complexation, stacking and
hydrophobic interactions, dynamic SCNPs are obtained.[6, 10-13] Current single-chain
technology [14-16] still lacks the nature´s exquisite degree of control to generate
sophisticated 3D nanoentities. Nevertheless, some SCNPs do already mimic the outstanding
properties of certain antimicrobial polypeptides as well as both the size and function of
some metalloenzymes, intrinsically disordered proteins (IDPs) and structural proteins. For
instance, Wong et al. described antimicrobial SCNPs against Gram-negative bacteria (e.g.,
Pseudomonas aeruginosa) at micromolar concentrations (e.g., 1.4 μM) able to kill ≥ 99.99%
of both planktonic cells, and biofilm within only 1 hour [17]. Ravi and co-workers developed
biomimetic SCNPs that closely match the properties of βhigh lens crystallins in size, refractive
index, and dynamic viscosity [18]. He et al. synthesized catalytic SCNPs containing Ni-
thiolate complexes with excellent thermal stability under aerobic conditions and
remarkable activity and selectivity for the photocatalytic reduction of CO2 to CO [19]. More
recently, Zimmerman et al. reported copper-based SCNPs that function as “clickases”,
showing enzyme-like click catalysis in vivo and enabling efficient cell surface glycan editing
[20]. Previously, our team demonstrated enzyme-mimetic substrate selectivity of copper-
containing SCNPs in oxidative coupling of mixtures of terminal alkynes [21], and pH-

Chapter 6
132
regulated kinetics of IDP-like SCNPs during simultaneous controlled delivery of folic acid
and hinokitiol [22].
However, as observed in the case of defective proteins, some SCNPs systems are not free
from multi-SCNPs aggregation phenomena -arising during synthesis or after long-term
storage trough inter-chain reactions- that negatively affect its performance, e.g., in catalysis,
drug delivery and sensing applications [23-25]. In the case of SCNPs, single-chain
compaction, and competitive multi-SCNPs assembly phenomena are mainly detected after
synthesis (“ex-situ”) by means of light, X-ray and neutron scattering techniques [26]. Self-
reporting, fluorescence methods for monitoring folding and aggregation of proteins have a
long history in biochemistry. Placing orthogonal luminophores within individual synthetic
polymer chains for self-reporting both folding (i.e., its intra-molecular compaction to
isolated single-chain nanoparticles, SCNPs) and unbidden aggregation (i.e., the inter-
molecular association of SCNPs) remains as a great challenge. To the best of our knowledge,
no techniques exist yet for self-reporting -via photoluminescence- both intra-molecular
compaction and inter-molecular aggregation phenomena in SCNPs. Previously, Palmans,
Meijer et al. developed SCNPs showing fluorescence upon intra-molecular self-assembly of
BiPy groups [27, 28]. Raymo et al. investigated a variety of biocompatible and photo-
switchable fluorescent multi-chain assemblies [29-31]. More recently, two different
methods for self-reporting of single-chain folding during synthesis have been reported by
Barner-Kowollik et al. based on: i) annihilation of paramagnetic nitroxide radicals [32], or
ii) release of a pyrene chromophore [33]. Critically, a visual, self-reporting method to
distinguish by the naked eye between individual SCNPs and unbidden multi-SCNPs
assemblies, and in the former case the degree of single-chain compaction, would be
invaluable in further advancing this field of bioinspired research.
SCNPs will be prepared from MMA/AEMA copolymers via the Hantzsch pyridine synthesis
reaction. This reaction was reported in 1881 by Arthur Rudolf Hantzsch [34]. In the
Hantzcsh reaction an aldehyde, two equivalents of a β-ketoester and a nitrogen donor (such
as ammonium acetate) react to form a dihydropyridine ring, which can be oxidized to
pyridine. The 1,4-dihydropyridine (1,4-DHP) product of the reaction is called Hantzsch
ester. Hantzsch esters have been often used as reductants in catalytic hydrogenation
reactions, acting as electron donors and proton sources [35]. These products also have
many biological applications as calcium channel blockers and the 1,4-DHP structure is
contained in commercial drugs; for instance, nifedipine, amlodipine or nimodipine. Shen et al. [36] developed a one pot method for the synthesis of 1,4-DHPs under mild conditions.
Scheme 6.1. Schematic representation of the synthesis of Hantzsch esters.
The Hantzsch reaction mechanism is the following:

Self-Reporting of Folding and Aggregation Phenomena in Single-Chain Nanoparticles
133
Knoevenagel condensation between the aldehyde and a β-ketoester gives the following
intermediate.
Condensation of the second equivalent β-ketoester with ammonia produces an ester
enamine.
Condensation between the two intermediate products results in the formation of a
dihydroxipyridine ring.
In this chapter we introduce a new, straightforward strategy to bridge the gap between
single-chain folding and inter-molecular aggregation self-reporting methods for proteins
and synthetic polymers relying on efficient placement within individual chains of
orthogonal self-reporting luminophores (Scheme 6.2). The strategy is exemplified through
generation of two complementary luminophores via Hantzsch ester formation [34] for
efficient visualization of single-chain folding [37] and, when present or externally induced,
multi-SCNPs aggregation. The key points of the present method are: i) starting from non-
luminescent -ketoester-decorated chains, single-chain intramolecular compaction is
visually detected through fluorescence arising from the Hantzsch fluorophores acting as
intra-chain connectors generated progressively during folding of individual chains, so -in
absence of aggregation phenomena at high dilution- the fluorescence intensity grows with
the compaction degree, as measured by the reduction in chain size (see below); ii) multi-
chain aggregation -when present or intentionally induced- is detected by intense
photoluminescence at redshifted wavelengths arising from orthogonal aggregation-induced
emission (AIE) luminophores after formation of multi-SCNPs assemblies [38-40]; and iii)
both kind of self-reporting probes are installed, concurrently, within the same polymer
chain via the multicomponent Hantzsch reaction [41-43]. This strategy holds promise to

Chapter 6
134
perceive with the naked eye the aggregation state / compaction degree of SCNPs during
functional applications.
Scheme 6.2. Schematic illustration of the strategy for the synthesis of orthogonal luminophores based on Hantzsch ester formation within a β-ketoester-decorated chain for self-reporting of intra-molecular compaction (folding) and inter-molecular association (aggregation).
6.3. Materials and Techniques
6.3.1. Materials
Methyl methacrylate (MMA) (99%), (2-acetoacetoxy)ethyl methacrylate (AEMA) (95%),
2.2′-azo(2-methylpropionitrile) (AIBN) (≥98%), ammonium acetate (NH4OAc) (99.999%
trace metals basis), benzaldehyde (A1) (≥99%), terephthalaldehyde (A2) (99%), 4-(1,2,2-
triphenylethenyl)benzaldehyde (A3) (≥95%), 2,2-dimethoxy-2-phenylaceto-phenone
(DMPA) (99%), 3,6-dioxa-1,8-octane-dithiol (DODT) (95%), piperidine (PIP) (99%), ethyl
acetate (EtOAc) (anhydrous, 99.8 %), diethyl ether (Et2O) (ACS reagent, anhydrous,
>99.0%), ethanol (EtOH) (anhydrous, denatured) and deuterated chloroform (CDCl3)
(99.96 atom % D, containing 0.03 % (v/v) tetramethylsilane, TMS) were purchased from
Sigma-Aldrich and used, unless specified, as received. 2-Cyanoprop-2-yl-dithiobenzoate
(CPDB) (≥97%) was purchased from Strem Chemicals. Methanol (MeOH) (synthesis grade)
and tetrahydrofuran (THF) (HPLC grade) were purchased from Scharlab. AIBN was

Self-Reporting of Folding and Aggregation Phenomena in Single-Chain Nanoparticles
135
recrystallized from MeOH. MMA was purified by distillation before use. AEMA was purified
by passing through alumina.
6.3.2. Techniques
Size-Exclusion Chromatography / Multi-Angle Light Scattering (SEC/MALS): SEC / MALS
measurements were performed at 30 °C on an Agilent 1200 system equipped with PLgel
5µm Guard and PLgel 5µm MIXED-C columns, and triple detection: a differential refractive
index (RI) detector (Optilab Rex, Wyatt), a multi-angle laser light scattering (MALS)
detector (MiniDawn Treos, Wyatt), and a viscosimetric (VIS) detector (ViscoStar-II, Wyatt).
Data analysis was performed with ASTRA Software (version 6.1) from Wyatt. THF was used
as eluent at a flow rate of 1 ml/min. A value of dn/dc = 0.083 was used for P1-P3, N1f-N3f
and N1fa-N3fa.
1H Nuclear Magnetic Resonance (1H NMR): 1H NMR spectra were recorded at room
temperature on a Bruker spectrometer operating at 400 MHz, using CDCl3 as solvent. AEMA
content of P1-P3 was determined following the procedure described in section 5.3 and ref.
[44].
Fourier Transform Infra-Red (FTIR) spectroscopy: FTIR spectra were recorded at room
temperature on a JASCO 3600 FTIR spectrometer.
Elemental Analysis (EA): EA measurements were performed in a Euro EA3000 elemental
analyser (CHNS).
Fluorescence spectroscopy (FS): Photoluminiscence spectra were recorded at room
temperature on an Agilent Cary Eclipse spectrometer at an excitation wavelength of 365
nm.
Dynamic light scattering (DLS): DLS measurements (intensity distribution) were carried
out at room temperature on a Malvern Zetasizer Nano ZS apparatus.
Small-angle X-ray scattering (SAXS): SAXS experiments were conducted on the Rigaku 3-
pinhole PSAXS-L equipment of the Materials Physics Center operating at 45 kV and 0.88 mA.
The MicroMax-002+ X-Ray Generator System is composed by a microfocus sealed tube
source module and an integrated X-Ray generator unit which produces CuKα transition
photons of wavelength λ = 1.54 Å. The flight path and the sample chamber in this equipment
are under vacuum. The scattered X-Rays are detected on a two-dimensional multiwire X-
Ray Detector (Gabriel design, 2D-200X) and converted to one-dimensional scattering
curves by radial averaging. This gas-filled proportional type detector offers a 200 mm
diameter active area with ca. 200 µm resolution. After radial integration, the scattered
intensities were obtained as a function of momentum transfer 𝑞 = 4𝜋𝜆−1𝑠𝑖𝑛 𝜃, where θ is
half the scattering angle. Reciprocal space calibration was done using silver behenate as
standard. The sample to detector distance was 2 m, covering a q-range between 0.008 and
0.20 Å-1. The measurements were performed at r.t. on THF solutions in capillaries of 2 mm
thickness. The concentration was 1 mg/ml in order to avoid interference effects between
different macromolecules and reproduce the usual synthesis conditions in the kinetic
experiments. Note that with laboratory SAXS instruments the concentration range usually
explored for this kind of systems is around 8 mg/ml. The low concentration here
investigated required long measuring times, of at least 1 hour, for each sample. The data
were carefully corrected for background scattering (due to capillary and solvent), measured
Chapter 6
136
for each sample on the same capillary for the same time. Scattering cross-sections were
obtained in absolute units by using water as calibration standard.
The generalized Gaussian coil function [45] given by:
(6.1)
𝑃(𝑄) =1
𝜈𝑈1 2𝜈⁄𝛾 (
1
2𝜈, 𝑈) −
1
𝜈𝑈1 𝜈⁄𝛾 (
1
𝜈, 𝑈)
Where 𝑈 =(2𝜈+1)(2𝜈+2)
6𝑄2𝑅𝐺
2
and 𝛾(𝑎, 𝑥) = ∫ 𝑡𝑎−1𝑋
0𝑒𝑥𝑝(−𝑡)𝑑𝑡
was employed for a precise determination of the values of radius of gyration, Rg, and scaling
exponent, ν.
A series of measurements were performed on P1-P3, N1f-N3f and N1fa-N3fa, where the
nanoparticles had previously been synthesized (Figure 6.6 A, B and C). Figure 6.6 D
compares the radii of gyration obtained by fitting equation (6.1) to the results.
In addition, we carried out a kinetic experiment following in situ the nanoparticle formation
process as a function of reaction time during single-chain compaction of P1 (1.2 eq) in THF
(1 mg/ml) via intra-chain Hantzsch ester formation involving A2 (0.25 eq), NH4OAc (4 eq)
and piperidine (0.05 eq). Immediately after mixing all reagents, the capillary was filled with
a small amount of the solution and placed within the SAXS instrument. SAXS measurements
were performed on this sample as function of reaction time, with 1 hour duration, along a
full week, keeping the sample exactly in the same position and under vacuum. The resulting
evolution of the radius of gyration and scaling exponent obtained by fitting equation (6.1)
are shown in Figure 6.11 A. In parallel, photoluminescence experiments were performed on
the rest of the solution which was kept in a vial. A sample from this solution was also
measured by SAXS at the end of the kinetic experiment (results represented by squares in
Figure 6.11 A).
UV irradiation experiments: UV irradiation experiments were performed in a Penn PhD
Photoreactor M2 (Penn Photon Devices, LLC).
6.3.3. Synthetic procedures
6.3.3.1. Synthesis of precursor copolymers P1-P3 Copolymers P1-P3 were synthesized by RAFT copolymerization following procedures
similar to those reported in section 5.2.3.1 and ref. [44]. In a typical procedure, MMA (2 ml,
18.7 mmol), AEMA (1.5 ml, 8 mmol), 2-cyanoprop-2-yl-dithiobenzoate (7.9 mg, 3.6×10⁻²
mmol) and 2,2-azobis(2-methylpropionitrile) (1.5 mg, 9×10⁻³ mmol) were dissolved in
ethyl acetate (8.8 ml). The reaction mixture was degassed by passing argon for 15 min. The
copolymerization reaction was carried out at 65ºC for 18 h. (P3: Yield (%) = 42, Mw

Self-Reporting of Folding and Aggregation Phenomena in Single-Chain Nanoparticles
137
(SEC/SLS) = 56.2 kDa, Mw/Mn = 1.08, Rg = 7.8 nm, composition (1H NMR) = 34.9 mol% AEMA). The resulting copolymers P1-P3 were isolated by precipitation in methanol and
further drying under vacuum. The molar fraction of β-ketoester groups in P1-P3, x, was
determined by 1H NMR spectroscopy following the procedure reported in section 5.3 and
ref. [44] from the normalized areas of peaks d, e and f of Figure 6.8. The absolute molecular
weight, Mw, and the dispersity of the molecular weight distribution, Ð, of copolymers P1-P3
were determined by SEC/MALS. The values of x, Mw, and Ð for copolymers P1-P3 are
provided in Table 6.1.
6.3.3.2. Synthesis of fluorescent SCNPs N1f-N3f After screening of reaction conditions with aldehydes A1 and A2, N1f-N3f were synthesized at r.t. from P1-P3, respectively, by intra-chain Hantzsch ester formation at high dilution
using aldehyde compound A2. In a typical reaction, P2 (100 mg, 0.21 mmol), A2 (7.1 mg,
0.053 mmol), NH4OAc (48.8 mg, 0.63 mmol), and PIP (2 µL, 0.02 mmol) were dissolved in
THF (100 ml). Samples were taken periodically to monitor the single-chain folding reaction
through SEC/MALS and FS, respectively. After reaction completion, the solution was
concentrated, precipitated in Et2O and dried under vacuum, prior to further
characterization by SEC/MALS, 1H NMR, FTIR, EA, FS, DLS and SAXS.
6.3.3.3. Synthesis of fluorescent SCNPs with AIE N1fa-N3fa After screening of reaction conditions with aldehydes A2 and A3, N1fa-N3fa were
synthesized at r.t. from P1-P3, respectively, by intra-chain Hantzsch ester formation at high
dilution using a blend of aldehyde compounds A2 and A3 at a molar ratio of 1/2. In a typical
reaction, P2 (100 mg, 0.21 mmol), A2 (3.6 mg, 0.027 mmol), A3 (19.1 mg, 0.053 mmol),
NH4OAc (48.8 mg, 0.63 mmol), and PIP (2 µl, 0.02 mmol) were dissolved in THF (100 ml).
Samples were taken periodically to monitor the single-chain folding reaction through
SEC/MALS and FS, respectively. After reaction completion, the solution was concentrated,
precipitated in Et2O and dried under vacuum, prior to further characterization by
SEC/MALS, 1H NMR, FTIR, EA, FS, DLS and SAXS.
6.3.3.4. Self-reporting of multi-SCNPs aggregation by N1fa-N3fa in good solvent Aggregation of SCNPs N1fa-N3fa was induced through photoactivated radical-mediated
thiol-ene coupling (TEC) reaction involving a homobifunctional cross-linker (DODT) and
the 1,4-dihidropyridine groups of SCNPs N1fa-N3fa, in the presence of DMPA as
photoinitiator. Reactions were carried out in THF at r.t. under UV irradiation. In a typical
reaction, P2 (3 mg, 6.3 x 10⁻³ mmol), DODT (1 µl, 6.3 x 10⁻³ mmol) and DMPA (0.6 mg, 2.4 x
10-3 mmol) were dissolved in THF (0.12 mL) and subject to UV light irradiation (λexc = 365 nm) for 90 min in a Penn PhD Photoreactor M2 (Penn Photon Devices, LLC). The multi-
SCNPs aggregates obtained were analysed by DLS and FS.
6.3.3.5. Self-reporting of multi-SCNPs aggregation by N1fa-N3fa in solvent / non-solvent mixtures For experiments about self-reporting of multi-SCNPs aggregation in solvent / non-solvent
mixtures, mixtures of THF and EtOH of varying composition were employed. The multi-
SCNPs aggregates obtained were analysed by DLS and FS.

Chapter 6
138
6.4. Results
6.4.1. Self-reporting of folding within a single polymer chain via Hantzsch reaction
Following the strategy depicted in Scheme 6.2, we first synthesized non-fluorescent
polymers randomly decorated with -ketoester moieties via RAFT copolymerization [44,
46] of methyl methacrylate (MMA) and 2-(acetoacetoxy)ethyl methacrylate (AEMA)
monomers. Random placement of pendant reactive groups along the copolymer chains to
participate in the Hantzsch reaction was guaranteed by similar reactivity ratios of MMA
(rMMA = 0.89) and AEMA (rAEMA = 0.98) [47]. Several representative poly(MMA-r-AEMA)
copolymers of varying molecular weight (Mw) and composition (molar fraction of -
ketoester groups, x) were prepared and characterized by 1H NMR spectroscopy and
SEC/MALS (see Table 6.1). Copolymers P1–P3 showed low values of dispersity (Ð < 1.25).
Table 6.1. Characterization data for poly(MMA-r-AEMA) copolymers with β-ketoester pendant reactive groups.
Polymer Mw
(kDa)[a] Ð[a] x
(mol %)[b]
P1 43.6 1.13 54.6
P2 288.6 1.22 33.2
P3 56.2 1.08 34.9
[a] Weight average molecular weight and dispersity determined by SEC/MALS.
[b] Molar fraction of β‐ketoester groups determined via 1H NMR.
Initial experiments about self-reporting of single-chain compaction were performed using
benzaldehyde (A1) (Scheme 6.3) and copolymer P1 containing 55 mol % of -ketoester
reactive groups. Single-chain compaction of P1 was induced at r.t. in THF at high dilution (1
mg/ml) via intra-chain Hantzsch reaction between -ketoester pendants of P1 (1 eq), A1
(0.5 eq) and ammonium acetate (NH4OAc, 0.5 eq), in the presence of piperidine (0.1 eq) as
catalyst [48]. At high dilution, the intra-chain reaction leading to single-chain compaction is
favoured over the inter-chain reaction giving to aggregation of multiple chains. Importantly,
the Hantzsch ester resulting from A1 and ethyl acetoacetate is known to display
fluorescence in organic solvents such as dimethylsulfoxide (em = 421 nm, quantum yield
ΦF = 1.2 %) [49]. The generation of Hantzsch luminophores as intra-chain connectors could
be therefore a very suitable strategy for self-reporting of single-chain compaction.

Self-Reporting of Folding and Aggregation Phenomena in Single-Chain Nanoparticles
139
Scheme 6.3. Aldehyde compounds allowing to monitor the compaction of individual polymer chains to single-chain nanoparticles (SCNPs). Benzaldehyde (A1) and terephthalaldehyde (A2).
As revealed by SEC / MALS measurements, the intra-chain Hantzsch ester formation
reaction was found to proceed very smoothly and SEC retention time (tR) of P1 -taken at the
maximum of the SEC trace- slightly increased during single-chain compaction as a
consequence of the induced reduction in hydrodynamic size [6] (Figure 6.1).
Figure 6.1. SEC/MALS elugrams as a function of reaction time (0, 1, 2, 3, 4 and 9 days) during single-chain folding of P1 (1.2 eq) via intra-chain Hantzsch ester formation involving A1 (0.5 eq), NH4OAc (0.5 eq) and piperidine (0.05 eq). Initial SEC/MALS trace of unfolded P1 displayed in black. Final SEC/MALS trace of P1 after 9 days of reaction time displayed in red.
In order to improve the degree of single-chain compaction, we replaced A1 (0.5 eq) by
bifunctional terephthalaldehyde (A2) (0.25 eq) although with limited success under the
above reaction conditions (see Figure 6.2).
7,8 8 8,2 8,4 8,6
Rela
tive inte
nsity (
a.u
.)
Retention time (min)
0
3d
4d
9d
1d
2d

Chapter 6
140
Figure 6.2. SEC/MALS elugrams as a function of reaction time (1, 2, 3, 4 and 9 days) during single-chain folding of P1 (1.2 eq) via intra-chain Hantzsch ester formation involving A2 (0.25 eq), NH4OAc (0.5 eq) and piperidine (0.05 eq). Final SEC/MALS trace of P1 after 9 days of reaction time displayed in red.
Unexpectedly, we found that by increasing the amount of NH4OAc from 0.5 eq to 3 eq, the
degree of single-chain compaction of P1 to SCNP N1f [50] improved notably, as observed by
SEC (see Figure 6.3).
7,8 8 8,2 8,4 8,6
Re
lative in
ten
sity (
a.u
.)
Retention time (min)
1d
2d
3d
4d
9d

Self-Reporting of Folding and Aggregation Phenomena in Single-Chain Nanoparticles
141
Figure 6.3. Normalized SEC/MALS elugrams as a function of reaction time (h = hours, d = days) during single-chain compaction of P1 (1.2 eq) via intra-chain Hantzsch ester formation involving A2 (0.25 eq), NH4OAc (3 eq) and piperidine (0.05 eq).
Due to the presumably formation of an excess of enamine adduct under such conditions, the
kinetics of the Hantzsch ester formation reaction substantially slows down when compared
to classical procedures [51]. Slow kinetics, however, should be beneficial for attaining
equilibrium conformations of the resulting SCNPs, although it could increase the probability
of inter-chain reactions. After 6 days of reaction time, corresponding to a shift of SEC
retention time of tR = 0.28 min, the yield of the Hantzsch ester formation reaction was
found to be 92% as calculated from elemental analysis data (Table 6.2).
7,5 8 8,5 9
Re
lative inte
nsity (
a.u
.)
Retention time (min)
0
2h
2d
5d
6d

Chapter 6
142
Table 6.2. Elemental analysis data and yield of the intra-chain Hantzsch ester formation reaction calculated thereof.
Experimental Theoretical Yieldb (%) Sample C
(wt. %) H (wt. %)
N (wt. %)
Nmaxa (wt. %)
P1 57.01 7.02 - - -
P2 58.47 7.20 - - -
P3 57.41 7.17 - - -
N1f 58.01 7.01 2.06 2.24 92.0
N2f 59.71 7.27 1.60 1.63 98.1
N2fa 59.11 7.92 1.25 1.39 90.0
N3fa 58.64 7.05 1.19 1.43 83.2
aMaximum amount of nitrogen from the theoretical molecular formula by assuming a yield of the
intra-chain Hantzsch ester formation reaction of 100 %.
bYield (%) = (N / Nmax) x 100.
The evolution of SEC traces for copolymer P2 of higher molecular weight and lower -
ketoester content is shown in Figure 6.4. The shift towards longer retention times (tR =
0.32 min) was indicative of the progressive compaction of P2 to SCNPs N2f via intra-chain
Hantzsch ester formation, which amounted to 98 % after 7 days of reaction time (Table 6.2).

Self-Reporting of Folding and Aggregation Phenomena in Single-Chain Nanoparticles
143
Figure 6.4. SEC/MALS elugrams of P2 (1.2 eq) during reaction with A2 (0.25 eq), NH4OAc (3 eq) and piperidine (0.05 eq).
No further significant shift of the SEC trace of P2 was observed at longer reaction time.
Similar observation of single-chain compaction of P3 to SCNPs N3f (Figure 6.5) revealed the
general scope of this method for chains randomly decorated with - ketoester moieties.
Figure 6.5. SEC/MALS elugrams as a function of reaction time (0, 1, 2, 4 and 7 days) during single-chain folding of P3 (1.2 eq) via intra-chain Hantzsch ester formation involving A2 (0.25 eq), NH4OAc (3 eq) and piperidine (0.05 eq). Final SEC/MALS trace of P3 after 7 days of reaction time displayed in red.
6 6,5 7 7,5 8 8,5
Re
lative inte
nsity (
a.u
.)
Retention time (min)
0
2h
3d
6d
7d
1d
2d
7,6 7,8 8 8,2 8,4 8,6
Re
lative inte
nsity (
a.u
.)
Retention time (min)
0
1d
2d
4d
7d

Chapter 6
144
It is worth mentioning the high yield of the Hantzsch ester achieved, even involving a very
slow reaction kinetics arising from both the excess of NH4OAc used and the macromolecular
environment of the -ketoester groups in P1–P3 when compared to the Hantzsch reaction
kinetics of low molecular weight organic molecules [41-43]. Actual Mw data of P1–P3 and
N1f–N3f derived from SEC/MALS measurements confirmed the successful intra-chain
reaction without signs of significant multi-chain aggregation (Table 6.3).
Table 6.3. Absolute Mw data of precursors P1-P3, SCNPs N1f-N3f and SCNPs N1fa-N3fa as determined from static multi-angle light scattering (MALS) measurements.
Sample Mw (kDa) Sample Mw (kDa) Sample Mw (kDa)
P1 43.6 N1f 56.1 N1fa 78.9
P2 288.6 N2f 346.3 N2fa 357.9
P3 56.2 N3f 71.4 N3fa 84.3
Additional support of single-chain compaction was obtained from small angle X-ray
scattering (SAXS) measurements in solution showing a decrease of the radius of gyration from Rg = 6.5, 23.4 and 7.8 nm (unfolded P1- P3 chains) to Rg = 4.6, 10.7 and 5.9 nm (SCNPs
N1f-N3f) and Flory exponents from = 0.59 in the unfolded state to = 0.46, 0.42 and 0.44
(SCNPs N1f-N3f) (see Figure 6.6).

Self-Reporting of Folding and Aggregation Phenomena in Single-Chain Nanoparticles
145
Figure 6.6. A) SAXS results revealing the form factor of P1, N1f and N1fa. Values of Rg and ν were obtained
through fits of the experimental P(Q) vs Q data to a generalized Gaussian coil function (equation (6.1). P1: Rg = 6.5 nm, ν = 0.59. N1f: Rg = 4.6 nm, ν = 0.46. N1fa: Rg = 5.8 nm, ν = 0.48. B) SAXS results revealing the form factor of P2, N2f and N2fa. Values of Rg and ν were obtained through fits of the experimental P(Q) vs Q data to a
generalized Gaussian coil function (equation (6.1). P2: Rg = 23.8 nm, ν = 0.59. N2f: Rg = 10.7 nm, ν = 0.42. N2fa: Rg = 17.6 nm, ν = 0.52. C) SAXS results revealing the form factor of P3, N3f and N3fa. Values of Rg and ν were obtained through fits of the experimental P(Q) vs Q data to a generalized Gaussian coil function (equation
(6.1). P3: Rg = 7.8 nm, ν = 0.59. N3f: Rg = 5.7 nm, ν = 0.44. N3fa: Rg = 6.4 nm, ν = 0.51. D) Scaling laws (Rg ~ Mwν) corresponding to P1-P3, SCNPs N1f-N3f and SCNPs N1fa-N3fa as determined from SAXS measurements.
These values are in agreement with previous results concerning single-chain folding of
synthetic polymers to SCNPs [26, 52]. Complementary to elemental analysis data, infra-red
(IR) spectroscopy revealed the appearance of a new, broad band between 3300 and 3500
cm-1 arising from the stretching vibrations of -NH- groups (Figure 6.7).

Chapter 6
146
Figure 6.7. FTIR spectra of P2, N2f and N2fa in the wavenumber regions of 3000-4000 cm-1 and 2000-1000 cm-
1. The appearance of a new, broad band -when compared to P2- arising from the stretching vibrations of –NH– groups in N2f and N2fa is highlighted in yellow.
Also, the 1H NMR spectrum was in agreement with the expected structure of SCNPs N2f
(Figure 6.8).
0
100
20
40
60
80
4000 100020003000
%T
Wavenumber [cm-1]
Tra
nsm
itta
nce
(%
)
Wavenumber (cm-1) Wavenumber (cm-1)
P2
N2f
N2fa

Self-Reporting of Folding and Aggregation Phenomena in Single-Chain Nanoparticles
147
Figure 6.8. 1H NMR spectra of P2 (displayed in blue) and N2f (in red).
Fluorescence spectroscopy measurements further supported the successful, progressive
formation of intra-chain connectors via Hantzsch reaction. As illustrated in Figure 6.9, the
intensity of the fluorescence band corresponding to the emission of intra-chain Hantzsch
fluorophores increases progressively with reaction time.

Chapter 6
148
Figure 6.9. A) Photoluminescence emission spectra of P3 during single-chain compaction as a function of reaction time (λexc = 365 nm). B) Results of FS experiments showing the increase in photoluminescence emission during “in-situ” generation of SCNPs N1f from P1. C) Results of FS experiments showing the increase in photoluminescence emission during “in-situ” generation of SCNPs N2f from P2.
Consequently, single-chain compaction was visually detected under UV illumination at exc
= 365nm through photoluminescence arising from Hantzsch luminophores progressively
generated as intra-chain connectors (Figure 6.10).

Self-Reporting of Folding and Aggregation Phenomena in Single-Chain Nanoparticles
149
Figure 6.10. Photographs of P2 in THF (1 mg/ml) under 365 nm UV illumination after 2h and 7d of single-chain compaction.
An inverse relationship between single-chain size reduction as monitored by in situ SAXS
kinetic experiments (Figure 6.11 A) and photoluminescence emission (Figure 6.9 B) was
found, as illustrated in Figure 6.11 B. Altogether, the above experimental data provide
support of the visual detection of single-chain folding of P1–P3 to SCNPs N1f–N3f via intra-
chain Hantzsch fluorophore generation.

Chapter 6
150
Figure 6.11. A) Results of SAXS experiments showing the single-chain size reduction (Rg ~ Mwν) during “in-situ” generation of SCNPs N1f from P1 (circles). Data from other two independent measurements are also included for comparison (triangles and squares). B) Inverse relationship between single-chain size reduction, as determined by SAXS measurements, and photoluminescence emission observed during single-chain compaction of P1.
6.4.2. Self-reporting of folding and aggregation within a single polymer chain by
orthogonal luminophores via Hantzsch reaction
Next, to endow the synthetic polymers P1–P3 with orthogonal intra-molecular compaction
and inter-molecular aggregation self-reporting characteristics, we investigated
replacement of bifunctional terephthalaldehyde A2 by 4-(1,2,2-
triphenylethenyl)benzaldehyde A3 (see Scheme 6.4) with the aim of visual detection of

Self-Reporting of Folding and Aggregation Phenomena in Single-Chain Nanoparticles
151
multi-chain aggregates (when formed) via aggregation-induced emission (AIE) [38-40]
from tetraphenylethene (TPE) moieties.
Scheme 6.4. A) Aldehyde compound to report, additionally, the assembly of SCNPs into multi-SCNPs aggregates via aggregation-induced emission (AIE) 4-(1,2,2- triphenylethenyl)benzaldehyde (A3). B) Illustration of self-reporting of folding and aggregation by orthogonal Hantzsch luminophores within a single polymer chain.
Remarkably, TPE molecules show almost no photoluminescence in diluted solutions (e.g.,
ΦF = 0.24 % in acetonitrile) whereas in a non-solvent medium and in the solid state they
display intense AIE-type photoluminescence (e.g., em = 475 nm and ΦF = 49 % in
amorphous film) [53]. We hypothesized that photoluminescence arising from aggregation
of TPE-containing SCNPs should be more intense than that coming from Hantzsch
fluorophores, and should be located at redshifted wavelengths. Moreover, installation of
TPE pendants based on aldehyde A3 can be carried out also through Hantzsch ester
formation. Hence, placement of an orthogonal (AIE-type) luminophore within a synthetic

Chapter 6
152
polymer chain via Hantzsch ester formation could be a very suitable strategy for additional
self-reporting of multi-SCNPs aggregation. Unfortunately, total replacement of A2 by A3
resulted in a significant reduction of the degree of single-chain compaction, presumably due
to the large steric hindrance introduced by A3 within the macromolecular environment of
the reactive -ketoester groups (Figure 6.12). The degree of single-chain compaction
increased by only partial replacement of A2 by A3.
Figure 6.12. SEC/MALS elugrams as a function of reaction time (0, 2, 3 and 7 days) during single-chain folding of P2 (1.2 eq) via intra-chain Hantzsch ester formation involving A3 (0.5 eq), NH4OAc (3 eq) and piperidine (0.05 eq). Initial SEC/MALS trace of unfolded P2 displayed in black. Final SEC/MALS trace of P2 displayed in red.
Figure 6.13 shows the evolution of the SEC / MALS traces as a function of reaction time
during single-chain folding of P2 to SCNPs N2fa [54] using a A2 / A3 molar ratio of 1/2. Even
involving a slower Hantzsch reaction kinetics due to the presence of A3, the yield of the
Hantzsch ester product was 90 % for SCNPs N2fa after 13 days of reaction time (Table 6.2).
6 6,5 7 7,5 8 8,5
Re
lative inte
nsity (
a.u
.)
Retention time (min)
0
2d
3d
7d

Self-Reporting of Folding and Aggregation Phenomena in Single-Chain Nanoparticles
153
Figure 6.13. Normalized SEC/MALS elugrams as a function of reaction time during single-chain compaction via intra-chain Hantzsch ester formation involving P2 (1.2 eq), A2 (0.125 eq), A3 (0.25 eq), NH4OAc (3 eq) and piperidine (0.05 eq).
SAXS measurements provide solid support of the single-chain compaction of P2 to SCNPs
N2fa, revealing a reduction in size from Rg = 23.8 nm to Rg = 17.6 nm, and a decrease of the
scaling exponent from = 0.59 to = 0.52, respectively (Figure 6.6 B). Due to the severe
steric hindrance introduced by A3 the degree of single-chain compaction was lower,
however, than that observed for SCNPs N2f (Rg = 10.7 nm, = 0.42). Structural
characterization by 1H NMR and IR spectroscopy -complemented with elemental analysis
data- revealed both generation of intra-chain connectors via Hantzsch reaction and
successful incorporation of TPE moieties into SCNPs N2fa (Figure 6.7, Figure 6.14, Table
6.2).
Moreover, absolute Mw data (Table 6.3) and SAXS results (Figure 6.6) corroborated the
single-chain nature of nanoparticles N1fa–N3f.
6 6,5 7 7,5 8 8,5
Rela
tive inte
nsity (
a.u
.)
Retention time (min)
0
1d
5d
8d
13d

Chapter 6
154
Figure 6.14. 1H NMR spectrum of N2fa synthesized using a A2 / A3 molar ratio = 1 / 2 (displayed in red) compared to that obtained by using neat A3 (in blue).
6.4.3. Self-reporting of (intentionally induced) multi-SCNPs aggregation
Two model experiments were performed to investigate self-reporting of (intentionally
induced) multi-SCNPs aggregation by SCNPs N1fa–N3fa. First, inter-particle association was
promoted in good solvent via photo-activated radical-mediated thiol-ene coupling (TEC)
reaction under UV irradiation in the presence of 2,2-dimethoxy-2-phenylacetophenone, as photo-initiator, and 3,6- dioxa-1,8-octane-dithiol, as homobifunctional cross-linker. Before
UV irradiation of SCNPs N1fa in THF, photoluminescence arising exclusively from the
Hantzsch luminophores generated as intra-chain connectors was observed (Figure 6.15 A,
i). After 90 min of UV irradiation (exc = 365 nm), the formation of multi-SCNPs aggregates,
that was confirmed by dynamic light scattering (DLS) measurements (see Figure 6.15 B and
C), was successfully accompanied by a significant increase in photoluminescence at
redshifted wavelengths (Figure 6.15 A, ii).

Self-Reporting of Folding and Aggregation Phenomena in Single-Chain Nanoparticles
155
Figure 6.15. A) Increase in photoluminescence at redshifted wavelengths upon formation in THF of multi-SCNPs aggregates (ii) via UV irradiation (λexc = 365 nm) of SCNPs N2fa (i) in the presence of 3,6-dioxa-1,8-octane-dithiol as homobifunctional cross-linker and 2,2-dimethoxy-2-phenylacetophenone as photoinitiator. B) Correlation function of multi-SCNPs aggregates of SCNPs N2fa (1 mg ml-1) generated in THF (1 mg ml-1) through photoactivated radical-mediated thiol-ene coupling reaction. The corresponding DLS intensity distribution is given in C) showing that the hydrodynamic size of the multi-SCNPs aggregates is > 100 nm. Results from 6 consecutive measurement are shown.
Next, inter-molecular association of SCNPs N1fa–N3fa in mixtures of THF and EtOH -which
is a precipitant of SCNPs N1fa–N3fa- was investigated. As a representative example, SCNPs
N3fa developed intense AIE-type photoluminescence at redshifted wavelengths in THF /
EtOH mixtures upon decreasing the THF / EtOH volume ratio (Figure 6.16).

Chapter 6
156
Figure 6.16. Photographs of SCNPs N2fa (1 mg/ml) in solvent (THF) / non-solvent (EtOH) mixtures at different volume ratios under 365 nm UV illumination.
The presence of multi-SCNPs aggregates was confirmed by DLS experiments. Hence, DLS
(intensity distribution) results of SCNPs N3fa in THF / EtOH mixtures at volume ratios of
2/3 and 1/3 revealed the presence of multi-SCNPs aggregates with hydrodynamic size
larger than 100 nm (Figure 6.17).

Self-Reporting of Folding and Aggregation Phenomena in Single-Chain Nanoparticles
157
Figure 6.17. Correlation function of multi-SCNPs aggregates of SCNPs N2fa (1 mg/ml) generated in THF / EtOH mixtures with a THF / EtOH ratio of 2/3 (A) and 1/3 (B). The corresponding DLS intensity distributions are given in C) and D), respectively. Results from 6 consecutive measurement are shown.
Macroscopic precipitation was visually observed at a THF / EtOH volume ratio of 1/9.
Although in the latter case a certain contribution from conformational changes induced by
preferential solvation [55] could be involved, taken together, the above model experiments
certified that SCNPs N1fa–N3fa were indeed successfully equipped with orthogonal
luminophores for visualizing intramolecular compaction and inter-molecular aggregation
phenomena.
Finally, the high sensitivity of this method via changes in both photoluminescence intensity
and wavelength was applied to establish an accurate diagram of states of the SCNPs in THF
/ EtOH mixtures. Figure 6.18 shows the photoluminescence emission spectra of SCNPs N3fa
in THF / EtOH mixtures (1 mg/ml) at different volume ratios.

Chapter 6
158
Figure 6.18. Photoluminescence emission spectra of SCNPs N3fa in THF / EtOH mixtures (1 mg/ml) at different volume ratios (λexc = 365 nm).
At low EtOH content (≤ 15 vol. %) the photoluminescence emission spectrum of the single-
chain nanoparticles was equivalent to that recorded in neat THF, revealing the absence of
significant aggregation phenomena. Upon increasing the EtOH content in the mixture, the
photoluminescence emission intensity grew (Figure 6.19 A) and the wavelength at peak
maximum shifted towards higher values (Figure 6.19 B). Macroscopic precipitation -which
was observed at high EtOH content (90 vol. %)- was accompanied by a 5-fold increase in
photoluminescence emission intensity, which was found to shift to em = 485nm. Based on
the above consistent changes in photoluminescence intensity and wavelength, a reliable
diagram of states reporting intra-molecular compaction (C), inter-molecular aggregation
(A) and macroscopic precipitation (P) of SCNPs N3fa in THF / EtOH mixtures emerged (see
Figure 6.19).
400 450 500 550 600
100:0
85:15
70:30
55:45
40:60
25:75
10:90
PL inte
nsity (
a.u
.)
Wavelength (nm)
THF:EtOH

Self-Reporting of Folding and Aggregation Phenomena in Single-Chain Nanoparticles
159
Figure 6.19. A) Ratio of photoluminescence emission intensity at peak maximum to that in neat THF (Imax/I0) as a function of EtOH volume fraction, and diagram of states of SCNPs N3fa: “intra-molecular compaction” zone (C, blue solid circles), “inter-molecular aggregation” region (A, green solid circles) and “macroscopic-precipitation” zone (P, red solid circles). B) Photoluminescence emission wavelength at peak maximum (lem) as a function of EtOH volume fraction (blue, green and red circles), and C-A-P diagram.
6.5. Conclusions
In conclusion, we have developed a strategy for self-reporting both intra-molecular
compaction and inter-molecular aggregation through installation of orthogonal
luminophores based on Hantzsch ester formation within a single polymer chain. We have
demonstrated that this method permits to detect visually the degree of single-chain
compaction of a synthetic polymer chain containing -ketoester moieties via generation of
Hantzsch luminophores as intra-chain connectors taking the role of surrogates of covalent
disulphide bonds in folded proteins. We have shown that orthogonal AIE-type
luminophores placed also through intra-chain Hantzsch reaction allow complementary self-
reporting of inter-molecular aggregation via photoluminescence at redshifted wavelengths.
Multi-chain aggregation, in the case of SCNPs, would play a role equivalent to the self-
assembly of defective proteins into pathogenic aggregates. The method is simple and highly

Chapter 6
160
accurate e.g. to establish reliable single-chain compaction-aggregation-precipitation
diagrams of SCNPs in solvent / non-solvent mixtures. Since introduction of -ketoester
moieties in synthetic polymer chains is relatively straightforward and a variety of functional
SCNPs have indeed been constructed from precursors containing these pendants, this
strategy holds promise to perceive at a glance the presence / absence of detrimental multi-
chain aggregates affecting the performance of SCNPs in catalysis, sensing, recognition, and
so on.
6.6. References
[1] M. Gruebele, K. Dave, S. Sukenik, Globular Protein Folding In Vitro and In Vivo, Annual Review of Biophysics, 45 (2016) 233-251. [2] V. Armiento, A. Spanopoulou, A. Kapurniotu, Peptide-Based Molecular Strategies To Interfere with Protein Misfolding, Aggregation, and Cell Degeneration, Angewandte Chemie International Edition, 59 (2020) 3372-3384. [3] J.R. Lakowicz, Principles of fluorescence spectroscopy, Springer science & business media2013. [4] A. Aliyan, N.P. Cook, A.A. Martí, Interrogating Amyloid Aggregates using Fluorescent Probes, Chemical Reviews, 119 (2019) 11819-11856. [5] C.W. Bertoncini, M.S. Celej, Small Molecule Fluorescent Probes for the Detection of Amyloid Self-Assembly In Vitro and In Vivo, Current Protein & Peptide Science, 12 (2011) 206-220. [6] J.A. Pomposo, Single-Chain Polymer Nanoparticles: Synthesis, Characterization, Simulations, and Applications, John Wiley & Sons2017. [7] We use the term "folding" referred to the process by which a functionalized polymer chain assumes its final shape or conformation as individual single-chain nanoparticle (SCNP) via non-covalent, or covalent, or dynamic covalent intra-chain interactions at high dilution. Folding, single-chain compaction and intra-molecular compaction are utilized as synonyms along the chapter. Note, however, that "unfolding" of SCNPs is reserved to SCNPs with non-covalent or dynamic covalent intra-chain interactions. [8] S. Mavila, O. Eivgi, I. Berkovich, N.G. Lemcoff, Intramolecular Cross-Linking Methodologies for the Synthesis of Polymer Nanoparticles, Chemical Reviews, 116 (2016) 878-961. [9] C.K. Lyon, A. Prasher, A.M. Hanlon, B.T. Tuten, C.A. Tooley, P.G. Frank, E.B. Berda, A brief user's guide to single-chain nanoparticles, Polymer Chemistry, 6 (2015) 181-197. [10] M. ter Huurne Gijs, R.A. Palmans Anja, E.W. Meijer, Supramolecular Single-Chain Polymeric Nanoparticles, CCS Chemistry, 1 (2019) 64-82. [11] T.S. Fischer, D. Schulze-Sünninghausen, B. Luy, O. Altintas, C. Barner-Kowollik, Stepwise Unfolding of Single-Chain Nanoparticles by Chemically Triggered Gates, Angewandte Chemie International Edition, 55 (2016) 11276-11280. [12] E. Huerta, P.J.M. Stals, E.W. Meijer, A.R.A. Palmans, Consequences of Folding a Water-Soluble Polymer Around an Organocatalyst, Angewandte Chemie International Edition, 52 (2013) 2906-2910. [13] E.A. Appel, J. Dyson, J. del Barrio, Z. Walsh, O.A. Scherman, Formation of Single-Chain Polymer Nanoparticles in Water through Host–Guest Interactions, Angewandte Chemie International Edition, 51 (2012) 4185-4189. [14] E. Verde-Sesto, A. Arbe, A.J. Moreno, D. Cangialosi, A. Alegría, J. Colmenero, J.A. Pomposo, Single-chain nanoparticles: opportunities provided by internal and external confinement, Materials Horizons, 7 (2020) 2292-2313. [15] M. Gonzalez-Burgos, A. Latorre-Sanchez, J.A. Pomposo, Advances in single chain technology, Chemical Society Reviews, 44 (2015) 6122-6142.

Self-Reporting of Folding and Aggregation Phenomena in Single-Chain Nanoparticles
161
[16] M. Ouchi, N. Badi, J.-F. Lutz, M. Sawamoto, Single-chain technology using discrete synthetic macromolecules, Nature Chemistry, 3 (2011) 917-924. [17] T.-K. Nguyen, S.J. Lam, K.K.K. Ho, N. Kumar, G.G. Qiao, S. Egan, C. Boyer, E.H.H. Wong, Rational Design of Single-Chain Polymeric Nanoparticles That Kill Planktonic and Biofilm Bacteria, ACS Infectious Diseases, 3 (2017) 237-248. [18] J. Liang, J.J. Struckhoff, P.D. Hamilton, N. Ravi, Preparation and Characterization of Biomimetic β-Lens Crystallins Using Single-Chain Polymeric Nanoparticles, Langmuir, 33 (2017) 7660-7668. [19] S. Thanneeru, J.K. Nganga, A.S. Amin, B. Liu, L. Jin, A.M. Angeles-Boza, J. He, “Enzymatic” Photoreduction of Carbon Dioxide using Polymeric Metallofoldamers Containing Nickel–Thiolate Cofactors, ChemCatChem, 9 (2017) 1157-1162. [20] J. Chen, J. Wang, K. Li, Y. Wang, M. Gruebele, A.L. Ferguson, S.C. Zimmerman, Polymeric “Clickase” Accelerates the Copper Click Reaction of Small Molecules, Proteins, and Cells, Journal of the American Chemical Society, 141 (2019) 9693-9700. [21] A. Sanchez-Sanchez, A. Arbe, J. Colmenero, J.A. Pomposo, Metallo-Folded Single-Chain Nanoparticles with Catalytic Selectivity, ACS Macro Letters, 3 (2014) 439-443. [22] A. Sanchez-Sanchez, S. Akbari, A.J. Moreno, F.L. Verso, A. Arbe, J. Colmenero, J.A. Pomposo, Design and Preparation of Single-Chain Nanocarriers Mimicking Disordered Proteins for Combined Delivery of Dermal Bioactive Cargos, Macromolecular Rapid Communications, 34 (2013) 1681-1686. [23] B.T. Tuten, D. Chao, C.K. Lyon, E.B. Berda, Single-chain polymer nanoparticles via reversible disulfide bridges, Polymer Chemistry, 3 (2012) 3068-3071. [24] G. Hattori, Y. Hirai, M. Sawamoto, T. Terashima, Self-assembly of PEG/dodecyl-graft amphiphilic copolymers in water: consequences of the monomer sequence and chain flexibility on uniform micelles, Polymer Chemistry, 8 (2017) 7248-7259. [25] G.M. ter Huurne, I.K. Voets, A.R.A. Palmans, E.W. Meijer, Effect of Intra- versus Intermolecular Cross-Linking on the Supramolecular Folding of a Polymer Chain, Macromolecules, 51 (2018) 8853-8861. [26] A. Arbe, J.A. Pomposo, A.J. Moreno, F. LoVerso, M. González-Burgos, I. Asenjo-Sanz, A. Iturrospe, A. Radulescu, O. Ivanova, J. Colmenero, Structure and dynamics of single-chain nano-particles in solution, Polymer, 105 (2016) 532-544. [27] M.A.J. Gillissen, I.K. Voets, E.W. Meijer, A.R.A. Palmans, Single chain polymeric nanoparticles as compartmentalised sensors for metal ions, Polymer Chemistry, 3 (2012) 3166-3174. [28] G.M. ter Huurne, M.A.J. Gillissen, A.R.A. Palmans, I.K. Voets, E.W. Meijer, The Coil-to-Globule Transition of Single-Chain Polymeric Nanoparticles with a Chiral Internal Secondary Structure, Macromolecules, 48 (2015) 3949-3956. [29] M. Tomasulo, E. Deniz, R.J. Alvarado, F.M. Raymo, Photoswitchable Fluorescent Assemblies Based on Hydrophilic BODIPY−Spiropyran Conjugates, The Journal of Physical Chemistry C, 112 (2008) 8038-8045. [30] I. Yildiz, S. Impellizzeri, E. Deniz, B. McCaughan, J.F. Callan, F.M. Raymo, Supramolecular Strategies To Construct Biocompatible and Photoswitchable Fluorescent Assemblies, Journal of the American Chemical Society, 133 (2011) 871-879. [31] S. Swaminathan, C. Fowley, B. McCaughan, J. Cusido, J.F. Callan, F.M. Raymo, Intracellular Guest Exchange between Dynamic Supramolecular Hosts, Journal of the American Chemical Society, 136 (2014) 7907-7913. [32] T.S. Fischer, S. Spann, Q. An, B. Luy, M. Tsotsalas, J.P. Blinco, H. Mutlu, C. Barner-Kowollik, Self-reporting and refoldable profluorescent single-chain nanoparticles, Chemical Science, 9 (2018) 4696-4702. [33] J.T. Offenloch, E. Blasco, S. Bastian, C. Barner-Kowollik, H. Mutlu, Self-reporting visible light-induced polymer chain collapse, Polymer Chemistry, 10 (2019) 4513-4518. [34] A. Hantzsch, Condensationsprodukte aus Aldehydammoniak und ketonartigen Verbindungen, Berichte der deutschen chemischen Gesellschaft, 14 (1881) 1637-1638.

Chapter 6
162
[35] D. Pi, H. Zhou, P. Cui, R. He, Y. Sui, Silver-Catalyzed Biomimetic Transfer Hydrogenation of N-Heteroaromatics with Hantzsch Esters as NADH Analogues, ChemistrySelect, 2 (2017) 3976-3979. [36] L. Shen, S. Cao, J. Wu, J. Zhang, H. Li, N. Liu, X. Qian, A revisit to the Hantzsch reaction: Unexpected products beyond 1,4-dihydropyridines, Green Chemistry, 11 (2009) 1414-1420. [37] We use the term "folding" referred to the process by which a functionalized polymer chain assumes its final shape or conformation as individual single-chain nanoparticle (SCNP) via non-covalent, or covalent, or dynamic covalent intra-chain interactions at high dilution. Folding, single-chain compaction and intra-molecular compaction are utilized as synonyms along the chapter. Note, however, that "unfolding" of SCNPs is reserved to SCNPs with non-covalent or dynamic covalent intra-chain interactions. [38] Z. Zhao, H. Zhang, J.W.Y. Lam, B.Z. Tang, Aggregation-Induced Emission: New Vistas at the Aggregate Level, Angewandte Chemie International Edition, 59 (2020) 9888-9907. [39] K. Kokado, K. Sada, Consideration of Molecular Structure in the Excited State to Design New Luminogens with Aggregation-Induced Emission, Angewandte Chemie International Edition, 58 (2019) 8632-8639. [40] J. Luo, Z. Xie, J.W.Y. Lam, L. Cheng, H. Chen, C. Qiu, H.S. Kwok, X. Zhan, Y. Liu, D. Zhu, B.Z. Tang, Aggregation-induced emission of 1-methyl-1,2,3,4,5-pentaphenylsilole, Chemical Communications, (2001) 1740-1741. [41] R. Kakuchi, Multicomponent Reactions in Polymer Synthesis, Angewandte Chemie International Edition, 53 (2014) 46-48. [42] H.G.O. Alvim, E.N. da Silva Júnior, B.A.D. Neto, What do we know about multicomponent reactions? Mechanisms and trends for the Biginelli, Hantzsch, Mannich, Passerini and Ugi MCRs, RSC Advances, 4 (2014) 54282-54299. [43] J. Zhu, H. Bienaymé, Multicomponent reactions, John Wiley & Sons2006. [44] A. Sanchez-Sanchez, S. Akbari, A. Etxeberria, A. Arbe, U. Gasser, A.J. Moreno, J. Colmenero, J.A. Pomposo, “Michael” Nanocarriers Mimicking Transient-Binding Disordered Proteins, ACS Macro Letters, 2 (2013) 491-495. [45] B. Hammouda, Small-Angle Scattering From Branched Polymers, Macromolecular Theory and Simulations, 21 (2012) 372-381. [46] C. Barner-Kowollik, Handbook of RAFT polymerization, John Wiley & Sons2008. [47] A. Zoller, K.B. Kockler, M. Rollet, C. Lefay, D. Gigmes, C. Barner-Kowollik, Y. Guillaneuf, A complete kinetic study of a versatile functional monomer: acetoacetoxyethyl methacrylate (AAEMA), Polymer Chemistry, 7 (2016) 5518-5525. [48] E.F.V. Scriven, Pyridines: from lab to production, Academic Press2013. [49] P. Pávez, M.V. Encinas, Photophysics and Photochemical Studies of 1,4-Dihydropyridine Derivatives, Photochemistry and Photobiology, 83 (2007) 722-729. [50] We use the code "f" for denoting folding self-reporting, whereas "fa" is reserved to denote both folding and aggregation self-reporting. [51] A.R. Katritzky, D.L. Ostercamp, T.I. Yousaf, The mechanism of the hantzsch pyridine synthesis: A study by 15N and 13C NMR spectroscopy, Tetrahedron, 42 (1986) 5729-5738. [52] J.A. Pomposo, I. Perez-Baena, F. Lo Verso, A.J. Moreno, A. Arbe, J. Colmenero, How Far Are Single-Chain Polymer Nanoparticles in Solution from the Globular State?, ACS Macro Letters, 3 (2014) 767-772. [53] Q. Miao, Polycyclic Arenes and Heteroarenes: Synthesis, Properties, and Applications, John Wiley & Sons2015. [54] We use the code "f" for denoting folding self-reporting, whereas "fa" is reserved to denote both folding and aggregation self-reporting. [55] A.K. Laha, P.K. Das, S. Bagchi, Study of Preferential Solvation in Mixed Binary Solvent as a Function of Solvent Composition and Temperature by UV−Vis Spectroscopic Method, The Journal of Physical Chemistry A, 106 (2002) 3230-3234.

Chapter 7: Conclusions


Conclusions
165
7.1. Conclusions
This Thesis has contributed to increase our understanding of single-chain polymer
nanoparticles (SCNPs) as complex soft nano-objects with potential applications in a variety
of fields, specially catalysis and sensing. The main conclusions of this work are the following:
1) A simple elastic SCNP model, as introduced in Chapter 3, provides a useful
framework for connecting -in the case of covalent-bonded SCNPs- the amount of
reactive groups (x) and precursor molar mass (M) with the SCNP size (R) upon
intra-chain cross-linking in a variety of solvents of different quality and on
substrates of different surface free energy. Force versus stretching curves for SCNPs
of different values of x -at low deformation- would allow determining
experimentally the effective elastic constant of the model.
2) Water-soluble self-folded iron-containing SCNPs can be used as enzyme-mimic
nanoreactors for the synthesis of intrinsically conducting polymers (ICPs) via step-
growth polymerization, as reported in Chapter 4. PEDOT: PSS dispersions generated
through this method showed the characteristic bipolaron UV–Vis absorption band
at 800 nm from conducting PEDOT. Thin films prepared from these PEDOT: PSS
dispersions revealed an electrical conductivity value of σ = 1 × 10⁻⁴ S/cm, similar to
that typically reported for films prepared from PEDOT: PSS dispersions synthesized
using iron-containing proteins.
3) Photoactivation of aggregation induced emission (AIE) molecules containing azide
functional groups in the presence of precursor polymers developing highly reactive
carbene species under such conditions is a new strategy for the generation of SCNPs
with intense fluorescence emission in both solution and solid state (λem ≈ 455 nm),
as described in Chapter 5. This strategy opens a new avenue to endow a variety of
other nanostructured polymeric materials with intense fluorescence emission.
4) An original platform for self-reporting both intra-molecular compaction and inter-
molecular aggregation through installation of orthogonal luminophores based on
Hantzsch ester formation within a single polymer chain has been developed. As
reported in Chapter 6, the degree of single-chain compaction of a synthetic polymer
chain containing -ketoester moieties can be detected visually via the generation of
Hantzsch luminophores at high dilution. Orthogonal AIE-type luminophores placed
also through intra-chain Hantzsch reaction allows self-reporting of inter-molecular
aggregation -when present- via photoluminescence at redshifted wavelengths.

Chapter 7
166
7.2. Publications
This thesis has contributed to the following publications:
J. De-La-Cuesta, E. González, A.J. Moreno, A. Arbe, J. Colmenero, J.A. Pomposo, Size of Elastic Single-Chain Nanoparticles in Solution and on Surfaces, Macromolecules, 50 (2017) 6323-6331.
J. De-La-Cuesta, E. González, J.A. Pomposo, Advances in Fluorescent Single-Chain
Nanoparticles, Molecules, 22 (2017).
J. De-La-Cuesta, J.A. Pomposo, Photoactivation of Aggregation-Induced Emission Molecules for Fast and Efficient Synthesis of Highly Fluorescent Single-Chain Nanoparticles, ACS Omega, 3 (2018) 15193-15199.
J. De-La-Cuesta, I. Asenjo-Sanz, A. Latorre-Sánchez, E. González, D.E. Martínez-Tong,
J.A. Pomposo, Enzyme-mimetic synthesis of PEDOT from self-folded iron-containing single-chain nanoparticles, European Polymer Journal, 109 (2018) 447-452.
J. De-La-Cuesta, E. Verde-Sesto, A. Arbe, J.A. Pomposo, Self-Reporting of Folding and Aggregation by Orthogonal Hantzsch Luminophores Within a Single Polymer Chain, Angewandte Chemie International Edition, 60 (2021) 3534-3539.

167
Resumen
Esta tesis profundiza en la comprensión de las nanopartículas poliméricas unimoleculares
(SCNPs, por sus siglas en inglés) como nano-objetos blandos complejos con aplicaciones
potenciales en varios campos, especialmente catálisis y detección. En particular, este
trabajo cubre diferentes aspectos relacionados con la estructura y propiedades de las SCNPs
como: i) el desarrollo de un modelo teórico de SCNPs elásticas que permita comprender el
comportamiento de estas nanopartículas en solución y sobre superficies; ii) el diseño de
SCNPs como nanoreactores avanzados para la síntesis de un polímero intrínsecamente
conductor como el poli(etilendioxitiofeno) (PEDOT); iii) el diseño de SCNPs altamente
fluorescentes por fotoactivación de copolímeros que contienen grupos funcionales diazo y
un fluoróforo de emisión inducida por agregación (AIE) decorado con grupos azida; y iv) la
síntesis de SCNPs que contienen fluoróforos ortogonales para autoreportar compactación
intra-molecular y, cuando está presente o es inducida externamente, agregación inter-
molecular.
El Capítulo 1, como capítulo introductorio, resume varios conceptos relevantes para la
comprensión de los resultados reportados en los Capítulos 3-6.
El Capítulo 2 explica las técnicas e instrumentos utilizados en la caracterización de
polímeros, SCNPs y productos utilizados o sintetizados en la tesis.
El Capítulo 3 presenta un nuevo modelo para el cálculo del tamaño, la masa molar aparente
y el factor de contracción de las SCNP elásticas en función de la longitud de la cadena del
polímero, la fracción de monómero reactivo y la calidad del disolvente. El modelo se utiliza
para estimar el tamaño de las SCNPs en diferentes superficies.
El modelo trata con SCNP con enlaces intracadena covalentes permanentes.
El plegamiento de cadenas de polímeros sintéticos individuales (precursores) a
nanopartículas de polímeros de cadena única (SCNP) recuerda al plegamiento de proteínas
a su estado nativo funcional y ha atraído un interés significativo en los últimos años. El
proceso de autoplegado puede ser impulsado por diferentes interacciones
intramoleculares, tales como enlaces de tipo no covalente, covalente y covalente dinámico,
mediante el uso de precursores bien definidos decorados con grupos funcionales
apropiados y condiciones experimentales tales que los eventos de acoplamiento entre
cadenas se minimizan en gran medida. Las SCNP resultantes son nano-objetos blandos con
aplicaciones potenciales en nanomedicina, biosensores y catálisis, entre otros campos. Los
modelos teóricos que proporcionan una conexión entre la cantidad de grupos funcionales,
x, y la masa molar precursora, M, con el tamaño de las SCNP resultantes son de gran interés
para establecer relaciones estructura-propiedades útiles. En particular, los parámetros
relevantes para las aplicaciones finales, como el área superficial, la viscosidad intrínseca y
el coeficiente de difusión, dependen del tamaño de las SCNPs.
Recientemente, se ha introducido un modelo que proporciona la reducción de tamaño esperada al plegar cadenas simples de tamaño R0 a SCNPs de tamaño R mediante
interacciones reversibles (enlaces no covalentes) en función de x y M. Este modelo simple
proporciona una valiosa estimación a priori de la reducción de tamaño al plegar cadenas
simples a SCNPs convencionales a través de interacciones reversibles (∼7% de la desviación
promedio de los datos calculados de los experimentales; 72 SCNPs y 22 interacciones
reversibles analizadas). A pesar de tal avance en la provisión de relaciones estructura-

168
propiedades útiles para desarrollar aplicaciones prácticas de SCNPs sensibles, hasta donde
sabemos, no se ha reportado todavía ningún modelo equivalente para el caso de SCNPs con
enlaces covalentes.
En comparación con las SCNPs reversibles, la estructura de las SCNPs con enlaces
covalentes incluye entrecruzamientos intramoleculares permanentes que afectan en gran
medida el grado de compactación final alcanzado y les proporcionan una estabilidad
térmica superior. Por lo tanto, las SCNPs con enlaces covalentes en solución con una
naturaleza similar y parámetros M y x similares a las SCNP reversibles, muestran, en
promedio, un nivel más alto de compactación de la cadena. En este trabajo, presentamos un
modelo simple de SCNPs unidas covalentemente considerando estos nano-objetos con
entrecruzamientos intracadena como redes elásticas unimoleculares compuestas de hebras
elásticas conectadas por entrecruzamientos. Derivamos expresiones de la ley de escala para
el tamaño, el coeficiente de difusión, la masa molar aparente y el factor de contracción de
los SCNP elásticos en solventes buenos, theta y malos. Además, obtenemos leyes de escala
para la altura de las SCNP elásticas depositadas en sustratos de energía libre de superficie
alta y baja.
En el Capítulo 4 se reporta la síntesis de SCNPs enzimo-miméticas, solubles en agua,
compuestas por copolímeros de poli(oligo(etilenglicol)-metil-éter metacrilato y 2-
acetoacetoxietil metacrilato) [poli(OEGMA-co-AEMA)], por coordinación con iones ferrosos
(Fe2+). Estas SCNPs se utilizan -por primera vez- como catalizadores para la síntesis de
dispersiones del polímero intrínsecamente conductor PEDOT: PSS mediante polimerización
oxidativa.
En este capítulo, se investiga el diseño de SCNPs como pseudoenzimas artificiales que
contienen hierro para la síntesis de un polímero intrínsecamente conductor (ICP) como el
poli (3,4-etilendioxitiofeno), PEDOT.
La primera síntesis enzimática de una dispersión PEDOT: PSS se reportó en 2007, mediante
el uso de peroxidasa de rábano como catalizador y en presencia de PSS como plantilla
soluble en agua y como dopante para equilibrar la carga. La síntesis tradicional de
dispersiones de PEDOT: PSS implica el uso de sales que contienen hierro y oxidantes como
el persulfato de amonio. Con el objetivo de introducir alternativas respetuosas con el medio
ambiente en lugar de catalizadores químicos convencionales, en los últimos años se ha
desarrollado una variedad de síntesis de PEDOT: PSS mediada por enzimas mediante la
introducción de proteínas que contienen hierro en un complejo hemo (peroxidasa de
rábano, peroxidasa de soja, catalasa y hemoglobina, citocromo c) y peróxido de hidrógeno
como oxidante. Las propiedades de las películas PEDOT: PSS resultantes dependen de la
enzima específica empleada durante la síntesis. Curiosamente, como lo demostraron Hira y
Payne, incluso las proteínas simples que enlazan con el hierro que muestran actividad no
enzimática (por ejemplo, transferrina) pueden usarse como oxidantes para la síntesis de
dispersiones de PEDOT: PSS. Este hecho expande significativamente el catálogo de
oxidantes biomoleculares disponibles para la síntesis de películas basadas en PEDOT con
un conjunto deseado de propiedades, ya que en la actualidad se conocen más de 800
proteínas hemo diferentes.
El uso de nanopartículas poliméricas monocatenarias (SCNP) como construcciones que
imitan las enzimas ha atraído un interés significativo. Las SCNPs dotadas de morfología y
actividad enzimo-mimética a menudo muestran una mayor estabilidad frente a los cambios
térmicos y una degradabilidad reducida en comparación con las enzimas naturales. Las
SCNP se construyen mediante el auto-plegado de una sola cadena polimérica lineal

169
mediante enlaces covalentes intracadena o interacciones supramoleculares (p. Ej., Enlaces
de hidrógeno, enlaces covalentes dinámicos, complejación de metales). Se han observado
dos morfologías limitantes en SCNP dependiendo de la ruta sintética empleada y el
equilibrio hidrófobo / hidrófilo de la cadena precursora de las SCNPs. Una morfología
esparsa que se asemeja a la mostrada por proteínas intrínsecamente desordenadas se
observa a menudo por medio del plegamiento / colapso intracadena del precursor en
buenas condiciones de disolvente. Por el contrario, una morfología globular más parecida a
la que se encuentra en las enzimas se obtiene típicamente por auto-plegado intramolecular
en agua de copolímeros aleatorios anfifílicos (neutros o cargados) de composición y peso
molecular apropiados.
En este capítulo se revela el uso de nanopartículas monocatenarias (SCNP) autoplegadas,
solubles en agua y que contienen metales como nano-reactores que imitan a las enzimas
para la síntesis de polímeros intrínsecamente conductores (ICP) a través de la
polimerización por etapas. Como prueba de concepto, se realiza la primera síntesis enzimo-
mimética de dispersiones de poli (3,4-etilendioxitiofeno): poliestirenosulfonato (PEDOT:
PSS) mediante polimerización oxidativa utilizando SCNPs auto-plegadas que contienen
hierro (II) como pseudo- enzimas artificiales. Las SCNPs fueron sintetizadas mediante
conplejación por hierro del polímero precursor OEGMA-co-AEMA. La compactación de las
SCNPs se midió mediante cromategrafía de exclusión por tamaño (SEC) y dispersión de luz
dinámica (DLS). La síntesis, que puede llevarse a cabo fácilmente en agua a temperatura
ambiente durante 3 h bajo atmósfera de argón, proporciona una dispersión PEDOT: PSS que
muestra la banda de absorción UV-vis a λ = 800 nm característica del bipolarón del PEDOT
conductivo. Las películas delgadas preparadas a partir de esta dispersión PEDOT: PSS
mostraron un valor de conductividad eléctrica de σ = 1 × 10⁻⁴ S/cm, similar al reportado
típicamente para películas PEDOT: PSS preparadas a partir de dispersiones PEDOT: PSS
sintetizadas usando proteínas que contienen hierro como catalasa (σ = 1,3 x 10⁻⁵ S/cm).
Este capítulo abre la puerta a la síntesis de otros tipos de ICP (p. Ej., Polianilina, polipirrol)
utilizando SCNP que contienen metales solubles en agua como nanoreactores que imitan a
las enzimas que operan a temperatura ambiente, y amplía el uso de SCNP como
catalizadores bioinspirados para la polimerización en cadena (es decir, polimerización por
apertura de anillo y polimerización por radicales vivos) a la polimerización por etapas (es
decir, policondensación mediante polimerización oxidativa).
El Capítulo 5 muestra la síntesis y caracterización de SCNPs fluorescentes mediante la
fotoactivación de copolímeros de poli(metil metacrilato-co-2-acetoacetoxietil metacrilato)
[poli (MMA-co-AEMA)] funcionalizados con grupos funcionales diazo. La emisión de
fluorescencia se produce mediante la adición de un fluoróforo de emisión inducida por
agregación (AIE) con grupos azida. El entrecruzamiento en las SCNPs se logra mediante la
activación de los grupos azida y diazo al irradiarlos con luz ultravioleta.
El desarrollo de nanopartículas altamente fluorescentes es de gran interés para una
variedad de aplicaciones prácticas que incluyen sensores biológicos de nueva generación,
sondas químicas innovadoras, dispositivos optoelectrónicos mejorados y materiales
inteligentes. En este capítulo presentamos un método original para la síntesis rápida y
eficiente de SCNP altamente fluorescentes basado en el uso eficiente de fluoróforos
entrecruzantes con emisión inducida por agregación (AIE).
En el capítulo, se investiga una nueva estrategia de fotoactivación rápida y eficiente para
producir SCNPs con emisión de fluorescencia intensa en solución, que se basa en la
fotoactivación de moléculas entrecruzantes de emisión inducida por agregación (AIE)
apropiadas que contienen grupos funcionales azida para la generación rápida y eficiente de

170
SCNPs con emisión de fluorescencia tanto en solución como en estado sólido. Se ha
demostrado que la generación de una combinación de especies de nitreno altamente
reactivas (de una molécula AIE entrecruzante que contiene azida, Silole-N3) y especies de
carbeno altamente reactivas (de un precursor polimérico apropiado de MMA-co-AEMA que
contiene unidades α-diazo-β-cetoéster, P) mediante irradiación UV, la probabilidad de una
inmovilización eficaz del compuesto AIE en el SCNP resultante aumenta considerablemente,
en comparación con el uso de un compuesto AIE sin grupos funcionales azida. Se obtiene la
confirmación del éxito de la compactación de cadenas individuales tras la irradiación UV del
precursor P en presencia de Silole-N3 a una dilución alta por la reducción del tamaño de las
cadenas medida por cromatografía de exclusión por tamaño (SEC) con detección múltiple.
El tiempo óptimo de irradiación UV durante el proceso de formación de SCNP es de 60 min.
Medida por espectrografía de fluorescencia, las SCNP fluorescentes FNP (Rh = 9 nm)
resultantes muestran un pico de emisión máximo en el disolvente THF centrado en λem ≈
455 nm y una excelente estabilidad de la intensidad de emisión de fluorescencia a lo largo
del tiempo, según lo determinado por espectroscopía de fluorescencia. Además, las FNPs
conservan sus propiedades fluorescentes en estado sólido, libres de los efectos de ACQ que
a menudo se observan en las SCNPs basadas en fluoróforos tradicionales. También de midió
el rendimiento cuántico de las FNPs. Para concluir, este trabajo abre una nueva vía para
dotar a una variedad de otros materiales poliméricos nanoestructurados (por ejemplo,
copolímeros de bloque, microgeles, dendrímeros y micelas) con una emisión de
fluorescencia intensa basada en la nueva estrategia de fotoactivación de moléculas de AIE.
El Capítulo 6 presenta una ruta para la síntesis y caracterización de SCNPs de poli(MMA-co-
AEMA) fluorescentes basada en la reacción de síntesis de dehidropiridinas de Hantzsch. El
empleo de fluoróforos ortogonales permite reportar tanto el plegado, como la agregación
de estas SCNPs. La compactación intramolecular que da lugar a las SCNPs se identifica
mediante la formación de ésteres de Hantzsch fluorescentes, mientras que la detección de
agregación intermolecular se produce a través de la incorporación de luminóforos AIE con
fluorescencia en longitudes de onda desplazadas al rojo.
En este capítulo se presenta una estrategia nueva y sencilla para cerrar la brecha entre el
plegamiento intramoleclular de cadenas simples y los métodos autoreportantes de
agregación intermolecular para proteínas y polímeros sintéticos que se basan en la
colocación eficiente dentro de cadenas individuales de luminóforos ortogonales
autoreportantes. La estrategia se ejemplifica mediante la generación de dos luminóforos
complementarios a través de la formación de éster de Hantzsch para la visualización del
plegamiento dentro de cadenas individuales y, cuando está presente o inducida
externamente, la agregación de múltiples SCNPs. Los puntos clave del presente método son:
i) partiendo de cadenas decoradas con β-cetoésteres no luminiscentes, la compactación
intramolecular monocatenaria se detecta visualmente a través de la fluorescencia que surge
de los fluoróforos de Hantzsch, que actúan como conectores intracadena equivalentes a los
enlaces disulfuro covalentes en proteínas plegadas, generados progresivamente durante el
plegado de las cadenas individuales, por lo que -en ausencia de fenómenos de agregación a
alta dilución- la intensidad de la fluorescencia crece con el grado de compactación, medida
por la reducción en el tamaño de la cadena; ii) la agregación de cadenas múltiples -cuando
está presente o inducida intencionalmente- es detectada por una fotoluminiscencia intensa
a longitudes de onda desplazadas al rojo que surge de luminóforos ortogonales de emisión
inducida por agregación (AIE) debido a la formación de conjuntos de múltiples SCNPs; y iii)
ambos tipos de sondas de autoreportantes se instalan, al mismo tiempo, dentro de la misma
cadena polimérica a través de la reacción de Hantzsch multicomponente. Esta estrategia

171
permite percibir a simple vista el estado de agregación / grado de compactación de las
SCNPs.
Se midió en diferentes tiempos la fluorescencia de las SCNPs por espectrografía de
fluorescencia, y su tamaño por cromategrafía de exclusión por tamaño (SEC) y dispersión
de luz dinámica (DLS). El grado de compactación de las SCNPs se midió mediante dispesión
de rayos X de ángulo reducido (SAXS).
La agregación de múltiples cadenas, en el caso de las SCNPs, desempeñaría un papel
equivalente al autoensamblaje de proteínas defectuosas en agregados patógenos. Es un
método es simple y muy preciso para, por ejemplo, establecer diagramas fiables de
compactación intra-cadena -agregación-precipitación de SCNPs en mezclas de disolventes
/ no disolventes. Dado que la introducción de restos β-cetoéster en cadenas de polímeros sintéticos es relativamente sencilla y una variedad de SCNPs funcionales se han construido
a partir de precursores que contienen estos grupos funcionales, esta estrategia promete
percibir de un vistazo la presencia / ausencia de agregados de multi-cadena perjudiciales
que afectan el rendimiento de SCNPs en catálisis, detección, reconocimiento, etc.
Las principales conclusiones de la tesis se recogen en el Capítulo 7.

172
Acknowledgements
En primer lugar, me gustaría agradecer al Prof. Juan Colmenero por darme la oportunidad
de incorporarme al grupo “Polymers and Soft Matter” del Centro de Física de Materiales.
También quisiera agradecer a la Universidad de País Vasco (UPV/EHU) por darme la
oportunidad de realizar la tesis, al Centro de Física de Materiales (CFM) por permitirme
utilizar sus instalaciones y al Ministerio de Ciencia e Innovación por concederme la beca
PREDOC.
Me gustaría agradecer especialmente al director de esta tesis, el Prof. José A. Pomposo, por
confiar en mi para este proyecto, por su ayuda y por guiarme a lo largo de la tesis.
Además, quiero agradecer a los demás profesores del grupo. Especialmente a la Prof.
Arantxa Arbe por su ayuda haciendo las medidas de SAXS. Al Prof. Ángel Alegría le agradezco su ayuda en las cuestiones y trámites relacionados con el doctorado. Y quisiera
agradecer al personal del CFM por su ayuda cuando la he necesitado.
I would like to thank Prof. Reidar Lund from the University of Oslo (UiO) for allowing me to
work in the Bio3 - Soft Matter group of the Department of Chemistry of the UiO during my
stay in Oslo and for his help, support and guidance in a new city far from home. Special
thanks to Nico for teaching me how to use the equipment and for inviting me to the parties.
I am also grateful to the rest of the team (Victoria, Mikkel, Mirna, Synne…) for their support
and help.
Muchas gracias a la gente del grupo “Polymers and Soft Matter” del CFM. Sobre todo a Isabel,
por estar dispuesta a ayudar cuando se lo piden y por mantener en funcionamiento todos
los equipos del laboratorio. También agradezco a Ester su ayuda en el laboratorio y
orientándome en la tesis. Y gracias a Dani por las medidas de AFM. Quiero expresar mi
gratitud al resto de los compañeros que siguen en el grupo (Jokin, Agustín, Numera, Davide,
Jon, Amaia, Paula, Jorge, Mariarita, Javier, Matteo…) o que han pasado por el (Ali, Xavi, Amaia, Bea, Jordan, Maud, Dani, Ander, Thomas, Jon, Marina, Edurne, Natalia, Izaskun, Lucia,
Alex, Ana Lucia…) por su ayuda y por los momentos que hemos pasado juntos estos años.
Y finalmente quisiera agradecer a toda mi familia el apoyo que me han dado todo este
tiempo y por haber confiado en mí. Eskerrik asko denoi.