structure-functionanalysisoftheendoplasmicreticulum ... · 2015-04-30 · k av v e v 0 / v t wherev...
TRANSCRIPT

Structure-Function Analysis of the Endoplasmic ReticulumOxidoreductase TMX3 Reveals Interdomain Stabilization ofthe N-terminal Redox-active Domain*□S
Received for publication, August 3, 2007, and in revised form, September 18, 2007 Published, JBC Papers in Press, September 18, 2007, DOI 10.1074/jbc.M706442200
Johannes Haugstetter‡, Michael Andreas Maurer‡, Thomas Blicher§, Martin Pagac‡1, Gerhard Wider¶,and Lars Ellgaard‡2
From the ‡Institute of Biochemistry, ETH Zurich, 8093 Zurich, Switzerland, §BioCentrum-DTU, Technical University of Denmark,2800 Lyngby, Denmark, and the ¶Institute of Molecular Biology and Biophysics, ETH Zurich, 8093 Zurich, Switzerland
Disulfide bond formation in the endoplasmic reticulum is cat-alyzed by enzymes of the protein disulfide-isomerase family thatharbor one or more thioredoxin-like domains. We recently dis-covered the transmembrane protein TMX3, a thiol-disulfideoxidoreductase of the protein disulfide-isomerase family. Here,we show that the endoplasmic reticulum-luminal region ofTMX3 contains three thioredoxin-like domains, an N-terminalredox-active domain (named a) followed by two enzymaticallyinactive domains (b and b�). Using the recombinantly expressedTMX3 domain constructs a, ab, and abb�, we compared struc-tural stability and enzymatic properties. By structural and bio-physical methods, we demonstrate that the reduced a domainhas features typical of a globular folded domain that is, however,greatly destabilized upon oxidization. Importantly, interdo-main stabilization by the b domain renders the a domain moreresistant toward chemical denaturation and proteolysis in boththe oxidized and reduced form. In combination with molecularmodeling studies of TMX3 abb�, the experimental results pro-vide a new understanding of the relationship between the mul-tidomain structure of TMX3 and its function as a redox enzyme.Overall, the data indicate that in addition to their role as sub-strate and co-factor binding domains, redox-inactive thiore-doxin-like domains also function in stabilizing neighboringredox-active domains.
For many proteins of the secretory pathway and those tar-geted to the cell surface or secreted, correct folding depends onthe formation of native disulfides. The formation of short rangedisulfide bonds found in some proteins likely requires littlecatalysis, whereas other proteins rely on the catalyzed forma-tion and rearrangement of disulfides thatmust be introduced in
a nontrivial pattern. The first ER enzyme found to promotethese processes was PDI3 (1). In vitro, PDI can catalyze oxida-tion of free cysteines as well as reduction and isomerization ofincorrect disulfide bonds (2–4). It is now clear that a wholefamily of PDI-like proteins of almost 20 members exists in themammalian ER (5, 6).The proteins of the PDI family all contain at least one domain
with a thioredoxin fold, where the secondary structure ele-ments are typically arranged as �1-�1-�2-�2-�3-�3-�4-�5-�4.Thioredoxin-like domains that encompass a reactive CXXCtetrapeptide sequence are classified as a-type domains and oth-erwise as b-type domains. For instance, PDI contains four thi-oredoxin-like domains named a,b,b�, and a�, where a and a� areredox-active, and b and b� show no such activity. The redox-active domains generally show a high level of sequence conser-vation, whereas the b-type domains display comparatively littlesequence similarity. The function of many b-type domainsremains unknown. It is clear, however, that the b� domain inPDI confers substrate binding (7) and that the correspondingdomain in ERp57, the closest homolog of PDI, interacts withthe lectin chaperones calnexin and calreticulin that bind glyco-protein substrates (8, 9).PDI-like proteins with one or more a-type domains can oxi-
dize free cysteine residues and reduce disulfides in in vitroassays. The same is the case for recombinantly expressed a-typedomains in isolation (10). However, at least in the case of PDIand ERp57, efficient isomerization requires the presence of oneor more b-type domains (11–13).Although PDI and ERp57 are quite well characterized and
the crystal structures of Saccharomyces cerevisiae PDI (Pdi1p)and a human ERp57 bb� construct were recently solved (9, 14),relatively little is known about the cellular functions performedby the human ER oxidoreductases. A plausible explanation forthe presence of so many oxidoreductases in the same organelleis that individual PDI homologs interact with discrete or onlypartially overlapping sets of substrates. An indication that thisis indeed the case comes from the recent finding that substratesof ERp57 generally belong to only a subset of glycoproteinscharacterized by multiple disulfides and a low level of regularsecondary structure elements (15).
* This work was supported by ETH Zurich Grant 0-20138-03, Carlsbergfondet,A. P. Møllers Fond til Lægevidenskabens Fremme, and Novo NordiskFonden. The costs of publication of this article were defrayed in part by thepayment of page charges. This article must therefore be hereby marked“advertisement” in accordance with 18 U.S.C. Section 1734 solely to indi-cate this fact.
□S The on-line version of this article (available at http://www.jbc.org) containssupplemental Figs. S1–S3.
1 Present address: Dept. of Medicine/Biochemistry, University of Fribourg,Rue du Musee, 1700 Fribourg, Switzerland.
2 To whom correspondence should be addressed. Present address: Dept. ofMolecular Biology, University of Copenhagen, August Krogh Building,2100 Copenhagen, Denmark. Tel.: 45-35-32-17-25; Fax: 45-35-32-15-67;E-mail: [email protected].
3 The abbreviations used are: PDI, protein disulfide-isomerase; DTT, dithio-1,4-threitol; ER, endoplasmic reticulum; Pdi1p, S. cerevisiae PDI; PMSF,phenylmethylsulfonyl fluoride.
THE JOURNAL OF BIOLOGICAL CHEMISTRY VOL. 282, NO. 46, pp. 33859 –33867, November 16, 2007© 2007 by The American Society for Biochemistry and Molecular Biology, Inc. Printed in the U.S.A.
NOVEMBER 16, 2007 • VOLUME 282 • NUMBER 46 JOURNAL OF BIOLOGICAL CHEMISTRY 33859
http://www.jbc.org/cgi/content/full/M706442200/DC1Supplemental Material can be found at:

Most human PDIs are soluble, but four have a transmem-brane region and are grouped in the TMX (thioredoxin-relatedtransmembrane protein) subfamily (5). No substrates areknown for the TMX proteins, but it is tempting to speculatethat their substrate selectivity is governed by the membraneassociation. All have a single a-type domain facing the ERlumen, except perhaps TMX2, for which the membrane orien-tation is unclear (16). No experimental characterization hasbeen published forTMX4.TheTMXprotein has thiol-disulfideexchange activity in vitro and can suppress brefeldinA-inducedapoptosis when overexpressed (17, 18).The protein in focus of the current study, TMX3, is expressed
in a variety of human tissues, with the highest levels in heart andskeletal muscle (19). The redox state of the active site cysteinesin TMX3 is predominantly reduced in vivo (19), with �30% ofTMX3 molecules present in the oxidized form (20). Here, wehave performed structural, biophysical, and biochemical stud-ies of TMX3 to learn more about the structure-function rela-tions in the protein. Notably, we find that in the three-domainstructure of the protein, the redox-active N-terminal domain isstabilized considerably in the context of the full-length protein.
EXPERIMENTAL PROCEDURES
Plasmids and Vectors—pRSET-miniT/TMX3lum (19) wasused for the expression of the entire ER luminal region ofTMX3 (TMX3lum, residues 25–373; all TMX3 residue num-bers in this study refer to the human sequence including the pre-dicted signal peptide, accession number NP_061895). For theexpression ofTMX3domain constructs containing one (TMX3 a;residues 25–131), two (TMX3 ab; residues 25–234), or threedomains (TMX3 abb�; residues 25–344), the TMX3 cDNA clonehj01608 (KIAA1830 protein) obtained from Kazusa DNAResearch Institute served as a PCR template. The forward primer3-BAB4-Trx-3 (5�-GGGGGATCCAAAGGATTTGTAGAAGA-TTTAG-3�) was used for all constructs, and the following reverseprimers were used to generate TMX3 a, TMX3 ab, and TMX3abb�, respectively: 4-BAB4-Trx-5 (5�-CCGGAATTCCTACCCA-GATACTCTGTGAGCA-3�), 112-TMX3trx2–5 (5�-CCGGAA-TTCCTACATAGCAAGGTAATTCTG-3�), and113-TMX3lumOh-5 (5�-CCGGAATTCCTATACTGTGCCATCCAAAATGT-TAT-3�). The PCR products were inserted into the pRSET-miniT expression vector (21) using the BamHI and EcoRIrestriction sites to yield pRSET-miniT/TMX3a, pRSET-miniT/TMX3ab, and pRSET-miniT/TMX3abb�. These constructswere used to express domain constructs of TMX3 containing a17-amino acidN-terminal affinity tag including six consecutivehistidines and a thrombin cleavage site. After thrombin cleav-age of the affinity tag, a GS dipeptide remains at the N terminusof the TMX3 domain constructs. The sequences of all gener-ated plasmids were verified by DNA sequencing.Protein Expression and Purification—Protein expression
from pRSET-miniT-derived constructs was done as describedpreviously for TMX3lum (19). In brief, the Rosetta(DE3) Esch-erichia coli strain (Novagen) was transformed with expressionplasmid and grown in LB medium containing ampicillin andchloramphenicol until an A600 of �0.75 was reached. Proteinexpression was induced with isopropyl �-D-1-thiogalactopyr-anoside, and the culture was grown for an additional hour,
before the cells were harvested by centrifugation. The 15N-la-beled TMX3 a was expressed essentially in the same manner,with the exception that the transformed bacteria were grown inCeltone-N complete medium (Spectra Stable Isotopes) insteadof LB medium for isotope labeling. The proteins were purifiedas described previously (19). Briefly, cell pellets were resus-pended in buffer containing 6 M guanidine hydrochloride, andthe cleared supernatant was then applied onto a Ni2�-chargednitrilotriacetic acid metal affinity chromatography column(Qiagen), refolded while bound on the column by applying alinear gradient into an aqueous buffer, and eluted with a gradi-ent of imidazol-containing aqueous buffer. Fractions contain-ing TMX3 protein were pooled and cleaved with thrombin(Sigma). Finally, the protein was subjected to anion exchangechromatography using a SOURCE15Q column (GE Health-care), and the purity was assessed by Coomassie staining ofSDS-PAGE gels. Protein purification under nondenaturingconditions was done by resuspending the bacterial pellet in abuffer containing 25 mM Tris, pH 8.0, 100 mM NaCl, 5 mM
2-mercaptoethanol, 0.2 mM phenylmethylsulfonyl fluoride(PMSF) followed by cell rupture using a French press. Aftercentrifugation for 45 min at 12,000 � g, the cleared superna-tants were loaded directly on the affinity chromatography col-umn. Further processing was the same as described above.Protein Concentration Determination—The concentration
of the purified TMX3 proteins was determined from theirabsorbance at 280 nmbyusing themolar extinction coefficientscalculated by themethodofGill and vonHippel (22). An extinc-tion coefficient of 45,920 M�1 cmMwas used for TMX3lum andTMX3 abb�, 40,800 M�1 cm�1 for TMX3 ab, and 23,590 M�1
cm�1 for TMX3 a.Limited Proteolysis of TMX3lum—Limited proteolysis was
carried out in 10 �M solution of TMX3lum that had beenreduced with dithio-1,4-threitol (DTT) prior to dialysis into100 mM KH2PO4/KOH (degassed and flushed with N2). Thereactions were performed at pH 7.0 at 30 °C using the concen-trations of trypsin (Sigma), proteinase K (Roche Applied Sci-ence), or subtilisin (Roche Applied Science) indicated in Fig. 1.The digests were stopped at various time points by addingPMSF to 10 mM. The samples were analyzed by SDS-PAGEwith subsequent Coomassie staining or blotted onto a polyvi-nylidene fluoride membrane and subjected to N-terminalsequencing. Alternatively, after treatment with PMSF, the sam-ples were separated by size exclusion chromatography on aSuperdex S75 HR 10/30 column (GE Healthcare). Fractionscontaining proteinwere incubated at 4 °C for 30minwith 0.02%(w/v) deoxycholate and overnight with 10% (w/v) trichloroace-tic acid. After centrifugation, the pellets were washed with 70%acetone and analyzed by mass spectrometry (FGCZ AnalyticalServices, Switzerland).Analytical Size Exclusion Chromatography—Analytical size
exclusion experiments were performed by applying 100 �l ofprotein sample in 50mMKH2PO4/KOH, pH 7.4, 100mMNaCl,1mMDTT on a Superdex S75HR 10/30 column that was run ata flow rate of 0.6 ml/min. The results were analyzed by plottingfor a set of standard proteins using a low molecular weight gelfiltration kit (GE Healthcare), the partition coefficient Kav,
Structure-Function Analysis of TMX3
33860 JOURNAL OF BIOLOGICAL CHEMISTRY VOLUME 282 • NUMBER 46 • NOVEMBER 16, 2007

Kav � �Ve � V0�/�Vt � V0� (Eq. 1)
where Ve is the elution volume, V0 is the void volume, and Vt isthe column volume, against the logarithm of the molecularweight. A linear fit of Kav values for the standard proteins thenserved as a calibration curve to calculate the apparent molecu-lar mass of the TMX3 domain constructs.CDMeasurements—CDmeasurements were performed on a
Jasco J-715 spectropolarimeter in a cell of 1-mm pathlength at25 °C. The spectra were averaged from 10 scans, and the bufferbase line was subtracted. The TMX3 a domain was used at aconcentration of 27 �M in a buffer containing 50 mM KH2PO4/KOH, pH 7.0. The protein was reduced or oxidized by dialyzingovernight against the same buffer containing 0.5 mM DTT or0.1 mM GSSG, respectively.NMR Spectroscopy—NMR spectra were measured on a
BRUKER DRX600 spectrometer at a proton resonance fre-quency of 600 MHz using an inverse triple resonance1H,15N,13C probe equippedwith an actively shielded z-gradientcoil. The 5-mmNMR tubes were filled with 550ml of a solutionof reducedTMX3 a domain in 95%H2O, 5%D2O containing 50mM phosphate buffer at pH 8.0. Proton homonuclear one-di-mensional spectra and two-dimensional nuclear Overhausereffect spectroscopy spectra (23) were recorded at a temperatureof 20 °C. Using the same experimental conditions, a [1H,15N]-correlated two-dimensional spectrum (24) was measured on asample of 0.86 mM 15N-labeled TMX3 a domain.Protein Stability Measurements—Protein stability was meas-
ured at different concentrations of ultra pure urea (Sigma) in100 mM KH2PO4/KOH, pH 7.0, 1 mM EDTA, and either 10 mMGSH or 2 mM GSSG using a Varian Cary Eclipse spectroflu-orometer. Urea concentrations were determined with a refrac-tometer. Prior to denaturation, the native protein was incu-bated at room temperature in the presence of 10 mM GSH or 2mM GSSG for at least 1 h. After adding urea from a concen-trated stock solution, the samples were again allowed to equil-ibrate for 1 h at room temperature, because pilot experimentshad demonstrated complete denaturation within this timeframe. To test the reversibility of denaturation, samples at thesame concentration of urea were produced from native andfully denatured protein, respectively. Pairs of samples gener-ated this way showed nearly identical fluorescence emissionspectra. Fluorescence experiments were performed at 25 °C,with a scan rate of 300 nm/min and excitation and emission slitsof 5 nm. After excitation at 280 nm, an emission scan wasrecorded between 300 and 400 nm. Each spectrum was cor-rected for background fluorescence. The final protein concen-tration was 0.2 �M. The unfolding profile of each TMX3domain construct was determined in at least two independentexperiments. The presented values were calculated from theexperiments shown in Fig. 4.Data processing was performed as described by Monsellier
and Bedouelle (25). Thus, each spectrum was approximated bya Taylor expansion between 320 and 380 nm to the followingequation,
Y��, x� � a� x� � ��� � �max�2/2!b�x� � ��� � �max�
3/3!c�x�
(Eq. 2)
where Y is the measured fluorescence intensity at the wave-length �, �max is the wavelength at which the intensity Y ismaximal, x is the urea concentration, a(x) Y(�max, x), b(x) (�2Y/��2) (�max, x), and c(x) (�3Y/��3) (�max, x), with a, b, c,and �max as floating parameters.In the next step, the maximal intensity �max as a function of
the urea concentration xwas fitted either to a three-statemodel
�max�x� � ��N � �Iexp����GNI � mNIx�/RT� � �Uexp����GNI
� mNIx�/RT�exp����GIU � mIUx�/RT�/�1 � exp����GNI
� mNIx�/RT� � exp����GNI � mNIx�/RT�exp����GIU
� mIUx�/RT� (Eq. 3)
or to a two-state model
�max�x� � ��N � �Uexp����GNU � mNUx�/RT�/�1
� exp����GNU � mNUx�/RT� (Eq. 4)
with the floating parameters �N, �I, and �U being the intensitymaxima of fluorescence of the native, intermediate, andunfolded state, respectively;�GNI,�GIU, and�GNU are the freeenergies for the conversions extrapolated to x 0; and mNI,mIU, andmNU are the values for the cooperativity of the respec-tive conversions.Themidpoint of conversion, x1⁄2, i.e. the concentration of urea
at which �max(x) reached half its maximal value, was calculatedas follows.
x1/ 2 � �G/m (Eq. 5)
Because the recorded value of �max(x) is not a linear functionof themolar fractions of the folded and unfolded states, x1⁄2 doesnot represent half-advancement of the unfolding reaction.Hence, the midpoint of denaturation, x�1⁄2, was calculated byintroducing a corrective term as detailed in Ref. 25.Peptide Oxidation Assay—The ability of TMX3 domain con-
structs to oxidize dithiols was investigated by following thefluorescence change upon oxidation of the decapeptideNRCSQGSCWN, as described earlier (19). Data analysis wasperformed as detailed in Ref. 26.Reaction Kinetics of TMX3 Domain Constructs with GSSG—
Pseudo first order rate constants and apparent second orderrate constants for the reaction between reduced TMX3 domainconstructs and GSSG were determined by measuring the fluo-rescence change upon oxidation of the protein essentially asdescribed inRef. 27. Proteins used in this assaywere reduced for1 h at room temperature with 2 mM DTT before the reducingagent was removed on a Micro Bio-Spin 30 column (Bio-Rad),pre-equilibrated in 50 mM Tris, pH 7.0, 50 mM NaCl, 1 mMEDTA (degassed and flushed with N2). Finally, protein sampleswere diluted to �0.25 �M in the same buffer. Fluorescenceemission at 328 nm, upon excitation at 280 nm, was then mon-itored in a stirrable quartz cuvette that had been silanized tominimize adsorption to the glass surface, as observed in partic-ular for the TMX3 a domain upon oxidation. After a stable baseline was attained, the reaction was initiated by the addition of amolar excess of GSSG (final concentrations, 16-355 �M) from a
Structure-Function Analysis of TMX3
NOVEMBER 16, 2007 • VOLUME 282 • NUMBER 46 JOURNAL OF BIOLOGICAL CHEMISTRY 33861
concentrated stock solution. Pseudo first order rate constantswere determined by fitting single exponential functions to thedata points. In particular for TMX3 a, we observed a drop in thefluorescence signal when full oxidation was approached, mostlikely because of glass adsorption as mentioned above. In thesecases, we only included data points for the fit corresponding to�90% completion of oxidation. An apparent second order rateconstant was determined from a linear fit to a series of experi-ments with varying GSSG concentrations. Two sets of inde-pendent experiments were performed with similar results.Molecular Modeling—A working model of TMX3 abb� was
constructed with the program Modeller (28) using default set-tings and the alignment shown in supplemental Fig. S1. Themodel comprises residues 25–340 and is based on the NMRsolution structure of the PDI a domain (ProteinData Bank code1MEK) (29) for TMX3 a and the crystal structure of rabbitskeletal muscle calsequestrin (Protein Data Bank code1A8Y) (30) for the TMX3 bb� region. When constructing themodel, an overlapping and similar region between the twotemplates was included in the alignment. This way the tem-plates were aligned to preserve the relative domain orienta-tion in calsequestrin.The quality of the model was assessed by submitting it to the
ProQ server (www.sbc.su.se/�bjornw/ProQ/), which has beendesigned to evaluate protein homology models (31). The eval-uation produced scores that were indicative of a reliable, highquality model (LGscore 4.09, MaxSub 0.48). Analysis ofthe backbone dihedral angles in the model using the Mol-Probity server (molprobity.biochem.duke.edu/) (32) showedthat 94% of the residues were in the most favored regions, and99% were within allowed regions. Only three outliers (Leu68,Pro116, and Ser139) weremarginally outside the allowed regions.Overall, this is comparable with the quality of the NMR tem-plate (PDI a).
RESULTS
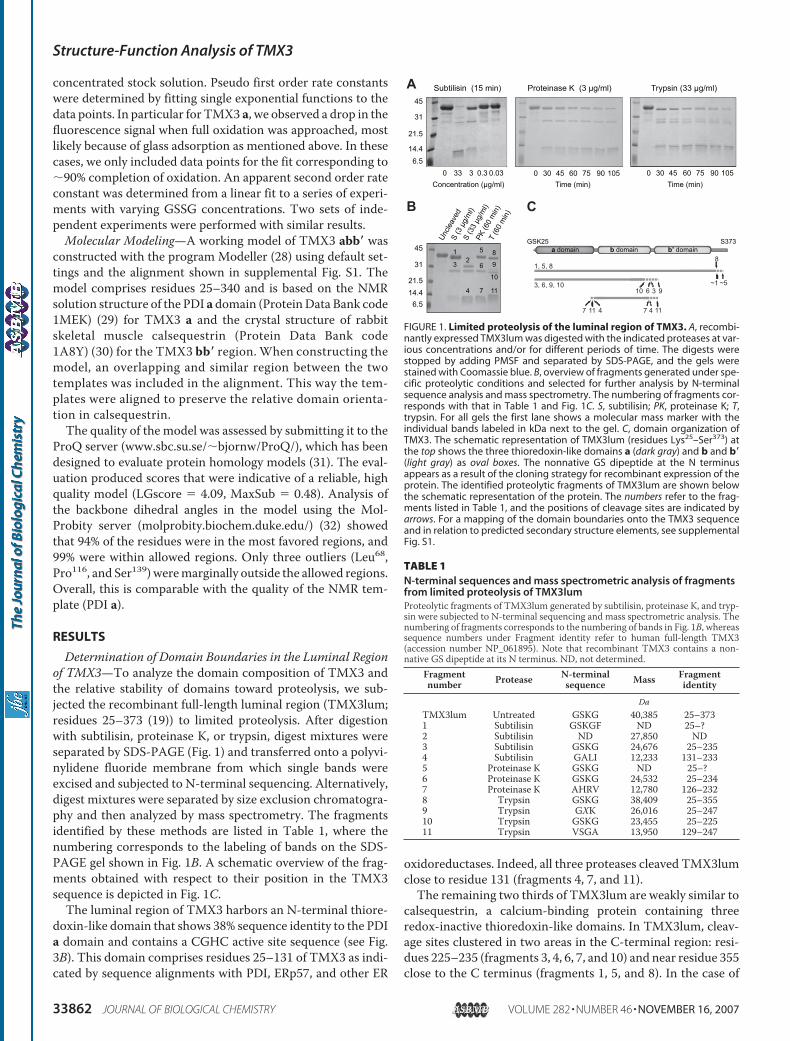
Determination of Domain Boundaries in the Luminal Regionof TMX3—To analyze the domain composition of TMX3 andthe relative stability of domains toward proteolysis, we sub-jected the recombinant full-length luminal region (TMX3lum;residues 25–373 (19)) to limited proteolysis. After digestionwith subtilisin, proteinase K, or trypsin, digest mixtures wereseparated by SDS-PAGE (Fig. 1) and transferred onto a polyvi-nylidene fluoride membrane from which single bands wereexcised and subjected to N-terminal sequencing. Alternatively,digest mixtures were separated by size exclusion chromatogra-phy and then analyzed by mass spectrometry. The fragmentsidentified by these methods are listed in Table 1, where thenumbering corresponds to the labeling of bands on the SDS-PAGE gel shown in Fig. 1B. A schematic overview of the frag-ments obtained with respect to their position in the TMX3sequence is depicted in Fig. 1C.The luminal region of TMX3 harbors an N-terminal thiore-
doxin-like domain that shows 38% sequence identity to the PDIa domain and contains a CGHC active site sequence (see Fig.3B). This domain comprises residues 25–131 of TMX3 as indi-cated by sequence alignments with PDI, ERp57, and other ER
oxidoreductases. Indeed, all three proteases cleaved TMX3lumclose to residue 131 (fragments 4, 7, and 11).The remaining two thirds of TMX3lum are weakly similar to
calsequestrin, a calcium-binding protein containing threeredox-inactive thioredoxin-like domains. In TMX3lum, cleav-age sites clustered in two areas in the C-terminal region: resi-dues 225–235 (fragments 3, 4, 6, 7, and 10) and near residue 355close to the C terminus (fragments 1, 5, and 8). In the case of
Proteinase K (3 µg/ml) Trypsin (33 µg/ml)
0 30 45 60 75 90 105Time (min)
Subtilisin (15 min)
0 33 3 0.3 0.03
45
31
21.5
14.46.5
Concentration (µg/ml)
Uncle
aved
S
(3 µ
g/m
l)S
(33
µg/m
l)PK
(60
min)
T (6
0 m
in)
1
3 2
4 7 11
6
5 8
9
10
45
31
21.514.46.5
A
B
Time (min)0 30 45 60 75 90 105
910 6 3
7 411
3, 6, 9, 10
47
1, 5, 8
11
8
GSK25b domain b’ domain
S373a domain
~1 ~5
C
FIGURE 1. Limited proteolysis of the luminal region of TMX3. A, recombi-nantly expressed TMX3lum was digested with the indicated proteases at var-ious concentrations and/or for different periods of time. The digests werestopped by adding PMSF and separated by SDS-PAGE, and the gels werestained with Coomassie blue. B, overview of fragments generated under spe-cific proteolytic conditions and selected for further analysis by N-terminalsequence analysis and mass spectrometry. The numbering of fragments cor-responds with that in Table 1 and Fig. 1C. S, subtilisin; PK, proteinase K; T,trypsin. For all gels the first lane shows a molecular mass marker with theindividual bands labeled in kDa next to the gel. C, domain organization ofTMX3. The schematic representation of TMX3lum (residues Lys25–Ser373) atthe top shows the three thioredoxin-like domains a (dark gray) and b and b�(light gray) as oval boxes. The nonnative GS dipeptide at the N terminusappears as a result of the cloning strategy for recombinant expression of theprotein. The identified proteolytic fragments of TMX3lum are shown belowthe schematic representation of the protein. The numbers refer to the frag-ments listed in Table 1, and the positions of cleavage sites are indicated byarrows. For a mapping of the domain boundaries onto the TMX3 sequenceand in relation to predicted secondary structure elements, see supplementalFig. S1.
TABLE 1N-terminal sequences and mass spectrometric analysis of fragmentsfrom limited proteolysis of TMX3lumProteolytic fragments of TMX3lum generated by subtilisin, proteinase K, and tryp-sin were subjected to N-terminal sequencing and mass spectrometric analysis. Thenumbering of fragments corresponds to the numbering of bands in Fig. 1B, whereassequence numbers under Fragment identity refer to human full-length TMX3(accession number NP_061895). Note that recombinant TMX3 contains a non-native GS dipeptide at its N terminus. ND, not determined.
Fragmentnumber Protease N-terminal
sequence Mass Fragmentidentity
DaTMX3lum Untreated GSKG 40,385 25–3731 Subtilisin GSKGF ND 25–?2 Subtilisin ND 27,850 ND3 Subtilisin GSKG 24,676 25–2354 Subtilisin GALI 12,233 131–2335 Proteinase K GSKG ND 25–?6 Proteinase K GSKG 24,532 25–2347 Proteinase K AHRV 12,780 126–2328 Trypsin GSKG 38,409 25–3559 Trypsin GXK 26,016 25–24710 Trypsin GSKG 23,455 25–22511 Trypsin VSGA 13,950 129–247
Structure-Function Analysis of TMX3
33862 JOURNAL OF BIOLOGICAL CHEMISTRY VOLUME 282 • NUMBER 46 • NOVEMBER 16, 2007

subtilisin, the short C-terminal fragment was removed even atlow concentrations of protease where smaller stable fragmentswere not yet generated (Fig. 1A), indicating it to be a highlyaccessible flexible tail.Overall, the results indicated that TMX3 contained three
structural entities of about the same size. Secondary structurepredictions (33) were consistent with the presence of two thi-oredoxin-like domains in TMX3 in addition to the N-terminalredox-active domain (supplemental Fig. S1). Moreover, theprotease cleavage sites clustered in three distinct regions thatcorrelatedwell with the expected positions of interdomain link-ers and the sequence region between the most C-terminaldomain and the transmembrane domain (supplemental Fig.S1). In accordance with common practice, the three thiore-doxin-like domains in TMX3 were named a, b, and b�.
These experiments also provided information about the rel-ative stability of the different domains toward proteolysis. Theonly single domain detected was the b domain (fragments 4, 7,and 11). Four fragments comprised the ab double domain (frag-ments 3, 6, 9, and 10). Contrary to this, fragments containingthe TMX3 bb� double domain were not detected. We con-cluded that the TMX3 b domain was most resistant towardproteolytic degradation and that upon the fast removal of theC-terminal tail the b� domain is degraded. Apparently the bdomain provides significantly higher protection against prote-olysis for the a domain than for the b� domain, indicating a rolefor the b domain in interdomain stabilization of the a domain.Expression and Gel Filtration Analysis of TMX3 Domain
Constructs—For further experiments, we used TMX3 con-structs comprising the a domain (residues 25–131), the abdomains (residues 25–234), or all three domains (abb�, residues25–344). The domain boundaries were based on the results ofthe proteolysis experiments, aswell as sequence alignments andsecondary structure predictions that indicated the constructsto contain all regular secondary structure elements of a canon-ical thioredoxin fold (Fig. 3B and supplemental Fig. S1).The purification protocol involved protein solubilization in a
denaturing buffer followed by refolding on an affinity chroma-tography column and anion exchange chromatography. Thisprotocol was employed because of its higher yields after havingensured that the refolded TMX3 a and ab constructs, initiallypurified under native conditions, showed no differences by CDor fluorescence spectroscopy to the natively purified proteins(data not shown). Likewise, no other experiments such as NMRspectroscopy and stability measurements (where reversibilityof unfolding was demonstrated) gave reason to believe thatrefolding resulted in perturbations of the native structure.The homogeneity of the purified TMX3 domain constructs
was assessed by SDS-PAGE (Fig. 2A) and analytical size exclu-sion chromatography (Fig. 2B). The apparent and theoreticalmasses were in good agreement for all TMX3 domain con-structs, indicating that all are likely to be spherically shapedproteins. No evidence for oligomerization was observed.NMR Spectroscopic Analysis and Molecular Modeling of the
TMX3aDomain—As a starting point for amore detailed struc-ture-function analysis, we chose the redox-active TMX3 adomain. ForNMRstructural investigations, unlabeled and 15N-labeled protein samples were generated and used to measure
one-dimensional and two-dimensional NMR spectra underreducing conditions. The proton one-dimensional spectrumdisplayed the features expected for a folded globular protein;several methyl and amide proton resonances were shifted wellout of the bulk of the spectrum that had linewidths expected forthe size of TMX3 a (data not shown). For a more detailed char-acterization we measured a 1H,15N correlation spectrum of15N-labeled reduced TMX3 a (Fig. 3A). In well structured pro-teins each backbone amide group, except theN-terminal one, isexpected to be represented by one peak in this type of spectrum.Indeed, this is exactly what was observed, demonstrating that thewhole protein isNMR-detectable.Moreover, the resonanceswerewell dispersed, indicating a globular folded protein containing�-helical and �-sheet secondary structure elements and only fewresidues in unstructured parts. A proton homonuclear two-di-mensional nuclearOverhauser effect spectroscopy spectrumcon-firmed the impression of the other two spectra because the reso-nances were well dispersed in the two-dimensional plane, and theclusteringof resonances typical for unfoldedproteinswasnot seen(data not shown).We also built a structural model of the TMX3 abb� fragment
as described under “Experimental Procedures ” and shown in itsentirety in supplemental Fig. S2. Based on the 38% sequenceidentity and the predicted conservation of the positions of indi-vidual regular secondary structure elements between TMX3 aand PDI a (Fig. 3B), the model of the a domain is likely quitereliable. With a number of residues expected to play a role incatalysis conserved between the two proteins (Fig. 3B), we
A B
0
0.2
0.4
0.6
0.8
1
8 9 10 11 12 13 14
67.0 43.0 27.0 13.7 kDa
Volume (ml)
A 2
80 (a
.u.)
45
31
21.5
14.4
6.5
66
TMX3
lum
TMX3
abb’
TMX3
ab
TMX3
a
97.4116200
FIGURE 2. Purification and analytical size exclusion chromatography ofTMX3 domain constructs. A, in addition to TMX3lum, fragments comprisinga, ab, or abb� were recombinantly expressed in E. coli and purified. Thehomogeneity of all purified TMX3 fragments was assessed by SDS-PAGE. Themarks on the side of each Coomassie-stained gel show the position and size(in kDa) of molecular mass marker bands. B, elution profiles of TMX3lum (solidline) and the a (dotted line), ab (short dashed line), and abb� (long dashed line)domain constructs from a calibrated Superdex S75 HR column. Individualelution profiles were scaled to adjust all the peaks to the same height. Basedon the elution volumes of marker proteins (indicated by arrows), apparentmasses were calculated for the TMX3 domain constructs. Those consisting ofmore than one domain tended to have slightly larger apparent masses(TMX3lum, 46.0 kDa; TMX3 abb�, 43.9 kDa; TMX3 ab, 28.5 kDa) compared withtheir theoretical masses (40.4, 37.2, and 24.6 kDa, respectively), whereas theapparent mass of the TMX3 a domain (11.7 kDa) was very close to its theoret-ical mass (12.3 kDa). The deviation of the apparent masses from the theoret-ical masses was in the same range as the difference from the linear calibrationfit observed for the individual proteins used for the calibration, indicatingspherical shapes for all TMX3 constructs. a.u., arbitrary units.
Structure-Function Analysis of TMX3
NOVEMBER 16, 2007 • VOLUME 282 • NUMBER 46 JOURNAL OF BIOLOGICAL CHEMISTRY 33865
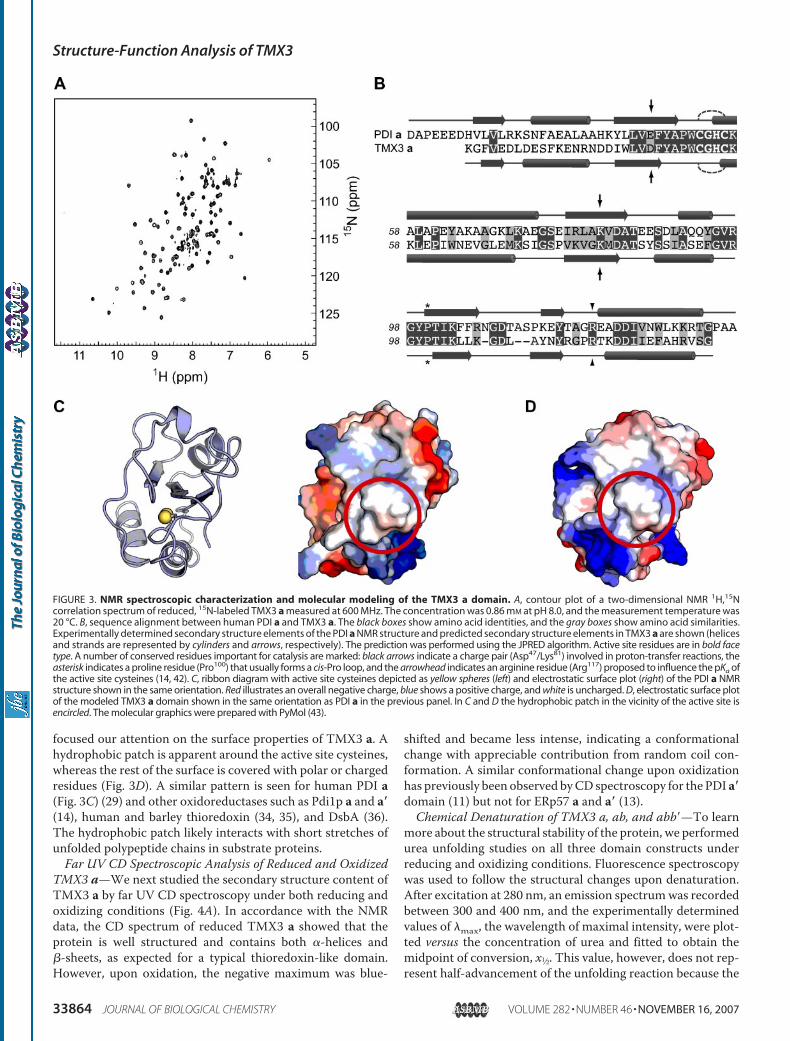
focused our attention on the surface properties of TMX3 a. Ahydrophobic patch is apparent around the active site cysteines,whereas the rest of the surface is covered with polar or chargedresidues (Fig. 3D). A similar pattern is seen for human PDI a(Fig. 3C) (29) and other oxidoreductases such as Pdi1p a and a�(14), human and barley thioredoxin (34, 35), and DsbA (36).The hydrophobic patch likely interacts with short stretches ofunfolded polypeptide chains in substrate proteins.Far UV CD Spectroscopic Analysis of Reduced and Oxidized
TMX3 a—We next studied the secondary structure content ofTMX3 a by far UV CD spectroscopy under both reducing andoxidizing conditions (Fig. 4A). In accordance with the NMRdata, the CD spectrum of reduced TMX3 a showed that theprotein is well structured and contains both �-helices and�-sheets, as expected for a typical thioredoxin-like domain.However, upon oxidation, the negative maximum was blue-
shifted and became less intense, indicating a conformationalchange with appreciable contribution from random coil con-formation. A similar conformational change upon oxidizationhas previously been observed byCD spectroscopy for the PDI a�domain (11) but not for ERp57 a and a� (13).Chemical Denaturation of TMX3 a, ab, and abb�—To learn
more about the structural stability of the protein, we performedurea unfolding studies on all three domain constructs underreducing and oxidizing conditions. Fluorescence spectroscopywas used to follow the structural changes upon denaturation.After excitation at 280 nm, an emission spectrumwas recordedbetween 300 and 400 nm, and the experimentally determinedvalues of �max, the wavelength of maximal intensity, were plot-ted versus the concentration of urea and fitted to obtain themidpoint of conversion, x1⁄2. This value, however, does not rep-resent half-advancement of the unfolding reaction because the
FIGURE 3. NMR spectroscopic characterization and molecular modeling of the TMX3 a domain. A, contour plot of a two-dimensional NMR 1H,15Ncorrelation spectrum of reduced, 15N-labeled TMX3 a measured at 600 MHz. The concentration was 0.86 mM at pH 8.0, and the measurement temperature was20 °C. B, sequence alignment between human PDI a and TMX3 a. The black boxes show amino acid identities, and the gray boxes show amino acid similarities.Experimentally determined secondary structure elements of the PDI a NMR structure and predicted secondary structure elements in TMX3 a are shown (helicesand strands are represented by cylinders and arrows, respectively). The prediction was performed using the JPRED algorithm. Active site residues are in bold facetype. A number of conserved residues important for catalysis are marked: black arrows indicate a charge pair (Asp47/Lys81) involved in proton-transfer reactions, theasterisk indicates a proline residue (Pro100) that usually forms a cis-Pro loop, and the arrowhead indicates an arginine residue (Arg117) proposed to influence the pKa ofthe active site cysteines (14, 42). C, ribbon diagram with active site cysteines depicted as yellow spheres (left) and electrostatic surface plot (right) of the PDI a NMRstructure shown in the same orientation. Red illustrates an overall negative charge, blue shows a positive charge, and white is uncharged. D, electrostatic surface plotof the modeled TMX3 a domain shown in the same orientation as PDI a in the previous panel. In C and D the hydrophobic patch in the vicinity of the active site isencircled. The molecular graphics were prepared with PyMol (43).
Structure-Function Analysis of TMX3
33864 JOURNAL OF BIOLOGICAL CHEMISTRY VOLUME 282 • NUMBER 46 • NOVEMBER 16, 2007

recorded value of �max is not a linear function of the molarfractions of the folded and unfolded states. The true midpointsof denaturation, x�1⁄2, given in the text were calculated by intro-ducing a corrective term to compensate for the nonlinearity(25), which is why they are not exactly equivalent to the valuesobtained by visual inspection of the curves in Fig. 4B.Upon fitting the �max values recorded for the TMX3 a
domain to a two-statemodel, midpoints of denaturation for thereduced and oxidized states of �1.3 and 0.4 M urea, respec-tively, were calculated (Fig. 4B, blue curves). The partial loss ofsecondary structure observed even in the absence of urea forthe oxidized state (Fig. 4A) correlates well with the low stabilitydetected by chemical denaturation. For the TMX3 ab and abb�constructs, two unfolding steps were observed, and the �maxvalues in dependence of the urea concentration were best fitted
to a three-state model. As seen forthe a domain in isolation, the firstunfolding step was found to be sen-sitive to the oxidation state. How-ever, with the higher stability evi-dently offered by the b and bb�domains, the denaturation mid-point shifted to �2.3 M urea underreducing conditions and �1.6 Murea for the oxidized state. The sec-ond unfolding step, whichwe attrib-ute to the b domain, was independ-ent of the redox state and took placeat �7 M urea.Peptide Oxidation Activity of
TMX3 a, ab, and abb�—Consider-ing the different structural andbiophysical properties of theTMX3 domain constructs, wedecided to compare their redoxactivity. The catalytic activity ofTMX3 a, ab, and abb� was investi-gated by comparing their ability tooxidize a model peptide contain-ing two cysteines (26). In this pep-tide, the formation of an intramo-lecular disulfide quenches theintrinsic fluorescence of a trypto-phan residue to 81% when com-pared with the reduced peptide.Here, we added 0.2 �M protein to3.4 �M reduced peptide substratein a buffer with a neutral pH con-taining 2 mM GSH and 0.5 mMGSSG and monitored the progressof the reaction by fluorescencespectroscopy (Fig. 5). The reactionprofiles all fit well to an exponen-tial function with random residu-als indicating the reaction to befirst order toward substrate andthereby peptide oxidation to berate-limiting (10) (see also supple-
mental Fig. S3). When previously performing this assay, wefound reaction half-times of 270 s for TMX3lum and 80 s forPDI (19). Here, we found all three domain constructs ofTMX3 to be faster catalysts than the entire luminal domainwith reaction half-times of �150 s.Determination of the Rate Constants for the Reaction between
Reduced TMX3 Domain Constructs and GSSG—Finally, wedetermined the kinetics of the reaction between reducedTMX3 domain constructs and GSSG. We used a fluorescence-based assay taking advantage of the observation that upon exci-tation at 280 nm, TMX3 a, ab, and abb� all showed �1.3 timeshigher fluorescence emission at 328 nm in the reduced com-pared with the oxidized state (data not shown). Pseudo firstorder rate constants were obtained from fitting a single-expo-nential function to the fluorescence change of reduced TMX3
[Urea] (M)
λ max
(nm
)
324
328
332
336
340
344
348
352
356
0 2 4 6 8
-10000
-5000
0
5000
200 210 220 230 240 250Wavelength (nm)
θ MR
W (d
eg c
m2
dmol
-1)
A B
aoxared
aox
abb’oxabox
ared
abb’red
abred
FIGURE 4. Stability measurements of reduced and oxidized TMX3 fragments. A, far UV CD spectra ofreduced (dashed line) and oxidized (solid line) TMX3 a. The protein was either reduced with 0.5 mM DTT oroxidized with 0.1 mM GSSG. B, 0.2 �M of TMX3 a (blue diamonds), TMX3 ab (red squares), or TMX3 abb� (blackcircles), were reduced in the presence of 10 mM GSH (empty symbols) or oxidized in the presence of 2 mM GSSG(filled symbols) and subsequently denatured with urea. After excitation at 280 nm, fluorescence emissionspectra were recorded between 300 and 400 nm. Each spectrum was background corrected, and the wave-length values at which maximal fluorescence emission was observed, �max, were plotted in dependence of theurea concentration. The data points were fitted to a two-state model (TMX3 a) or a three-state model (TMX3 aband TMX3 abb�) to obtain the midpoints of conversion x1⁄2. Note that the midpoints of denaturation, x�1⁄2, givenin the text were calculated by introducing a corrective term to compensate for the nonlinear relationshipbetween the �max signal and the concentrations of native and denatured protein, which is why they are notexactly the same values that can be determined by visual inspection of the curves in this panel.
0 500 1000 15000 500 1000 15000.8
0.9
1
0 500 1000 1500Time (s)
Nor
mal
ized
pep
tide
fluor
esce
nce
Time (s) Time (s)
A B Cabb’aba
FIGURE 5. Comparison of peptide oxidation by TMX3 fragments. Shown is the time-dependent fluores-cence change of the peptide NRCSQGSCWN upon oxidation. The data were recorded at 350 nm after excitationat 280 nm. The normalized peptide fluorescence given on the ordinate was obtained by normalizing to thevalue of the fully reduced peptide after subtraction of the protein fluorescence. The reaction was performed in100 mM KH2PO4/KOH, pH 7.0, 2 mM EDTA, 2 mM GSH, and 0.5 mM GSSG with 3.4 �M peptide substrate, andoxidation was catalyzed by 0.2 �M protein and compared with the uncatalyzed reaction. The half-times foroxidation were determined to be 166 � 25 s for TMX3 a (o, A), 142 � 31 s for TMX3 ab (o, B), 151 � 32 s for TMX3abb� (o, C), and 607 � 48 s for the uncatalyzed reaction (�, A–C). In the case of the uncatalyzed reaction, theexponential fit shown was used to derive the half-time, whereas the corresponding values for the TMX3fragments were obtained as described by Ruddock et al. (26).
Structure-Function Analysis of TMX3
NOVEMBER 16, 2007 • VOLUME 282 • NUMBER 46 JOURNAL OF BIOLOGICAL CHEMISTRY 33865

domain constructs (�0.25 �M) upon mixing with a molarexcess of GSSG (16–355 �M). As an example, the reaction ofTMX3 abwith 16 �MGSSG is shown in Fig. 6. From a series ofreactions performed at varying concentrations of GSSG, appar-ent second order rate constants (kapp) were determined. Asillustrated in Fig. 6 (inset), the kapp values obtained with theTMX3 a and ab constructs (105 mM�1 min�1 and 84 mM�1
min�1, respectively) were faster than the value of 26 mM�1
min�1 for the TMX3 abb� construct.
DISCUSSION
In the multi-domain proteins of the PDI family, a particularcombination of redox-active and noncatalytic thioredoxin-likedomains seems to be critical to ensure the specificity for distincttypes of substrates. Moreover, noncatalytic domains in differ-ent enzymesmust be able to fulfill different functions. Here, wehave shown that TMX3 is composed of one redox-activedomain (a) and two noncatalytic domains (b and b�). In addi-tion, a roughly 30-residue linker sequence connects the b�domain to the transmembrane region of the protein. This linkeris predicted to form an amphipathic helix from Ile352 to Phe371.Because this sequence is located immediately N-terminal to thetransmembrane region, which is predicted to start at Pro375, itmight well mediate membrane association.For the isolated TMX3 a domain, oxidation of the active site
disulfide resulted in partial unfolding and destabilization. Judg-ing by the CD spectra (Fig. 4A), a quite substantial conforma-tional change takes place upon oxidation. Unfortunately, we
could not characterize this change in more detail because wewere unable to produce the oxidized a domain at the concen-tration needed for recording a 1H,15N correlation spectrumbecause of problems of aggregation.For TMX3 ab and abb�, denaturation studies revealed two
separate transitions (Fig. 4B). The first likely reflects the dena-turation of the a domain because it was clearly stabilized in thereduced ab and abb� constructs. Moreover, the presence of band bb� notably stabilized the a domain regardless of its redoxstate (compare red and black curveswith blue curves in Fig. 4B).The second transition represents the unfolding of the bdomain. Because of the absence of tryptophan residues inTMX3 b�, its unfolding could not be followed by fluorescencespectroscopy. However, the presence of the b� domain did notinfluence the stability of either transition. The results of thedenaturation experiments correlated well with the proteolysisstudies that revealed the b domain to be most protease-resis-tant and to have a protective effect on the a domain towardprotease digestion.Particularly for the oxidized domain constructs, the conven-
tional use of fluorescence intensity in dependence of the dena-turant concentration to calculate protein stability turned outnot to be ideal. Likely because of protein aggregation and/oradsorption to the glass cuvette of oxidized TMX3 fragments,the intensity data scattered more than the wavelength maxi-mum data used instead. This method gave a robust signal thathad the advantage of being concentration-independent.Although the relationship between �max and the fractions offolded and unfolded protein is not linear, the method reliablydetermines transition midpoints (25). Primarily because cer-tain pretransition regions, especially that of the oxidized adomain, were too short to obtain nearly perfect fits, we did notuse the thermodynamic stabilities, �G values, as quantitativemeasures of protein stability. Although transition midpointsare not exact representations of protein stability, they did allowvalid semi-quantitative estimates to be made. Because the con-clusions about the relative stabilities are independent of theexact numbers, the urea concentrations atmidpoint servedwellas a measure of protein stability when comparing the TMX3domain constructs.The enzymatic characterization revealed that all TMX3
domain constructs catalyzed the oxidation of a model peptidefaster than TMX3lum (19). Because of the partial hydrophobicnature of the C-terminal tail present in the TMX3lum con-struct, it is conceivable that this region can compete for bindingof the peptide substrate by interaction with the hydrophobicpatch close to the active site in the a domain.TheTMX3 abb� constructwas oxidized a bit slower byGSSG
than TMX3 a and ab (Fig. 6, inset; experiment performed at pH7.0). The differences that we observed between TMX3 ab andTMX3 abb� in peptide oxidation kinetics at concentrations ofGSSG below �250 �M (see supplemental Fig. S3) were in fullagreement with the finding that TMX3 ab reacted faster thanTMX3 abb� with GSSG. Although it is presently unclear whyTMX3 abb� was oxidized slower than the two shorter domainconstructs, it is interesting to note that the kapp values deter-mined here for the TMX3 constructs were all in the rangereported for the PDI a and a� domains of �36 mM�1 min�1 at
1
1.05
1.1
1.15
1.2
1.25
1.3
0 40 80 120 160 200 240 280
Time (s)
Rel
ativ
e flu
ores
cenc
e
k’ (m
in-1
)
0
2
4
6
8
10
0 0.05 0.1 0.15 0.2 0.25 0.3 0.35
[GSSG] (mM)
abb’
ab
a
FIGURE 6. Determination of rate constants for the reaction betweenreduced TMX3 domain constructs and GSSG. The reaction between 0.25�M TMX3 ab and 16 �M GSSG in 100 mM potassium phosphate at pH 7.0 and1 mM EDTA at 25 °C was monitored by following the change in fluorescence at328 nm upon excitation at 280 nm. A pseudo first order rate constant k� 1.2min�1 was obtained by fitting a single exponential function to the datapoints. Inset, plot of the pseudo first order rate constants, k�, obtained from aseries of equivalent experiments by varying [GSSG] between 16 and 355 �M,against [GSSG]. Linear fits yielded apparent second order rate constants of 84mM
�1 min�1 for TMX3 a (diamonds, dotted line), 105 mM�1 min�1 for TMX3 ab
(squares, dashed line), and 26 mM�1 min�1 for TMX3 abb� (circles, solid line).
Structure-Function Analysis of TMX3
33866 JOURNAL OF BIOLOGICAL CHEMISTRY VOLUME 282 • NUMBER 46 • NOVEMBER 16, 2007

pH 7.4 (37). For comparison, these values are approximately 3orders of magnitude faster than the reaction of GSSG with thecysteine pair in the rxYFP redox sensor (kapp 0.072 mM�1
min�1 at pH 7.0) (27). Given their very similar redox potentials(19, 37, 38), the results indicate that TMX3 and PDI will equil-ibrate approximately equally fast with the glutathione redoxbuffer in the ER lumen.Based on the NMR structure of human PDI a and the crystal
structure of rabbit skeletal muscle calsequestrin, we built astructural model of TMX3 abb� (supplemental Fig. S2). In thismodel, the relative domain orientations are imposed by thecalsequestrin template. The quite short linker lengths betweendomains in TMX3 (supplemental Fig. S1) are similar to thosealso seen in calsequestrin, Pdi1p, and other family members(39). This feature must limit the degrees of freedom betweenthe a and b domains and between the b and b� domains, respec-tively. As noted previously (14), it is striking how well the thi-oredoxin domains of calsequestrin align structurally with theabb� domains of Pdi1p. By conjecture, but presently quite spec-ulative, the domain orientations in TMX3 could be similar tothose in Pdi1p abb� as suggested by supplemental Fig. S2. Nohydrophobic surface regions at the interface between the a andb domains were observed in the TMX3 model, and the molec-ular details of how the b domain stabilizes the a domain awaitfurther structural studies.Previously, it has been hypothesized that the PDI a� domain,
which partially unfolds upon oxidation, would be stabilized inthe context of the entire protein (11). Here, we clearly show thatsuch a mechanism is indeed in place for the TMX3 a domain,where pronounced effects were observed as a result of interdo-main stabilization by the b domain. Our results therefore indi-cate that at least certain PDI family members capable of cata-lyzing oxidation might rely on noncatalytic domains forstructural stabilization. The destabilization of a-type domainsobserved upon oxidation inTMX3 andPDI is a feature found tocorrelate with efficient transfer of the active site disulfide inother oxidoreductases, e.g.DsbA (40).Whether TMX3 and PDIact as efficient catalysts of protein oxidation in vivo is still anopen question; so far, the only proposed substrate of the flavin-binding oxidase ER oxidase 1 in mammalian cells is PDI (41).We are currently investigating this point further for both PDIand TMX3.
Acknowledgments—We thank the Institute of Biochemistry, ETHZurich, for the continued support, Rudi Glockshuber for helpful sug-gestions, and Karen Skriver, Jakob R.Winther, and all members of theEllgaard lab for critical reading of themanuscript. The peptide for theoxidation assay was kindly provided by Lloyd W. Ruddock.
REFERENCES1. Givol, D., Goldberger, R. F., and Anfinsen, C. B. (1964) J. Biol. Chem. 239,
PC3114–31162. Creighton, T. E., Hillson, D. A., and Freedman, R. B. (1980) J. Mol. Biol.
142, 43–623. Weissman, J. S., and Kim, P. S. (1993) Nature 365, 185–1884. Darby, N. J., Freedman, R. B., and Creighton, T. E. (1994) Biochemistry 33,
7937–79475. Ellgaard, L., and Ruddock, L. W. (2005) EMBO Rep. 6, 28–32
6. Sevier, C. S., and Kaiser, C. A. (2006) Antioxid. Redox. Signal. 8, 797–8117. Klappa, P., Ruddock, L.W., Darby,N. J., and Freedman, R. B. (1998)EMBO
J. 17, 927–9358. Russell, S. J., Ruddock, L. W., Salo, K. E., Oliver, J. D., Roebuck, Q. P.,
Llewellyn, D. H., Roderick, H. L., Koivunen, P., Myllyharju, J., and High, S.(2004) J. Biol. Chem. 279, 18861–18869
9. Kozlov, G., Maattanen, P., Schrag, J. D., Pollock, S., Cygler, M., Nagar, B.,Thomas, D. Y., and Gehring, K. (2006) Structure 14, 1331–1339
10. Alanen, H. I., Salo, K. E., Pirneskoski, A., and Ruddock, L. W. (2006) An-tioxid. Redox. Signal. 8, 283–291
11. Darby, N. J., and Creighton, T. E. (1995) Biochemistry 34, 11725–1173512. Darby,N. J., Penka, E., andVincentelli, R. (1998) J.Mol. Biol. 276, 239–24713. Frickel, E. M., Frei, P., Bouvier, M., Stafford, W. F., Helenius, A., Glock-
shuber, R., and Ellgaard, L. (2004) J. Biol. Chem. 279, 18277–1828714. Tian, G., Xiang, S., Noiva, R., Lennarz,W. J., and Schindelin, H. (2006)Cell
124, 61–7315. Jessop, C. E., Chakravarthi, S., Garbi, N., Hammerling, G. J., Lovell, S., and
Bulleid, N. J. (2007) EMBO J. 26, 28–4016. Meng, X., Zhang, C., Chen, J., Peng, S., Cao, Y., Ying, K., Xie, Y., andMao,
Y. (2003) Biochem. Genet. 41, 99–10617. Matsuo, Y., Akiyama, N., Nakamura, H., Yodoi, J., Noda, M., and Kizaka-
Kondoh, S. (2001) J. Biol. Chem. 276, 10032–1003818. Matsuo, Y., Nishinaka, Y., Suzuki, S., Kojima, M., Kizaka-Kondoh, S.,
Kondo, N., Son, A., Sakakura-Nishiyama, J., Yamaguchi, Y., Masutani, H.,Ishii, Y., and Yodoi, J. (2004) Arch. Biochem. Biophys. 423, 81–87
19. Haugstetter, J., Blicher, T., and Ellgaard, L. (2005) J. Biol. Chem. 280,8371–8380
20. Appenzeller-Herzog, C., and Ellgaard, L. (2007)Antiox. Redox. Signal., 10,10.1089/ars.2007.1837
21. Zahn, R., Buckle, A. M., Perrett, S., Johnson, C. M., Corrales, F. J., Golbik,R., and Fersht, A. R. (1996) Proc. Natl. Acad. Sci. U. S. A. 93, 15024–15029
22. Gill, S. C., and von Hippel, P. H. (1989) Anal. Biochem. 182, 319–32623. Kumar, A., Ernst, R. R., and Wuthrich, K. (1980) Biochem. Biophys. Res.
Commun. 95, 1–624. Bodenhausen, G., and Ruben, D. J. (1980) Chem. Phys. Lett. 69, 185–18925. Monsellier, E., and Bedouelle, H. (2005)Protein. Eng. Des. Sel. 18, 445–45626. Ruddock, L. W., Hirst, T. R., and Freedman, R. B. (1996) Biochem. J. 315,
1001–100527. Hansen, R. E., Ostergaard, H., and Winther, J. R. (2005) Biochemistry 44,
5899–590628. Sali, A., and Blundell, T. L. (1993) J. Mol. Biol. 234, 779–81529. Kemmink, J., Darby, N. J., Dijkstra, K., Nilges, M., and Creighton, T. E.
(1996) Biochemistry 35, 7684–769130. Wang, S., Trumble, W. R., Liao, H., Wesson, C. R., Dunker, A. K., and
Kang, C. H. (1998) Nat. Struct. Biol. 5, 476–48331. Wallner, B., and Elofsson, A. (2003) Protein Sci. 12, 1073–108632. Davis, I.W.,Murray, L.W., Richardson, J. S., and Richardson, D. C. (2004)
Nucleic Acids Res. 32,W615–W61933. Rost, B., Yachdav, G., and Liu, J. (2004) Nucleic Acids Res. 32,
W321–W32634. Qin, J., Clore, G. M., Kennedy, W. M., Huth, J. R., and Gronenborn, A. M.
(1995) Structure 3, 289–29735. Maeda, K., Hagglund, P., Finnie, C., Svensson, B., andHenriksen, A. (2006)
Structure 14, 1701–171036. Martin, J. L., Bardwell, J. C., and Kuriyan, J. (1993) Nature 365, 464–46837. Darby, N. J., and Creighton, T. E. (1995) Biochemistry 34, 16770–1678038. Raturi, A., and Mutus, B. (2007) Free Radic. Biol. Med. 43, 62–7039. Alanen,H. I., Salo, K. E., Pekkala,M., Siekkinen,H.M., Pirneskoski, A., and
Ruddock, L. W. (2003) Antioxid. Redox Signal 5, 367–37440. Zapun, A., Bardwell, J. C., and Creighton, T. E. (1993) Biochemistry 32,
5083–509241. Mezghrani, A., Fassio, A., Benham,A., Simmen, T., Braakman, I., and Sitia,
R. (2001) EMBO J. 20, 6288–629642. Lappi, A. K., Lensink, M. F., Alanen, H. I., Salo, K. E., Lobell, M., Juffer,
A. H., and Ruddock, L. W. (2004) J. Mol. Biol. 335, 283–29543. Delano, W. L. (2002) The PyMOL Molecular Graphics System, DeLano
Scientific, Palo Alto, CA
Structure-Function Analysis of TMX3
NOVEMBER 16, 2007 • VOLUME 282 • NUMBER 46 JOURNAL OF BIOLOGICAL CHEMISTRY 33867