structure hydraulics and hydrology final hydraulic report ... · final hydraulic report . smith...
TRANSCRIPT
“Caltrans improves mobility across California”
- 1 -
__________________________ REGISTERED ENGINEER C 61217 REGISTRATION NUMBER
State of California – Department of Transportation Division of Engineering Services
Structure Design Services
Structure Hydraulics and Hydrology
Final Hydraulic Report
Smith River Bridge (Dr. Fine Memorial Bridge)
Bridge Number 01-0020
Located on State Route 101 in Del Norte County
September 23, 2016
_____________________________________________________________________ WRITTEN BY:
Ronald McGaugh
This report has been prepared under our direction as the professional engineers in responsible charge of the work, in accordance with the provisions of the Professional Engineers Act of the State of California

State of California Smith River Bridge (Dr. Ernest Fine), Br. No. 01-0020 DEPARTMENT OF TRANSPORTATION 01-DN-101-PM 36.06 EA 01-43640 EFIS 01-0000-0193
“Caltrans improves mobility across California” - 2 -
1.0 Introduction: Structure Design has proposed to replace the existing bridge with a 4-span, 1,025 foot long, and 50.25 foot wide structure. The super structure will be a Cast In Place/Parabolic Span (CIP/PS) Box Girder a variable depth from 7.5 to 17 feet. The super structure will be supported on 8 foot diameter CIDH piles. The proposed bridge will be built on the same alignment and with a slightly higher profile grade as the existing structure. The proposed bridge will require at least four construction seasons with a complexity of detours and falsework. A new bridge would improve safety and reliability providing a structure built to the latest seismic standards while eliminating concerns about scour and potential deterioration of the bridge’s steel members. 2.0 Scope of Report: For the bridge design, an assessment of the pre-construction, construction, and post construction conditions for water surface elevations and scour were based on the design flood Q50 and base flood Q100 and discharges. For the environmental studies, assessment of environmental impacts during temporary construction conditions for water surface elevations and scour were based were based on various conditions that are outlined in Section 18.0 The U.S. Army Corps of Engineers Hydrologic Engineering Center-River Analysis System (HEC-RAS program Version 5.01) was used to perform a one-dimensional hydraulic analysis to calculate the water surface elevations and velocity for this project. The FHWA Hydraulic Engineering Circular, (HEC-18), “Evaluating Scour at Bridges 5th Edition” was used to calculate the potential scour for this project. This report makes reference to:
• Plans and Profiles Submitted by Structure Design • As-Built Plans for 1939 Dr. Fine Bridge • Caltrans Bridge Maintenance Reports • Structures Ratings Branch Memo, OSMI, 1996, • Smith River Gravel Study, Department of Water Resources,1974, • FEMA Study, November 26, 2010, • Debris Analysis Report, March 15 2016 James Philipp
All Elevations in this report are based on NAVD 88.
3.0 General: The Smith River Bridge (Br. No. 01-0020) is located on State Route 101 approximately 9 miles north of Crescent City in Del Norte County. The existing 20-span bridge consists of two structure types with a total length of approximately 1,051 feet and a width of approximately 32 feet. The south end approach is a continuous 10-span Cast-In-Place/Reinforced Concrete (CIP/RC) slab, with parabolic shaped soffit, on RC 3-column piers (with seismic retrofit RC infill walls between the columns of Piers 6, 7, 10 and 11). Span 1 is a cantilever end span. The six main spans are riveted steel plate girders (2) with CIP/RC non-composite deck on RC 2-column piers with web walls. The bridge’s north end approach is a continuous 4-span CIP/RC slab, with parabolic shaped soffit on RC 3-column piers (with seismic retrofit RC infill walls between the columns of Pier 17). Span 20 is a cantilevered end span. The piers supporting the approach spans at the south end and the piers for the main spans are on driven H piles. The piers supporting the approach spans at the north end are on RC spread footings. The 1997 seismic retrofit also consists of four 6-foot diameter Cast-In-Drilled-Hole (CIDH) RC piles with CIP/RC caps buried in the approach embankment adjacent to

State of California Smith River Bridge (Dr. Ernest Fine), Br. No. 01-0020 DEPARTMENT OF TRANSPORTATION 01-DN-101-PM 36.06 EA 01-43640 EFIS 01-0000-0193
“Caltrans improves mobility across California” - 3 -
both ends of the bridge. The Abutment 1 pile-shafts are connected to the Pier 12 and Pier 19 strengthened bent cap by high-strength steel tendons encased and grouted in four galvanized steel pipes that are hung below the deck of the approach spans and supported by hangers attached to the soffit. The existing bridge is fracture critical due to low redundancy (2 girder system), pin and hangar assemblies at the hinge and Category E welds in the wind brace connections to the girders. A fatigue analysis performed by Structure Maintenance & Investigations Ratings Branch in 2007 estimated a remaining service life of 7 years before major rehabilitation would be needed. The bridge also has substandard rail and shoulders and a long history of scour problems. In 2006, the Bridge’s scour potential was assessed in accordance with FHWA Technical Advisory T5140.23, “Evaluating Scour at Bridges” and within current Caltrans guidelines, the bridge was estimated to be scour critical with an item 113 code of 3, “Bridge foundations determined to be unstable for calculated scour conditions.” Several types of scour monitoring were installed but no countermeasures were ever constructed. 4.0 Scour History for Existing Bridge The Smith River Bridge spans a highly mobile gravel bed river dominated by high discharge events. The underlying channel bed stratum varies from sandy silt, sand to coarse gravel. The Smith River has been actively mined for gravel upstream and downstream of the bridge for many years. The gravel mining has been regulated by the U.S. Army Corps of Engineers and the Del Norte County Planning Department. The channel bed has also experienced severe erosion and scour around the existing bridge pier foundations. This could be attributed to major flood events and the gravel extraction operations, both upstream and downstream of the existing bridge. Caltrans Bridge Inspection Record Excerpts:
• In 3/5/1974 the Pier 15 foundation had scour countermeasures installed to prevent further erosion.
• In 4/23/1996, the Structure Maintenance and Investigations (SM&I) Rating Branch determined
that the bridge would become unstable below an elevation of -6.0 feet. The control elevation for seismic loading was then conservatively set at the top of footing elevation.
• In 8/9/1996 Structure Hydraulics completed a scour evaluation where the local pier scour was
calculated below the footings for the critical Piers 12 through 15. The bridge was then coded as scour critical.
• A passive scour monitoring program for Piers 12 through 15 was recommended, (BIR
10/1/2001) and the Item 113 code for scour vulnerability was changed to 7.
• In 6/4/2003 the pile cap was exposed 1 foot at Pier 13 on the Span 12 side and approximately 1.3 foot on the Span 13 side.
• In 8/11/2004 the channel thalweg had dropped an additional 2 feet in just one year threatening
footing exposure at Pier 13.

State of California Smith River Bridge (Dr. Ernest Fine), Br. No. 01-0020 DEPARTMENT OF TRANSPORTATION 01-DN-101-PM 36.06 EA 01-43640 EFIS 01-0000-0193
“Caltrans improves mobility across California” - 4 -
• In 10/10/2006, The Bridge’s scour potential was re-assessed in accordance with FHWA Technical Advisory T5140.23, “Evaluating Scour at Bridges” and within current Caltrans guidelines, the bridge was determined to be scour critical and the item 113 code was changed to 3, “Bridge foundations determined to be unstable for calculated scour conditions.” According to the National Bridge Inventory (NBI) coding manual, passive monitoring was not considered a permanent scour countermeasure.
• In 7/10/2007 the entire surface of the footing at Pier 13 was exposed.
• In 8/27/2009 the pile cap at Pier 14 is exposed approximately 1 foot on the span 13 and 14 side.
• In 6/14/2011 an underwater investigation was completed. The top of the Pier 13 footing was
completely exposed up to a maximum depth of 1.2 feet. At the Pier 14 footing there was approximately 3 feet of cover at the west end gradually decreasing to approximately 1 foot at the east end. At the Pier 15 footing there was approximately 5 feet of cover on the west end and 3 feet at the east end. No undermining was found at any of the piers.
• In 8/28/2011 a channel cross-section was measured from Pier 11 through 16. This cross-section
was compared with the last one dated 10/10/2006 and on average the channel had degraded by approximately 3 feet.
• In 9/26/2013 the entire top of footing of Pier 14 was exposed by a maximum of 1.2 feet at the
northwest corner. • According to the most recent Bridge Inspection Report, completed 9/9/2015, the following scour
was noted:
• Pier 11 - Located within the left overbank where the soil is mostly soft and silty. No scour was noted at this location.
• Pier 12- Was found to have 2 scour holes with the larger one being triangular in shape and
wider downstream extending for the entire pier wall length at span 11. The smaller scour hole was located upstream, where the deeper portion extended several feet away from the pier on the span 12 side. There was also some debris noted at the nose of the pier. No footing exposure was noted.
• Pier 13- The Pier 13 footing was visible through the entire pier wall length on the span 12 side.
• A channel cross-section was taken during this inspection and compared to previous historical
cross-sections. It appears that the channel elevation has not changed much since 2004. A more recent evaluation by the Office of Geotechnical Support Branch in 10/26/2015 and SM&I Ratings Branch in 3/3/2016 concluded that the bridge was scour critical assuming migration continues towards Pier 13. According to the Caltrans Bridge Maintenance Records this bridge has a long history of gravel mining upstream and downstream of the bridge. The overall degradation rate over the years at the bridge site is relatively small, approximately 1 foot every ten years. However the combination of degradation, channel migration, hydraulic skew, local pier scour, unpredictable and rapid fluctuation in vertical stability due to gravel mining, drift and the potential seismic instability makes this bridge scour critical.

State of California Smith River Bridge (Dr. Ernest Fine), Br. No. 01-0020 DEPARTMENT OF TRANSPORTATION 01-DN-101-PM 36.06 EA 01-43640 EFIS 01-0000-0193
“Caltrans improves mobility across California” - 5 -
5.0 Drainage Basins The Smith River is the largest perennial river in California that flows freely with no manmade structures for its entire course. The Smith River main stem is formed by the confluence of the Middle and North Forks near the community of Gasquet and its South Fork near the community of Hiouchi. The river continues flowing northwest for 12 miles to the Smith River Bridge, Br. No. 01-0020. From the bridge site the Smith River continues to flow northwest for another 6 miles entering the Pacific Ocean south of the community of Smith River. The Smith River is a natural channel with steep slopes through much of Del Norte County, with a watershed area of approximately 672 square miles of rugged mountainous terrain. The River above the bridge site has a sinusoidal shape with many point bars and longitudinal flow areas. At the project site the river has a longitudinal slope of 0.0012. ft/ft. The project study area floodplain has a general slope of 0.0026 ft/ft. The average annual precipitation based on the Oregon Climate Service Prism Program (Annual normal from 1981 to 2010) is approximately 103 inches. 6.0 Floodway The Smith River Basin is fan shaped with common focal point for the major tributaries, which gives the basin its very sharp reaction to rainfall and runoff. As a result, floods in the basin are normally of short duration, lasting approximately 2 to 4 days. Intense flows develop rapidly in this particular watershed basin, with the peak being reached in approximately 6 to 8 hours after occurrence of the most intense part of the storm. During the 1964 flood of record, the flow at the Smith River Bridge increased from 20,000 cubic feet per second to a peak of 228,000 cubic feet per second in approximately 36 hours and remained above 100,000 cubic feet per second for 30 hours. Based on USGS records a discharge of 228,000 cfs in 1964 is believed to have equaled or exceeded the legendary flood of December 1861, making it the largest in about 140 years. The second highest recorded peak was a discharge of 182,000 cfs in January 1972. There is no history of the bridge ever overtopping. The project is located in a FEMA Special Flood Hazard Area (SFHAs) subject to inundation by the 1% Annual Chance Flood. The 1% annual chance flood (100-year flood), is also known as the base flood that has a 1% chance of being equaled or exceeded in any given year. This Special Flood Hazard Area is designated as a Zone AE, where the Base Flood Elevations have been determined. There is a relief bridge located approximately 1200 feet south named the Smith River Overflow Bridge, Br. No. 01-0046. During major flood events this bridge could experience overflows from the Smith River.
State of California Smith River Bridge (Dr. Ernest Fine), Br. No. 01-0020 DEPARTMENT OF TRANSPORTATION 01-DN-101-PM 36.06 EA 01-43640 EFIS 01-0000-0193
“Caltrans improves mobility across California” - 6 -
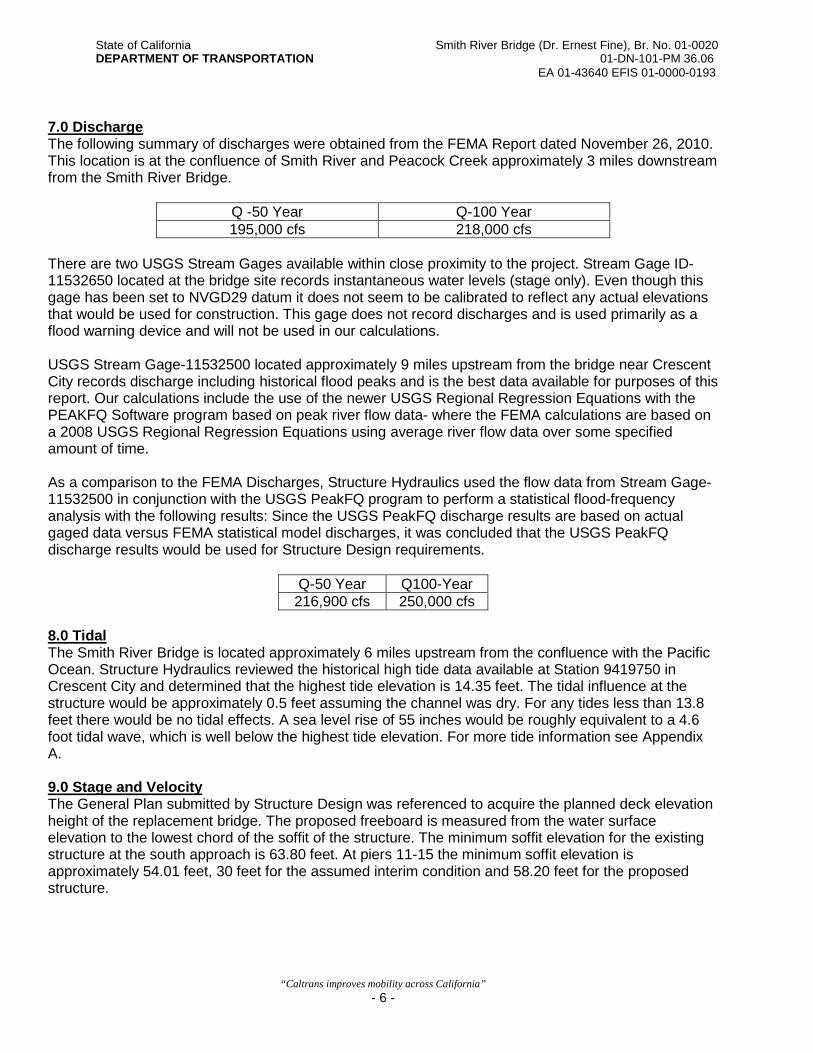
7.0 Discharge The following summary of discharges were obtained from the FEMA Report dated November 26, 2010. This location is at the confluence of Smith River and Peacock Creek approximately 3 miles downstream from the Smith River Bridge.
Q -50 Year Q-100 Year 195,000 cfs 218,000 cfs
There are two USGS Stream Gages available within close proximity to the project. Stream Gage ID-11532650 located at the bridge site records instantaneous water levels (stage only). Even though this gage has been set to NVGD29 datum it does not seem to be calibrated to reflect any actual elevations that would be used for construction. This gage does not record discharges and is used primarily as a flood warning device and will not be used in our calculations. USGS Stream Gage-11532500 located approximately 9 miles upstream from the bridge near Crescent City records discharge including historical flood peaks and is the best data available for purposes of this report. Our calculations include the use of the newer USGS Regional Regression Equations with the PEAKFQ Software program based on peak river flow data- where the FEMA calculations are based on a 2008 USGS Regional Regression Equations using average river flow data over some specified amount of time. As a comparison to the FEMA Discharges, Structure Hydraulics used the flow data from Stream Gage-11532500 in conjunction with the USGS PeakFQ program to perform a statistical flood-frequency analysis with the following results: Since the USGS PeakFQ discharge results are based on actual gaged data versus FEMA statistical model discharges, it was concluded that the USGS PeakFQ discharge results would be used for Structure Design requirements.
Q-50 Year Q100-Year 216,900 cfs 250,000 cfs
8.0 Tidal The Smith River Bridge is located approximately 6 miles upstream from the confluence with the Pacific Ocean. Structure Hydraulics reviewed the historical high tide data available at Station 9419750 in Crescent City and determined that the highest tide elevation is 14.35 feet. The tidal influence at the structure would be approximately 0.5 feet assuming the channel was dry. For any tides less than 13.8 feet there would be no tidal effects. A sea level rise of 55 inches would be roughly equivalent to a 4.6 foot tidal wave, which is well below the highest tide elevation. For more tide information see Appendix A. 9.0 Stage and Velocity The General Plan submitted by Structure Design was referenced to acquire the planned deck elevation height of the replacement bridge. The proposed freeboard is measured from the water surface elevation to the lowest chord of the soffit of the structure. The minimum soffit elevation for the existing structure at the south approach is 63.80 feet. At piers 11-15 the minimum soffit elevation is approximately 54.01 feet, 30 feet for the assumed interim condition and 58.20 feet for the proposed structure.
State of California Smith River Bridge (Dr. Ernest Fine), Br. No. 01-0020 DEPARTMENT OF TRANSPORTATION 01-DN-101-PM 36.06 EA 01-43640 EFIS 01-0000-0193
“Caltrans improves mobility across California” - 7 -
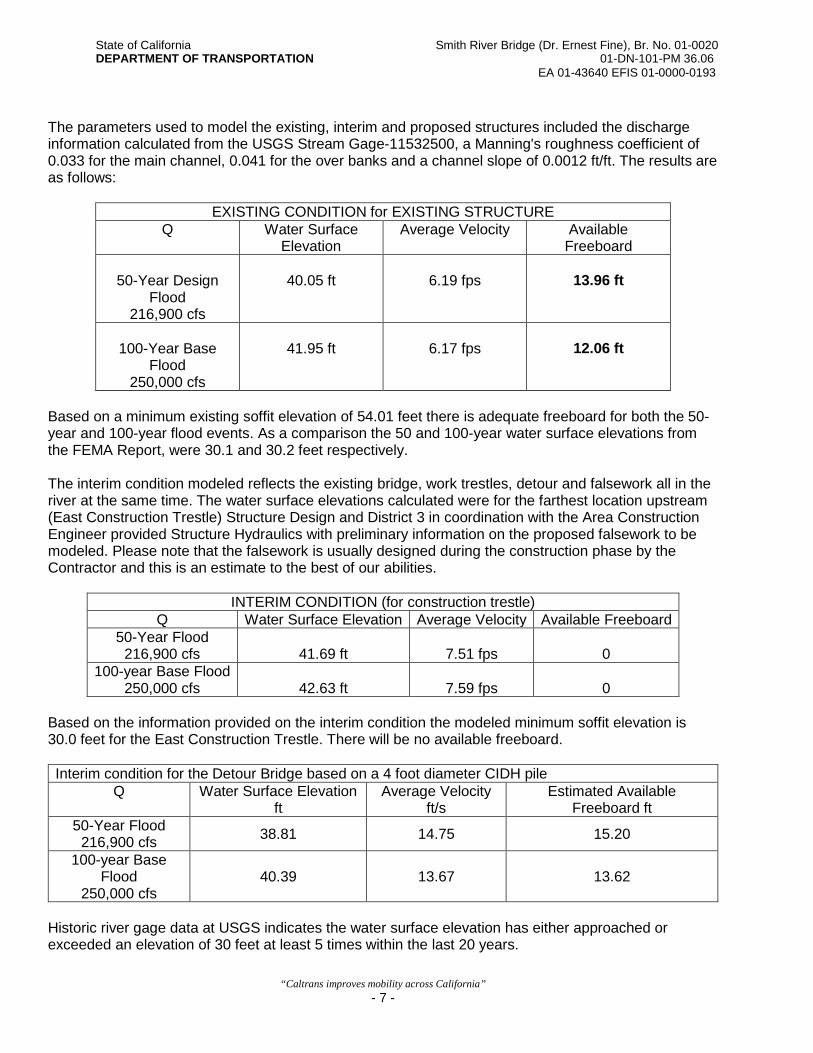
The parameters used to model the existing, interim and proposed structures included the discharge information calculated from the USGS Stream Gage-11532500, a Manning's roughness coefficient of 0.033 for the main channel, 0.041 for the over banks and a channel slope of 0.0012 ft/ft. The results are as follows:
EXISTING CONDITION for EXISTING STRUCTURE Q Water Surface
Elevation Average Velocity Available
Freeboard
50-Year Design Flood
216,900 cfs
40.05 ft
6.19 fps
13.96 ft
100-Year Base
Flood 250,000 cfs
41.95 ft
6.17 fps
12.06 ft
Based on a minimum existing soffit elevation of 54.01 feet there is adequate freeboard for both the 50-year and 100-year flood events. As a comparison the 50 and 100-year water surface elevations from the FEMA Report, were 30.1 and 30.2 feet respectively. The interim condition modeled reflects the existing bridge, work trestles, detour and falsework all in the river at the same time. The water surface elevations calculated were for the farthest location upstream (East Construction Trestle) Structure Design and District 3 in coordination with the Area Construction Engineer provided Structure Hydraulics with preliminary information on the proposed falsework to be modeled. Please note that the falsework is usually designed during the construction phase by the Contractor and this is an estimate to the best of our abilities.
INTERIM CONDITION (for construction trestle) Q Water Surface Elevation Average Velocity Available Freeboard
50-Year Flood 216,900 cfs
41.69 ft
7.51 fps
0
100-year Base Flood 250,000 cfs
42.63 ft
7.59 fps
0
Based on the information provided on the interim condition the modeled minimum soffit elevation is 30.0 feet for the East Construction Trestle. There will be no available freeboard. Interim condition for the Detour Bridge based on a 4 foot diameter CIDH pile
Q Water Surface Elevation ft
Average Velocity ft/s
Estimated Available Freeboard ft
50-Year Flood 216,900 cfs 38.81 14.75 15.20
100-year Base Flood
250,000 cfs 40.39 13.67 13.62
Historic river gage data at USGS indicates the water surface elevation has either approached or exceeded an elevation of 30 feet at least 5 times within the last 20 years.

State of California Smith River Bridge (Dr. Ernest Fine), Br. No. 01-0020 DEPARTMENT OF TRANSPORTATION 01-DN-101-PM 36.06 EA 01-43640 EFIS 01-0000-0193
“Caltrans improves mobility across California” - 8 -
PROPOSED CONDITION for the REPLACEMENT STRUCTURE Q WSEL Average Velocity Available Freeboard
50-Year Design Flood 216,900 cfs
39.89 ft
7.47 fps
18.31 ft
100-Year Base Flood
250,000 cfs
41.78 ft
7.54 fps
16.42 ft
Based on a minimum soffit elevation of 58.20 feet for the proposed replacement structure, there is adequate freeboard for both the 50-year and 100-year flood events for the replacement structure. 10.0 Interim Scour Condition for Structures Design The FHWA Hydraulic Engineering Circular, (HEC-18), “Evaluating Scour at Bridges 5th Edition” was used to calculate the potential scour for the interim condition. For modeling purposes the scour will be calculated at maximum velocity conditions using the Q100 and the Q50 flows. Based on the log of test borings from the as-builts, and District streambed investigation memo in Appendix D. All piers are assumed to be graded with a d50 of approximately 00.151 ft (46 millimeters) and the d95 no greater than 0.591 ft (180 millimeters). All Work Trestle piers are assumed to be 2 foot in diameter or 2 foot square. Degradation and contraction calculations are not used for these pile extensions since these foundational structures are deemed as temporary and shall be removed.
Interim scour conditions for 2 foot square or round diameter pile at the East Construction Trestle
Q50 Q100 Square Pier (ft) scour hole depth 5.5 5.6 Scour hole diameter at intersection of streambed and square support (ft) 24.0 24.4
Round Pier(ft) scour hole depth 4.80 4.80 Scour hole diameter at intersection of streambed and round support (ft) 21.2 21.2
Interim condition for the Detour Bridge based on a 4 foot diameter CIDH pile
Q Water Surface
Elevation ft
Average Velocity ft/s
Estimated Available
Freeboard ft
Scour Depth CIDH Piles no
blockage ft
Scour Depth CIDH Piles 10%
blockage** ft
50-Year Flood
216,900 cfs 38.81 14.75 15.20 7.45 6.67
100-year Base Flood 250,000 cfs
40.39 13.67 13.62 7.50 7.63
** To assess scour depths associated with debris stacked against the East Construction Trestle, the interim condition model was run with 10% of the trestle opening closed off

State of California Smith River Bridge (Dr. Ernest Fine), Br. No. 01-0020 DEPARTMENT OF TRANSPORTATION 01-DN-101-PM 36.06 EA 01-43640 EFIS 01-0000-0193
“Caltrans improves mobility across California” - 9 -
11.0 Scour for the Proposed Structure The FHWA Hydraulic Engineering Circular, (HEC-18), “Evaluating Scour at Bridges” was used to calculate the potential future scour for the proposed bridge. The scour evaluation requires an assessment of (1) Channel Bed Degradation, (2) Contraction Scour and (3) Local Pier Scour including the effects of debris and hydraulic skew. The gravel mining has been regulated by the U.S. Army Corps of Engineers and the Del Norte County Planning Department. The gravel mining company immediately upstream is required to replenish any lost river bed materials, maintaining an agreed upon river bed elevation. Structure Hydraulics does not have any future concerns with degradation or contraction scour at the bridge site. The 100-Year Flood of 250,000 cfs was used to calculate a potential local pier scour of 20.0 feet for the proposed replacement bridge based on a pier diameter of 8 feet. Structure Hydraulics recommends that all new foundations for the proposed replacement bridge should be designed assuming no ground support (lateral or vertical) as a result of soil loss due to possible future scour. 12.0 Drift According to the Caltrans Maintenance Records there has been history of drift accumulation requiring periodic maintenance. The drift type consisted of small branches to large logs accumulating at various piers, especially during major storm events. Structure Hydraulics anticipates a low to moderate potential of drift for the construction and final conditions. There will be adequate freeboard over all flood events to pass any potential drift for the proposed replacement bridge. According to a Debris Analysis Report completed by James Phillip, Caltrans District 3, March 22, 2016, there has been a consistent decrease in the occurrence of floating debris from 1980’s to present. This is probably due to changes in the timber harvest practices and more stringent controls on in-stream mining. According to our model results there will not be adequate freeboard in any flow frequency to pass any drift for the construction trestles. Any accumulation of drift should be removed by the contractor to avoid exacerbating any potential local pier scour, or potential damming of flows. The depth of flow is deep enough to where floating debris should not pose any problems for scour. Degradation and Contraction Scour is not a concern. 13.0 Bank Protection Bank protection is not an anticipated need for the proposed replacement structure however if any entities feel bank protection is needed it will be designed by the District to protect the roadway approach fills. The average velocity (See “Section 9 above) is provided to assist the District hydraulic engineers in the design of bank protection if necessary.

State of California Smith River Bridge (Dr. Ernest Fine), Br. No. 01-0020 DEPARTMENT OF TRANSPORTATION 01-DN-101-PM 36.06 EA 01-43640 EFIS 01-0000-0193
“Caltrans improves mobility across California” - 10 -
14.0 Hydrologic Summary for Design Engineer for Proposed Structure
HYDROLOGIC SUMMARY FOR SMITH RIVER Br. No. 01-0020 Drainage Area: 672 mi2
Design Flood Base Flood Overtopping Flood
Frequency 50-yr 100-yr N/A
Discharge 216,900 cfs
250,000 cfs N/A
Water Surface Elevation 39.89 ft 41.78 ft N/A
Flood plain data are based upon information available when the plans were prepared and are shown to meet federal requirements. The accuracy of said information is not warranted by the State and interested or affected parties should make their own investigation.
15.0 Scour Data Table for Design Engineer for Proposed Structure
Support No. Long Term (Degradation** and Contraction) Scour Elevation (feet)
Short Term (Local) Scour Depth, (feet)
Abutment 1 55.0 0 Pier 2 35.0 20.0 Pier 3 22.0 20.0 Pier 4 14.5 20.0 Abutment 5 55.0 0
** Degradation based on 75 years

State of California Smith River Bridge (Dr. Ernest Fine), Br. No. 01-0020 DEPARTMENT OF TRANSPORTATION 01-DN-101-PM 36.06 EA 01-43640 EFIS 01-0000-0193
“Caltrans improves mobility across California” - 11 -
16.0 Scour Data Table for Design Engineer for Detour Structure
Support No. Long Term (Degradation **and Contraction) Scour Elevation (feet)
Short Term (Local) Scour Depth, (feet)
Abutment 1 58 0 Pier 2 45 0 Pier 3 43 0 Pier 4 33.14 4.45 Pier 5 31.49 4.9 Pier 6 33.66 4.32 Pier 7 32.36 4.67 Pier 8 11.16 5.31 Pier 9 2.47 8.91
Pier 10 5.38 9.51 Pier 11 6.26 9.03 Pier 12 7.52 9.01 Pier 13 30.03 8.82 Pier 14 36.59 3.88 Pier 15 38.93 2.89
Abutment 16 58 0 ** Degradation based on 10 years
17.0 Recommendations for Structure Design Each work trestle raises the water surface elevations and lowers velocity. The West Work Trestle is in a particularly fast part of the river. Construction of this trestle should be done on small platforms at various stages no longer than 30 ft. long along the bridge opening. The 50 ft span for the mussel beds will not be a problem for the contractor to “work around”

State of California Smith River Bridge (Dr. Ernest Fine), Br. No. 01-0020 DEPARTMENT OF TRANSPORTATION 01-DN-101-PM 36.06 EA 01-43640 EFIS 01-0000-0193
“Caltrans improves mobility across California” - 12 -
18.0 Assessment of environmental impacts during temporary construction Environmental impacts evaluated for this section of this report are limited to the water surface elevations and scour based on Q10, Q5 and Q2 discharge events. Temporary work trestles used in construction to be modeled for Q5. For assessment of environmental impacts during construction, Q10, Q5 and Q2 discharge events will be modeled for purposes related to environmental studies. Plans and trestles are shown in Appendix A and B . For temporary work trestles zero freeboard is an accepted risk. Contractor may be allowed to build temporary trestles at heights feasible and necessary for contractor to accomplish bridge work in timely manner and trestles may be required to be built to withstand being temporarily submerged during peak storm events. During peak storm events, contractor may pull equipment from trestles and utilize trestles as a platform to remove debris stacked up against the structures once water levels recede. 19.0 Discharge for environmental assessment Structure Hydraulics used the flow data from Stream Gage-11532500 in conjunction with the USGS PeakFQ program to perform a flood-frequency analysis with the following results:
Q-2 Year Q-5 Year Q-10 Year 91,000 cfs 123,000 cfs 151,000 cfs
20.0 Water surface elevations The interim condition modeled reflects the existing bridge, work trestles, detour and falsework all in the river at the same time. The water surface elevations calculated were for the farthest location upstream (East Construction Trestle). Structure Design and District 3 in coordination with the Area Construction Engineer provided Structure Hydraulics with preliminary information on the proposed falsework to be modeled. Please note that the falsework is usually designed during the construction phase by the Contractor and this is an estimate to the best of our abilities. Scour depths for the interim conditions for 2 foot square or round diameter pile at the East Construction Trestle.
INTERIM CONDITION Q Water
Surface Elevation
Average Velocity
Available Freeboard
2-Year Flood 91,000 cfs
33.30 ft
11.16 fps
0
5-Year Flood 123,000 cfs
36.41 ft
10.48 fps
0
10-Year Flood 151,000 cfs
38.42 ft
8.91 fps
0
Based on the information provided on the interim condition the modeled minimum soffit elevation is 30.0 feet for the East Construction Trestle. There will be no available freeboard for a 2-Year Flood Event or any event greater than a 2 Year Flood Event. However, debris that accumulate on the trestle will be removed by the contractor to avoid exacerbating any potential local pier scour, or potential damming of flows.
State of California Smith River Bridge (Dr. Ernest Fine), Br. No. 01-0020 DEPARTMENT OF TRANSPORTATION 01-DN-101-PM 36.06 EA 01-43640 EFIS 01-0000-0193
“Caltrans improves mobility across California” - 13 -
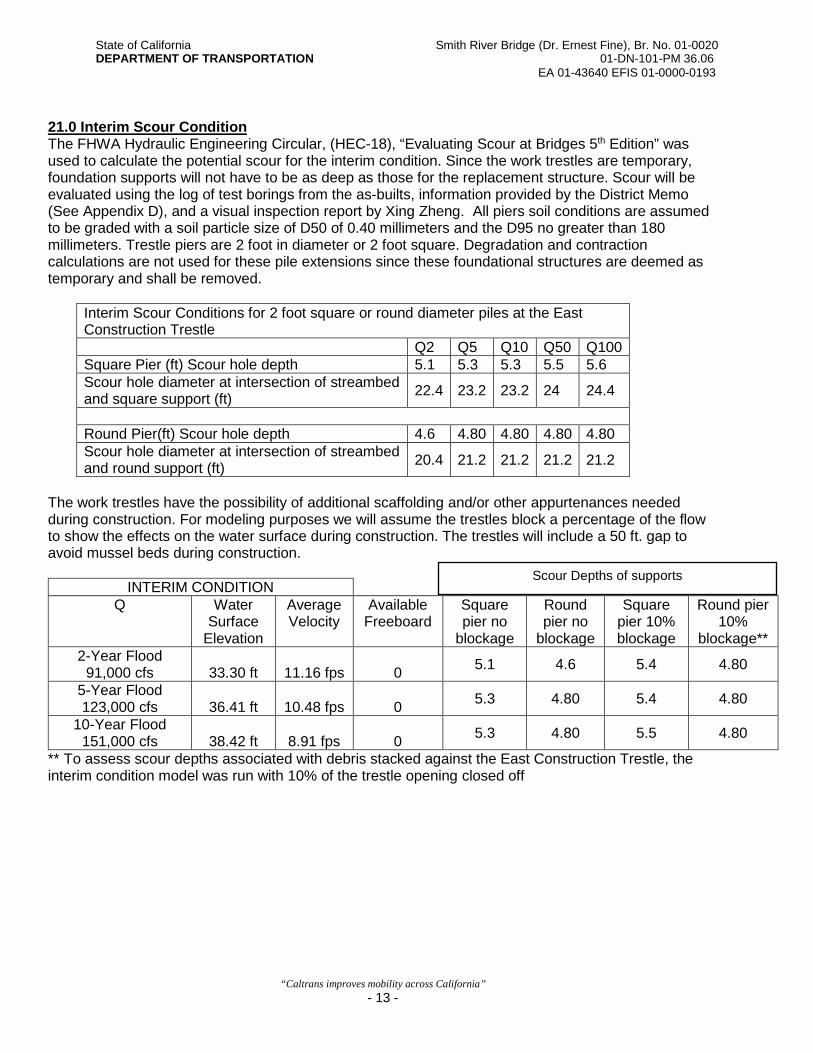
21.0 Interim Scour Condition The FHWA Hydraulic Engineering Circular, (HEC-18), “Evaluating Scour at Bridges 5th Edition” was used to calculate the potential scour for the interim condition. Since the work trestles are temporary, foundation supports will not have to be as deep as those for the replacement structure. Scour will be evaluated using the log of test borings from the as-builts, information provided by the District Memo (See Appendix D), and a visual inspection report by Xing Zheng. All piers soil conditions are assumed to be graded with a soil particle size of D50 of 0.40 millimeters and the D95 no greater than 180 millimeters. Trestle piers are 2 foot in diameter or 2 foot square. Degradation and contraction calculations are not used for these pile extensions since these foundational structures are deemed as temporary and shall be removed.
Interim Scour Conditions for 2 foot square or round diameter piles at the East Construction Trestle Q2 Q5 Q10 Q50 Q100 Square Pier (ft) Scour hole depth 5.1 5.3 5.3 5.5 5.6 Scour hole diameter at intersection of streambed and square support (ft) 22.4 23.2 23.2 24 24.4
Round Pier(ft) Scour hole depth 4.6 4.80 4.80 4.80 4.80 Scour hole diameter at intersection of streambed and round support (ft) 20.4 21.2 21.2 21.2 21.2
The work trestles have the possibility of additional scaffolding and/or other appurtenances needed during construction. For modeling purposes we will assume the trestles block a percentage of the flow to show the effects on the water surface during construction. The trestles will include a 50 ft. gap to avoid mussel beds during construction.
INTERIM CONDITION Q Water
Surface Elevation
Average Velocity
Available Freeboard
Square pier no
blockage
Round pier no
blockage
Square pier 10% blockage
Round pier 10%
blockage** 2-Year Flood
91,000 cfs
33.30 ft
11.16 fps
0 5.1 4.6 5.4 4.80
5-Year Flood 123,000 cfs
36.41 ft
10.48 fps
0 5.3 4.80 5.4 4.80
10-Year Flood 151,000 cfs
38.42 ft
8.91 fps
0 5.3 4.80 5.5 4.80
** To assess scour depths associated with debris stacked against the East Construction Trestle, the interim condition model was run with 10% of the trestle opening closed off
Scour Depths of supports

State of California Smith River Bridge (Dr. Ernest Fine), Br. No. 01-0020 DEPARTMENT OF TRANSPORTATION 01-DN-101-PM 36.06 EA 01-43640 EFIS 01-0000-0193
“Caltrans improves mobility across California” - 14 -
Interim condition for the Detour Bridge based on a 4 foot diameter CIDH pile
Q Water Surface
Elevation ft
Average Velocity
ft/s
Estimated Available
Freeboard ft
Scour Depth CIDH Piles no blockage
ft
Scour Depth CIDH Piles 10%
blockage** ft
2-Year Flood 91,000 cfs 30.92 11.89 23.36 7.39 7.42
5-Year Flood 123,000 cfs 31.87 15.02 22.14 7.75 7.70
10-Year Flood 151,000 cfs 33.65 16.10 20.36 7.86 7.55
** To assess scour depths associated with debris stacked against the East Construction Trestle, the interim condition model was run with 10% of the trestle opening closed off If you have any questions or need further clarification please contact Ronald McGaugh at [email protected] or 916 730 6422

“Caltrans improves mobility across California”
- 15 -
APPENDICES Appendix A Tide Information Tidal influences were considered:
From this historic tide information shown above, assuming the highest anticipated tide condition at 14.35 ft. The slope of the channel from the bridge to the ocean is approximately 0.0006 The distance from the ocean to the bridge is approximately 8 miles. From those numbers it would seem that the tidal influence on the structure is a little over 0.5 ft. (assuming the channel was dry). For any tides less than about 13.8 ft. there will be no tidal effects. A sea level rise of 55 inches would be roughly equivalent to a 4.6 foot tidal wave, which is well below the highest tide elevation. Flow from tidal effects will be included in the flow frequencies used in this report.
Tidal influence Highest and Lowest Values Station: 9419750 Begin Date: 19500519 Name: Crescent City, CA End Date: 20071115 Product: High/Low Units: Feet Datum: STND Quality: Verified Rank Highest
Highest tide
Highest Date
time Lowest tide
Lowest Date
time
1 14.35 19830129 11:06 0.27 19910613 06:12 2 13.97 19830126 08:36 0.51 20030518 15:06 3 13.78 20051230 18:00 0.69 20010208 01:18 4 13.77 19830128 10:24 0.80 20030517 14:30 5 13.70 19780208 00:00 0.87 19910613 06:12 6 13.65 20060101 19:42 0.90 19790527 00:00 7 13.60 19780109 00:00 0.96 19901202 17:36 8 13.57 20051231 18:12 0.99 19910614 06:54 9 13.54 19830127 09:30 1.00 19740205 00:00 10 13.50 19730118 00:00 1.00 19741230 00:00

“Caltrans improves mobility across California”
- 16 -
Appendix B General Plans pg. 1

“Caltrans improves mobility across California”
- 17 -
Appendix B General Plans pg. 2

“Caltrans improves mobility across California” 18
Appendix C Possible Scenario General Plans Proposals for this structure include a detour to be built just upstream of the existing alignment using a modified extension of the existing piers for substr bridge. The replacement bridge and the detour bridge each has a proposed “construction” trestle platform to be built to support the construction of each In profile view looking downstream one possible construction scenario would look like below.

Appendix D Soils information for interim scour calculations
M e m o r a n d u m
Serious Drought. Help save water!
To: JIM M. PHILLIP, Project Engineer
District 3 -Marysville Design Branch S4 Date: July 7, 2016
File: 01-DN-101-PM 35.8/36.5
01-436400 {01 0000 0193) Dr. Fine Bridge Replacement
From: KRISTINE D. PEPPER, P.E.
North Region Capital Hydraulics District 1- Eureka
Subject: Sediment Distribution for the Smith River at State Route 101
This is a summary of the sampling and analysis of bed material to determine the size distribution at the state route 101 crossing of the Smith River in Del Norte County. The project proposes to replace the Smith River Bridge, AKA Dr. Fine Bridge (BR. No. 01-0020).
On June 28, 2016, Celeste Redner and myself (Kristine Pepper), visited the project site for the Dr. Fine Bridge replacement project. Due to the need for a noninvasive and an expedient method for determining the gradation of the streambed at the Dr. Fine Bridge, the Wolman Pebble Count technique was employed. Two samples sets were taken, one downstream (138 particles) and one upstream (118 particles) of the structure (Figure 1).
Figure 1: Bed material sample locations of the Smith River at the State Route 101 crossing
Provide a safe, sustainable, integrated and efficient transportation system to enhance California's economy and livability "
Provide a safe, sustainable, integrated and efficient transportation sys tem to enhance California 's economy and livability "
1
20%
01-DN-101-PM 35.8/36.5 July 7, 2016 Page 2
EA 01-436400
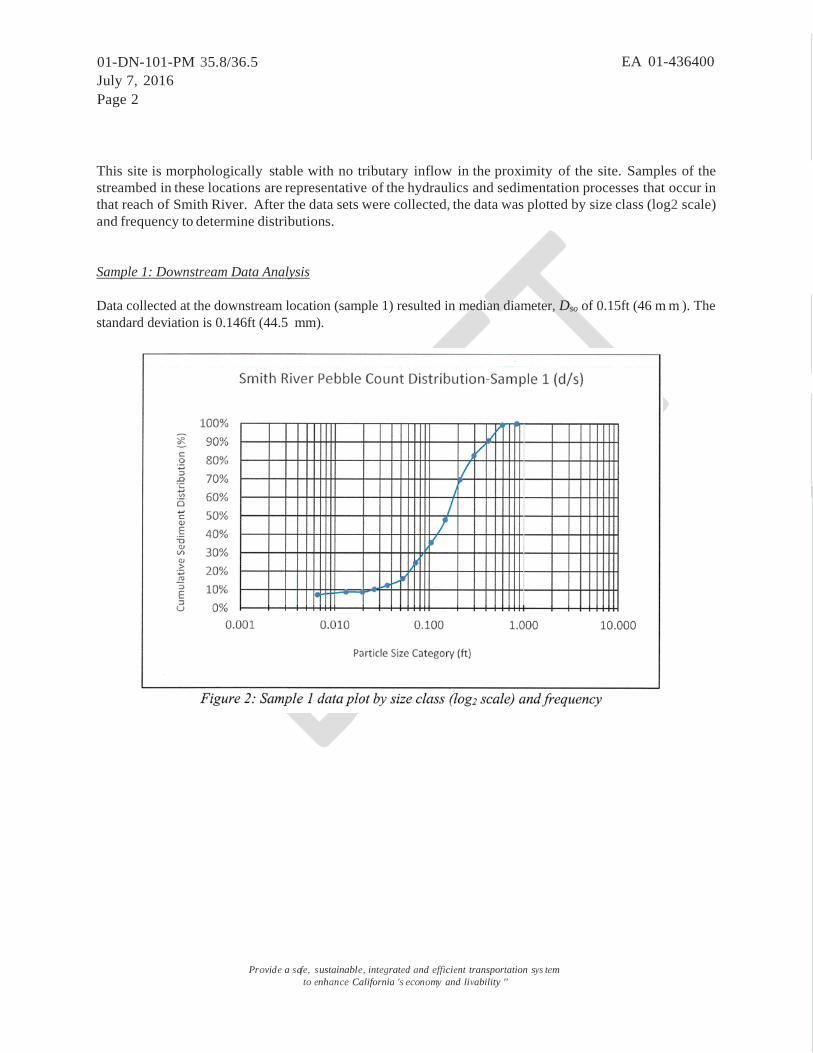
This site is morphologically stable with no tributary inflow in the proximity of the site. Samples of the streambed in these locations are representative of the hydraulics and sedimentation processes that occur in that reach of Smith River. After the data sets were collected, the data was plotted by size class (log2 scale) and frequency to determine distributions.
Sample 1: Downstream Data Analysis
Data collected at the downstream location (sample 1) resulted in median diameter, Dso of 0.15ft (46 m m ). The standard deviation is 0.146ft (44.5 mm).
.I /'
j / I
J I / ( _ ... .... -
Figure 2: Sample 1 data plot by size class (log2 scale) and frequency

Provide a safe, sustainable, integrated and efficient transportation sys tem to enhance California 's economy and livability "
River 2
category
01-DN-101-PM 35.8/36.5 July 7, 2016 Page 3
EA 01-436400
Figure 3: Photo of Smith River streambed in the vicinity of sample set 1: right bank downstream of Dr. Fine Bridge.
Sample 2: Upstream Data Analysis
Data collected at the upstream location (sample 2) resulted in median diameter, Dso of 0.11ft (34 mm). The standard deviation is O.134ft (41 mm).
/ r'
.7. J I r I/
4 Al
Figure 4: Sample 2 data plot by size class (log2 scale) and frequency
Provide a safe, sustainable, integrated and efficient transportation system to enhance California 's economy and livability"
01-DN-101-PM 35.8/36.5 July 7, 2016 Page 4
EA 01-436400
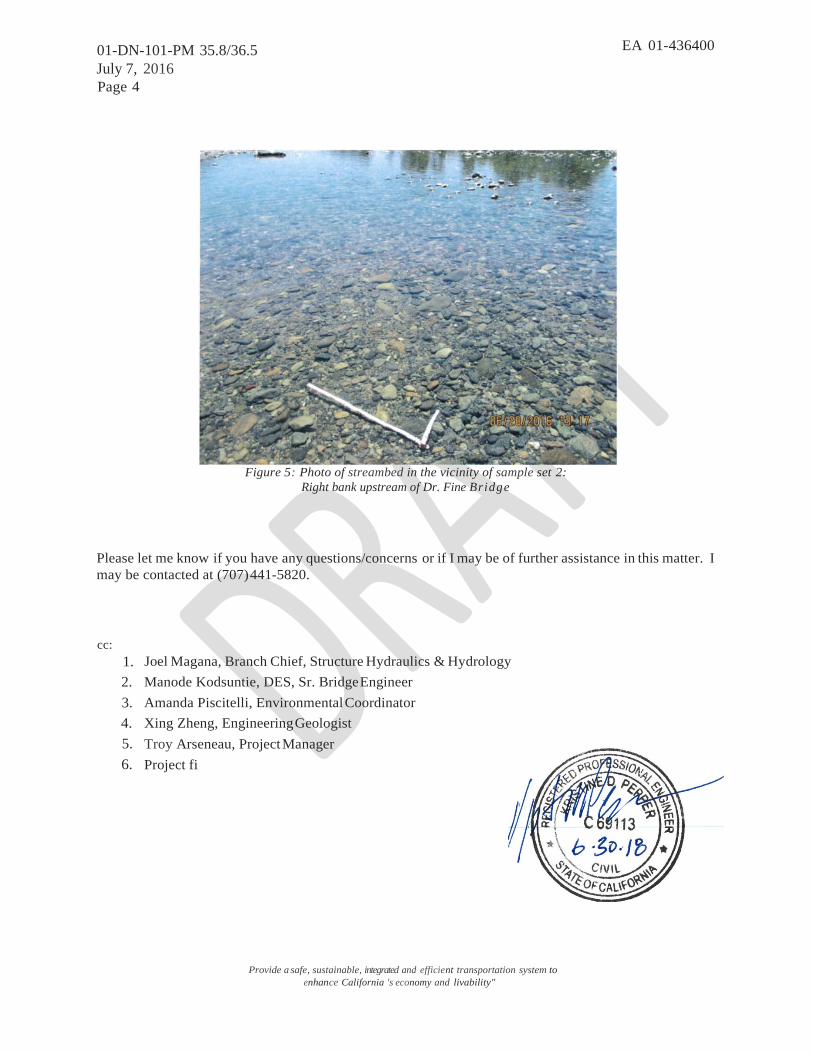
Figure 5: Photo of streambed in the vicinity of sample set 2: Right bank upstream of Dr. Fine Bridge
Please let me know if you have any questions/concerns or if I may be of further assistance in this matter. I may be contacted at (707) 441-5820.
cc: 1. 2. 3. 4. 5. 6.
Joel Magana, Branch Chief, Structure Hydraulics & Hydrology Manode Kodsuntie, DES, Sr. Bridge Engineer Amanda Piscitelli, Environmental Coordinator Xing Zheng, Engineering Geologist Troy Arseneau, Project Manager Project fi
“Caltrans improves mobility across California”
- 23 -
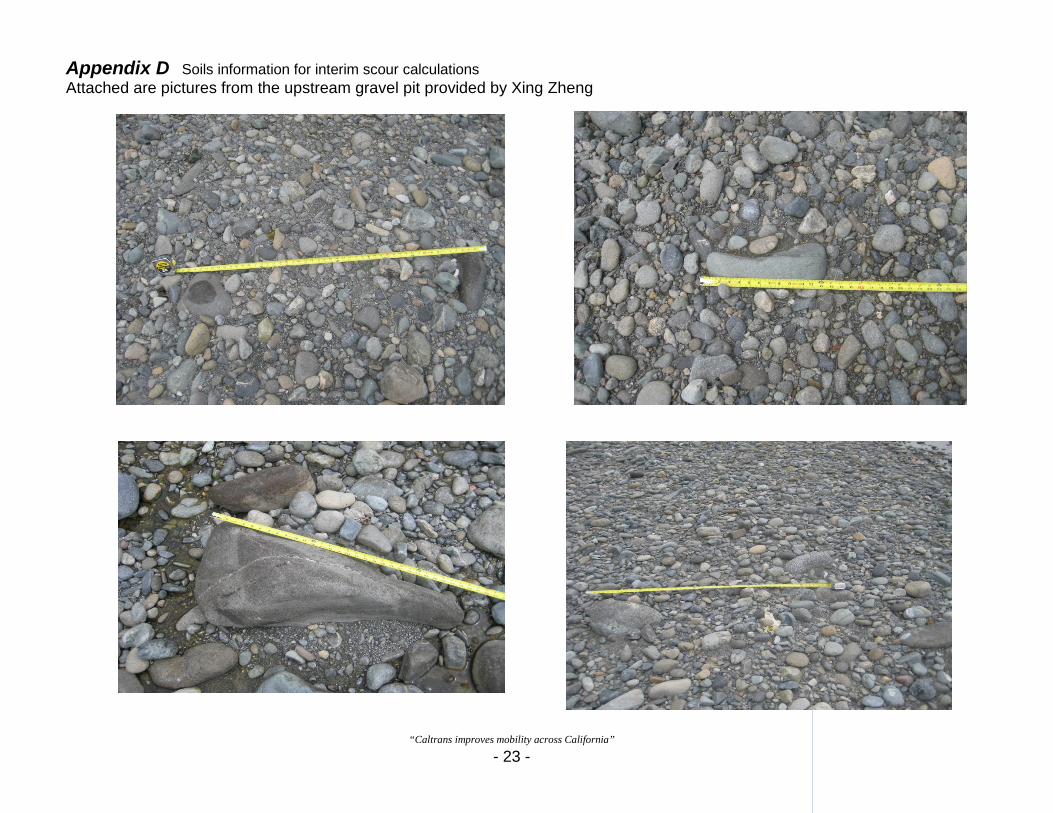
Appendix D Soils information for interim scour calculations Attached are pictures from the upstream gravel pit provided by Xing Zheng
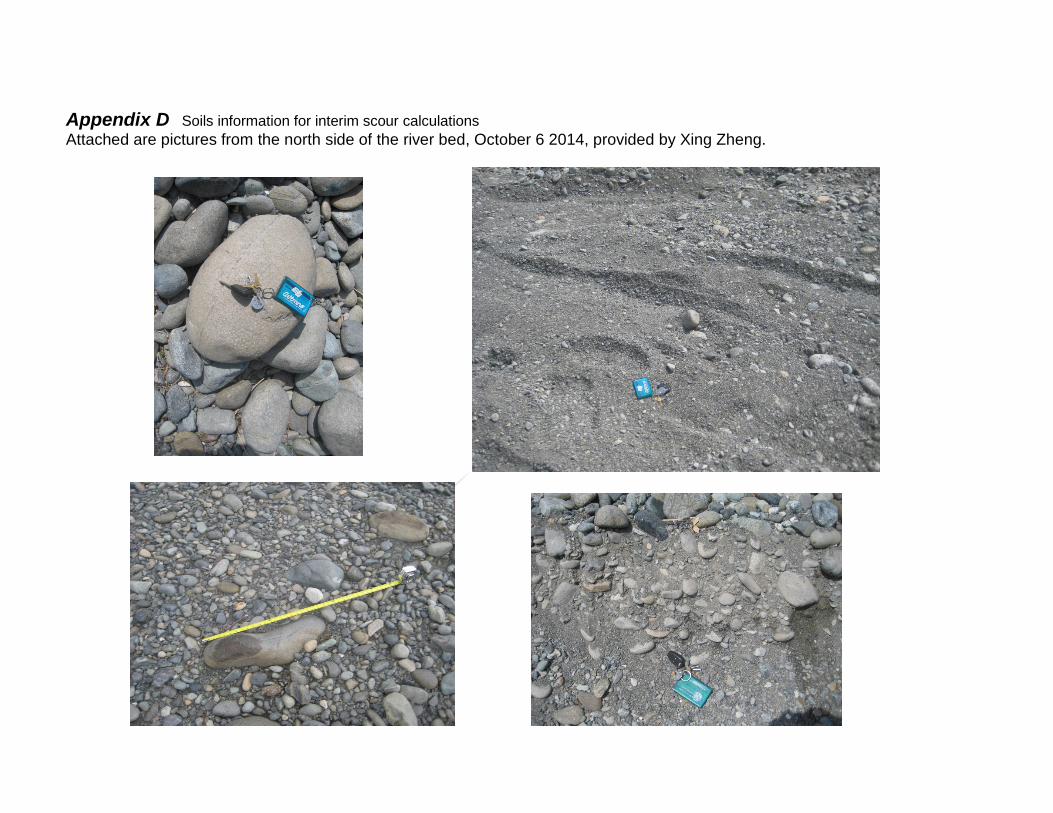
Appendix D Soils information for interim scour calculations Attached are pictures from the north side of the river bed, October 6 2014, provided by Xing Zheng.