structure of demersal fish assemblages based on trawl surveys in the continental shelf and upper...
TRANSCRIPT

Structure of demersal fish Structure of demersal fish assemblages based on trawl surveys assemblages based on trawl surveys
in the continental shelf and upper in the continental shelf and upper slope off Guinea Bissauslope off Guinea Bissau
P. Amorim1, S. S. Mané2 and K. A. Stobberup1
1 IPIMAR: Instituto de Investigação das Pescas e do Mar (Portugal)
2 CIPA: Centro de Investigação Pesqueira e Aplicada (Guiné-Bissau)
Presented at the Symposium on “Marine fisheries, ecosystems, and societies in West Africa: half a century of change”, 24-28 June 2002, Dakar, Senegal.

Ecosystem characteristics
- an extensive continental shelf (about 150 km)
- considered an important nursery area in the region
- strong influence due to seasonal upwelling and alternation between dry and wet seasons
- located at the southern limit of the Canary Current System and the western limit of the Gulf of Guinea causing important shifts in oceanographic conditions.
These characteristics are expected to affect the composition and abundance of the resources

OBJECTIVE
Study demersal fish assemblages in Guinea Bissau considering the effects of DEPTH,
ZONE and TIME in abundance and species composition.
DATA SOURCES
- 5 surveys
- between 1988 and 1995
- CIPA-IPIMAR

$
$
$$
$
$
$
$
$
$
$
$$$
$
$$$
$
$
$
$$
$ $
$
$
$$$
$$
$
$
$
Survey 1988

##
# ######
#######
#
####### ####
##
###
###
#### #
###
#
##
######
###
##
# ##
#######
#######
##
##
#
#
# # #
##
##
Survey 1989

#Y#Y #Y #Y#Y #Y #Y#Y#Y#Y#Y
#Y#Y#Y#Y
#Y#Y#Y#Y
#Y
#Y#Y#Y #Y#Y#Y#Y#Y#Y
#Y#Y#Y#Y#Y
#Y #Y#Y#Y#Y
#Y#Y#Y#Y #Y#Y #Y
#Y#Y#Y#Y
#Y#Y
#Y#Y#Y
#Y#Y#Y
#Y#Y#Y#Y#Y#Y #Y#Y#Y
#Y
#Y#Y #Y
#Y
#Y #Y#Y#Y
#Y#Y#Y#Y#Y#Y#Y#Y
#Y#Y#Y
#Y#Y
#Y #Y
#Y#Y#Y
#Y#Y
#Y
#Y#Y
#Y#Y
#Y
#Y
#Y
#Y#Y
Survey 1990

#³#³
#³
#³#³
#³#³
#³ #³ #³
#³#³#³
#³
#³
#³
#³#³#³
#³
#³
#³
#³#³#³
#³#³
#³#³#³
#³#³#³
Survey 1991

#0#0#0#0#0 #0#0#0#0#0#0#0#0#0#0#0
#0#0#0#0#0#0 #0#0#0#0#0
#0#0#0#0#0#0#0#0#0#0#0
#0#0#0#0#0#0#0#0#0#0
#0#0#0#0#0#0#0#0
#0#0 #0#0
#0#0#0#0#0#0#0
#0#0#0#0#0#0#0
#0#0
#0
Survey 1995

CIPA - IPIMAR Surveys CIPA - IPIMAR Surveys
Survey Shallow Mid Deep Shallow Mid Deep Total1988 5 1 - 18 7 4 351989 36 27 - 14 6 5 881990 29 21 - 24 24 7 1051991 7 3 1 9 11 2 331995 48 18 - 11 - - 77
125 70 1 76 48 18 338
North South
Different areas covered in different years
Survey periods varied between the months of March and June (transition between dry and wet season)
Depth of trawl stations ranged from 10 to 500 meters
The northern area and the shallow waters were better sampled
Rocky bottoms were not covered due to gear limitations
Fishing stationsFishing stations

Zeexln3.shp
Province.shpCape VerdeGambiaGuineaGuinea BissauMaliMauritaniaSenegalSierra LeoneWestern Sahara
Interfundo_zeegbshp.shpRocky bancsSand with shellSand fine/ very fineSand medium/ coarse grained Sand medium/ coarse grained + rocky zones Sand silt/ Silt sandySiltSilt+ rocky zones
10°00' 10°00'
10°30' 10°30'
11°00' 11°00'
11°30' 11°30'
12°00' 12°00'
18°00'
18°00'
17°30'
17°30'
17°00'
17°00'
16°30'
16°30'
16°00'
16°00'
15°30'
15°30'
15°00'
15°00'
Sediment types
Source: SIAP SIG project
Zone North
Bottom mainly consist in silt
sediments
Zone South
Bottom mainly consist in sandy
sediments

Factors defined for statistical analysis:Factors defined for statistical analysis:
- Time (survey years)
- Zone (corresponding to different sediment types)
- Depth 1. Shallow (<50 m) above thermocline
2. Mid (50-200 m)
3. Deep (>200 m) Shelf-slope transition
Total data:Total data:
- 316 fish species
- 338 trawl stations
- Catch weight (kg) standardized by half-hour.

ANALYSIS OF COVARIANCEANALYSIS OF COVARIANCE
Results indicate significant effects of Depth and Zone in the total catch
Catch versus Depth
-1
0
1
2
3
4
5
0 100 200 300 400 500 600
Depth (m)
Lo
g (
kg/3
0 m
in)
Fish catch increased with depth
- due to the possible effects of seasonal upwelling
- incidental high catches of deepwater species (ex: Chlorophthalmus agassizi)

North South
The factor Zone was significant: lower catches in the north
Only the survey of 1990 presented significantly higher catches. The differences in survey area for the different years does not appear to have an effect on the results obtained.
1 2 3 4 5
01
23
4
Trawl Catch by Survey
Log
(kg/
half
hour
)
Norte Sul
01
23
4Trawl Catch by Zone
Log
(kg/
half
hour
)

MULTIVARIATE ANALYSISMULTIVARIATE ANALYSIS
Study of demersal fish assemblages and the effects of Time, Depth and
Area
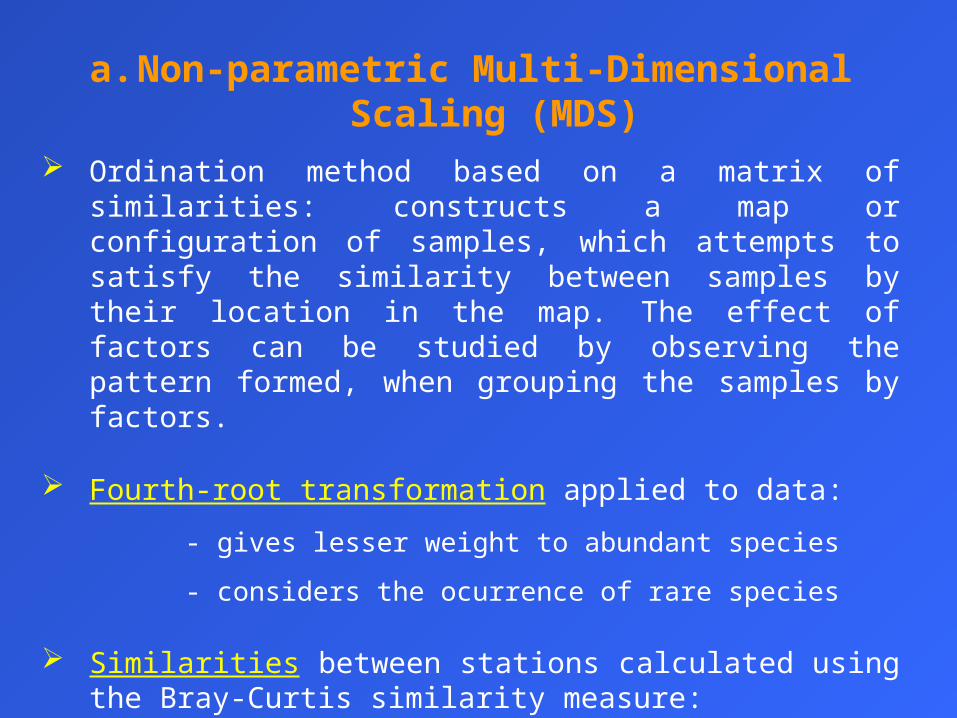
a. Non-parametric Multi-Dimensional Scaling (MDS)
Ordination method based on a matrix of similarities: constructs a map or configuration of samples, which attempts to satisfy the similarity between samples by their location in the map. The effect of factors can be studied by observing the pattern formed, when grouping the samples by factors.
Fourth-root transformation applied to data:
- gives lesser weight to abundant species
- considers the ocurrence of rare species
Similarities between stations calculated using the Bray-Curtis similarity measure:
- not sensitive to double zeros in the matrix data

Shallow
Mid
Deep
Stress: 0.15
North
South
Stress: 0.15
MDS plot for Zone and Depth effects
Depth
Zone
Clear groups are formed when
presenting the stations by Depth
and Zone
Low value of stress
Station relationships well represented, considering
the high number of stations

1988
1989
1990
1991
1995
Stress: 0.15
Time
MDS plot for Time effects
No pattern was found when stations were grouped by Time

South - Shallow
South - Mid
South - Deep
North - Shallow
North - Mid
North - Deep
Stress: 0.15
Zone + Depth
MDS plot for combined effects
A grouping of stations considering the combined effects of Zone and Depth show a
clear pattern of aggregation.

b. Determine whether the effects of Depth and Zone are significant (using the ANOSIM procedure)
ANOSIM is an non-parametric extension of ANOVA to test for the significant effects
A 2-way crossed test based on matrix of similarities was undertaken to test for the significant effects of Depth and Zone
Time factor was not considered based on the MDS results, which did not show any clear pattern.
The results obtained confirme that Depth and Zone produce
significant effects in demersal fish assemblages.
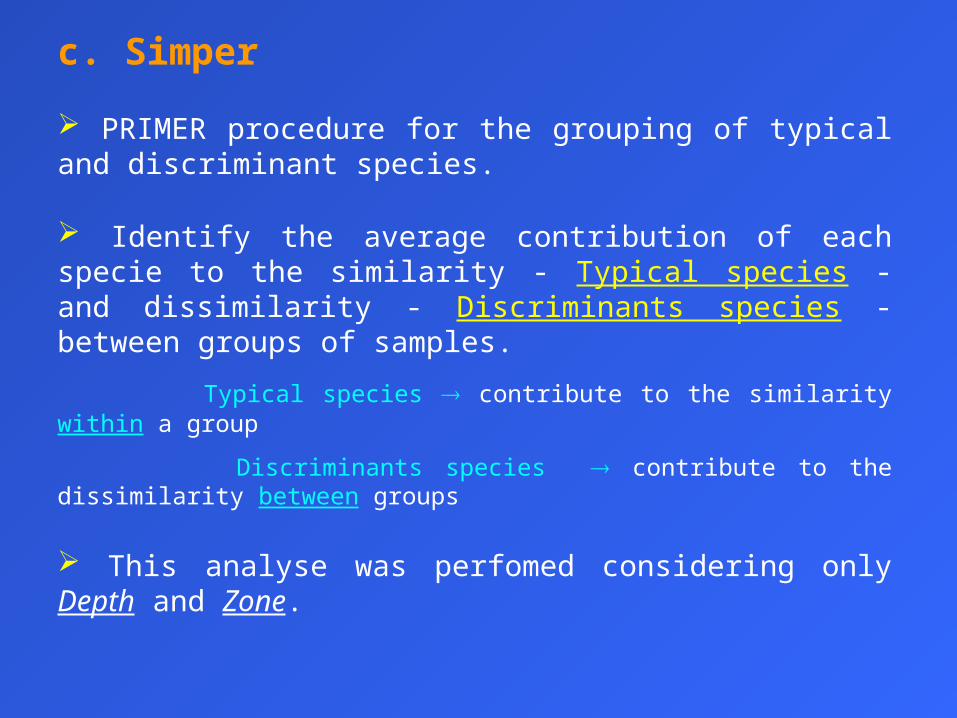
c. Simper
PRIMER procedure for the grouping of typical and discriminant species.
Identify the average contribution of each specie to the similarity - Typical species - and dissimilarity - Discriminants species - between groups of samples.
Typical species contribute to the similarity within a group
Discriminants species contribute to the dissimilarity between groups
This analyse was perfomed considering only Depth and Zone.

10°30' 10°30'
11°00' 11°00'
11°30' 11°30'
12°00' 12°00'
18°00'
18°00'
17°30'
17°30'
17°00'
17°00'
16°30'
16°30'
16°00'
16°00'
15°30'
15°30'
Syacium guineensisBothus podsTrachinocephalus myopsRaja miraletusChelidonichthys gabonensisPseudupeneus prayensisSolitas gruveliPagellus bellottii bellottiiDicologlossa hexophthalmaChilomycterus spinosus mauretanicusParaconger notialis
Chlorophthalmus agassiziSynagrops microlepisPterothrissus bellociPeristedion cataphractumAriomma melanumChascanopsetta lugubrisAriomma bondiSynagrops bellusBembrops heterurusMerluccius polli
Cynoglossus canariensisBrachydeuterus auritusGaleoides decadactylusPteroscion peliIlisha africanaPseudotolithus senegalensisTrichiurus lepturusCitharichthys stampfliiPseudotolithus typusCynoponticus feroxVanstraelenia chirophthalmus
Less than 2 samples in this group: it was
not possible determined the typical species
Typical speciesBrotula barbata Vanstraelenia chirophthalmus Citharus linguatula Lepidotrigla cadmani Trachurus trecae Brachydeuterus auritus Dentex angolensis Zeus faber Saurida brasiliensis Umbrina canariensis Dentex maroccanus Microchirus frechkopi Raja miraletus Leptocharias smithii
Raja miraletus Trachurus trecae Ariomma melanum Heteropriacanthus cruentatus Dentex congoensis Lepidotrigla cadmani Dentex angolensis Antigonia capros Pagellus bellottii bellottii Spicara alta Saurida brasiliensis Lepidotrigla carolae
Z eus faber Chelidonichthys gabonensis Citharus linguatula Solitas gruveli

Temperature Dissolved Oxygen Chlorophyll
decrease with depth
Similar values in both areas
Shallow water is characterised by higher values of temperature, chlorophyll and oxygen in contrast with Deeper
waters
Salinity little variation (surveys undertaken in a limited period of the year)
Depth factor Enviromental parameters
Oceanographic stations indicated:

Zone:
Clear separation of bottom type between the 2 zones
Different types of sediment
Different benthos communities
Different demersal fish assemblages
Diet preferences
Prey-predator relationships

CONCLUSIONS Results indicate important spatial structure (by depth and zone) in the Guinea-Bissau ecosystem, both in terms of total catches and fish assemblages.
There were no detectable time effects, but the period considered (1988-1995) is limited. Future studies should attempt to lengthen the time period in order to study temporal dynamics.
The various methods applied appear to be useful and complementary in studying the structure of demersal fish communities, considering spatial and temporal dynamics.