structure of gel phase dmpc determined by x-ray diffraction
TRANSCRIPT

Structure of Gel Phase DMPC Determined by X-Ray Diffraction
Stephanie Tristram-Nagle,* Yufeng Liu,† Justin Legleiter,‡ and John F. Nagle*†
*Department of Biological Sciences, †Department of Physics, ‡Department of Chemistry, Carnegie Mellon University,Pittsburgh, Pennsylvania 15213 USA
ABSTRACT The structure of fully hydrated gel phase dimyristoylphosphatidylcholine lipid bilayers was obtained at 10°C.Oriented lipid multilayers were used to obtain high signal-to-noise intensity data. The chain tilt angle and an estimate of themethylene electron density were obtained from wide angle reflections. The chain tilt angle is measured to be 32.3 � 0.6o nearfull hydration, and it does not change as the sample is mildly dehydrated from a repeat spacing of D � 59.9 Å to D � 56.5Å. Low angle diffraction peaks were obtained up to the tenth order for 17 samples with variable D and prepared by threedifferent methods with different geometries. In addition to the usual Fourier reconstructions of the electron density profiles,model electron density profiles were fit to all the low angle data simultaneously while constraining the model to include thewide-angle data and the measured lipid volume. Results are obtained for area/lipid (A � 47.2 � 0.5 Å2), the compressibilitymodulus (KA � 500 � 100 dyn/cm), various thicknesses, such as the hydrocarbon thickness (2DC � 30.3 � 0.2 Å), and thehead-to-head spacing (DHH � 40.1 � 0.1 Å).
INTRODUCTION
Because lipid bilayers form the underlying matrix of cellmembranes, it is desirable to measure their structural pa-rameters quantitatively. The hydrocarbon thickness of thebilayer is important for accommodation of transmembraneproteins (Lewis and Engelman, 1983; Veld et al., 1991;Lundbaek and Andersen, 1999) and for permeability ofsmall molecules (Paula et al., 1996; Huster et al., 1997;Olbrich et al., 2000). Obtaining the water spacing betweenadjacent bilayers is required for evaluating interactions be-tween membranes (Rand and Parsegian, 1989; McIntosh,2000; Nagle and Tristram-Nagle, 2000). The area/moleculeprovides a test and guide for simulations of lipid bilayers(Tobias et al., 1997; Tieleman et al., 1997; Feller et al.,1997; Venable et al., 2000).
Although most cell membranes in vivo exist in the fluidL� phase, the gel phase of lipid bilayers has biologicalinterest for specialized membranes such as stratum corneum(Bouwstra et al., 1992; Pilgram et al., 1999). In addition, gelphase structure has broader relevance because one methodfor obtaining fluid L� phase structure uses gel phase struc-ture as an essential stepping stone (McIntosh and Simon,1986a; Nagle et al., 1996). This method can be used for anyfluid phase lipid with the same headgroup, even if the fluidphase of the lipid in question does not have a gel phase(Tristram-Nagle et al., 1998; Petrache et al., 1998a; Nagleand Tristram-Nagle, 2000). Therefore, the best determina-tion of any gel phase bilayer structure of a phosphatidyl-choline lipid is of general interest.
DPPC (dipalmitoylphosphatidylcholine) is the most stud-ied gel phase structure. The pioneering work of Torbet and
Wilkins (1976) obtained 10 orders of diffraction for fullyhydrated multilamellar vesicles (i.e., MLV powder sample)as well as for less fully hydrated oriented samples. Theirelectron density profiles and their continuous Fourier trans-forms of the electron density were different for their ori-ented samples than for their fully hydrated powder sample.Their fully hydrated sample had a lamellar repeat spacingD � 64.0 Å, but all their oriented samples had D less than58.8 Å with no data within the gap from D � 64.0 Å to D �58.8 Å. Repeated observation of such gaps over the yearsled to the concept of the vapor pressure paradox (Rand andParsegian, 1989). However, full hydration of the orientedgel phase of DPPC from water vapor was accomplishedsome time ago (Katsaras et al., 1992; Tristram-Nagle et al.,1993), and this has now been accomplished for the fluidphase (Katsaras, 1998; Nagle and Katsaras, 1999;Lyatskaya et al., 2001). As the results in this article show forgel phase dimyristoylphosphatidylcholine (DMPC), theconsiderable osmotic pressure associated with a 5 Å differ-ence in D causes a decrease in chain tilt, thereby increasingthe hydrocarbon thickness. This changes the electron den-sity profile and the continuous transform, in agreement withthe results of Torbet and Wilkins (1976) for DPPC. How-ever, milder dehydration associated with less osmotic pres-sure reduces the chain tilt imperceptibly, as we show in thispaper. Therefore, it is now possible to obtain data in a rangeof D spacings from fully hydrated to 4 Å less than fullyhydrated in which the structure does not change measurablyand to obtain 10 orders of diffraction from oriented samples.The closest comparison is the study of McIntosh and Simon(1986b), which obtained five orders of diffraction for un-oriented samples of gel phase DPPC with D spacings from63.6 to 57.8 Å with the conclusion that changes in bilayerthickness were less than 1 Å. Having a range of D spacingsprovides many more data points that give a more accuratecontinuous Fourier transform. In this paper, we take advan-tage of this increase in the amount and quality of data by
Submitted March 19, 2002, and accepted for publication July 15, 2002.
Address reprint requests to John F. Nagle, Department of Physics, 5000Forbes Avenue, Carnegie Mellon University, Pittsburgh, PA 15213. Tel.:412-268-2764; Fax: 412-681-0648; E-mail: [email protected].
© 2002 by the Biophysical Society
0006-3495/02/12/3324/12 $2.00
3324 Biophysical Journal Volume 83 December 2002 3324–3335
developing a global analysis that uses all the data simulta-neously to determine the gel phase structure of DMPC.
MATERIALS AND METHODS
DMPC (1,2-dimyristoyl-sn-glycero-phosphatidylcholine) was purchasedfrom Avanti Polar Lipids (Alabaster, AL) in the lyophilized form and usedwithout further purification. Organic solvents were high-performance liq-uid chromatography grade from Aldrich (Milwaukee, WI).
Oriented sample preparation
Oriented samples were prepared using the “rock and roll” method (Tris-tram-Nagle et al., 1993) in which 5 or 10 mg of lipid is deposited onto aflat substrate (3 � 4 cm piece of freshly cleaved mica or glass microscopeslide) by evaporating from a chloroform:methanol mixture (2.5:1, v/v), orfrom a trifluoroethanol:chloroform mixture (2:1, v/v). This method ob-tained greater than 80% orientation according to a magic angle spinningNMR assay (K. Gawrisch, private communication). After drying for 1 dayin a glove box followed by 1 day on the laboratory bench and transferringto x-ray sample chambers, full hydration through the vapor was hastenedusing a Peltier element to cool the lipid film relative to the water vapor,thereby condensing water onto the lipid (Tristram-Nagle et al., 1993). Milddehydration in watertight chambers with high relative humidity was ef-fected by reversing the electrical leads to the Peltier cooler to maintain thesample slightly warmer than the water vapor in the chamber. The thicknessof the sample (required for the x-ray absorption correction) was estimatedby two different methods: 1) calculation using the lipid mass and substratearea covered and 2) atomic force microscopy (AFM).
AFM
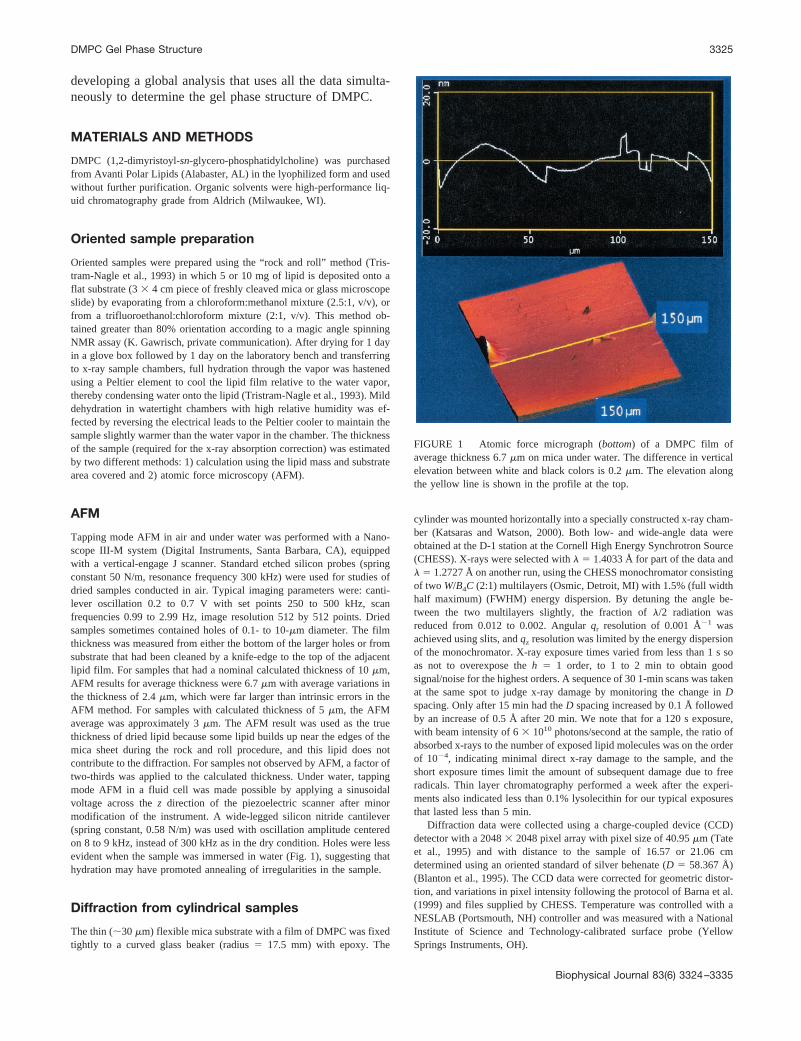
Tapping mode AFM in air and under water was performed with a Nano-scope III-M system (Digital Instruments, Santa Barbara, CA), equippedwith a vertical-engage J scanner. Standard etched silicon probes (springconstant 50 N/m, resonance frequency 300 kHz) were used for studies ofdried samples conducted in air. Typical imaging parameters were: canti-lever oscillation 0.2 to 0.7 V with set points 250 to 500 kHz, scanfrequencies 0.99 to 2.99 Hz, image resolution 512 by 512 points. Driedsamples sometimes contained holes of 0.1- to 10-�m diameter. The filmthickness was measured from either the bottom of the larger holes or fromsubstrate that had been cleaned by a knife-edge to the top of the adjacentlipid film. For samples that had a nominal calculated thickness of 10 �m,AFM results for average thickness were 6.7 �m with average variations inthe thickness of 2.4 �m, which were far larger than intrinsic errors in theAFM method. For samples with calculated thickness of 5 �m, the AFMaverage was approximately 3 �m. The AFM result was used as the truethickness of dried lipid because some lipid builds up near the edges of themica sheet during the rock and roll procedure, and this lipid does notcontribute to the diffraction. For samples not observed by AFM, a factor oftwo-thirds was applied to the calculated thickness. Under water, tappingmode AFM in a fluid cell was made possible by applying a sinusoidalvoltage across the z direction of the piezoelectric scanner after minormodification of the instrument. A wide-legged silicon nitride cantilever(spring constant, 0.58 N/m) was used with oscillation amplitude centeredon 8 to 9 kHz, instead of 300 kHz as in the dry condition. Holes were lessevident when the sample was immersed in water (Fig. 1), suggesting thathydration may have promoted annealing of irregularities in the sample.
Diffraction from cylindrical samples
The thin (�30 �m) flexible mica substrate with a film of DMPC was fixedtightly to a curved glass beaker (radius � 17.5 mm) with epoxy. The
cylinder was mounted horizontally into a specially constructed x-ray cham-ber (Katsaras and Watson, 2000). Both low- and wide-angle data wereobtained at the D-1 station at the Cornell High Energy Synchrotron Source(CHESS). X-rays were selected with � � 1.4033 Šfor part of the data and� � 1.2727 Šon another run, using the CHESS monochromator consistingof two W/B4C (2:1) multilayers (Osmic, Detroit, MI) with 1.5% (full widthhalf maximum) (FWHM) energy dispersion. By detuning the angle be-tween the two multilayers slightly, the fraction of �/2 radiation wasreduced from 0.012 to 0.002. Angular qr resolution of 0.001 �1 wasachieved using slits, and qz resolution was limited by the energy dispersionof the monochromator. X-ray exposure times varied from less than 1 s soas not to overexpose the h � 1 order, to 1 to 2 min to obtain goodsignal/noise for the highest orders. A sequence of 30 1-min scans was takenat the same spot to judge x-ray damage by monitoring the change in Dspacing. Only after 15 min had the D spacing increased by 0.1 Šfollowedby an increase of 0.5 Šafter 20 min. We note that for a 120 s exposure,with beam intensity of 6 � 1010 photons/second at the sample, the ratio ofabsorbed x-rays to the number of exposed lipid molecules was on the orderof 10�4, indicating minimal direct x-ray damage to the sample, and theshort exposure times limit the amount of subsequent damage due to freeradicals. Thin layer chromatography performed a week after the experi-ments also indicated less than 0.1% lysolecithin for our typical exposuresthat lasted less than 5 min.
Diffraction data were collected using a charge-coupled device (CCD)detector with a 2048 � 2048 pixel array with pixel size of 40.95 �m (Tateet al., 1995) and with distance to the sample of 16.57 or 21.06 cmdetermined using an oriented standard of silver behenate (D � 58.367 Å)(Blanton et al., 1995). The CCD data were corrected for geometric distor-tion, and variations in pixel intensity following the protocol of Barna et al.(1999) and files supplied by CHESS. Temperature was controlled with aNESLAB (Portsmouth, NH) controller and was measured with a NationalInstitute of Science and Technology-calibrated surface probe (YellowSprings Instruments, OH).
FIGURE 1 Atomic force micrograph (bottom) of a DMPC film ofaverage thickness 6.7 �m on mica under water. The difference in verticalelevation between white and black colors is 0.2 �m. The elevation alongthe yellow line is shown in the profile at the top.
DMPC Gel Phase Structure 3325
Biophysical Journal 83(6) 3324–3335
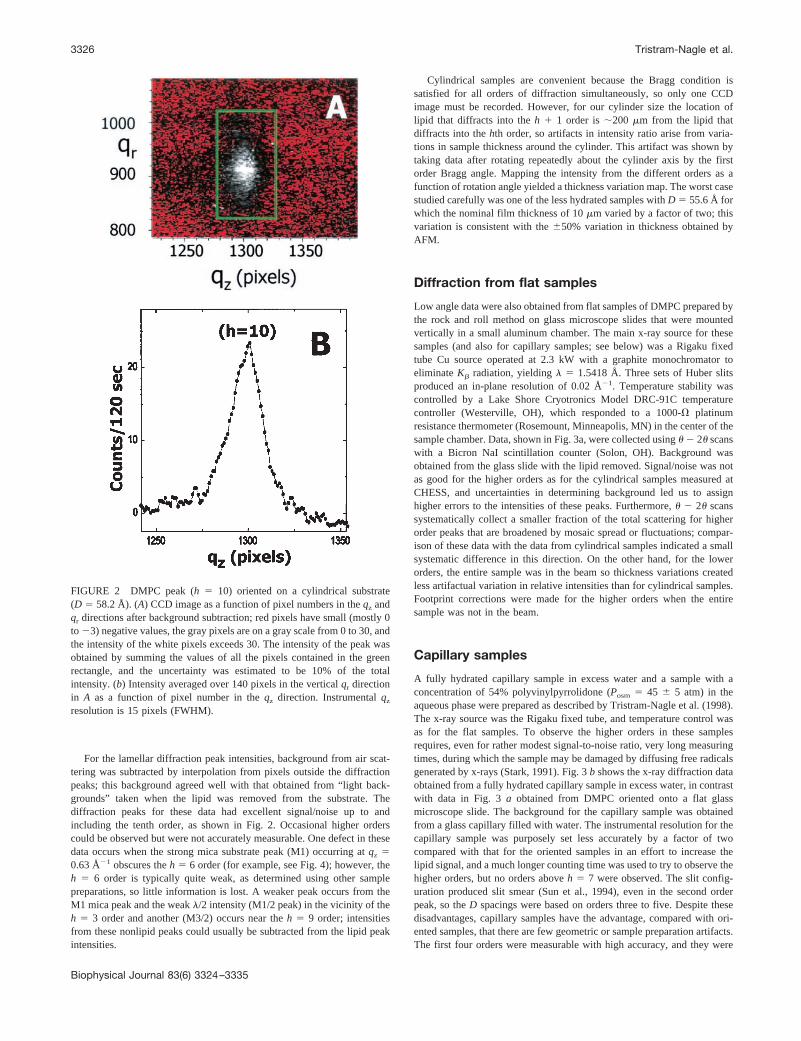
For the lamellar diffraction peak intensities, background from air scat-tering was subtracted by interpolation from pixels outside the diffractionpeaks; this background agreed well with that obtained from “light back-grounds” taken when the lipid was removed from the substrate. Thediffraction peaks for these data had excellent signal/noise up to andincluding the tenth order, as shown in Fig. 2. Occasional higher orderscould be observed but were not accurately measurable. One defect in thesedata occurs when the strong mica substrate peak (M1) occurring at qz �0.63 Å�1 obscures the h � 6 order (for example, see Fig. 4); however, theh � 6 order is typically quite weak, as determined using other samplepreparations, so little information is lost. A weaker peak occurs from theM1 mica peak and the weak �/2 intensity (M1/2 peak) in the vicinity of theh � 3 order and another (M3/2) occurs near the h � 9 order; intensitiesfrom these nonlipid peaks could usually be subtracted from the lipid peakintensities.
Cylindrical samples are convenient because the Bragg condition issatisfied for all orders of diffraction simultaneously, so only one CCDimage must be recorded. However, for our cylinder size the location oflipid that diffracts into the h � 1 order is �200 �m from the lipid thatdiffracts into the hth order, so artifacts in intensity ratio arise from varia-tions in sample thickness around the cylinder. This artifact was shown bytaking data after rotating repeatedly about the cylinder axis by the firstorder Bragg angle. Mapping the intensity from the different orders as afunction of rotation angle yielded a thickness variation map. The worst casestudied carefully was one of the less hydrated samples with D � 55.6 Å forwhich the nominal film thickness of 10 �m varied by a factor of two; thisvariation is consistent with the �50% variation in thickness obtained byAFM.
Diffraction from flat samples
Low angle data were also obtained from flat samples of DMPC prepared bythe rock and roll method on glass microscope slides that were mountedvertically in a small aluminum chamber. The main x-ray source for thesesamples (and also for capillary samples; see below) was a Rigaku fixedtube Cu source operated at 2.3 kW with a graphite monochromator toeliminate K� radiation, yielding � � 1.5418 Å. Three sets of Huber slitsproduced an in-plane resolution of 0.02 Å�1. Temperature stability wascontrolled by a Lake Shore Cryotronics Model DRC-91C temperaturecontroller (Westerville, OH), which responded to a 1000-� platinumresistance thermometer (Rosemount, Minneapolis, MN) in the center of thesample chamber. Data, shown in Fig. 3a, were collected using � � 2� scanswith a Bicron NaI scintillation counter (Solon, OH). Background wasobtained from the glass slide with the lipid removed. Signal/noise was notas good for the higher orders as for the cylindrical samples measured atCHESS, and uncertainties in determining background led us to assignhigher errors to the intensities of these peaks. Furthermore, � � 2� scanssystematically collect a smaller fraction of the total scattering for higherorder peaks that are broadened by mosaic spread or fluctuations; compar-ison of these data with the data from cylindrical samples indicated a smallsystematic difference in this direction. On the other hand, for the lowerorders, the entire sample was in the beam so thickness variations createdless artifactual variation in relative intensities than for cylindrical samples.Footprint corrections were made for the higher orders when the entiresample was not in the beam.
Capillary samples
A fully hydrated capillary sample in excess water and a sample with aconcentration of 54% polyvinylpyrrolidone (Posm � 45 � 5 atm) in theaqueous phase were prepared as described by Tristram-Nagle et al. (1998).The x-ray source was the Rigaku fixed tube, and temperature control wasas for the flat samples. To observe the higher orders in these samplesrequires, even for rather modest signal-to-noise ratio, very long measuringtimes, during which the sample may be damaged by diffusing free radicalsgenerated by x-rays (Stark, 1991). Fig. 3 b shows the x-ray diffraction dataobtained from a fully hydrated capillary sample in excess water, in contrastwith data in Fig. 3 a obtained from DMPC oriented onto a flat glassmicroscope slide. The background for the capillary sample was obtainedfrom a glass capillary filled with water. The instrumental resolution for thecapillary sample was purposely set less accurately by a factor of twocompared with that for the oriented samples in an effort to increase thelipid signal, and a much longer counting time was used to try to observe thehigher orders, but no orders above h � 7 were observed. The slit config-uration produced slit smear (Sun et al., 1994), even in the second orderpeak, so the D spacings were based on orders three to five. Despite thesedisadvantages, capillary samples have the advantage, compared with ori-ented samples, that there are few geometric or sample preparation artifacts.The first four orders were measurable with high accuracy, and they were
FIGURE 2 DMPC peak (h � 10) oriented on a cylindrical substrate(D � 58.2 Å). (A) CCD image as a function of pixel numbers in the qz andqr directions after background subtraction; red pixels have small (mostly 0to �3) negative values, the gray pixels are on a gray scale from 0 to 30, andthe intensity of the white pixels exceeds 30. The intensity of the peak wasobtained by summing the values of all the pixels contained in the greenrectangle, and the uncertainty was estimated to be 10% of the totalintensity. (b) Intensity averaged over 140 pixels in the vertical qr directionin A as a function of pixel number in the qz direction. Instrumental qz
resolution is 15 pixels (FWHM).
3326 Tristram-Nagle et al.
Biophysical Journal 83(6) 3324–3335

used with small errors in data fitting to help determine and confirm therelative intensities of orders one to four from oriented samples.
Absorption, lorentz, refraction, andreflectivity corrections
The absorption correction for flat samples of thickness t, absorption atten-uation length �, and for incidence angle � is
Abs�� � 1 � exp��y�/y (1)
in which y � 2t/�sin�. For cylindrical samples, the correction formula ofWiener and White (1991) was used. Our measured � � 1.0 mm for � �1.54 Å agrees well with the value calculated (using http://www-cxro.lbl.gov) for the other wavelengths used at CHESS; the calculation gives� � 1.5 mm for � � 1.40 Å and � � 2.2 mm for � � 1.27 Å.
The usual Lorentz correction factor of q was applied to intensities fromoriented samples, and a factor of q2 was applied to capillary samples.Finally, the absolute values of the form factors Fm(qh) are given by
(KmIm(qh))1/2 where the unknown scaling factor Km for each sample mtakes into account the relative x-ray intensities and the amount of sample.
Calculation (using http://www-cxro.lbl.gov) of the refraction of x-raysentering the lipid film from air obtains a shift in diffraction angle equiv-alent to an apparent decrease in D by 1 Å for h � 1. The correction is only�0.1 Å for h � 3 and becomes negligible for higher orders that wereprimarily used to obtain D. No intensity correction for reflectivity from thelipid/air interface was used because less than 10�4 of the x-rays werereflected even near the first Bragg order.
Wide angle data
The wide angle spacings d11 and d20 were obtained by measuring from thewide angle peaks to the beam position that was well determined on theCCD image by using a semitransparent beam stop. Intensity plots locatedthe center of the off-equator (11) peak. Although only the upper part of the(20) Bragg rod could be observed in the typical gel phase, it was quitenarrow (Fig. 4) and easily extrapolated to qz � 0 to yield an accurate valueof d20. Electron density �2 of the methylene region of the bilayer wascalculated using
�2�1.27 Å/8e � 1/Ac � 1 � �d11/2d202�1/2/�d20d11 (2)
in which 8e is the number of electrons per methylene and 1.27 Å is thelength/methylene group along an all-trans hydrocarbon chain. The areaperpendicular to a chain Ac is given by the standard formula for ortho-rhombic packing (Ruocco and Shipley, 1982; Tristram-Nagle et al., 1993).
FIGURE 3 Low angle lamellar x-ray intensity data of DMPC at 10 °C.(A) Oriented DMPC (3 �m) on a flat glass slide with D spacings as shownand from a glass slide with lipid removed (gray); exposure times 20 s/0.05°step. (B) Unoriented DMPC in a capillary with D � 59.9 Å (solid curve)and a water background (gray); exposure times were 250 s/0.05° step for2� � 8° and 1800 s/0.05° step for 2� 8° (counts scaled to 250 s/0.05°step).
FIGURE 4 CCD image (5-s exposure) obtained from a fully hydratedcylindrical sample (D � 59.9Å) with qz increasing in the vertical directionand qr increasing in the horizontal direction. The beam and some smallangle reflectivity are at the lower left, and the image of the semitransparentbeamstop is the light gray area. Low angle lamellar diffraction peaks arelabeled by order numbers h � 1 to 7. Orders 8 through 10 are not visibleusing the coarse gray scale necessary to visualize the lower orders. The firsttwo orders of mica reflection are denoted M1 and M2 and the weaker M3/2peak comes from the third order mica peak and �/2 x-rays. The wide anglepeak (20) and the peak (11) with one of its satellites (Sun et al., 1994) areshown on the right with a finer gray scale to visualize these weaker peaks.
DMPC Gel Phase Structure 3327
Biophysical Journal 83(6) 3324–3335
The chain tilt angle was also obtained using standard procedures (Levine,1973; Smith et al., 1988; Hentschel and Rusticelli, 1991; Tristram-Nagle et al., 1993). One modification arises from noting that forcylindrical samples the wide-angle scattering comes from bilayers thatare oriented over a range of angles between the bilayer normal and thebeam. Because scattering from the sample was cut off by the cylinderwhen 0 � � max � 2�z, we used average values of sin() and cos()in Eq. 5 in Tristram-Nagle et al. (1993). This increases the tilt angle byless than 0.3o compared with using � 0.
Global data analysis
Input data for the program include the corrected low angle lamellar relativeintensities Im(qh) located at qh for m different samples. The data were fit tothe 2G electron density model (Nagle and Wiener, 1989) that consists ofthe sum of 1) two positive Gaussians (i � 1, 2) to represent each of twoheadgroups (each Gaussian has three parameters, one for width Hi, one forintegrated size SHi, and one for location zHi), 2) a single negative Gaussianlocated at z � 0 for the four terminal methyl groups (two methyls for eachlipid in each monolayer) on the hydrocarbon chains (with two parameters,one for the width M and one for the integrated size defined as 2SM), and3) a function that extends from �D/2 to �D/2 that has two plateaus, onefor the known electron density of water �w and one for the electron densityof the methylene region with parameter �2; the plateau function has asmooth cosine bridge with center constrained to lie between the twoheadgroup Gaussians and with width constrained to the average width ofthe headgroup Gaussians.
Given values of the model parameters, it is routine to compute thecontinuous transform F(q) (Wiener et al., 1989). The nonlinear leastsquares fitting program uses simplex minimization to search for the bestvalues of the model parameters and the unknown scale factors Km for therelative x-ray intensities between different samples by minimizing
�2 � �h,m
��Fm�qh�2 � Im�qhKm2/hm2 � W, (3)
in which Im(qh) are the corrected intensity data, hm are the estimatedexperimental errors for each datum Im(qh)Km, and W is an additional term,described at the end of this subsection, that allows the model to account forother data in addition to the low angle intensities. Indeed, if there are noother data and W � 0, then there is a trivial solution that gives �2 � 0 bysetting Km � 0 � F(q).
Another important input datum is the volume VL � 1041 Å3 of theDMPC molecule at 10°C (Nagle and Wilkinson, 1978), which determinesthe product of the area/molecule A and the zero order form factor F(0)through the relation (Nagle and Wiener, 1989)
AF�0 � 2�nL � �wVL, (4)
in which nL � 374 is the number of electrons/DMPC and �W � 0.3342e/Å3
is the electron density of water at 10°C. Because the continuous transformis (Worthington et al., 1973)
F�q � ��D/2
D/2
���z � �wcos�2 qzdz, (5)
F(0) depends on all the parameters in the electron density model. The areaA is directly related to the wide angle data for the tilt angle �t, and themethylene electron density �2 by
A � 16e/�2�1.27Åcos �t�, (6)
in which 16e is the number of electrons in two methylenes, one on each ofthe two chains/lipid. The ratio r of terminal methyl volume V3 to methylenevolume V2 in the hydrocarbon chains is related (Nagle and Wiener, 1989)
to the parameter for the integrated size 2SM of the terminal methyl Gauss-ian, which represents a major feature in the electron density profile, by
r � �9e � ASM/2/8e, (7)
in which 9e and 8e are the number of electrons per CH3 and CH2,respectively. The volume of the hydrocarbon chains is
VC � 16e�n2 � r/�2, (8)
in which n2 is the number of methylenes/chain. The half-thickness of thehydrocarbon region is
DC � VC/A � �n2 � r�1.27 Åcos �t. (9)
The volume of the headgroup is
VH � VL � VC. (10)
Finally, the ratio SH2/SH1 of the integrated sizes of the outer to the innerheadgroup Gaussian will be defined as R.
The W function in Eq. 3 includes a sum over i penalty terms, each ofwhich has the form (wi � wi,set)
2/i2. The purpose of a penalty term for a
particular quantity wi is to force the model to take into account priorinformation, such as from wide angle data; smaller choices for i force thefitted model value of wi closer to the value wi,set. Any combination ofpenalty terms from the set [�2, �t, r, VH, A, DC, R] may be chosen, althoughsome subset combinations should not be chosen, such as [A, �2, �t] becauseA is already determined from �2 and �t by Eq. 6.
Relative electron density profiles were also routinely obtained by simpleFourier reconstruction
��z � �W � D�1F�0 � 2D�1 �h�1
hmax
Fhcos�2 hz
D � . (11)
RESULTS
Hydrocarbon chain features
Fig. 4 shows wide angle data in the context of an entireCCD image with the low angle data rising vertically nearthe left. The length of the (11) wide angle Bragg rods in theqz direction is consistent with the hydrocarbon chains inboth monolayers of the bilayer being tilted in the samedirection as was also observed for DPPC by Sun et al.(1994). Fig. 5 shows three qualitatively different wide anglepatterns that occur sequentially as DMPC is dehydrated,starting with the L�I phase at full hydration and ending withthe L�F phase at the lowest hydration level. Fig. 6 showsthat the tilt angle �t as a function of D changed very little asD first decreased from its fully hydrated value. The average�t for the three samples with largest D in Fig. 6 is 32.3o. Forthe four samples with open circles with 54.4 � D � 55.4,the average �t decreased to 31.3o. For smaller D, there is atransition to the L�L phase and then to the L�F phase inwhich �t decreased rapidly with decreasing D. The resultin Fig. 6 implies that the DMPC gel phase bilayer struc-ture is unlikely to change appreciably when D is greaterthan 56.5 Å.
From the wide angle data in the L�I phase in Fig. 6, theorthorhombic chain packing spacings were d20 � 4.25 Å
3328 Tristram-Nagle et al.
Biophysical Journal 83(6) 3324–3335

and d11 � 4.09 Å with no perceptible change with varyingD in the L�I phase. These spacings yield an electron densityin the methylene region �2 � 0.317 � .0015 e/Å3. This isvery close to the value obtained in much the same way forgel phase DPPC at 19°C (Tristram-Nagle et al., 1993).
The area/lipid is calculated using Eq. 6 with the resultA � 47.0 Å2 (column I in Table 1) for fully hydrated DMPCand A � 46.5 Å2 (column IV in Table 1) when 54.4 � D �55.4 Å. As indicated in Fig. 6, these smaller D spacings canbe obtained by applying an osmotic pressure p � 45 atm toMLV samples (Nagle and Katsaras, 1999). This decrease,�A � 0.5 Å2, upon applying osmotic pressure yields a resultfor the area compressibility modulus KA � 500 dyn/cmusing the defining equation (Rand and Parsegian, 1989;Nagle and Tristram-Nagle, 2000)
KA � 2nwVwP/�A (12)
in which nw is the number of waters/lipid when the osmoticstress P is applied. Also, the total volume of water in theunit cell is 2nwVw � DA � 2VL, which also gives the resultsshown in Table 1 for the number of waters/lipid nw.
Structure along bilayer normal
Some low angle data are shown in Figs. 2 to 4. Our globalanalysis obtains the phases (which are not assumed) and the
unknown scaling factors Km (see Wide Angle Data section)for each sample. Fig. 7 shows absolute scaled form factorsand a continuous Fourier transform produced by a fit whoseconstraints will be described below. The phases of the firstfive orders are clearly (� � � � �) typical of gel phases(Torbet and Wilkins, 1976; McIntosh and Simon, 1986b).The phase remains negative for h � 6 and h � 7. The smallh � 8 orders have a positive phase for most values of qz.The phases for h � 9 and h � 10 are negative. Thereasonableness of these phases is apparent when they are
FIGURE 6 Hydrocarbon chain tilt angle �t as a function of D spacing ofDMPC samples oriented on mica. Open circles denote the L�I phase andclosed circles the L�F phase. Arrow shows the D spacing of a DMPCcapillary sample under 45 � 5 atm osmotic pressure.
TABLE 1 Structural results*†‡
Quantities* I‡ II‡ III IV§
D 59.9¶ 59.9¶ 59.9¶ 55.6¶
�t 32.3¶ 32.3¶ 32.3¶ 31.3¶
�2 0.317¶ 0.314 0.325 0.317¶
A 47.0 47.5 45.9 46.5VH 331 319¶ 357 3372DC 30.2 30.4 29.8 30.3DHH 40.1 40.1 40.3 40.6DH1 5.0 4.9 5.2 5.2D�B 48.2 48.4 47.8 48.3D�W 11.7 11.5 12.1 7.3nW 12.3 12.8 11.2 8.4r 2.06 2.16 1.89 1.94�r
2 1.01 1.11 0.95 1.70
*Å based units are used.†R � 2.0 was constrained.‡Columns I and II show range of favored results for full hydration (rangeA).§Column IV used four samples with lower D spacings (range B).¶Value was constrained.
FIGURE 5 Wide angle x-ray diffraction data as in Fig. 4 showing thefully hydrated L�I gel phase, which converts to the L�L phase upon partialdehydration and then to the L�F phase upon further dehydration. Thedirection of chain tilting (�) is shown schematically below the data.
DMPC Gel Phase Structure 3329
Biophysical Journal 83(6) 3324–3335

used to calculate standard Fourier reconstructions (Eq. 11)of the electron density as shown in Fig. 8. The only phasethat could be changed and still obtain reasonable Fourierprofiles in Fig. 8 is the weak h � 8 order, but global fittingusing several different constraint combinations and differentcombinations of data sets favors the phases shown in Fig. 7.
The model results in Figs. 7 and 8 were obtained withconstraints for the values of �t and �2 obtained in the last
subsection. Constrained values and results of the fit areshown in column I of Table 1. Also, the ratio R � SH2/SH1
of sizes of the two headgroup peaks was set so that the innerheadgroup (i � 1) would emulate the carbonyls, and theouter headgroup (i � 2) would emulate the phosphatidyl-choline. These two groups have by far the greatest electrondensity in excess of the electron density of water or hydro-carbons, and they should therefore be related to the twoGaussians in the headgroup region. The value of R � 2 wasobtained using the volumes of these component groupsobtained from simulations (Armen et al., 1998). It may alsobe noted that the phosphate group has much more excesselectron density than the choline group, so the outer Gauss-ian essentially emulates the phosphate. When this R con-straint was released, the value of R migrates to 1.1, but thereduced �2 of the fit is not improved much (�r
2 � 0.94) andnone of our conclusions is significantly altered. In particu-lar, the electron density profile remains similar, which in-dicates that the 2G model is over parametrized unless thephysical R constraint is used.
The fits of the model to the data with D spacing in rangeA shown in Fig. 7 and to the Fouriers (Eq. 11) in Fig. 8appear satisfactory, but both improve when the wide angleconstraint on �2 is removed. The results of this fit are listedin column III of Table 1, which shows that the value of �r
2
decreases. Also, �2 increases, and this makes the modelelectron density profile agree even better with the Fouriersin the methylene plateau region 5 � z � 12 Å than in Fig.8. Another fitting result, shown in column II of Table 1, ismotivated by a previous result for DPPC, which constrainsthe headgroup volume to VH � 319 Å3 (Sun et al., 1994).This fit has a higher �r
2, and it matches more poorly with theFouriers in the methylene plateau region. A fit to four
FIGURE 8 Electron density profile obtained from the fit in Fig. 7(broad gray curve) and by Fourier reconstruction (narrow black curves) forseveral D spacings in range A with 10 measured orders of diffraction. TheFourier phases are those in Fig. 7. By using the scaling factors Km obtainedfrom the model, the Fourier profiles are placed on an absolute scale.
FIGURE 7 Symbols show absolute formfactors for 13 samples with 56.4 � D � 60.0Å (range A), and the solid line shows thecontinuous Fourier transform obtained as de-scribed for column I of Table 1. The shape ofthe symbol indicates the type of sample andthe different colors distinguish different sam-ples of the same type. The regions of thedifferent orders h are indicated by the numbers1 to 10, and the signs of the form factors areindicated by � for each lobe of the transform.Some samples have missing orders as ex-plained in Materials and Methods.
3330 Tristram-Nagle et al.
Biophysical Journal 83(6) 3324–3335

partially dehydrated samples with 55.3 � D � 55.8 Å(range B) is reported in column IV in Table 1; this range ofD is close to the range for the partially dehydrated wide-angle data in Fig. 6. A comparison of the electron densityprofiles obtained from the four fits in Table 1 is shown inFig. 9. The full widths at half maximum are �4.7 Å for themethyl trough, 5.1 Å for the outer phosphate Gaussian, and3.9 Å for the inner carbonyl Gaussian with variations oforder 0.1 Å among the different fits.
A fit was also performed that used only one Gaussian inthe headgroup region along with the other constraints incolumn I of Table 1. Forcing one symmetric headgroupGaussian to represent an obviously asymmetric headgroupgives a poor fit to the higher orders as shown in Fig. 10 witha �r
2 � 3.56. It also shifts the location of the maximum inthe headgroup electron density to smaller values by 1.0 Å,as shown in Fig. 9.
In addition to the quantities defined previously, Table 1includes the steric bilayer thickness DB�, which is estimatedby adding 9 Å for each headgroup (Nagle and Tristram-Nagle, 2000) to the hydrocarbon thickness 2DC. As shownin Fig. 9, this definition of D�B corresponds to the position atwhich the headgroup electron density has decayed to within10% of the electron density of bulk water. The steric waterspacing is obtained from D�W � D � D�B. We emphasize thatthis thickness is not the Luzzati thickness DB that is oftenreported and that does not correspond to any physical thick-
ness (Nagle and Tristram-Nagle, 2000). This difference indefinitions accounts for much of the difference between thethickness of DB � 42.5 Å reported by Janiak et al. (1976)and our DB� values in Table 1. From column I we calculateDB � 44.2 Å, and this smaller remaining difference withJaniak et al. (1976) is due to their use of the gravimetricx-ray method, which generally yields larger values of A and�t because it overestimates the amount of water between thebilayers (Nagle and Tristram-Nagle, 2000). Table 1 alsoincludes a measure of the distance between the phosphategroup and the hydrocarbon region, namely, DH1 � (DHH/2) � DC, in which DHH/2 is the position of the maximum inthe electron density profile. Another measure not shown inTable 1 uses the position of the Gaussian representing thephosphate group instead of DHH; this is slightly larger thanDH1 by 0.1 � 0.2 Å.
DISCUSSION
There is more structural information available for gel phasesthan for fluid L� phases, not only because there are moreorders of low angle lamellar reflections but because theordered chain packing gives wide angle diffraction fromwhich the chain tilt �t and the lateral chain packing (meth-ylene electron density �2) are obtained. The new valuesobtained for fully hydrated DMPC gel phase agree very wellwith the extrapolation of results obtained from a study ofphosphatidylcholines with chain lengths greater than 14
FIGURE 9 Comparison of absolute electron density profiles for the fitsin columns I to IV in Table 1. Solid vertical lines show various bilayerthicknesses for column I. The dotted vertical line shows a larger DHH/2 forthe fit in column IV for partially dehydrated samples (range B). Theelectron density for a 1G model fit to fully hydrated data in range A isshown as a broad gray curve.
FIGURE 10 Continuous transform of the 1G model is shown by a broadgray curve. Continuous transform from Fig. 7 of fully hydrated model I inTable 1 is shown by a solid curve fit to the data points in range A shownby solid circles. Continuous transform of model IV in Table 1 is shown bya dashed curve fit to the partially dehydrated data in range B shown byopen circles.
DMPC Gel Phase Structure 3331
Biophysical Journal 83(6) 3324–3335

(Sun et al., 1996). The chain length trend from that studyshowed that decreasing chain length decreases �t and �2,and decreasing temperature increases �t and �2. Takingthese trends into account quantitatively predicts the resultsobtained in this paper (see Table 1) for �t to within 0.2o andfor �2 to within 0.003e/Å3. We might also note that wechose to study DMPC at T � 10°C because it is safelybelow the pretransition temperature of 13°C to 14°C into theripple phase (Nagle and Wilkinson, 1978), which has anunmistakably different diffraction pattern (Katsaras et al.,2000).
Unlike our previous studies of DPPC (Wiener et al.,1989; Tristram-Nagle et al., 1993; Sun et al., 1994), thispaper reports the effects of dehydration on the chain pack-ing of DMPC. We have taken data in two hydration ranges.Most of our data are in the range D � 56.5 Å, which we callrange A. The wide angle data in Fig. 6 suggest that there islittle change in bilayer structure in range A, and this con-clusion is supported by Fourier reconstructions in Fig. 8, soall the data in range A are appropriate for global fitting toobtain structure at full hydration for which D � 59.9 Å. Wealso have data in a narrow range 55.3 � D � 55.8 Å, whichwe call range B, which corresponds to an osmotic pressureof 45 atm or a relative humidity of 96.7%. Fig. 6 suggestslittle variation in �t within this narrow range. Our subse-quent global analysis suggests that the structure in range Bis different than in range A. This conclusion is confirmed bycomparing the structural results in columns I and IV, whichshow that DHH and DC increase with this small degree ofdehydration. Comparison of A for columns I and IV in Table1 for these two ranges yields the area compressibility KA �500 � 100 dyn/cm. If one compares A in column II withcolumn I in Table 1, one might suppose that the uncertaintyin KA is much larger because of the large uncertainty in �A,which is required to calculate KA using Eq. 12. However,the uncertainty in A between columns I and II includes theuncertainty in �2; because �2 does not vary experimentallywith this mild dehydration, the uncertainty in �A onlyincludes the uncertainty in �t as well as the uncertainty innw, which is also used to calculate KA using Eq. 12.
Our value of KA for gel phase DMPC may be comparedwith a value of 855 dyn/cm (Evans and Needham, 1987) forwhich the accuracy was limited by low temperature anddifficulties using the aspiration pipette method for gelphases. A much more accurate value of KA � 234 � 23dyn/cm was obtained for the fluid L� phase of DMPC(Rawicz et al., 2000). This is smaller than our gel phaseresult as one would expect. However, one might have ex-pected the gel phase to be more than a factor of two stifferthan the fluid phase, and this is likely to be true for bilayerscomposed of phosphatidylethanolamines that have no chaintilt because lateral compression would require forcing hy-drocarbon chains closer together against their strong repul-sive cores. Tilted chains offer a different degree of freedomto reduce their area A, namely, reduction of chain tilt while
maintaining the same distance between parallel chains. Ofcourse, the headgroups must still come closer together andthis is effected by the osmotic dehydration. Therefore, gelphase phosphatidylcholines remain moderately soft underlateral compression. This explanation conforms well to themodel used to explain the very small thermal area expan-sivity (Sun et al., 1996) and the chain length dependence ofA (Tristram-Nagle et al., 1993).
It may be of some interest to speculate on how this smallvalue of KA relates to the bending modulus Kc. It is gener-ally accepted that the bending modulus Kc is related to thearea modulus KA by a formula of the form Kc �KA(2DC)2/N. In a recent advance in the theory that involvedconsideration of a polymer brush model, Rawicz et al.(2000) derived N � 24, and their data showed that thisworks well for many fluid phase lipids that do not have ahigh degree of unsaturation. Using N � 24 and our valuesof KA and DC yields Kc � 1.9 � 10�12 erg. However, wesuggest that the observation of a fairly sharp h � 10 dif-fraction peak (Fig. 2) requires a larger value of Kc for gelphase DMPC. Our suggestion is based on using this putativeKc value to calculate the Caille fluctuation parameter for thehth order �h � h2 kBT/[2D2(BKc)
1/2] (Nagle and Tristram-Nagle, 2000); we estimate the interaction bulk modulus B �1014 erg/cm4 from Petrache et al. (1998b) when the sepa-ration between bilayers is taken to be the same as for thefully hydrated gel phase in Table 1. This gives �10 � 1.3and such a large value of � would give a broader h � 10peak (Lyatskaya et al., 2001) than we observe in Fig. 2 B.Because the polymer brush analogy would not be expectedto apply to gel phase lipids, it may be better to revert tosimple elasticity theory that predicts N � 12 under theassumptions that 1) the monolayers in the bilayer do not sliprelative to each other and 2) the lateral force required tocompress the bilayer is the same at all distances z from thecenter of the bilayer. Assumption 1 is supported by ourresult for the length of the wide angle arcs that impliesregistry of the hydrocarbon chains between monolayers.However, if the headgroups are much less compressiblethan the chains, then the breakdown of assumption 2 yieldsN � 4 and Kc � 11 � 10�12 erg. Therefore, it seemspossible to reconcile our small value of KA with the lack ofsignificant broadening of the tenth order diffraction peak.This suggestion is consistent with the view that bendingfluctuations are largely suppressed in gel phases (McIntoshand Simon, 1993).
The sequence of structural phases we observe in Fig. 5 isthe same as those observed for temperatures above 15°C bySmith et al. (1990) in their pioneering study that mapped outa phase diagram for the various gel subphases. However,they did not report data at lower temperatures, and theywere unable to achieve fully hydrated D spacings. Theirextrapolated phase diagram implied that L�F is the fullyhydrated DMPC gel phase below T � 13°C. In contrast, ourdata show that L�I is the fully hydrated DMPC gel phase at
3332 Tristram-Nagle et al.
Biophysical Journal 83(6) 3324–3335

10°C; this is also the stable gel phase for fully hydratedDPPC. Smith et al. (1990) also reported �t � 30.0° at T �23.5°C. Our �t � 31.3° for our comparably dehydrated Dspacings in range B at 10°C is in excellent agreement withtheir result when adjustment is made for the temperaturedependence of the tilt angle d�t/dT � �0.1° obtained bySun et al. (1996).
Our most significant result for �t shown in Fig. 6 and for�2 is that they do not change appreciably with dehydrationuntil D is smaller than 56.5 Å. Therefore, A and the hydro-carbon core do not change from full hydration. Also, be-cause the steric thickness of the bilayer is only approxi-mately DB� � 48 Å (Table 1), the headgroups are still wellsolvated even down to D � 55.6 Å in range B, so they arelikely to have the same conformations. Our result that thephosphate/hydrocarbon distance DH1 changes very little be-tween columns I and IV of Table 1 is consistent with havingeven less variation in headgroup conformation within eachrange of D. Therefore, changes in bilayer structure for D 56.5 Å would seem to be negligible because neither thehydrocarbon region nor the headgroup region appears to bechanging. Accordingly, we have developed a global analy-sis that uses data throughout range A, close to and includingfull hydration. This provides much more low angle data thanour previous low angle analysis for gel phase DPPC (Wie-ner et al., 1989).
Let us make one more comparison of results from rangeB and range A. Fig. 9 also shows a small, but definite, shiftin the electron density profile. From five orders of diffrac-tion, McIntosh and Simon (1986b) concluded that changesin DHH were less than 1 Å for changes in osmotic pressurefrom 0 to 50 atm, which is consistent with our difference of0.5 Å based on 10 orders of diffraction. In agreement withMcIntosh and Simon, these differences correspond to arather small change in the continuous transforms as shownin Fig. 10. These differences are much smaller than thedifferences in the continuous transforms of DPPC obtainedby Torbet and Wilkins (1976). This is consistent with theiroriented samples being more dried out with shrinkages in Dat least 5.2 Å compared with our average shrinkage of 4.3 Åin range B. Fig. 6 shows that DMPC tilt angle �t begins tochange quite rapidly with D when the shrinkage exceeds 5Å. Fluid phase structure begins to change rapidly when nW
becomes smaller than 11 to 13 (Hristova and White, 1998),which is the number of waters required to complete theinner hydration shell (Perera et al., 1997; Mashl et al.,2001). Table 1 suggests that gel phase structure begins tochange significantly when nw � 9; this limiting nw foreffective fully hydrated structure should be smaller than forthe fluid phase limit because less water is required betweenthe headgroups because A is smaller.
Although the results of the fits shown in Figs. 7 and 8appear to be reasonable, there is a small conflict between thewide angle result for �2 and the low angle data. This isindicated by the lower �r
2 when the fit is not constrained by
the wide angle value �2 � 0.317e/Å3 (compare column Iand column III in Table 1). It is also indicated by betteragreement of the electron density of model III and theFouriers in the methylene region; Fig. 8 shows that themethylene plateau value of model I is slightly below that ofthe Fourier levels. A similar conflict was noted for DPPC byWiener et al. (1989), but then there were so few low angledata compared with the number of model parameters that itwas concluded that the low angle data were incapable ofproviding independent estimates of �2. A more refinedanalysis of DPPC (Sun et al., 1994) that incorporated twosatellite peaks (one is shown in Fig. 4) revealed that the d11
spacing is not necessarily obtained from the location ofgreatest intensity in the (11) peak. That analysis obtainedthe same value of �t � 32° for DPPC that Tristram-Nagle etal. (1993) obtained by the more straightforward analysisalso used in this article. However, again for DPPC, themethod of Sun et al. (1994) yielded a smaller value of �2
and a correspondingly larger A � 47.9 Å2, compared withA � 47.2 Å2 that was obtained by the conventional method(Tristram-Nagle et al., 1993) used in the Results section ofthis article. The smaller �2 then produced a smaller VH �319 Å3 (Sun et al., 1994) for DPPC. Because the areas andtilt angles are so similar in DPPC and DMPC, and becausethe same phosphatidylcholine headgroup is fully hydrated inboth systems, it is reasonable that the headgroup volume VH
is the same, and this is the constraint that is used in the fitreported in column II of Table 1. Unfortunately, this con-straint increases the �r
2 of the fit compared with columns Iand III, so it widens the conflict between wide angle andlow angle results. Fig. 9 emphasizes the effects that thewide-angle choices have on the electron density profiles.
One possible resolution of the conflict is that it may notbe the data but the functional form of the model that is atfault. Although Gaussians are undoubtedly the best simpleapproximation for the distribution of component groups incondensed matter systems such as bilayers, they would onlybe exact if the potential of mean force happens to beperfectly harmonic over the ranges of fluctuations repre-sented by the widths of the fitted Gaussians. Indeed, simu-lations of fluid phase bilayers (Feller et al., 1997; Armen etal., 1998) show that spatial distributions of many compo-nent groups are close to, although not quite, Gaussians, andthe largest deviation was the terminal methyl distribution. Arecent simulation of the gel phase of DPPC shows that theterminal methyls are quite well localized with the sn-1methyls centered at z � �0.6 Å and the sn-2 methylscentered at z � �2.7 Å (Venable et al., 2000). Perhaps thiskind of fine structure will be useful in future data analysis,but the smoothed electron density profile presented in theirFig. 4 suggests that the Gaussian trough used in this paperis a good first approximation.
We will not resolve this conflict in this paper. Instead, weconclude that the range of values represented by columns Ito III in Table 1 are all possible, depending upon how one
DMPC Gel Phase Structure 3333
Biophysical Journal 83(6) 3324–3335

weights the low angle data versus the wide angle data andwhich wide angle result one decides is most plausible. Weprefer the range between column I and II because we thinkthe wide angle �2 data should not be ignored. Before thisstudy, we preferred the wide angle results from Sun et al.(1994), which gives column II, but the larger �r
2 in theglobal low angle fits has reduced our confidence, so that wenow give equal weight to the straightforward result for �2
represented by column I.Although the heights of the headgroup peaks and the
depth of the methyl trough in Fig. 9 decrease for modelswith smaller �w � �2, some important results are robustlyindependent of these uncertainties in �2. For the fully hy-drated models I to III, there is very little difference in thedistance between the headgroup peaks in the electron den-sity profiles as seen by comparing DHH in Table 1. There arealso only minor differences in hydrocarbon thickness 2DC
(these are caused by small differences in r via Eq. 8). Thismeans that the value of �2 makes little difference in thequantity DH1 that represents the distance between the phos-phates and the hydrocarbon chain regions. The method ofobtaining fluid phase area structure using gel phase struc-ture as a stepping-stone assumes that DH1 is the same inboth phases. This assumption is supported by the goodagreement of the results shown in Table 1 with DH1 � 5.2Å from fluid phase simulations (Feller et al., 1997; see alsofigure 2 in Nagle and Tristram-Nagle, 2000). It is alsoencouraging that there is agreement with the value DH1 �5.0 Å for gel phase DPPC that can be obtained from Table3 of Wiener et al. (1989). However, it should be emphasizedthat the one Gaussian fit in Fig. 9 yields a much smallervalue of DH1 � 4.2 Å and an even smaller DH1 � 4.1 Åwhen only four orders of diffraction are used in the fit. Thisis easily understood from Fig. 9 because the single Gaussianattempts to compromise between the larger Gaussian thatrepresents the phosphate and the smaller Gaussian thatrepresents the carbonyls. This artifact must be taken intoaccount when analyzing fluid phase data, which generallyhave fewer orders due to suppression of higher orders byfluctuations (Zhang et al., 1994, 1996). Because fitting to atwo Gaussian model is then underdetermined, the oneGaussian model for both the gel and the fluid phase hasbeen used by Nagle et al. (1996). Now that we have moreconfidence in the electron density profile in the headgroupregion for the gel phase, another possibility emerges thatuses the gel phase electron density profile in the headgroupregion to constrain the fitting of fluid phase data. Con-straints would include R � 2 and the distance between thetwo headgroup peaks, while retaining the mean position ofthe headgroup and its width as fitting parameters. It istherefore anticipated that this DMPC gel phase structurewill be useful in obtaining better structures of many fluidphase bilayers with PC headgroups.
The authors thank John Katsaras of the Chalk River Laboratories (NationalResearch Council of Canada) for the use of the x-ray chamber that providesfull hydration of oriented samples from the vapor. We thank TomaszKowalewski of the Chemistry Department at Carnegie Mellon Universityfor use of his AFM facility and his advice. We thank Rich Pastor and RickVenable for interesting discussions and for sharing detailed probabilitydistribution functions that were calculated, but not published, in Venable etal. (2000). We acknowledge use of the CHESS facility (National ScienceFoundation Grant DMR-9311772) and thank all the CHESS staff, partic-ularly Ernie Fontes for much help with the D1 station. We thank CHESSdirector Sol Gruner and his associates Adam Finnefrock and Mark Tate forassistance and discussion regarding use of the CCD. This work wassupported by the National Institutes of Health Grant GM44976-11 and thePetroleum Research Foundation.
REFERENCES
Armen, R. S., O. D. Uitto, and S. E. Feller. 1998. Phospholipid componentvolumes: determination and application to bilayer structure calculations.Biophys. J. 75:734–744.
Barna, S. L., M. W. Tate, S. M. Gruner, and E. F. Eikenberry. 1999.Calibration procedures for charge-coupled device x-ray detectors. Rev.Sci. Instr. 70:2927–2934.
Blanton, T. N., T. C. Huang, H. Toraya, C. R. Hubbard, S. B. Robie, D.Louer, H. E. Gobel, G. Will, R. Gilles, and T. Raftery. 1995. JCPDS-international centre for diffraction data round robin study of silverbehenate. Powder Diffraction 10:91–95.
Bouwstra, J. A., M. A. Salomons-de Vries, J. A. van der Spek, and W.Bras. 1992. Structure of human stratum corneum as a function oftemperature and hydration: a wide angle x-ray diffraction study. Int.J. Pharmacol. 84:205–216.
Evans, E., and D. Needham. 1987. Physical properties of surfactant bilayermembranes: thermal transitions, elasticity, rigidity, cohesion, and col-loidal interactions. J. Phys. Chem. 91:4219–4228.
Feller, S. E., R. M. Venable, and R. W. Pastor. 1997. Computer simulationof a DPPC phospholipid bilayer: structural change as a function ofmolecular surface area. Langmuir. 13:6555–6561.
Hentschel, M. P., and F. Rusticelli. 1991. Structure of the ripple phase P��
in hydrated phosphatidylcholine multimembranes. Phys. Rev. Lett. 66:903–906.
Hristova, K., and S. H. White. 1998. Determination of the hydrocarboncore structure of fluid dioleoylphosphocholine (DOPC) bilayers by x-raydiffraction using specific bromination of the double-bonds: effect ofhydration. Biophys. J. 74:2419–2433.
Huster, D., A. J. Jin, K. Arnold, and K. Gawrisch. 1997. Water perme-ability of polyunsaturated lipid membranes measured by 17O NMR.Biophys. J. 73:855–864.
Janiak, M. J., D. M. Small, and G. G. Shipley. 1976. Nature of the thermalpretransition of synthetic phospholipids: dimyristoyl- and dipalmitoyl-lecithin. Biochemistry. 15:4574–4580.
Katsaras, J. 1998. Adsorbed to a rigid substrate, dimyristoylphosphatidyl-choline multibilayers attain full hydration in all mesophases. Biophys. J.75:2157–2162.
Katsaras, J., and M. J. Watson. 2000. Sample cell capable of 100% relativehumidity suitable for x-ray diffraction of aligned lipid multibilayers.Rev. Sci. Instrum. 71:1737–1739.
Katsaras, J., S. Tristram-Nagle, Y. Liu, R. L. Headrick, E. Fontes, P. C.Mason, and J. F. Nagle. 2000. Clarification of the ripple phase of lecithinbilayers using fully hydrated aligned samples. Phys. Rev. E. 61:5668–5677.
Katsaras, J., D. S.-C. Yang, and R. M. Epand. 1992. Fatty-acid chain tiltangles and direction in DPPC bilayers. Biophys. J. 63:1170–1175.
Levine, Y. K. 1973. X-ray diffraction studies of membranes. Prog. Surf.Sci. 3:279–352.
Lewis, B. A., and D. M. Engelman. 1983. Lipid bilayer thickness varieslinearly with acyl chain length in fluid phosphatidylcholine vesicles.J. Mol. Biol. 166:211–217.
3334 Tristram-Nagle et al.
Biophysical Journal 83(6) 3324–3335

Lundbaek, J. A., and O. S. Andersen. 1999. Spring constants for channel-induced lipid bilayer deformations: estimates using gramicidin channels.Biophys. J. 76:889–895.
Lyatskaya, Y., Y. Liu, S. Tristram-Nagle, J. Katsaras, and J. F. Nagle.2001. Method for obtaining structure and interactions from oriented lipidbilayers. Phys. Rev. E. 63:0119071–0119079.
Mashl, R. J., H. L. Scott, S. Subramaniam, and E. Jakobsson. 2001.Molecular simulation of dioleoylphosphatidylcholine lipid bilayers atdiffering levels of hydration. Biophys. J. 81:3005–3015.
McIntosh, T. J. 2000. Short-range interactions between lipid bilayersmeasured by x-ray diffraction. Curr. Opin. Struct. Biol. 10:481–485.
McIntosh, T. J., and S. A. Simon. 1986a. Area per molecule and distribu-tion of water in fully hydrated DLPE bilayers. Biochemistry. 25:4948–4952 and 8474.
McIntosh, T. J., and S. A. Simon. 1986b. Hydration force and bilayerdeformation: a reevaluation. Biochemistry. 25:4058–4066.
McIntosh, T. J., and S. A. Simon. 1993. Contributions of hydration andsteric entropic pressure to the interactions between phosphatidylcholinebilayers: experiments with the subgel phase. Biochemistry. 32:8374–8384.
Nagle, J. F., and J. Katsaras. 1999. Absence of a vestigial vapor pressureparadox. Phys. Rev. E. 59:7018–7024.
Nagle, J. F., and S. Tristram-Nagle. 2000. Structure of lipid bilayers.Biochim. Biophys. Acta. 1469:159–195.
Nagle, J. F., and M. C. Wiener. 1989. Relations for lipids bilayers:connection of electron density profiles to their structural quantities.Biophys. J. 64:1476–1481.
Nagle, J. F., and D. A. Wilkinson. 1978. Lecithin bilayers: density mea-surements and molecular interactions. Biophys. J. 23:159–175.
Nagle, J. F., R. Zhang, S. Tristram-Nagle, W-. S. Sun, H. I. Petrache, andR. M. Suter. 1996. X-ray structure determination of L�-phase DPPCbilayers. Biophys. J. 70:1419–1431.
Olbrich, K., W. Rawicz, D. Needham, and E. A. Evans. 2000. Waterpermeability and mechanical strength of polyunsaturated lipid bilayers.Biophys. J. 79:321–327.
Paula, S., A. G. Volkov, A. N. V. Hoek, T. H. Haines, and D. W. Deamer.1996. Permeation of protons, potassium ions, and small polar moleculesthrough phospholipid bilayers as a function of membrane thickness.Biophys. J. 70:339–348.
Perera, L., U. Essman, and M. L. Berkowitz. 1997. The role of water in thehydration force: molecular dynamics simulations. Progr. Colloid Poly-mer Sci. 103:107–115.
Petrache, H. I., N. Gouliaev, S. Tristram-Nagle, R. Zhang, R. M. Suter, andJ. F. Nagle. 1998b. Interbilayer interactions from high-resolution x-rayscattering. Phys. Rev. E. 57:7014–7024.
Petrache, H. I., S. Tristram-Nagle, and J. F. Nagle. 1998a. Fluid phasestructure of EPC and DMPC bilayers. Chem. Phys. Lipids. 95:83–94.
Pilgram, G. S. K., A. M. Engelsma-van Pelt, J. A. Bouwstra, and H. K.Koerten. 1999. Electron diffraction provides new information on humanstratum corneum lipid organization studied in relation to depth andtemperature. J. Invest. Dermatol. 113:403–409.
Rand, R. P., and V. A. Parsegian. 1989. Hydration forces between phos-pholipid bilayers. Biochim. Biophys. Acta. 988:351–376.
Rawicz, W., K. C. Olbrich, T. McIntosh, D. Needham, and E. Evans. 2000.Effect of chain length and unsaturation on elasticity of lipid bilayers.Biophys. J. 79:328–339.
Ruocco, M. J., and G. G. Shipley. 1982. Characterization of the subtran-sition of DPPC bilayers. Biochim. Biophys. Acta. 691:309–320.
Smith, G. S., E. B. Sirota, C. R. Safinya, and N. A. Clark. 1988. Structureof the L�-phase in DMPC. Phys. Rev. Lett. 60:813–816.
Smith, G. S., E. B. Sirota, C. R. Safinya, R. J. Plano, and N. A. Clark. 1990.X-ray structural studies of freely suspended ordered hydrated DMPCmultimembrane films. J. Chem. Phys. 92:4519–4529.
Stark, G. 1991. The effect of ionizing radiation on lipid membranes.Biochim. Biophys. Acta. 1071:103–122.
Sun, W.-J., R. M. Suter, M. A. Knewtson, C. R. Worthington, S. Tristram-Nagle, R. Zhang, and J. F. Nagle. 1994. Order and disorder in fullyhydrated unoriented bilayers of gel phase dipalmitoylphosphatidylcho-line. Phys. Rev. E. 49:4665–4676.
Sun, W.-J., S. Tristram-Nagle, R. M. Suter, and J. F. Nagle. 1996. Structureof gel phase saturated lecithin bilayers: temperature and chain lengthdependence. Biophys. J. 71:885–891.
Tate, M. W., E. F. Eikenberry, S. O. Barna, S. E. Wall, J. L. Lowrance, andS. M. Gruner. 1995. A large-format high-resolution area x-ray detectorbased on a fiber-optically bonded charge-coupled device (CCD). J. Appl.Crystogr. 28:196–205.
Tieleman, D. P., S. J. Marrink, and H. J. C. Berendsen. 1997. A computerperspective of membranes: molecular dynamics studies of lipid bilayersystems. Biochim. Biophys. Acta. 1331:235–270.
Tobias, D. J., K. Tu, and M. L. Klein. 1997. Atomic-scale moleculardynamics simulations of lipid membranes. Curr. Opin. Colloid InterfaceSci. 2:15–26.
Torbet, J., and M. H. F. Wilkins. 1976. X-ray diffraction studies of lecithinbilayers. J. Theor. Biol. 62:447–458.
Tristram-Nagle, S., H. I. Petrache, and J. F. Nagle. 1998. Structure andinteractions of fully hydrated dioleoylphosphatidylcholine bilayers. Bio-phys. J. 75:917–925.
Tristram-Nagle, S., R. Zhang, R. M. Suter, C. R. Worthington, W-J. Sun,and J. F. Nagle. 1993. Measurement of chain tilt angle in fully hydratedbilayers of gel phase lecithin. Biophys. J. 64:1097–1109.
Veld, G. I., A. J. M. Driessen, J. A. F. Op Den Kamp, and W. N. Konings.1991. Hydrophobic membrane thickness and lipid-protein interactions ofthe leucine transport system of Lactococcus lactis. Biochim. Biophys.Acta. 1065:203–212.
Venable, R. M., B. R. Brooks, and R. W. Pastor. 2000. Molecular dynamicssimulations of gel (L�I) phase lipid bilayers in constant pressure andconstant surface area ensembles. J. Chem. Phys. 112:4822–4832.
Wiener, M. C., R. M. Suter, and J. F. Nagle. 1989. Structure of the fullyhydrated gel phase of DPPC. Biophys. J. 55:315–325.
Wiener, M. C., and S. H. White. 1991. Transbilayer distribution of brominein fluid bilayers containing a specifically brominated analogue of DOPC.Biochemistry. 30:6997–7008.
Worthington, C. R., G. I. King, and T. J. McIntosh. 1973. Direct structuredetermination of multilayered membrane-type systems which containfluid layers. Biophys. J. 13:480–494.
Zhang, R., R. M. Suter, and J. F. Nagle. 1994. Theory of the structurefactor of lipid bilayers. Phys. Rev. E. 50:5047–5060.
Zhang, R., S. Tristram-Nagle, W. Sun, R. L. Headrick, T. C. Irving, R. M.Suter, and J. F. Nagle. 1996. Small-angle x-ray scattering from lipidbilayers is well described by modified Caille theory but not by paracrys-talline theory. Biophys. J. 70:349–357.
DMPC Gel Phase Structure 3335
Biophysical Journal 83(6) 3324–3335