structured growth of zinc oxide nanorods on …eprints.utem.edu.my/19044/1/structured growth...
TRANSCRIPT

STRUCTURED GROWTH OF ZINC OXIDE NANORODS ON PLASTIC OPTICAL FIBER AND LIGHT SIDE
COUPLING TOWARDS SENSING APPLICATIONS
HAZLI RAFIS BIN ABDUL RAHIM
FACULTY OF ENGINEERING UNIVERSITY OF MALAYA
KUALA LUMPUR
2017

STRUCTURED GROWTH OF ZINC OXIDE NANORODS ON PLASTIC OPTICAL FIBER AND
LIGHT SIDE COUPLING TOWARDS SENSING APPLICATIONS
HAZLI RAFIS BIN ABDUL RAHIM
THESIS SUBMITTED IN FULFILMENT OF THE
REQUIREMENTS FOR THE DEGREE OF DOCTOR OF PHILOSOPHY
FACULTY OF ENGINEERING UNIVERSITY OF MALAYA
KUALA LUMPUR
2017

ii
UNIVERSITY OF MALAYA
ORIGINAL LITERARY WORK DECLARATION
Name of Candidate: Hazli Rafis Bin Abdul Rahim (I.C No.: 811110-02-5401)
Registration/Matric No: KHA140007
Name of Degree: Doctor of Philosophy
Title of Thesis: Structured Growth of Zinc Oxide Nanorods on Plastic Optical Fiber and Light Side Coupling Towards Sensing Applications
Field of Study: Electronic (Engineering and Engineering Trades)
I do solemnly and sincerely declare that:
(1) I am the sole author/writer of this Work; (2) This Work is original; (3) Any use of any work in which copyright exists was done by way of fair dealing
and for permitted purposes and any excerpt or extract from, or reference to or reproduction of any copyright work has been disclosed expressly and sufficiently and the title of the Work and its authorship have been acknowledged in this Work;
(4) I do not have any actual knowledge nor do I ought reasonably to know that the making of this work constitutes an infringement of any copyright work;
(5) I hereby assign all and every rights in the copyright to this Work to the University of Malaya (“UM”), who henceforth shall be owner of the copyright in this Work and that any reproduction or use in any form or by any means whatsoever is prohibited without the written consent of UM having been first had and obtained;
(6) I am fully aware that if in the course of making this Work I have infringed any copyright whether intentionally or otherwise, I may be subject to legal action or any other action as may be determined by UM.
Candidate’s Signature Date:
Subscribed and solemnly declared before,
Witness’s Signature Date:
Name:
Designation:

iii
ABSTRACT
A simple and cost effective optical fiber sensor using side coupling of light into
the core modes of plastic optical fiber (POF) coated with zinc oxide (ZnO) nanorods is
reported here. Nanorods coating enhanced coupling inside the fiber by scattering light but
were also capable of causing leakage. Structuring the growth to specific regions allowed
scattering from different segments along the fiber to contribute to the total coupled power.
A uniform, densed and highly aligned spiral patterned ZnO nanorods were grown on the
POF using the hydrothermal method and its effect was investigated. ZnO nanorods
growth time of 12 h and temperature of 90 °C provided the best coupling voltage. Side
coupling was measured to be a factor of 2.2 times better for spiral patterned coatings as
opposed to unpatterned coatings. The formation of multiple segments was used for
multiple-wavelength channels excitation where different bands were side coupled from
different segments. It was found that visible white light source significantly coupled the
light into the POF compared with infrared laser sources. A first order theoretical model
was derived to simulate the impact of millimeter (mm) scale spiral patterns on coupling
efficiency by varying the width and spacing of the coated and uncoated regions. The width
of spiral patterned ZnO nanorod coatings on POF was optimized theoretically for light
side coupling and was found to be 5 mm. An experimental validation was performed to
complete the optimization and the experimental results showing a well correlation with
simulation. Optimized width of spiral patterned ZnO nanorods grown on large core POFs
was used for the purpose of temperature and multiple optical channel alcohol vapor
sensing. Spiral patterned ZnO nanorods coating exhibited a significant response to
temperature change from 20 ˚C to 100 ˚C based on extinction concept which is the
attenuation of light by scattering and absorption as it traverses the ZnO nanorods.
Sensitivity was measured to be a factor of 1.3 times better for spiral patterned coatings as
opposed to unpatterned coating. The multiple optical channel alcohol sensing mechanism

iv
utilized changes in the output signal due to adsorption of methanol, ethanol and
isopropanol vapors. Three spectral bands consisting of red (620-750 nm), green (495-
570 nm) and blue (450-495 nm) were applied in measurements. The range of relative
intensity modulation (RIM) was determined to be between 25 to 300 ppm. Methanol
presented the strongest response compared to ethanol and isopropanol in all three spectral
channels. With regard to alcohol detection RIM by spectral band, the green channel
demonstrated the highest RIM values followed by the blue and red channels respectively.
v
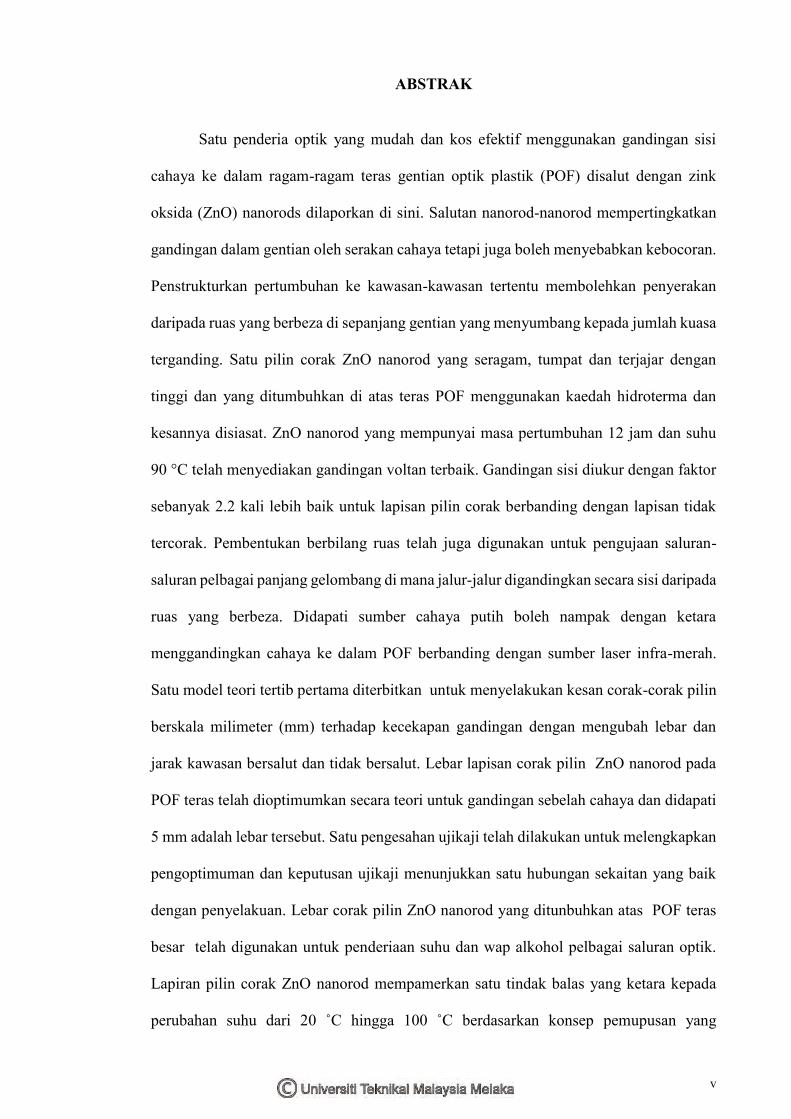
ABSTRAK
Satu penderia optik yang mudah dan kos efektif menggunakan gandingan sisi
cahaya ke dalam ragam-ragam teras gentian optik plastik (POF) disalut dengan zink
oksida (ZnO) nanorods dilaporkan di sini. Salutan nanorod-nanorod mempertingkatkan
gandingan dalam gentian oleh serakan cahaya tetapi juga boleh menyebabkan kebocoran.
Penstrukturkan pertumbuhan ke kawasan-kawasan tertentu membolehkan penyerakan
daripada ruas yang berbeza di sepanjang gentian yang menyumbang kepada jumlah kuasa
terganding. Satu pilin corak ZnO nanorod yang seragam, tumpat dan terjajar dengan
tinggi dan yang ditumbuhkan di atas teras POF menggunakan kaedah hidroterma dan
kesannya disiasat. ZnO nanorod yang mempunyai masa pertumbuhan 12 jam dan suhu
90 °C telah menyediakan gandingan voltan terbaik. Gandingan sisi diukur dengan faktor
sebanyak 2.2 kali lebih baik untuk lapisan pilin corak berbanding dengan lapisan tidak
tercorak. Pembentukan berbilang ruas telah juga digunakan untuk pengujaan saluran-
saluran pelbagai panjang gelombang di mana jalur-jalur digandingkan secara sisi daripada
ruas yang berbeza. Didapati sumber cahaya putih boleh nampak dengan ketara
menggandingkan cahaya ke dalam POF berbanding dengan sumber laser infra-merah.
Satu model teori tertib pertama diterbitkan untuk menyelakukan kesan corak-corak pilin
berskala milimeter (mm) terhadap kecekapan gandingan dengan mengubah lebar dan
jarak kawasan bersalut dan tidak bersalut. Lebar lapisan corak pilin ZnO nanorod pada
POF teras telah dioptimumkan secara teori untuk gandingan sebelah cahaya dan didapati
5 mm adalah lebar tersebut. Satu pengesahan ujikaji telah dilakukan untuk melengkapkan
pengoptimuman dan keputusan ujikaji menunjukkan satu hubungan sekaitan yang baik
dengan penyelakuan. Lebar corak pilin ZnO nanorod yang ditunbuhkan atas POF teras
besar telah digunakan untuk penderiaan suhu dan wap alkohol pelbagai saluran optik.
Lapiran pilin corak ZnO nanorod mempamerkan satu tindak balas yang ketara kepada
perubahan suhu dari 20 ˚C hingga 100 ˚C berdasarkan konsep pemupusan yang
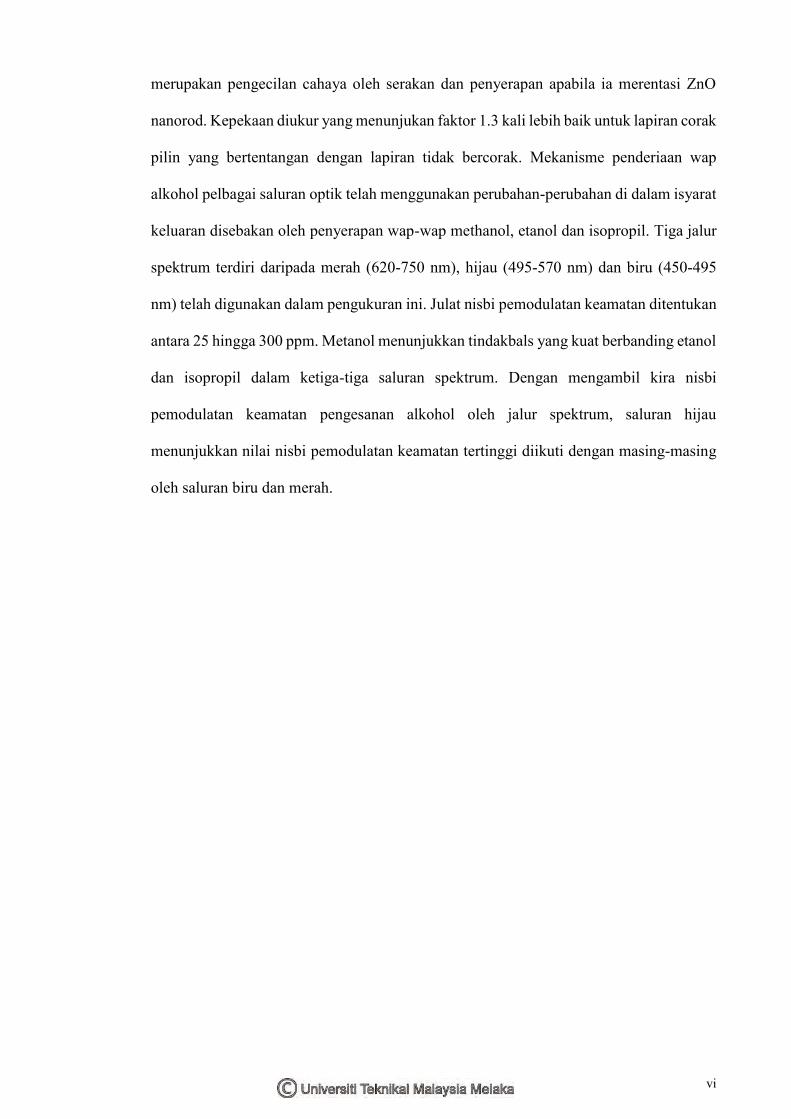
vi
merupakan pengecilan cahaya oleh serakan dan penyerapan apabila ia merentasi ZnO
nanorod. Kepekaan diukur yang menunjukan faktor 1.3 kali lebih baik untuk lapiran corak
pilin yang bertentangan dengan lapiran tidak bercorak. Mekanisme penderiaan wap
alkohol pelbagai saluran optik telah menggunakan perubahan-perubahan di dalam isyarat
keluaran disebakan oleh penyerapan wap-wap methanol, etanol dan isopropil. Tiga jalur
spektrum terdiri daripada merah (620-750 nm), hijau (495-570 nm) dan biru (450-495
nm) telah digunakan dalam pengukuran ini. Julat nisbi pemodulatan keamatan ditentukan
antara 25 hingga 300 ppm. Metanol menunjukkan tindakbals yang kuat berbanding etanol
dan isopropil dalam ketiga-tiga saluran spektrum. Dengan mengambil kira nisbi
pemodulatan keamatan pengesanan alkohol oleh jalur spektrum, saluran hijau
menunjukkan nilai nisbi pemodulatan keamatan tertinggi diikuti dengan masing-masing
oleh saluran biru dan merah.

vii
ACKNOWLEDGEMENTS
It is with immense gratitude that I would like to acknowledge the support and help
of my supervisor, Prof. Dr. Sulaiman Wadi Bin Harun. He has been a source of inspiration
and has convincingly conveyed a spirit of adventure in regard to research. The initial ideas
he suggested and his vast knowledge on optical sensor were invaluable in helping me get
set on the right track. The successful completion of my task would not have been possible
without his constant encouragement and guidance throughout the whole period of my
research work.
I am also indebted to my co-supervisor Prof. Dr. Waleed S. Mohammed who
helped me in building up a positive work attitude. His mastery over the subject and the
freedom he provided in carrying out my research were instrumental in gaining a lot of
confidence. I owe my deepest gratitude to Prof. Dr. Louis Gabor Hornyak, Director of
Center of Excellence in Nanotechnology, Asian Institute of Technology (AIT), Bangkok,
Thailand and Prof. Dr. Joydeep Dutta, Chair of Functional Materials division, KTH Royal
Institute of Technology, Stockholm, Sweden for reading my reports, commenting on my
views and helping me understand and enrich my ideas.
I share the credit of my work with Mr. Manjunath, PhD student, Bangkok
University, Thailand and Siddharth Thokchom, master student, Assam Don Bosco
University, India for their constant involvement and inspiring advice.
Most importantly, I would like to express my heart-felt gratitude to my parents
Abdul Rahim and Hasnah, thank you for your encouragement and prayers. My deepest
appreciations from bottom of my heart go to my wife Siti Khatijah for all your love and
support, and to our children Rayyan and Rayqal for being such as wonderful sons.
Lastly, I would like to thank Universiti Teknikal Malaysia Melaka (UTeM) and
Ministry of Higher Education Malaysia (MOHE) for sponsoring my PhD program under
SLAB/ SLAI scholarship.

viii
TABLE OF CONTENTS
Abstract ............................................................................................................................ iii
Abstrak .............................................................................................................................. v
Acknowledgements ......................................................................................................... vii
Table of Contents ........................................................................................................... viii
List of Figures ................................................................................................................. xii
List of Tables................................................................................................................ xviii
List of Symbols and Abbreviations ................................................................................ xix
List of Appendices ........................................................................................................ xxii
CHAPTER 1: INTRODUCTION .................................................................................. 1
1.1 General ..................................................................................................................... 1
1.2 The Role of Nanotechnology in Optical Sensor ...................................................... 2
1.3 Problem Statement ................................................................................................... 4
1.4 Hypothesis ............................................................................................................... 5
1.5 Objectives of the Study ............................................................................................ 6
1.6 Limitation of the Study ............................................................................................ 6
1.7 Organization of the Thesis ....................................................................................... 7
CHAPTER 2: LITERATURE REVIEW ...................................................................... 9
2.1 Introduction.............................................................................................................. 9
2.2 Optical Fiber .......................................................................................................... 10
2.3 Plastic Optical Fiber (POF) ................................................................................... 13
2.3.1 Optical Properties of POF ........................................................................ 14
2.3.2 Mechanical Properties of POF.................................................................. 15
2.3.3 Thermal Properties of POF ....................................................................... 17
ix
2.3.4 Chemical Infiltration ................................................................................ 18
2.4 Optical Sensor Using Plastic Optical Fiber ........................................................... 19
2.4.1 Optical Loss .............................................................................................. 20
2.4.2 Interferometry-Based Sensors .................................................................. 22
2.4.3 OTDR, OFDR and Scattering................................................................... 24
2.4.4 Fiber Bragg Grating (FBG) ...................................................................... 25
2.5 Zinc Oxide Nanorod-Structure .............................................................................. 25
2.6 Hydrothermal Synthesis Method of Zinc Oxide Nanostructure ............................ 29
2.7 Zinc Oxide in Global Applications ........................................................................ 34
2.8 Light Scattering and Side Coupling ....................................................................... 37
2.9 Recent Research on Temperature and Gas Sensing Using Optical Fiber .............. 46
CHAPTER 3: OPTIMIZATION OF ZINC OXIDE NANOROD COATINGS ON
LARGE CORE PLASTIC OPTICAL FIBER THROUGH HYDROTHERMAL
GROWTH……… .......................................................................................................... 50
3.1 Introduction............................................................................................................ 50
3.2 Optimization parameters for the hydrothermal method......................................... 51
3.3 ZnO Nanorods through Hydrothermal Growth ..................................................... 52
3.3.1 Fiber Preparation ...................................................................................... 53
3.3.2 Seeding Process ........................................................................................ 54
3.3.3 ZnO Nanorod Growth Process ................................................................. 59
3.4 Optimization of ZnO Nanorod Growth on POF .................................................... 60
3.4.1 Spiral Patterned Growth of Zno Nanorods on POF Using the Optimized
Growth Duration. ...................................................................................... 69
3.5 Optimization of Seeding Methods to Improve the Growth of Zno Nanorods on
POF…. ................................................................................................................... 72
3.6 Summary ................................................................................................................ 76

x
CHAPTER 4: CHARACTERIZATION OF LIGHT SIDE COUPLING TOWARDS
MULTIPLE OPTICAL CHANNEL AND OPTIMIZATION OF SPIRAL
PATTERNED WIDTH OF ZINC OXIDE NANOROD COATING FOR OPTIMAL
SIDE COUPLING ......................................................................................................... 78
4.1 Introduction............................................................................................................ 78
4.2 Mechanism of Light Scattering by ZnO Nanorod ................................................. 80
4.3 Mechanism of Light Scattering For Unpatterned and Spiral Patterned ZnO Nanorod
Layers and For the Multi-Channel Optical Fiber .................................................. 81
4.4 Experimental Characterization of Multi-Channel Optical Fiber towards Light Side
Coupling ................................................................................................................ 84
4.5 Modeling of Coupling Efficiency for Spiral Patterned and Unpatterned Coating by
Varying the Width of the Coated Region towards Light Side Coupling ............... 86
4.6 Theoretical Optimization of Spiral Patterned Width for Optimal Side Coupling . 93
4.7 Experimental Optimization of Spiral Patterned Width for Optimal Side
Coupling….. .......................................................................................................... 99
4.8 Summary .............................................................................................................. 102
CHAPTER 5: APPLIED LIGHT SIDE COUPLING WITH OPTIMIZED SPIRAL
PATTERNED ZINC OXIDE NANOROD COATINGS FOR TEMPERATURE
AND MULTIPLE OPTICAL CHANNEL ALCOHOL VAPOR SENSING ........ 104
5.1 Introduction.......................................................................................................... 104
5.2 SEM images of Optimized Spiral Patterned Zinc Oxide Nanorod Coatings for
Sensing Applications ........................................................................................... 105
5.3 Applied Light Side Coupling With Optimized Spiral Patterned Zinc Oxide Nanorod
Coatings for Temperature Sensing ...................................................................... 107
5.3.1 Experiment of Temperature Sensing ...................................................... 109
5.3.2 Results and Discussions ......................................................................... 110

xi
5.4 Applied Light Side Coupling With Optimized Spiral Patterned Zinc Oxide Nanorod
Coatings for Multiple Optical Channel Alcohol Vapor Sensing. ........................ 113
5.4.1 Experiment of Multiple Optical Channel for Alcohol Vapor Sensing ... 114
5.4.2 Results and Discussions ......................................................................... 117
5.5 Summary .............................................................................................................. 125
CHAPTER 6: CONCLUSION AND FUTURE WORK ......................................... 127
6.1 Conclusion ........................................................................................................... 127
6.2 Future work .......................................................................................................... 129
References ..................................................................................................................... 130
List of Publications, Papers Presented And patents ...................................................... 147
Appendix ....................................................................................................................... 151
xii
LIST OF FIGURES
Figure 2.1 Some applications of optical fiber sensors in industry (Rajan, 2015) ........... 10
Figure 2.2 The parts of optical fiber................................................................................ 11
Figure 2.3 Phenomena of light refraction and reflection inside optical fiber. ............... 12
Figure 2.4 (a) Multimode and (b) single mode ............................................................... 13
Figure 2.5 Attenuation loss of common POF as a function of wavelength (Zubia & Arrue, 2001) ............................................................................................................................... 15
Figure 2.6 The measurement of true stress versus strain for single-mode PMMA-doped core (Kiesel et al., 2007) ................................................................................................. 16
Figure 2.7 The results of Dynamic Young’s modulus for PMMA MPOF, step index POF and silica SMF28 (Stefani, Andresen, Yuan, & Bang, 2012) ......................................... 17
Figure 2.8 The responses of two POF FBG sensors with RH varied from 80% to 70% at a temperature of 25°C (W. Zhang, Webb, & Peng, 2012) .............................................. 19
Figure 2.9 Schematic of POF-based accelerometer. The inset shows a magnification of the fiber gap region. (Antunes et al., 2013)..................................................................... 21
Figure 2.10 (a) Schematic of VCO interrogator used for time-of-flight measurements and (b) Image of upper side of aircraft flap with POF adhered to surface and prototype instrumentation. (Gomez et al., 2009) ............................................................................. 23
Figure 2.11 Wurtzite structure of ZnO ............................................................................ 26
Figure 2.12 3D ZnO structures (a) nanorods (Dedova et al., 2007), (b) nanowires (Shan et al., 2008), (c) nanoflowers (Miles et al., 2015) and (d) snowflakes (Jing et al., 2012). ......................................................................................................................................... 28
Figure 2.13 Growth morphologies of ZnO 1D nanostructures. (Z. L. Wang, 2004) ...... 29
Figure 2.14 SEM images of ZnO nanostructures grown with different aqueous solutions of pH value of (a) 1.8, (b) 4.6, (c) 6.6, (d) 9.1, (e) 10.8 and (f) 11.2. (Amin et al., 2011) ......................................................................................................................................... 30
Figure 2.15 SEM images of ZnO nanorods on Si substrate with different precursor concentrations of the growth aqueous solution (a) at 25 mM, (b) 50 mM, (c) 100 mM, (d) 300 mM. (Amin et al., 2011)........................................................................................... 31
Figure 2.16 SEM image of ZnO nanorods grown using Zn(NO3)2 and HMT (Baruah & Dutta, 2008) .................................................................................................................... 34

xiii
Figure 2.17 Various applications of ZnO (Kołodziejczak-Radzimska & Jesionowski, 2014) ............................................................................................................................... 35
Figure 2.18 Illustration of light scattering from one ZnO nanorod................................. 38
Figure 2.19 Schematic representation of two possible configurations of side coupling to cladding modes with guided and leakage intensity responses of light paths in the side coupling configuration (H Fallah et al., 2013) ................................................................ 39
Figure 2.20 Optical characterization setup for the light side coupling (Hoorieh Fallah et al., 2014).......................................................................................................................... 41
Figure 2.21 The coupling intensity of different concentration of zinc acetate for ZnO nanorods grown on wet etched optical fiber (H Fallah et al., 2013) ............................... 42
Figure 2.22 The measurement of coupling intensity (y- left axis), the average scattering coefficient (y- right axis) and versus the concentration of zinc acetate (H Fallah et al., 2013) ............................................................................................................................... 43
Figure 2.23 The coupling intensity for cladding mode and core mode at different excitation location on the optical fiber (Hoorieh Fallah et al., 2014) ............................. 44
Figure 2.24 Optical nephelometer setup for testing scattering properties of ZnO grown on glass substrate (Hoorieh Fallah et al., 2014) ................................................................... 45
Figure 2.25 The measurement of (a) normalized angular power spectra and (b) density, ρa respect to the concentrations of zinc acetate used for preparing the ZnO seed layer on glass substrate (Bora et al., 2014) ................................................................................... 46
Figure 2.26 The setup of liquid temperature sensor. (S. Kumar & Swaminathan, 2016) ......................................................................................................................................... 47
Figure 2.27 Optical fiber sensor based on SPR for chemical sensing. (Michel et al., 2016) ......................................................................................................................................... 49
Figure 3.1 Optimization parameters for the ZnO nanorods growth on POF using hydrothermal method ...................................................................................................... 51
Figure 3.2 General procedures of ZnO nanorods synthesis using hydrothermal ............ 52
Figure 3.3 The process of fiber preparation (a) POF with black jacket (b) POF is exposed with length of 10 cm for ZnO coating (c) 3M water proof tape is used to create spiral template (d) manually creating spiral pattern on POF and (e) POF with spiral template before the synthesis process. ........................................................................................... 53
Figure 3.4 Procedures of seeding process on POF .......................................................... 54

xiv
Figure 3.5 Process of 1mM ZnO nanoparticle solution preparation ............................... 55
Figure 3.6 Preparation of the pH controlled solution using NaOH................................. 55
Figure 3.7 Alkaline process of ZnO nanoparticles solution by NaOH ........................... 56
Figure 3.8 (a) Tween 80 preparation and (b) POF surface treatment ............................. 57
Figure 3.9 Dip and Dry method in seeding process ........................................................ 57
Figure 3.10 Drop and Dry method in seeding process .................................................... 58
Figure 3.11 Slow stirring method in seeding process ..................................................... 59
Figure 3.12 The process of ZnO nanorod growth on POFs ............................................ 60
Figure 3.13 Flow of the optimization process of ZnO nanorod growth on POF through hydrothermal ................................................................................................................... 61
Figure 3.14 Low magnification SEM images of the POF coated with ZnO nanorods with (a) surface treatment (Tween 80) and (b) without surface treatment .............................. 62
Figure 3.15 Vpp characterisation setup to measure the side coupling of ZnO nanorods for unpatterned and spiral patterned POFs ........................................................................... 62
Figure 3.16 The modulated LED red light source used in the optical characterization .. 63
Figure 3.17 The exposed regions on the unpatterned type of POF (a) interface, (b) middle and (c) tip ........................................................................................................................ 64
Figure 3.18 Average Vpp for 15 and 20 hours growth time with backscattering effects. 65
Figure 3.19 ZnO nanorods grown on POF (a) 15 hours (b) 20 hours ............................. 65
Figure 3.20 Backscattering effect is eliminated at interface regions after reducing the growth time to 8, 10, and 12 hours.................................................................................. 66
Figure 3.21 Average Vpp at interfacial area for all growth times .................................... 67
Figure 3.22 The SEM images for growth durations: 8 hours (top left), 10 hours (top right) and 12 hours (bottom) ..................................................................................................... 68
Figure 3.23 The specified regions on the spiral patterned POF for optical characterization. ......................................................................................................................................... 69
Figure 3.24 Average Vpp for the spiral patterned growth for 12 h which has more than one interface and ZnO regions. The inset shows the regions covered by the aperture when characterisation the structured and unstructured ZnO growth on POF ........................... 70
xv
Figure 3.25 (a) 13 kX SEM image of ZnO spiral patterned growth after synthesis (b) 25.0 kX SEM image of the nanorods and Inset: The ZnO nanorods at 60.0 kx magnification for 12 hours ..................................................................................................................... 71
Figure 3.26 EDX spectrum of ZnO nanorods showing zinc and oxygen peaks ............. 72
Figure 3.27 The growth of ZnO nanorods using the drop and dry method (a) 5 kX SEM image of spiral patterned growth on POF and (b) the morphology of ZnO nanorods at a high magnification .......................................................................................................... 73
Figure 3.28 Schematic diagram showing the possible agglomeration of ZnO nanoparticles upon evaporation of the solvent (a) thin layer of ZnO nanoparticles (b) agglomerated clumps of ZnO nanoparticles with various orientations and (c) ZnO nanorods grow from the seed crystallites in the different directions ................................................................ 74
Figure 3.29 The continuous slow stirring process .......................................................... 75
Figure 3.30 The growth of ZnO nanorods using the continuous slow stirring method (a) 5 kX SEM image of spiral patterned growth on POF and (b) the morphology of ZnO nanorods at 10.0 kX ........................................................................................................ 76
Figure 4.1 Mechanism of light scatters into POF by ZnO nanorods at angle larger than critical angle, θc ............................................................................................................... 80
Figure 4.2 Schematic diagram of light scattering for (a) Unpatterned growth of ZnO nanorods with the coupling light (b) Spiral patterned growth of ZnO nanorods with more interface and ZnO regions with the coupling light (c) Spiral patterned growth of ZnO nanorods for a multi-channel excitation .......................................................................... 82
Figure 4.3 Spectral analysis setup to determine wavelength coupling maxima ............. 84
Figure 4.4 Transmittance of the visible white light spectrum ......................................... 85
Figure 4.5 Spectrum for near infrared (850 and 980 nm) for spiral patterned and unpatterned growth.......................................................................................................... 86
Figure 4.6 (a) Spirally patterned coating of ZnO nanorods on POF and (b) unpatterned coating of ZnO nanorods on POF with a visible light source ......................................... 87
Figure 4.7 Definition of polar coordinate ....................................................................... 88
Figure 4.8 (a) Dividing the POF coated with ZnO nanorods into discrete sections of width Δz for both coating schemes (b) Optical Intensity components around a segment h of the ZnO coated POF .............................................................................................................. 90
Figure 4.9 The scheme of light propagation for unpatterned continuous and spiral patterned coating where ZnO coating region was fixed to 3 segments (3 mm) .............. 92

xvi
Figure 4.10 The normalized coupling output for unpatterned and spiral patterned coating by varying the width of ZnO nanorod coating on POFs ................................................. 94
Figure 4.11 (a) Spirally patterned coating of ZnO nanorods on POF and (b) unpatterned coating of ZnO nanorods on POF with a laser light source (Gaussian beam) ................ 96
Figure 4.12 The coupling efficiencies for spiral patterned and unpatterned coating excited by a laser light source ...................................................................................................... 97
Figure 4.13 Spiral patterned coating of ZnO nanorods (b) unpatterned coating of ZnO nanorods with varied uncoated spacing .......................................................................... 98
Figure 4.14 The effects on coupling efficiency by varying the uncoated region ............ 99
Figure 4.15 Coating schemes (a) unpatterned POFs (b) Spiral patterned POFs ........... 100
Figure 4.16 Optimization setup to measure the output voltage for unpatterned and spiral patterned ZnO nanorods ................................................................................................ 101
Figure 4.17 The experimental result of spiral patterned and unpatterned coating for 3, 5, 7 and 100 mm ................................................................................................................ 102
Figure 5.1 (a) The optimized spiral patterned ZnO nanorod coatings, (b) the perpendicular growth of ZnO nanorods on POF at low magnification (c) at high magnification (d) hight and diameter of the ZnO nanorod and (e) ZnO continuous coating on unpatterned POF ....................................................................................................................................... 106
Figure 5.2 Experimental setup for the proposed temperature sensor towards light side coupling ......................................................................................................................... 110
Figure 5.3 The response of spiral patterned coating and unpatterned coating in temperature sensing. ...................................................................................................... 111
Figure 5.4 The temperature sensing mechanism (a) before light illumination (b) upon light illumination and (c) aluminum rod in close proximity to ZnO nanorods coating layer. ....................................................................................................................................... 112
Figure 5.5 The sensitivity of spiral patterned and unpatterned coating in temperature sensing ........................................................................................................................... 113
Figure 5.6 Experimental setup to validate the alcohol sensing activities of spiral patterned POF as multiple optical channels .................................................................................. 115
Figure 5.7 Spectroscopy responses of multiple optical channels sensor in blue, green, and red wavelengths for (a) methanol, (b) ethanol and (c) isopropanol .............................. 118

xvii
Figure 5.8 Schematic diagram of the alcohol sensing mechanism activated using visible white light illumination (a) in air at room temperature (b) with visible white light and (c) with methanol exposure ................................................................................................ 120
Figure 5.9 The responses of multiple optical channels sensor in channel (a) blue (b) green and (c) red ..................................................................................................................... 121
Figure 5.10 The relative intensity modulation (RIM) of multiple optical channels sensor exposed to ethanol, methanol and isopropanol vapors.................................................. 123
Figure 5.11 The validation of the multiple optical channels sensor for (a) channel blue/ channel red (b) channel green/ channel red................................................................... 124

xviii
LIST OF TABLES
Table 2.1 Properties of Zinc Oxide ................................................................................. 27
Table 4.1 Differences of normalized coupling output, ΔI between spiral patterned and unpatterned POFs for different widths of ZnO coating from 0 to 7 mm ........................ 95

xix
LIST OF SYMBOLS AND ABBREVIATIONS
˚C : Degree Celsius
µm : Micrometer
nm : Nanometer
cm : Centimeter
g : Gram
mM : Mili mole
C2H5OH : Ethanol
CH3OH : Methanol
C3H8O : Isopropanol
C6H12N4 : Hexamethylenetetramine
HCL : Hydrochloric acid
CO : Carbon monoxide
O2 : Oxygen
CO2 : Carbondioxide
H2O : Water
NaOH : Sodium hydroxide
ZAH : Zinc acetate hydrate
Zn(CH3COO)2 : Zinc acetate
Zn(NO2)3 : Zinc Nitrate hexahydrate
Zn(OH)2 : Zinc hydroxide
ZnCl2 : Zinc chloride
ZnO : Zinc oxide
Zn2+ : Zinc ions
O2- : Oxygen ions

xx
OH- : Hydroxyl ions
dB/km : Decibels/kilometer
Vpp : Peak-to-peak Voltage
σ : Beam waist
𝑟 : Distance from the center of the beam
Csc : Scattering cross section
a : Rods density
: Portion of Scattered Light
θinc : Incident angle
θc : Critical angle
Δz : Width of Segment
z. : Coupling coefficient
Ip : Coupling output of spiral pattern
Iup : Coupling output of unpatterned
n : Refractive index
ΔI : Normalized coupling output
: Azimuthal angle
HMT : Hexamethylenetetramine
MMF : Multimode Fiber
SOF : Silica Optical Fiber
OFSs : Optical Fiber Sensors
POF : Plastic Optical Fiber
AI : Artificial intelligence
PMMA : Polymehyl Methacrylate
xxi
SEM : Scanning Electron Microscope
LED : Light Emitting Diode
FBG : Fiber Bragg Grating
DI : Deionized
DC : Direct Current
1D : One Dimensional
2D : Two Dimensional
3D : Three Dimensional
ZAH : Zinc Acetate Hydrate
EDX : Energy-dispersive X-ray
SPR : Space Plasmon Resonance
RH : Relative Humidity
CTOP : Specialty Amorphous Fluorinated Polymer
DMA : Dynamic Mechanical Analysis
MPOF : Multimode Plastic Optical Fiber
OTDR : Optical Time-Domain Reflectometry
OFDR Optical Frequency-Domain Reflectometry
VCO : Voltage-Controlled Oscillator
RI : Refractive Index
IR : Infrared
VZn : Zinc Vacancies
ca. : Around, about or approximately
RIM : Relative Intensity Modulation
GOF : Glass Optical Fiber

xxii
LIST OF APPENDICES
Publications and Papers Presented
Patent Filing Reports
1
CHAPTER 1: INTRODUCTION
1.1 General
Historically, the early research on optical fiber sensors (OFSs) was started in the
70s and related to medical instrument that was such as a fiber-optic endoscope consisting
of a bundle of flexible glass fibres able to coherently transmit an image (Edmonson,
1991). Nowadays, various approaches and technologies have been developed to gain
attention in sensing applications. Optical sensors using fiber optics definitely provide
reliable solutions in many fields since optical fibers can measure physical properties such
as strain (Ohno, Naruse, Kihara, & Shimada, 2001), displacement (Rahman, Harun,
Yasin, & Ahmad, 2012), temperature (Tyler et al., 2009), pressure (W. Wang, Wu, Tian,
Niezrecki, & Wang, 2010), velocity (Weng et al., 2006) and magnetism (Lv, Zhao, Wang,
& Wang, 2014). Every year, exploring the potentials of OFSs keep receiving high interest
because optical fibers offer well known advantages such as immunity to electrical and
magnetic fields, low attenuation, wide transmission bandwidth, small physical size and
weight, increased flexibility, analog and digital transmission, electrical insulation,
immunity to electromagnetic interference and interception and receiver sensitivity.
Beside these properties, FOSs also hold enormous potential for the use in chemical
applications due to the high sensitivity and slightly invasive technique (Mescia &
Prudenzano, 2013) which is important in monitoring environmental pollution, mainly if
FOSs are applied in radiation zone.
This thesis is concerned with the development of a simple and cost effective
system based on light scattering from zinc oxide (ZnO) nanorods grown in spiral pattern
on plastic optical fiber (POF) for temperature and alcohol vapors sensing applications.
The performance of the system is investigated based on the simulation and experimental