structured network design and implementation for a … · structured network design and...
TRANSCRIPT
Structured Network Design and Implementation for a Small Office Home
Office – Tutorial/Report Offor, Kennedy J. 1, Obi, Patrick I.1, Nwadike Kenny T 2 and Okonkwo I. I.1.
1. Department of Electrical/Electronic Engineering, Anambra State University, Uli, Nigeria
2. Project Manager, SocketWorks Ltd., Bauchi State, Nigeria.
Abstract
The paper outlined the steps involved in structure
network design and deployment for a small office
home office need. It presented the steps (or phases)
of a structured network design and demonstrated a
practical implementation of the steps using a real-
life case study. The design was first simulated using
Cisco Packet Tracer™ software and WireShark
protocol analyser. Specifically, the paper
demonstrated first hand, how a small network may
be set up using the five phases beginning with the
needs analysis and ending with deployment/testing.
The result of simulation and results of the post-
deployment test revealed that the network met the
client’s needs.
1. Introduction Extensive planning should go into a network
installation/implementation. Just like any project, a
need is identified and then a plan outlines the
process from beginning to end. A good project plan
will help identify any strengths, weaknesses,
opportunities, or threats (SWOT). The plan should
clearly define the tasks, and the order in which
tasks are completed.
The main goal of structured systems analysis is to
more accurately represent users’ needs, which
unfortunately often are ignored or misrepresented.
Another goal is to make the project manageable by
dividing it into modules that can be more easily
maintained and changed.
Structured systems analysis has the following
characteristics [1]:
■ The system is designed in a top-down sequence.
■ During the design project, several techniques and
models can be used to characterize the existing
system, determine new user requirements, and
propose a structure for the future system.
■ A focus is placed on data flow, data types, and
processes that access or change the data.
■ A focus is placed on understanding the location
and needs of user communities that access or
change data and processes.
■ A logical model is developed before the physical
model. The logical model represents the basic
building blocks, divided by function, and the
structure of the system. The physical model
represents devices and specific technologies and
implementations.
■ Specifications are derived from the requirements
gathered at the beginning of the top-down
sequence.
A network that is a patchwork of devices strung
together, using a mixture of technologies and
protocols, is usually an indicator of poor initial
planning. These types of networks are susceptible
to downtime, and are difficult to maintain and
troubleshoot. Therefore, at the planning stage, the
network engineer needs to take account of the
existing equipment and technologies the network
would have to operate with and their compatibility
with the proposed equipment.
The planning of a network (LAN) has five distinct
phases:
1. Phase 1: Requirements Gathering/
Needs Analysis
All the necessary information needed is gathered
during a site survey and also from the client. A site
survey provides much information to the network
engineer/designer and creates a proper starting
point for the project [2]. It shows what is already
on site, and gives a good indication as to what is
needed.
Some of the more important pieces of information
that can be gathered during a site survey include:
Number of users and types of equipment
Projected growth
Current Internet connectivity(if any)
Application requirements
Existing network infrastructure and
physical layout
1342
International Journal of Engineering Research & Technology (IJERT)
Vol. 2 Issue 8, August - 2013
IJERT
IJERT
ISSN: 2278-0181
www.ijert.orgIJERTV2IS80441
New services required
Security and privacy considerations
Reliability and Uptime expectations
Budget constraints
It is a good idea to obtain a floor plan, if possible.
If a floor plan is not available, the technician can
draw a diagram indicating the size and locations of
all rooms [1]. It is also ideal to make measurements
where the cable would be run. An inventory of
existing network hardware and software is also
useful to provide a baseline of requirements.
Table 1 shows the Analysis Report drawn after a
site survey and interaction with the client.
Table 1: Client’s need analysis gathering
Analysis Report of The Site Survey For The Installation of a LAN and Internet Connectivity.
S/N Requirement Client’s Response
1 Number of users and type of
equipment.
Ten desktops in the library, one in the HOD’s Secretary’s office, one
in the HOD’s office and a maximum of 5 laptops on wireless access.
This totals to 12 wired desktops. Each desktop computer has a
100Mbps NIC installed. The wireless users will be limited to 5 and
would be increased as Internet Bandwidth from the Digital Centre is
increased. So maximum number of users will be 17.
2 Service Provider Equipment
(Internet Connectivity)
The Institution’s Digital Centre provides a Wi-Fi cloud for internet
connectivity using the IEEE 802.11b/g). The department Intends to
connect to the digital centre located about 900 metres from the
department. The average link speed is 220KBps.
Local Servers The department has no local server and presently cannot afford to
own one.
4 Email Servers None
5 Project growth The number of wireless users may likely be increased in future.
6 Application Requirements We run word processing, spread sheets, eBooks, AutoCAD and
graphic applications.
7 Number of printers None at the moment. Though we plan to acquire printers in the future.
8 Physical layout. The library is rectangular in shape with plywood ceiling. The same
applies to the HOD’s and his Secretary’s office.
9 WLAN area The Wi-Fi cloud should be accessible within the departmental block
and a few metres outside
10 Reliability and Uptime
expectations
The LAN should be very reliable; however, the uptime of the internet
connection is dependent on the Digital Centre.
11 Security and Privacy
Concerns
The wireless LAN should be much secured with restricted access. The
network should have the capability of filtering what enters and leaves
the network.
12 Budget Constraints We are working on a limited budget of N140, 000.00 (One Hundred
and Forty Thousand Naira Only).
2. Phase 2: Design and Selection
Devices and cabling were then selected based on
the requirements outlined in the Analysis Report.
Multiple designs were also created to be able to
view the LAN from a documentation perspective
and evaluate trade-offs in performance and cost. It
is during this step that any weaknesses of the
design can be identified and addressed.
Factors considered when selecting the devices for a
LAN were costs, number of ports (a function of the
number of computers to be networked and the
possibility for future growth or expansion), speed,
expandable/modular and manageability.
Also during this phase, prototypes were created and
tested. A successful prototype is a good indicator of
how the network will operate. A simulator program
such as Packet Tracer 5.0 is a good tool to test the
network [3].
After the design was approved by the customer,
implementation of the new network can begin. If
the design exceeds the budget of the customer,
adjustments could be made but with caution not to
compromise quality that would have adverse effect
on the network.
Based on the above Analysis Report, the design
below was drawn up and simulated using Packet
Tracer 5.0.
1343
International Journal of Engineering Research & Technology (IJERT)
Vol. 2 Issue 8, August - 2013
IJERT
IJERT
ISSN: 2278-0181
www.ijert.orgIJERTV2IS80441
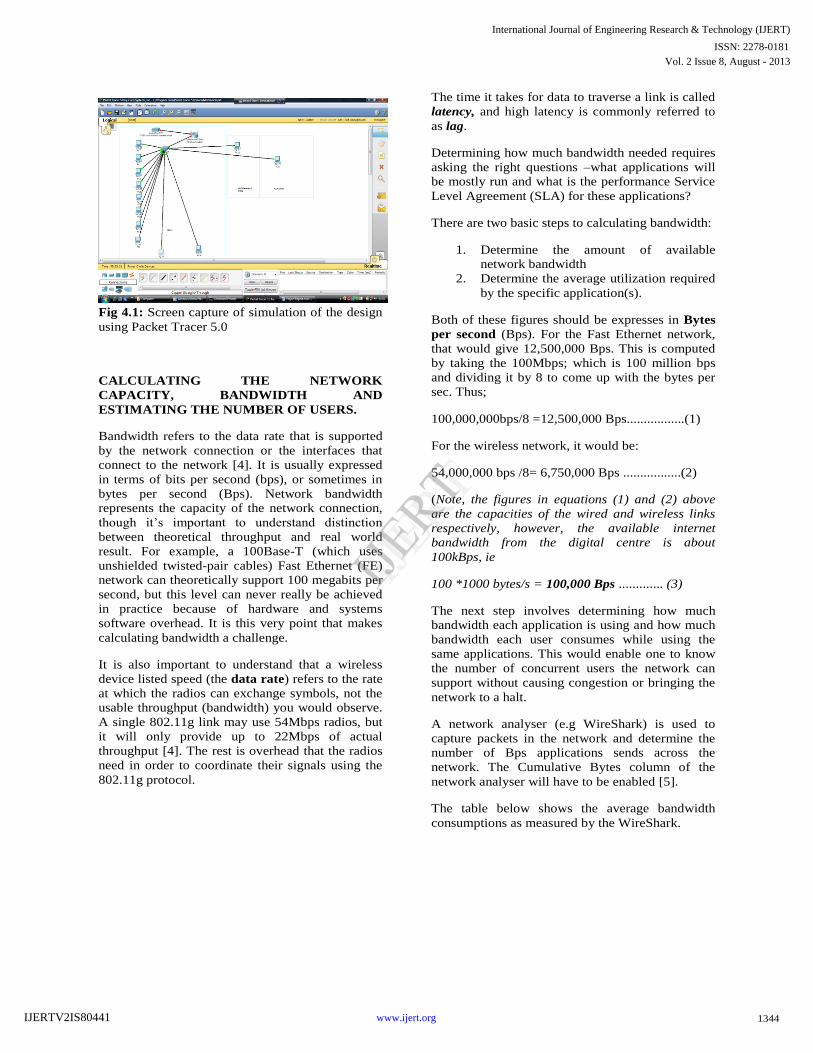
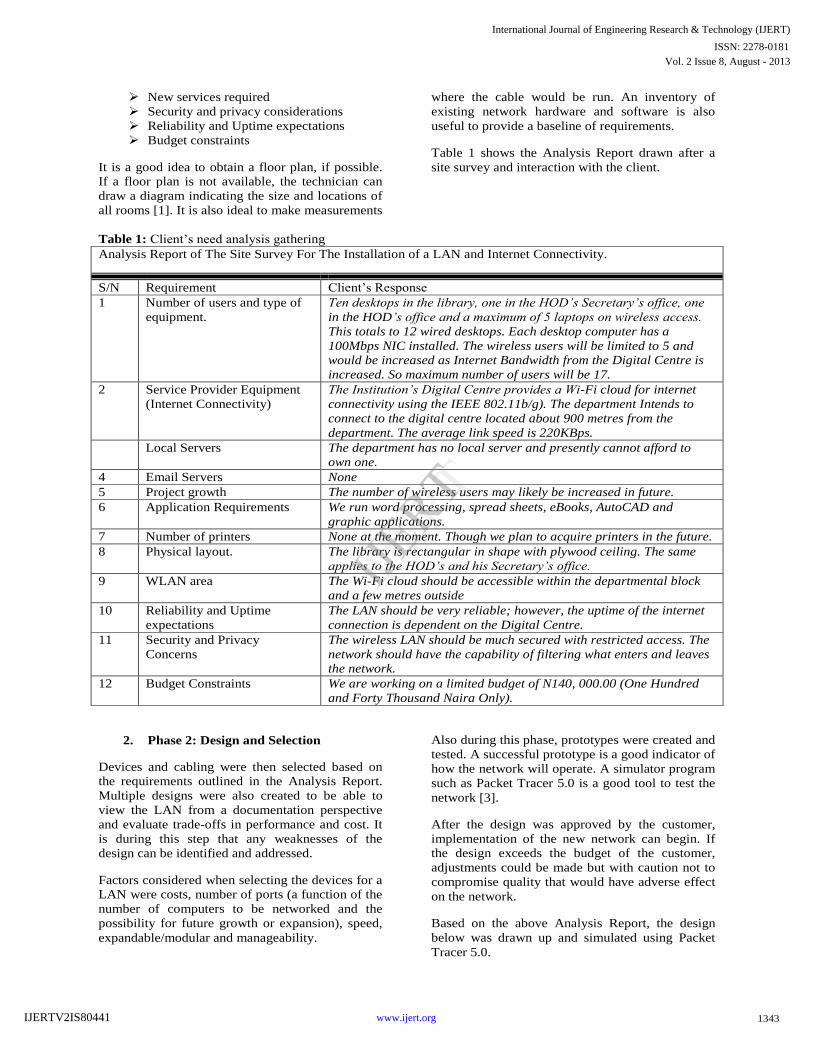
Fig 4.1: Screen capture of simulation of the design
using Packet Tracer 5.0
CALCULATING THE NETWORK
CAPACITY, BANDWIDTH AND
ESTIMATING THE NUMBER OF USERS.
Bandwidth refers to the data rate that is supported
by the network connection or the interfaces that
connect to the network [4]. It is usually expressed
in terms of bits per second (bps), or sometimes in
bytes per second (Bps). Network bandwidth
represents the capacity of the network connection,
though it’s important to understand distinction
between theoretical throughput and real world
result. For example, a 100Base-T (which uses
unshielded twisted-pair cables) Fast Ethernet (FE)
network can theoretically support 100 megabits per
second, but this level can never really be achieved
in practice because of hardware and systems
software overhead. It is this very point that makes
calculating bandwidth a challenge.
It is also important to understand that a wireless
device listed speed (the data rate) refers to the rate
at which the radios can exchange symbols, not the
usable throughput (bandwidth) you would observe.
A single 802.11g link may use 54Mbps radios, but
it will only provide up to 22Mbps of actual
throughput [4]. The rest is overhead that the radios
need in order to coordinate their signals using the
802.11g protocol.
The time it takes for data to traverse a link is called
latency, and high latency is commonly referred to
as lag.
Determining how much bandwidth needed requires
asking the right questions –what applications will
be mostly run and what is the performance Service
Level Agreement (SLA) for these applications?
There are two basic steps to calculating bandwidth:
1. Determine the amount of available
network bandwidth
2. Determine the average utilization required
by the specific application(s).
Both of these figures should be expresses in Bytes
per second (Bps). For the Fast Ethernet network,
that would give 12,500,000 Bps. This is computed
by taking the 100Mbps; which is 100 million bps
and dividing it by 8 to come up with the bytes per
sec. Thus;
100,000,000bps/8 =12,500,000 Bps.................(1)
For the wireless network, it would be:
54,000,000 bps /8= 6,750,000 Bps .................(2)
(Note, the figures in equations (1) and (2) above
are the capacities of the wired and wireless links
respectively, however, the available internet
bandwidth from the digital centre is about
100kBps, ie
100 *1000 bytes/s = 100,000 Bps ............. (3)
The next step involves determining how much
bandwidth each application is using and how much
bandwidth each user consumes while using the
same applications. This would enable one to know
the number of concurrent users the network can
support without causing congestion or bringing the
network to a halt.
A network analyser (e.g WireShark) is used to
capture packets in the network and determine the
number of Bps applications sends across the
network. The Cumulative Bytes column of the
network analyser will have to be enabled [5].
The table below shows the average bandwidth
consumptions as measured by the WireShark.
1344
International Journal of Engineering Research & Technology (IJERT)
Vol. 2 Issue 8, August - 2013
IJERT
IJERT
ISSN: 2278-0181
www.ijert.orgIJERTV2IS80441

Table 4.0: Average bandwidth usage of various internet applications.
Application Bandwidth per
User
Notes
Text Messaging/Instant Messaging <1kbps As traffic is infrequent and asynchronous
Email 1 to 100 kbps As with IM, email is asynchronous and intermittent, so
it will tolerate latency. Large attachments, viruses and
spam significantly add to bandwidth usage. Note that
web email services (such as yahoo or gmail) should be
considered as web browsing, not as email.
Web browsing 50-100+kbps Web browsers only use the network when data is
requested. Communication is asynchronous, so a fair
amount of lag can be tolerated. As web browsers request
more data(large images, long downloads, etc) bandwidth
usage will go up significantly.
Streaming audio 96-160kbps Each user of a streaming audio service will use a
constant amount of relatively large bandwidth for as
long as it plays. It can tolerate some transient latency by
using large buffers on the client. But extended periods
of lag will cause audio “skips” or outright session
failures.
Voice over IP (VOIP) 24-100+
kpbs
As with streaming audio, VOIP commits a constant
amount of bandwidth to each user for the duration of the
call. But with VoIP, the bandwidth is used roughly in
both directions. Latency on a VoIP connection is
immediate and annoying to users. Lag greater than a few
milliseconds is unacceptable for VoIP.
Streaming video 64-200+ kbps As with streaming audio, some intermittent latency is
avoided by using buffers on the client. Streaming video
requires high throughput and low latency to work
properly
Peer-to-peer file-sharing
applications (BitTorrent, KaZaA,
eDonkey, etc)
0-infinite
Mbps
While peer to per applications will tolerate any amount
of latency, they tend to use up the entire available
throughput by transmitting data to as many clients as
possible, as quickly as possible. Use of these
applications will cause latency and throughput problems
for all other network users unless you use careful
bandwidth shaping.
To estimate the number of expected users, we
divide the available (internet) bandwidth by the sort
of application they will probably use.
Assuming that all the users will mainly be
browsing the web,
From the table above, web browsing consumes
between 50kbps to 100+ kbps per user;
Converting the boundaries to bytes per second;
50*1000/8=50000/8 = 6250 Bps –........(4)
100*1000/8=12,500 Bps ................ (5)
Now dividing the available bandwidth in (3) by the
above bandwidth per user boundaries:
i.e 100000/6250=16 users.
and
100000/12500=8 users
Since all users are unlikely to use the connection at
precisely the same moment, it is common practise
to oversubscribe available throughput by some
factor (that is, allow more users than the maximum
available bandwidth can support). Oversubscribing
by a factor of 2 to 5 is quite common. By carefully
monitoring throughput throughout the network, one
will be able to plan when to upgrade various part of
the network and make necessary adjustments if
need be.
In this case, the lower estimated number of users
was oversubscribed by a factor of 2.125, bringing
the estimated number of users to 17 users. Twelve
users will be on the desktop while the wireless
router would be configured to allow a maximum of
1345
International Journal of Engineering Research & Technology (IJERT)
Vol. 2 Issue 8, August - 2013
IJERT
IJERT
ISSN: 2278-0181
www.ijert.orgIJERTV2IS80441
5 users. This is achieved by configuring the
wireless router to lease only 5 IP addresses.
3. Phase 3: Implementation.
If there are tasks that have been overlooked in the
earlier phases, they must be corrected during
implementation. Creation of a good implementation
schedule and allowing for some additional time for
unexpected events keep disruption of the client’s
business to a minimum. During the
implementation, there should be strict adherence to
standards, such as colour codes, operational limits,
etc.
Staying in constant communication with the client
during the installation was critical to the success of
the project.
3.1 Explanation of the Design.
In the above design, all desktop computers and one
of the router’s Fast Ethernet ports were connected
to the switch (a 16-port Linksys Switch). The
Internet Port of the wireless router/access point was
connected to the 600mW outdoor Access Point.
Since there is no server available, the router acts as
a DHCP server distributing IP addresses in the
192.168.4.1 – 192.168.4.49 range to the wireless
clients and 192.168.4.100 – 192.168.4.150 range
for the wired clients. To ensure security of the
network, a WPA passphrase was used which is
more secured than its counterpart WEP [6].
For the physical cabling, the cables were passed
through the ceiling to the HOD’s and his
Secretary’s office. The cables were terminated with
a patch panel nailed to the wall. The cables were
bundled together using low cost cable managers
instead of using trunks in order to safe costs.
Nevertheless, the cabling work was neatly done and
aligned along the wall.
The 400mW Outdoor Access point/Bridge was
firmly mounted on a pole already fixed to the roof.
The device is aligned to the line of sight of the
digital centre for maximum reception.
Fig 4.2 The 400mW Outdoor Access point/Bridge
aligned to the digital centre.
4. Phase 4: Operation
The network is brought into service in what is
termed a production environment. Prior to this step,
the network is considered to be in a testing or
implementation phase.
5. Phase 5: Review and Evaluation
After the network is operational, the design and
implementation were reviewed and evaluated. For
this process, the following steps are recommended:
Compare the user experience with the
goals in the documentation and evaluate if
the design is right for the job.
Compare the projected designs and costs
with the actual deployment. This ensures
that future projects will benefit from the
lessons learned on this project.
Monitor the operation and record changes.
This ensures that the system is always
fully documented and accountable.
6. Conclusion
The paper outlined the steps involved in structure
network design and deployment for a small office
home office need. It presented the steps (or phases)
of a structured network design and demonstrated a
practical implementation of the steps using a real-
life case study. The design was first simulated
using Cisco Packet Tracer™ software and
WireShark protocol analyser. The only problem
encountered was the issue of unavailability of
power at the site for configuration of the devices.
However, UPS systems were used to overcome this
issue since the devices are not high power devices
and a laptop was used to configure and test the
1346
International Journal of Engineering Research & Technology (IJERT)
Vol. 2 Issue 8, August - 2013
IJERT
IJERT
ISSN: 2278-0181
www.ijert.orgIJERTV2IS80441

resultant configuration in place of the desktop
computers.
References
[1] Priscilla Oppenheimer, (2010). “Top-Down
Network Design”, 3rd ed. Cisco Press,
Indianapolis, USA
*2+ Meraki Inc. (2011). “Network Design
Guide” *online+ Available at
http://meraki.cisco.com/lib/pdf/
meraki_setup_network_design.pdf
[3] Cisco Packet Tracer Brochure,
http://www.cisco.com/web/learning/neta
cad/downloads/pdf/
PacketTracer5_0_DS_0703.pdf
[4] Wikipedia,
http://en.wikipedia.org/wiki/Bandwidth_(c
omputing)
[5] WireShark. www.wireshark
.org/about.html.
[6] Wikipedia,
http://en.wikipedia.org/wiki/Wi-
Fi_Protected_Access
1347
International Journal of Engineering Research & Technology (IJERT)
Vol. 2 Issue 8, August - 2013
IJERT
IJERT
ISSN: 2278-0181
www.ijert.orgIJERTV2IS80441
