structured polyvinyl alcohol/zeolite/carbon composites...
TRANSCRIPT

Research ArticleStructured Polyvinyl Alcohol/Zeolite/Carbon CompositesPrepared Using Supercritical Fluid Extraction Techniques asAdsorbent for Bioethanol Dehydration
Joddy Arya Laksmono ,1,2 Mahmud Sudibandriyo ,1 Asep Handaya Saputra,1
and Agus Haryono2
1Chemical Engineering Department, Faculty of Engineering, Universitas Indonesia (UI), Kampus UI, Depok 16424, Indonesia2Research Center for Chemistry-Indonesian Institute of Sciences (RCChem-LIPI), Kawasan PUSPIPTEK,Serpong Tangerang Selatan, Banten 15314, Indonesia
Correspondence should be addressed to Mahmud Sudibandriyo; [email protected]
Received 13 August 2018; Revised 5 December 2018; Accepted 16 December 2018; Published 16 January 2019
Academic Editor: Sebastien Deon
Copyright © 2019 Joddy Arya Laksmono et al. ,is is an open access article distributed under the Creative Commons AttributionLicense, which permits unrestricted use, distribution, and reproduction in any medium, provided the original work isproperly cited.
Introduction. Adsorption is a purification process with a more efficient energy level than others. Adsorption performance isstrongly influenced by the ability of the adsorbent to be used; therefore, the modification of the adsorbent becomes a veryimportant key for the purification process that occurs.Methods. In this study, the preparation of composite adsorbents was carriedout by combining polyvinyl alcohol (PVA), zeolite (Zeo), and activated carbon (AC) as precursors. ,e crosslinking process wasfulfilled by adding glutaraldehyde to the precursor mixtures followed by a supercritical fluid CO2 extraction (SFE) technique tocreate conditions for the crosslinking process. ,e composites were analyzed using Braunner–Emmet–Teller (BET) surface areaanalysis, Fourier-transform infrared (FTIR), differential scanning calorimetry (DSC), and scanning electron microscopy withenergy dispersive X-ray (SEM/EDX-mapping), while individual and composite adsorbents were evaluated for their ability inbioethanol dehydration at various initial concentrations of ethanol and temperature. Results. ,e BETcharacterization shows thatcomposite preparation under supercritical CO2 conditions provides reasonable surface areas, which are proportional to thecontent of activated carbon. ,e crosslinking process has been described by FTIR data interpretation, showing that PVA andglutaraldehyde were properly distributed on Zeo and AC precursors. ,e DSC characterization results give information that PVAsuccessfully forms hydrophilic composites within Zeo and AC.,e SEMmicrograph analysis shows the formation of pores on thesurface and cross section in structured adsorbents. ,e experimental adsorption shows that an increasing amount of AC in thecomposites increases the capacity of water adsorption (i.e., 0.80 gram of water/gram of adsorbent for PVA/Zeo/AC � 1 :1 :1 at22°C). However, the effect is not significant when the ratio of AC is less than 0.5. As expected, the lower temperature increases theadsorption capacity. Further, by using approximately 4.5 gram adsorbents composite in 30ml of water-ethanol mixtures, highconcentration of bioethanol (>99%) can be achieved at various temperatures from 22°C to 40°C and bioethanol initial con-centration from 88% to 96%. Conclusion. ,e SFE technique provides distinguished adsorbents composite properties. Further, thenew composites provide about four times better adsorption capacity than that showed in the individual adsorbents test. ,eaddition of AC influences on increasing the capacity and adsorption kinetics value.
1. Introduction
Environmental sustainability factors have become the mainreason for the use of suitable alternative fuel types [1]. Fossilfuels have continued to decline, causing subsequent price
increases, particularly in the developing countries. On theother hand, alternative renewable fuels provide eco-friendly,inexpensive, and pollution-free options that increase energysecurity [2]. In this case, bioethanol production is becomingmore attractive for the scientific community [3]. Currently,
HindawiInternational Journal of Chemical EngineeringVolume 2019, Article ID 6036479, 11 pageshttps://doi.org/10.1155/2019/6036479

bioethanol production has increased by 4,959 kilotons in2007, to 97,280 kilotons in 2017, which significantly con-tributes to the wholesale of biofuels in the world with a valueof approximately 58 billion dollars per year [4, 5].
Bioethanol can be produced from a variety of rawmaterials. Bioethanol from lignocellulosic can be consideredsecond-generation biofuel production technology, whichhas the advantage of not competing with food needs [6]. ,eproduction of second-generation bioethanol generallyconsists of the following steps: pretreatment, hydrolysis/saccharification, fermentation, and distillation to purifythe bioethanol to meet a fuel grade [7]. Bioethanol fuel gradefollows the standards such as ASTM D4806 to fulfill themaximum water content contained in products, i.e., 1% v/v[8]. Unfortunately, the purification process of bioethanolcannot be achieved using ordinary distillation, consideringthe azeotropic conditions (95.63% vol.; 78.15°C; 1.013 bar)[9] occurring in the water-ethanol system [10]. Researchershave reviewed several techniques for breaking down azeo-tropes in water-ethanol systems, such as pervaporation,permeation, adsorption, extraction, pressure-swing distil-lation, extractive distillation, azeotropic distillation,adsorption-distillation complexes, and pervaporation dis-tillation complexes [11, 12]. Energy consumption in thepurification process is a major concern considering the largeenergy utilization; moreover, there is an ongoing effort toachieve energy and economic efficiency [13]. According toWang et al., the energy consumption of the adsorptionprocess is 32KJ/m3 while the azeotropic distillation is 88KJ/m3; therefore, the adsorption process is a technique whichprovides higher energy efficiency compared to others[14–16].
Previous researchers have investigated the types of ad-sorbents related to the dehydration process of bioethanol,which includes zeolitic-based, carbon-based, polymer-based, bio-based, and composite-based. Several studies onthe use of zeolitic adsorbent compounds have been pub-lished. Sowerby and Crittenden investigated the effect oftype A zeolites, such as 3A, 4A, 5A, and 10A, which are usedfor bioethanol purification adsorption [17]. Meanwhile,Wang et al. compared type 3A zeolites with bio-based ad-sorbents [18]. In addition, some researchers conducted aninvestigation using NaZSM-5 type zeolites [19], silicalite[20], natural clinoptilolite [21], and several types of Lindetype A (LTA), faujasite (FAU), and mordenite (MOR) [14].Other studies explored the process of dehydration of bio-ethanol using carbon-based adsorbents [22–26]. In addition,the application of polymeric and composite adsorbents hasbeen accomplished previously with polymeric resin Sepa-bead 207® [27], poly([1-vinyl-3-hexylimidazolium] [bis(trifluoromethyl sulfonyl) imide]), a polymeric ionic liquid[28], polyvinyl alcohol and zeolite 3A mixed matrix com-posite [29], and a carbon-natural zeolite composite [30] asan adsorbent for bioethanol purification regarding the fuelgrade.
PVA is selected in the dehydration process because of itsbiodegradability, water solubility, and its bulk hydroxylgroup on the surface, which can form a chemical bondbetween the PVA and water molecules [31]. PVA is a
hydrophilic semicrystalline synthetic polymer [32]; there-fore, in the appropriate conditions, the PVA can formcomposites with other materials, especially using CO2 at asupercritical condition [12]. ,e molecular structure ofcertain liquids, especially CO2 in supercritical conditions(SCCO2), plays an essential role in the processing of com-posite polymers. It is important to realize that the specificinteractions found between CO2 and polymer also explainsthe high solubility of CO2 inmany of the glass polymers usedin this composite preparation. It can be explored that theincreased concentration of active polymer groups results inan appropriate increase in CO2 solubility relative to hydroxygroups in PVA, creating specific interactions with functionalgroups in zeolite and activated carbon structures. In thiscase, PVA utilizes SCCO2 properties (high diffusivity, lowsurface tension, and solvent recovery ease) to prepare thepolymer composite materials. In other words, SCCO2 dis-solved in the composite preparation process significantlyaffects the mass transport properties of zeolites and activatedcarbon in the polymer matrix [33].
Zeolite 3A type is a rigid aluminosilicate compoundwhich is highly selective to water, considering its pore size of3 A, while the molecular size of water is 2.8 A. It has stablemechanical properties, regular micropore distribution, and ahigh adsorption capacity; however, it has a moderate in-ternal surface and pore volume [34].
Activated carbon has microcrystals arranged randomlyas a high surface area and a high pore volume; however, ithas an unequal pore size distribution and low water selec-tivity under ambient conditions near azeotropic conditions.Hence, external improvement with other materials is nec-essary for the water adsorbent criteria [26, 35].
Considering the advantages and disadvantages of thethree material properties, the preparation of excellent per-formance adsorbents for bioethanol dehydration will beconducted in this study. Observing and conducting ad-sorption studies on the three types of individual adsorbentshas been performed in previous studies [10, 13]. ,e resultswill be used as the basis for choosing the precursor, thevariation of the ratio of each precursor, and the adsorptionperformance using the composite adsorbent. In other words,the purpose of this study is to develop PVA/Zeo/AC as anadsorbent composite material that provides excellentphysiochemical properties for the bioethanol dehydrationprocess performance.
2. Materials and Methods
2.1. Materials. Bioethanol was obtained from the bio-ethanol’s pilot plant, RCChem-LIPI. Meanwhile, the ethanoltechnical grade (±95%) was obtained from a local marketand repurified using simple distillation to ensure a constantconcentration and measurement using the densitometerKyoto KEM density/specific gravity meter DA-640.Aquadest was obtained by a local water reverse osmosisprocess using NESCA YDO 6800. AC was purchased fromAjax Chemicals, in the Netherlands. Natural Zeo was ob-tained from research units from the Natural ProductTechnology (BPTBA)-LIPI, Yogyakarta, Indonesia. ,e
2 International Journal of Chemical Engineering

obtained natural Zeo was then characterized using X-raydiffraction (XRD), where data processing was performedusing Match software. ,e characterization results revealedthat the natural Zeo used was clinoptilolite-k monoclinictype (Al3.48Ba0.16Ca0.22H2.58K1.06Na0.42O38.58Si14.52) [36].Meanwhile, glutaraldehyde as a crosslinker was purchasedfrom the Emerck Milipore Corp. Glutaraldehyde was usedwithout pretreatment.
2.2. Methods
2.2.1. Material Preparation. ,e redistilled ethanol wasdiluted with aquadest to provide several initial concen-trations (C0) 96%, 94%, 92%, 90%, and 88% by volume,which were then analyzed using Kyoto KEM density/specific gravity meter DA-640. ,e substances werestored in dark glass bottles for the adsorption process.Adsorbent materials such as PVA, Zeo, and AC werepretreated; the particle size was reduced by using ball millinto 40 meshes, which was sieved by stainless steel meshsieving vibrator Laboratory Test Sieve Retsch ASTM E11.,e water content in PVA and AC was removed by heatingin the oven ,ermo Scientific Precision 652 at 105°C untilthe weight was constant, and the water content wasmeasured using Ohaus. ,e PVA was then stored in thedesiccator. AC was heated gradually using a ,ermolyne46200 high-temperature furnace employing a heat rate at10°C/min to raise 150°C and detained for 2 hours to removeits water content. Afterward, it was cooled down simul-taneously to room temperature in the desiccator.
A natural Zeo was washed using redistilled water, and itwas activated using 1M hydrochloric acid (HCl). In thiscase, 100 g Zeo was put into a beaker glass while 1000mL ofHCl 1M was put dropwise approximately 2ml/min; then,the mixture was stirred continuously for 24 hours. ,e Zeowas then washed using distilled water until pH 7 wasachieved, and then filtered using the Whatman filter paper.,e Zeo was further activated by heating the furnace to reacha temperature of 150°C with a rate of 10°C/min and detainedfor 2 hours; the temperature was then increased to 800°C anddetained for 4 hours. Subsequently, the cooling process wascarried out until the temperature reached 100°C with a rateof 10°C/min; then, AC was cooled down to room temper-ature in the desiccator.
2.2.2. Composites Preparation. 10% of the PVA solution inwater was prepared by dissolving a certain amount of PVAin boiled redistilled water in a 1 L beaker glass and stirredusing a mixing apparatus. Meanwhile, the Zeo and ACpowder were mixed using a laboratory scale ball mill. ,eratio of Zeo to AC was varied at 1 :1, 1 : 0.75, 1 : 0.5, 1 : 0.25,and 1 : 0. Afterward, the PVA solution was mixed with Zeoand AC so that the ratio of PVA to Zeo was 1 :1 for eachcomposite adsorbent prepared. ,e mixture was then stir-red. As much as 4% wt. (of the total mixture) of glutaral-dehyde as a crosslinker was then added into the mixture.,is mixing process was continuously carried out at 80°C for2 hours.
After thoroughly mixed, the mixture was formed intogranules with a diameter of approximately 3-4mm using agranulator apparatus. ,e granules were incorporated intothe stainless steel basket contained in the supercritical fluidextraction (SFE) reactor. ,e composite granular adsorbentproduction was performed at 2,500 psi with the temperatureof 60°C for 4 hours. ,e dried sample was stored in thedesiccator.
2.2.3. Material Characterizations. ,e physical properties ofthe adsorbent material, such as surface area, pore volume,pore size, and nanoparticle size, were characterized usingBET Micromeritics TriStar II. In order to examine theavailability of crosslinking in the produced composites, thefunctional group characterization was performed usingFTIR Shimadzu IR Prestige-21. FTIR spectra were obtainedusing transmittance mode in the range of wavenumber from4,000 to 550 cm−1. ,e FTIR spectra were normalized, andmajor vibration bands were associated with the chemicalgroup. Meanwhile, the thermal characterization of adsor-bents was analyzed using the DSC Linseis Simultaneously,ermal Analysis Platinum Series STA PT 1600 with thefollowing procedure: the composite sample was preparedinto small pieces and it was weighed as 3mg and fed into thecrucible. ,e analysis was carried out exothermically from30°C to 250°C with a heating rate of 10°C/min, and N2 wasused as a purge gas at 10mL/min rate. ,e morphology andcross-section analysis of the adsorbent composite werecharacterized using SEM Hitachi. ,e sample was coatedusing Pt for 55 seconds with 30mA current. Scanningelectron microscopy with energy dispersive X-ray (SEM/EDX-mapping) analysis was determined on the 20 kVaccelerated voltage. In addition, the mapping of the majorelements of each constituent of the adsorbent was de-termined to characterize the position of the layer and thehomogeneity of the formed composite. ,e hydroxyl andiodine value procedure has been described in the previouspaper [10, 13].
2.2.4. Adsorption Test. ,e adsorption test for individualadsorbents has been described in the previous paper [10, 13]for temperatures of 20, 30, and 40°C. ,e adsorption processusing composite adsorbents involves the ratio of PVA :zeolite is 1 :1, where the value varies the AC: 1, 0.75, 0.5,0.25, and 0; accordingly, five variations of composite PVA/Zeo/ACwere obtained.,e ethanol solution was prepared invarious initial concentrations (88%, 90%, 92%, 94%, and96%). ,e granular composite adsorbents used are 15%(approximately, 4.5 gram) in 30mL of the water-ethanolmixture, which was put in the 100mL laboratory glass. 10samples were prepared to be taken for measurement at adifferent time (2minutes difference for each sample). Allsamples were inserted into the New Brunswick shaker in-cubator for an adsorption process. ,e samples were takenand filtered using a Minisart syringe filter Sartorius Stedim;and then, the ethanol concentration of adsorption wasmeasured using Kyoto KEM density/specific gravity meterDA-640. ,e same process was undertaken for each
International Journal of Chemical Engineering 3

temperature varied from 20, 30, and 40°C, the ethanol so-lution initial concentration, and the composite adsorbentvariations. ,orough evaluation on experimental un-certainties following this method reveals that the level ofuncertainties of the experimental results will be about 5%.
,e calculation of adsorption capacity (qe) was carriedout based on the experimental results in accordance withmass balance, as typically the adsorption process reaches theequilibrium state. Calculation for adsorption capacity hasbeen explained in the previous paper [10].
3. Results and Discussion
3.1. Adsorbents Characterization. Table 1 presents thecharacterization results for each adsorbent, which will beused as the precursor for the adsorbent composite prepa-ration. AC as an individual adsorbent has a higher surfacearea and pore volume compared to PVA and Zeo. PVA has alower surface area and pore volume compared to zeolite andactivated carbon, but PVA has a higher hydroxy numbercompared to others. ,e iodine value of the AC is almostdouble compared to other individual adsorbents. ,esevalues indicate the ability to adsorb an adsorbate. In mostcases, the higher surface area results in the higher value ofiodine number.
Characterizations of the produced composites show thatthe less AC in the composites, in general, reduces the surfacearea and the pore volume. Meanwhile, the pore sizes and theiodine numbers do not change significantly to the variationof composition. ,e hydroxy number is higher when thecomposition of PVA is higher. However, the numbers aredecreasing significantly compared to the original number ofindividual PVA. In this case, the PVA used in adsorbentcomposites acts more as a binder of Zeo and AC than otherfunctions, so that the hydroxyl group in the original PVA isused mostly to form the composites.
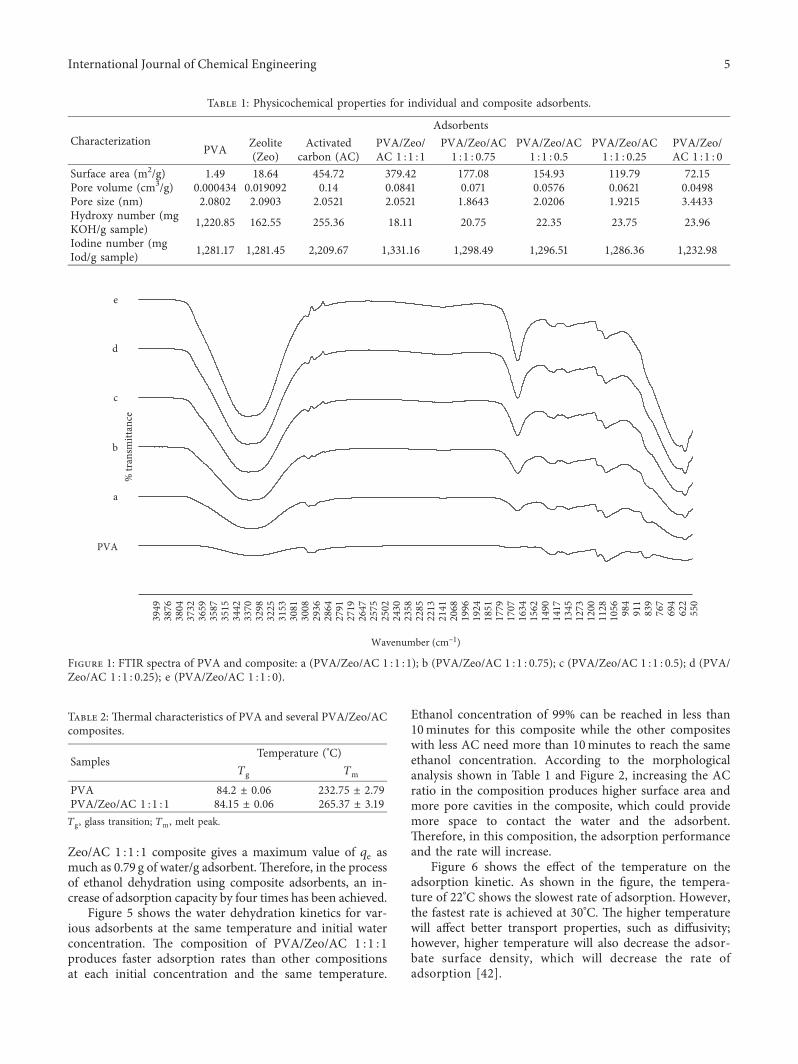
,e preparation process of the composite adsorbent wasundertaken by employing the crosslink mechanism, utilizingthe glutaraldehyde compound as a crosslinker. In addition,conditions in supercritical fluids also play an essential role inthe composite preparation and drying process. ,e cross-linking process can be represented by the results of theanalysis using FTIR, as shown in Figure 1. In the FTIRspectrum of PVA, all significant peaks associated with thehydroxyl and acetate groups were observed. Compared topure PVA in the composites spectra, there is a strong peakformation in ca. 1670 cm−1. ,is shows a strong interactionbetween the hydroxyl groups in PVA and the aldehydegroups found in glutaraldehyde to form acetal duringcrosslinked network formation [36–38].
,e peaks of the Zeo and the AC presence in thecomposite have been identified. Two firm peaks occur at thewavelengths of 1054 cm−1 resulting from asymmetricstretch and bend of the Si-O or Al-O bonds, respectively,within the Zeo structure [38]. ,e peak occurring at580 cm−1 indicates the presence of an interaction betweenPVA and Zeo. ,e intensity of this peak is increased by thecomposition of PVA and Zeo. ,e presence of carbon isidentified in the two strong peaks at 1590 cm−1 and
1300 cm−1 representing the AC absorption band. ,is peakis associated with the asymmetrical C-C stretching mode orC-O stretching from a portion of the chain, in whichintramolecular hydrogen bonds are formed between twoadjacent OH groups [30, 39]. As indicated in Figure 1, theO-H stretch vibration peak (] � 3330–3350 cm−1) is rela-tively increased when compared with pure PVA. ,is in-dicates the formation of cross linking between PVA, GA,AC, and Zeo to create a solid composite through the hy-drogen bonds mechanism [37, 40]. ,is FTIR character-ization also confirms the results of hydroxy numberanalysis, where the numbers in all composites were sig-nificantly decreased compared to that of the original PVA.
,ermal characterization using the DSC of PVA, andone of the composites, is presented in Table 2. As depictedin the table, the value of temperature glass (Tg) does notchange between PVA and the composite while the meltingtemperature (Tm) of the PVA is lower than that of thecomposite (232.7°C compared to 265.4°C). ,e sametemperature glass between the two substances indicatesthat the crystallinity of both substances is unchanged. ,eincreasing of Tm in the composite is due to the presence ofhydrogen bonds [41].
,e SEM image of the composite sample is presented inFigure 2.,e figures show that many pore cavities have beencreated. ,e mapping figures indicate that PVA can bedistributed among Zeo and AC particles while a thin layer ofPVA is located on the top layer.,e existence of pore cavitiesindicates that the formation of pores through supercriticalconditions works optimally. ,e formation of these poreshas a significant effect on the adsorption process by pro-viding an entrance to the pore cavity.
3.2. Adsorption Analysis. ,e adsorption capacity equilib-rium for each experiment is presented in Table 3 and Fig-ure 3. ,e qe calculations were carried out for each variationof composite adsorbents at various initial concentrations ofethanol and other temperatures. As appeared in Figure 3, theincrease in water concentration, the qe value, will increase.,is is related to mass transfer, with the initial concentra-tions of water leading to the greater driving mass transferforce, which results in increasing qe values.,e experimentaldata fit quite well within 5% deviation with the Langmuirmodel.
At the same temperature, the decreasing of AC compo-sition in the composite results in the decreasing capacity ofadsorption. ,is result can be correlated with the physical-chemical properties of each adsorbent, where the increasingAC content in the adsorbents will increase their surface areaand pore volume, which, in turn, will result in increasing qevalues. Further, as expected, the increasing adsorption tem-perature will decrease the qe value, as shown in Figure 4. ,isshows that the adsorption follows the exothermic process. Inour previous studies for the same solution system on indi-vidual adsorbent, the activated carbon has the highest ad-sorption capacity compared to PVA and zeolite, and themaximum adsorption capacity achieved was 0.2 g of water/gadsorbent [10]. In this study, at a temperature of 22°C, PVA/
4 International Journal of Chemical Engineering
Zeo/AC 1 :1 :1 composite gives a maximum value of qe asmuch as 0.79 g of water/g adsorbent.,erefore, in the processof ethanol dehydration using composite adsorbents, an in-crease of adsorption capacity by four times has been achieved.
Figure 5 shows the water dehydration kinetics for var-ious adsorbents at the same temperature and initial waterconcentration. ,e composition of PVA/Zeo/AC 1 :1 :1produces faster adsorption rates than other compositionsat each initial concentration and the same temperature.
Ethanol concentration of 99% can be reached in less than10minutes for this composite while the other compositeswith less AC need more than 10minutes to reach the sameethanol concentration. According to the morphologicalanalysis shown in Table 1 and Figure 2, increasing the ACratio in the composition produces higher surface area andmore pore cavities in the composite, which could providemore space to contact the water and the adsorbent.,erefore, in this composition, the adsorption performanceand the rate will increase.
Figure 6 shows the effect of the temperature on theadsorption kinetic. As shown in the figure, the tempera-ture of 22°C shows the slowest rate of adsorption. However,the fastest rate is achieved at 30°C. ,e higher temperaturewill affect better transport properties, such as diffusivity;however, higher temperature will also decrease the adsor-bate surface density, which will decrease the rate ofadsorption [42].
Table 1: Physicochemical properties for individual and composite adsorbents.
CharacterizationAdsorbents
PVA Zeolite(Zeo)
Activatedcarbon (AC)
PVA/Zeo/AC 1 :1 :1
PVA/Zeo/AC1 :1 : 0.75
PVA/Zeo/AC1 :1 : 0.5
PVA/Zeo/AC1 :1 : 0.25
PVA/Zeo/AC 1 :1 : 0
Surface area (m2/g) 1.49 18.64 454.72 379.42 177.08 154.93 119.79 72.15Pore volume (cm3/g) 0.000434 0.019092 0.14 0.0841 0.071 0.0576 0.0621 0.0498Pore size (nm) 2.0802 2.0903 2.0521 2.0521 1.8643 2.0206 1.9215 3.4433Hydroxy number (mgKOH/g sample) 1,220.85 162.55 255.36 18.11 20.75 22.35 23.75 23.96
Iodine number (mgIod/g sample) 1,281.17 1,281.45 2,209.67 1,331.16 1,298.49 1,296.51 1,286.36 1,232.98
% tr
ansm
ittan
ce
Wavenumber (cm–1)
e
d
c
b
a
PVA
3949
3876
3804
3732
3659
3587
3515
3442
3370
3298
3225
3153
3081
3008
2936
2864
2791
2719
2647
2575
2502
2430
2358
2285
2213
2141
2068
1996
1924
1851
1779
1707
1634
1562
1490
1417
1345
1273
1200
1128
1056 98
491
183
976
769
462
255
0
Figure 1: FTIR spectra of PVA and composite: a (PVA/Zeo/AC 1 :1 :1); b (PVA/Zeo/AC 1 :1 : 0.75); c (PVA/Zeo/AC 1 :1 : 0.5); d (PVA/Zeo/AC 1 :1 : 0.25); e (PVA/Zeo/AC 1 :1 : 0).
Table 2: ,ermal characteristics of PVA and several PVA/Zeo/ACcomposites.
SamplesTemperature (°C)
Tg Tm
PVA 84.2 ± 0.06 232.75 ± 2.79PVA/Zeo/AC 1 :1 :1 84.15 ± 0.06 265.37 ± 3.19Tg, glass transition; Tm, melt peak.
International Journal of Chemical Engineering 5

As shown in Figures 5 and 6, eventually, ethanolconcentration greater than 99%, as fuel grade in accordancewith ASTM 4806, was achieved at each process temperatureusing various composite adsorbent compositions in this
study. In comparison, individual adsorbents for the samevariation of initial ethanol concentration, as shown inFigure 7, cannot achieve the designated concentration ofethanol.
(a) (b)
(c) (d)
(e)
Figure 2: SEM-mapping micrograph of representative sample PVA/Zeo/AC. (a) 1 :1 : 1; (b) 1 :1 : 0.75; (c) 1 :1 : 0.5; (d) 1 :1 : 0.25; (e) 1 :1 : 0.C; O; Si.
Table 3: Determining of qe for each experiment.
Temperature(°C)
C0 ofwater(%v/v)
qe experiment in various PVA/Zeo/AC and temperature (g of water/g adsorbent)PVA/Zeo/AC 1 :1 :
1PVA/Zeo/AC 1 :1 :
0.75PVA/Zeo/AC 1 :1 :
0.5PVA/Zeo/AC 1 :1 :
0.25PVA/Zeo/AC 1 :1 :
0
22
12 0.79 0.75 0.74 0.75 0.7510 0.65 0.62 0.61 0.61 0.618 0.46 0.49 0.42 0.51 0.506 0.36 0.33 0.33 0.35 0.374 0.21 0.14 0.19 0.17 0.22
30
12 0.77 0.76 0.75 0.75 0.7410 0.62 0.62 0.61 0.61 0.618 0.47 0.47 0.47 0.45 0.496 0.29 0.31 0.32 0.32 0.354 0.16 0.15 0.15 0.22 0.19
40
12 0.66 0.65 0.49 0.74 0.7610 0.53 0.52 0.39 0.61 0.628 0.44 0.36 0.29 0.48 0.476 0.37 0.22 0.22 0.32 0.354 0.23 0.13 0.13 0.17 0.15
% AAD∗ 3.01 1.14 0.96 1.16 3.58∗Absolute average percentage deviation [42].
6 International Journal of Chemical Engineering

0
0.2
0.4
0.6
0.8
1
0 2 4 6 8 10
q e (g
wat
er/g
adso
rben
t)
Ce water (%)
(a)
Ce water (%)
0
0.2
0.4
0.6
0.8
1
0 2 4 6 8 10 12
q e (g
wat
er/g
adso
rben
t)
(b)
0
0.2
0.4
0.6
0.8
1
0 2 4 6 8 10 12
q e (g
awat
er/g
adso
rben
t)
Ce water (%)
(c)
Figure 3: Adsorption isotherms of water at same temperature in various adsorbents. (a) 22°C; (b) 30°C; (c) 40°C. , qeks PVA/Zeo/AC 1 :1:1; ,qeksPVA/Zeo/AC 1 :1 : 0.75; , qeks PVA/Zeo/AC 1 :1 : 0.5; , qeks PVA/Zeo/AC 1 :1 : 0.25; , qeks PVA/Zeo/AC 1 :1 : 0; , qmod Langmuir.
0
0.20.1
0.40.3
0.60.5
0.70.80.9
1
0 2 4 6 8 10
q e (g
wat
er/g
adso
rben
t)
Ce water (%)
(a)
q e (g
wat
er/g
adso
rben
t)
Ce Water (%)
0
0.20.1
0.40.3
0.60.5
0.80.7
0.91
0 2 4 6 8 10
(b)
q e (g
wat
er/g
adso
rben
t)
Ce water (%)
0
0.20.1
0.40.3
0.60.5
0.80.7
0.91
0 2 4 6 8 10 12
(c)
q e (g
wat
er/g
adso
rben
t)
Ce water (%)
0
0.20.1
0.40.3
0.60.5
0.80.7
0.91
0 2 4 6 8 10 12
(d)
Figure 4: Continued.
International Journal of Chemical Engineering 7

q e (g
wat
er/g
adso
rben
t)
Ce water (%)
0
0.20.1
0.40.3
0.60.5
0.80.7
0.91
0 2 4 6 8 10 12
(e)
Figure 4: Adsorption isotherms of water at same adsorbents in various temperatures. (a) PVA/Zeo/AC 1 :1 :1; (b) PVA/Zeo/AC 1 :1 : 0.75;(c) PVA/Zeo/AC 1 :1 : 0.5; (d) PVA/Zeo/AC 1 :1 : 0.25; (e) PVA/Zeo/AC 1 :1 : 0. , qeks at 22°C; , qeks at 30°C; ■, qeks at 40°C; , qmodLangmuir.
95.00
96.00
97.00
98.00
99.00
100.00
0 5 10 15 20
Etha
nol c
once
ntra
tion
(%)
Time (min)
(a)
86.00
88.00
90.00
92.00
94.00
96.00
98.00
100.00
0 5 10 15 20
Etha
nol c
once
ntra
tion
(%)
Time (min)
(b)
95.5096.0096.5097.0097.5098.0098.5099.0099.50
100.00
0 5 10 15 20
Etha
nol c
once
ntra
tion
(%)
Time (min)
(c)
86
88
90
92
94
96
98
100
0 5 10 15 20
Etha
nol c
once
ntra
tion
(%)
Time (min)
(d)
Figure 5: Continued.
8 International Journal of Chemical Engineering

95.00
96.00
97.00
98.00
99.00
100.00
0 5 10 15 20
Etha
nol c
once
ntra
tion
(%)
Time (min)
(a)
87.0088.0089.0090.0091.0092.0093.0094.0095.0096.0097.0098.0099.00
100.00
0 5 10 15 20
Etha
nol c
once
ntra
tion
(%)
Time (min)
(b)
Figure 6: Ethanol concentration vs. time for various adsorbents at the different temperatures and initial water concentration. (a) 96%ethanol initial concentration for PVA/Zeo/AC 1 :1 :1; (b) 88% ethanol initial concentration for PVA/Zeo/AC 1 :1 :1. , 22°C; ■, 30°C; ,40°C.
95.00
95.50
96.00
96.50
97.00
97.50
98.00
98.50
99.00
0 5 10 15 20
Etha
nol c
once
ntra
tion
(%)
Time (min)
(a)
95.00
95.50
96.00
96.50
97.00
97.50
98.00
98.50
99.00
0 5 10 15 20
Etha
nol c
once
ntra
tion
(%)
Time (min)
(b)
Figure 7: Ethanol concentration vs. time for individual adsorbent (a) at same temperature and different individual adsorbent (■, Zeo at22°C; , AC at 22°C; PVA at 22°C) and (b) at zeolite individual adsorbent and different temperatures ( , 22°C; , 30°C; , 40°C).
95.00
96.00
97.00
98.00
99.00
100.00
0 5 10 15 20
Etha
nol c
once
ntra
tion
(%)
Time (min)
(e)
86
88
90
92
94
96
98
100
0 5 10 15 20
Etha
nol c
once
ntra
tion
(%)
Time (min)
(f)
Figure 5: Ethanol concentration vs. time for various adsorbents at the same temperature and initial water concentration. (a) Ethanolconcentration 96% and temperature 22°C; (b) Ethanol concentration 88% and temperature 22°C. (c) Ethanol concentration 96% andtemperature 30°C. (d) Ethanol concentration 88% and temperature 30°C. (e) Ethanol concentration 96% and temperature 40°C. (f ) Ethanolconcentration 88% and temperature 40°C. , PVA/Zeo/AC 1 :1 :1;■, PVA/Zeo/AC 1 :1 : 0.75; , PVA/Zeo/AC 1 :1 : 0.5; , PVA/Zeo/AC 1 :1 : 0.25; , PVA/Zeo/AC 1 :1 : 0.
International Journal of Chemical Engineering 9

4. Conclusion
,e composite preparation with the supercritical CO2 ex-traction fluid technique has provided excellent physical andchemical properties.,e existence of the composite has beenconfirmed from FTIR analysis, as well as the SEM mor-phology and DSC analysis. ,e experimental adsorptionshows that increasing the amount of AC in the compositesincreases approximately the capacity of water adsorption byfour times (i.e., 0.80 gram of water/gram of adsorbent forPVA/Zeo/AC � 1 :1 :1 at 22°C). By using approximately4.5 gram adsorbents composite in 30ml of water-ethanolmixtures, the standard fuel grade of bioethanol (>99%) canbe achieved at various temperatures from 22°C to 40°C andbioethanol initial concentration from 88% to 96%.
Data Availability
,e data used to support the findings of this study areavailable from the corresponding author upon request.
Conflicts of Interest
,e authors declare that there are no conflicts of interestregarding the publication of this paper.
Authors’ Contributions
Mahmud Sudibandriyo (MS) and Joddy Arya Laksmono(JAL) were responsible for the original conception, design,and overall investigation. Asep Handaya Saputra (AHS) andAgus Haryono (AH) were responsible for analysis and in-terpretation of data. MS and JAL were responsible for theexperiment and drafting the manuscript. Each author hassufficiently participated in the work to take public re-sponsibility for appropriate portions of the content. Allauthors gave critical revisions and approved the finalmanuscript.
Acknowledgments
,e authors would like to thank Universitas Indonesia viaGrant of UI’s Doctoral Students Dissertation 2018 (GrantNo. 1353/UN2.R3.1/HKP.05.00/2018) for financial researchsupport.
References
[1] M. Morales, J. Quintero, R. Conejeros, and G. Aroca, “Lifecycle assessment of lignocellulosic bioethanol: environmentalimpacts and energy balance,” Renewable and SustainableEnergy Reviews, vol. 42, pp. 1349–1361, 2015.
[2] M. Rastogi and S. Shrivastava, “Recent advances in secondgeneration bioethanol production: an insight to pretreatment,saccharification and fermentation processes,” Renewable andSustainable Energy Reviews, vol. 80, pp. 330–340, 2017.
[3] F. B. Mendes, D. Ibraim Pires Atala, and J. C. ,omeo, “Iscellulase production by solid-state fermentation economicallyattractive for the second generation ethanol production?,”Renewable Energy, vol. 114, pp. 525–533, 2017.
[4] M. J. Burk, “Sustainable production of industrial chemicalsfrom sugars,” International Sugar Journal, vol. 112, pp. 30–5,2010.
[5] Renewable fuels association, “Industry statistics for world fuelethanol production,” July 2018, http://www.ethanolrfa.org/resources/industry/statistics/#1454099788442-e48b2782-ea53.
[6] S. H. Mood, A. H. Golfeshan, M. Tabatabaei et al., “Ligno-cellulosic biomass to bioethanol, a comprehensive review witha focus on pretreatment,” Renewable and Sustainable EnergyReviews, vol. 27, pp. 77–93, 2013.
[7] M. Balat, H. Balat, and C. Oz, “Progress in bioethanol pro-cessing,” Progress in Energy and Combustion Science, vol. 34,no. 5, pp. 551–573, 2008.
[8] A. A. Kiss and D. J. P. C. Suszwalak, “Enhanced bioethanoldehydration by extractive and azeotropic distillation in di-viding wall column,” Separation and Purification Technology,vol. 86, pp. 70–78, 2012.
[9] M. Vazquez-Ojeda, J. G. Segovia-Hernandez, S. Hernandez,A. Hernandez-Aguirre, and A. A. Kiss, “Design and opti-mization of an ethanol dehydration process using stochasticmethods,” Separation and Purification Technology, vol. 105,pp. 90–97, 2013.
[10] J. A. Laksmono, U. A. Pangesti, M. Sudibandriyo, A. Haryono,and A. H. Saputra, “Adsorption capacity study of ethanol-water mixture for zeolite, activated carbon, and polyvinylalcohol,” IOP Conference Series: Earth and EnvironmentalScience, vol. 105, article 012025, 2018.
[11] A. K. Frolkova and V. M. Raeva, “Bioethanol dehydration:state of the art,” 6eoretical Foundations of Chemical Engi-neering, vol. 44, no. 4, pp. 545–556, 2010.
[12] J. A. Laksmono, M. Sudibandriyo, A. H. Saputra, andA. Haryono, “Development of porous structured polyvinylalcohol/zeolite/carbon composites as adsorbent,” IOP Con-ference Series: Materials Science and Engineering, vol. 201,article 012006, 2017.
[13] J. A. Laksmono, I. M. Pratiwi, M. Sudibandriyo, A. Haryono,and A. H. Saputra, “Kinetic studies of adsorption in thebioethanol dehydration using polyvinyl alcohol, zeolite andactivated carbon as adsorbents,” AIP Conference Proceedings,vol. 1904, no. 1, 2017.
[14] T. Yamamoto, Y. H. Kim, B. C. Kim et al., “Adsorptioncharacteristics of zeolites for dehydration of ethanol: evalu-ation of diffusivity of water in porous structure,” ChemicalEngineering Journal, vol. 181-182, pp. 443–448, 2012.
[15] Y. Wang, C. Gong, J. Sun, H. Gao, S. Zheng, and S. Xu,“Separation of ethanol/water azeotrope using compoundstarch-based adsorbents,” Bioresource Technology, vol. 101,no. 15, pp. 6170–6176, 2010.
[16] W.-C. Chen, C.-T. Sheng, Y.-C. Liu et al., “Optimizing theefficiency of anhydrous ethanol purification via regenerablemolecular sieve,” Applied Energy, vol. 135, pp. 483–489, 2014.
[17] B. Sowerby and B. D. Crittenden, “An experimental com-parison of Type A molecular sieves for drying the ethanol-water azeotrope,” Gas Separation and Purification, vol. 2,no. 2, pp. 77–83, 1988.
[18] K.-S. Wang, C.-C. Liao, R. Q. Chu, and T.-W. Chung,“Equilibrium Isotherms of Water and Ethanol Vapors onStarch Sorbents and Zeolite 3A,” Journal of Chemical andEngineering Data, vol. 55, no. 9, pp. 3334–3337, 2010.
[19] B. Adnadevic, Z. Mojovic, and A. Abu Rabi, “,e kinetics ofethanol adsorption from the aqueous phase onto zeoliteNaZSM-5,” Adsorption, vol. 14, no. 1, pp. 123–131, 2008.
[20] J. A. Delgado, M. A. Uguina, J. L. Sotelo, V. I. Agueda,A. Garcıa, and A. Roldan, “Separation of Ethanol-water liquid
10 International Journal of Chemical Engineering

mixtures by adsorption on silicalite,” Chemical EngineeringJournal, vol. 180, pp. 137–144, 2012.
[21] E. Ivanova, D. Damgaliev, and M. Kostova, “Adsorptionseparation on ethanol—water liquid mixtures by naturalclinoptilolite,” Journal of the University of Chemical Tech-nology and Metalurgy, vol. 44, no. 3, pp. 267–274, 2009.
[22] J. A. Delgado, V. I. Agueda, M. A. Uguina, J. L. Sotelo,A. Garcıa-Sanz, and A. Garcıa, “Separation of ethanol-waterliquid mixtures by adsorption on BPL activated carbon withair regeneration,” Separation and Purification Technology,vol. 149, pp. 370–380, 2015.
[23] H. Asano, K. Murata, N. Takenaka, and Y. Saito, “Visuali-zation and measurement of adsorption/desorption process ofethanol in activated carbon adsorber,” Physics Procedia,vol. 69, pp. 503–508, 2015.
[24] A. J. Romero-Anaya, M. A. Lillo-Rodenas, and A. Linares-Solano, “Factors governing the adsorption of ethanol onspherical activated carbons,”Carbon, vol. 83, pp. 240–249, 2015.
[25] A. Elsayed, S. Mahmoud, R. Al-Dadah, J. Bowen, andW. Kaialy, “Experimental and numerical investigation of theeffect of pellet size on the adsorption characteristics of acti-vated carbon/ethanol,” Energy Procedia, vol. 61, pp. 2327–2330, 2014.
[26] I. I. El-Sharkawy, K. Uddin, T. Miyazaki et al., “Adsorption ofethanol onto parent and surface treated activated carbonpowders,” International Journal of Heat and Mass Transfer,vol. 73, pp. 445–455, 2014.
[27] J. A. Delgado, V. I. Agueda, M. A. Uguina et al., “Separation ofethanol-water liquid mixtures by adsorption on a polymericresin Sepabeads 207,” Chemical Engineering Journal, vol. 220,pp. 89–97, 2013.
[28] B. Tang, W. Bi, and K. H. Row, “Using poly([1-vinyl-3-hexylimidazolium] [bis(trifluoromethylsulfonyl)imide]) toadsorb bio-ethanol from a Chamaecyparis obtuse leavesfermentation broth,” Bioresource Technology, vol. 137,pp. 25–32, 2013.
[29] B. Sarkar, K. Sunitha, S. Sridhar, and V. Kale, “Bioethanoldehydration through polyvinyl alcohol (PVA) and 3A zeolitemixed matrix composite pervaporation membrane,” Journalof Polymer Material, vol. 30, no. 2, pp. 131–143, 2013.
[30] P. R. Sukhla, S. Wang, H. M. Ang, and M. O. Tade, “Synthesis,characterization, and adsorption evaluation of carbon-naturalzeolite composite,” Advanced Powder Technology, vol. 20,no. 3, pp. 245–250, 2009.
[31] V. G. Kadajji and G. V. Betageri, “Water Soluble Polymers forPharmaceutical Applications,” Polymers, vol. 3, no. 4,pp. 1972–2009, 2011.
[32] C. A. Finch, Polyvinyl Alcohol Development, Wiley, New York,NY, USA, 1992.
[33] S. G. Kazarian, “Polymer processing with supercritical fluids,”Polymer Science, Series C, vol. 42, no. 1, pp. 78–101, 2000.
[34] S. Kulprathipanja, Zeolites in Industrial Separation and Ca-talysis, WILEY-VCH Verlag GmbH and Co. KGaA, Wein-heim, Great Britain, 2010.
[35] R. C. Bansal andM. Goyal,Activated Carbon Adsorption, CRCPress Taylor and Francis Groups, LLC, Boca Raton, FL, USA,2005.
[36] T. Armbruster, “Dehydration mechanism of clinoptilolite andheulandite: single-crystal X-ray study of Na-poor, Ca-, K-,Mg-rich clinoptilolite at 100 KSample Dehyd 2Data obtainedfrom the ICSD,” American Mineralogist, vol. 78, pp. 260–264,1993.
[37] R. Sabarish and G. Unnikrishnan, “Polyvinyl alcohol/carboxymethyl cellulose/ZSM-5 zeolite biocomposite membranes for
dye adsorption applications,” Carbohydrate Polymers,vol. 199, pp. 129–140, 2018.
[38] H. S. Mansur, C. M. Sadahira, A. N. Souza, andA. A. P. Mansur, “FTIR spectroscopy characterization of poly(vinyl alcohol) hydrogel with different hydrolysis degree andchemically crosslinked with glutaraldehyde,” MaterialsScience and Engineering: C, vol. 28, no. 4, pp. 539–548, 2008.
[39] Y. Zheng, V. M. Gun’ko, C. A. Howell et al., “Composites withmacroporous poly(vinyl alcohol) cryogels with attached ac-tivated carbon microparticles with controlled accessibility of asurface,” ACS Applied Materials and Interfaces, vol. 4, no. 11,pp. 5936–5944, 2012.
[40] Lelifajri, M. A. Nawi, S. Sabar, Supriatno, and W. I. Nawawi,“Preparation of immobilized activated carbon-polyvinyl al-cohol composite for the adsorptive removal of 2,4-dichlor-ophenoxyacetic acid,” Journal of Water Process Engineering,vol. 25, pp. 269–277, 2018.
[41] M. Krumova, D. Lopez, R. Benavente, C. Mijangos, andJ. M. Pereña, “Effect of crosslinking on the mechanical andthermal properties of poly(vinyl alcohol),” Polymer, vol. 41,no. 26, pp. 9265–9272, 2000.
[42] M. Sudibandriyo, S. A. Mohammad, R. L. Robinson Jr., andK. A. M. Gasem, “Ono-Kondo lattice model for high-pressureadsorption: Pure gases,” Fluid Phase Equilibria, vol. 299, no. 2,pp. 238–251, 2010.
International Journal of Chemical Engineering 11

International Journal of
AerospaceEngineeringHindawiwww.hindawi.com Volume 2018
RoboticsJournal of
Hindawiwww.hindawi.com Volume 2018
Hindawiwww.hindawi.com Volume 2018
Active and Passive Electronic Components
VLSI Design
Hindawiwww.hindawi.com Volume 2018
Hindawiwww.hindawi.com Volume 2018
Shock and Vibration
Hindawiwww.hindawi.com Volume 2018
Civil EngineeringAdvances in
Acoustics and VibrationAdvances in
Hindawiwww.hindawi.com Volume 2018
Hindawiwww.hindawi.com Volume 2018
Electrical and Computer Engineering
Journal of
Advances inOptoElectronics
Hindawiwww.hindawi.com
Volume 2018
Hindawi Publishing Corporation http://www.hindawi.com Volume 2013Hindawiwww.hindawi.com
The Scientific World Journal
Volume 2018
Control Scienceand Engineering
Journal of
Hindawiwww.hindawi.com Volume 2018
Hindawiwww.hindawi.com
Journal ofEngineeringVolume 2018
SensorsJournal of
Hindawiwww.hindawi.com Volume 2018
International Journal of
RotatingMachinery
Hindawiwww.hindawi.com Volume 2018
Modelling &Simulationin EngineeringHindawiwww.hindawi.com Volume 2018
Hindawiwww.hindawi.com Volume 2018
Chemical EngineeringInternational Journal of Antennas and
Propagation
International Journal of
Hindawiwww.hindawi.com Volume 2018
Hindawiwww.hindawi.com Volume 2018
Navigation and Observation
International Journal of
Hindawi
www.hindawi.com Volume 2018
Advances in
Multimedia
Submit your manuscripts atwww.hindawi.com