student connection research: final narrative report to the
TRANSCRIPT
AMERICAN INSTITUTES FOR RESEARCH®
Notice of Trademark: “AMERICAN INSTITUTES FOR RESEARCH” and “AIR” are registered trademarks. All other brand, product, or company names are trademarks or registered trademarks of their respective owners.
1000 THOMAS JEFFERSON STREET, NW | WASHINGTON, DC 20007-3835
STUDENT CONNECTION RESEARCH:
FINAL NARRATIVE REPORT TO THE
SPENCER FOUNDATION
GRANT NUMBER
200700169
REPORT PREPARED BY
David Osher, Kimberly Kendziora, and Marjorie Chinen American Institutes for Research 1000 Thomas Jefferson St., NW
Washington, DC 20007-3835
REPORT SUBMITTED
March 31, 2008
Final Narrative Report: Student Connection Research Grant # 200700169
i
CONTENTS Acknowledgement .......................................................................................................................... ii Executive Summary ....................................................................................................................... iii Introduction..................................................................................................................................... 1
AIR’s Survey of the Social and Emotional Conditions for Learning (the Student Connection Survey)........................................................................................................................................ 4
History of AIR’s Work on the Social and Emotional Conditions for Learning ...................... 4 From concept to implementation ............................................................................................ 5
Surveying the Social and Emotional Conditions for Learning for Performance Management and Continuous Improvement..................................................................................................... 6 The Present Research.................................................................................................................. 7
Part I: The Data Included in this Analysis ...................................................................................... 8 Part II: Characteristics of the Student Connection Survey Participants ......................................... 9 Part III: Student Connection Results: Overall and by Student Subgroup..................................... 12
Correlation Coefficients among the Student Connection Survey Constructs........................... 13 Mean Student Connection Survey Values for Middle Grades and High School...................... 14 Mean Student Connection Survey Values by Grade Levels..................................................... 16 Mean Student Connection Scores by School Level and Student Gender ................................. 18 Mean Student Connection Scores by School Level and Student Lunch Status........................ 19 Mean Student Connection Scores by Gender and Lunch Status............................................... 20 Mean Student Connection Scores by School Level and Student Ethnicity .............................. 21 Mean Student Connection Scores by Ethnicity and Lunch Status............................................ 22 Mean Student Connection Scores by School Level and Student’s Language Status ............... 23 Mean Student Connection Scores by School Level and Student’s Special Education Status .. 24
Part IV: Addressing the Research Questions ................................................................................ 25 Question 1: Correlations between Achievement and Student Connection ............................... 26
Correlations between EXPLORE and Student Connection Scales ....................................... 26 Correlations between PLAN and Student Connection Scales............................................... 27 Correlations between PSAE and Student Connection Scales ............................................... 28 Exploring Correlations between GPA and Student Connection Scales................................ 29 Mean Student Connection Scores by On Track Index (9th Grade) ....................................... 30 Exploring Correlations between Test Scores and Student Connection Scales by Gender ... 31 Exploring Correlations between Test Scores and Student Connection Scales by Lunch Status..................................................................................................................................... 34
Question 2: Student Connection and School Level Characteristics.......................................... 37 Types of Chicago Schools ..................................................................................................... 37 Student Connection Responses by School Enrollment and Average Class Size ................... 40
Question 3: Specific Correlations for Student Connection Scales............................................ 42 School Safety, School Disruption and Neighborhood Crime................................................ 42 Academic Rigor and Grade Retention and Dropout............................................................. 44 Student Support and Class Size ............................................................................................ 44 Social Emotional Learning Skills and Graduation ............................................................... 45
Question 4: Self- vs. Other- Ratings of Social Emotional Learning Skills .............................. 46 Question 5: Student Connection and AVID.............................................................................. 47 Question 6: Student Connection and Community Context....................................................... 50 Question 7: Student Connection Constructs and NAEP........................................................... 50
Final Narrative Report: Student Connection Research Grant # 200700169
ii
Part VIV: Exploratory Hierarchical Linear Models (HLM)......................................................... 53 Gender Differences Controlling by Lunch Status..................................................................... 56 Ethnic Differences Controlling by Lunch Status ...................................................................... 57
References..................................................................................................................................... 62 Appendix A................................................................................................................................... 67
Distributions of the SCS Scales by Type of School ................................................................. 67 Appendix B: NAEP Journal Manuscript....................................................................................... 70
The Role of School Safety and High Expectations on 8th Graders’ Reading Proficiency: Linking the Chicago Student Connection Survey with the NAEP Trial Urban Data Assessment................................................................................................................................................... 70
ACKNOWLEDGEMENT We are very grateful for the kind cooperation and help provided by the Research, Evaluation, and Accountability Office of the Chicago Public Schools and for the collaboration of the Consortium on Chicago School Research.
Final Narrative Report: Student Connection Research Grant # 200700169
iii
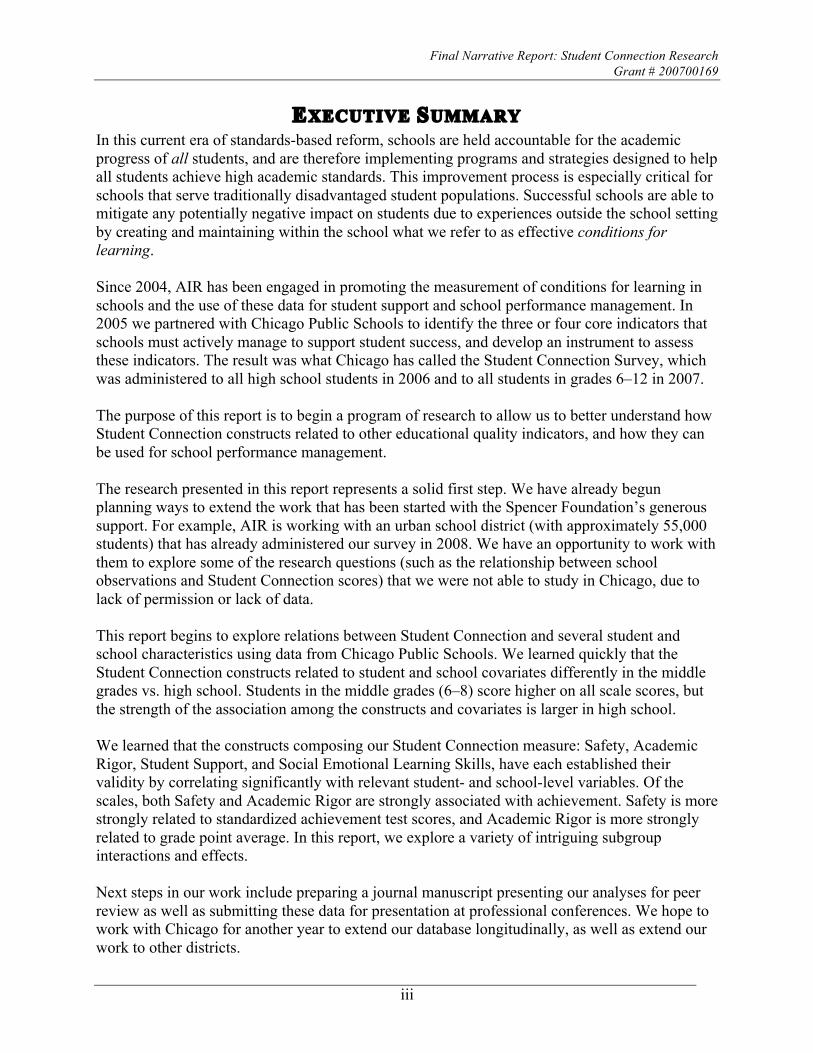
EXECUTIVE SUMMARY In this current era of standards-based reform, schools are held accountable for the academic progress of all students, and are therefore implementing programs and strategies designed to help all students achieve high academic standards. This improvement process is especially critical for schools that serve traditionally disadvantaged student populations. Successful schools are able to mitigate any potentially negative impact on students due to experiences outside the school setting by creating and maintaining within the school what we refer to as effective conditions for learning. Since 2004, AIR has been engaged in promoting the measurement of conditions for learning in schools and the use of these data for student support and school performance management. In 2005 we partnered with Chicago Public Schools to identify the three or four core indicators that schools must actively manage to support student success, and develop an instrument to assess these indicators. The result was what Chicago has called the Student Connection Survey, which was administered to all high school students in 2006 and to all students in grades 6–12 in 2007. The purpose of this report is to begin a program of research to allow us to better understand how Student Connection constructs related to other educational quality indicators, and how they can be used for school performance management. The research presented in this report represents a solid first step. We have already begun planning ways to extend the work that has been started with the Spencer Foundation’s generous support. For example, AIR is working with an urban school district (with approximately 55,000 students) that has already administered our survey in 2008. We have an opportunity to work with them to explore some of the research questions (such as the relationship between school observations and Student Connection scores) that we were not able to study in Chicago, due to lack of permission or lack of data. This report begins to explore relations between Student Connection and several student and school characteristics using data from Chicago Public Schools. We learned quickly that the Student Connection constructs related to student and school covariates differently in the middle grades vs. high school. Students in the middle grades (6–8) score higher on all scale scores, but the strength of the association among the constructs and covariates is larger in high school. We learned that the constructs composing our Student Connection measure: Safety, Academic Rigor, Student Support, and Social Emotional Learning Skills, have each established their validity by correlating significantly with relevant student- and school-level variables. Of the scales, both Safety and Academic Rigor are strongly associated with achievement. Safety is more strongly related to standardized achievement test scores, and Academic Rigor is more strongly related to grade point average. In this report, we explore a variety of intriguing subgroup interactions and effects. Next steps in our work include preparing a journal manuscript presenting our analyses for peer review as well as submitting these data for presentation at professional conferences. We hope to work with Chicago for another year to extend our database longitudinally, as well as extend our work to other districts.

Final Narrative Report: Student Connection Research Grant # 200700169
1
INTRODUCTION In this current era of standards-based reform, much attention is paid to the role that schools play in raising students’ academic achievement. Schools are held accountable for the academic progress of all students, and are therefore implementing programs and strategies designed to help all students achieve high academic standards. This improvement process is especially critical for schools that serve traditionally disadvantaged student populations. Successful schools are those which are able to mitigate any potentially negative impact on students due to experiences outside the school setting by creating and maintaining within the school what are referred to as effective conditions for learning. Such conditions typically include high-quality pedagogy, well-trained teachers, adequate resources, and effective leadership. Another equally, if not more important set of conditions is called the social and emotional conditions for learning. Students who feel “connected” to school across these social/emotional indicators are more likely to have improved attitudes towards school, learning, and teachers; heightened academic aspirations, motivation, and achievement; and more positive social attitudes, values, and behavior (Resnick et al., 1997). Recent research emphasizes the view that learning is possible only after students’ social, emotional, and physical needs have been successfully met (CASEL, 2003; Learning First Alliance, 2001; Osher, Dwyer, and Jackson, 2004). The social and emotional conditions for learning include a number of factors that are essential for ensuring that students feel safe and supported in school. Specifically, there are four components that define the social and emotional conditions for learning: (1) school safety, (2) high expectations, (3) student support, and (4) social and emotional skills. Research and practical experience demonstrate that a high level of school safety and student discipline that comes as a result of high expectations and effective supports reduces administrative burdens and allows teachers to spend more time on the task of raising academic performance (Osher, Dwyer, & Jackson, 2004). First, school safety refers to an overall school climate in which students feel physically and emotionally safe. There is little to no violence, fighting, bullying, crime, substance abuse, or gang presence. Overall, there is a climate of mutual respect and trust among all members of the school community, and students feel comfortable in taking personal and academic risks. Failure to support academic achievement is related to students’ disengagement from school and increased risk-taking behavior (Blum, Beuhring, & Rinehard, 2000). A safe and supportive learning environment fulfills students’ basic psychological needs for belonging, autonomy, influence, competence, and physical security. As these needs are met, students tend to become increasingly committed to the school community’s norms, rules, and values (Learning First Alliance, 2001). Research also shows that the physical environment can have a profound effect on the ability of students to learn efficiently (National School Boards Association, 1996). An analysis in schools of such areas as bathrooms, cafeterias, hallways, and isolated areas can determine if safety “hot spots” exist. With this information, a school improvement team can change the environment to minimize opportunities for inappropriate behavior (Dwyer & Osher, 2000). In addition, providing teachers and other staff with opportunities to influence decisions on school safety

Final Narrative Report: Student Connection Research Grant # 200700169
2
policy (as well as other student connection indicators) can help to create a more cohesive, well functioning professional community (Smylie, 1994). Finally, students who participate in structured extracurricular activities are less likely to engage in negative and risky behaviors and have better attendance, lower dropout rates, lower rates of drug use, high academic achievement, and higher aspirations than nonparticipants (Brown & Theobald, 1998; Mahoney, 2000). A second key component to the social and emotional conditions of learning is high expectations. Schools may be safe and orderly, but if they fail to build a supportive, engaging community and press for high academic expectations, students learn little (Learning First Alliance, 2001). Teachers should have high expectations for students in terms of the level of effort they put forth, as well as the academic and behavioral standards to which they are expected to achieve. Ideally, teachers and other school staff provide rigorous academic support to all students, and work to ensure that the curriculum has direct relevance to students’ life goals. In addition, all students have access to high-level, demanding courses, as well as service learning opportunities, extra-curricular activities, and internships that allow them to explore their postsecondary options. Research has shown that when students feel that teachers and other adults hold high expectations for them, they are likely to do better in school (Catalano et al., 2004). Examinations of the NELS: 88 survey, which collects data from students in high school, established that students are more likely to perform well on tests when they believe that their teachers care about them and that this relationship is stronger for students who are judged to be at risk for dropping out of high school (Muller, 2001; Ryan & Patrick, 2001). In the classroom, cooperative learning strategies (e.g., group discussions, presentations, projects) have been shown to promote the development of social skills in students, sense of the classroom as a community, and academic achievement (Johnson and Johnson, 1989; Slavin, 1990). Finally, students who perceived their teachers as warm, caring and supportive had higher classroom participation rates which in turn positively affected their academic achievement (Voelkl, 1995). In addition to holding high expectations of students, an overall sense of student support is critical. When coupled with a consistent emphasis on academic performance, a strong sense of support and school community boosts academic achievement. There is also evidence that these effects may be most pronounced for at-risk students (Shouse, 1996). Establishing effective student supports involves ensuring that children’s basic needs are met and that the significant adults in their lives work collaboratively to encourage, support, and nurture them. Students work with and receive support from teachers who are able to establish a connection with them, personalize their experience, and engage them in the learning process. For example, examinations of national data have shown that positive student beliefs about how much their teachers support their efforts to succeed in school can reduce the probability of their dropping out by half (Croninger & Lee, 2001). A study of 167 sixth-grade students found that student support was associated with increased grade-point-averages, through its effects on interest in class, interest in school, and social responsibility (Wentzel, 1998). Goodenow (1993) found teacher support to be predictive of a students’ expectancy of success, which in turn predicted their class effort and resulting grades. Other studies of interventions designed to build relationships between adults and students in school have also shown a positive impact of these programs on school-related attitudes and motives (Battistich, 2001; Sinclair, Christenson & Thurlow, 2005).

Final Narrative Report: Student Connection Research Grant # 200700169
3
Finally, schools that provide sufficient conditions for learning ensure that students learn and exhibit the social and emotional skills they need to succeed. Social and emotional learning is the process of developing the ability to recognize and manage emotions, develop caring and concern for others, make responsible decisions, establish positive relationships, and handle challenging situations effectively. Related skills that can be developed and reinforced in schools include relationship building, anger management, and responsible decision-making (CASEL, 2003; U.S. Department of Education, 2000). Students with strong social and emotional skills are able to maintain healthy interpersonal relationships with peers and adults, and have access to a multitude of coping strategies to manage stress and difficult situations. Moreover, social and emotional skills are strongly tied to learning and performance at school. Evidence from social and emotional learning programs suggests that social and emotional skills increase students’ capacity to cope with emotional experiences that interfere with learning, to work effectively with other students in the classroom, to face barriers to academic achievement, and to set and strive towards academic goals. Several studies have found that early evidence of pro-social behaviors (e.g., effective problem-solving, effective decision-making, and effective interpersonal relationships) predicts better academic outcomes later on. For example, one study found that good behavioral conduct during late childhood (ages 8–12) had a direct positive impact on academic success during late adolescence (ages 17–23) (Masten, et al., 1995). Another recent study found that higher levels of social and emotional skills in 7th grade significantly predicted higher academic achievement in 10th grade (Fleming et al., 2005). This research strongly suggests that social and emotional learning has an enduring impact on outcomes related to school achievement.
Schools can promote social and emotional skills through regular practice and modeling among adults and students in the school, and by placing a high value on conflict resolution, communication, caring, appreciation for diversity, problem solving, and teamwork. Research on social and emotional programming suggests that maximizing students’ opportunities for participation and choice is essential for fostering student decision-making abilities, self-efficacy, self-expression, personal responsibility and accountability (CASEL, 2006; Zins, Weissberg, Wang, & Walberg, 2004). School interventions that have focused on creating a caring learning environment and providing students with the skills and supports to manage school transitions have proven effective in increasing attendance, GPA and stability of self-concept, and decreasing drop-out, emotional and behavioral problems (Felner & Adan, 1988; Reyes & Jason, 1991). Mentoring programs provide the relational context for promoting social and academic competence, and in research have resulted in improvements in school attendance, parental relations, academic performance and peer emotional support, as well as decreases in conduct problems in youth (Catalano, Berglund, Ryan, Lonczak & Hawkins, 2004). Diverse instructional and classroom management practices, including cooperative group learning, service learning strategies and positive behavioral supports, have a significant impact on improving student relations, academic gains, prosocial attitudes and behavior, cognitive problem-solving abilities, empathy, sense of civic responsibility and sense of contributing to the community (Battistich, Solomon, Watson, Solomon, & Schaps, 1989; Billig, 2000; Elias, 2003; Johnson, Johnson, Maruyama, 1983; Yamauchi, Billig, Meyer, & Hofshire, 2006). In addition, social and emotional skills can significantly improve learning in the classroom when they are integrated into different subject matter (CASEL). Involving parents and community members in teaching and reinforcing the development of social and emotional skills appears to be a cornerstone of many effective youth development programs (Zins et al., 2004). Specifically, research suggests that when

Final Narrative Report: Student Connection Research Grant # 200700169
4
parents are involved in implementing social and emotional interventions, students benefit more and the effects of participation are more lasting and pervasive (Elias, 2003). Building a comprehensive plan for improving student connection across the critical components of safety, high expectations, student support, and social and emotional skills takes time and requires input, planning, and commitment from students, teachers, administrators, school counselors, psychologists, parents, and relevant community agencies (CASEL, 2003). Beyond the presence of caring and committed stakeholders, it requires the presence of developmentally appropriate programs for children that teach and reinforce social and problem-solving skills, and engaging curricula combined with high teacher expectations. Improving the level of student connection in schools requires a long-term school and district commitment to planning, leadership, use of data, and staff development to build capacity for continued student support.
AIR’s Survey of the Social and Emotional Conditions for Learning (the Student Connection Survey) For years, AIR has been actively pursuing the goal of promoting and assisting states’ and districts’ measurement of students’ social and emotional development as part of a performance management plan. Our research and experience tell us: • Enhancing students’ connection to school, their commitment to achieve, and their social,
emotional, and civic competencies improves their academic performance and positive development (Greenberg et al., 2003; McNeeley, Nonnemaker, & Blum, 2002; Osher et al., in press; Zins et al., 2004).
• Many students experience individual-level barriers to learning (such as social, economic, or health challenges), and the provision of high-quality instruction alone will not improve these students’ performance (Adelman & Taylor, 2000; Osher, Dwyer, & Jackson, 2004).
• Students who attend safe schools are more likely to be academically engaged and are less likely to exhibit problem behaviors such as drug use or violence. Students are less likely to drop out of safe schools (Bekuis, 1995; Bryk & Thum, 1989; Greenberg, Skidmore, & Rhodes, 2004; Osher, Dwyer, & Jimerson, 2005).
• Many barriers, including disinterest, lack of knowledge, and lack of resources, prevent educators from addressing students’ social and emotional factors as part of school reform efforts.
• What gets assessed gets addressed; measurement of social and emotional development in schools, whether as part of a performance management strategy or not, will tend to increase educators’ attention to the role these factors play.
History of AIR’s Work on the Social and Emotional Conditions for Learning In 2003, AIR identified the importance of assessing the social and emotional conditions for learning and developed a collaboration with the Collaborative for Academic, Social, and Emotional Learning (CASEL) and the Learning First Alliance (LFA) to develop approaches to address these issues. In April 2004, these three organizations co-hosted a meeting of national experts sponsored by the Fetzer Institute titled Safe, Supportive, and Successful Schools for All Students. The meeting’s purpose was to launch an initiative to foster the development of safe, supportive learning communities as a means to meet high academic standards. Our basic premise was that the approach to standards-based reform, which has been effective in focusing educators on advancing academic achievement—establishing standards, measuring progress toward

Final Narrative Report: Student Connection Research Grant # 200700169
5
meeting those standards, and supporting a continuous improvement process for making corrections and aligning resources to meet standards—should be expanded to explicitly address personal, social, and organizational facilitators of learning, and that doing so will, in turn, support greater academic and life success for more students. Our initiative progressed substantially in July 2005 when Chicago Public Schools (CPS) asked AIR, on a sole-source basis, to demonstrate that conditions for learning could be assessed and to identify three or four indicators for CPS’ high school scorecards that reflect the conditions for learning in a school, such as school climate or student engagement. The indicators had to be (1) practical to measure, (2) scientifically valid, (3) easy to communicate to diverse audiences, and (4) actionable by school personnel. In August 2005, AIR convened a meeting of national experts in Chicago specifically to address this charge. The group worked with CPS district staff and came to a strong, clear consensus on the most important factors that schools should address if they want to improve student attendance, achievement, graduation, and post secondary success, as well as actionable indicators of these factors. The indicators identified by the meeting participants as most critical, grouped broadly as the social and emotional conditions for learning, are (1) students are safe, (2) students are challenged, (3) students are supported, and (4) students are socially and emotionally skilled. Each of these indicators has extensive research to support its importance for schools and its link to students’ academic success, graduation, and postsecondary success. For each measure, meeting participants defined what each indicator covered, identified some available measures, and described ways that schools could use these measures to improve the conditions for learning. A table summarizing the conceptual foundation for the survey is presented in Table 1below. Table 1 Constructs in the Student Connection Survey Students are safe
• Physically safe • Emotionally and socially safe • Treated fairly and equitably • Avoid risky behaviors
Students are challenged • High expectations • Strong personal motivation • School is connected to life goals • Rigorous academic opportunities
Students are socially capable • Emotionally intelligent and
culturally competent • Responsible and persistent • Cooperative team players • Contribute to school and
community
Students are supported • Meaningful connection to adults • Strong bonds to school • Positive peer relationships • Effective and available support
From concept to implementation AIR conducted a series of 22 structured focus groups with students, parents, and teachers to inform the survey with the authentic input of stakeholders. Based on expert consensus and this stakeholder input, the Co-Principal Investigators for the current project, along with Drs. Roger Weissberg and Mary Utne O’Brien of CASEL, conducted a review of school climate surveys to

Final Narrative Report: Student Connection Research Grant # 200700169
6
identify items that were already proven to be reliable and valid. Where extant items did not provide sufficient coverage of the desired constructs, the team wrote new items. AIR pilot tested candidate items with almost 1,700 students in 24 schools to identify psychometrically strong scales for the operational survey. We administered the operational survey to students in 115 Chicago high schools and attained a response rate (77%; 74,602 valid surveys) approaching the average daily attendance rate of 84%. For the 2006–07 school year, Chicago asked AIR to include students in grades 6–8 in the survey and to modify some of the items to increase the range of responses on items and to attain greater between-school variance. AIR revised items and tested the new scales in cognitive laboratory interviews with diverse students in grades 6–12. We pilot tested the new version in 21 high schools (n=1,359) and 24 elementary schools (n=1,685), resulting in a stronger survey instrument. The 2007 operational administration, which was combined in the same form with the Consortium on Chicago School Research’s survey, obtained 60,802 valid surveys from 119 high schools (at a 64% response rate) and 76,187 valid surveys from 484 elementary schools (at an 83% response rate). Chicago Public Schools will be administering the survey again in 2008 on its own.
Surveying the Social and Emotional Conditions for Learning for Performance Management and Continuous Improvement AIR has done more than develop a survey. Our work for Chicago Public Schools includes two additional components. The second component is an 8 page customized report for each school that provides information on how subgroups of students responded as well as explanations of the significance of the responses (see Figure 1for images of the cover and a sample page of the report). The third component is an online toolkit (www.cpstoolkit.com) available to support schools that use the survey. The toolkit, which is linked to the individual school reports, is designed to help school teams use the survey information by presenting the school’s survey results, housing a database of evidence-based programs and strategies for addressing student connection issues, providing advice for how to look at data, implement programs, and take the next steps, and providing a forum for offering comments or quotes about personal experiences with a program or strategy. The programs and strategies identified include universal,
Figure 1 Student Connection Survey Score Report to Schools

Final Narrative Report: Student Connection Research Grant # 200700169
7
selective/targeted, and indicated/intensive programs, which have been demonstrated to work with similar groups of students in similar contexts. The purposes of implementing these activities includes (1) changing discourse within districts, as school and district staff discuss the conditions for learning; (2) orienting the behavior of principals, school staff, and district personnel to addressing the social and emotional conditions for learning in a strategic manner; (3) monitoring how subgroups of students and schools are doing; (4) providing data for continuous improvement; and (5) creating conditions where schools, districts, and states can learn about the importance of addressing the social and emotional conditions for learning.
The Present Research In spite of the examples of progress in this area noted above, barriers remain. The first is to demonstrate the importance of social-emotional factors in education. Although more research is accumulating, it is important to assess and demonstrate the impact of the social emotional conditions for learning and of addressing these conditions effectively. The second barrier is financial; doing good surveys and providing support for responding to these surveys is not inexpensive. Paradoxically, as long as social emotional are factors marginalized, it will be hard to generate the resources for such surveys. Therefore, the information produced through the efforts supported by this grant represents a potential vehicle for addressing these barriers. AIR’s specific goal for the current research was to develop a refined understanding of 1) the construct of student connection and how it relates to schools and schooling, and 2) the performance and characteristics of the Student Connection survey itself. We examined the relations between conditions for learning and students’ and schools’ academic performance and other characteristics, and examined relations by type of student and type of context. There were eight research questions originally proposed for this grant: 1. How do students’ individual ratings of their experience of the conditions for learning in a
school relate to individual student achievement? Does the strength of this relation change when we look at different subgroups of students, including those who are on or off track for graduation?
2. Do conditions for learning vary systematically by school characteristics, such as school size, demographics, school type, or principal characteristics?
3. To what extent to student perceptions of the conditions for learning in a school relate to objective data available to principals for decision-making?
a. How do student perceptions of safety relate to numbers of incidents reported to police or disciplinary data?
b. How do student perceptions of high expectations relate to schoolwide achievement, grade retention rate, and dropout rate?
c. How do student perceptions of student support relate to school size (as a proxy for personalization)?
d. How do student perceptions of the level of social emotional learning skills in a school related to school disruption measures and graduation rates?
Final Narrative Report: Student Connection Research Grant # 200700169
8
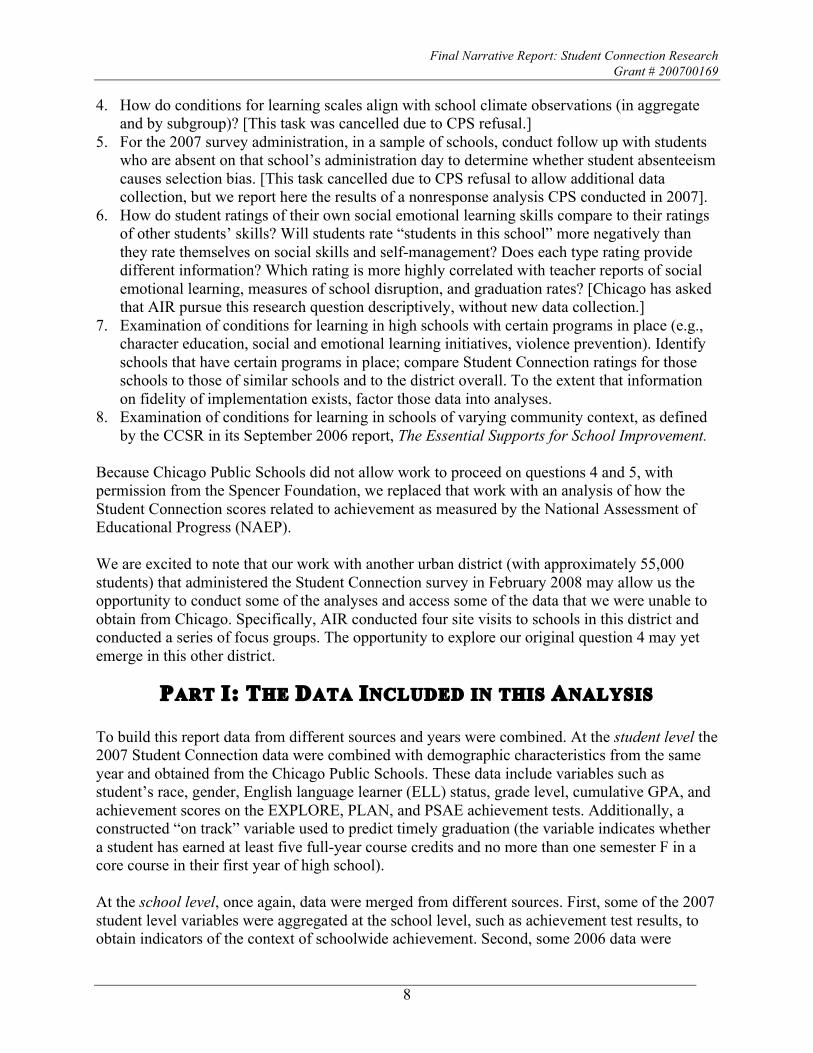
4. How do conditions for learning scales align with school climate observations (in aggregate and by subgroup)? [This task was cancelled due to CPS refusal.]
5. For the 2007 survey administration, in a sample of schools, conduct follow up with students who are absent on that school’s administration day to determine whether student absenteeism causes selection bias. [This task cancelled due to CPS refusal to allow additional data collection, but we report here the results of a nonresponse analysis CPS conducted in 2007].
6. How do student ratings of their own social emotional learning skills compare to their ratings of other students’ skills? Will students rate “students in this school” more negatively than they rate themselves on social skills and self-management? Does each type rating provide different information? Which rating is more highly correlated with teacher reports of social emotional learning, measures of school disruption, and graduation rates? [Chicago has asked that AIR pursue this research question descriptively, without new data collection.]
7. Examination of conditions for learning in high schools with certain programs in place (e.g., character education, social and emotional learning initiatives, violence prevention). Identify schools that have certain programs in place; compare Student Connection ratings for those schools to those of similar schools and to the district overall. To the extent that information on fidelity of implementation exists, factor those data into analyses.
8. Examination of conditions for learning in schools of varying community context, as defined by the CCSR in its September 2006 report, The Essential Supports for School Improvement.
Because Chicago Public Schools did not allow work to proceed on questions 4 and 5, with permission from the Spencer Foundation, we replaced that work with an analysis of how the Student Connection scores related to achievement as measured by the National Assessment of Educational Progress (NAEP). We are excited to note that our work with another urban district (with approximately 55,000 students) that administered the Student Connection survey in February 2008 may allow us the opportunity to conduct some of the analyses and access some of the data that we were unable to obtain from Chicago. Specifically, AIR conducted four site visits to schools in this district and conducted a series of focus groups. The opportunity to explore our original question 4 may yet emerge in this other district.
PART I: THE DATA INCLUDED IN THIS ANALYSIS To build this report data from different sources and years were combined. At the student level the 2007 Student Connection data were combined with demographic characteristics from the same year and obtained from the Chicago Public Schools. These data include variables such as student’s race, gender, English language learner (ELL) status, grade level, cumulative GPA, and achievement scores on the EXPLORE, PLAN, and PSAE achievement tests. Additionally, a constructed “on track” variable used to predict timely graduation (the variable indicates whether a student has earned at least five full-year course credits and no more than one semester F in a core course in their first year of high school). At the school level, once again, data were merged from different sources. First, some of the 2007 student level variables were aggregated at the school level, such as achievement test results, to obtain indicators of the context of schoolwide achievement. Second, some 2006 data were
Final Narrative Report: Student Connection Research Grant # 200700169
9
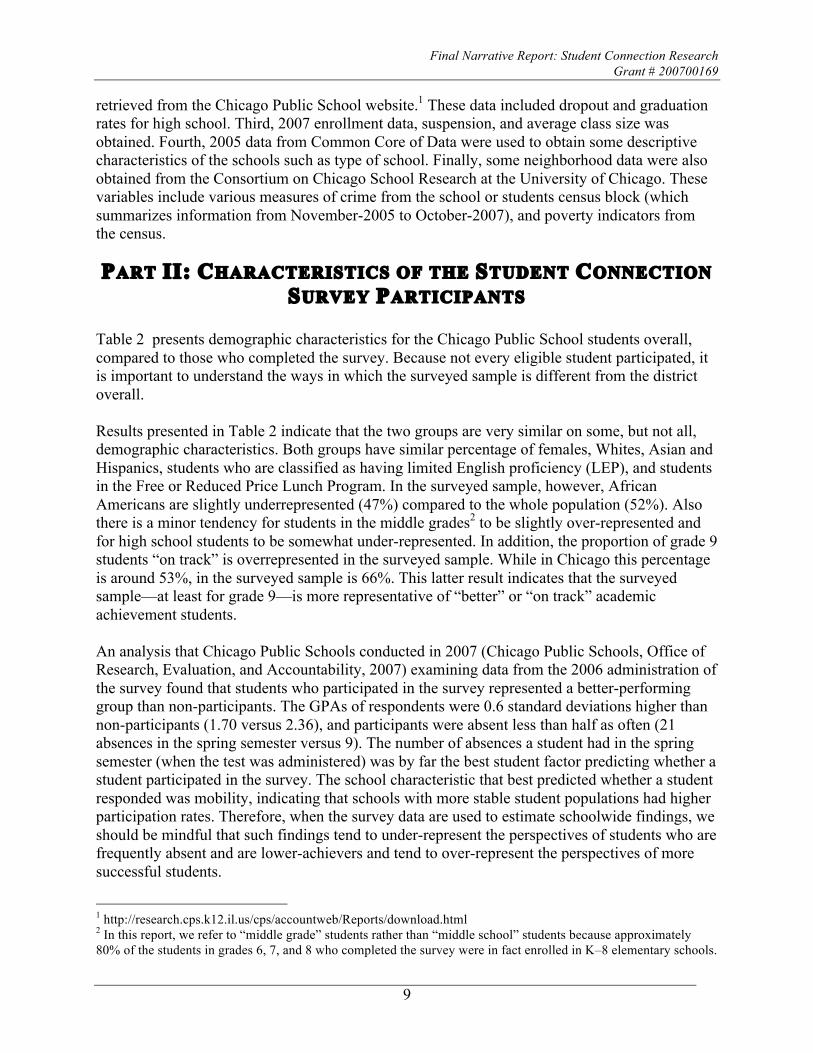
retrieved from the Chicago Public School website.1 These data included dropout and graduation rates for high school. Third, 2007 enrollment data, suspension, and average class size was obtained. Fourth, 2005 data from Common Core of Data were used to obtain some descriptive characteristics of the schools such as type of school. Finally, some neighborhood data were also obtained from the Consortium on Chicago School Research at the University of Chicago. These variables include various measures of crime from the school or students census block (which summarizes information from November-2005 to October-2007), and poverty indicators from the census.
PART II: CHARACTERISTICS OF THE STUDENT CONNECTION SURVEY PARTICIPANTS
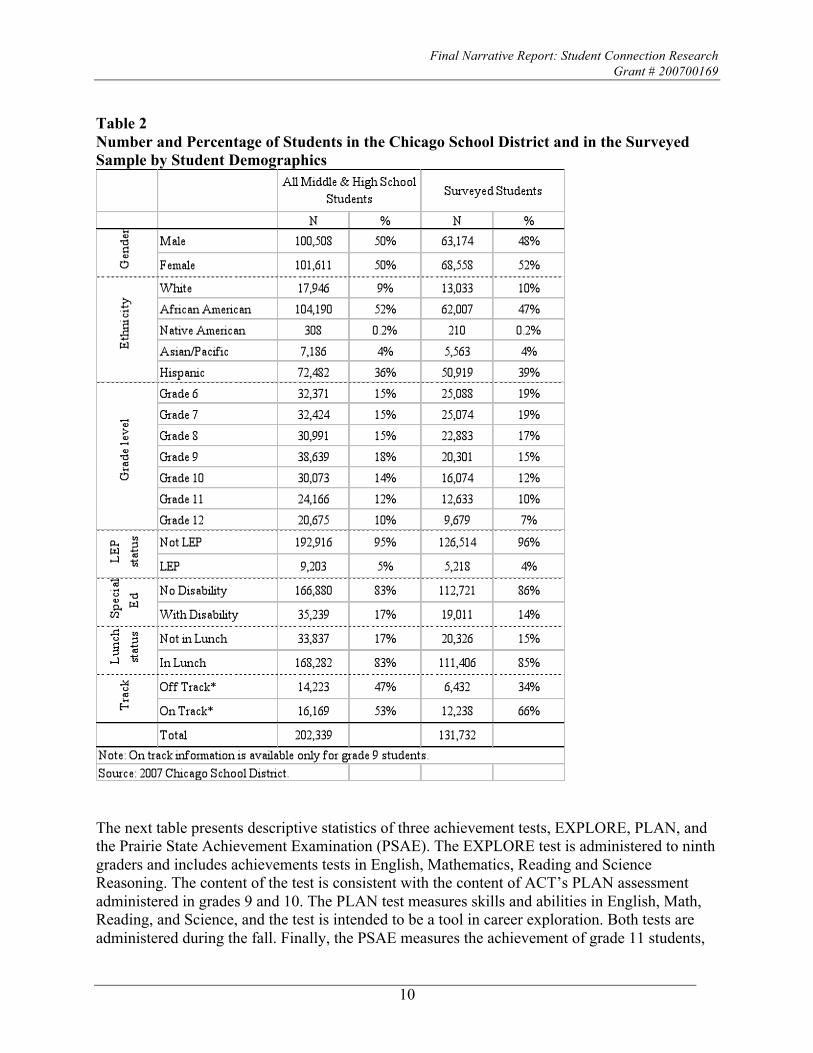
Table 2 presents demographic characteristics for the Chicago Public School students overall, compared to those who completed the survey. Because not every eligible student participated, it is important to understand the ways in which the surveyed sample is different from the district overall. Results presented in Table 2 indicate that the two groups are very similar on some, but not all, demographic characteristics. Both groups have similar percentage of females, Whites, Asian and Hispanics, students who are classified as having limited English proficiency (LEP), and students in the Free or Reduced Price Lunch Program. In the surveyed sample, however, African Americans are slightly underrepresented (47%) compared to the whole population (52%). Also there is a minor tendency for students in the middle grades2 to be slightly over-represented and for high school students to be somewhat under-represented. In addition, the proportion of grade 9 students “on track” is overrepresented in the surveyed sample. While in Chicago this percentage is around 53%, in the surveyed sample is 66%. This latter result indicates that the surveyed sample—at least for grade 9—is more representative of “better” or “on track” academic achievement students. An analysis that Chicago Public Schools conducted in 2007 (Chicago Public Schools, Office of Research, Evaluation, and Accountability, 2007) examining data from the 2006 administration of the survey found that students who participated in the survey represented a better-performing group than non-participants. The GPAs of respondents were 0.6 standard deviations higher than non-participants (1.70 versus 2.36), and participants were absent less than half as often (21 absences in the spring semester versus 9). The number of absences a student had in the spring semester (when the test was administered) was by far the best student factor predicting whether a student participated in the survey. The school characteristic that best predicted whether a student responded was mobility, indicating that schools with more stable student populations had higher participation rates. Therefore, when the survey data are used to estimate schoolwide findings, we should be mindful that such findings tend to under-represent the perspectives of students who are frequently absent and are lower-achievers and tend to over-represent the perspectives of more successful students.
1 http://research.cps.k12.il.us/cps/accountweb/Reports/download.html 2 In this report, we refer to “middle grade” students rather than “middle school” students because approximately 80% of the students in grades 6, 7, and 8 who completed the survey were in fact enrolled in K–8 elementary schools.
Final Narrative Report: Student Connection Research Grant # 200700169
10
Table 2 Number and Percentage of Students in the Chicago School District and in the Surveyed Sample by Student Demographics
The next table presents descriptive statistics of three achievement tests, EXPLORE, PLAN, and the Prairie State Achievement Examination (PSAE). The EXPLORE test is administered to ninth graders and includes achievements tests in English, Mathematics, Reading and Science Reasoning. The content of the test is consistent with the content of ACT’s PLAN assessment administered in grades 9 and 10. The PLAN test measures skills and abilities in English, Math, Reading, and Science, and the test is intended to be a tool in career exploration. Both tests are administered during the fall. Finally, the PSAE measures the achievement of grade 11 students,

Final Narrative Report: Student Connection Research Grant # 200700169
11
relative to the Illinois Learning Standards for Reading, Mathematics, and Science. The PSAE test is administered in late April. Table 3 Descriptive Statistics of the Test Scores for the Chicago School District and the Surveyed Sample
Note: The EXPLORE scores range from 1 to 25; the PLAN scores range from 1 to 32. Finally, the PSAE scores range from 120 to 200. Table 3 presents the number of students with data in each subscale for the three achievement tests, the subscale mean values, and the subscale standard deviations. Overall, students in the two groups look very similar in terms the average standardized achievement tests, but there is a tendency for surveyed students to have slightly higher average scores in all the subscales compared to the whole population. This is consistent with the response analysis reported in Table 2.

Final Narrative Report: Student Connection Research Grant # 200700169
12
Within the Chicago School District, approximately 83% of middle grade and high school students participate in the Free or Reduced Price Lunch Program (see Table 4, below). Despite this high percentage, there are still differences by student ethnicity. For example, only 48% and 59% of White and Native American students, respectively, participate in the Free or Reduced Price Lunch Program, 86% and 90% of African American and Hispanic students participate, respectively. In other words, the majority of African American and Hispanic students are in the lunch program, which indicates that in our sample, ethnicity is likely confounded with socioeconomic status. Table 4 Student Demographics and Poverty
In Lunch program
Student demographics No Yes Total
White 52% 48% 17,946
African American 14% 86% 104,190
Native American 41% 59% 308
Asian/Pacific 27% 73% 7,186
Ethn
icity
Hispanic 10% 90% 72,482
Non-LEP 17% 83% 192,916
LEP
stat
us
LEP 7% 93% 9,203
Non-SPED 16.6% 83.4% 166,880
Spec
ial
Ed
SPED 17.4% 82.6% 35,239
PART III: STUDENT CONNECTION RESULTS: OVERALL AND BY STUDENT SUBGROUP
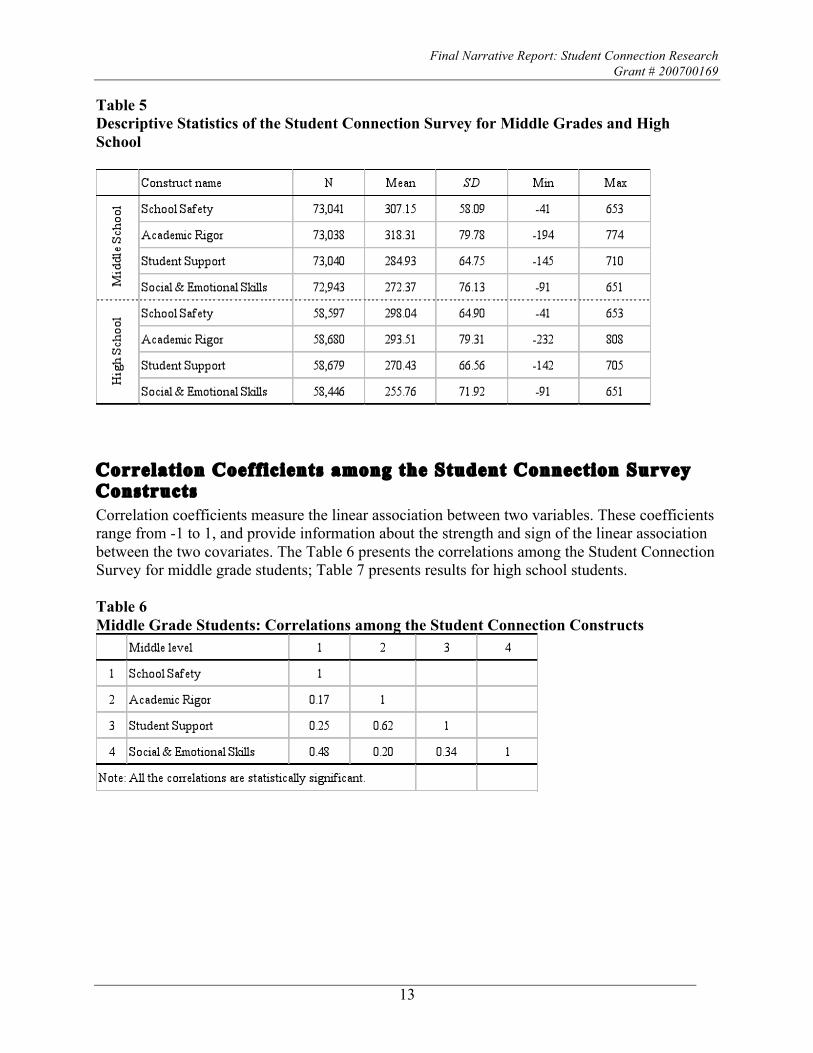
Before addressing each of the questions, we present a descriptive analysis of the Student Connection survey, as well as results by student subgroup. Table 5 presents the original distribution of the Student Connection Scales for middle grade and high school levels separately. It is important to notice that the constructs have different ranges, including negative values. However, the percentages of students with negative scores are less than one percent for all scales. Additionally, approximately one percent of students scored above 469, 524, 441, and 437 for the School Safety, Academic Rigor, Student Support, and Social Emotional scales respectively. For more information about the distribution of these scales see Appendix A.
Final Narrative Report: Student Connection Research Grant # 200700169
13
Table 5 Descriptive Statistics of the Student Connection Survey for Middle Grades and High School
Correlation Coefficients among the Student Connection Survey Constructs Correlation coefficients measure the linear association between two variables. These coefficients range from -1 to 1, and provide information about the strength and sign of the linear association between the two covariates. The Table 6 presents the correlations among the Student Connection Survey for middle grade students; Table 7 presents results for high school students. Table 6 Middle Grade Students: Correlations among the Student Connection Constructs

Final Narrative Report: Student Connection Research Grant # 200700169
14
Table 7 High School: Correlations among the Student Connection Constructs
As expected, all the scales are positively correlated with each other. In the middle grades, the correlations between School Safety and Academic Rigor and Safety and Student Support are small and equal to .17 and .25 respectively, which suggests that these are separate constructs. The correlation between School Safety and Social Emotional Learning Skills is moderate and equal to .48, suggesting that students who feel safer at school tend to rate the social emotional learning skills of their peers more highly. This makes sense because some of the items on the Safety Scale assess “emotional safety”—the extent to which students are picked on or bullied. Academic Rigor is highly correlated with Student Support (r=.62), which makes sense because both scales ask students to rate teacher or school factors. Academic Rigor is less correlated with Social Emotional Skills (r = .20). Finally, Student Support has a small correlation with Social Emotional Skills (r = .34). In high school, the correlations among the SCS constructs tend to be slightly higher than those in the middle grades, but show the same patterns.
Mean Student Connection Survey Values for Middle Grades and High School The following figures present the mean values on the scales by different student demographic characteristics. It is important to remember when examining these figures that the ranges of the constructs to some extent different. Therefore, comparisons are more meaningful when done within the same construct.

Final Narrative Report: Student Connection Research Grant # 200700169
15
Figure 2 Mean Student Connection Scores for Middle Grades and High School The results presented above shows that middle grade students tend to provide higher scores on all the Student Connection Scales than high school students. All these differences are statistically significant. For example, of the School Safety scale, while middle grade students scored on average above 300 points, high school students scored below 300 points. These are very interesting results which can have different interpretations. On one hand, they can suggest that the older the students, the lower their perceptions of Safety, Academic Rigor, Student Support, and Social Emotional Skills. Perhaps older students’ perceptions of their surroundings are more realistic or critical than those of their younger peers. On the other hand, it may be the case that the actual conditions for learning get worse in high school. Perhaps high schools in Chicago are less safe, teachers have lower expectations, students receive less support, and they are less likely to have prosocial peers compared to middle grade students. Or maybe both interpretations explain these differences; additional data would need to be collected to explain these effects. Nonetheless, the finding of lower ratings for variables, such as school climate, that are similar to conditions for learning is consistent with a broader body of research and experience that shows that both students and staff report progressively less satisfaction as they advance higher in grade levels (Eccles & Midgley, 1989).3 To provide some evidence on how some of the conditions for learning and safety problems (such as disciplinary referrals) change from middle to high school, data on truancy and suspensions
3 Except for students in alternative or special schools; regardless of grade levels, such schools tend to have school climate and connection scores similar to those of elementary schools (i.e., at the higher end; Spier, Cai, Kendziora, & Osher, 2007).

Final Narrative Report: Student Connection Research Grant # 200700169
16
were analyzed. These variables were highly positively skewed and therefore the range and median are reported instead of the mean values.4 Table 8 Number, Median and Range for Truancy and Suspensions
By far, behavioral problems are more common in high school than in middle grades. Although in middle grades, truancy ranged from 0 to 180 with a median of 2, in high school this variable ranges from 0 to 533 with a median of 39. Further, in middle grades the number of suspended students ranged from 0 to 317 and the median is 23, while the same indicator in high school ranged from 0 to 822 with a median of 154. Regarding the number of suspensions, this indicator ranged from 0 to 879 with a median of 33 in middle grades, and from 0 to 2496 with a median of 345 in high school. Although suspension data tend to reflect school policy as much as they do the actual incidence of behavior problems, these data suggest that there may be higher rates of school disruption in high schools compared to schools with middle grade students.
Mean Student Connection Survey Values by Grade Levels Additionally, we examined whether a specific grade levels responded systematically differently compared to other grade levels. We found that overall, grade-eight students showed a tendency to score higher on the School Safety and Academic Rigor scales than the other grade levels. It appears reasonable that the oldest age-group in K–8 schools might feel somewhat safer than students in younger grades. But it is less clear why grade-eight students tend to rate Academic Rigor most highly. The only other pattern to emerge was that for the Social and Emotional Learning scale, students tended to rate their peers more negatively as they moved along to higher grades. Because of the large differences between middle and high school students in their responses to the survey, we will show results separately for middle and high school students.
4 In a skewed variable there are more data in the right tails than would be expected in a normal distribution. With skewed variables the mean not longer provides a useful measure of central tendency.

Final Narrative Report: Student Connection Research Grant # 200700169
17
Table 9 Exploring Patterns across Grade Levels
Final Narrative Report: Student Connection Research Grant # 200700169
18
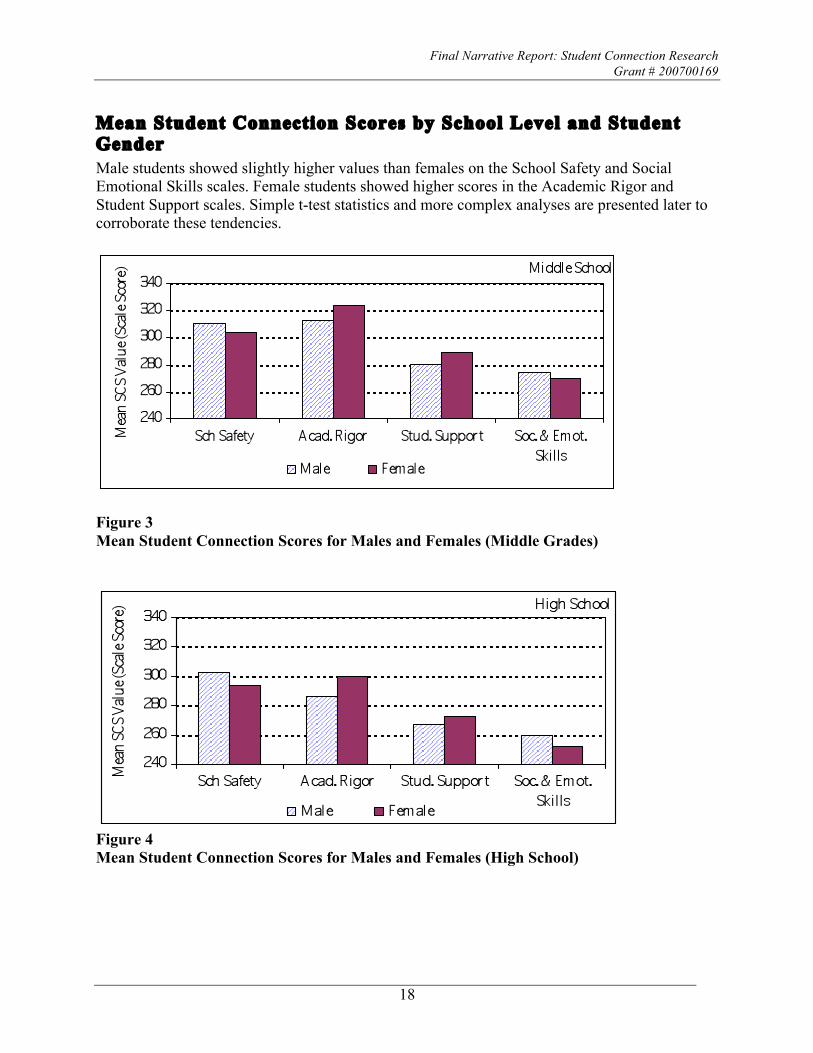
Mean Student Connection Scores by School Level and Student Gender Male students showed slightly higher values than females on the School Safety and Social Emotional Skills scales. Female students showed higher scores in the Academic Rigor and Student Support scales. Simple t-test statistics and more complex analyses are presented later to corroborate these tendencies.
Figure 3 Mean Student Connection Scores for Males and Females (Middle Grades)
Figure 4 Mean Student Connection Scores for Males and Females (High School)
Final Narrative Report: Student Connection Research Grant # 200700169
19
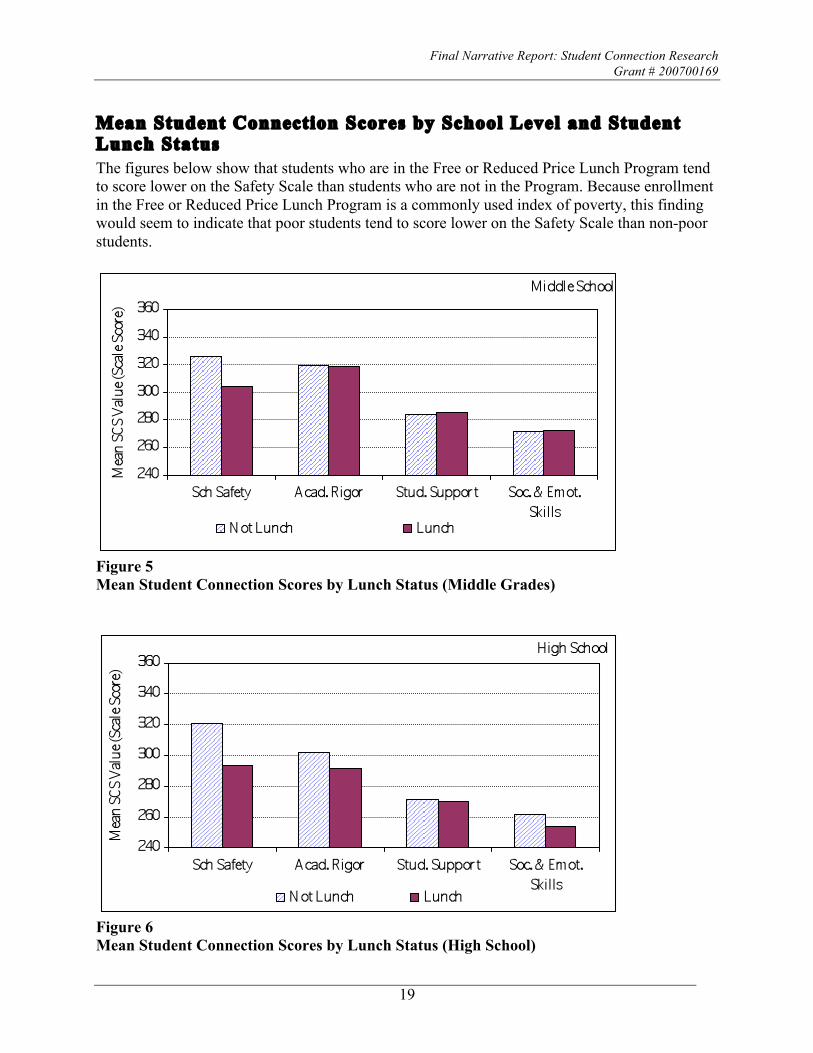
Mean Student Connection Scores by School Level and Student Lunch Status The figures below show that students who are in the Free or Reduced Price Lunch Program tend to score lower on the Safety Scale than students who are not in the Program. Because enrollment in the Free or Reduced Price Lunch Program is a commonly used index of poverty, this finding would seem to indicate that poor students tend to score lower on the Safety Scale than non-poor students.
Figure 5 Mean Student Connection Scores by Lunch Status (Middle Grades)
Figure 6 Mean Student Connection Scores by Lunch Status (High School)

Final Narrative Report: Student Connection Research Grant # 200700169
20
One hypothesis for why students in the Free or Reduced Price Lunch Program tend to score lower on the School Safety scale is that their sense of safety may be influenced by factors beyond the context of the school. Alternatively, these students may experience micro-climates within the school that are characterized by greater physical and social threat and victimization.
Mean Student Connection Scores by Gender and Lunch Status The figures below reveal that the differences previously found between females and males on the School Safety and Social Emotional Scales are likely to occur among Free or Reduced Price Lunch Program students but not among non- Free or Reduced Price Lunch students. For the Safety Scale, the gender differences are very small, with females scoring higher than males. In terms of Academic Rigor and Student Support, female students consistently scored higher than males.
Figure 7 Mean Student Connection Scores by Gender and Lunch Status (Middle Grades)
Figure 8

Final Narrative Report: Student Connection Research Grant # 200700169
21
Mean Student Connection Scores by Gender and Lunch Status (High School)
Mean Student Connection Scores by School Level and Student Ethnicity White and Asian students tended to produce the highest scores on the School Safety scale, while African American students tended to score the lowest on the Safety Scales and the Social Emotional Skills Scales. In the middle grades, students from different ethnicities scored similarly on Academic Rigor and Student Support. In high school, more differences were observed across ethnicity on Academic Rigor, where Asian students tended to score the highest.
Figure 9 Mean Student Connection Scores by Ethnicity (Middle Grades)

Final Narrative Report: Student Connection Research Grant # 200700169
22
Figure 10 Mean Student Connection Scores by Ethnicity (High School)
Mean Student Connection Scores by Ethnicity and Lunch Status The figure below illustrates ethnic differences on the pattern of response on the condition for learning scales controlling for the lunch status of the student. Previously we found that African American students tended to score the lowest on the School Safety Scale. Here we observed in the Lunch or non-Lunch groups, African Americans tended to provide the lowest scores on the School Safety scale.
Figure 11 Mean Student Connection Scores by Ethnicity and Lunch Status (Middle Grades)
Figure 12 Mean Student Connection Scores by Ethnicity and Lunch Status (High School)
Final Narrative Report: Student Connection Research Grant # 200700169
23
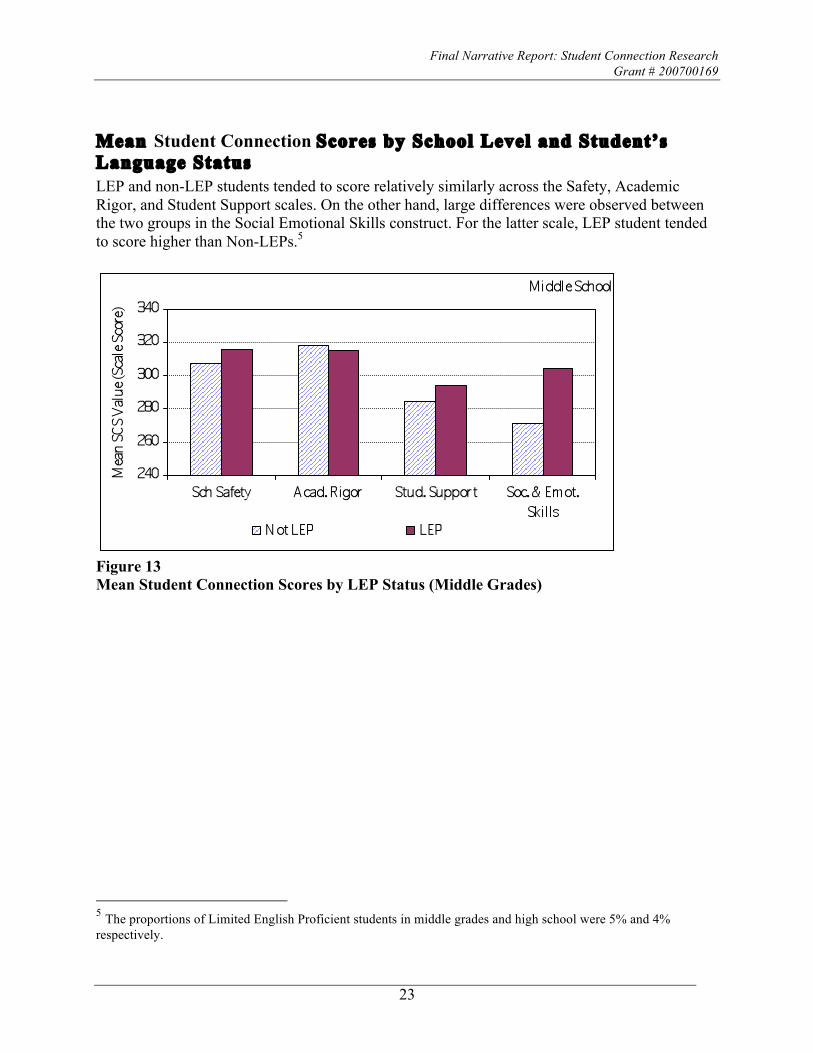
Mean Student Connection Scores by School Level and Student’s Language Status LEP and non-LEP students tended to score relatively similarly across the Safety, Academic Rigor, and Student Support scales. On the other hand, large differences were observed between the two groups in the Social Emotional Skills construct. For the latter scale, LEP student tended to score higher than Non-LEPs.5
Figure 13 Mean Student Connection Scores by LEP Status (Middle Grades)
5 The proportions of Limited English Proficient students in middle grades and high school were 5% and 4% respectively.

Final Narrative Report: Student Connection Research Grant # 200700169
24
Figure 14 Mean Student Connection Scores by LEP Status (High School)
Mean Student Connection Scores by School Level and Student’s Special Education Status There was tendency for non-special education students to score slightly higher on the School Safety and Academic Rigor Scales and for students in special education to provide higher scores on Student Support and Social Emotional Learning Skills scales. The results for Support were expected because the particular conditions of special education students require that they receive more support and help than other students. However, the finding that students receiving special education services rated the social emotional learning skills of their peers higher than did other groups may be an extension of our 2006 finding that when students with disabilities rated their own social emotional learning skills, they tended to rate themselves lower than their peers.

Final Narrative Report: Student Connection Research Grant # 200700169
25
Figure 15 Mean Student Connection Scores by SPED Status (Middle Grades)
Figure 16 Mean Student Connection Scores by SPED Status (High School)
PART IV: ADDRESSING THE RESEARCH QUESTIONS In this section, we address each of the research questions posed for this study in turn. The final research questions addressed through this grant were: 1. How do students’ individual ratings of their experience of the conditions for learning in a
school relate to individual student achievement? Does the strength of this relation change

Final Narrative Report: Student Connection Research Grant # 200700169
26
when we look at different subgroups of students, including those who are on or off track for graduation?
2. Do conditions for learning vary systematically by school characteristics, such as school size, demographics, school type, or principal characteristics?
3. To what extent to student perceptions of the conditions for learning in a school relate to objective data available to principals for decision-making?
a. How do student perceptions of safety relate to numbers of incidents reported to police or disciplinary data?
b. How do student perceptions of high expectations relate to schoolwide achievement, grade retention rate, and dropout rate?
c. How do student perceptions of student support relate to school size (as a proxy for personalization)?
d. How do student perceptions of the level of social emotional learning skills in a school related to school disruption measures and graduation rates?
4. How do student ratings of their own social emotional learning skills compare to their ratings of other students’ skills? Will students rate “students in this school” more negatively than they rate themselves on social skills and self-management? Does each type rating provide different information? Which rating is more highly correlated with teacher reports of social emotional learning, measures of school disruption, and graduation rates?
5. Examination of conditions for learning in high schools using AVID. 6. Examination of conditions for learning in schools of varying community context, as defined
by the CCSR in its September 2006 report, The Essential Supports for School Improvement. 7. How do Student Connection scores relate to achievement as measured by the National
Assessment of Educational Progress (NAEP)?
Question 1: Correlations between Achievement and Student Connection In the following figures, we present the correlation coefficients between the all the available achievement test scores for Chicago Public School students and the student connection constructs. Each correlation value is illustrated using a bar, where the size of the bar represents the linear strength between the two variables and the vertical axis shows the range of the correlation. Therefore, the taller the bar, the larger the correlation.
Correlations between EXPLORE and Student Connection Scales The following two figures show the correlation between EXPLORE tests and Student Connection scales for grades eight and nine respectively. For example, in grade eight, the Safety scale has a correlation of .16 with English, .19 with Mathematics, .17 with Reading and 0.18 with the Science component of this test. Overall, all the correlations are below .20 and statistically significant, except for the correlation between the Student Support and Science. In grade nine, the correlations are larger than in grade eight but uniformly below .30. However, several correlations are not statistically significant: the correlations between Student Support and English, Math and Reading are not significant, neither are the correlations between the Social and Emotional Skills and Math, and Reading and Science. Across constructs, we observed that four tests are more highly correlated with the Safety construct than any other scale.

Final Narrative Report: Student Connection Research Grant # 200700169
27
Figure 17 Correlation between EXPLORE subscales and SCS scales (grade 8)
Figure 18 Correlation between EXPLORE subscales and SCS scales (grade 9)
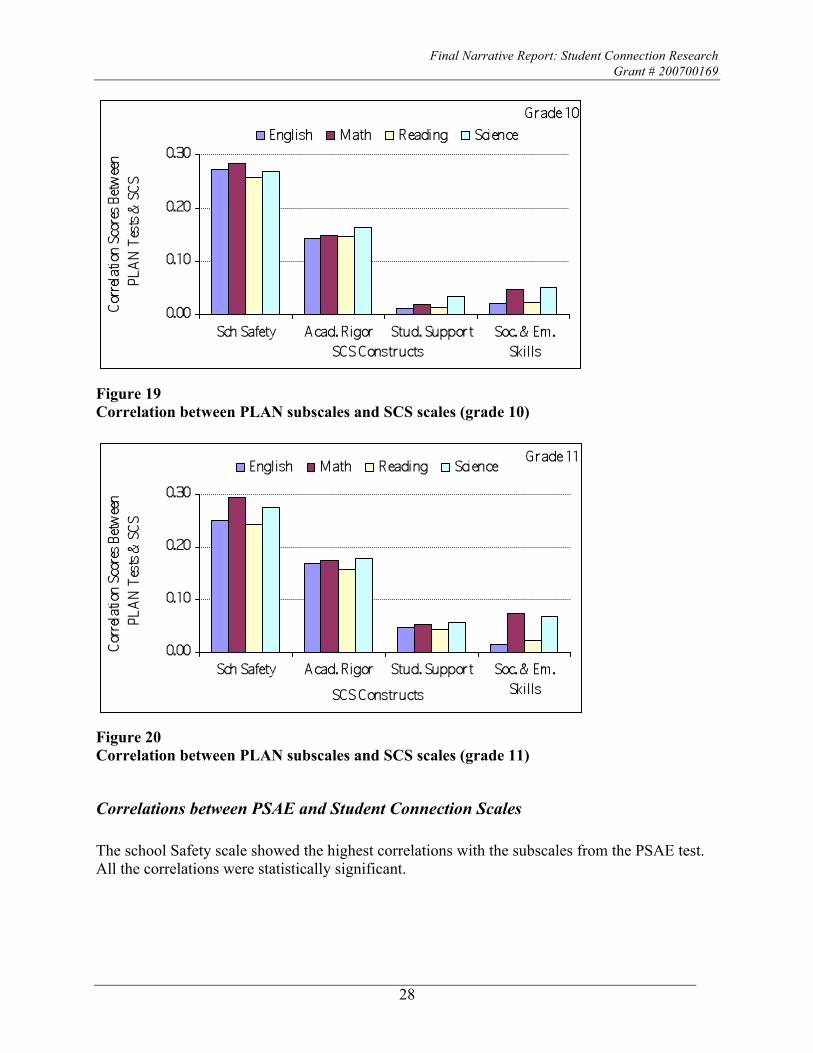
Correlations between PLAN and Student Connection Scales
Correlations among PLAN test scores and the SCS constructs were uniformly below .30, but were nonetheless mostly statistically significant. Only the correlations between Student Support and English, Student Support and Reading in grade 10, and Social Emotional Skills and English in grade 11 were not statistically significant.
Final Narrative Report: Student Connection Research Grant # 200700169
28
Figure 19 Correlation between PLAN subscales and SCS scales (grade 10)
Figure 20 Correlation between PLAN subscales and SCS scales (grade 11)
Correlations between PSAE and Student Connection Scales
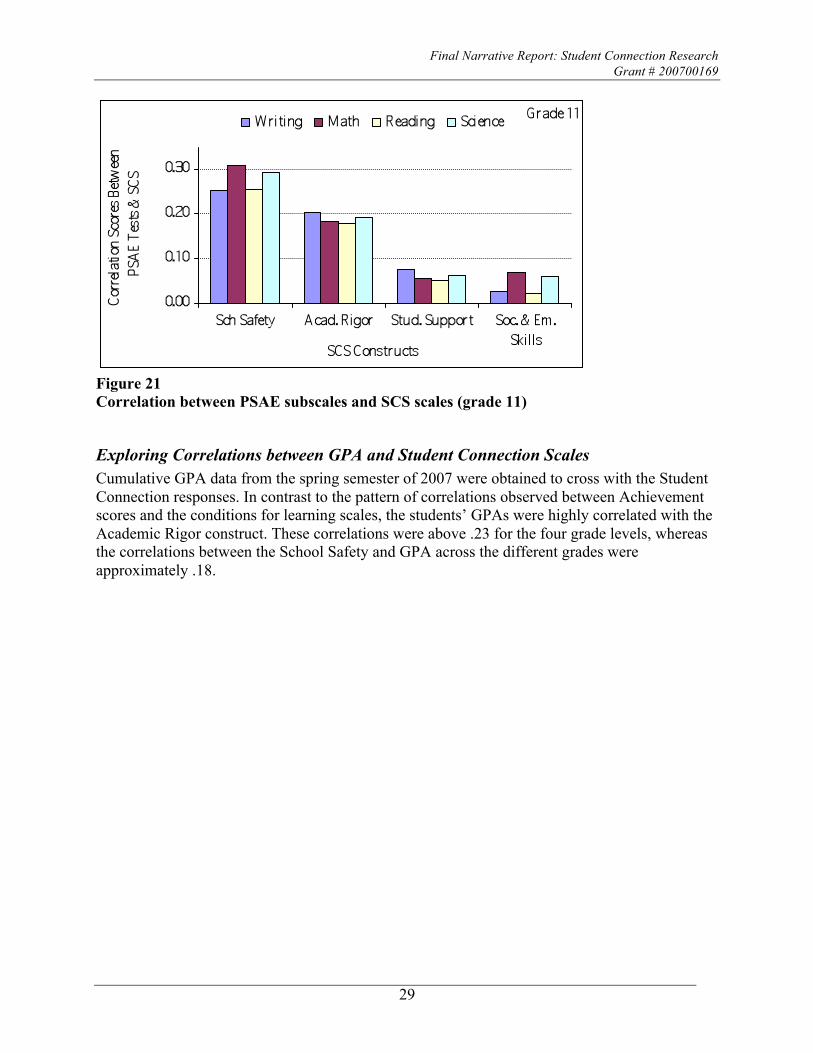
The school Safety scale showed the highest correlations with the subscales from the PSAE test. All the correlations were statistically significant.
Final Narrative Report: Student Connection Research Grant # 200700169
29
Figure 21 Correlation between PSAE subscales and SCS scales (grade 11)
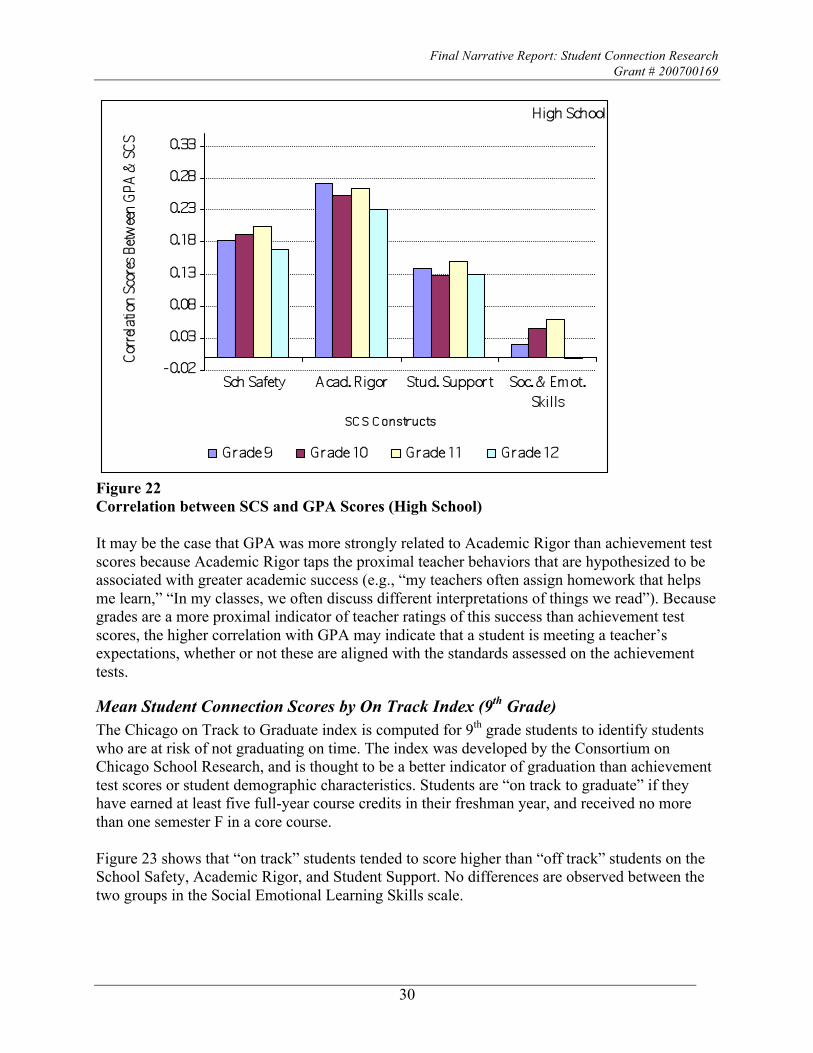
Exploring Correlations between GPA and Student Connection Scales Cumulative GPA data from the spring semester of 2007 were obtained to cross with the Student Connection responses. In contrast to the pattern of correlations observed between Achievement scores and the conditions for learning scales, the students’ GPAs were highly correlated with the Academic Rigor construct. These correlations were above .23 for the four grade levels, whereas the correlations between the School Safety and GPA across the different grades were approximately .18.
Final Narrative Report: Student Connection Research Grant # 200700169
30
Figure 22 Correlation between SCS and GPA Scores (High School) It may be the case that GPA was more strongly related to Academic Rigor than achievement test scores because Academic Rigor taps the proximal teacher behaviors that are hypothesized to be associated with greater academic success (e.g., “my teachers often assign homework that helps me learn,” “In my classes, we often discuss different interpretations of things we read”). Because grades are a more proximal indicator of teacher ratings of this success than achievement test scores, the higher correlation with GPA may indicate that a student is meeting a teacher’s expectations, whether or not these are aligned with the standards assessed on the achievement tests.
Mean Student Connection Scores by On Track Index (9th Grade) The Chicago on Track to Graduate index is computed for 9th grade students to identify students who are at risk of not graduating on time. The index was developed by the Consortium on Chicago School Research, and is thought to be a better indicator of graduation than achievement test scores or student demographic characteristics. Students are “on track to graduate” if they have earned at least five full-year course credits in their freshman year, and received no more than one semester F in a core course. Figure 23 shows that “on track” students tended to score higher than “off track” students on the School Safety, Academic Rigor, and Student Support. No differences are observed between the two groups in the Social Emotional Learning Skills scale.

Final Narrative Report: Student Connection Research Grant # 200700169
31
Figure 23 Mean Student Connection Scores by Track Status (Grade 9 Students)
Exploring Correlations between Test Scores and Student Connection Scales by Gender When exploring the correlations by gender, we found that the level of association between the Safety Scale and the EXPLORE subscales tended to be larger for females than for males.
Final Narrative Report: Student Connection Research Grant # 200700169
32
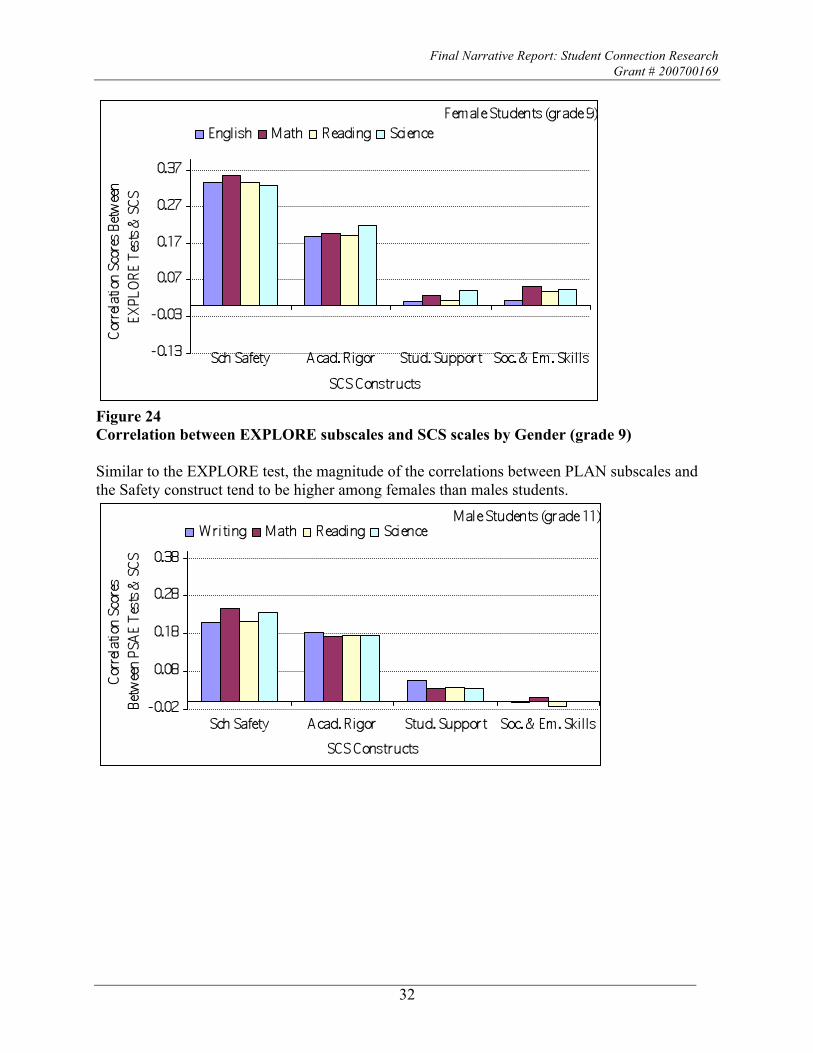
Figure 24 Correlation between EXPLORE subscales and SCS scales by Gender (grade 9) Similar to the EXPLORE test, the magnitude of the correlations between PLAN subscales and the Safety construct tend to be higher among females than males students.

Final Narrative Report: Student Connection Research Grant # 200700169
33
Figure 25 Correlation between PLAN subscales and SCS scales by Gender (grade 11) The pattern of associations between achievement and Student Connection by gender was also found for PSAE test scores. Correlations between PSAE test scores and SCS scale scores tended to be higher among female than male students.

Final Narrative Report: Student Connection Research Grant # 200700169
34
Figure 26 Correlation between PSAE subscales and SCS scales by Gender (grade 11)
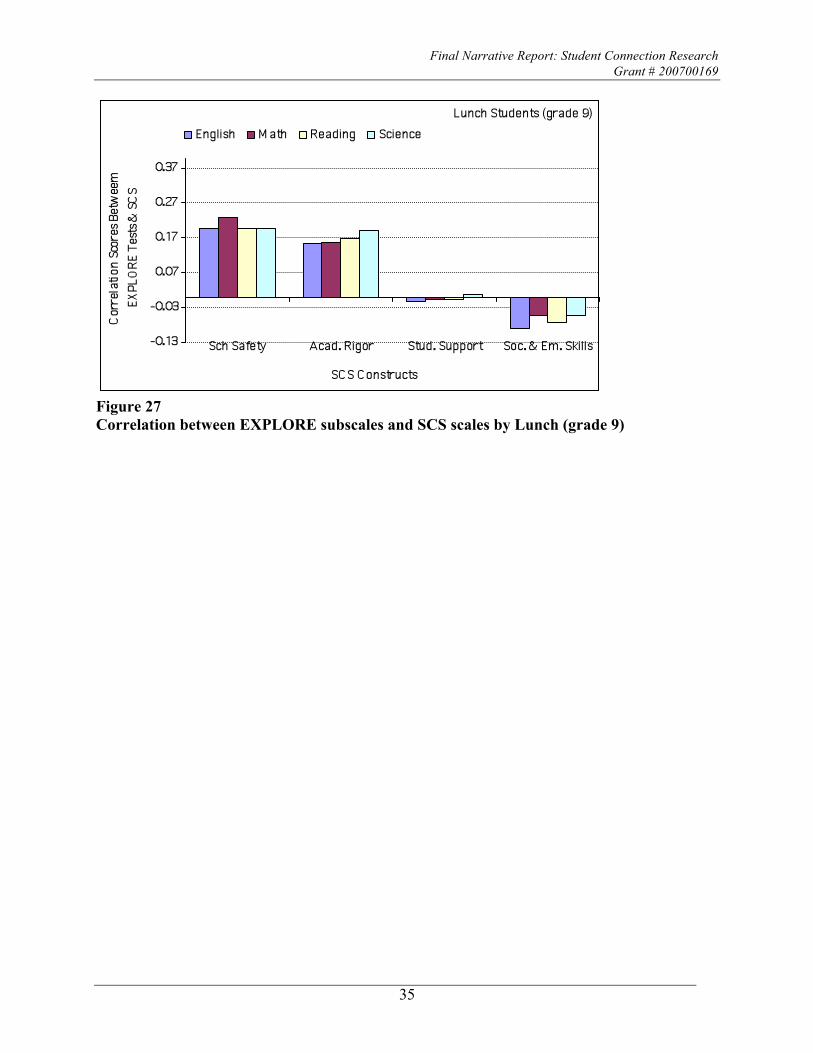
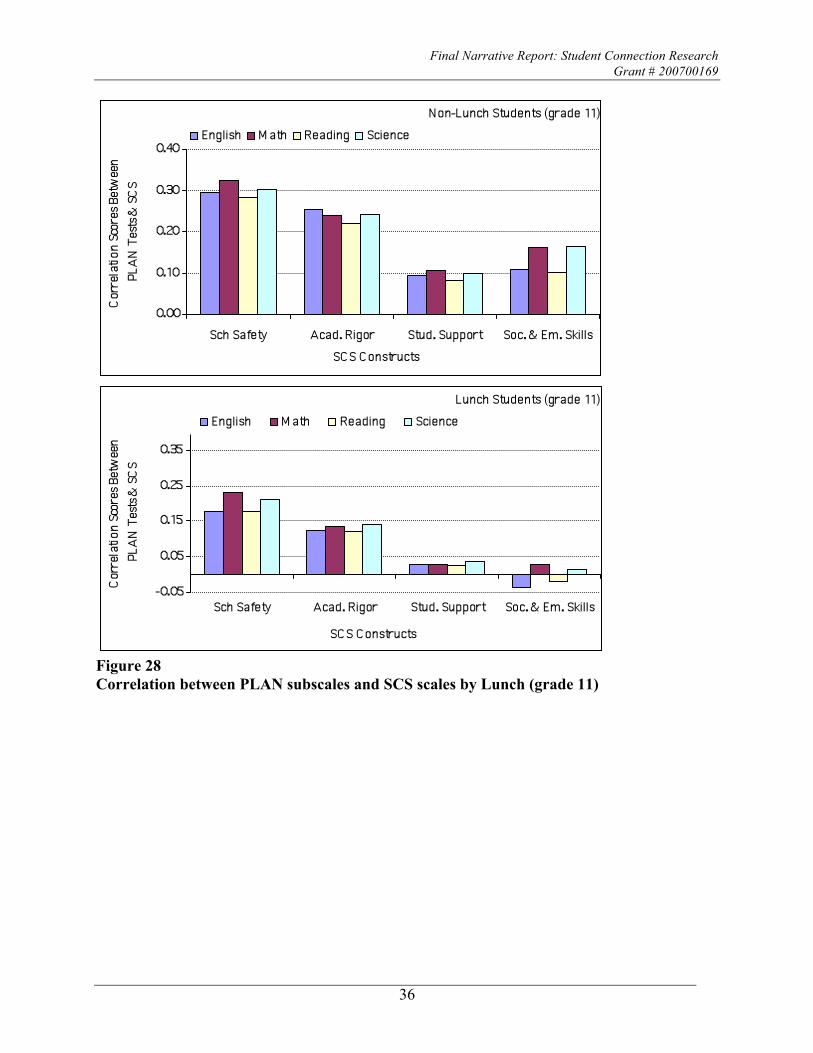
Exploring Correlations between Test Scores and Student Connection Scales by Lunch Status Regardless of the test or grade level, correlations among the Student Connection constructs and the achievement tests are higher for students who are not in the Free or Reduced Price Lunch Program than for students who are enrolled in the program. That is to say, that the Student Connection-achievement relationship is moderated by poverty, with students in poverty showing less connection between achievement and Student Connection.
Final Narrative Report: Student Connection Research Grant # 200700169
35
Figure 27 Correlation between EXPLORE subscales and SCS scales by Lunch (grade 9)
Final Narrative Report: Student Connection Research Grant # 200700169
36
Figure 28 Correlation between PLAN subscales and SCS scales by Lunch (grade 11)

Final Narrative Report: Student Connection Research Grant # 200700169
37
Figure 29 Correlation between PSAE subscales and SCS scales by Lunch (grade 11) It may be the case that the reason for the constricted relationship between Student Connection and achievement for students in poverty is that for them, there are other variables outside of the school that influence their achievement more strongly (such as poor health, lack of dental or vision care, or other life stressors).
Question 2: Student Connection and School Level Characteristics
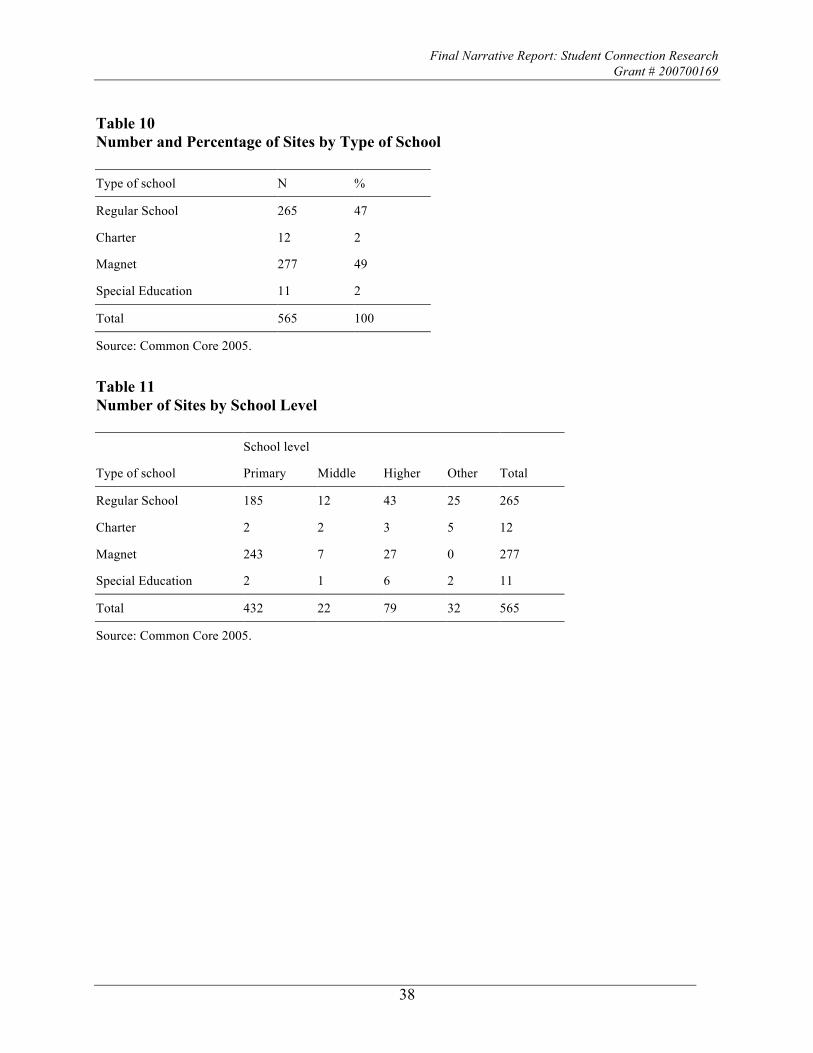
Types of Chicago Schools The first tables of this section describe the general characteristics of the Chicago schools. As shown in the following tables most of the elementary schools (that have middle grades) and high schools in Chicago are regular or magnet schools. Only a few schools are charter or special education schools.
Final Narrative Report: Student Connection Research Grant # 200700169
38
Table 10 Number and Percentage of Sites by Type of School Type of school N %
Regular School 265 47
Charter 12 2
Magnet 277 49
Special Education 11 2
Total 565 100
Source: Common Core 2005.
Table 11 Number of Sites by School Level School level
Type of school Primary Middle Higher Other Total
Regular School 185 12 43 25 265
Charter 2 2 3 5 12
Magnet 243 7 27 0 277
Special Education 2 1 6 2 11
Total 432 22 79 32 565
Source: Common Core 2005.
Final Narrative Report: Student Connection Research Grant # 200700169
39
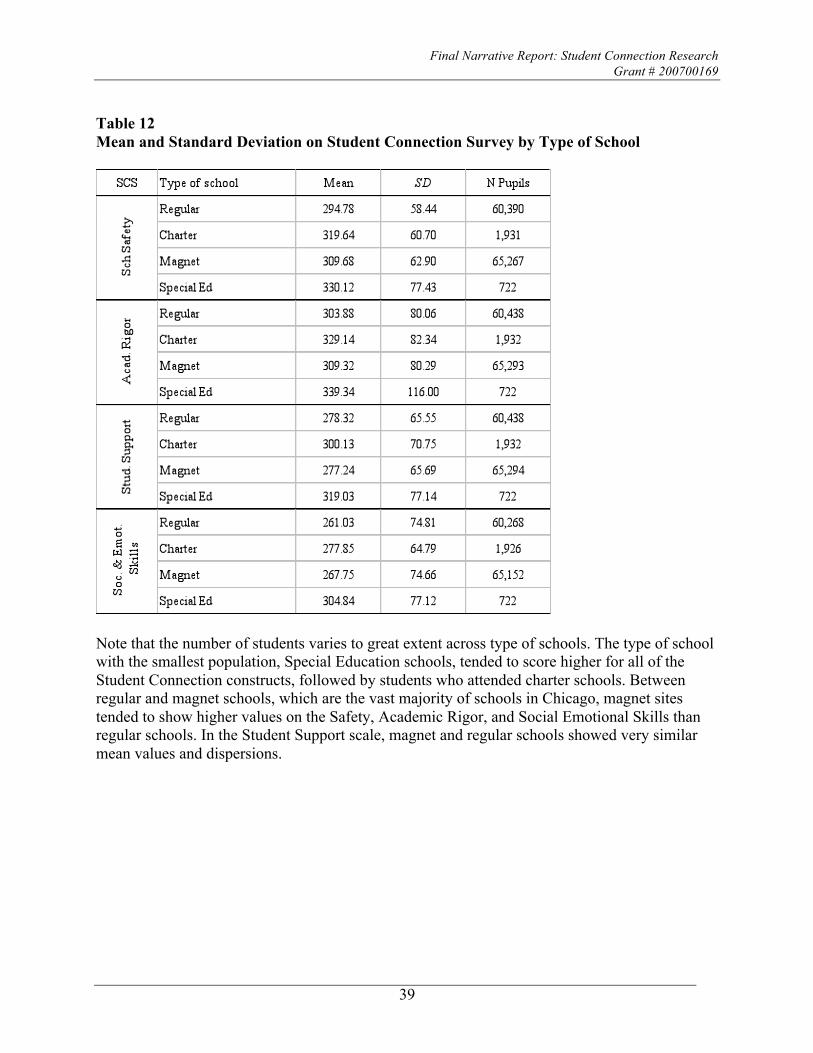
Table 12 Mean and Standard Deviation on Student Connection Survey by Type of School
Note that the number of students varies to great extent across type of schools. The type of school with the smallest population, Special Education schools, tended to score higher for all of the Student Connection constructs, followed by students who attended charter schools. Between regular and magnet schools, which are the vast majority of schools in Chicago, magnet sites tended to show higher values on the Safety, Academic Rigor, and Social Emotional Skills than regular schools. In the Student Support scale, magnet and regular schools showed very similar mean values and dispersions.

Final Narrative Report: Student Connection Research Grant # 200700169
40
Table 13 Mean and Standard Deviation on Student Connection Survey by Title I Status SCS Title I School? Mean SD N students
No 326.99 67.73 29,168
Scho
ol
Safe
ty
Yes 295.86 57.55 99,142
No 314.01 80.74 29,184
Aca
d.
Rig
or
Yes 305.23 80.43 99,201
No 280.18 68.02 29,184
Stud
. Su
ppor
t
Yes 277.78 65.26 99,202
No 273.63 75.24 29,111
Soc.
&
Emot
. Ski
lls
Yes 262.39 74.43 98,957
Overall there was a tendency for non-Title I schools to score higher on School Safety, Academic Rigor and Social Emotional Scales than Title I schools.
Student Connection Responses by School Enrollment and Average Class Size Enrollment size ranges from 41 to 2005 in the middle grades, and from 67 to 4,248 students in high school. The distributions of enrollment in both levels were highly positively skewed; schools with more than 2,000 students were not very common. Because of the skewness or lack of symmetry of this variable, simple Pearson correlations would not be very meaningful. To get a rough proxy of the relation between enrollment size and the responses on the Student Connection Survey, the enrollment distribution was divided into quintile categories: the lowest 20%, between 20% and 40%; between 40% and 60%; between 60% and 80% and above 80%. The following table presents the average Student Connection Scores for each of the enrollment categories.

Final Narrative Report: Student Connection Research Grant # 200700169
41
Table 14 Average SCS by Schools with Different Enrollment Sizes
Especially in high school, there seemed to be a tendency for Student Connection values to be negatively associated with enrollment. These negative relations were more evident for the Academic Rigor, Student Support Scales, and Social Emotional Skills scores. In the multilevel analyses we explore in more detail the relation between school enrollment and the Student Connection responses by using a logarithmic form for enrollment that corrects its asymmetrical distribution. The correlations between the Student Connection constructs and the logarithm of enrollment are shown in the following table.
Final Narrative Report: Student Connection Research Grant # 200700169
42
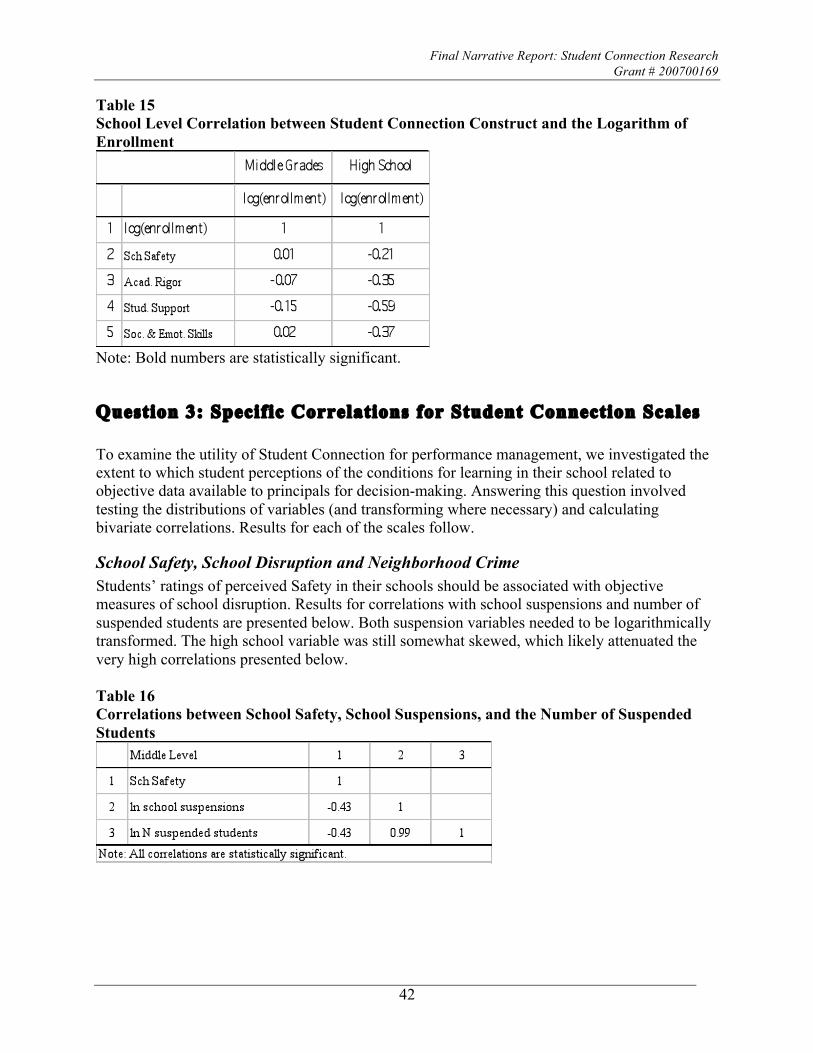
Table 15 School Level Correlation between Student Connection Construct and the Logarithm of Enrollment
Note: Bold numbers are statistically significant.
Question 3: Specific Correlations for Student Connection Scales To examine the utility of Student Connection for performance management, we investigated the extent to which student perceptions of the conditions for learning in their school related to objective data available to principals for decision-making. Answering this question involved testing the distributions of variables (and transforming where necessary) and calculating bivariate correlations. Results for each of the scales follow.
School Safety, School Disruption and Neighborhood Crime Students’ ratings of perceived Safety in their schools should be associated with objective measures of school disruption. Results for correlations with school suspensions and number of suspended students are presented below. Both suspension variables needed to be logarithmically transformed. The high school variable was still somewhat skewed, which likely attenuated the very high correlations presented below. Table 16 Correlations between School Safety, School Suspensions, and the Number of Suspended Students

Final Narrative Report: Student Connection Research Grant # 200700169
43
The numbers of school suspensions and suspended students were almost perfectly correlated; both were very strongly associated with School Safety as assessed on the Student Connection survey. Additionally, we examined the relationship between School Safety and neighborhood crime, testing the logic that schools in neighborhoods with more crime would feel less safe to students. Crime in students’ home census blocks was more strongly related to school safety than crime in the school’s own census block (“imported disorder”), supporting the finding by Clark and Lab (2000) the school’s neighborhood characteristics do not strongly influence in-school crime. However, Welsh, Stokes, and Greene (2000) have reported findings that the school’s surrounding neighborhood is more influential for in-school victimization than students’ home neighborhoods. Table 17 Correlations between School Safety and Neighborhood Crime
Final Narrative Report: Student Connection Research Grant # 200700169
44
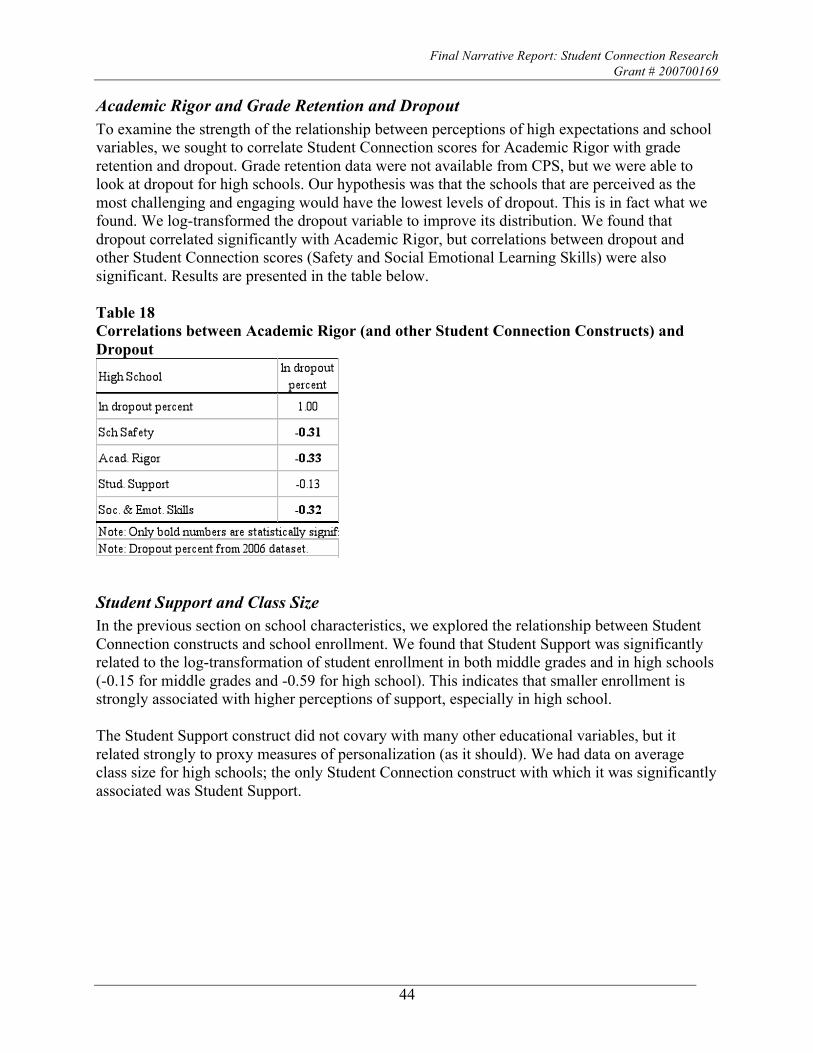
Academic Rigor and Grade Retention and Dropout To examine the strength of the relationship between perceptions of high expectations and school variables, we sought to correlate Student Connection scores for Academic Rigor with grade retention and dropout. Grade retention data were not available from CPS, but we were able to look at dropout for high schools. Our hypothesis was that the schools that are perceived as the most challenging and engaging would have the lowest levels of dropout. This is in fact what we found. We log-transformed the dropout variable to improve its distribution. We found that dropout correlated significantly with Academic Rigor, but correlations between dropout and other Student Connection scores (Safety and Social Emotional Learning Skills) were also significant. Results are presented in the table below. Table 18 Correlations between Academic Rigor (and other Student Connection Constructs) and Dropout
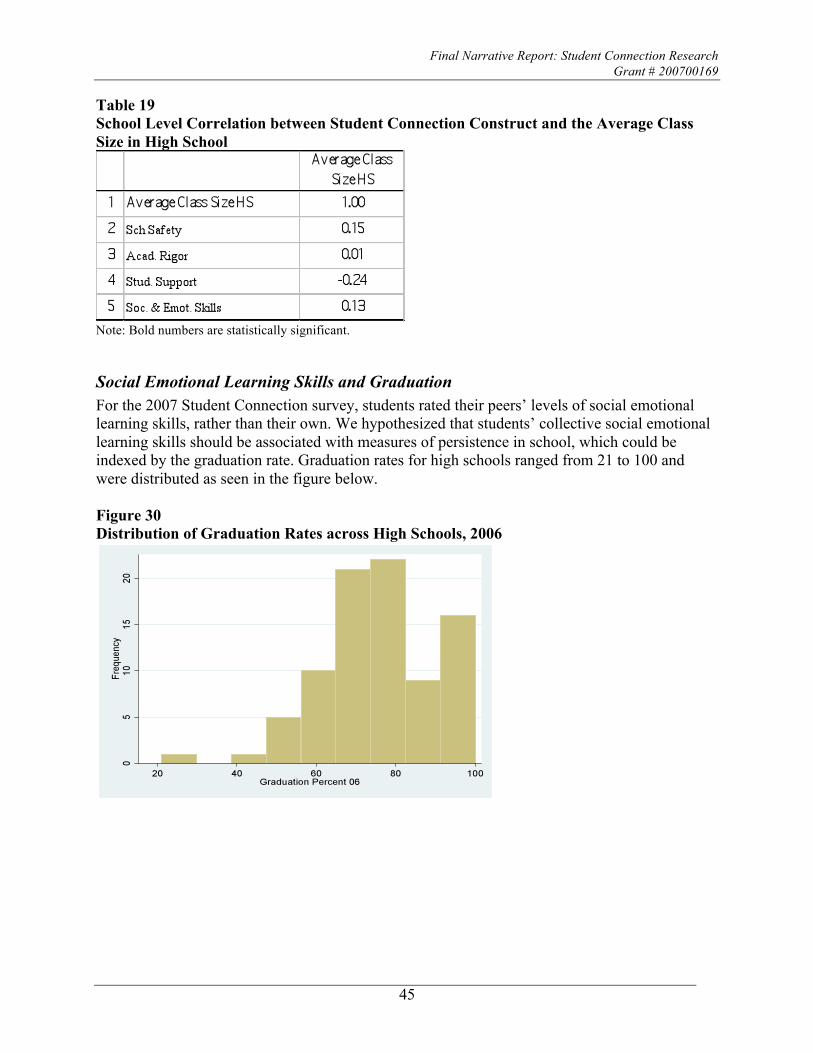
Student Support and Class Size In the previous section on school characteristics, we explored the relationship between Student Connection constructs and school enrollment. We found that Student Support was significantly related to the log-transformation of student enrollment in both middle grades and in high schools (-0.15 for middle grades and -0.59 for high school). This indicates that smaller enrollment is strongly associated with higher perceptions of support, especially in high school. The Student Support construct did not covary with many other educational variables, but it related strongly to proxy measures of personalization (as it should). We had data on average class size for high schools; the only Student Connection construct with which it was significantly associated was Student Support.
Final Narrative Report: Student Connection Research Grant # 200700169
45
Table 19 School Level Correlation between Student Connection Construct and the Average Class Size in High School
Note: Bold numbers are statistically significant.
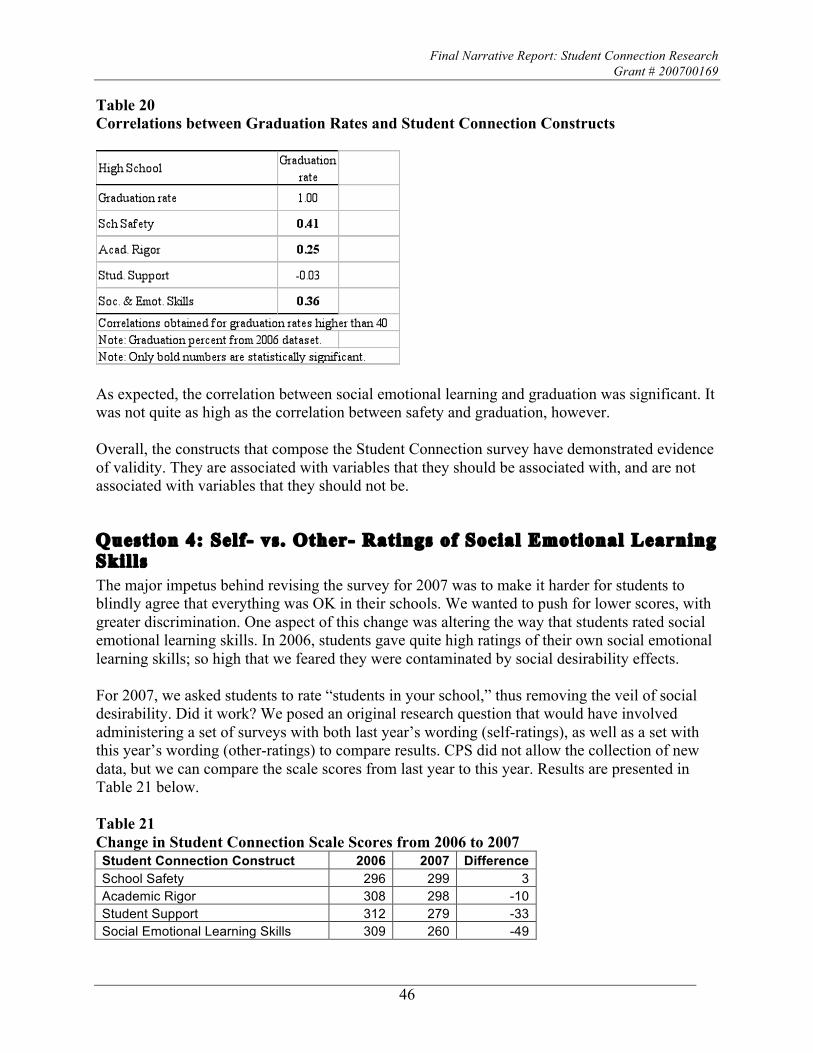
Social Emotional Learning Skills and Graduation For the 2007 Student Connection survey, students rated their peers’ levels of social emotional learning skills, rather than their own. We hypothesized that students’ collective social emotional learning skills should be associated with measures of persistence in school, which could be indexed by the graduation rate. Graduation rates for high schools ranged from 21 to 100 and were distributed as seen in the figure below. Figure 30 Distribution of Graduation Rates across High Schools, 2006
Final Narrative Report: Student Connection Research Grant # 200700169
46
Table 20 Correlations between Graduation Rates and Student Connection Constructs
As expected, the correlation between social emotional learning and graduation was significant. It was not quite as high as the correlation between safety and graduation, however. Overall, the constructs that compose the Student Connection survey have demonstrated evidence of validity. They are associated with variables that they should be associated with, and are not associated with variables that they should not be.
Question 4: Self- vs. Other- Ratings of Social Emotional Learning Skills The major impetus behind revising the survey for 2007 was to make it harder for students to blindly agree that everything was OK in their schools. We wanted to push for lower scores, with greater discrimination. One aspect of this change was altering the way that students rated social emotional learning skills. In 2006, students gave quite high ratings of their own social emotional learning skills; so high that we feared they were contaminated by social desirability effects. For 2007, we asked students to rate “students in your school,” thus removing the veil of social desirability. Did it work? We posed an original research question that would have involved administering a set of surveys with both last year’s wording (self-ratings), as well as a set with this year’s wording (other-ratings) to compare results. CPS did not allow the collection of new data, but we can compare the scale scores from last year to this year. Results are presented in Table 21 below. Table 21 Change in Student Connection Scale Scores from 2006 to 2007 Student Connection Construct 2006 2007 Difference School Safety 296 299 3 Academic Rigor 308 298 -10 Student Support 312 279 -33 Social Emotional Learning Skills 309 260 -49

Final Narrative Report: Student Connection Research Grant # 200700169
47
As we expected, the average scale score for social emotional learning dropped markedly for 2007. Although comparisons across scales are inexact due to distribution differences, with caution we note that whereas in 2006 it was (along with Academic Rigor) the highest-rated scale; in 2007 it was by far the lowest. It appears that shifting from self-ratings to other-ratings had quite a profound effect—and the intended effect—on student perceptions of Social Emotional Learning Skills in their school.
Question 5: Student Connection and AVID We sought to examine whether Student Connection scores could be used for program evaluation purposes by looking at conditions for learning in high schools with certain programs in place (e.g., character education, social and emotional learning initiatives, violence prevention). We planned to identify schools that had certain clearly defined programs in place (AVID, PBIS), and compare Student Connection ratings for those schools to those of other schools in the district. We proposed that information on fidelity of implementation might exist, and that we might factor that into our analysis. We learned that it is challenging for the CPS central office to maintain accurate data on which schools are implementing which programs. We were able to secure a list from the Office of Postsecondary Education of the schools that were implementing Advancing Via Individual Determination (AVID). AVID is a school-wide, in-school academic support program for students in Grades 4–12 without a college-going tradition in their families. AVID targets students with GPAs of 2.0 to 3.5 who want to go to college and are willing to work hard. AVID requires that students enroll in their school’s toughest classes, such as honors and Advanced Placement (AP), and also in the AVID elective. For one period a day, students learn organizational and study skills, work on critical thinking and asking probing questions, get academic help from peers and college-student tutors, and participate in enrichment and motivational activities that make college seem attainable. AVID aims to improve students’ self-image and help them become academically successful leaders and role models for other students.
Many of the schools implementing AVID are “evening high schools” and were not included in the survey sample. The 27 high schools implementing AVID were compared to the remainder of high schools, and the results are presented in

Final Narrative Report: Student Connection Research Grant # 200700169
48
Table 22 below.

Final Narrative Report: Student Connection Research Grant # 200700169
49
Table 22 Comparison of High Schools with and without AVID Programs
Avid N Mean Std.
Deviation
Std. Error Mean
Avid HS program
15536 288.32 59.506 0.477 Safe & Resp. Climate
no Avid 43061 301.54 66.387 0.32 Avid HS program
15557 288.62 78.103 0.626 Academic Rigor
no Avid 43123 295.27 79.672 0.384 Avid HS program
15557 268.97 67.915 0.545 Student Support
no Avid 43122 270.96 66.061 0.318 Avid HS program
15494 248.42 71.508 0.574 Social & Emot. Skills
no Avid 42952 258.41 71.89 0.347 Avid HS program
4754 12.89 3.372 0.049 EXPLORE English scale score
no Avid 13224 13.51 4.11 0.036 Avid HS program
6673 14.78 3.519 0.043 PLAN English scale score
no Avid 17414 15.93 4.309 0.033 Avid HS program
6637 15.41 2.862 0.035 PLAN composite scale score
no Avid 17357 16.59 3.777 0.029 Avid HS program
6675 14.89 3.391 0.042 PLAN mathematics scale score
no Avid 17431 16.19 4.408 0.033 Avid HS program
3002 146.17 12.591 0.23 PSAE mathematics scale score
no Avid 8561 150.84 15.516 0.168 Avid HS program
3000 148.48 12.936 0.236 PSAE reading scale score
no Avid 8558 151.87 15.156 0.164 Avid HS program
3001 147.14 12.013 0.219 PSAE science scale score
no Avid 8560 151.17 14.561 0.157

Final Narrative Report: Student Connection Research Grant # 200700169
50
Avid N Mean Std.
Deviation
Std. Error Mean
Avid HS program
3010 150 13.972 0.255 PSAE writing scale score
no Avid 8664 153.29 15.895 0.171 Avid HS program
14780 2.318 0.96801 0.00796 GPA
no Avid 40315 2.4992 1.03941 0.00518 Note: All differences are statistically significant.
In every single instance, for both the Student Connection survey scores and achievement data, the schools with AVID scored significantly lower than the schools without AVID.
This may be due to the fact that AVID is selectively implemented in lower-performing high schools. It may also be that although the program claims to have a schoolwide component, that the schoolwide elements are not implemented well or at all, and that the only program effects accrue to the specific students enrolled in AVID classes. Future work could potentially secure rosters of students enrolled in AVID, and look at their individual responses; however, such rosters are not currently available to us.
Because of the limited programmatic data we were able to obtain from CPS, we determine that we were not able to fully test the suitability of Student Connection scores for program evaluation. At a minimum we can say that Student Connection scores yield the same kind of information as achievement data.
Question 6: Student Connection and Community Context Schools in highly challenged neighborhoods can either reflect the problems of that neighborhood or serve as refuges of calm for students with otherwise chaotic lives. The Consortium on Chicago School Research (CCSR) shared data with us on community crime so that we could examine which schools do serve as such refuges, and what characteristics such schools may share. However, due to the timing of our data exchange, we have not yet completed our analysis of this research question. Initial data on school neighborhood vs. students’ home neighborhoods were presented in Table 17, above.
Question 7: Student Connection Constructs and NAEP Because Chicago Public Schools did not grant approval for work to proceed on questions 4 and 5, with permission from the Spencer Foundation, we replaced that work with an analysis of how the Student Connection scores related to achievement as measured by the National Assessment of Educational Progress (NAEP). Our analysis of this question was perhaps the most thorough of all of our research, and also the most disappointing. After tremendous effort merging data sets and strenuously accommodating NAEP’s highly selective matrix sampling design (the average number of students per school in Chicago taking the NAEP tests was only 18), we found null
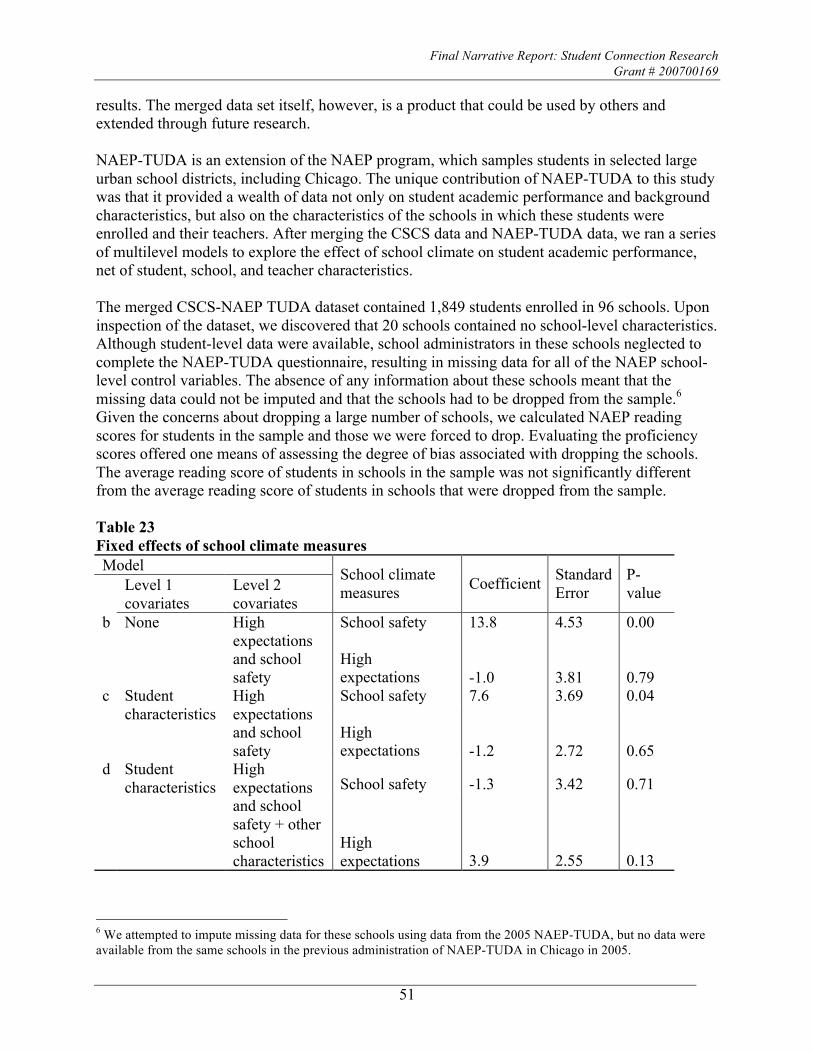
Final Narrative Report: Student Connection Research Grant # 200700169
51
results. The merged data set itself, however, is a product that could be used by others and extended through future research. NAEP-TUDA is an extension of the NAEP program, which samples students in selected large urban school districts, including Chicago. The unique contribution of NAEP-TUDA to this study was that it provided a wealth of data not only on student academic performance and background characteristics, but also on the characteristics of the schools in which these students were enrolled and their teachers. After merging the CSCS data and NAEP-TUDA data, we ran a series of multilevel models to explore the effect of school climate on student academic performance, net of student, school, and teacher characteristics. The merged CSCS-NAEP TUDA dataset contained 1,849 students enrolled in 96 schools. Upon inspection of the dataset, we discovered that 20 schools contained no school-level characteristics. Although student-level data were available, school administrators in these schools neglected to complete the NAEP-TUDA questionnaire, resulting in missing data for all of the NAEP school-level control variables. The absence of any information about these schools meant that the missing data could not be imputed and that the schools had to be dropped from the sample.6 Given the concerns about dropping a large number of schools, we calculated NAEP reading scores for students in the sample and those we were forced to drop. Evaluating the proficiency scores offered one means of assessing the degree of bias associated with dropping the schools. The average reading score of students in schools in the sample was not significantly different from the average reading score of students in schools that were dropped from the sample. Table 23 Fixed effects of school climate measures Model
Level 1 covariates
Level 2 covariates
School climate measures Coefficient Standard
Error P-value
School safety 13.8 4.53 0.00 b None High expectations and school safety
High expectations -1.0 3.81 0.79 School safety 7.6 3.69 0.04 c Student
characteristics High expectations and school safety
High expectations -1.2 2.72 0.65
School safety -1.3 3.42 0.71 d Student
characteristics High expectations and school safety + other school characteristics
High expectations 3.9 2.55 0.13
6 We attempted to impute missing data for these schools using data from the 2005 NAEP-TUDA, but no data were available from the same schools in the previous administration of NAEP-TUDA in Chicago in 2005.
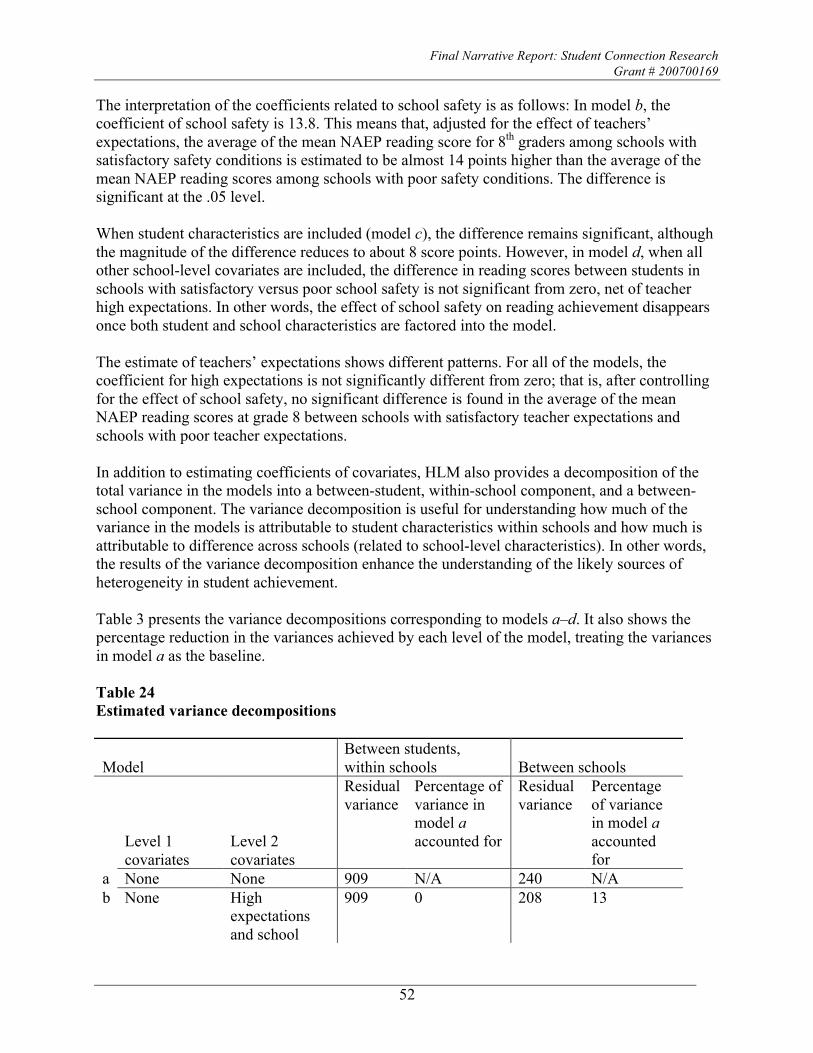
Final Narrative Report: Student Connection Research Grant # 200700169
52
The interpretation of the coefficients related to school safety is as follows: In model b, the coefficient of school safety is 13.8. This means that, adjusted for the effect of teachers’ expectations, the average of the mean NAEP reading score for 8th graders among schools with satisfactory safety conditions is estimated to be almost 14 points higher than the average of the mean NAEP reading scores among schools with poor safety conditions. The difference is significant at the .05 level. When student characteristics are included (model c), the difference remains significant, although the magnitude of the difference reduces to about 8 score points. However, in model d, when all other school-level covariates are included, the difference in reading scores between students in schools with satisfactory versus poor school safety is not significant from zero, net of teacher high expectations. In other words, the effect of school safety on reading achievement disappears once both student and school characteristics are factored into the model. The estimate of teachers’ expectations shows different patterns. For all of the models, the coefficient for high expectations is not significantly different from zero; that is, after controlling for the effect of school safety, no significant difference is found in the average of the mean NAEP reading scores at grade 8 between schools with satisfactory teacher expectations and schools with poor teacher expectations. In addition to estimating coefficients of covariates, HLM also provides a decomposition of the total variance in the models into a between-student, within-school component, and a between-school component. The variance decomposition is useful for understanding how much of the variance in the models is attributable to student characteristics within schools and how much is attributable to difference across schools (related to school-level characteristics). In other words, the results of the variance decomposition enhance the understanding of the likely sources of heterogeneity in student achievement. Table 3 presents the variance decompositions corresponding to models a–d. It also shows the percentage reduction in the variances achieved by each level of the model, treating the variances in model a as the baseline. Table 24 Estimated variance decompositions
Model Between students, within schools Between schools
Level 1 covariates
Level 2 covariates
Residual variance
Percentage of variance in model a accounted for
Residual variance
Percentage of variance in model a accounted for
a None None 909 N/A 240 N/A b None High
expectations and school
909 0 208 13
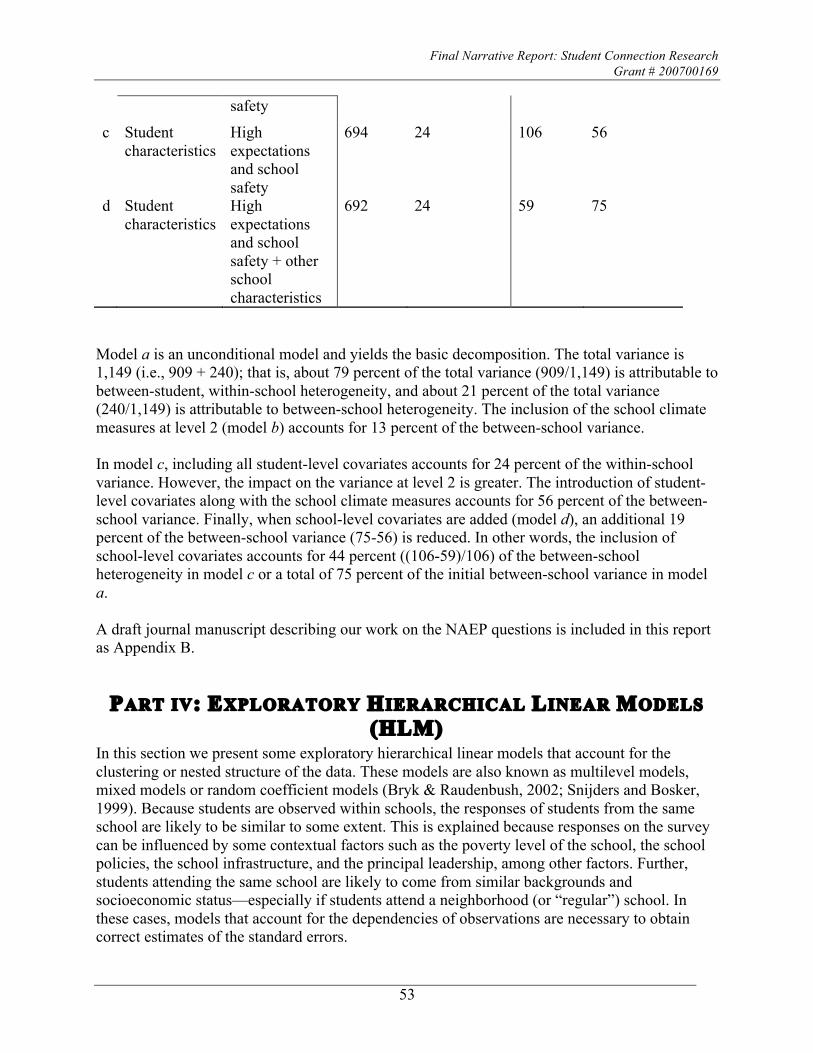
Final Narrative Report: Student Connection Research Grant # 200700169
53
safety
c Student characteristics
High expectations and school safety
694 24 106 56
d Student characteristics
High expectations and school safety + other school characteristics
692 24 59 75
Model a is an unconditional model and yields the basic decomposition. The total variance is 1,149 (i.e., 909 + 240); that is, about 79 percent of the total variance (909/1,149) is attributable to between-student, within-school heterogeneity, and about 21 percent of the total variance (240/1,149) is attributable to between-school heterogeneity. The inclusion of the school climate measures at level 2 (model b) accounts for 13 percent of the between-school variance. In model c, including all student-level covariates accounts for 24 percent of the within-school variance. However, the impact on the variance at level 2 is greater. The introduction of student-level covariates along with the school climate measures accounts for 56 percent of the between-school variance. Finally, when school-level covariates are added (model d), an additional 19 percent of the between-school variance (75-56) is reduced. In other words, the inclusion of school-level covariates accounts for 44 percent ((106-59)/106) of the between-school heterogeneity in model c or a total of 75 percent of the initial between-school variance in model a. A draft journal manuscript describing our work on the NAEP questions is included in this report as Appendix B.
PART IV: EXPLORATORY HIERARCHICAL LINEAR MODELS (HLM)
In this section we present some exploratory hierarchical linear models that account for the clustering or nested structure of the data. These models are also known as multilevel models, mixed models or random coefficient models (Bryk & Raudenbush, 2002; Snijders and Bosker, 1999). Because students are observed within schools, the responses of students from the same school are likely to be similar to some extent. This is explained because responses on the survey can be influenced by some contextual factors such as the poverty level of the school, the school policies, the school infrastructure, and the principal leadership, among other factors. Further, students attending the same school are likely to come from similar backgrounds and socioeconomic status—especially if students attend a neighborhood (or “regular”) school. In these cases, models that account for the dependencies of observations are necessary to obtain correct estimates of the standard errors.

Final Narrative Report: Student Connection Research Grant # 200700169
54
In this section, each of the four constructs—School Safety, Academic Rigor, Student Support, and Social Emotional Skills—is included in the HLM model as an outcome. The goal of this analysis is to explore some of the patterns of responses previously observed after controlling by covariates related to the socioeconomic status of the student or the school. The analyses are centered on investigating the gender and ethnic differences previously found controlling by student socioeconomic status. The analyses here presented should be interpreted with caution. The conditions for learning can be affected by several factors and complete knowledge of these models or the directionality of the effects has not been fully studied. We also provide some evidence of validity by showing that the relations between the Student Connection responses and some student and school covariates are logically as expected. We hope that these analyses will begin to deepen some of the interesting first-order findings and indicate what might be worthy of exploring in the future with richer, longitudinal data. For example, we expect that covariates such as teachers’ characteristics, instructional practices, and principal policies, among others, may account for meaningful variance in Student Connection scores. Similarly, data collected across time points can provide greater information about the direction of effects (although still without establishing formal causality). To control for poverty at the student level a proxy measure named “lunch status” was used. This is not the best measure of poverty especially in contexts where the majority of students are poor. In Chicago middle grades and high schools, 86% and 83% of the students receive the free or reduced price lunches. However, this was the only student level measure available for this study. We begin by presenting the partition of each scale variances across students (within) and across schools (between) for middle grades and high schools separately. This model is also known as the Null Model or Model without predictors.
…….Level-1 or Student-Level …….Level-2 or School-Level
The tables below show the estimates of the within and between school variance and their proportions of the total variance.

Final Narrative Report: Student Connection Research Grant # 200700169
55
Table 25 Variance Components Within and Between Schools (Middle Grades)
Table 26 Variance Components Within and Between Schools (High Schools)
First, note that the proportion of the total scale variance explained by differences across schools is larger in high school than in middle grades. For example, the proportion of the between-schools variance for the School Safety scale is 18% in middle grades and 24% in high school. In the case of the Academic Rigor, Student Support, and Social Emotional Skills constructs, these proportions are about 5% in middle and 10% in high school. Second, in middle grades, the Safety scale’s between-schools variance is four times larger than those of the Academic Rigor, Student Support, and Social Emotional Skills (18% for Safety, compared to 5% for the other three constructs). The same phenomenon was found for high school but at a smaller magnitude. The Safety scale between-schools variance component was about two times larger than those of the other three scales (24% vs. 10%). In other words, there are many micro-environments within a school that

Final Narrative Report: Student Connection Research Grant # 200700169
56
produce very large within-school variation for Academic Rigor, Student Support, and Social Emotional Learning Skills. School Safety does not vary quite as much within schools; it has by far a larger between-school component, meaning that the factors that drive perceptions of Safety are more different from one school to the next. For simplicity, in the subsequent models when covariates or fixed effects are added to the model, their potential random effects are not included. Student covariates are included in the Level-1 or student level, and school covariates and included in the level-2 or school-level.
Gender Differences Controlling by Lunch Status The following HLM analysis presents the estimates for Female, Lunch, and the interaction term between Female and Lunch. The interaction terms aim to capture the differential effect of being a Female in the Lunch and non-Lunch conditions. By having the three terms in the model, the coefficient of Female directly captures the effect of being a female who is not in the lunch program and the coefficient of the interaction captures the effect of being a female and in the lunch program. The constant represent the estimate for Males who are not in the Lunch program, while the coefficient of Lunch measures the effect of being a non-lunch male student. Table 27 HLM Results: Exploring Gender Differences Controlling by Lunch Status (Middle)
On the Safety Scale, and within the population of non-Lunch students, female students scored 3.29 higher than males. In contrast, within the population of students receiving the Lunch program, female students scored 7.01 (3.29 -10.3) points less than Males. No interaction between Female and Lunch was found for the other three outcomes. For Student Support and Social Emotional Learning Skills the interaction between Female and Lunch were not significant. But the student-level covariate “lunch status” is positive and significantly related to those constructs, suggesting that students in the lunch program scored higher in those constructs than non-lunch students. This result should be studied in more detail

Final Narrative Report: Student Connection Research Grant # 200700169
57
with richer data to understand better the implications of this finding or if this variable is picking up some other unobserved student characteristic. Table 28 HLM Results: Exploring Gender Differences Controlling by Lunch Status (High School)
In high school and for the Safety scale, non-lunch females scored 1.75 points less than non-Lunch males (but this coefficient was not significant). The gender differences were even larger within the population receiving the Lunch program: Females scored 11.39 (-1.75-9.64) points less than males. Fr the Social Emotional Learning Skills scale and among the population not receiving the lunch program, females scored 4.6 points less than males. Again, the gender gap was larger within the lunch program population: females scored 9.22 (-4.57- 4.65) points below male students
Ethnic Differences Controlling by Lunch Status For the Safety and Social Emotional Skills constructs, Whites, Asian, and Hispanics scored significantly higher than African American students, holding constant their Lunch status. In the case of Academic Rigor and Student Support scales, African American students provided higher scores than Hispanic students, holding constant their Lunch status.

Final Narrative Report: Student Connection Research Grant # 200700169
58
Table 29 HLM Results: Exploring Race Differences Controlling by Lunch Status (Middle Grades)
Table 30 HLM Results: Exploring Race Differences Controlling by Lunch Status (High School)
In high school, White students scored significant higher than African Americans on the Safety scale. In the middle grades, no other ethnicity scored significantly higher than African American students. For Student Support, African Americans provided significantly higher scores than

Final Narrative Report: Student Connection Research Grant # 200700169
59
Whites, Asians, and Hispanics respectively, after controlling by Lunch status. For Social Emotional Learning Skills, African Americans provided scores 4.49 points higher than Whites. Ethnic Differences Controlling by Student Lunch Status and School Level Poverty Characteristics In the following models, three school-level predictors were included: the logarithm of per capita crime in school’s own census block which collect crime data since November 2005–October 2007; the concentration of poverty in school’s own census block, and the logarithm of school enrollment. These variables aim to capture some of the “contextual” characteristics of the schools in terms of crime and poverty as well as school size. The logarithm form was used to correct for the skewness of these variables.

Final Narrative Report: Student Connection Research Grant # 200700169
60
Table 31 HLM Results: Exploring Race Differences Controlling by Lunch Status and School Contextual Characteristics (Middle Grades)
No major differences were observed compared to the previous model and after controlling by contextual neighborhood and enrollment size. For the Safety scale, these results suggest that even after controlling the student’s lunch status, and for the school size and poverty characteristics of the school’s vicinity, African American students consistently scored lower than all the other ethnicities. These results should be explored in more detail in future work. For Social Emotional Learning Skills, the differences between White and African American students were no longer significant after controlling for these contextual characteristics.
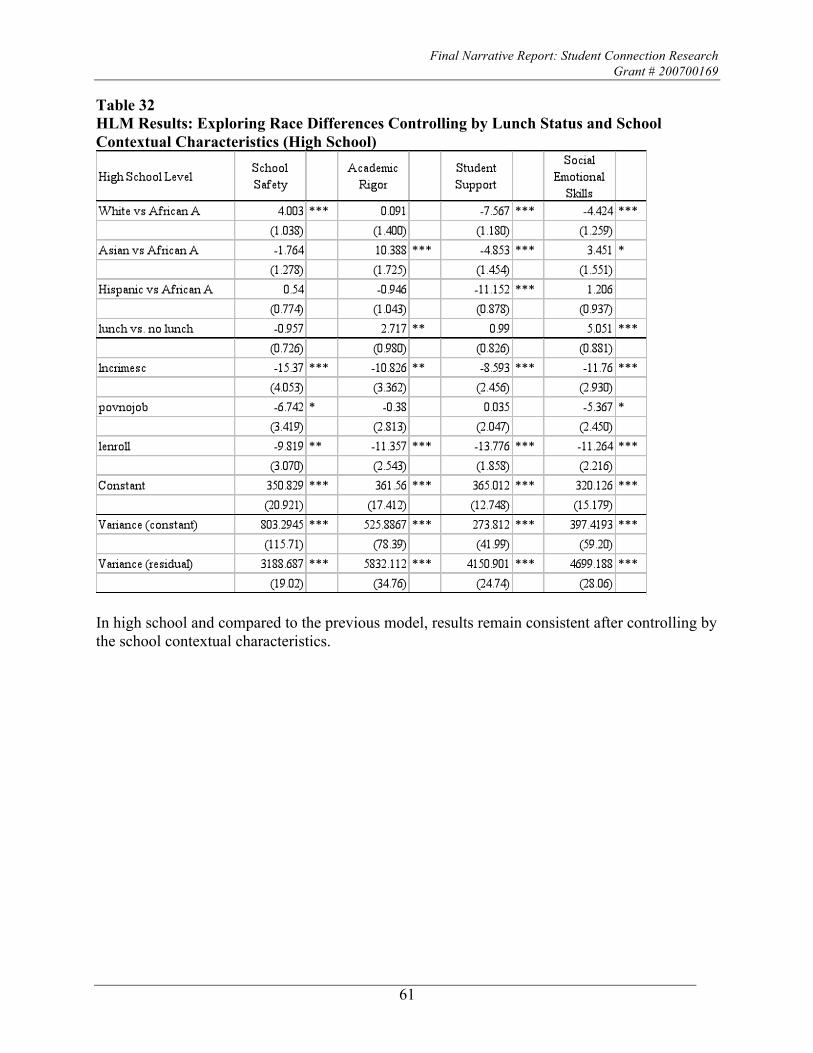
Final Narrative Report: Student Connection Research Grant # 200700169
61
Table 32 HLM Results: Exploring Race Differences Controlling by Lunch Status and School Contextual Characteristics (High School)
In high school and compared to the previous model, results remain consistent after controlling by the school contextual characteristics.

Final Narrative Report: Student Connection Research Grant # 200700169
62
REFERENCES Adelman, H. S., & Taylor, L. (2000). Moving prevention from the fringes into the fabric of
school improvement. Journal of Educational and Psychological Consultation, 11, 7–36.
Battistich, V. (2001, April). Effects of an elementary school intervention on students’ “connectedness” to school and social adjustment during middle school. In J. Brown (Chair), Resilience education: Theoretical, interactive, and empirical applications. Symposium conducted at the annual meeting of the American Educational Research Association, Seattle, WA.
Battistich, V., Solomon, D., Watson, M., Solomon, J., & Schaps, E. (1989). Effects of an elementary school program to enhance prosocial behavior on children’s cognitive social problem-solving skills and strategies. Journal of Applied Developmental Psychology, 10, 147–169.
Bekuis, T. (1995, March). Unsafe public schools and the risk of dropping out: A longitudinal study of adolescents. Paper presented at the Annual Meeting of the Eastern Psychological Association, Boston, MA.
Billig (2000). The Impacts of Service-Learning on Youth, Schools and Communities: Research on K-12 School-Based Service Learning, 1990 to 1999. Learning in Deed Research Summary. Battle Creek, MI: Kellogg Foundation.
Blum, A.L., Beuhring, T., and Rinehard, P.M. (2000). Protecting teens: Beyond race, income, and family structure. Minneapolis, MN: Center for Adolescent Health, University of Minnesota.
Brown, B. B. and Theobald, W. (1998). Learning contexts beyond the classroom: Extra curricular activities, community organizations, and peer groups. In K. Borman & B. Schneider (Eds.), The adolescent years: Social influences and educational challenges: Ninety-seventh yearbook of the National society for the Study of Education (Part 1). Chicago, IL: The National Society for the Study of Education.
Bryk, A. S., & Thum, Y. M. (1989). The effects of high school organization on dropping out: An exploratory investigation. American Educational Research Journal, 26, 353–383.
CASEL Connections: SEL Research and Practice Updates from the Collaborative for Academic, Social and Emotional Learning (March, 2006). Focus on Adolescents. University of Chicago, Illinois. Retrieved from http://www.casel.org/listservs/enewsletters/e-news-mar06.htm
Catalano, R. F., Berglund, M. L, .Ryan, J.A.M., Lonczak, H.S. and Hawkins, J.D. (2004). Positive youth development in the United States: Research findings on evaluations of positive youth development programs. The ANNALS of the American Academy of Political and Social Science, 591, 98–124
Final Narrative Report: Student Connection Research Grant # 200700169
63
Catalano, R. F., Haggerty, K. P., Oesterle, S., Fleming, C.B., & Hawkins, J. D. (2004). The importance of bonding to school for healthy development: Findings from the Social Development Research Group. Journal of School Health, 74, 252–261.
Chicago Public Schools, Office of Research, Evaluation, and Accountability (2007). The 2005–2006 Student Connection Survey scales: Response bias, determinants of scale scores, and the utility of the scales in predicting achievement gains and 9th grade progress toward graduation. Chicago: Author. [Unpublished report.]
Clark, R. D., & Lab, S. P. (2000). Community characteristics and in-school criminal victimization. Journal of Criminal Justice, 28, 33–42.
Collaborative for Academic, Social, and Emotional Learning (CASEL) (2003). Safe and sound: An educational leader’s guide to evidence-based social and emotional learning (SEL) programs. Chicago, IL: Author.
Croninger, R. & Lee, V. E. (2001). Social capital and dropping out of high school: Benefits to at-risk students of teacher’s support and guidance. Teachers College Record, 103, 548–581.
Dwyer, K., & Osher, D. (2000). Safeguarding our children: An action guide. Washington, DC: U.S. Departments of Education and Justice, American Institutes for Research.
Eccles, J. S., & Midgley, C. (1989). Stage/environment fit: Developmentally appropriate classrooms for early adolescents. In R. E. Ames & C. Ames (Eds.), Research on Motivation in Education, 3, 139–186. New York: Academic.
Elias, M.J. (2003). Academic and social-emotional learning. Switzerland: International Academy of Education, International Bureau of Education. Retrieved from http://www.casel.org/downloads/BIE_Practices_11.pdf
Felner, R.D., & Adan, A.M. (1988). The school transitional project: An ecological intervention and evaluation. In R.H. Price, E.L. Cowen, R.P. Lorion, & J. Ramos-McKay (Eds.), 14 ounces of prevention: A casebook for practitioners (pp. 111–122). Washington, DC: American Psychological Association.
Fleming, C. B., Haggerty, K. P., Catalano, R. F., Harachi, T. W., Mazza, J., J., & Gruman, D. H. (2005). Do social and behavioral characteristics targeted by preventive interventions predict standardized test scores and grades? Journal of School Health, 75, 342–349.
Goodenow, C. (1993). Classroom belonging among early adolescent students: Relationships to motivation and achievement. Journal of Early Adolescence, 13, 21–43.
Greenberg, E., Skidmore, D., & Rhodes, D. (2004, April). Climates for learning: mathematics achievement and its relationship to schoolwide student behavior, schoolwide parental involvement, and school morale. Paper presented at the annual meeting of the American Educational Researchers Association, San Diego, CA.

Final Narrative Report: Student Connection Research Grant # 200700169
64
Greenberg, M. T., Weissberg, R. P., O’Brien, M. U., Zins, J. E., Fredericks, L., Resnik, H., & Elias, M. J. (2003). Enhancing school-based prevention and youth development through coordinated social, emotional, and academic learning. American Psychologist, 58, 466–474.
Hawkins, J.D., Guo, J., Hill, K.G., Battin-Pearson, S., & Abbott, R.D. (2001). Long-term effects of the Seattle Social Development Project on school bonding trajectories. Applied Developmental Sciences, 5, 225–236.
Johnson, D.W. and Johnson, R.T. (1989). Cooperation and competition: Theory and research. Edina, MN: Interaction Book Company.
Johnson, D.W., Johnson, R.T., & Maruyama,G. (1983). Interdependence and interpersonal attraction among heterogeneous and homogeneous individuals: A theoretical formulation and a meta-analysis of the research. Review of Educational Research, 53, 5–54.
Kendziora, K. & Osher, D. (2007). Say Yes to Education Student Monitoring System: Research report. [Unpublished document.] New York: Say Yes to Education.
Learning First Alliance (2001). Every child learning: Safe and supportive schools. Washington, DC: Association for Supervision and Curriculum Development.
Mahoney, J.L. (2000). School extracurricular activity participation as a moderator in the development of antisocial patterns. Child Development, 71, 502–516.
Masten, A., Coatsworth, J., Neemann, J., Gest, S., Tellegen, A., & Garmezy, N. (1995). The structure and coherence of competence from childhood through adolescence. Child Development, 66, 754–763.
McNeeley, C. A., Nonnemaker, J. M., & Blum, R. W. (2002). Promoting school connectedness: Evidence from the National Longitudinal Study of Adolescent Health. Journal of School Health, 72, 138–146.
Muller, C. 2001. The role of caring in the teacher-student relationship for at-risk students. Sociological Inquiry, 71, 241–255.
National School Boards Association (1996). Learning by design: A school leader’s guide to architectural services. Alexandria, VA: National School Boards Association.
Osher, D. and Hanley, T. V. (1995). Implications of the National Agenda to Improve Results for Children and Youth with or at Risk of Serious Emotional Disturbance, Special Services in the Schools, 10, 7–36.
Osher, D. Sprague, S., Axelrod, J., Keenan, S., Weissberg, R., Kendziora, K., & Zins, J. (in press,). A comprehensive approach to addressing behavioral and academic challenges in contemporary schools. In J. Grimes & A. Thomas (Eds.) Best Practices in School Psychology (5th Edition). Bethesda, MD: National Association of School Psychologists.
Final Narrative Report: Student Connection Research Grant # 200700169
65
Osher, D., Dwyer, K., & Jackson, S. (2004). Safe, Supportive, and Successful Schools Step by Step Longmont, CO: Sopris West.
Osher, D., Dwyer, K., and Jackson, S. (2004). Safe, Supportive and Successful Schools: Step by Step. Longmont, CO: Sopris West Educational Services.
Osher, D., Dwyer, K., and Jimerson, S. (2006). Foundations of school violence and safety. In S. Jimerson and M. Furlong (Eds.) Handbook of School Violence and School Safety: From Research to Practice (pp.51–71). Mahwah, NJ: Lawrence Erlbaum.
Raudenbush, S. W., & Bryk, A. S. (2002). Hierarchical linear models: Applications and data analysis methods, 2nd ed., Thousand Oaks, CA: Sage Publications.
Resnick, M.D., Bearman, P.S., Blum, R.W., Bauman, K.E., Harris, K.M., Jones, J., Tabor, J., Beuhring, T., Sieving, R.E., Shew, M., Ireland, M., Bearinger, L.H., & Udry, J.R. (1997). Protecting adolescents from harm: Findings from the National Longitudinal Study on Adolescent Health. Journal of the American Medical Association, 278, 823–832.
Ryan, A.M., & Patrick, H. (2001). The classroom social environment and changes in adolescents’ motivation and engagement during middle school. American Educational Research Journal, 38, 437–460.
Shouse, R.C. (1996). Academic press and sense of community: Conflict, congruence, and implications for student achievement. Social Psychology of Education, 1, 47–68.
Sinclair, M.F., Christenson, S.L., & Thurlow, M.L. (2005). Promoting school completion of urban secondary youth with emotional or behavioral disabilities. Exceptional Children, 71, 465-482.
Slavin, R. E. (1990). Cooperative learning: Theory, research, and practice. Englewood Cliffs, NJ: Prentice-Hall.
Smylie, M.A. (1994). Redesigning teachers’ work: Connections to the classroom. In L. Darling-Hammond (Ed.), Review of research in education (Vol. 20, pp. 129-177). Washington, DC: American Educational Research Association.
Snijders, T., & Bosker, R. (1999). Multilevel Analysis, London: Sage Publications.
Solomon, D.,Watson, M., S., Douche, K. L., Schaps, E., & Battistich,V. (1988). Enhancing children’s prosocial behavior in the classroom. American Educational Research Journal, 25, 527–55
Spier, E., Cai, C., Kendziora, K., & Osher, D. (2007). School climate and connectedness and student achievement. Juneau, AK: Association of Alaska School Boards.
U.S. Department of Education (2000). Safeguarding our children: An action guide. Washington, DC: U.S. Department of Education.
Final Narrative Report: Student Connection Research Grant # 200700169
66
Van Buren, E., Kendziora, K., Osher, D., Brown, D., & Buford, M. (2007, September). Safe Schools, Successful Students Initiative: Annual report to the United Way. [Unpublished report.] New York: United Way of New York City.
Vander Stoep, A., Weiss, N. S., Kuo, E., Cheney, D., & Cohen, P. (2003). What proportion of failure to complete secondary school in the US population is attributable to adolescent psychiatric disorder? Journal of Behavioral Health Services and Research, 30, 119–24.
Voelkl, K.A. (1995). School warmth, student participation, and achievement. Journal of Experiential Education, 63, 127-138.
Welsh, W. N., Stokes, R., & Greene, J. R. (2000). A macro-level model of school disorder . Journal of Research in Crime and Delinquency, 37, 243–283.
Wentzel, K.R. (1998). Social relationships and motivation in middle school: The role of parents, teachers, and peers. Journal of Educational Psychology, 90, 202–209.
Yamauchi, Lois A., Billig, Shelley H., Meyer, Stephen, Hofshire, Linda (2006). Student outcomes associated with service-learning in a culturally relevant high school program, Journal of Prevention and Intervention in the Community, 32, 149–164.
Zins, J. E., Weissberg, R. P., Wang, M. C., & Walberg, H. J. (Eds.) (2004). Building academic success on social and emotional learning: What does the research say? New York: Teachers College Press.

Final Narrative Report: Student Connection Research Grant # 200700169
67
APPENDIX A
Distributions of the SCS Scales by Type of School Table A1 Upper bound value for different percentiles by construct

Final Narrative Report: Student Connection Research Grant # 200700169
68
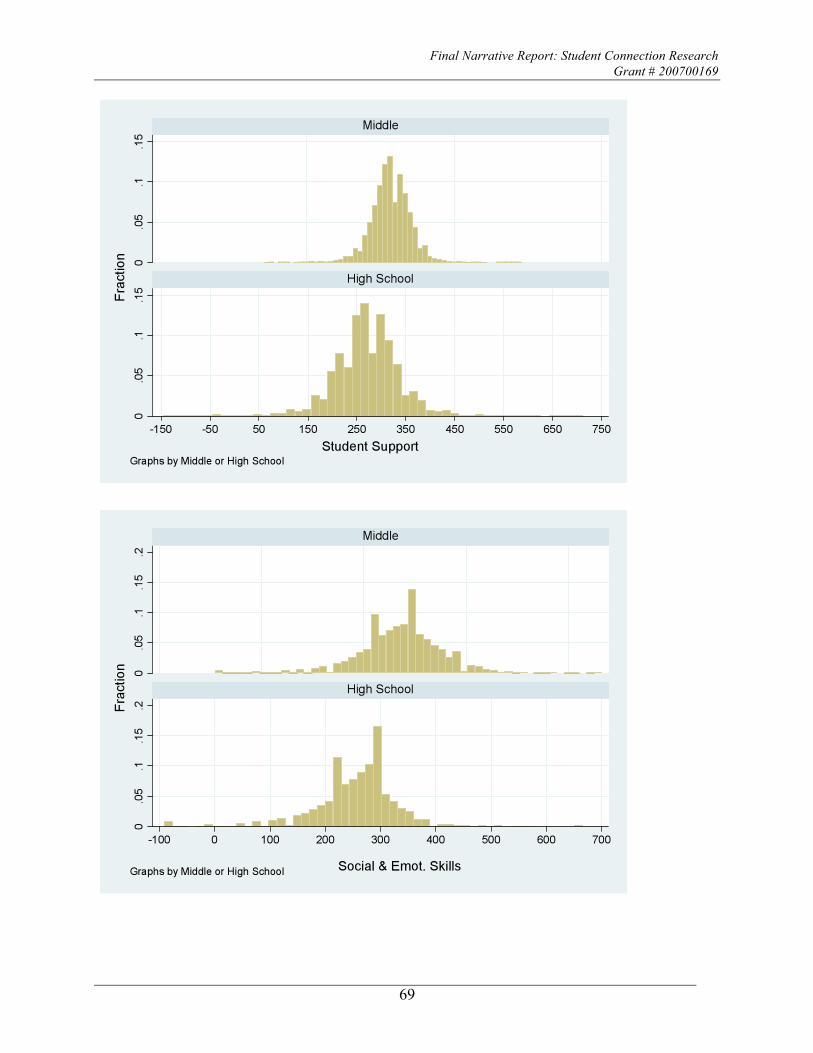
Final Narrative Report: Student Connection Research Grant # 200700169
69

APPENDIX B: NAEP JOURNAL MANUSCRIPT
The Role of School Safety and High Expectations on 8th Graders’ Reading Proficiency: Linking the Chicago Student Connection
Survey with the NAEP Trial Urban Data Assessment
The Chicago Student Connection Survey (CSCS) and the National Assessment of Educational Progress—Trial Urban District Assessment for Chicago (Chicago NAEP-TUDA) capture a wealth of information about educational achievement and the conditions for learning in Chicago. Using multilevel models, we explore the relationship between two key measures of school climate – student perceptions of school safety and the expectations for learning – and the reading proficiency of Chicago 8th grade students. The results reveal both strengths and limitations of the merged CSCS-NAEP TUDA data and suggest directions for future research that may extend the analyses beyond Chicago schools to inform the literature on the association between the conditions for learning within a school and student academic achievement.
Justin Baer
Ying Jin
Kimberly Kendziora
American Institutes for Research (AIR)
Ebony Walton
Optimal Solutions Group, LLC
This research was conducted with the generous support of a grant from the Spencer Foundation. We thank the National Center for Education Statistics (NCES) for providing access to the NAEP-TUDA data and Linda Hamilton of NAEP-ESSI for her assistance merging the Chicago Student Connection Survey and Chicago NAEP-TUDA data.
Final Narrative Report: Student Connection Research Grant # 200700169
1
Introduction
Of all of the major institutions in the United States, the educational system may be
subject to the greatest number of surveys and research projects aimed at documenting,
describing, and explaining its operations, products, and performance. The National Center for
Education Statistics (NCES), the statistical arm of the U.S. Department of Education, has
supported over 15 national and international projects exploring educational outcomes from
preschool to adult literacy. The federal government is not alone in surveying students and
educational personnel. The passage of the No Child Left Behind (NCLB) Act in 2001 has fueled
the rise of state studies of student academic progress, as every school in the nation must provide
quantifiable evidence of the degree to which schools, teachers, and students meet specified goals.
The wealth of educational data is a bonanza for researchers who can look to a variety of
datasets to address questions about a multitude of educational outcomes. The growth of
educational surveys and emphasis on documenting a range of educational practices, however,
carries the risk that researchers and policymakers may lose the ability to look across different
projects and may ignore opportunities to link complementary studies. The lack of efforts to link
educational surveys is understandable, as the complexities of many large educational studies
impose startup costs to researchers who must invest significant time understanding what one
particular survey can offer and how the data can most effectively be utilized. Moreover, surveys
conducted by independent educational authorities (e.g. the federal government and a state) may
be challenging to link because of different data structures and the lack of common identifiers for
subjects across the surveys.
Yet the promise of projects exploiting the resources of multiple surveys remains,
especially as the quality of educational surveys takes steps toward matching their quantity. In

Final Narrative Report: Student Connection Research Grant # 200700169
2
this paper, we report the results of a project merging two rich datasets and explore the unique
types of analyses that can be conducted on the linked data. Specifically, we use the Chicago
Student Connection Survey (CSCS), a recent survey developed by Chicago Public Schools
(CPS) and the American Institutes for Research (AIR), and the National Assessment of
Educational Progress - Trial Urban District Assessment for Chicago (NAEP-TUDA) to examine
the relationship between student-level and school-level predictors on student academic
achievement. While the exploration of factors contributing to student academic achievement is
key to this paper, equally significant are the lessons learned in merging the data and how these
lessons can be applied to future research endeavors.
The rationale behind linking the CSCS and NAEP-TUDA lay not in a methodological
exercise but because of the complementary nature of the data collected by both projects. As
described in greater detail below, the CSCS is a comprehensive survey that measures student
attitudes about four dimensions of school climate. Although developed in collaboration with
CPS, the survey instrument was not designed to be unique to Chicago schools and could be
administered to students in any school system. In 2007, valid data were collected from over
135,000 Chicago children in grades 6 through 12. Based on these data, the following four
measures of school climate were constructed: 1) school safety, 2) high expectations for learning,
3) student support, and 4) social and emotional skills. These measures offer a composite picture
of student perceptions of their school climate, a key contextual measure associated with a variety
of student-level outcomes (Lee, Smith, Perry & Smylie, 1999).
NAEP-TUDA is an extension of the NAEP program, which samples students in selected
large urban school districts, including Chicago. The unique contribution of NAEP-TUDA to this
study was that it provided a wealth of data not only on student academic performance and
Final Narrative Report: Student Connection Research Grant # 200700169
3
background characteristics, but also on the characteristics of the schools in which these students
were enrolled and their teachers. After merging the CSCS data and NAEP-TUDA data, we ran a
series of multilevel models to explore the effect of school climate on student academic
performance, net of student, school, and teacher characteristics.
We begin by outlining the research questions motivating this study and then provide
background on the Chicago Student Connection Survey and NAEP-TUDA. Following the
discussion of the two surveys, we describe the research question motivating the project in greater
detail, the measures used in the analyses, and the analytic strategy. Finally, we present the
results and discuss their implications not only for the literature on school climate, but also for
future research drawing on CSCS and NAEP-TUDA data.
Research Questions
Three research questions motivated our analyses:
1) What are the issues associated with merging CSCS and NAEP-TUDA data? 2) How can the merged CSCS and NAEP-TUDA data be used to inform studies of the
relationship between school climate and student academic performance?
3) What are the unique contributions of the merged data and what can it offer to educational researchers?
The first research question arises because of the unique structures of the CSCS and
NAEP-TUDA data and the lack of previous efforts to link them. As noted below, the CSCS and
NAEP-TUDA are distinct projects administered by different agencies (Chicago Public Schools
and the National Center for Education Statistics, respectively). Moreover, the CSCS is a census
of all middle and high school students in Chicago, whereas NAEP-TUDA relies on sampling of
students. This raises a series of technical issues which must be considered before any analyses
can be conducted.
Final Narrative Report: Student Connection Research Grant # 200700169
4
The purpose behind the second research question is to explore how the merged CSCS and
NAEP-TUDA data can be applied to a topic of prime interest to educators and policymakers, the
relationship between the conditions for learning within a school and student achievement. This
analysis is exploratory, examining how the merged CSCS and NAEP-TUDA data can inform the
literature on school climate and positing directions for future research using the data. Finally, we
evaluate the unique contributions of the merged CSCS and NAEP-TUDA data in light of the
analyses and suggest directions for subsequent research. Taken together, the three questions
establish a foundation for a promising research program utilizing merged CSCS and NAEP-
TUDA data, one that can be extended both by exploring additional variables available in the
datasets and by looking to tie-in additional sources of data.
Chicago Student Connection Survey
In this era of standards-based reform, much attention is paid to the role that schools play
in raising the academic achievement of all students. Schools are held accountable for the
academic progress of all students, and are therefore implementing programs and strategies
designed to help all students achieve to high academic standards. Successful schools are those
that are able to mitigate any potentially negative impact on students due to experiences outside
the school setting by creating and maintaining within the school what are often referred to as
effective conditions for learning. Such conditions typically include high-quality pedagogy, well-
trained teachers, adequate resources, and effective leadership.
Another equally, if not more important set of conditions is called the social and emotional
conditions for learning. Students who feel “connected” to school across these social/emotional
indicators are more likely to have improved attitudes towards school, learning, and teachers;
heightened academic aspirations, motivation, and achievement; and more positive social
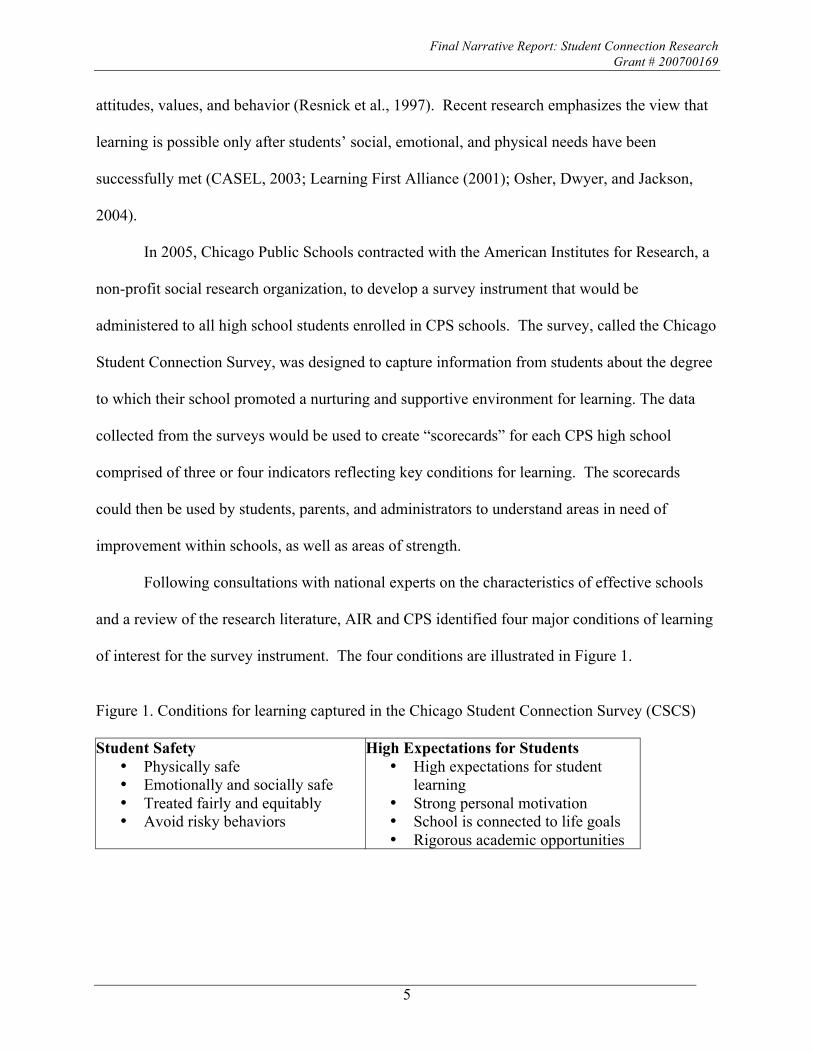
Final Narrative Report: Student Connection Research Grant # 200700169
5
attitudes, values, and behavior (Resnick et al., 1997). Recent research emphasizes the view that
learning is possible only after students’ social, emotional, and physical needs have been
successfully met (CASEL, 2003; Learning First Alliance (2001); Osher, Dwyer, and Jackson,
2004).
In 2005, Chicago Public Schools contracted with the American Institutes for Research, a
non-profit social research organization, to develop a survey instrument that would be
administered to all high school students enrolled in CPS schools. The survey, called the Chicago
Student Connection Survey, was designed to capture information from students about the degree
to which their school promoted a nurturing and supportive environment for learning. The data
collected from the surveys would be used to create “scorecards” for each CPS high school
comprised of three or four indicators reflecting key conditions for learning. The scorecards
could then be used by students, parents, and administrators to understand areas in need of
improvement within schools, as well as areas of strength.
Following consultations with national experts on the characteristics of effective schools
and a review of the research literature, AIR and CPS identified four major conditions of learning
of interest for the survey instrument. The four conditions are illustrated in Figure 1.
Figure 1. Conditions for learning captured in the Chicago Student Connection Survey (CSCS) Student Safety
• Physically safe • Emotionally and socially safe • Treated fairly and equitably • Avoid risky behaviors
High Expectations for Students • High expectations for student
learning • Strong personal motivation • School is connected to life goals • Rigorous academic opportunities

Final Narrative Report: Student Connection Research Grant # 200700169
6
Student Support • Meaningful connection to adults • Strong bonds to school • Positive peer relationships • Effective and available support
Student Social and Emotional Skills • Emotionally intelligent and
culturally competent • Responsible and persistent • Cooperative team players • Contribute to school and
community
The dimension of school safety refers to an overall school climate in which students feel
physically and emotionally safe. There is little to no violence, fighting, bullying, crime,
substance abuse, or gang presence. Overall, there is a climate of mutual respect and trust among
all members of the school community, and students feel comfortable in taking personal and
academic risks. Failure to support academic achievement is related to students’ disengagement
from school and increased risk-taking behavior (Blum, Beuhring, and Rinehard, 2000). A safe
and supportive learning environment fulfills students’ basic psychological needs for belonging,
autonomy, influence, competence, and physical security. As these needs are met, students tend
to become increasingly committed to the school community’s norms, rules, and values (Learning
First Alliance, 2001). Research also shows that the physical environment can have a profound
effect on the ability of students to learn efficiently (National School Boards Association, 1996).
A second key component to the social and emotional conditions of learning is high
expectations. Schools may be safe and orderly, but if they fail to build a supportive, engaging
community and press for high academic expectations, students learn little (Learning First
Alliance, 2001). Teachers should have high expectations for students in terms of the level of
effort they put forth, as well as the academic and behavioral standards to which they are expected
to achieve. When students feel that teachers and other adults hold high expectations for them,
they are likely to do better in school (Lee et al., 1999; Catalano et al., 2004). In the classroom,
cooperative learning strategies (e.g., group discussions, presentations, projects) have been shown
Final Narrative Report: Student Connection Research Grant # 200700169
7
to promote the development of social skills in students, sense of the classroom as a community,
and academic achievement (Johnson & Johnson, 1989; Slavin, 1990). Finally, students who
perceived their teachers as warm, caring and supportive had higher classroom participation rates
which in turn positively affected their academic achievement (Voelkl, 1995).
Establishing effective student support involves ensuring that children’s basic needs are
met and that the significant adults in their lives work collaboratively to encourage, support, and
nurture them. Students work with and receive support from teachers who are able to establish a
connection with them, personalize their experience, and engage them in the learning process.
For example, examinations of national data have shown that positive student beliefs about how
much their teachers support their efforts to succeed in school can reduce the probability of their
dropping out by half (Croninger & Lee, 2001). A study of 167 sixth-grade students found that
student support was associated with increased grade-point-averages, through its effects on
interest in class, interest in school, and social responsibility (Wentzel, 1998). Goodenow (1993)
found teacher support to be predictive of a students’ expectancy of success, which in turn
predicted their class effort and resulting grades. Other studies of interventions designed to build
relationships between adults and students in school have also shown a positive impact of these
programs on school-related attitudes and motives, especially for at-risk students (Battistich,
2001; Sinclair, Christenson & Thurlow, 2005; Shouse, 1996).
Finally, schools that provide sufficient conditions for learning ensure that students learn
and exhibit the social and emotional skills they need to succeed. Social and emotional learning
is the process of developing the ability to recognize and manage emotions, develop caring and
concern for others, make responsible decisions, establish positive relationships, and handle
challenging situations effectively. Studies have found a relationship between pro-social
Final Narrative Report: Student Connection Research Grant # 200700169
8
behaviors and academic performance and that school interventions focused on creating a caring
learning environment have proven effective in increasing attendance, GPA and stability of self-
concept, and decreasing drop-out, emotional and behavioral problems (Felner & Adan, 1988;
Fleming et al., 2005; Masten, et al., 1995 Reyes & Jason, 1991).
For our analyses, we elected to focus particularly on the dimensions of school safety and
high expectations. We selected these measures were selected for two reasons. First, previous
research has demonstrated the association between aggregated high expectations within a school
and student learning (Lee et al., 1999; Lee & Smith, 1999; Ma & Wilkins, 2002). Less work has
investigated the relationship between student perceptions of safety and academic performance,
though some research has found other non-academic benefits of student perceptions of safety
(Sellström & Bremberg, 2006). One of the unique contributions of the merged CSCS and
NAEP-TUDA is the ability to examine understudied constructs such as school safety using a
dataset in which valid and reliable proficiency estimates can be generated for all students.
Following a pilot test of the survey in 2005, the first CSCS was administered in Spring
2006 to students in 115 Chicago high schools (students enrolled in grades 9 –12). In Spring
2007, CPS extended the administration of the survey to all middle school (grades 6 – 8) and high
school students. The results presented in this paper focus on students enrolled in grade 8, which
is also sampled by NAEP-TUDA. Among all middle school students, 76,187 surveys were
returned, representing 83 percent of all Chicago students in grades 6 – 8. Each survey was
comprised of 60 questions related to the four dimensions of conditions for learning. Item
Response Theory (IRT) was used to construct the four scales and to identify cutpoints on the
scales associated with “adequate” and “excellent” levels of student connectivity.
National Assessment of Educational Progress – Trial Urban Assessment Data

Final Narrative Report: Student Connection Research Grant # 200700169
9
For over 30 years, the National Assessment of Educational Progress (NAEP) has
evaluated the academic performance of U.S. students across multiple subject areas. Referred to
as “The Nation’s Report Card,” NAEP is the only educational assessment administered to a
representative sample of American students. Administered through the National Center for
Education Statistics (NCES) within the U.S. Department of Education, NAEP currently assesses
student knowledge in nine subject areas, including mathematics, reading, writing and science
(NCES, 2007). NAEP has taken on increased significance over the past decade with the passage
of the No Child Left Behind Act, as student performance on the NAEP assessments provide an
independent check on state initiatives promoting student learning. In addition to assessing
student performance in selected academic areas, NAEP also collects background data from
students, teachers, and schools that is used to frame the interpretation of student results.
NAEP draws samples of students at the national, state and district level. Within states,
sampled 4th and 8th grade students take assessments in mathematics, reading, science, and writing
in alternating years. In 2002, NCES began administration of NAEP to selected large urban
school districts located in cities with a population of 250,000 or more. Six districts, including
Chicago Public Schools, participated in the first Trial Urban District Assessment (TUDA) in
which students were assessed in mathematics and reading. CPS also participated in the 2005
and 2007 NAEP-TUDA administrations, along with 10 other school districts. The design of
NAEP-TUDA allows for large urban districts to compare the performance of their schools to
other similar schools across the country, fostering collective problem solving to the common
issues facing urban school districts.
NAEP measures student aptitude through a series of multiple-choice and constructed
response (i.e. open-ended) items (NCES, 2005). Multiple-choice items are scored electronically

Final Narrative Report: Student Connection Research Grant # 200700169
10
while professionally trained scorers evaluate constructed-response answers. In order to estimate
the proficiency of students across various domains of a subject in a short period of time, students
are administered only a partial set of the full pool of assessment items. This unique study design
allows for proficiency estimates to be generated for the sample of students participating in the
assessment, but not for individual students.7 Population weights are then applied to the estimates
so that they accurately reflect the population of interest. This differs from state assessments, in
which students receive a test score on the basis of the items they complete. Because the concern
of NAEP is population estimates instead of individual-level estimates, the analysis procedures
for NAEP differ fundamentally from almost all other performance tests.
NAEP data for particular subject matter are scaled using IRT methods and then
transformed so that the scores are more interpretable. Scale scores generally range from 0 to 500
for mathematics and reading assessments and 0 to 300 for science and writing assessments.
After scale scores are calculated, student performance on NAEP is reported in two ways, as
average scale scores and by achievement levels. NAEP uses the performance levels of Basic,
Proficient, and Advanced to describe student performance at various points along the distribution
of the NAEP scales and to aid in the interpretation of the NAEP results.
In addition to the assessment, or “cognitive” items, NAEP administers non-cognitive,
background questions, which provide context for reporting student performance data. Federal
law mandates that NAEP report achievement by race/ethnicity, gender, and disability status.
Background questionnaires are also administered to teachers and school administrators.
Teachers are asked to report their years of experience, education, certification, and opportunities
for professional development. School administrators are asked to provide descriptive
7 For details about how NAEP estimates student proficiency scores through the use of plausible values, see Allen, Donoghue and Schoeps (2001).

Final Narrative Report: Student Connection Research Grant # 200700169
11
information about their schools, including enrollment size, racial/ethnic distribution of students,
measures of poverty (e.g. percentage of students participating in the federal free and reduced
price lunch program), staff and student turnover, and student remediation. We draw extensively
on the student and school background data in the analyses below.
Method
In this section, we describe the steps for merging the CSCS and NAEP-TUDA data, the
measures used in the analyses of the combined dataset, and the analytic strategy for estimating
the effect of student and school predictors on student achievement.
Merging CSCS and NAEP-TUDA Data
One of the unique challenges in merging the CSCS and NAEP-TUDA data is the fact that
the CSCS is a census of all middle and high school students enrolled in CPS schools whereas
NAEP-TUDA samples students within schools. For the CSCS, all students who 1) were at
school the day the survey was administered, and 2) agreed to complete the survey, are included
in the CSCS dataset. In contrast, NAEP-TUDA uses a two-stage sampling strategy in which
schools within the CPS system are sampled in the first stage and students within the schools are
sampled in the second stage.8 Thus, in merging the two datasets, data will only be retained for
those students sampled by NAEP-TUDA. The power of the NAEP-TUDA sampling design,
however, ensures that the estimates for these students are representative of all students in the
selected grade (grade 8) once the sampling weights are applied.
Students are the unit of analysis for both the CSCS and NAEP-TUDA. In merging the
data, however, it is only possible to match students at the school level using the common school
identifier from the Common Core of Data (CCD). Because the CSCS and NAEP-TUDA use
their own unique variables for identifying students, data from students in the two datasets cannot 8 The sampling procedures used for NAEP and NAEP-TUDA are described in greater detail in Allen et al (2001).

Final Narrative Report: Student Connection Research Grant # 200700169
12
matched. The inability to match the datasets at the student level is not problematic because the
data collected from students in CSCS are designed to capture the conditions for learning that
exist globally in a school. Consequently, in our analyses, we first calculated average values
across all students within a school for the four measures of school climate. Next, the four
average values were matched to the schools that were sampled by NAEP-TUDA. Thus, each
student in our merged dataset has data collected as part of NAEP (e.g. student background
measures and assessment data) and four school climate scores that reflect the average
impressions of the conditions for learning reported by all of the students in the sampled student’s
school.
Measures
We examined two sets of measures: 1) student-level measures and 2) school-level
measures (figure 2). As noted above, all individual-level measures were taken from the NAEP-
TUDA. The measures selected are common control variables used in analyses examining the
relationship between student and school effects on learning and reflect students’ background
characteristics (race/ethnicity, gender, disability status, English language learners),
socioeconomic status (number of books in the home and participation in the National School
Lunch Program), and time spent in school (number of absences) (Braun, Jenkins and Grigg,
2006a, 2006b).
Figure 2. Student- and school-level variables included in the models.
Studentlevelvariables SchoollevelvariablesGenderRace/ethnicity
StudentswithdisabilitiesEnglishlanguagelearners
EligibilityforNationalSchoolLunch
TeacherexperienceTeachercertification
StudentabsenteeismTeacherabsenteeism
Studentmobility
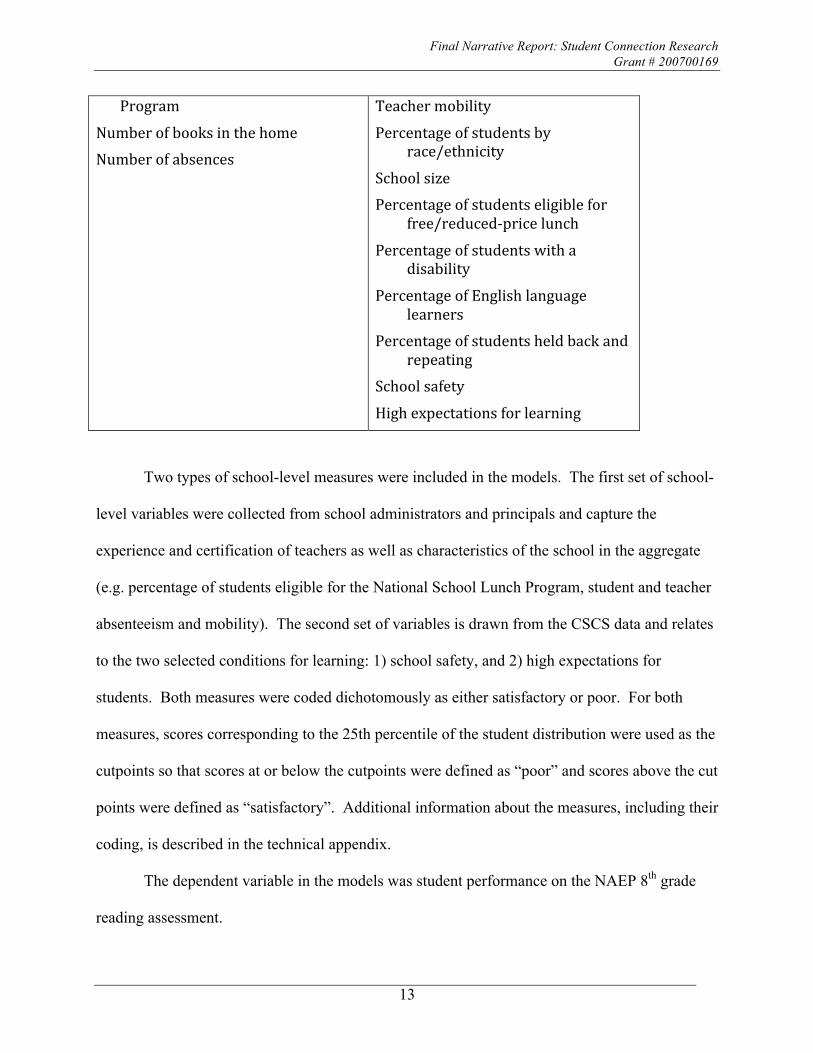
Final Narrative Report: Student Connection Research Grant # 200700169
13
Program
NumberofbooksinthehomeNumberofabsences
Teachermobility
Percentageofstudentsbyrace/ethnicity
SchoolsizePercentageofstudentseligiblefor
free/reduced‐pricelunch
Percentageofstudentswithadisability
PercentageofEnglishlanguagelearners
Percentageofstudentsheldbackandrepeating
Schoolsafety
Highexpectationsforlearning
Two types of school-level measures were included in the models. The first set of school-
level variables were collected from school administrators and principals and capture the
experience and certification of teachers as well as characteristics of the school in the aggregate
(e.g. percentage of students eligible for the National School Lunch Program, student and teacher
absenteeism and mobility). The second set of variables is drawn from the CSCS data and relates
to the two selected conditions for learning: 1) school safety, and 2) high expectations for
students. Both measures were coded dichotomously as either satisfactory or poor. For both
measures, scores corresponding to the 25th percentile of the student distribution were used as the
cutpoints so that scores at or below the cutpoints were defined as “poor” and scores above the cut
points were defined as “satisfactory”. Additional information about the measures, including their
coding, is described in the technical appendix.
The dependent variable in the models was student performance on the NAEP 8th grade
reading assessment.
Final Narrative Report: Student Connection Research Grant # 200700169
14
Analytic Strategy
Given the hierarchical structure of the merged CSCS-NAEP data (i.e., students nested
within schools), a two-level Hierarchical Linear Model (HLM) was used in the analysis to take
into account the nested nature of the data.9 Our HLM is comprised of two sets of linear
regression equations that incorporate explanatory variables at each level of the data structure. At
the student level (level 1), regression coefficients relating student achievement to the set of
specified student characteristics (e.g., gender, race, socio-economic status) are estimated for each
school. Because this level focuses on differences in proficiency related to characteristics of
students within schools, the effect of student background variables on achievement can differ
from one school to another.
At the school level (level 2), each school’s set of regression coefficients is predicted by a
set of school characteristics (e.g., school size, racial composition, and the conditions for
learning). In other words, the regression slopes estimated in level 1, which capture the
relationship between student characteristics and student performance, are used as dependent
variables in level 2 with school-level variables as predictors. The use of HLM allows us to
estimate the effect of school safety and high expectations on reading proficiency, net of all other
school-level predictors as well as student-level covariates.
The software program HLM6 was used for this study. HLM6 is designed to handle the
NAEP data structure, which incorporates plausible values for each student in order to estimate
9 See Braun et al. (2006a, 2006b) for a discussion of the technical issues related to running HLM models with NAEP data, including sample weights and variance estimation.
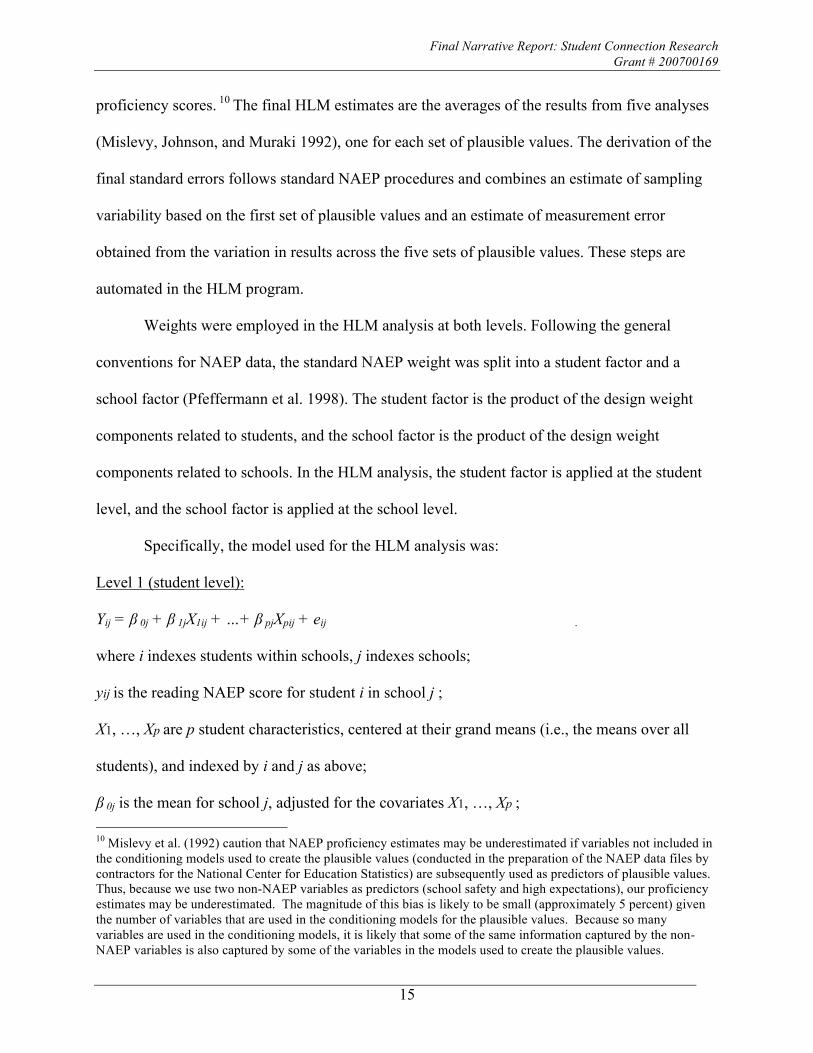
Final Narrative Report: Student Connection Research Grant # 200700169
15
proficiency scores. 10 The final HLM estimates are the averages of the results from five analyses
(Mislevy, Johnson, and Muraki 1992), one for each set of plausible values. The derivation of the
final standard errors follows standard NAEP procedures and combines an estimate of sampling
variability based on the first set of plausible values and an estimate of measurement error
obtained from the variation in results across the five sets of plausible values. These steps are
automated in the HLM program.
Weights were employed in the HLM analysis at both levels. Following the general
conventions for NAEP data, the standard NAEP weight was split into a student factor and a
school factor (Pfeffermann et al. 1998). The student factor is the product of the design weight
components related to students, and the school factor is the product of the design weight
components related to schools. In the HLM analysis, the student factor is applied at the student
level, and the school factor is applied at the school level.
Specifically, the model used for the HLM analysis was: Level 1 (student level):
Yij = β 0j + β 1jX1ij + …+ β pjXpij + eij .
where i indexes students within schools, j indexes schools;
yij is the reading NAEP score for student i in school j ;
X1, …, Xp are p student characteristics, centered at their grand means (i.e., the means over all
students), and indexed by i and j as above;
β 0j is the mean for school j, adjusted for the covariates X1, …, Xp ; 10 Mislevy et al. (1992) caution that NAEP proficiency estimates may be underestimated if variables not included in the conditioning models used to create the plausible values (conducted in the preparation of the NAEP data files by contractors for the National Center for Education Statistics) are subsequently used as predictors of plausible values. Thus, because we use two non-NAEP variables as predictors (school safety and high expectations), our proficiency estimates may be underestimated. The magnitude of this bias is likely to be small (approximately 5 percent) given the number of variables that are used in the conditioning models for the plausible values. Because so many variables are used in the conditioning models, it is likely that some of the same information captured by the non-NAEP variables is also captured by some of the variables in the models used to create the plausible values.

Final Narrative Report: Student Connection Research Grant # 200700169
16
β1j, …, β pj are the regression coefficients associated with the covariates X1, …, Xp for school j;
eij is the random error (i.e., residual term) at level 1, assumed to be independently and normally
distributed with mean zero and a common variance σ2 for all students;
Level 2 (school level):
β 0j = γ00 + γ01W1j + γ02W2j …+ γ0qWqj + u0j
β 1j = γ10
…
β pj = γp0
W1, …, Wp are q school characteristics, including high expectations and school safety measures
for school j;
γ00 is the intercept for the regression of the adjusted school mean controlling for the school
characteristics;
γ01 is the regression coefficient associated with school characteristic W1, indicating how much of
the variation in adjusted school means can be associated with school characteristic W1, after
taking into account school differences on the other q – 1 school characteristics;
u0j is the random error in the level 2 equation, assumed to be independently and normally
distributed across schools with mean zero and variance τ2; and
γ10, … , γp0 are constants denoting the common values of the p regression coefficients across
schools. For example, γ10 is the common regression coefficient associated with the first covariate
in the level 1 model for each school.
Results
The merged CSCS-NAEP TUDA dataset contained 1,849 students enrolled in 96 schools.
Upon inspection of the dataset, we discovered that 20 schools contained no school-level
characteristics. Although student-level data were available, school administrators in these
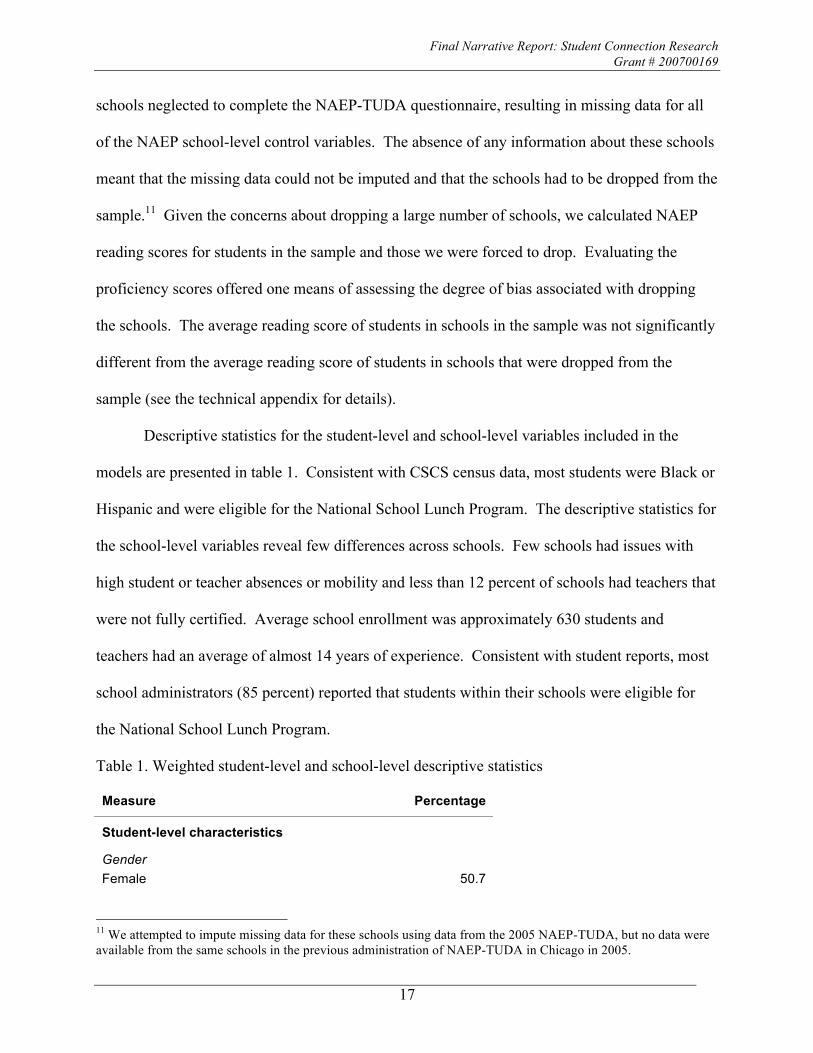
Final Narrative Report: Student Connection Research Grant # 200700169
17
schools neglected to complete the NAEP-TUDA questionnaire, resulting in missing data for all
of the NAEP school-level control variables. The absence of any information about these schools
meant that the missing data could not be imputed and that the schools had to be dropped from the
sample.11 Given the concerns about dropping a large number of schools, we calculated NAEP
reading scores for students in the sample and those we were forced to drop. Evaluating the
proficiency scores offered one means of assessing the degree of bias associated with dropping
the schools. The average reading score of students in schools in the sample was not significantly
different from the average reading score of students in schools that were dropped from the
sample (see the technical appendix for details).
Descriptive statistics for the student-level and school-level variables included in the
models are presented in table 1. Consistent with CSCS census data, most students were Black or
Hispanic and were eligible for the National School Lunch Program. The descriptive statistics for
the school-level variables reveal few differences across schools. Few schools had issues with
high student or teacher absences or mobility and less than 12 percent of schools had teachers that
were not fully certified. Average school enrollment was approximately 630 students and
teachers had an average of almost 14 years of experience. Consistent with student reports, most
school administrators (85 percent) reported that students within their schools were eligible for
the National School Lunch Program.
Table 1. Weighted student-level and school-level descriptive statistics Measure Percentage
Student-level characteristics
Gender Female 50.7
11 We attempted to impute missing data for these schools using data from the 2005 NAEP-TUDA, but no data were available from the same schools in the previous administration of NAEP-TUDA in Chicago in 2005.

Final Narrative Report: Student Connection Research Grant # 200700169
18
Race/ethnicity White 9.8 Black 48.9 Hispanic 37.8 Asian American/Pacific Islander 3.5 American Indian/Alaska Native 0.1
Disability status Disabled 18.7
English language learner (ELL) Students classified as ELL 6.5
Books in the home Students in homes with 26 or more books 51.4
National School Lunch Program (NSP) Student eligible for NSP 85.2
Student absences No absences in past month 43.3 School-level characteristics
Teacher Certification Not all teachers in school were certified 11.8
Teacher absenteeism Over 5% of teachers absent on an average day 3.7
Teacher mobility Over 5% of teachers who started last year left before the end of the school year 4.4
Student absences Over 5% of students absent on an average day 22.3
Student mobility Less than 70% of students enrolled at the beginning of the school year enrolled at the end of the school year 7.3
Students held back and repeating Over 5% of students held back and repeating 5.8
Race/ethnicity of school
White 10.7 Black 53.7 Hispanic 32.7
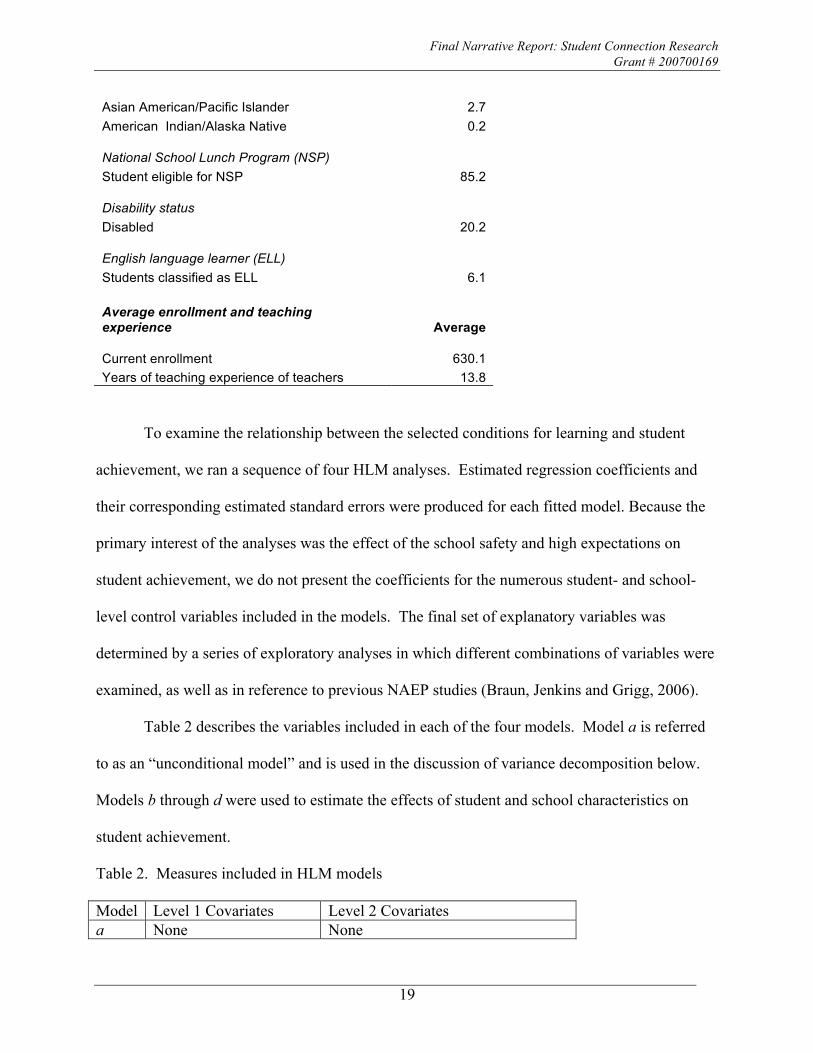
Final Narrative Report: Student Connection Research Grant # 200700169
19
Asian American/Pacific Islander 2.7 American Indian/Alaska Native 0.2
National School Lunch Program (NSP) Student eligible for NSP 85.2
Disability status Disabled 20.2
English language learner (ELL) Students classified as ELL 6.1 Average enrollment and teaching experience Average
Current enrollment 630.1 Years of teaching experience of teachers 13.8
To examine the relationship between the selected conditions for learning and student
achievement, we ran a sequence of four HLM analyses. Estimated regression coefficients and
their corresponding estimated standard errors were produced for each fitted model. Because the
primary interest of the analyses was the effect of the school safety and high expectations on
student achievement, we do not present the coefficients for the numerous student- and school-
level control variables included in the models. The final set of explanatory variables was
determined by a series of exploratory analyses in which different combinations of variables were
examined, as well as in reference to previous NAEP studies (Braun, Jenkins and Grigg, 2006).
Table 2 describes the variables included in each of the four models. Model a is referred
to as an “unconditional model” and is used in the discussion of variance decomposition below.
Models b through d were used to estimate the effects of student and school characteristics on
student achievement.
Table 2. Measures included in HLM models
Model Level 1 Covariates Level 2 Covariates a None None

Final Narrative Report: Student Connection Research Grant # 200700169
20
b None High expectations and School Safety c Student characteristics High expectations and School Safety d Student characteristics High expectations and School Safety
+ Other school characteristics
The focal parameters of interest in each model are the coefficients of the two school
climate measures. Fitting different models to the CSCS-NAEP TUDA data reveals how the
inclusion of different combinations of variables changes the estimates of the focal parameters of
interest. In order to see how the focal parameters change depending upon the set of covariates,
we show results for models b through d. Table xxx displays estimates of the coefficients for the
two school climate measures for models b-d, along with the corresponding standard errors and p
values12.
Table 3. Fixed effects of school climate measures
Model
Level 1 covariates
Level 2 covariates
School climate measures Coefficient Standard
Error P-value
School safety 13.8 4.53 0.00 b None High expectations and school safety High expectations -1.0 3.81 0.79
School safety 7.6 3.69 0.04 c Student characteristics
High expectations and school safety High expectations -1.2 2.72 0.65
School safety -1.3 3.42 0.71 d Student
characteristics High expectations and school safety + other school characteristics High expectations 3.9 2.55 0.13
The interpretation of the coefficients related to school safety is as follows: In model b, the
coefficient of school safety is 13.8. This means that, adjusted for the effect of teachers’
expectations, the average of the mean NAEP reading score for 8th graders among schools with
satisfactory safety conditions is estimated to be almost 14 points higher than the average of the 12 The p value (two-sided) is the probability that, under the null hypothesis of no average difference between schools with different levels of learning conditions (i.e., school climate measures), a difference as large or larger in absolute magnitude than the observed difference would occur.

Final Narrative Report: Student Connection Research Grant # 200700169
21
mean NAEP reading scores among schools with poor safety conditions. The difference is
significant at the .05 level.
When student characteristics are included (model c), the difference remains significant,
although the magnitude of the difference reduces to about 8 score points. However, in model d,
when all other school-level covariates are included, the difference in reading scores between
students in schools with satisfactory versus poor school safety is not significant from zero, net of
teacher high expectations. In other words, the effect of school safety on reading achievement
disappears once both student and school characteristics are factored into the model.
The estimate of teachers’ expectations shows different patterns. For all of the models, the
coefficient for high expectations is not significantly different from zero; that is, after controlling
for the effect of school safety, no significant difference is found in the average of the mean
NAEP reading scores at grade 8 between schools with satisfactory teacher expectations and
schools with poor teacher expectations.
It is also worth noting the size of the standard errors associated with each of the estimates
of high expectations. For models a and b, the standard errors are larger than their corresponding
coefficients. This suggests a large amount of imprecision in the measurement of high
expectations, which will be elaborated upon in the Discussion section below.
In addition to estimating coefficients of covariates, HLM also provides a decomposition
of the total variance in the models into a between-student, within-school component and a
between-school component. The variance decomposition is useful for understanding how much
of the variance in the models is attributable to student characteristics within schools and how
much is attributable to difference across schools (related to school-level characteristics). In other

Final Narrative Report: Student Connection Research Grant # 200700169
22
words, the results of the variance decomposition enhance the understanding of the likely sources
of heterogeneity in student achievement.
Table 3 presents the variance decompositions corresponding to models a–d. It also shows
the percentage reduction in the variances achieved by each level of the model, treating the
variances in model a as the baseline.
Table 4. Estimated variance decompositions
Model Between students, within
schools Between schools
Level 1 covariates Level 2 covariates
Residual variance
Percentage of variance in model a accounted for
Residual variance
Percentage of variance in model a accounted for
a None None 909 N/A 240 N/A b None High expectations
and school safety 909 0 208 13
c Student characteristics
High expectations and school safety
694 24 106 56
d Student characteristics
High expectations and school safety + other school characteristics
692 24 59 75
Model a is an unconditional model and yields the basic decomposition. The total variance
is 1,149 (i.e., 909 + 240); that is, about 79 percent of the total variance (909/1,149) is attributable
to between-student, within-school heterogeneity, and about 21 percent of the total variance
(240/1,149) is attributable to between-school heterogeneity. The inclusion of the school climate
measures at level 2 (model b) accounts for 13 percent of the between-school variance.
In model c, including all student-level covariates accounts for 24 percent of the within-
school variance. However, the impact on the variance at level 2 is greater. The introduction of
student-level covariates along with the school climate measures accounts for 56 percent of the
between-school variance. Finally,whenschool‐levelcovariatesareadded(modeld),an
additional19percentofthebetween‐schoolvariance(75‐56)isreduced.Inotherwords,
Final Narrative Report: Student Connection Research Grant # 200700169
23
theinclusionofschool‐levelcovariatesaccountsfor44percent((106‐59)/106)ofthe
between‐schoolheterogeneityinmodelcoratotalof75percentoftheinitialbetween‐
schoolvarianceinmodela.
Discussion
Merging Chicago Student Connection Survey data with Chicago NAEP-Trial Urban
District Assessment data yielded a unique dataset comprised of both school climate measures as
well measures of student, teacher, and other school characteristics. The CSCS provides insight
into student reports about the conditions for learning in their schools, including attitudes toward
school safety and the expectations for learning that teachers communicate to students. Because
of NAEP’s mandate to report student proficiency by a series of contextual variables, NAEP-
TUDA contains multiple student, teacher, and school level variables that can be used to explore
the predictors of student achievement.
Our analyses revealed effects for school safety on reading achievement, net of high
expectations for students as well as individual student characteristics (models b and c,
respectively). When all school-level control variables were added to the model, however, the
significant effect of school safety on achievement disappeared. Throughout all of the models,
the measure of student perceptions of high expectations for learning failed to demonstrate a
statistically significant relationship with reading proficiency. Although the two measures of
school climate were not statistically significant predictors in the fully specified model (model d),
the variance decomposition analyses suggests that this model accounted for a large proportion of
the variance explaining reading achievement. The combination of student-level and school-level
variables in the full model, including the school-level control variables as well as the two

Final Narrative Report: Student Connection Research Grant # 200700169
24
measures of conditions for learning, explained accounted for three-quarters of the variance in
student reading scores.
On the basis of our results from the merged CSCS-NAEP data, we suggest educational
researchers should consider the following:
1. Issues with missing data
Missing data is always an issue in social science research. When using large datasets
such as the NAEP national sample, missing data can be managed through various imputation
techniques, or, in severe cases, by dropping missing cases. Missing data on a smaller scale, such
as in the NAEP-TUDA sample, is more problematic. If, as in our dataset, school administrators
do not report basic school-level information, there is no clear strategy for imputing missing
values. This results in dropping cases, narrowing the sample size. Although our analysis of the
reading scores of students in the sample compared to those dropped of the sample indicated no
statistically significant differences, we still lost all of the information that these students reported
for the other covariates in the model.
2. Issues with lack of sample variation
A glance at the descriptive statistics from our merged sample indicates few sources of
variation across schools. For example, over 95 percent of all schools were classified as
“satisfactory” for teacher absenteeism and teacher mobility, and nearly 80 percent were
“satisfactory” for student absenteeism. In absolute numbers, this means that 3 of the 76 schools
in the sample were part of the “poor” category for teacher absenteeism and teacher mobility and
16 were classified as “poor” for student absenteeism. For the two school climate measures,
school safety and high expectations, schools at or below the 25th percentile were categorized as
“poor;” this translates to18 schools for school safety and 19 schools for high expectations.
Final Narrative Report: Student Connection Research Grant # 200700169
25
The small sample sizes for the school-level variables result in larger standard errors for
the estimates and, consequently, decrease the likelihood of detecting statistically significant
effects in the HLM analyses. The solution for this issue lies not in reclassifying the school-level
variables to include more cases. The cutpoints for the school-level variables were determined
substantively and reflect meaningful differences between schools. Schools in which the average
school safety rating is below the 25th percentile likely do have a very different school climate
compared to those schools where the ratings of school safety are higher.13 The small number of
schools in the sample with low reported levels of school safety and high expectations means that
we cannot rule out the possibility that the effects of these measures went undetected because of
the lack of variation across schools. Assessing the reliability of our results by replicating the
analyses using a larger sample of schools would be a welcome next step in the research on
school climate.
Implications for Future Research
The issues of missing data and sample variation should not, however, deter researchers
from using the CSCS and NAEP-TUDA data. In fact, should the Student Connection Survey
instrument developed for Chicago Public Schools be administered in other urban districts, the
data might be put to best use by pooling the CSCS data with the data from those districts.
Likewise, the NAEP-TUDA data for Chicago could be combined with data from the other
TUDA districts (corresponding to where the Student Connection Survey is administered).
Pooling the Student Connection Survey across districts and merging it with the pooled
TUDA data would have several benefits. First, the sample size of the merged data would be
expanded, making the dataset less susceptible to problems with missing data. Concomitant with
13 For context, the average school safety score for students at the 25th percentile was 290.5 (standard deviation equal to 33.4), compared to 339.3 for students above the 25th percentile (standard deviation equal to 21.9).

Final Narrative Report: Student Connection Research Grant # 200700169
26
reducing missing data, variation within the sample, especially for school-level measures would
also increase. With more schools and more students, differences between schools might be
easier to be detected and hence more likely to be statistically significant.
Finally, utilizing a sample of students and schools drawn from multiple urban districts
would make the results more generalizable to all urban districts. Although instructive, the results
from this paper are only representative of the population of Chicago students and schools.
Results pooled from other urban districts would still be directly representative of the students and
schools sampled from specific districts, but the power to argue that the results should hold across
other urban districts would increase with each additional urban district added. This would allow
researchers to speak more globally about the constructs measuring conditions for learning and
how these conditions impact student achievement across a broad and diverse range of urban
districts.

Final Narrative Report: Student Connection Research Grant # 200700169
27
References
Allen, N. L., Donoghue, J. R., & Schoeps, T. L. (2001). The NAEP 1998 technical report. Washington, DC: National Center for Education Statistics.
Battistich, V. (2001, April). Effects of an elementary school intervention on students’ “connectedness” to school and social adjustment during middle school. In J. Brown (Chair), Resilience education: Theoretical, interactive, and empirical applications. Symposium conducted at the annual meeting of the American Educational Research Association, Seattle, WA.
Blum, A. L., Beuhring, T., and Rinehard, P. M. (2000). Protecting teens: Beyond race, income and family structure. Minneapolis, MN: Center for Adolescent Health, University of Minnesota.
Braun, H., Jenkins, F., & Grigg, W. (2006a). A closer look at charter schools using hierarchical linear modeling. Washington, DC: National Center of Education Statistics.
Braun, H., Jenkins, F., & Grigg, W. (2006b). Comparing private schools and public schools using hierarchical linear modeling. Washington DC: National Center for Education Statistics.
CASEL Connections: SEL research and practice updates from the collaborative for academic, social and emotional learning (2006, March). Focus on Adolescents. University of Chicago, Illinois. Retrieved on December 3, 2007 from http://www.casel.org/listservs/enewsletters/e-news-mar06.htm.
Catalano, R. F., Berglund, M. L,.Ryan, J. A. M., Lonczak, H. S. and Hawkins, J. D. (2004). Positive youth development in the United States: Research findings on evaluations of positive youth development programs. The ANNALS of the American Academy of Political and Social Science, 591(1), 98-124.
Croninger, R. & Lee, V. E. (2001). Social capital and dropping out of high school: Benefits to at-risk students of teacher’s support and guidance. Teachers College Record, 103(4), 548-581.
Felner, R.D., & Adan, A.M. (1988). The school transitional project: An ecological intervention and evaluation. In R.H. Price, E.L. Cowen, R.P. Lorion, & J. Ramos-McKay (Eds.), 14 ounces of prevention: A casebook for practitioners (pp. 111-122). Washington, DC: American Psychological Association.
Fleming, Charles B., Haggerty, Kevin P., Catalano, Richard F., Harachi, Tracy W., Mazza, James, J., Gruman, Diana H. (2005). Do social and behavioral characteristics targeted by preventive interventions predict standardized test scores and grades? Journal of School Health, 75(9), 342-349.

Final Narrative Report: Student Connection Research Grant # 200700169
28
Goodenow, C. (1993). Classroom belonging among early adolescent students: Relationships to motivation and achievement. Journal of Early Adolescence, 13(1), 21-43.
Johnson, D. W. and Johnson, R. T. (1989). Cooperation and competition: Theory and research. Edina, MN: Interaction Book Company.
Learning First Alliance (2001). Every child learning: Safe and supportive schools. Washington, DC: Association for Supervision and Curriculum Development.
Lee, V. E., Smith, J. B., Perry, T. E. and Smylie, M. A. (1999). Social support, academic press and student achievement: a view from the middle grades in Chicago.
Lee, V. E., and Smith, J. B. (1999). Social support and achievement for young adolescents in Chicago: the role of school academic press. American Educational Research Journal, 36(4): 907-945.
Lutkus, A. D., Grigg, W. S., & Donahue, P. L. (2007). The nation’s report card: 2007 trial urban district assessment in reading. Washington, DC: National Center for Education Statistics.
Ma, X., and Wilkins, J. (2002). The development of science achievement in middle and high school: individual differences and schools effects. Evaluation Review, 26(4): 395-417.
Masten, A., Coatsworth, J., Neemann, J., Gest, S., Tellegen, A., & Garmezy, N. (1995). The structure and coherence of competence from childhood through adolescence. Child Development, 66: 754-763.
Mislevy, R.. J., Johnson, E. J., & Muraki, E. (1992). Scaling procedures in NAEP. Journal of Educational Statistics. 17(2): 131-154.
National Center for Education Statistics. (2005). NAEP item scoring process. Retrieved December 3, 2007, from www.nces.ed.gov/nationsreportcard/contracts/item_score.asp
National Center for Education Statistics. (2007). NAEP overview. Retrieved December 3, 2007, from http://www.nces.ed.gov/nationsreportcard/about/#overview
National School Boards Association (1996). Learning by design: A school leader’s guide to architectural services. Alexandria, VA: National School Boards Association.
Osher, D., Dwyer, K., and Jackson, S. (2004). Safe, supportive and successful schools: Step by step. Longmont, CO: Sopris West Educational Services.
Pfeffermann, D., Skinner, C.J., Holmes, D.J., Goldstein, H., and Rabash, J. (1998). Weighting for unequal selection probabilities in multilevel models. Journal of the Royal Statistical Society, 60(1): 23-40.
Resnick, M. D., Bearman, P. S., Blum, R. W., Bauman, K. E., Harris, K. M., Jones, J., Tabor, J., Beuhring, T., Sieving, R. E., Shew, M., Ireland, M., Bearinger, L. H., & Udry, J. R.

Final Narrative Report: Student Connection Research Grant # 200700169
29
(1997). Protecting adolescents from harm: Findings from the National Longitudinal Study on Adolescent Health. Journal of the American Medical Association, 278(10), 823-832.
Reyes, O. & Jason, L. A. (1991). An evaluation of a high school dropout prevention program. Journal of Community Psychology, 19, 221-230.
Sellström, E. and Bremberg, S. (2006). Is there a “school effect” on pupil outcomes? A review of multilevel studies. Journal of Epidemiology & Community Health, 60(2): 149-155.
Shouse, R. C. (1996). Academic press and sense of community: Conflict, congruence, and implications for student achievement. Social Psychology of Education, 1: 47-68.
Sinclair, M. F., Christenson, S. L., & Thurlow, M. L. (2005). Promoting school completion of urban secondary youth with emotional or behavioral disabilities. Exceptional Children, 71(4), 465-482.
Slavin, R. E. (1990). Cooperative learning: Theory, research, and practice. Englewood Cliffs, NJ: Prentice-Hall.
Voelkl, K. A. (1995). School warmth, student participation, and achievement. Journal of Experiential Education, 63, 127-138.
Wentzel, K.R. (1998). Social relationships and motivation in middle school: The role of parents, teachers, and peers. Journal of Educational Psychology, 90(2), 202-209.
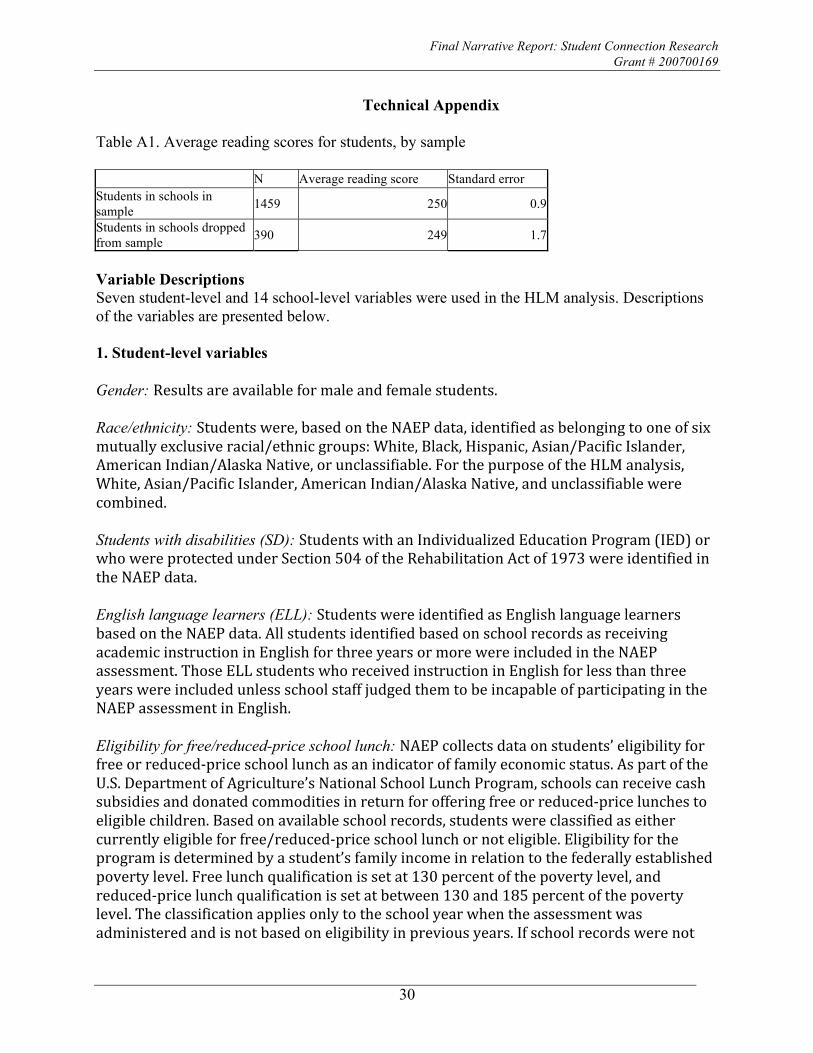
Final Narrative Report: Student Connection Research Grant # 200700169
30
Technical Appendix
Table A1. Average reading scores for students, by sample
N Average reading score Standard error Students in schools in sample 1459 250 0.9 Students in schools dropped from sample 390 249 1.7
Variable Descriptions Seven student-level and 14 school-level variables were used in the HLM analysis. Descriptions of the variables are presented below. 1. Student-level variables Gender: Resultsareavailableformaleandfemalestudents.Race/ethnicity: Studentswere,basedontheNAEPdata,identifiedasbelongingtooneofsixmutuallyexclusiveracial/ethnicgroups:White,Black,Hispanic,Asian/PacificIslander,AmericanIndian/AlaskaNative,orunclassifiable.ForthepurposeoftheHLManalysis,White,Asian/PacificIslander,AmericanIndian/AlaskaNative,andunclassifiablewerecombined.Students with disabilities (SD): StudentswithanIndividualizedEducationProgram(IED)orwhowereprotectedunderSection504oftheRehabilitationActof1973wereidentifiedintheNAEPdata.English language learners (ELL): StudentswereidentifiedasEnglishlanguagelearnersbasedontheNAEPdata.AllstudentsidentifiedbasedonschoolrecordsasreceivingacademicinstructioninEnglishforthreeyearsormorewereincludedintheNAEPassessment.ThoseELLstudentswhoreceivedinstructioninEnglishforlessthanthreeyearswereincludedunlessschoolstaffjudgedthemtobeincapableofparticipatingintheNAEPassessmentinEnglish.Eligibility for free/reduced-price school lunch: NAEPcollectsdataonstudents’eligibilityforfreeorreduced‐priceschoollunchasanindicatoroffamilyeconomicstatus.AspartoftheU.S.DepartmentofAgriculture’sNationalSchoolLunchProgram,schoolscanreceivecashsubsidiesanddonatedcommoditiesinreturnforofferingfreeorreduced‐pricelunchestoeligiblechildren.Basedonavailableschoolrecords,studentswereclassifiedaseithercurrentlyeligibleforfree/reduced‐priceschoollunchornoteligible.Eligibilityfortheprogramisdeterminedbyastudent’sfamilyincomeinrelationtothefederallyestablishedpovertylevel.Freelunchqualificationissetat130percentofthepovertylevel,andreduced‐pricelunchqualificationissetatbetween130and185percentofthepovertylevel.Theclassificationappliesonlytotheschoolyearwhentheassessmentwasadministeredandisnotbasedoneligibilityinpreviousyears.Ifschoolrecordswerenot

Final Narrative Report: Student Connection Research Grant # 200700169
31
available,oriftheschooldidnotparticipateintheprogram,thestudentwasclassifiedasnoteligible.Number of books in the home: StudentswhoparticipatedinNAEPwereaskedabouthowmanybookstherewereintheirhomes.Responseoptionsincluded“afew(0–10),”“enoughtofilloneshelf(11–25),”“enoughtofillonebookcase(26–100),”or“enoughtofillseveralbookcases(morethan100).”ForthepurposeoftheHLManalysis,thefirsttworesponsecategorieswerecombined,alongwithanymissingresponses,andthelasttwocategorieswerecombined.Number of absences: StudentswhoparticipatedinNAEPwereaskedhowmanydaystheyhadbeenabsentfromschoolinthelastmonth.Responseoptionsincluded“none,”“1or2days,”“3or4days,”“5to10days,”or“morethan10days.”ThevariableintheHLManalysiswasrecodedintotwocategories:studentswhoindicated“none”forthenumberofdaysabsentoverthepastmonth,andstudentswhoindicated“1ormoredays”alongwithstudentswhohadmissingresponses.2. School-level variables Years of teaching experience: YearsofteachingexperiencewascomputedasthemeanofalloftheyearsofexperienceofteachersinaschoolbasedontheNAEPdata.Ifthevaluewasmissingfortheentireschool,themeanforallschoolswithdataavailablewassubstituted.Teacher certification: BasedontheNAEPdata,teachersofparticipatingstudentswereaskedtoindicatethetypeofteachingcertificatetheyheld(choosingfromfivepossibleoptions)oriftheyheldnocertificate.Resultsforstudentswhoseteachersindicatedhavingaregularorprovisionalcertificatewerecategorizedashavinga“certified”teacher.Studentswhoseteachersindicatedhavingaprobationary,temporary,oremergencycertificate(oriftheresponsewasmissing)werecategorizedashavingateacherwhowasnotcertified.Thevariablewastheaggregatedvalueforaschoolofallstudentsmatchedwithateacherquestionnaire.ThevariableintheHLManalysishadtwocategories:“Allteachersintheschoolwerecertified”and“Notallteachersintheschoolwerecertified.”Student absenteeism: TheNAEPschoolquestionnaireaskedschooladministratorstoindicatethepercentageofstudentsabsentonanaverageday.Responseoptionsincluded“0–2%,”“3–5%,”“6–10%,”and“morethan10%.”Thefirsttwocategoriesandthelasttwocategorieswerecombined,respectively,fortheHLManalysis.Teacher absenteeism: TheNAEPschoolquestionnaireaskedschooladministratorstoindicatethepercentageofteachersabsentonanaverageday.Responseoptionsincluded“0–2%,”“3–5%,”“6–10%,”and“morethan10%.”Thefirsttwocategorieswerecombined,alongwithMissingresponsestoformonecategory.Thelasttwocategorieswerecombinedtoformtheothercategory.
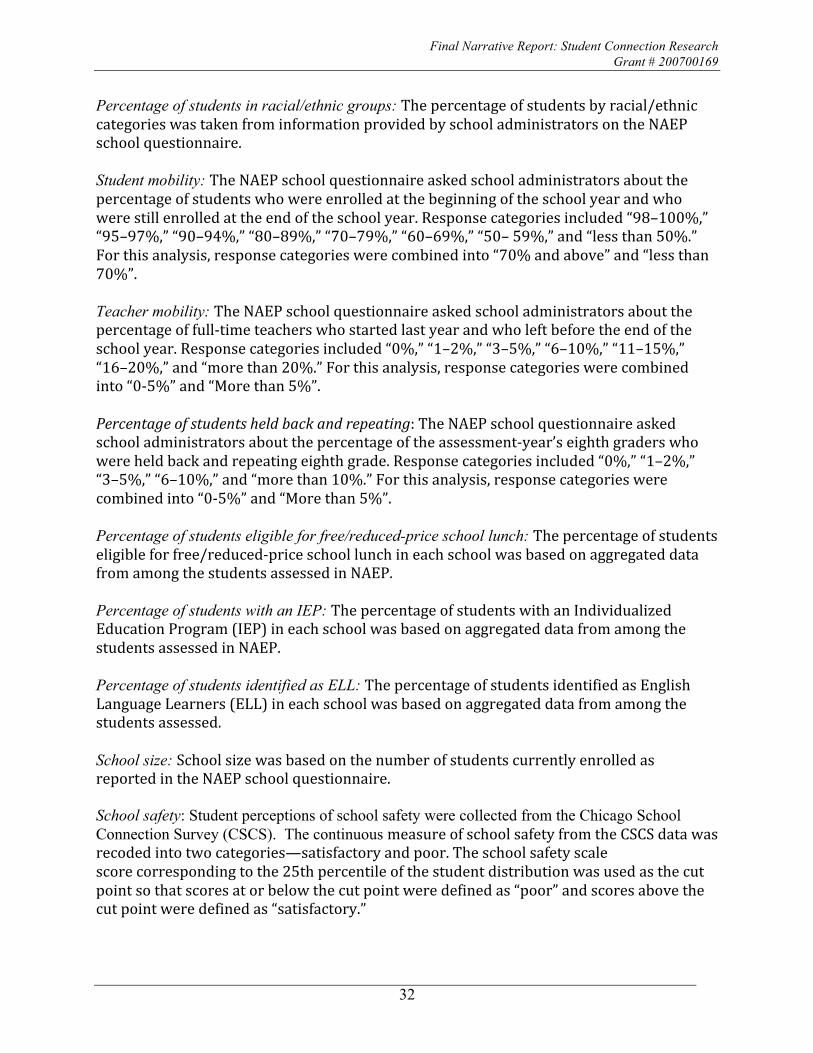
Final Narrative Report: Student Connection Research Grant # 200700169
32
Percentage of students in racial/ethnic groups: Thepercentageofstudentsbyracial/ethniccategorieswastakenfrominformationprovidedbyschooladministratorsontheNAEPschoolquestionnaire.Student mobility: TheNAEPschoolquestionnaireaskedschooladministratorsaboutthepercentageofstudentswhowereenrolledatthebeginningoftheschoolyearandwhowerestillenrolledattheendoftheschoolyear.Responsecategoriesincluded“98–100%,”“95–97%,”“90–94%,”“80–89%,”“70–79%,”“60–69%,”“50–59%,”and“lessthan50%.”Forthisanalysis,responsecategorieswerecombinedinto“70%andabove”and“lessthan70%”.Teacher mobility: TheNAEPschoolquestionnaireaskedschooladministratorsaboutthepercentageoffull‐timeteacherswhostartedlastyearandwholeftbeforetheendoftheschoolyear.Responsecategoriesincluded“0%,”“1–2%,”“3–5%,”“6–10%,”“11–15%,”“16–20%,”and“morethan20%.”Forthisanalysis,responsecategorieswerecombinedinto“0‐5%”and“Morethan5%”.Percentageofstudentsheldbackandrepeating:TheNAEPschoolquestionnaireaskedschooladministratorsaboutthepercentageoftheassessment‐year’seighthgraderswhowereheldbackandrepeatingeighthgrade.Responsecategoriesincluded“0%,”“1–2%,”“3–5%,”“6–10%,”and“morethan10%.”Forthisanalysis,responsecategorieswerecombinedinto“0‐5%”and“Morethan5%”. Percentage of students eligible for free/reduced-price school lunch: Thepercentageofstudentseligibleforfree/reduced‐priceschoollunchineachschoolwasbasedonaggregateddatafromamongthestudentsassessedinNAEP. Percentage of students with an IEP: ThepercentageofstudentswithanIndividualizedEducationProgram(IEP)ineachschoolwasbasedonaggregateddatafromamongthestudentsassessedinNAEP.Percentage of students identified as ELL: ThepercentageofstudentsidentifiedasEnglishLanguageLearners(ELL)ineachschoolwasbasedonaggregateddatafromamongthestudentsassessed.School size: SchoolsizewasbasedonthenumberofstudentscurrentlyenrolledasreportedintheNAEPschoolquestionnaire. School safety: Student perceptions of school safety were collected from the Chicago School Connection Survey (CSCS). The continuous measureofschoolsafetyfromtheCSCSdatawasrecodedintotwocategories—satisfactoryandpoor.Theschoolsafetyscalescorecorrespondingtothe25thpercentileofthestudentdistributionwasusedasthecutpointsothatscoresatorbelowthecutpointweredefinedas“poor”andscoresabovethecutpointweredefinedas“satisfactory.”

Final Narrative Report: Student Connection Research Grant # 200700169
33
High expectations: Student perceptions of the expectations for learning in their school were collected from the Chicago School Connection Survey (CSCS). The continuous measureofhighexpectationsfromtheCSCSdatawasrecodedintotwocategories—satisfactoryandpoor.Thehighexpectationsscalescorecorrespondingtothe25thpercentileofthestudentdistributionwasusedasthecutpointsothatscoresatorbelowthecutpointweredefinedaspoorandscoresabovethecutpointweredefinedassatisfactory.