student drug use survey pei 2014 v20 - prince … · student drug use report 2013 i executive...
TRANSCRIPT


PRINCE EDWARD ISLAND
STUDENT DRUG USE
2004‐2013

Acknowledgements
Tremendous thanks go to Katarina Kujundzic, our Health Care Futures summer student, who was
instrumental in the production of this report. Thanks also to Kathleen Brennan, Sterling Carruthers, and
Dr. Rhonda Matters for their review and comments on the report.
This report was built from an analysis of the data collected from the Youth Smoking Survey (YSS). The
Youth Smoking Survey is a product of the pan‐Canadian capacity building project funded through a
contribution agreement between Health Canada and the Propel Centre for Population Health Impact
from 2004 to 2007 and a contract between Health Canada and the Propel Centre for Population Health
Impact from 2008‐2011. The YSS consortium includes Canadian tobacco control researchers from all
provinces and provided training opportunities for university students at all levels. The views expressed
herein do not necessarily represent the views of Health Canada.
Population Health Assessment and Surveillance
Chief Public Health Office
Department of Health and Wellness
May 2015
Printed by Document Publishing Centre, Charlottetown, PEI.
Available on the Prince Edward Island Department of Health and Wellness Website:
www.gov.pe.ca/health

Student Drug Use Report 2013 i
Executive Summary
The Prince Edward Island Student Drug Use Report describes the prevalence and drug use trends for tobacco,
alcohol, cannabis and other drugs as reported by Prince Edward Island students in grades 6 through 12. Data
and figures presented in this report are based on the 2004‐05, 2006‐07, 2008‐09, 2010‐11, and 2012‐13
Youth Smoking Survey results. It is not meant to be a full discussion on potential reasons for changing rates
or methods to reduce student substance use, but rather a starting point for these discussions.
General:
Alcohol, cannabis, tobacco, and other drug use usually increased as grade level increased.
Typically males reported more substance use compared to females.
A relationship was observed between student substance use and poor emotional well‐being.
Students that reported using substances reported lower self‐esteem on emotional well‐being
questions from the survey, compared to students that did not report using drugs.
Academic achievement and drug use follows the same trend; students that reported using
substances indicated having lower marks in academic achievement questions from the survey,
compared to students that did not report using substances.
School connectedness and drug use also follows the same trend. Students that reported using
substances were less likely to respond positively to school connectedness questions.
Bullying and substance use also follows the same trend. Students that reported using substances
were more likely to report participating in bullying behaviors.
Alcohol:
Alcohol was the most prevalent drug among the population of Island students surveyed (39% of
students reported having more than a sip of alcohol in the last 12 months).
The trend in alcohol use has been decreasing over time.
An estimated 43% of students who reported drinking alcohol, reported mixing alcohol with energy
drinks in the last 12 months.
Overall, 81% of students who reported drinking more than just a sip in the last 12 months, reported
binge drinking in the last 12 months.
Binge drinking has not changed since 2010‐11 (79%) or 2008‐09 (82%).
Tobacco:
Tobacco use (“smoker”) has remained similar to 2010‐11 and 2008‐09 (8% of students were smokers
in 2012‐13).
Roll‐your‐own cigarette use, cigarillo use, smokeless tobacco use, and water pipe use has increased
since 2010‐11.
Cigar use, pipe tobacco use, blunt wrap use, and bidi use have remained similar to 2010‐11.
Students who are smokers were more likely to have used cannabis and/or alcohol.
Cannabis:
Cannabis use has remained steady (21% of students reported using cannabis in the last 12 months).
ii Student Drug Use Report 2013
Other Drugs:
In total, 24% of students from grades 7‐12 report using at least one drug (excludes tobacco and
alcohol) in the last 12 months. Of those students, 37% used more than one.
Approximately 10.1% of students reported using any one drug (excluding cannabis, alcohol, and
tobacco) in the last 12 months.
Salvia and solvent use have decreased since 2010‐11.
Healthy Living:
Females report significantly lower emotional well‐being compared with their male counterparts.
Females were significantly more likely to report getting higher marks than their male counterparts.
Overall, 24% of students reported being bullied in the last 30 days, while 11% of students reported
bullying others in the last 30 days.
Only 12% of students overall reported consuming six or more servings of fruits and vegetables on a
usual day. Fruit and vegetable consumption was associated with emotional well‐being and academic
achievement.
Approximately 12% of students reported getting at least 60 minutes of vigorous physical activity
every day over the last week. Males were consistently more active than females. A relationship was
observed between amount of physical activity and emotionally well‐being.
Eighty‐five percent of students reported exceeding the recommended maximum of two hours of
screen time per day. Students that exceeded two hours of screen time per day reported having
lower marks and lower self‐esteem/emotional well‐being than students who reported less than two
hours of screen time per day.
Overall, 62% of students responded “agree” or “strongly agree” to all six questions pertaining to
school connectedness (“I feel close to people at my school”, “I feel I am part of my school”, “I am
happy to be at my school”, “I feel the teachers at my school treat me fairly”, “I feel safe in my
school”, and “Getting good grades is important to me”).

Student Drug Use Report 2013 iii
Student Drug Use Indicator Table ‐ Use in the last 12 months
School Year
2012‐13 %
2010‐11 %
Alcohol (more than just a sip) 38.8 41.8
Alcohol (binge drinking, among drinkers) 81.1 78.7
Tobacco (current smokers) 8.0 7.7
Cannabis 20.7 18.8
Drugs (not Cannabis) 10.1 ‐
Pain Relievers 3.8 4.6
Hallucinogens 3.8 3.8
MDMA 3.4 4.3
Stimulants 3.4 3.0
Amphetamines 3.1 2.7
Cocaine 2.9 2.6
Dextromethorphan (Cough/cold medicine) 2.9 3.3
Sleeping Medication 2.0 2.2
Sedatives/Tranquilizers 1.6 2.0
Spice 1.6 ‐
Salvia 1.3 2.9
Solvents 1.1 2.9
Bath Salts 1.1 ‐
BZP/TFMPP 1.0 ‐
Heroin 0.9 1.4
‐ Not asked in the 2010‐11 survey or data not comparable

iv Student Drug Use Report 2013

Student Drug Use Report 2013 v
Table of Contents Executive Summary ........................................................................................................................................ i
Overview ....................................................................................................................................................... 1
Methodology ................................................................................................................................................. 2
Alcohol Use ................................................................................................................................................... 3
Tobacco Use .................................................................................................................................................. 9
Cannabis Use ............................................................................................................................................... 15
Drug Use (excluding cannabis) .................................................................................................................... 19
Pain Relievers ................................................................................................................................................................ 21
Dextromethorphan (cough/cold medicine) ..................................................................................................... 23
Sleeping Medication .................................................................................................................................................... 24
Sedatives/Tranquilizers............................................................................................................................................ 25
Illicit Drug Use ............................................................................................................................................................... 26
Hallucinogens ................................................................................................................................................................ 26
Amphetamines .............................................................................................................................................................. 28
Cocaine ............................................................................................................................................................................. 29
Salvia ................................................................................................................................................................................. 30
Bath Salts ......................................................................................................................................................................... 31
BZP/TFMPP .................................................................................................................................................................... 32
Heroin ............................................................................................................................................................................... 33
Miscellaneous Drug Use .............................................................................................................................. 34
Spice .................................................................................................................................................................................. 34
Trends in Drug Use ...................................................................................................................................... 36
Healthy Living: Physical, Emotional, Mental .............................................................................................. 40
Emotional Well‐Being and Self‐Esteem .............................................................................................................. 40
Academic Achievement ............................................................................................................................................. 40
Bullying ............................................................................................................................................................................ 41
Physical Activity ........................................................................................................................................................... 44
Screen Time .................................................................................................................................................................... 45
School Connectedness ................................................................................................................................................ 46
Risk of Alcohol or Drug‐related Disorder .......................................................................................................... 47
References .................................................................................................................................................. 48

vi Student Drug Use Report 2013

Overview and Methodology
Student Drug Use Report 2013 1
Overview
This document describes the prevalence and trends of tobacco, alcohol, cannabis, and other drug use as
reported by Prince Edward Island students in grades 6 through 12. This document also briefly describes other
student behaviors such as bullying, healthy eating and physical activity. Data and figures presented in this
report are based on the 2004‐05, 2006‐07, 2008‐09, 2010‐11, and 2012‐13 Youth Smoking Survey (YSS)
results. This report attempts to present a comprehensive analysis of student substance use and other
behaviors by:
Reporting on students surveyed in a safe and non‐judgmental atmosphere.
Reporting on students at various developmental stages and stages of adolescence.
Correlating drug use with emotional well‐being, school marks, peer and family influence, and age of
onset.
Observing patterns comparatively with the past five survey years.
This report is not meant to be a full discussion on potential reasons for changing student substance use rates
nor methods to reduce use. It is a description of the self‐reported trends at a population level with some
interpretation of these statistics. It is also important to note that this report is meant to be complementary
to the 2012‐13 SHAPES‐PEI report as it reflects the self‐reported data from different students within the
same cohorts (grades).

Overview and Methodology
2 Student Drug Use Report 2013
Methodology
Survey Procedure
The 2004‐13 PEI Student Drug Use Report provides an analysis and summary of the 2012‐13 YSS data1–7 that
corresponds with the analyses of the 2004‐05, 2006‐07, 2008‐09, and 2010‐11 surveys. The YSS, sponsored
by Health Canada (http://www.yss.uwaterloo.ca), is a classroom‐based survey that examines the tobacco,
alcohol, cannabis, and other substance use behaviors of students. The survey outlines possible implications
substance use may have on students’ health, well‐being, and school performance. In 2012‐13, YSS
collaborated with the SHAPES‐PEI project (healthy eating, physical activity, and mental fitness survey).
Approximately one‐third of participating grade 6‐12 students in each classroom received a YSS, while the
remaining two‐thirds received a SHAPES‐PEI survey. In PEI, a total of 53 of 61 target schools were surveyed.
Overall, 2525 students from grade 6‐12 completed the YSS in 2012‐13. All analyses of the data took into
account probability weights, to adjust for the disproportionate cluster sample design. Bootstrap weights
(BSW1‐BSW500, faye method) were used to evaluate the statistical significance and correct for imprecise
analyses of the questions.8 Manipulation and analysis of the data were performed using the statistical
program STATA 13.
Presentation of the Results
All questions, and some definitions, outlined in this report are summarized from the YSS 2012‐13 Data
Codebook7 and 2012‐13 YSS Results Profile9, with the exception of a few definitions that were adapted from
the World Health Organization Drug Lexicon10 and Mycek et al.11 Substances throughout the report were
grouped in the following categories: alcohol, tobacco, cannabis, prescription drugs/over‐the‐counter drugs
(OTC), illicit drugs, and miscellaneous drugs. Any data in the figures or tables that represents 5 students or
less was suppressed to maintain confidentiality. For some questions, data from earlier years were omitted
due to dissimilar questions. Students in grade 6 were not asked questions about alcohol, cannabis or other
drug use. Students were asked about their substance use “ever” and “in the last 12 months” from date of
survey, so results are presented using those words. In the graphs, the years are shown as the first year of the
school year (eg: 2004‐05 is shown as 2004). Results for alcohol, tobacco, cannabis, and other drug use are
presented in “High‐Low‐Close” charts, which display data points for total student population (Total), each sex
(Male and Female), and each grade (G6, G7, G8, G9, G10, G11, G12, where G is used as an abbreviation for
grade). Confidence interval bars on each data point represent 95% confidence intervals. The dashed lines
that run horizontally throughout each graph are used as reference points, indicating the lower and upper
bounds of the 95% confidence intervals of the “Total” data point for each question. Differences in estimates
that have a p‐value <0.05 are reported as “significant”. Differences in estimates that have a p‐value >0.05
but <0.10 are reported as a “somewhat” higher or lower. Differences in estimates that have a p‐value >0.10
are reported as “no” difference.
It is important to emphasize that this survey is based on self‐reports. There is a potential for individual
students to exaggerate or deny certain behaviors, including substance use.

Alcohol Use
Student Drug Use Report 2013 3
Alcohol Use
Drinking in 2012‐13 Drinking in the Past
Total Sample Overall, 38.8% of students from grade 7‐12 reported having consumed alcohol (more than just a sip) in the last 12 months.
The overall rate of drinking has decreased in this population: 41.8% of students in 2010 and 45.7% of students in 2008 reported having consumed alcohol (more than just a sip) in the last 12 months.
Sex Drinking rates are similar between males (39.4%) and females (38.2%).
In 2008, somewhat more males (47.2%) reported drinking than females (44.3%) but no sex difference was found in 2010.
Grade/Age
The proportion of drinkers increases with increasing grade. The average age at which grade 12 students first consumed alcohol (more than just a sip) was 14 years old.
The average age at which grade 12 students first consumed alcohol (more than just a sip) has not changed over time.
38.8 39.4 38.2
4.8
12.2
25.2
49.7
58.8
74.2
0
10
20
30
40
50
60
70
80
90
100
Total Male Female G7 G8 G9 G10 G11 G12
Percent
Student drinking in the last 12 months, by sex and grade, PEI, 2012‐13
Question: 7 In the last 12
months, have you had a
drink of alcohol that was
more than just a sip?
Definition: 9 “Drinking” is
defined by having a drink
of alcohol that was more
than just a sip.

Alcohol Use
4 Student Drug Use Report 2013
A significant association was observed between being a drinker and lack of school connectedness. In 2012‐13, non‐drinkers were significantly more likely to answer “true” or “mostly true” to each of the school connectedness questions than drinkers. In fact, a significantly higher proportion of non‐drinkers (65.6%) answered “true” or “mostly true” to all of the school connectedness questions overall, compared to drinkers (49.9%).
◊◊
◊
◊
◊ ◊
◊
◊ ◊ ◊
◊◊
◊
◊
0
20
40
60
80
100
I feel close to people at my school
I feel I am part of my school
I am happy to be at my school
I feel the teachers at my school treat me
fairly
I feel safe in my school
Getting good grades is important to me
Overall
Percent
School connectedness responses (true/mostly true) of drinkers vs. non‐drinkers, PEI, 2012‐13
Drinker Non‐drinker ◊ Significant difference
A relationship between being a drinker and demonstrating bullying behaviors towards others was observed. In 2012‐13, the proportion of drinkers (17.9%) reported engaging in any type of bullying in the last 30 days was more than twice as great as the proportion of non‐drinkers (8.3%). A significantly greater proportion of drinkers reported engaging in every type of bullying behavior in the last 30 days than non‐drinkers.
◊
◊
◊
◊
◊
◊
◊
◊
◊
◊
0
5
10
15
20
25
30
35
40
Physical Verbal Cyber Theft Any
Percent
Bullying behaviours of drinkers vs. non‐drinkers, PEI, 2012‐13
Drinker Non‐drinker
◊ Significant difference
Question:7 How strongly do
you agree or disagree with
the following?
(a) I feel close to people at
my school
(b) I feel I am part of my
school
(c) I am happy to be at my
school
(d) I feel the teachers at my
school treat me fairly (e) I
feel safe in my school
(f) Getting good grades is
important to me
Question:7 In the last
30 days, in what ways
did you bully other
students?

Alcohol Use
Student Drug Use Report 2013 5
In 2012‐13, a significant association was observed between drinking (in the last 12 months) and self esteem.
Students who reported not having a drink that was more than a sip in the last 12 months were more likely to
report higher self‐esteem (i.e. responding “true” or “mostly true” to “I like the way I am”, “When I do
something, I do it well”, and “I like the way I look”) than drinkers. It is not possible to discern whether
drinking lowers self‐esteem, low self‐esteem encourages drinking, or some other factor influences both.
Alcohol use and emotional well‐being, PEI, 2012‐13
Emotional well‐being* Drinkers
(last 12 months) Non‐drinkers
In general, I like the way I am.
71.7% 80.4%
When I do something, I do it well.
73.8% 78.3%
I like the way I look. 62.2% 70.4%
*If students answered “True” or “Mostly True”, they were considered to have high self‐esteem.
In 2012‐13, a significant relationship was observed between being a drinker and reporting low academic
achievement. Students who reported having a drink that was more than a sip in the last 12 months were
more likely to report lower grades (i.e. marks were “mostly B’s and C’s” or “mostly lower than C’s”) than
non‐drinkers, who were more likely to report their marks as being “mostly A’s and B’s” .
Alcohol use and school marks, PEI, 2012‐13
Marks in school Drinkers
(last 12 months) Non‐drinkers
Mostly A’s and B’s 70.5% 88.5%
Mostly B’s and C’s 26.4% 10.7%
Mostly lower than C’s 3.1% 0.9%
Question:7 Which of the following best
describes your marks during the past
year?
a) Mostly A’s and B’s > 70%
b) Mostly B’s and C’s/ 50% ‐ 69%
c) Mostly below C’s < 50%
Question:7 Choose the answer that describes how you feel about the statements (True, Mostly True, Neutral, False, Mostly False): (a) “In general, I like the way I am” (b) “When I do something, I do it well” (c) “I like the way I look”
Alcohol Use
6 Student Drug Use Report 2013
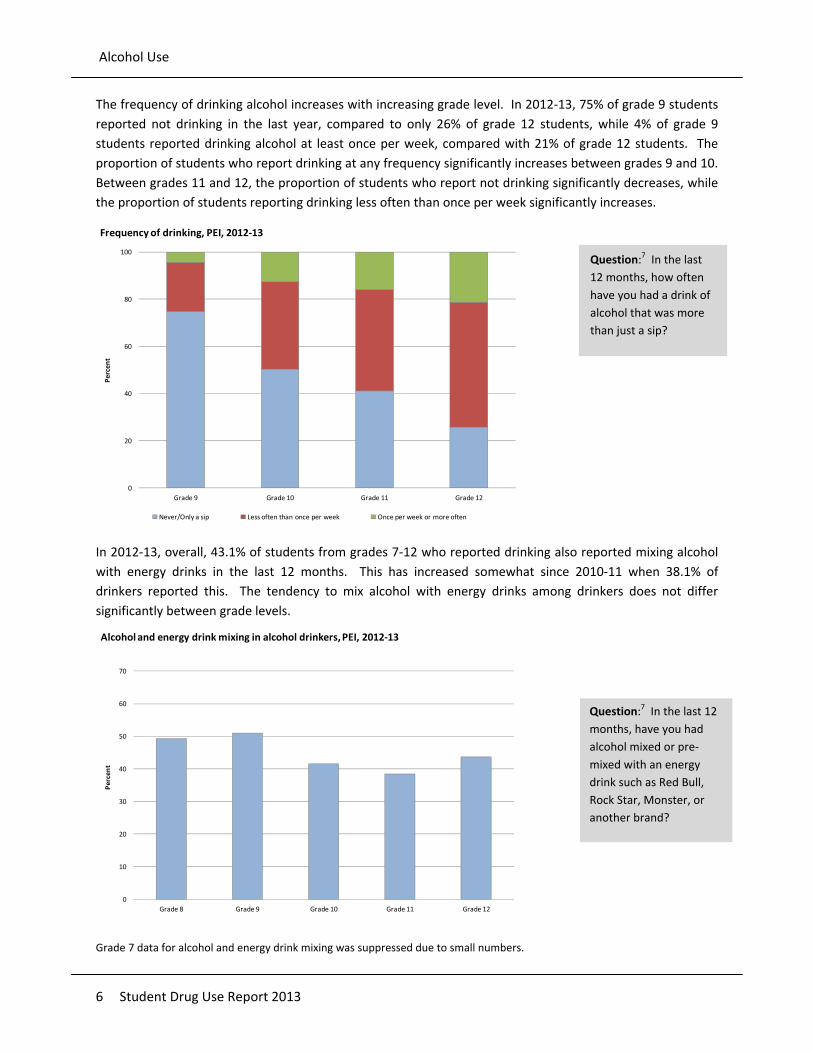
The frequency of drinking alcohol increases with increasing grade level. In 2012‐13, 75% of grade 9 students
reported not drinking in the last year, compared to only 26% of grade 12 students, while 4% of grade 9
students reported drinking alcohol at least once per week, compared with 21% of grade 12 students. The
proportion of students who report drinking at any frequency significantly increases between grades 9 and 10.
Between grades 11 and 12, the proportion of students who report not drinking significantly decreases, while
the proportion of students reporting drinking less often than once per week significantly increases.
0
20
40
60
80
100
Grade 9 Grade 10 Grade 11 Grade 12
Percent
Frequency of drinking, PEI, 2012‐13
Never/Only a sip Less often than once per week Once per week or more often
In 2012‐13, overall, 43.1% of students from grades 7‐12 who reported drinking also reported mixing alcohol
with energy drinks in the last 12 months. This has increased somewhat since 2010‐11 when 38.1% of
drinkers reported this. The tendency to mix alcohol with energy drinks among drinkers does not differ
significantly between grade levels.
0
10
20
30
40
50
60
70
Grade 8 Grade 9 Grade 10 Grade 11 Grade 12
Percent
Alcohol and energy drink mixing in alcohol drinkers, PEI, 2012‐13
Grade 7 data for alcohol and energy drink mixing was suppressed due to small numbers.
Question:7 In the last
12 months, how often
have you had a drink of
alcohol that was more
than just a sip?
Question:7 In the last 12
months, have you had
alcohol mixed or pre‐
mixed with an energy
drink such as Red Bull,
Rock Star, Monster, or
another brand?

Alcohol Use
Student Drug Use Report 2013 7
Binge Drinking in 2012‐13 Binge Drinking in the Past
Total Sample Overall, 81.1% of grade 7‐12 students who reported drinking (more than just a sip) in the last 12 months, reported binge drinking in the last 12 months.
The overall rate of binge drinking among drinkers has remained similar to 2010‐11 (78.7%) and 2008‐09 (82.3.
Sex Binge drinking rates in 2012‐13 were similar between males (82.5%) and females (79.7%) who drink.
In 2008‐09, significantly more males who drink (85.2%) reported binge drinking than females (79.1%) who drink.
Grade/Age The proportion of binge drinkers among students who drink increases substantially between grades 8 and 9, but is similar among grades 9 to 12. In 2012‐13, the average age at which grade 12 students first binge drank was 14.8 years old.
The average age at which grade 12 students first binge drank has not changed over time.
Our students have a culture of binge drinking that appears to begin at the Grade 9 level. Students that are consuming alcohol are doing so in a dangerous manner. Binge drinking leads to substantial intoxication which can often produce both accidental and non‐accidental injuries, bullying, and irresponsible sexual behavior.
81.1 82.5 79.7
45.4
82.5 81.9 81.2 85.6
0
10
20
30
40
50
60
70
80
90
100
Total Male Female G8 G9 G10 G11 G12
Percent
Binge drinking in students who reported drinking in the last 12 months, by sex and grade, PEI, 2012‐13
Grade 7 data for binge drinking was suppressed due to small numbers.
Question:7 In the
last 12 months, have
you had 5 drinks of
alcohol or more on
one occasion?
Definition:9 “Binge
drinking” is defined
as consuming 5 or
more drinks of
alcohol on one
occasion.

Alcohol Use
8 Student Drug Use Report 2013
In 2012‐13, a significant relationship was observed between being a binge drinker and reporting lower
academic achievement than non‐binge drinkers. Binge drinkers were more likely to report lower grades (i.e.
“mostly B’s and C’s” and “mostly lower than C’s”) than non‐binge drinkers, who were more likely to report
their marks as “mostly A’s and B’s”.
Binge drinking and school marks, PEI, 2012‐13
Marks in school Binge drinkers (last 12 months)
Non‐binge drinkers
Mostly A’s and B’s 67.5% 81.8%
Mostly B’s and C’s 28.8% 16.4%
Mostly lower than C’s 3.7% 1.8%
Question:7 Which of the following best describes your marks during the past year? a) Mostly A’s and B’s > 70% b) Mostly B’s and C’s/ 50% ‐ 69% c) Mostly below C’s < 50%

Tobacco Use
Student Drug Use Report 2013 9
Tobacco Use
Smoking in 2012‐13 Smoking in the Past
Total Sample Overall, 8.0% of students from grade 6‐12 reported being smokers.
The overall smoking rate in this population is similar to 2006‐07 (8.3%), 2008‐09 (8.6%), and 2010‐11 (7.7%) surveys.
Sex Smoking rates in 2012‐13 were significantly higher in males (10.0%) than in females (5.9%).
In 2006, smoking rates were not significantly different between males and females. In 2008 and 2010, significantly more males than females were smokers.
Grade/Age
The proportion of students who smoke increases with increasing grade level, including a significant increase between grades 9 and 10. In 2012‐13, the average age at which grade 12 students smoked their first whole cigarette was 14.1.
The average age at which grade 12 students report smoking their first whole cigarette has decreased significantly since 2010‐11 (14.5) and 2008‐09 (14.6).
8.0
10.0
5.9
3.16.1
12.5
14.715.1
0
5
10
15
20
25
30
Total Male Female G8 G9 G10 G11 G12
Percent
Student smoking, by sex and grade, PEI, 2012‐13
Grade 6 and 7 data were suppressed due to small numbers.
Question:7 Are you a
smoker?
Definition:9 A current
smoker is defined as
someone who has
smoked 100 cigarettes
or more in their lifetime,
and has smoked a
minimum of one whole
cigarette in the past 30
days.

Tobacco Use
10 Student Drug Use Report 2013
In 2012‐13, overall, 24.8% of students reported trying smoking (as little as a puff). This number is similar to
2010 (25.0%), but is lower than in 2008 (29.8%). In 2012‐13, the average age at which grade 12 students first
tried cigarettes (even just a puff) was 14.3 years old, which is similar to previous years.
24.8 27.2
22.2
5.5
12.7
21.9
34.3
40.3
47.7
0
10
20
30
40
50
60
Total Male Female G7 G8 G9 G10 G11 G12
Percent
Students who have ever tried smoking, by sex and grade, PEI, 2012‐13
Grade 6 data were suppressed due to small numbers
Students who reported being smokers were more likely to report their close friends and family members also
being smokers. More than three quarters of students who smoke have a parent or guardian who smokes,
just under half of students who smoke have a sibling that smokes, and the vast majority (93%) of students
who smoke have at least one close friend who also smokes.
0
10
20
30
40
50
60
70
80
90
100
A parent or guardian smokes One or more close friends smoke Any sibling smokes
Percent
Smoking status of family and friends among smokers and non‐smokers, PEI, 2012‐13
Smokers Non‐smokers
Question: 7 Have you
ever tried cigarette
smoking, even just a
puff?
Definition:9 The term
“ever tried cigarettes”
describes someone who
has ever smoked a
cigarette, as little as a
puff.
Question:7 Do your
parents, step‐parents,
or guardians smoke
cigarettes? Do any of
your siblings smoke?
How many of your
closest friends (friends
that you like to spend
the most time with)
smoke?

Tobacco Use
Student Drug Use Report 2013 11
In 2012‐13, Island students reported that the most common source of getting cigarettes was “getting them
from a friend or someone else”, followed by “asking someone to buy them for me”. This is consistent with
previous years’ answers. In 2012‐13, only 25.9% of students from grade 6‐12 reported being asked for ID
when buying cigarettes in a store in the last 30 days, which was similar to 2010‐11 (28.6%). Of students who
reported that they usually get their cigarettes by buying them themselves, 34.3% reported being asked for ID
in the last 30 days.
29.4%
21.4%15.8%
14.6%
12.7%
6.1%
"Where do you usually get your cigarettes?", PEI, 2012‐13
A friend/someone else gives them to me
I ask someone to buy them for me
I buy them from a friend or someone else
I get them from my siblings or parents (given or taken)
I buy them myself
Other
In 2012‐13, 41% of Island students in grades 6‐12 reported that they thought it would be easy to get
cigarettes if they wanted to smoke. This number has remained stable over time. The perception of ease of
acquiring cigarettes increases with increasing grade level.
0
10
20
30
40
50
60
70
80
90
100
Grade 6 Grade 7 Grade 8 Grade 9 Grade 10 Grade 11 Grade 12
Percen
t
Perception of the ease of acquiring cigarettes, by grade, PEI, 2012‐13
Proportion of students who answered "easy"
Question:7 Where
do you usually get
your cigarettes?
Question:7 Do you
think it would be
difficult or easy to
get cigarettes if you
wanted to smoke?

Tobacco Use
12 Student Drug Use Report 2013
In 2012‐13, 38% of grade 7‐12 students who tried smoking cigarettes reported that the first time they tried
smoking was when they were drinking alcohol. This number increases with increasing grade level.
0
10
20
30
40
50
60
Grade 8 Grade 9 Grade 10 Grade 11 Grade 12
Percen
t
Students who were drinking at the time they first tried smoking, by grade, PEI, 2012‐13
Grade 7 data were suppressed due to small numbers
A relationship was observed between smoking and reported lack of school connectedness. In 2012‐13, non‐
smokers were significantly more likely to answer “true” or “mostly true” to all of the individual school
connectedness questions than smokers. In fact, a significantly higher proportion of non‐smokers (64%)
responded “true” or “mostly true” to all the school connectedness questions (“Overall”), compared to
smokers (34.6%).
◊
◊
◊
◊
◊
◊
◊
◊ ◊◊
◊
◊◊
◊
0
20
40
60
80
100
I feel close to people at my
school
I feel I am part of my school
I am happy to be at my school
I feel the teachers at my school treat
me fairly
I feel safe in my school
Getting good grades is important
to me
Overall
Percent
School connectedness responses (true/mostly true) of smokers vs. non‐smokers, PEI, 2012‐13
Smoker Non‐smoker
◊ Significant difference
Question:7 When
you first tried
smoking cigarettes,
were you drinking
alcohol at the same
time?
Question:7 How strongly
do you agree or disagree
with the following?
(a) I feel close to people
at my school
(b) I feel I am part of my
school
(c) I am happy to be at my
school
(d) I feel the teachers at
my school treat me fairly
(e) I feel safe in my school
(f) Getting good grades is
important to me

Tobacco Use
Student Drug Use Report 2013 13
A relationship was observed between being a smoker and demonstrating bullying behaviors towards others.
In 2012‐13, a significantly higher proportion of smokers (24.6%) reported engaging in any type of bullying in
the last 30 days, compared to non‐smokers (9.8%). All of the individual bullying responses were also
significantly different between smokers and non‐smokers.
◊
◊
◊◊
◊
◊
◊
◊
◊
◊
0
5
10
15
20
25
30
35
40
Physical Verbal Cyber Theft Any
Percent
Bullying behaviours of smokers vs. non‐smokers, PEI, 2012‐13
Smoker Non‐smoker
◊ Significant difference
In 2012‐13, the most used miscellaneous tobacco product reported by students was roll‐your‐own‐cigarettes (6.0%). Roll‐your‐own cigarette use has increased since 2010‐11, along with cigarillo, smokeless tobacco, and water pipe use. Cigar, pipe tobacco, blunt wrap, nicotine patch and bidi use have not changed much since 2010‐11.
0
2
4
6
8
10
Percent
Miscellaneous tobacco product use in the last 30 days, by year, PEI 2008‐2012
2008 2010 2012
** * *
*Option not available in 2008 survey
Question:7 In the
last 30 days, in what
ways did you bully
other students?
Question:7 In the last
30 days, did you use any
of the following
miscellaneous tobacco
products?
Definitions:10,11
Bidis: Tobacco wrapped
in temburni leaf, and
secured with a colorful
string.
Blunt wrap: tobacco
hand rolled in a flavored
paper.

Tobacco Use
14 Student Drug Use Report 2013
In 2012‐13, a significant association was observed between being a smoker and having low self esteem.
Students who reported being smokers were more likely to report lower self‐esteem (i.e. respond “false” or
“mostly false” to “I like the way I am”, “When I do something, I do it well”, and “I like the way I look”) than
non‐smokers, who were more likely to respond “true” or “mostly true” to the above questions. It is not
possible to discern whether smoking lowers self‐esteem, or if low self‐esteem encourages smoking, or if
some outside factor influences both.
Smoking and emotional well‐being, 2012‐13
Emotional well‐being* Smokers Non‐smokers
In general, I like the way I am.
66.5% 79.8%
When I do something, I do it well.
67.2% 78.3%
I like the way I look. 60.2% 70.4%
*Proportion answering “True” or “Mostly True”
In 2012‐13, an association was observed between being a smoker and demonstrating low academic
achievement. Students who reported being smokers were more likely to get lower grades (i.e. report that
their marks were “mostly B’s and C’s” and “mostly lower than C’s”) than non‐smokers, who were more likely
to report that their marks were “mostly A’s and B’s”.
Smoking and academic achievement, 2012‐13
School marks Smokers Non‐smokers
Mostly A’s and B’s 44.0% 85.8%
Mostly B’s and C’s 45.4% 13.5%
Mostly lower than C’s 10.7% 0.7%
In 2012‐13, a total of 64.2% of students from grade 6‐12 who smoke have tried to quit at least once. This is
similar to 65.6% of students in 2010‐11. In 2012‐13, females were significantly more likely (66.7%) to try
quitting than males (62.7%).
Question:7 Which of the following best describes your marks during the past year? (a) Mostly A’s and B’s/ ≥ 70% (b) Mostly B’s and C’s/ 50%‐69% (c) Mostly lower than C’s < 50%
Question:7 Choose the answer that describes how you feel about the statements (True, Mostly True, Neutral, False, Mostly False): (a) “In general, I like the way I am” (b) “When I do something, I do it well” (c) “I like the way I look”

Cannabis Use
Student Drug Use Report 2013 15
Cannabis Use
Cannabis Use in 2012‐13 Cannabis Use in the Past
Total Sample Overall, 20.7% of grade 7‐12 students reported having used cannabis in the last 12 months.
The overall cannabis use rate in this population is similar to 2010‐11 (18.8%), 2008‐09 (17.9%), and 2006‐07 (20.1%) surveys.
Sex Cannabis use rates in 2012‐13 are significantly higher in males (23.1%) than in females (18.2%).
Higher rates of cannabis use in males compared to females have been observed throughout all survey years.
Grade/Age
The proportion of cannabis users increases with increasing grade level. In 2012‐13, the average age at which grade 12 students first used/tried cannabis was 15.0 years old.
The average age at which grade 12 students first used/tried cannabis is somewhat older than in 2010‐11 (14.7), but is similar to 2008‐09 (15.1) and 2006‐07 (15.0).
20.7
23.1
18.2
5.9
13.2
25.129.9
44.5
0
10
20
30
40
50
60
Total Male Female G8 G9 G10 G11 G12
Percent
Cannabis use in the last 12 months, by sex and grade, PEI, 2012‐13
* Grade 7 data were suppressed due to small numbers.
Question:7 In the last 12
months, did you use
marijuana or cannabis?
Definition:10,11 Cannabis
(marijuana, weed, pot,
hash, a joint…) is a drug
that is made up of the
plant Cannabis sativa,
which contains the
psychoactive “THC”.
Cannabis often induces a
state of euphoria,
relaxation, drowsiness,
and social isolation.

Cannabis Use
16 Student Drug Use Report 2013
Of those using cannabis in the last 12 months, 42.3% are frequent users (more than once per week). Over
half of these frequent users (54.4%) use cannabis every day.
0
10
20
30
40
50
60
Once/week 2‐3 times/week 4‐6 times/week Every day
Percent
Frequency of cannabis use among students reporting frequent use (once per week or more) in last 12 months, PEI, 2012‐13
In 2012‐13, a relationship was observed between cannabis use and lack of school connectedness. Non‐cannabis users were significantly more likely to answer “true” and “mostly true” to all the individual school connectedness questions than cannabis users. Additionally, a significantly greater proportion of non‐cannabis users (64.2%) answered “true” and “mostly true” to all the school connectedness questions (“Overall”), compared to of cannabis users (40.9%).
◊
◊
◊
◊
◊ ◊
◊
◊ ◊ ◊
◊◊
◊
◊
0
20
40
60
80
100
I feel close to people at my school
I feel I am part of my school
I am happy to be at my school
I feel the teachers at my school treat
me fairly
I feel safe in my school
Getting good grades is important to me
Overall
Percent
School connectedness responses (true/mostly true) of cannabis users vs. non‐cannabis users, PEI, 2012‐13
Cannabis user Non‐Cannabis user
◊ Significant difference
Question:7 In the last
12 months, how often
did you use marijuana
or cannabis?
Question:7 How strongly
do you agree or disagree
with the following?
(a) I feel close to people
at my school
(b) I feel I am part of my
school
(c) I am happy to be at my
school
(d) I feel the teachers at
my school treat me fairly
(e) I feel safe in my school
(f) Getting good grades is
important to me

Cannabis Use
Student Drug Use Report 2013 17
A relationship was observed between being a cannabis user and demonstrating bullying behaviors towards
others. In 2012‐13, a significantly higher proportion of cannabis users (21.6%) reported engaging in any type
of bullying in the last 30 days, compared to non‐cannabis users (9.3%). The individual bullying responses
were also all significantly different between cannabis users and non‐cannabis users.
◊
◊
◊ ◊
◊
◊
◊
◊
◊
◊
0
10
20
30
40
Physical Verbal Cyber Theft Any
Percent
Bullying behaviours of cannabis users vs. non‐cannabis users, PEI, 2012‐13
Cannabis user Non‐Cannabis user
◊ Significant difference
In 2012‐13, a significant association was observed between being a cannabis user and having low self esteem.
Students who reported using cannabis in the last 12 months were more likely to have lower self‐esteem (i.e.
respond “false” or “mostly false” to “I like the way I am”, “When I do something, I do it well”, and “I like the
way I look”) than non‐cannabis users. It is not possible to discern whether cannabis use lowers self‐esteem,
or if low self‐esteem encourages cannabis use, or whether an outside factor contributes to both.
Cannabis use and emotional well‐being, 2012‐13
Emotional well‐being* Cannabis Users Non‐Cannabis
users
In general, I like the way I am.
68.9% 79.6%
When I do something, I do it well.
69.2% 78.7%
I like the way I look. 60.7% 69.2%
* Proportion answering “True” or “Mostly True”
Question:7 In the last
30 days, in what ways
did you bully other
students?
Question:7 Choose the answer that describes how you feel about the statements (True, Mostly True, Neutral, False, Mostly False): (a) “In general, I like the way I am” (b) “When I do something, I do it well” (c) “I like the way I look”

Cannabis Use
18 Student Drug Use Report 2013
In 2012‐13, a significant relationship was observed between being a cannabis user and demonstrating lower
academic achievement. Students who reported using cannabis in the last 12 months were significantly more
likely to get lower grades (i.e report that their marks were “mostly B’s and C’s” and “mostly lower than C’s”)
than non‐cannabis users, who were significantly more likely to report their grades as “mostly A’s and B’s”.
Cannabis use and academic achievement, 2012‐13
School marks Cannabis Users Non‐Cannabis
users
Mostly A’s and B’s 59.6% 87.1%
Mostly B’s and C’s 35.1% 12.2%
Mostly lower than C’s 5.3% 0.7%
Question:7 Which of the following best describes your marks during the past year? (a) Mostly A’s and B’s/ ≥ 70% (b) Mostly B’s and C’s/ 50%‐69% (c)Mostly lower than C’s < 50%

Trends in Drug Use
Student Drug Use Report 2013 19
Drug Use (excluding cannabis)
Overall, in 2012‐13, 10.1% of students reported using any drug other than alcohol, tobacco, or cannabis (see
list below) in the last 12 months.
The following section outlines Island student drug use (excluding cannabis), categorized as follows:
(a) Prescription and over‐the‐counter (OTC) drug use (Non‐medicinal)
(1) Pain Relievers
(2) Stimulants
(3) Dextromethorphan (Cough/cold medicine)
(4) Sleeping Medicine
(5) Sedatives and Tranquilizers
(b) Illicit Drug Use
(1) Hallucinogens
(2) MDMA
(3) Amphetamines
(4) Cocaine
(5) Salvia
(6) Bath Salts
(7) BZP/TFMPP
(8) Heroin
(c) Miscellaneous Drug Use
(1) Spice
(2) Solvents
(d) Trends in Drug Use

Drug Use (excluding cannabis)
20 Student Drug Use Report 2013
Drug Use (excluding cannabis) and Average Age of First Use, 2012‐13
Rank
Percent of use in last 12 months
[2010‐11] Drug Type
Average age of first use*
1 3.8% [4.6%]
Pain relievers Prescription/OTC 15.2
1 3.8% [3.8%]
Hallucinogens Illicit 15.4
2 3.4% [4.3%]
MDMA Illicit 15.2
2 3.4% [3.0%]
Stimulants Prescription/OTC 15.2
3 3.1% [2.7%]
Amphetamines Illicit 15.0
4 2.9% [2.6%]
Cocaine Illicit 15.5
4 2.9% [3.3%]
Dextromethorphan (Cough/cold medicine)
Prescription/OTC 13.9
5 2.0% [2.2%]
Sleeping Medicine Prescription/OTC 13.3
6 1.6% [2.0%]
Sedatives/tranquilizers Prescription/OTC 14.5
6 1.6% [ ‐ ]
Spice Miscellaneous 13.8
7 1.3%↓
[2.9%] Salvia Illicit 14.7
8 1.1%↓ [2.9%]
Solvents Miscellaneous 13.6
8 1.1% [ ‐ ]
Bath Salts Illicit 15.9
9 1.0% [ ‐ ]
BZP/TFMPP Illicit 14.9
10 0.9% [1.4%]
Heroin Illicit 13.0
* Grade 12 students’ response.
‐ Not asked in the 2010‐11 survey
↓ Significant decrease in use 2012‐13 compared with 2010‐11

Trends in Drug Use
Student Drug Use Report 2013 21
Prescription and OvertheCounter Drug Use (Nonmedicinal)
Pain Relievers
In 2012‐13, 6.8% of students from grade 7‐12 reported ever using pain relievers to get high. Males (6.5%)
and females (7.1%) used pain relievers to get high at a similar rate. In 2012‐13, the average age at which
grade 12 students first used/tried pain relievers to get high was 15.2 years old. This is similar to 2010‐11
(15.3) and 2008‐09 (15.6).
6.8 6.5 7.1
3.0 3.84.0
6.9
9.7
12.3
0
5
10
15
20
25
Total Male Female G7 G8 G9 G10 G11 G12
Percent
Pain reliever use, ever, by sex and grade, PEI, 2012‐13
In 2012‐13, 3.8% of students from grade 7‐12 reported using pain relievers to get high in the last 12 months.
This is similar to 2010‐11 (4.6%), and somewhat lower than 2008‐09, when it was 4.8%.
3.8
3.1
4.6
2.5 3.3
6.68.1
0
5
10
15
20
25
Total Male Female G9 G10 G11 G12
Percent
Pain reliever use in the last 12 months, by sex and grade, PEI, 2012‐13
* Grade 7 and 8 data were suppressed due to small numbers.
Definition:10,11 Pain relievers
such as Demerol, Percocet,
Percodan, Oxycontin, or any
other pain killer containing
codeine are prescription
drugs used to provide relief
from pain (analgesic). Other
effects of these pain‐killers
may include mood changes
and drowsiness.
Question:7 Have you ever
used pain relievers to get
high?
Question:7 Have you used
pain relievers to get high in
the last 12 months?

Drug Use (excluding cannabis)
22 Student Drug Use Report 2013
* Grade 7 and 8 data were suppressed due to small numbers.
Stimulants
In 2012‐13, 5.3% of students from grade 7‐12 reported ever using stimulants to get high. Females (5.3%) and
males (5.2%) reported using stimulants at a similar rate. In 2012‐13, the average age at which grade 12
students’ first used/tried stimulants to get high was 15.2 years old. This is similar to 2010‐11 (14.6) and 2008‐
09 (15.5).
5.3 5.25.3
3.2
5.6
9.29.1
0
5
10
15
20
25
Total Male Female G9 G10 G11 G12
Percent
Stimulant use, ever, by sex and grade, PEI, 2012‐13
* Grade 7 and 8 data were suppressed due to small numbers.
In 2012‐13, 3.4% of students from grade 7‐12 reported using stimulants to get high in the last year. This is
similar to 2010‐11 (3.0%) and 2008‐09 (4.3%).
3.4 3.13.7
2.2 2.5
7.1
6.1
0
5
10
15
20
25
Total Male Female G9 G10 G11 G12
Percent
Stimulant use in the last 12 months, by sex and grade, PEI, 2012‐13
* Grade 7 and 8 data were suppressed due to small numbers.
Question:7 Have you used
stimulants to get high in the
last 12 months?
Definition:10,11 Stimulants, in this
case, are separated into two
categories: stay awake pills/ diet
pills (uppers, bennies…) and
medication used to treat ADHD,
such as Ritalin, Concerta,
Adderall, Dexedrine (prescription
or over‐the‐counter). Both are
stimulants of the central nervous
system, and induce
concentration and alertness.
Question:7 Have you ever
used/tried stimulants to get
high?

Trends in Drug Use
Student Drug Use Report 2013 23
Dextromethorphan (cough/cold medicine)
In 2012‐13, 2.9% of students from grade 7‐12 reported using dextromethorphan in the last 12 months to get
high. This is similar to 2010‐11 (3.3%). Females demonstrated a significantly higher rate of dextromethorphan
use (3.4%) compared to males (2.5%). In 2012‐13, the average age at which grade 12 students first
used/tried dextromethorphan to get high was 13.9 years old. This is similar to 2010‐11, when it was 13.4
years old.
2.9
2.5
3.4
1.7
3.0
5.0
4.5
0
5
10
15
20
Total Male Female G9 G10 G11 G12
Percent
Dextromethorphan use in the last 12 months, by sex and grade, PEI, 2012‐13
*Grade 7 and 8 data were suppressed due to small numbers.
Question: 7 Have you used
Dextromethorphan (cold or
cough medicine) to get
high in the last 12 months?
Definition: 10,11
Dextromethorphan
products (cold or cough
medicine) such as
Robitussin DM, Benylin DM
(robos, dex, DXM…) are
over‐the‐counter (and
sometimes prescription)
drugs used to provide relief
from cold and cough
symptoms. Abuse of these
drugs may induce a state of
euphoria, hallucinations,
and changes in perception.

Drug Use (excluding cannabis)
24 Student Drug Use Report 2013
Sleeping Medication
In 2012‐13, 2.0% of students from grade 7‐12 reported using sleeping medication in the last 12 months to get
high. This is similar to 2010‐11 (2.2%). Females (2.4%) are somewhat more likely to use sleeping medication
to get high than males (1.6%). In 2012‐13, the average age at which grade 12 students first used/tried
sleeping medication to get high was 13.3 years old. This is similar to 2010‐11 (14.0)
2.0
1.6
2.4
1.5
2.33.5
2.4
0
2
4
6
8
10
Total Male Female G9 G10 G11 G12
Percent
Sleeping medication use in the last 12 months, by sex and grade, PEI, 2012‐13
*Grade 7 and 8 data were suppressed due to small numbers.
Question:7 Have you
used sleeping
medication to get high in
the last 12 months?
Definition:10,11 Sleeping
medication from a
drugstore, such as Nytol,
Unisom, etc. are over‐
the‐counter (and
sometimes prescription)
drugs that are used to
treat sleep disorders.
Using these medications
to get high induces a
calm, drowsy, relaxed
state of euphoria.

Trends in Drug Use
Student Drug Use Report 2013 25
Sedatives/Tranquilizers
In 2012‐13, 1.6% of students from grade 7‐12 reported using sedatives/tranquilizers to get high in the last 12
months. This is has not changed since 2008‐09 and 2010‐11, when it was 1.9% and 2.0%, respectively. There
is no difference between males (1.7%) and females (1.5%) who reported using sedatives/tranquilizers to get
high in the last 12 months. In 2012‐13, the average age at which grade 12 students first tried
sedatives/tranquilizers to get high was 14.5 years old. This is similar to 2010‐11 (14.0), and has somewhat
decreased since 2008‐09 (14.8).
1.61.7 1.5
2.9
3.4
0
2
4
6
8
10
Total Male Female G11 G12
Percent
Sedative use in the last 12 months, by sex and grade, PEI, 2012‐13
* Grade 7, 8, 9, and 10 data were suppressed due to small numbers.
Question:7 Have you used
sedatives or tranquilizers to get
high in the last 12 months?
Definition:10,11 Sedatives or
tranquilizers, such as Ativan,
Xanax, Valium (tranqs,
downers…) are prescription
drugs that are used as relaxants,
anti‐convulsants, and hypnotics,
among other things. Effects of
these drugs include reduction of
irritability and agitation, and
induction of calmness and sleep.

Drug Use (excluding cannabis)
26 Student Drug Use Report 2013
Illicit Drug Use Hallucinogens In 2012‐13, 6.4% of students from grade 7‐12 reported ever using hallucinogens. Significantly more males
(7.9%) reported using hallucinogens than females (4.9%). In 2012‐13, the average age at which grade 12
students first used/tried hallucinogens was 15.4 years old. This is similar to previous survey years; 2010‐11
was 15.2 years old, and in both 2006‐07 and 2008‐09, the average age was 15.6.
6.4 7.9
4.9
2.1
3.9
8.58.8
12.8
0
5
10
15
20
25
Total Male Female G8 G9 G10 G11 G12
Percent
Hallucinogen use, ever, by sex and grade, PEI, 2012‐13
* Grade 7 data were suppressed due to small numbers.
In 2012‐13, 3.8% of students from grade 7‐12 reported using hallucinogens in the last year. This is similar to
2010‐11 (3.8%) and 2008‐09 (4.3%).
3.8 4.8 2.8 2.8
5.3
4.8
7.6
0
5
10
15
20
25
Total Male Female G9 G10 G11 G12
Percent
Hallucinogen use in the last 12 months, by sex and grade, PEI, 2012‐13
*Grade 7 and 8 data were suppressed due to small numbers.
Question:7 Have you ever used
or tried hallucinogens?
Definition:10,11 Hallucinogens
(LSD, PCP, acid, magic
mushrooms, mesc…) are a
group of psychoactive drugs
that induce changes in
perception, thought, and
emotion. Other effects include
euphoria, illusions, and
heightened awareness of self.
Question:7 Have you used or
tried hallucinogens in the last
12 months?

Trends in Drug Use
Student Drug Use Report 2013 27
MDMA In 2012‐13, 5.6% of students from grade 7‐12 reported ever using MDMA. This is similar to 2010‐11 (6.5%)
and 2008‐09 (4.8%) findings. Significantly more males (6.9%) reported using MDMA than females (4.2%). In
2012‐13, the average age at which grade 12 students first tried MDMA was 15.2 years old. This is somewhat
younger than 2008‐09 (15.7), and similar to 2010‐11 (15.3).
5.6 6.9 4.2
2.8
5.3
9.9
12.2
0
5
10
15
20
25
Total Male Female G9 G10 G11 G12
Percent
MDMA use, ever, by sex and grade, PEI, 2012‐13
*Grade 7 and 8 data were suppressed due to small numbers.
In 2012‐13, 3.4% of students from grade 7‐12 reported using MDMA in the last year. This number is similar to
2010‐11 (4.3%) and 2008‐09 (3.5%) findings.
3.4 4.02.7
1.9
3.3
6.3 7.0
0
5
10
15
20
25
Total Male Female G9 G10 G11 G12
Percent
MDMA use in the last 12 months, by sex and grade, PEI, 2012‐13
*Grade 7 and 8 data were suppressed due to small numbers.
Question:7 Have you ever
used or tried MDMA?
Definition:10,11 MDMA
(ecstasy, E, X, XTC, mandy,
molly…) is a psychoactive
drug with hallucinogenic and
stimulant properties. This
“rave drug” typically induces
a state of euphoria, intimacy,
and a decreased sense of
anxiety.
Question:7 Have you used or
tried MDMA in the last 12
months?

Drug Use (excluding cannabis)
28 Student Drug Use Report 2013
Amphetamines
In 2012‐13, 4.9% of students from grade 7‐12 reported ever using amphetamines. Use in males (5.7%) was
not significantly different than use in females (4.1%). In 2012‐13, the average age at which grade 12 students
first used/tried amphetamines was 15.0 years old. This is similar to 2010‐11 (15.1), but has significantly
decreased since 2008‐09 (15.4), and 2006‐07 (15.5).
4.9 5.7 4.1
2.2
5.1
7.7
10.3
0
5
10
15
20
25
Total Male Female G9 G10 G11 G12
Percent
Amphetamine use, ever, by sex and grade, PEI, 2012‐13
* Grade 7 and 8 data were suppressed due to small numbers.
In 2012‐13, 3.1% of students from grade 7‐12 reported using amphetamines in the last year. This is similar to
2010‐11 (2.7%), but is significantly higher than in 2008‐09 (1.4%).
3.1 3.1 3.1 3.2
5.0
7.1
0
5
10
15
20
25
Total Male Female G10 G11 G12
Percent
Amphetamine use in the last 12 months, by sex and grade, PEI, 2012‐13
* Grades 7 8, and 9 data were suppressed due to small numbers.
Question:7 Have you ever
used or tried
amphetamines?
Definition:10,11
Amphetamines (speed,
crystal meth, ice, meth…)
comprise a group of
stimulant drugs. These drugs
typically induce heightened
focus and alertness, and
decrease appetite and
feelings of fatigue.
Question:7 Have you used
or tried amphetamines in
the last 12 months?

Trends in Drug Use
Student Drug Use Report 2013 29
Cocaine
In 2012‐13, overall, 4.4% of students from grade 7‐12 reported ever using cocaine. Males (5.6%) were
significantly more likely to report cocaine use than females (3.0%). In 2012‐13, the average age at which
grade 12 students first used/tried cocaine was 15.5 years old. This is similar to 2010‐11 (14.8), 2008‐09
(15.0), and 2006‐07 (15.7).
4.45.6
3.0 2.8
4.1
6.1
10.7
0
5
10
15
20
25
Total Male Female G9 G10 G11 G12
Percent
Cocaine use, ever, by sex and grade, PEI, 2012‐13
*Grade 7 and 8 data were suppressed due to small numbers
In 2012‐13, overall, 2.9% of students from grade 7‐12 reported using cocaine in the last year. This is similar
to 2010‐11 (2.6%) and 2008‐09 (2.0%).
2.9 3.7 2.1 2.0 2.6 4.3
7.0
0
5
10
15
20
25
Total Male Female G9 G10 G11 G12
Percent
Cocaine use in the last 12 months, by sex and grade, PEI, 2012‐13
*Grade 7 and 8 data were suppressed due to small numbers.
Question:7 Have you ever
used or tried cocaine?
Definition:10,11 Cocaine
(crack, blow, snow…) is a
drug derived from the leaves
of a coca plant. This local
anesthetic/stimulant drug
induces a sense of euphoria
and wakefulness. Cocaine is
most commonly consumed
via nasal insufflations, but
can also be taken orally or
smoked.
Question:7 Have you used
or tried cocaine in the last
12 months?

Drug Use (excluding cannabis)
30 Student Drug Use Report 2013
Salvia
In 2012‐13, 1.3% of students from grade 7‐12 reported using salvia in the last 12 months to get high. This has
significantly decreased from 2008‐09 (2.3%) and 2010‐11 (2.9%). Males (1.6%) were equally as likely to
report using salvia in the last 12 months as females (1.1%). In 2012‐13, the average age at which grade 12
students first used/tried salvia to get high was 14.7 years old. This is similar to 2010‐11 (14.9 years old), and
significantly younger than 2008‐09 (15.6 years old).
1.3 1.6 1.1
2.12.6
0
2
4
6
8
10
Total Male Female G11 G12
Percent
Salvia use in the last 12 months, by sex and grade, PEI, 2012‐13
* Grade 7, 8, 9, and 10 data were suppressed due to small numbers.
Question:7 Have you used
salvia to get high in the last 12
months?
Definition:10,11 Salvia (Divine
Sage, Magic Mint, Sally D…) is
a drug that is made up of the
plant Salvia divinorum, which
contains psychoactive
properties. This drug typically
induces heightened self
awareness, visual distortions,
and hallucinations.

Trends in Drug Use
Student Drug Use Report 2013 31
Bath Salts
In 2012‐13, overall, 2.0% of students from grade 7‐12 reported ever using bath salts to get high. Males
(3.4%) were significantly more likely to report bath salt use than females (<1%). In 2012‐13, the average age
at which grade 12 students first used/tried bath salts to get high was 15.9 years old.
2.0
3.4
2.01.7
4.5
0
2
4
6
8
10
Total Male Female* G9 G10 G11* G12
Percent
Bath salt use, ever, by sex and grade, PEI, 2012‐13
* Grade 7, 8, and 11, and female data were suppressed due to small numbers.
In 2012‐13, 1.1% of students from grade 7‐12 reported using bath salts in the last 12 months to get high.
Question:7 Have you ever
used or tried bath salts to
get high?
Definition:10,11 Bath salts
(mephedrone, MDPV,
meow, meph, MCAT…) are
cathinone based stimulants
that increase dopamine
release, causing the user to
experience euphoria,
increased sex‐drive, anxiety,
or paranoia.

Drug Use (excluding cannabis)
32 Student Drug Use Report 2013
BZP/TFMPP
In 2012‐13, overall, 1.5% of students from grade 7‐12 reported ever using BZP/TFMPP to get high. Males
(2.4%) were significantly more likely to report BZP/TFMPP use than females (<1%). In 2012‐13, the average
age at which grade 12 students first used/tried BZP/TFMPP to get high was 14.9 years old.
1.52.4 1.6
3.3
0
2
4
6
8
10
Total Male Female* G11 G12
Percent
BZP/TFMPP use, ever, by sex and grade, PEI, 2012‐13
* Grade 7, 8, 9, 10, and female data were suppressed due to small numbers.
In 2012‐13, 1% of students from grade 7‐12 reported using BZP/TFMPP in the last 12 months to get high.
Question:7 Have you ever
used or tried BZP/TFMPP to
get high?
Definition:10,11 BZP/TFMPP
Benzylpiperazine/trifluoro‐
methyl‐phenylpiperazine
(Legal E, Legal X, A2,
piperazine, frenzy,
nemesis…) are
hallucinogenic stimulants
that promote dopamine and
serotonin release.
BZP/TFMPP induce a sense
of euphoria and increased
energy/alertness.

Trends in Drug Use
Student Drug Use Report 2013 33
Heroin
In 2012‐13, overall, 1.8% of students from grade 7‐12 reported ever using heroin. Significantly more males
(3.0 %) reported using heroin than females (<1%). In 2012‐13, the average age at which grade 12 students
first used/tried heroin was 13.0 years old. This is similar to previous years.
1.8
3.0
1.61.5
2.0
3.1
0
2
4
6
8
10
Total Male Female* G9 G10 G11 G12
Percen
t
Heroin use, ever, by sex and grade, PEI, 2012‐13
* Grade 7, 8 and female data were suppressed due to small numbers.
In 2012‐13, 0.9% of students from grades 7‐12 reported using heroin in the last year. This is similar to 2010‐
11 (1.4%), and 2008‐09 (1.1%).
Question:7 Have you ever
used or tried heroin?
Definition:10,11 Heroin
(smack, junk, crank…) is a
type of opioid drug that
induces mood changes,
drowsiness and relief of
pain. This drug is most
commonly administered as
an injectable, however it can
also be taken orally or
smoked.

Drug Use (excluding cannabis)
34 Student Drug Use Report 2013
Miscellaneous Drug Use
Spice
In 2012‐13, overall, 2.6% of students from grade 7‐12 reported ever using spice. Significantly more males
(3.3%) reported using spice than females (1.8%). In 2012‐13, the average age at which grade 12 students first
used/tried spice was 13.8 years old.
2.6
3.3
1.8
2.2
2.7 3.8
4.7
0
2
4
6
8
10
Total Male Female G9 G10 G11 G12
Percent
Spice use, ever, by sex and grade, PEI, 2012‐13
* Grade 7 and 8 data were suppressed due to small numbers.
In 2012‐13, overall, 1.6% of students from grade 7‐12 reported using spice in the last 12 months to get high.
1.6
2.0 1.2
1.9 1.4
2.6
2.4
0
2
4
6
8
10
Total Male Female G9 G10 G11 G12
Percent
Spice use in the last 12 months, by sex and grade, PEI, 2012‐13
Question:7 Have you used
spice in the last 12
months?
Question:7 Have you ever
used spice?
Definition:10,11 Spice (K2,
K3, scence, herbal
mixtures, herbal incense) is
a legal alternative to
marijuana composed of
synthetic cannabinoid
compounds. The effects of
spice are similar to those
of THC; inducing an
elevated mood, relaxation,
anxiety, or paranoia.

Trends in Drug Use
Student Drug Use Report 2013 35
* Grade 7 and 8 data were suppressed due to small numbers.
Solvents
In 2012‐13, overall, 2.8% of students from grade 7‐12 reported ever using solvents to get high. Significantly
more males (3.9%) reported using solvents to get high than females (1.7%). In 2012‐13, the average age at
which grade 12 students first used/tried solvents to get high was 13.6 years old. This is similar to 2010‐11
(13.1 years old) and 2008‐09 (14.2 years old).
2.8
3.9
1.7 1.7
2.92.8
4.7
0
2
4
6
8
10
Total Male Female G9 G10 G11 G12
Percent
Solvent use, ever, by sex and grade, PEI, 2012‐13
* Grade 7 and 8 data were suppressed due to small numbers.
In 2012‐13, overall, 1.1% of students from grade 7‐12 reported using solvents in the last 12 months to get
high. This has decreased significantly since 2008‐09 (2.3%) and 2010‐11 (2.9%)..
Definition:10,11 Solvents
such as glue, gasoline,
cleaning products, etc. are
chemical substances that
are typically sniffed or
inhaled to achieve a high.
Effects of solvent use
include euphoria, dizziness,
visual distortions, and
hallucinations.
Question:7 Have you ever
used solvents to get high?
Trends in Drug Use
36 Student Drug Use Report 2013
Trends in Drug Use
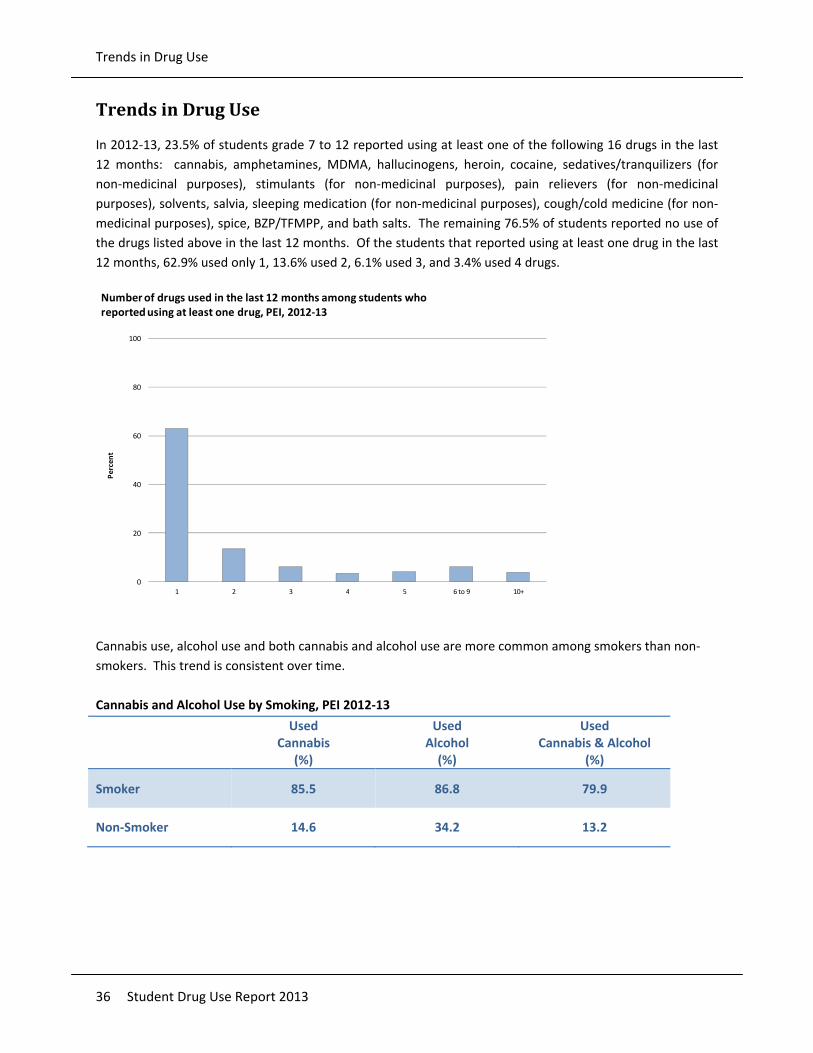
In 2012‐13, 23.5% of students grade 7 to 12 reported using at least one of the following 16 drugs in the last
12 months: cannabis, amphetamines, MDMA, hallucinogens, heroin, cocaine, sedatives/tranquilizers (for
non‐medicinal purposes), stimulants (for non‐medicinal purposes), pain relievers (for non‐medicinal
purposes), solvents, salvia, sleeping medication (for non‐medicinal purposes), cough/cold medicine (for non‐
medicinal purposes), spice, BZP/TFMPP, and bath salts. The remaining 76.5% of students reported no use of
the drugs listed above in the last 12 months. Of the students that reported using at least one drug in the last
12 months, 62.9% used only 1, 13.6% used 2, 6.1% used 3, and 3.4% used 4 drugs.
0
20
40
60
80
100
1 2 3 4 5 6 to 9 10+
Percent
Number of drugs used in the last 12 months among students who reported using at least one drug, PEI, 2012‐13
Cannabis use, alcohol use and both cannabis and alcohol use are more common among smokers than non‐
smokers. This trend is consistent over time.
Cannabis and Alcohol Use by Smoking, PEI 2012‐13
Used
Cannabis (%)
UsedAlcohol (%)
Used Cannabis & Alcohol
(%)
Smoker 85.5 86.8 79.9
Non‐Smoker 14.6 34.2 13.2
Trends in Drug Use
Student Drug Use Report 2013 37
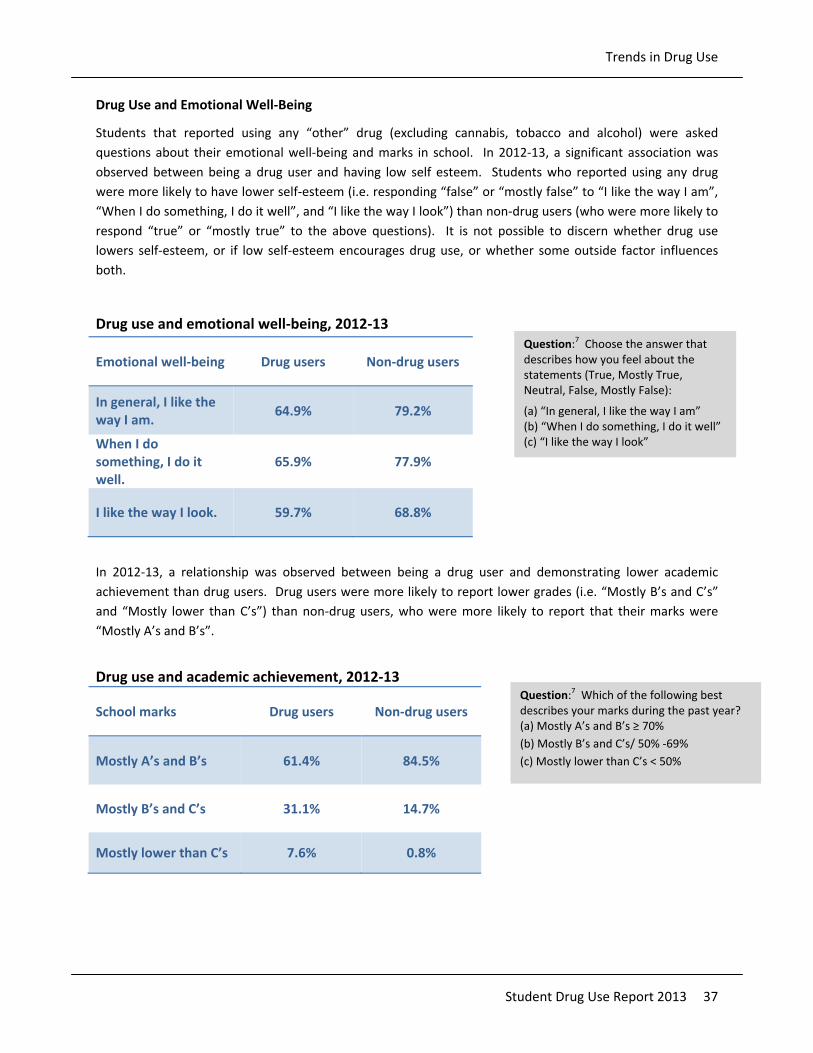
Drug Use and Emotional Well‐Being
Students that reported using any “other” drug (excluding cannabis, tobacco and alcohol) were asked
questions about their emotional well‐being and marks in school. In 2012‐13, a significant association was
observed between being a drug user and having low self esteem. Students who reported using any drug
were more likely to have lower self‐esteem (i.e. responding “false” or “mostly false” to “I like the way I am”,
“When I do something, I do it well”, and “I like the way I look”) than non‐drug users (who were more likely to
respond “true” or “mostly true” to the above questions). It is not possible to discern whether drug use
lowers self‐esteem, or if low self‐esteem encourages drug use, or whether some outside factor influences
both.
Drug use and emotional well‐being, 2012‐13
Emotional well‐being Drug users Non‐drug users
In general, I like the way I am.
64.9% 79.2%
When I do something, I do it well.
65.9% 77.9%
I like the way I look. 59.7% 68.8%
In 2012‐13, a relationship was observed between being a drug user and demonstrating lower academic
achievement than drug users. Drug users were more likely to report lower grades (i.e. “Mostly B’s and C’s”
and “Mostly lower than C’s”) than non‐drug users, who were more likely to report that their marks were
“Mostly A’s and B’s”.
Drug use and academic achievement, 2012‐13
School marks Drug users Non‐drug users
Mostly A’s and B’s 61.4% 84.5%
Mostly B’s and C’s 31.1% 14.7%
Mostly lower than C’s 7.6% 0.8%
Question:7 Choose the answer that describes how you feel about the statements (True, Mostly True, Neutral, False, Mostly False):
(a) “In general, I like the way I am” (b) “When I do something, I do it well” (c) “I like the way I look”
Question:7 Which of the following best describes your marks during the past year? (a) Mostly A’s and B’s ≥ 70%
(b) Mostly B’s and C’s/ 50% ‐69%
(c) Mostly lower than C’s < 50%

Trends in Drug Use
38 Student Drug Use Report 2013
A relationship was observed between drug use and lack of school connectedness. In 2012‐13, non‐drug users
were more likely to answer “true” and “mostly true” to all of the individual school connectedness questions
than drug users. Additionally, a significantly higher proportion of non‐drug users (62.2%) responded “true”
and “mostly true” to all the school connectedness questions (“Overall”), compared to drug‐users (39.1%).
◊◊
◊
◊
◊
◊
◊
◊ ◊ ◊
◊
◊◊
◊
0
20
40
60
80
100
I feel close to people at my school
I feel I am part of my school
I am happy to be at my school
I feel the teachers at my school treat me
fairly
I feel safe in my school
Getting good grades is important to me
Overall
Percent
School connectedness responses (true/mostly true) of drug users vs. non‐drug users, PEI, 2012‐13
Drug user Non‐drug user
◊ Significant difference
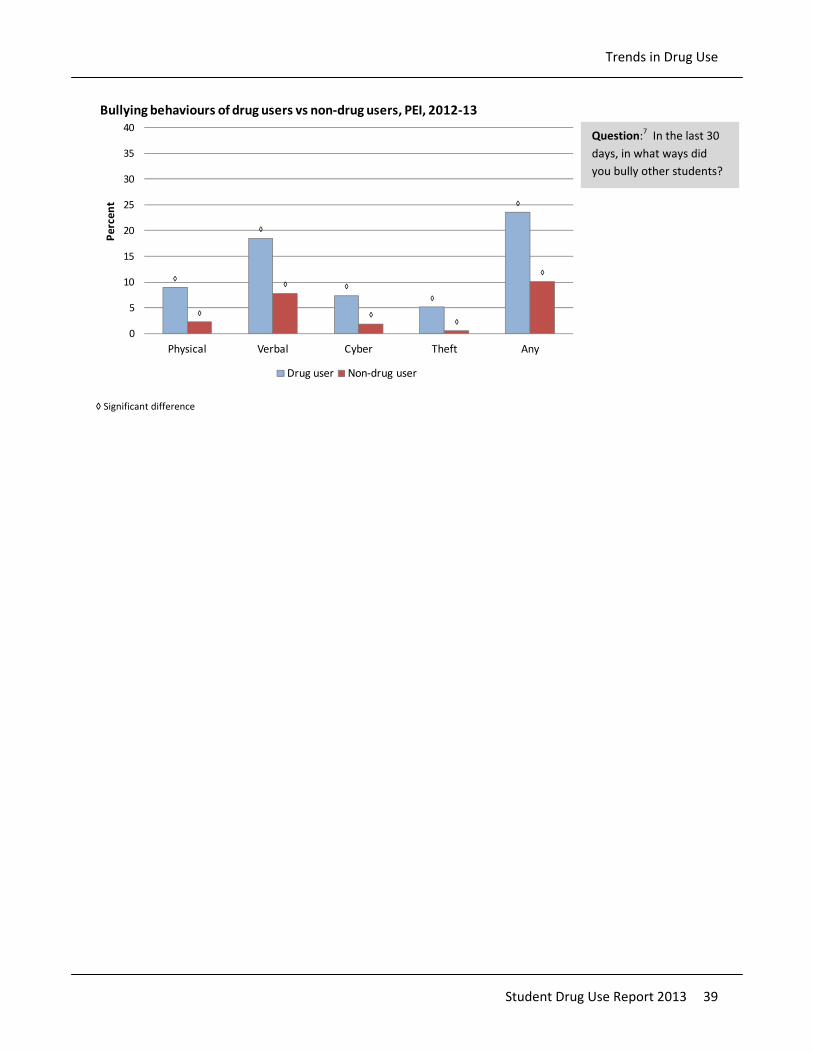
A relationship was observed between being a drug user and demonstrating bullying behaviors towards others. In 2012‐13, a significantly higher proportion of drug users (23.5%) reported engaging in any type of bullying in the last 30 days, compared to non‐drug users (10.1%). All of the individual bullying responses were also significantly different between drug users and non‐drug users.
Question:7 How strongly
do you agree or disagree
with the following?
(a) I feel close to people
at my school
(b) I feel I am part of my
school
(c) I am happy to be at my
school
(d) I feel the teachers at
my school treat me fairly
(e) I feel safe in my school
(f) Getting good grades is
important to me
Trends in Drug Use
Student Drug Use Report 2013 39
◊
◊
◊
◊
◊
◊
◊
◊◊
◊
0
5
10
15
20
25
30
35
40
Physical Verbal Cyber Theft Any
Percent
Bullying behaviours of drug users vs non‐drug users, PEI, 2012‐13
Drug user Non‐drug user
◊ Significant difference
Question:7 In the last 30
days, in what ways did
you bully other students?

Healthy Living
40 Student Drug Use Report 2013
Healthy Living: Physical, Emotional, Mental
Emotional WellBeing and SelfEsteem
Students were evaluated on their emotional well‐being. In 2012‐13, overall, 78.8% of students responded
“true” or “mostly true” to “I like the way I am”, 77.4% responded “true” or “mostly true” to “When I do
something, I do it well”, and 69.5% responded “true” or “mostly true” to “I like the way I look”. Although not
significant, in 2012‐13, students demonstrated lower self‐esteem than the previous survey (2010‐11).
Females demonstrated significantly lower self esteem than males in all three questions, and this is consistent
across all survey years.
Emotional well‐being by sex, 2012‐13
Emotional well‐being Females [2010‐11]
Males [2010‐11]
In general, I like the way I am.
70.7% [77.8%]
86.3% [88.0%]
When I do something, I do it well.
74.2% [75.8%]
80.4% [81.5%]
I like the way I look. 58.3% [67.4%]
80.0% [82.8%]
Academic Achievement
Students were asked about their academic achievement. In 2012‐13, overall, 82.5% of students reported
that their marks were “mostly A’s and B’s”, 16.0% of students reported that their marks were “mostly
B’s and C’s”, and 1.5% of students reported that their marks were “mostly lower than C’s”. Academic
achievement has remained consistent with previous years’ data. Females were significantly more likely
to report getting higher marks than their male counterparts.
Academic achievement by sex, 2012‐13
School Marks Females Males
Mostly A’s and B’s 86.4% [86.1%]
78.8% [77.9%]
Mostly B’s and C’s 12.6% [12.9%]
19.3% [20.1%]
Mostly lower than C’s 1.0% [1.0%]
1.9% [2.1%]
Question:7 Choose the answer that describes how you feel about the statements (True, Mostly True, Neutral, False, Mostly False):
(a) “In general, I like the way I am” (b) “When I do something, I do it well”
(c) “I like the way I look”
Question:7 Which of the following best describes your marks during the past year? (a) Mostly A’s and B’s ≥ 70%
(b) Mostly B’s and C’s/ 50%‐69%
(c) Mostly lower than C’s < 50%

Healthy Living
Student Drug Use Report 2013 41
Bullying
In 2012‐13, 21.6% of males and 26.9% of females reported being bullied through physical bullying, verbal
bullying, cyber bullying, or theft in the last 30 days. The most common type of bullying received by both
sexes was verbal bullying (19.8%). The least common type of bullying received by males was cyber bullying
(4.1%), and by females was physical bullying (2.5%).
◊
◊
◊4
◊
◊
◊
◊
◊
◊
0
5
10
15
20
25
30
35
40
Physical Verbal Cyber Theft Any
Percent
Types of bullying reported by sex (bullied by others), PEI, 2012‐13
Male Female
◊ Significant difference
In 2012‐13, 13.5% of males and 8.4% of females reported bullying other students through physical bullying, verbal bullying, cyber bullying, or theft in the last 30 days. The most common type of bullying inflicted by both sexes was verbal bullying (8.5%).
◊
◊
◊
◊
◊
◊
◊
◊
0
5
10
15
20
25
30
35
40
Physical Verbal Cyber Theft Any
Percent
Types of bullying reported by sex (bullied others), PEI, 2012‐13
Male Female
◊ Significant difference
Question:7 In the last
30 days, in what ways
have you been bullied
by other students?
Question: 7 In the last
30 days, in what ways
did you bully other
students?
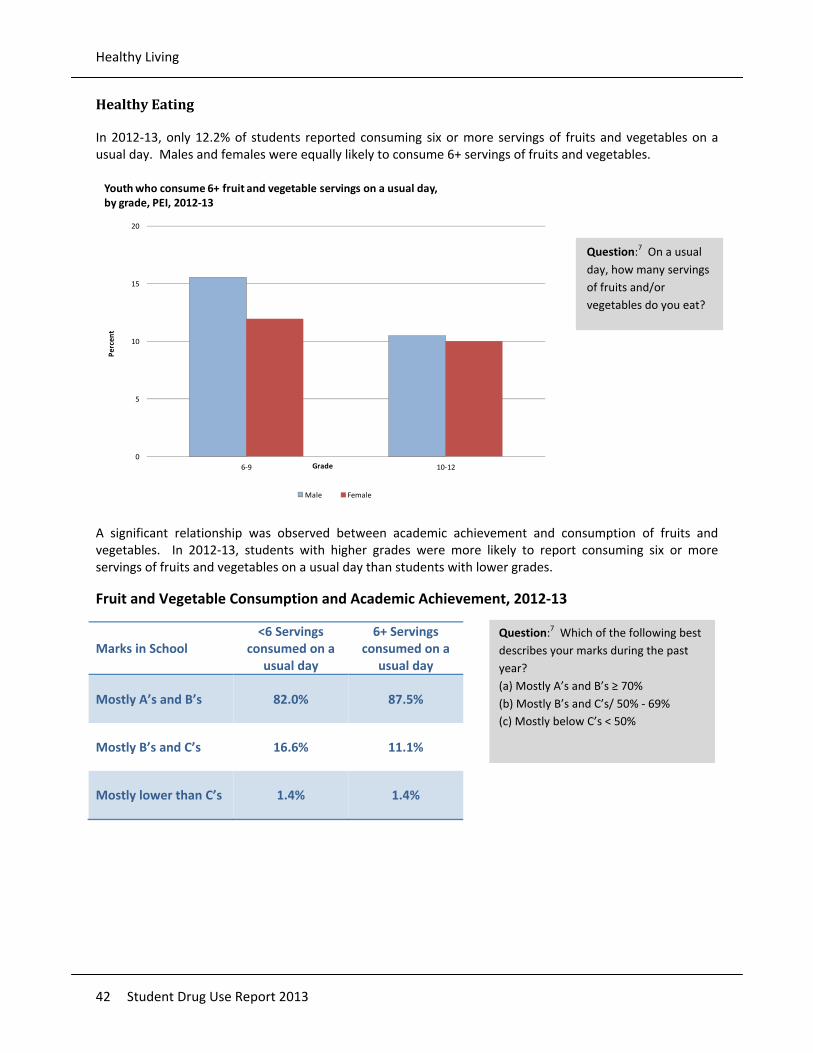
Healthy Living
42 Student Drug Use Report 2013
Healthy Eating
In 2012‐13, only 12.2% of students reported consuming six or more servings of fruits and vegetables on a usual day. Males and females were equally likely to consume 6+ servings of fruits and vegetables.
0
5
10
15
20
6‐9 10‐12
Percent
Grade
Youth who consume 6+ fruit and vegetable servings on a usual day, by grade, PEI, 2012‐13
Male Female
A significant relationship was observed between academic achievement and consumption of fruits and vegetables. In 2012‐13, students with higher grades were more likely to report consuming six or more servings of fruits and vegetables on a usual day than students with lower grades.
Fruit and Vegetable Consumption and Academic Achievement, 2012‐13
Marks in School <6 Servings
consumed on a usual day
6+ Servings consumed on a
usual day
Mostly A’s and B’s 82.0% 87.5%
Mostly B’s and C’s 16.6% 11.1%
Mostly lower than C’s 1.4% 1.4%
Question:7 On a usual
day, how many servings
of fruits and/or
vegetables do you eat?
Question:7 Which of the following best
describes your marks during the past
year?
(a) Mostly A’s and B’s ≥ 70%
(b) Mostly B’s and C’s/ 50% ‐ 69%
(c) Mostly below C’s < 50%

Healthy Living
Student Drug Use Report 2013 43
A significant relationship was observed between emotional well‐being and consumption of fruits and
vegetables. In 2012‐13, students who reported consuming six or more servings of fruits and vegetables on a
usual day were more likely to have higher self‐esteem (i.e. respond “true” or “mostly true” to “I like the way I
am”, “When I do something, I do it well”, and “I like the way I look”) than those who reported consuming less
than six servings of fruits and vegetables.
Fruit and Vegetable Consumption and Emotional Well‐Being, 2012‐13
Emotional Well‐Being <6 Servings
consumed on a usual day
6+ Servings consumed on a
usual day
In general, I like the way I am.
78.2% 83.8%
When I do something, I do it well.
76.6% 84.9%
I like the way I look. 67.9% 82.4%
Question:7 Choose the answer that describes how you feel about the statements (True, Mostly True, Neutral, False, Mostly False): (a) “In general, I like the way I am” (b) “When I do something, I do it well” (c) “I like the way I look”

Healthy Living
44 Student Drug Use Report 2013
Physical Activity
In 2012‐13, only 11.9% of students reported getting at least 60 minutes of vigorous physical activity per day over the last week. Males at all age groups/grades reported a significantly higher rate of physical activity (15.7%) than their female counterparts (7.8%).
0
5
10
15
20
25
30
6‐9 10‐12
Percent
Grade
Youth who report at least 60 minutes per day of vigorous physical activity over the last week, by grade, PEI, 2012‐13
Male Female
A significant relationship was observed between emotional well‐being and physical activity. In 2012‐13, students who reported getting 60 minutes or more of vigorous physical activity a day were more likely to have higher self‐esteem (i.e. respond “true” or “mostly true” to “I like the way I am”, “When I do something, I do it well”, and “I like the way I look”) than those who reported getting less than 60 minutes of vigorous physical activity a day.
Physical activity and emotional well‐being, 2012‐13
Emotional well‐being <60 minutes per day of vigorous physical activity
60+ minutes per day of vigorous physical activity
In general, I like the way I am.
77.9% 85.2%
When I do something, I do it well.
75.9% 85.2%
I like the way I look. 67.9% 89.0%
Question:7 Mark how
many minutes of
physical activity you did
on each of the past 7
days. Include activities
that cause you to sweat
and to breathe harder
or “be out of breath”.
Question:7 Choose the answer that describes how you feel about the statements (True, Mostly True, Neutral, False, Mostly False): (a) “In general, I like the way I am”
(b) “When I do something, I do it well”
(c) “I like the way I look”
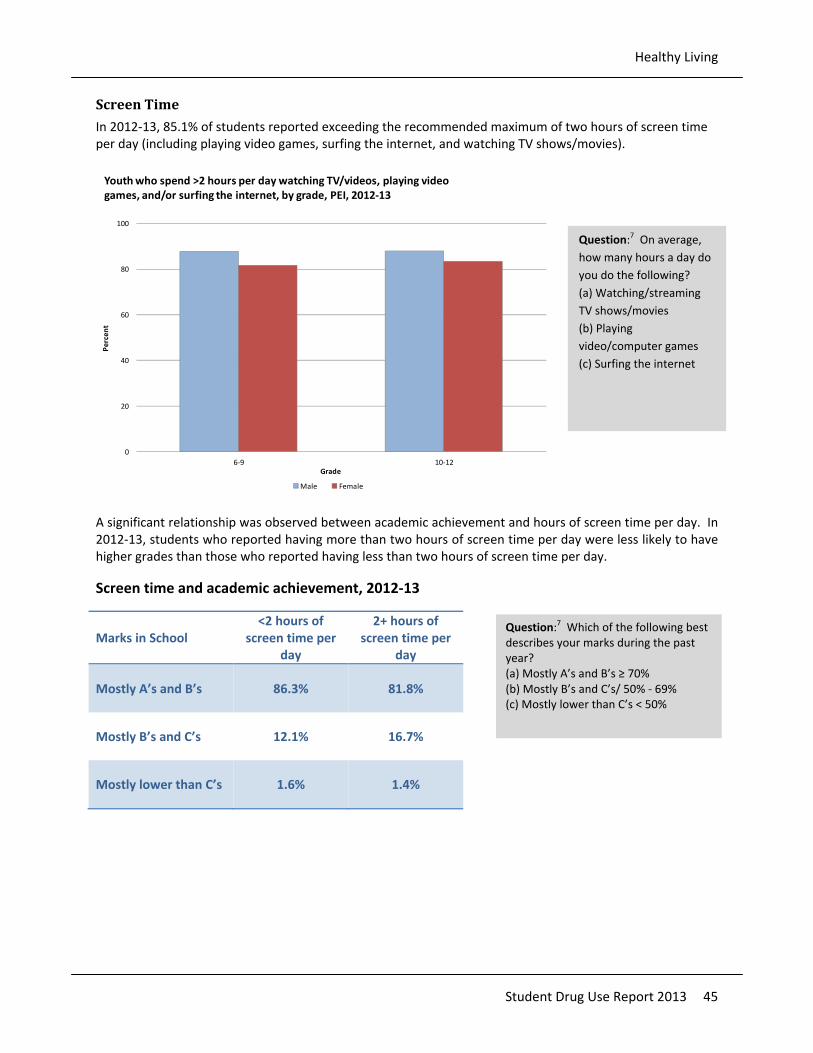
Healthy Living
Student Drug Use Report 2013 45
Screen Time
In 2012‐13, 85.1% of students reported exceeding the recommended maximum of two hours of screen time per day (including playing video games, surfing the internet, and watching TV shows/movies).
0
20
40
60
80
100
6‐9 10‐12
Percent
Grade
Youth who spend >2 hours per day watching TV/videos, playing video games, and/or surfing the internet, by grade, PEI, 2012‐13
Male Female
A significant relationship was observed between academic achievement and hours of screen time per day. In 2012‐13, students who reported having more than two hours of screen time per day were less likely to have higher grades than those who reported having less than two hours of screen time per day.
Screen time and academic achievement, 2012‐13
Marks in School <2 hours of
screen time per day
2+ hours of screen time per
day
Mostly A’s and B’s 86.3% 81.8%
Mostly B’s and C’s 12.1% 16.7%
Mostly lower than C’s 1.6% 1.4%
Question:7 On average,
how many hours a day do
you do the following?
(a) Watching/streaming
TV shows/movies
(b) Playing
video/computer games
(c) Surfing the internet
Question:7 Which of the following best describes your marks during the past year? (a) Mostly A’s and B’s ≥ 70% (b) Mostly B’s and C’s/ 50% ‐ 69% (c) Mostly lower than C’s < 50%

Healthy Living
46 Student Drug Use Report 2013
A significant relationship was observed between emotional well‐being and hours of screen time per day. In 2012‐13, students who reported having less than two hours of screen time per day were more likely to have higher self‐esteem (i.e., respond “true” or “mostly true” to “I like the way I am”, “When I do something, I do it well”, and “I like the way I look”) than those who reported having two or more hours of screen time per day.
Screen time and emotional well‐being, 2012‐13
Emotional well‐being <2 hours of
screen time per day
2+ hours of screen time per
day
In general, I like the way I am.
87.7% 77.2%
When I do something, I do it well.
85.6% 76.0%
I like the way I look. 81.1% 67.4%
School Connectedness
In 2012‐13, 61.8% (63.2% males and 61.2% females) of students responded “agree” or “strongly agree” to all six questions pertaining to school connectedness (“Overall”). The highest proportion of females agreed/strongly agreed that “getting good grades is important to me”, while the highest proportion of males agreed/strongly agreed that “I feel safe in my school”.
0
20
40
60
80
100
I feel close to people at my school
I feel I am part of my school
I am happy to be at my school
I feel the teachers at my school treat
me fairly
I feel safe in my school
Getting good grades is important to me
Overall
Percent
School connectedness responses (true/mostly true) by sex, PEI, 2012‐13
Male Female
Question:7 How strongly
do you agree or disagree
with the following?
(a) I feel close to people
at my school
(b) I feel I am part of my
school
(c) I am happy to be at my
school
(d) I feel the teachers at
my school treat me fairly
(e) I feel safe in my school
(f) Getting good grades is
important to me
Question:7 Choose the answer that describes how you feel about the statements (True, Mostly True, Neutral, False, Mostly False): (a) “In general, I like the way I am” (b) “When I do something, I do it well” (c) “I like the way I look”

Healthy Living
Student Drug Use Report 2013 47
Risk of Alcohol or Drugrelated Disorder
In 2012‐13, overall, 27.0% of students demonstrated a high risk of having/developing an alcohol or drug‐related disorder. Males and females were equally as likely to demonstrate high risk of having/developing an alcohol or drug‐related disorder. The proportion of high risk students increases with increasing grade level.
27.04 25.2128.96
4.328
9.309
17.19
32.92
39.48
53.22
0
10
20
30
40
50
60
70
0
10
20
30
40
50
60
70
Total Male Female G7 G8 G9 G10 G11 G12
Percent
Youth who demonstrate a high risk of having or developing an alcohol or drug‐related disorder, by grade and sex, PEI, 2012‐13
Question:7 Derived variable from
the CRAFFT question:
(a) Have you ever ridden in a CAR
driven by someone (including
yourself) who was “high” or had
been using alcohol or drugs?
(b) Do you ever use alcohol or
drugs to RELAX, feel better about
yourself or fit in?
(c) Do you ever use alcohol or
drugs while you are by yourself,
ALONE?
(d) Do you ever FORGET things you
did while using alcohol or drugs?
(e) Do your family and FRIENDS
ever tell you that you should cut
down on your drinking or drug
use?
(f) Have you ever gotten into
TROUBLE while you were using
alcohol or drugs?
*Students are considered “high
risk” if they answered “Yes” to 2 or
more of the above questions.

References
48 Student Drug Use Report 2013
References
1. Propel Centre for Population Health Impact. Youth Smoking Survey (YSS):2010/2011 YSS Microdata User Guide. 1–50 (University of Waterloo, 2011).
2. Propel Centre for Population Health Impact. Youth Smoking Survey (YSS):2008/2009 YSS Microdata User Guide. 1–54 (University of Waterloo, 2009).
3. Propel Centre for Population Health Impact. Youth Smoking Survey (YSS):2006/2007 YSS Microdata User Guide. 1–13 (University of Waterloo, 2008).
4. Propel Centre for Population Health Impact. Youth Smoking Survey (YSS):2004/2005 YSS Microdata User Guide. 1–37 (University of Waterloo, 2005).
5. Propel Centre for Population Health Impact. Youth Smoking Survey (YSS):2010/2011 YSS Public Use Data Codebook. (University of Waterloo, 2010).
6. Propel Centre for Population Health Impact. 2010/2011 Youth Smoking Survey: Results Profile for Prince Edward Island. 1–21 (University of Waterloo, 2012).
7. Propel Centre for Population Health Impact. Youth Smoking Survey (YSS):2012/2013 YSS Public Use Data Codebook. (University of Waterloo, 2014).
8. Burkhalter, R., Cumming, T., Rynard, V. & Manske. Youth Smoking Survey Microdata User Guide. Waterloo, Ontario: Propel Centre for Population Health Impact, University of Waterloo, 1‐47.
9. Propel Centre for Population Health Impact. 2012/2013 Youth Smoking Survey: Results Profile for Canada. 1–20 (University of Waterloo, 2014).
10. World Health Organization. WHO | Lexicon of alcohol and drug terms. WHO at <http://www.who.int/substance_abuse/terminology/who_lexicon/en/>
11. Mary J.Mycek, Richard A. Harvey & Pamela C. Champe. Pharmacology. (Lippincott‐Raven�; M. Dunitz, 1990).
