student loans in thailand: are they effective, equitable
TRANSCRIPT

Student loans in Thailand:are they effective,equitable, sustainable?
Adrian Ziderman
UNESCO BangkokInternational Institute for Educational Planning
International Institute for Educational Planning http://www.unesco.org/iiep

Student loans in Thailand: are they effective,equitable, sustainable?

The views and opinions expressed in this booklet are those of the authorand do not necessarily represent the views of UNESCO, UNESCO Bangkok orof the IIEP. The designations employed and the presentation of materialthroughout this review do not imply the expression of any opinion whatsoeveron the part of UNESCO or IIEP concerning the legal status of any country,territory, city or area or its authorities, or concerning its frontiers or boundaries.
The publication costs of this study have been covered through a grant-in-aid offered by UNESCO and by voluntary contributions made by several MemberStates of UNESCO, the list of which will be found at the end of the volume.
Published by:UNESCO BangkokMom Luang Pin Malakul Centenary Building920 Sukhumvit RoadP.O. Box 967, Prakanong Post OfficeBangkok 10110, Thailande-mail: [email protected] Bangkok web site: www.unescobkk.org
andInternational Institute for Educational Planning7-9 rue Eugène Delacroix, 75116 Parise-mail: [email protected] web site: www.unesco.org/iiep
Cover design: Corinne HayworthTypesetting: Linéale Production
ISBN: 92-803-1231-6© UNESCO 2003
This volume has been printed in IIEP’s printshop
International Institute for Educational Planning http://www.unesco.org/iiep

5
Contents
List of abbreviations 7
List of tables 8
Statistical appendix tables 10
List of figures 11
Preface to the series 13
Acknowledgements 16
Chapter 1. The Thai education system 17Economic and social background 17The education system: budgets and financing 19Student enrolment 21Institutional structure 24
Chapter 2. Objectives and expectations 27Alternative loans scheme objectives and policies 27Objectives of the Thai loans scheme 30Particular characteristics of the Thai loans scheme 33
Chapter 3. Organizational structure and administration 35Student Loans Scheme Committee 35Allocating the national loans budget 40Loan distribution 46Loan repayment 50Concluding remarks 50
Chapter 4. Main lines of development: a statistical account 53Plans versus outcomes 53National loans scheme budget 55Number of borrowers and loans disbursement 58Loan repayment 65
Chapter 5. Financial analysis 69Formal loan conditions 70The individual loan account 72
International Institute for Educational Planning http://www.unesco.org/iiep

6
Contents
Loan recovery with default and administration costs(the loan recovery ratio) 76Loans scheme viability: revolving fund or open-endedcommitment 80
Chapter 6 Targeting for equity and access 83Reach of the scheme 83Effect on access and drop-out prevention 89Horizontal equity 93Case study: MOE provincial loans budget allocation 98
Chapter 7 Policy conclusions and implications for reform 103Two major areas for reform 103Organizational reform: improving targeting andhorizontal equity 104Finance reform 110The loans scheme and educational reform 111Recommendations from the 1999 Policy Reviewand their implementation 114
References 119
Appendices1. Loans Interview Surveys 1212. Improving financial performance: a simulation approach 1233. Student aid: grants and scholarships 131
Statistical appendix 141
International Institute for Educational Planning http://www.unesco.org/iiep

7
List of abbreviations
ADB Asian Development BankGDP Gross Domestic ProductKTB Krung Thai BankLEAs Local Education AuthoritiesMOE Ministry of EducationMOF Ministry of FinanceMUA Ministry of University AffairsNEC National Education CommissionNESDB National Economic and Social Development BoardONEC Office of the National Education CommissionRIT Rajamamgala Institute of TechnologySES Social and Economic Survey (of the NESDB)SLO Student Loans OfficeSLS Student Loans SchemeSLSB Student Loans and Scholarships BureauSLSC Student Loans Scheme Committee
International Institute for Educational Planning http://www.unesco.org/iiep
8
List of tables
Table 1.1 Government expenditure on education, 1966-2001Table 1.2 Number of students and enrolment ratios by educational
level, 2001Table 1.3 Number of educational institutions, upper secondary to
first-degree level, 1999Table 3.1 MOE loans budget allocation, 2000Table 3.2 Criteria used to allocate MOE loan budgets to the
provincial officesTable 4.1 Number of borrowers and total loans expenditure: planned
and actualTable 4.2 Total annual budget allocations and loans disbursement:
1996-2002Table 4.3 Annual budget surplus (budgeted allocation less loans
distribution)Table 4.4 Number of loan recipients and loans coverage, open and
closed public universities and private universities, 2000Table 4.5 Total loan disbursement by education categoryTable 4.6 Loan repayments, cohorts with repayments due to
commence in 1999 and 2000Table 4.7 Income of non-payers, 1999 repayment cohortTable 5.1 Loans maxima, 1998Table 5.2 Student loans: annual repayment schedulesTable 5.3 Hidden grant and repayment ratio on selected student
loans programmes: alternative discount ratesTable 5.4 Annual loan repayment burden: undergraduate courses, by
genderTable 5.5 Net recovery ratio on loans (with 5 per cent default and
alternative administration costs)Table 6.1 Reach of the loans scheme: upper-secondary level of
schooling, 1999Table 6.2 Upper-secondary school loan recipientsTable 6.3 Number of youth aged 15-17 in poor households, by
school attendance, 1999
International Institute for Educational Planning http://www.unesco.org/iiep

9
List of tables
Table 6.4 Annual household income of loan recipients, selectedprovinces and institutions
Table 6.5 Possible consequences of lack of loan for recipientsTable 6.6 Reasons for not taking a student loan, non-borrowing
studentsTable 6.7 Reasons for discontinuing studies (drop-out), non-student
youth aged 15-17Table 6.8 Average loan size, recipients in MUA demonstration
schools, 1998Table 6.9 Maximum loan ceilings, RIT (Khon Kaen), 1998Table 6.10 Correlation matrix of five target measuresTable 6.11 Bivariate correlations between loan allocation and target
measuresTable 7.1 Student Loans Scheme review (1999): summary matrix of
findings and recommendations
Table A2.1 Student loans: possible 8-year annual repayment scheduleTable A2.2 Repayment ratio: the effect of alternative changes on loan
repayment conditions, undergraduate programmesTable A2.3 Recovery ratios on loans: the effect of changes in
repayment conditions at alternative levels ofadministration costs, undergraduate programmes
Table A2.4 Present values of repayment burden: loan repayment as apercentage of annual income, alternative repaymentconditions
Table A2.5 Annual loan repayment burden, undergraduate courses bygender: alternative repayment conditions
Table A2.6 Present values of repayment burden: loan repayment as apercentage of incremental income, alternative repaymentconditions
Table A3.1 SEMA Life Development Fund, classified by ministryTable A3.2 Grants from various large private non-profit foundationsTable A3.3 Grants administered by the MUA, 2000Table A3.4 Grants at the university level, selected examplesTable A3.5 Total amount of student grant and scholarship aid, tertiary
institutions, 1999
International Institute for Educational Planning http://www.unesco.org/iiep

10
Statistical appendix tables
Table 1 Number of loan recipients, 1996-2000
Table 2 Loans scheme coverage, 1996-2000
Table 3 Total loan disbursements, 1996-2000
Table 4 Number of new and old loan recipients, 1996-2000
Table 5 Average loan size, new and old recipients, 1996-2000
Table 6 Number of borrowers and total loans allocation,MOE and MUA, 1996-2000
Table 7 Number and percentage of loan recipients by incomegroup and institution, selected universities, 1997
Table 8 School/institution type classified by level/type ofeducation and unit of control
Table 9 Grant/scholarship aid, by type: selected universities, 1999
International Institute for Educational Planning http://www.unesco.org/iiep

11
List of figures
Figure 1.1 Real GDP growth, 1992-2001
Figure 1.2 Percentage distribution of the education budget,fiscal year 2002
Figure 1.3 Distribution of students in public and private institutions,by level of education, 2000
Figure 3.1 Student loans budget allocation
Figure 4.1 Number of borrowers and total loan disbursements:MOE and MUA, percentage distribution, 1996-2000
Figure 4.2 Student Loans Scheme coverage, 2000
Figure 4.3 Number of loan recipients: total and new, 1996-2000
Figure 4.4 Average loan size, new and old recipients, 1996-2000
Figure 6.1 Reach of the loans scheme
Figure 6.2 Percentage of loan recipients, by income group:selected universities, 1997
Figure 6.3 Loan ceilings, RIT, Khon Kaen, 1998
Figure 7.1 Alternative scenarios for loans allocation reform
Figure A3.1 Line of administration: student grants/scholarships
International Institute for Educational Planning http://www.unesco.org/iiep

International Institute for Educational Planning http://www.unesco.org/iiep

13
Preface to the series
This book is part of a series of in-depth studies on the functioning ofgovernment-sponsored student loans schemes in Asia. It was written inthe framework of a regional comparative policy review on student loansschemes undertaken by the Bangkok-based UNESCO Asia and PacificRegional Bureau for Education (UNESCO Bangkok) in association withthe International Institute for Educational Planning (IIEP). This regionalproject covered five countries and territories including P.R. China, HongKong S.A.R. China, the Republic of Korea, the Philippines and Thailand.Additional studies are being commissioned by IIEP, and a regionalcomparative assessment prepared by UNESCO Bangkok is forthcoming.
Most countries in Asia are experiencing a dramatic increase indemand for higher levels of education at a time of both severe publicbudget constraints and profound overhaul of education systems aimed atsignificantly increasing their impact and relevance. In an attempt to easethe burden on public budgets, a number of countries have introducedstudent loans schemes, hoping to recover costs and increase the revenuebase for the expansion of education, while at the same time providingopportunities for poorer segments of the population to access higher levelsof education.
In an attempt to increase the knowledge base available togovernments and provide practical insights which might be useful fornational education policy, the UNESCO Asia and Pacific Regional Bureaufor Education initiated in 2001 a regional comparative study to examinethe performance of student loans schemes in a number of countries inAsia. The study is intended to be instrumental in improving the efficacyand financial efficiency of existing schemes and in providing acomparative information base for countries intending to introduce astudent loans scheme.
International Institute for Educational Planning http://www.unesco.org/iiep

14
Preface to the series
A joint endeavor by UNESCO Bangkok and IIEP, this regional policystudy was initiated and its implementation co-ordinated by the Planningand Sector Analysis Unit (PSA) at UNESCO Bangkok. It benefited fromtechnical support by IIEP and was able to draw on a wide range of regionaland international expertise available at research institutes, universitiesand ministries in the participating countries. Five research teams led byacademics and senior-level practitioners were involved in producing themonographs. UNESCO Bangkok and the Korean EducationalDevelopment Institute (KEDI) hosted several research seminars bringingtogether research teams and practitioners from the countries participatingin the project.
Partner institutions involved in the study included the KoreanEducational Development Institute (KEDI); Huazhong University ofScience and Technology (Graduate School of Education), Wuhan; PekingUniversity (Graduate School of Education); the Chinese University ofHong Kong (Department of Educational Policy and Administration); theCommission for Higher Education (CHED) in the Philippines (Office ofStudent Services, Office of Policy Planning, Research and Information)and the Asian Development Bank collaborating in the framework of anongoing Education Sector Development Program in the Philippines.Researchers and officials from several universities, education and financeministries and national agencies such as student loans offices in theparticipating countries collaborated in the preparation of the case studies.UNESCO Bangkok and IIEP would like to thank all those individualswho provided their expertise and professional experience to this researchand therefore helped to assemble a considerable cross-sectoral informationbase required for comparative loans policy analysis. The importantcontributions by individual researchers and authors are acknowledged inthis book.
The policy study benefited from the technical expertise of AdrianZiderman, Professor of Economics at Bar-Ilan University, Israel, actingas UNESCO international lead consultant. He provided methodologicalguidance to research teams along the lines of his earlier study on loans inThailand, prepared under a joint UNESCO Bangkok – Asian DevelopmentBank project, ‘Education management and financing study’, in 1999. IgorKitaev, Programme Specialist (education financing), served as resource
International Institute for Educational Planning http://www.unesco.org/iiep
15
Preface to the series
person from the IIEP in addition to authoring one of the studies. DominiqueAltner, Chief, Planning and Sector Analysis Unit, UNESCO Bangkok, withsupport from Toshiyuki Matsumoto, Assistant Programme Specialist, PSA,initiated and ensured the professional co-ordination for this study.
Gudmund Hernes, DirectorInternational Institute for Educational Planning, Paris
Sheldon Shaeffer, DirectorUNESCO Asia and Pacific Regional Bureau for Education, Bangkok
International Institute for Educational Planning http://www.unesco.org/iiep

16
Acknowledgements
This monograph was written by Adrian Ziderman, Professor of economicsand education at Bar-Ilan University, Israel. It is a revised and updatedversion of an earlier policy study prepared by the author in 1999 as partof a joint UNESCO (Bangkok) – Asian Development Bank project,Education management and financing study.
The author acknowledges the research assistance provided in up-dating the earlier version, by Nonglak Wiratchai, Professor Emeritus,Department of educational research at Chulalongkorn University,Bangkok, and by Walairat Asaves, Educational Officer, Office of theNational Education Commission, Bangkok.
International Institute for Educational Planning http://www.unesco.org/iiep

17
Chapter 1
The Thai education system
Economic and social background
The Asian financial crisis
The initiation and early development of the student loans scheme inThailand should be viewed in the context of the financial and economiccrisis that hit the Thai economy in mid-1997, subsequently spreading toother countries in the region. The rapid economic development over thepreceding decade had established Thailand as one of the new emergingAsian tigers; following double-digit economic growth from 1988-1990,the early nineties witnessed annual growth rates in GDP well in excess of8 per cent (Figure 1.1). The initial, underlying factors leading to theseextremely high economic growth rates were mainly external – rapidgrowth in the export sector, tourism and foreign investment; subsequently,domestic investment and consumption demand played a major role.
The run on the baht in mid-1997 was followed by depression ofother financial and asset markets; by mid-1998, the value of the baht hadfallen by 40 per cent and stock values by 50 per cent (Cresswell, 1999).These climactic events exerted their toll on economic activity. In 1997,GDP growth fell some six percentage points and was negative (-5.5 percent) in 1998. Unemployment and underemployment increased. Whilestrong moves towards economic recovery were apparent in 1999, thesewere not sustained; GDP growth rates exceeded 4 per cent in 1999 and2000, but subsequently fell to 1.5 per cent in 2001 (Figure 1.1). In 2002,growth is only about 1 per cent.
The effects of the crisis on the education system were harsh. Theresulting strain on the government budget led to reductions in publicresources available for the education sector. The crisis also affected theeducation sector through its impact on family incomes and welfare. Itreduced the ability of families to finance tuition fees and other education
International Institute for Educational Planning http://www.unesco.org/iiep

18
Student loans in Thailand: are they effective, equitable, sustainable?
costs, with a resulting increase in late tuition payments, reduced schoolingenrolments and greater student drop-out (Cresswell, 1999). Poorer familieswere particularly hard hit.
Figure 1.1 Real GDP growth, 1992-2001 (%)
10
8
6
4
2
0
–2
–4
–61992 1993 1994 1995 1996 1997 1998 1999 2000 2001
8.1 8.3 8.8 8.7
6.4
0.6
4.2 4.3
1.5
–5.5
The student loans scheme, which began operation in 1996, is aimedparticularly at easing the financial burden on students studying at theupper secondary and tertiary levels; its ultimate aim is to increaseeducational access (to upper secondary and tertiary education) for poorersections of the population, leading to increased equality of educationalopportunity and greater social equity. While the scheme was planned,and set in motion, prior to the onset of the crisis, it was seen as playing animportant role in maintaining student enrolments and in countering studentdrop-out from the education system. One of the central themes of thismonograph is how far this has proved to be the case in practice.
Social background
The total population in Thailand was approximately 62 million in2000, of which 53 per cent was in the labour force and 80 per cent livedin non-urban areas.
International Institute for Educational Planning http://www.unesco.org/iiep

19
The Thai education system
We may identify two, rather different, categories in the occupationaland social class structure of Thailand. The first relates to the hierarchicalclass structure characterizing urban dwellers in the Bangkok Metropolisand big provinces. Considerable differences in well-being are foundamongst the segments of urban society, which is highly stratified in termsof wealth, income, social position and education level; rich and middle-class lifestyles coexist with extreme urban poverty, exacerbated by inwardmigration from the rural areas. In parallel, a more homogeneous socialstructure is found in the largely classless populations in the small villagesand districts, which is characterized by a common, basic cultural pattern,subsistence agriculture and widespread rural poverty.
High economic growth in the past had contributed to a substantialimprovement in the standard of living, especially in rural areas (Kakwaniand Pothong, 1998); these improvements were largely halted by theeconomic crisis and the already high disparities between rural and urbanareas, and between regions, have increased. The impact of the crisis wasstrongest in the poorest, north-eastern region, which contains the country’sfive most poverty-stricken provinces.
The education system: budgets and financing
Overall, the public sector is the dominant provider and fundingsource of education in Thailand, as in most countries, though we willnote the importance of private education provision in some sectors,particularly in vocational education and at the university level. This sectionprovides information on the government’s role in funding education, thedistribution of the education budget between sub-sectors and recent trendsin the private financing of education.
Public educational expenditure
Central government spending on education is in the order of225 billion baht (Table 1.1); this includes considerable subsidies for localgovernment expenditure and subsidies for private education.
The level of spending on education in relation to the gross domesticproduct (GDP) – the major measure of overall economic activity –compares well with that of other countries in the region (Cresswell, 1999).Overall, an upward trend is discernible over recent years. On average,
International Institute for Educational Planning http://www.unesco.org/iiep

20
Student loans in Thailand: are they effective, equitable, sustainable?
government spending on education accounted for 3.16 per cent of GDPover the period 1987-1997 (ONEC, 1997); in recent years this ratio haswell exceeded 4 per cent (Table 1.1).
Table 1.1 Government expenditure on education,1996-2001
1996 1997 1998 1999 2000 2001
Amount (billion baht) 170.1 202.9 201.7 207.3 220.6 224.1
% of GDP 3.7 3.9 3.9 3.7 4.3 4.3
% of national budget 20.3 20.6 25.2 25.1 25.7 24.6
The share of government spending on education in the overall centralbudget, has shown a clear, upward trend. For over a decade prior to 1996,this ratio fell considerably short of the 20 per cent figure for 1996; since1998 the ratio has been about 25 per cent. In 1998, due to the ongoingeconomic crisis, the total government allocation to education from thenational budget was reduced; however, the share of the budget allocatedto education rose sharply to over 25 per cent. While this may be taken torepresent a commitment of government to education development, evenin times of economic austerity (ONEC, 2000), it also reflects the difficultyof imposing cuts in a sector with high levels of committed expenditure(Cresswell, 1999).
Allocation of the education budget
The distribution of the education budget levels and types of educationis shown in Figure 1.2. While pre-primary and primary education stillreceive the largest allocation (44 per cent), over the longer term theirshare has declined markedly, from nearly 60 per cent in 1987 to 50 percent a decade later. This decline no doubt is less indicative of parsimonyof budgets for pre-primary and primary education than a reflection of thegrowth of other education sub-sectors, such as higher education (whichnow receives over 14 per cent of the budget, compared with about 10 percent in the mid-1980s). Secondary education received 24 per cent of theeducation budget.
International Institute for Educational Planning http://www.unesco.org/iiep

21
The Thai education system
Figure 1.2 Percentage distribution of the education budget, fiscalyear 2002
Higher education14%
Non-formaleducation
2% Educationsupport
13%
Other education3%
Pre-primary &primary education
44%
Secondaryeducation
24%
The overall conclusion reached in a recent, comprehensive surveyof educational finance in Thailand is that, in the aggregate, governmentfinancial support for education is adequate by some standards, but foundto be lacking by others (Cresswell, 1999). Total government educationalspending in Thailand is comparable to that in other countries in the regionand is not seen to be low in terms of wider international comparisons;allocations by major levels of education and across types of educationare also found to be largely sound in terms of international comparisons.A number of problem areas were identified, including the high level ofsubsidies to higher education (particularly universities) relative to primaryand secondary education and disparities in the allocation of resources forbasic education across provinces and regions.
Student enrolment
Over 14 million students are enrolled in the Thai formal educationsystem, from pre-primary through to tertiary education (Table 1.2). Themain education levels within the Thailand system are: pre-primary (threeyears of pre-school, consisting of a variety of programmes includingkindergartens in primary schools and pre-school programmes run by
International Institute for Educational Planning http://www.unesco.org/iiep

22
Student loans in Thailand: are they effective, equitable, sustainable?
temples, communities and other organizations); primary (grades 1-6);lower secondary (grades 7-9); upper secondary (grades 10-12, includingboth general and vocational schools and streams); and tertiary or highereducation. In Thai educational parlance, ‘basic education’ refers toschooling up to and including upper-secondary education. Free stateeducation runs from primary though to lower-secondary education, thoughcurrently it is being extended to 12 years of basic education (to includeupper-secondary education) under the provisions of the 1999 NationalEducation Act.
Enrolment ratios
Enrolment ratios by education level are shown in Table 1.2. Theprimary-level enrolment ratios have exceeded 100 per cent since 1998,the result of repetition as well as under- and over-age primary-levelstudents. However, many children lack access to primary-level schooling,particularly those in remote rural areas and the handicapped (ONEC,2000). The overall secondary enrolment ratio is some 70 per cent – 83 percent at the lower, and some 60 per cent at the higher, secondary level; ofthe latter, two-thirds are in general, academic education and a third isenrolled in vocational programmes. A quarter of the population aged 18-21 is enrolled in tertiary education (excluding the open universities whichcater for a broader age range), whether at the below-degree and diplomalevel or in first-degree programmes.
Table 1.2 Number of students and enrolment ratios by educationallevel, 2001
Education level Age Student Enrolment/group enrolment (’000) Population ratio
Pre-primary education 3-5 2,790 96.0
Primary education 6-11 6,051 103.7
Lower-secondary education 12-14 2,358 82.9
Upper-secondary education 15-17 1,720 59.2– Academic track 15-17 1,123 38.7– Vocational track 15-17 597 20.6
Tertiary education* 18-21 1,085 25.0
Total 3-21 14,004 -
* Excludes students in open universities.Source: ONEC (2001).
International Institute for Educational Planning http://www.unesco.org/iiep

23
The Thai education system
Enrolment in private education
About 15 per cent of overall student enrolment in the academic year2000 was in private education institutions; however, the relativeimportance of private education differs by educational level and type(Figure 1.3). The highest proportion of private enrolments is found invocational education – at the upper-secondary level some 36 per cent ofstudents are enrolled in private institutions, while at the upper vocational(tertiary level – grades 13-14) nearly half of all enrolments are in theprivate sector. The private sector has played a minor role in generalsecondary education; only 5 per cent both of lower and of upper-generalsecondary students are enrolled in private-sector schools. About a fifthof all university students study at private institutions.
Figure 1.3 Distribution of students in public and private institutions,by level of education (%), 2000
University
Upper vocational(grades 13-14)
Vocational uppersecondary
General uppersecondary
Lower secondary
Primary
Pre-primary
0 20 40 60 80 20
Public Private
81
52
95
95
87
81
64
19
48
36
5
5
13
19
International Institute for Educational Planning http://www.unesco.org/iiep

24
Student loans in Thailand: are they effective, equitable, sustainable?
Institutional structure
Overall administrative structure
The Office of the National Education Commission (ONEC), withinthe Office of the Prime Minister, is responsible overall for educationalpolicy, planning and research. There are two ministries centrally concernedwith the provision, management and quality control of education: theMinistry of Education (MOE) and the Ministry of University Affairs(MUA).
The MUA is responsible for higher education provision in allgovernment universities, institutions and colleges; and is in charge ofcurriculum approval in all private higher-education institutions. Besidesgoverning all universities, the MUA is in charge of the administration ofall demonstration schools affiliated with the universities.
In contrast, the responsibilities of the MOE span all levels and typesof education. In addition to pre-primary, primary and secondary education,the MOE is responsible for the administration of colleges and institutes,at the tertiary level, providing undergraduate education in teachereducation, and vocational and technical education. Specializeddepartments/offices in the MOE deal with the various types and levels ofeducation for which it is responsible. These include:
• Office of the National Primary Education Commission;• Department of General Education: responsible for the provision of
secondary, general education;• Department of the Private Education Commission: overseeing quality
control and financing of private education, at both basic and tertiaryeducation levels;
• Department of Vocational Education: responsible for the provisionof vocational education at secondary and tertiary certificate/diplomalevels;
• Office of Rajabhat Institute Council: responsible for the provisionof teacher education and undergraduate programmes at Rajabhatinstitutes (formerly known as teacher institutes);
• Department of Rajamangala Institute of Technology: responsiblemainly for the provision of tertiary programmes in vocationaleducation;
International Institute for Educational Planning http://www.unesco.org/iiep

25
The Thai education system
• Department of non-formal education: responsible for the provisionof informal and non-formal education, at both basic and tertiaryeducation levels;
• Department of Fine Arts: responsible for the Colleges of Fine Arts;• Department of Religious Affairs: provision of education for monks.
A second group of ministries/agencies is responsible for the provisionof education in specialized fields. These include: the Ministry of Defence,Ministry of Public Health, Ministry of Transport and Communications,Ministry of Agriculture and Cooperatives, Ministry of Justice, Ministryof Labour and Social Welfare, Bangkok Metropolitan Administration (apublic independent agency), and the National Police Office under thePrime Minister’s Office. All these ministries/agencies operate institutionsor are responsible for the management of education in specialized fieldsor for specific purposes.
Upper secondary and higher education
Since the student loans scheme covers upper and tertiary education,details relating to these two education levels are included in this section.
Table 1.3 provides information on the number of educationalinstitutions at the upper secondary and tertiary levels.1 It should be notedthat the sum of the school/institution numbers from all levels and typesof education shown in the table exceeds the total number of schools/institutions for the whole country (not shown in the table) because someschools/institutions provide education at more than one level or type ofeducation. Thus, for example, the Rajamangala institutes of technologyin the past have provided two-year vocational education programmes atthe upper-secondary education level, two-year vocational educationprogrammes at the diploma level (equivalent to the first two years at thebachelor-degree level) and four-year vocational degree programmes aswell.
The data for private institutions parallel those for student enrolmentin private educational institutions, presented in Figure 1.3.
1. Appendix Table 8 provides detailed information on types of school/institution, classified bylevel/type of education and unit of control.
International Institute for Educational Planning http://www.unesco.org/iiep

26
Student loans in Thailand: are they effective, equitable, sustainable?
Table 1.3 Number of educational institutions, upper secondary tofirst-degree level, 1999
Number of schools/institutions
Educational level Public Private Total % private
Upper secondaryeducation– Academic track 2,416 147 2,563 5.7– Vocational track 542 312 854 36.5
Tertiary education– Below first degree 304 269 573 46.9– First degree 145 33 178 18.5
Source: ONEC (2001).
Tertiary education in Thailand is highly fragmented. The MOE hasbeen charged with responsibility for below-degree tertiary education aswell as degree-level studies at the RIT and Rajabhat institutes; universityeducation is in the purview of the MUA. This dichotomy of responsibilityhas led to differing policies, levels of budgetary support and admissionpolicies across the tertiary education divide; it has also militated againstequality of treatment for MUA and MOE tertiary students in theadministration and distribution of student loans – a theme to be developedin subsequent chapters. Under the 1999 Education Act reforms, areorganization of the administrative structure of tertiary education isplanned, aimed at unifying all three major elements – the ONEC, theMOE and the MUA – within a single ministry.
The line of administration from the centre to individual educationalinstitutions differs both between the MUA and the MOE and within theMOE. The MUA deals directly with individual universities, both publicand private. This is very different from the administration of basic(including upper secondary) education, of which there are two variants.
Particularly at the level of upper-secondary schooling, the various MOEcentral departments concerned (such as for General Education, the Office ofthe Private Education Commission) delegate authority to the 12 EducationalRegion Offices, the 75 Provincial Education Offices (excluding Bangkok)and the District Education Offices, in the supervision and control of allsecondary schools. This decentralized framework was adapted by the MOEfor administering the student loans scheme, though not without negativeoutcomes. In parallel, the Bangkok Metropolitan Administration and the othermunicipalities, with financial support from, and under the supervision of, theMinistry of the Interior, are responsible for providing education at all levels(apart from universities) within their administrative area.
International Institute for Educational Planning http://www.unesco.org/iiep

27
Chapter 2
Objectives and expectations
Alternative loans scheme objectives and policies
While student loans schemes are in place in some 50 countries, thecentral objective and type of policies pursued differ from case to case.We may identify five different sets of objectives for student loans schemeswhich, in turn, will influence the design and operation of the scheme as awhole, as well as its financial sustainability. These are: pure cost recovery;facilitating the expansion of the higher education system; meeting specificmanpower needs; easing student financial burdens; and social objectives– improving equity and access for the poor (a fuller discussion is given inZiderman, 2002a). In practice, any given scheme may incorporate morethan one objective.
Cost recovery
Universities throughout the world, and particularly in developingcountries, are under-financed. Governments have responded to thegrowing social demand for higher education through policies leading toexpanded student enrolments; yet, due to national budgetary constraints,the growth in student numbers is largely unmatched by commensurateadditional government funding. Many university systems have turned togreater cost recovery in an effort to tap additional sources of funding.The main thrust of these policies is to be seen in the introduction, orincrease, of student payments for services received. These may take theform of higher, more realistic tuition fees or increased payments forsubsidized lodgings and meals. Incidentally, the introduction of a regimeof sizeable student fees will have additional effects on the educationsystem. It leads to a changed relationship between institution and students,in the direction of a provider-client relationship and a greater studentvoice in the affairs of the institution.
The raising of student fees, whether for tuition or living expenses,may be both politically and socially unacceptable; vested interests from
International Institute for Educational Planning http://www.unesco.org/iiep

28
Student loans in Thailand: are they effective, equitable, sustainable?
all strata of society will actively oppose the imposition of studentexpenditures that may represent a multiple of current salary levels.Recourse to the banking system for loans to ease this payment burdenmay be unsuccessful; banks are notoriously loath to lend for educationcourses, a clear case of market failure. Hence the role for a government-backed student loans scheme, offered at commercial rates, to fill thisgap. Students are able to finance their education and living expensesthrough resort to borrowing; the repayment burden is eased by the expectedenhancement of earnings that the additional education makes possible.
It should be noted that loans schemes primarily concerned with costrecovery are also frequently subsidized and targeted to the poor. But theseelements are not an integral part of a cost recovery loans scheme that, inprinciple, should be offered at market interest rates and be available toall, not only the poor. The availability of additional revenues from studentfees, facilitated by the introduction of a loans scheme, may not lead toincreases in net funding to the educational institutions. Whether it doesso will depend on whether or not additional revenues from fees are offsetby commensurate reductions in public funding of the institutions.
Facilitating higher education expansion
Responding to the pressures of growing social demand for educationexpansion will require sizeable increases in public expenditures; theseincreases, we have argued, could be contained by offsetting additionalrevenues from increases in student fees, by reduced public institutionalsupport. A complementary measure is to encourage the growth of privateeducational institutions. Students pay full costs, with a minimal burdenon the public purse. However, full-cost fees are likely to be sizeable andbeyond the reach of large segments of the population. A student loansscheme may have a central role to play in easing the burden of privatefees, particularly so if private education is to be widely available and notto remain the prerogative of the rich. In Colombia and Brazil, loans tostudents attending private institutions have permitted these institutionsto expand, thus increasing the overall access to higher education whilelowering budgetary demands on the government. The SOFES loansscheme in Mexico is directly targeted on academically able but financiallyneedy students attending or wishing to enrol in private higher educationinstitutions. This scheme receives considerable public subsidies; however,
International Institute for Educational Planning http://www.unesco.org/iiep

29
Objectives and expectations
a student loans scheme introduced for this purpose does not, in principle,need to be a subsidized one.
Manpower needs
Loans schemes may aim specifically at providing support for studentswho are willing to study in fields of national manpower priority (e.g.engineering) or to work in areas of social importance (doctors or teachersservicing remote rural areas).
Easing student financial burdens
Even when tuition fees are minimal, students (including the non-poor)may face considerable financial burdens. University-level students are of anage of legal and financial independence; yet, potential earnings are forgonewhile studying, and living expenses may be sizeable, especially when thestudent does not attend a local university. In many countries students are ableto combine work with study. This may take the form of part-time, usuallycasual, student employment (on or off the campus), as evidenced in the USAconcept of ‘working your way through college’. In other cases, timetablingand university regulations facilitate regular employment with study. However,in some systems, these possibilities may not be readily available or it maynot be the norm for students to work. In these cases, financial pressures,which may have negative effects on student motivation and performance,can be mitigated by the broad availability of student loans. While such burdensmay fall relatively heavily on the poor, in principle loans for this purposecould be made available for all students, including the non-poor, but notsubsidized.
Social objectives – increasing access for the poor
None of the four above reasons for introducing a student loansscheme make out a case for highly subsidized loans. Increasing theeducational participation of the poor does. In many countries the relativelylow enrolment of poor and disadvantaged youth in non-compulsoryeducation is a cause of social concern; increasing the access to schoolingamong these segments of the population has become a major element ineducational and social policy. There is a broad consensus that clearfinancial incentives need to be offered, not only to overcome the burdenof fee payments and living expenses but also to offset parental resistance
International Institute for Educational Planning http://www.unesco.org/iiep

30
Student loans in Thailand: are they effective, equitable, sustainable?
to reductions in family income and the risk that the benefits of theeducational process may not be sizeable.
The traditional, and most effective, method of enhancing access toeducation of the poor has been through the provision of means-testedgrants to cover tuition fees (where schooling is not free) and usuallyliving expenses as well. This remains the dominant approach still in placefor secondary education. The availability of grants and scholarships forupper-secondary and tertiary-level education in Thailand is limited.2
However, a widespread grants scheme is likely to be overly expensive;the use of loans rather than grants offers a method that both increasesaccess of the poor and contains public expenditure over the longer termas loan repayments build up. To be effective in increasing the educationaccess of the poor, loans need to be offered at attractive rates. Hence thejustification for subsidized loans, in terms of grace periods for repayment,below-market rates of interest and repayments in current rather than realterms. But these subsidies will result in only a partial recouping of loans,overall. That part of the loan that is not repaid may be seen as a ‘hiddengrant’ to the borrower, the size of which is a reflection of the degree ofsubsidy built into the scheme. In this sense, loans offered at commercialrates, on the one hand, and outright grants, on the other, might be seen astwo extreme points on a continuum, with a subsidized loan lyingsomewhere in between. The larger the loan subsidy, the greater is thehidden grant element. From this arises a central policy issue: given thehigher administrative costs of loans compared with grants and theprobabilities of repayment default, at what level of subsidy does a grantbecome a more cost-effective instrument than a subsidized loan?
Objectives of the Thai loans scheme
How far are these objectives reflected in the Thai loans scheme?The broad configuration of the Student Loans Scheme (SLS) was set outin a Cabinet document prepared by the Ministry of Finance in March1995 (Ministry of Finance, 1995); the Cabinet adopted the document,both the general concept and the details of the Student Loans Scheme.The Scheme was to be put in place in the 1996 academic year, under theresponsibility of the Ministry of Finance. The Scheme had been operated
2. Details of the availability of grants and scholarship aid in Thailand are provided in Appendix 3.
International Institute for Educational Planning http://www.unesco.org/iiep

31
Objectives and expectations
under the Cabinet regulation until the promulgation of the Student LoansFund Act in March 1998. A note to the Act explains its purpose:
“… there is a need to develop human resources in order to achieveeconomic growth and to increase the competitive capacity of the country.Given these needs, educational development needs to be accelerated.Existing problems of educational inequality within society can be solvedby enlarging the educational opportunities of students from low-incomefamilies. This will play a major part in improving general living standards.To achieve these goals, it is necessary to establish the Student LoansScheme”.
In the Act itself, the only objective mentioned is “to lend money topoor students for tuition, educational expenses and other expensesnecessary for living during studying” (Clause 5).
From these and other citations, it is seen that the objectives of theScheme are primarily social: the availability of student loans would leadto greater educational opportunities for the poor, higher living standardsand greater degree of equality in the population. The longer-run objectives– of enhancing the nation’s human capital, competitiveness anddevelopment – are economic; but the human capital development will besecured through targeting on the needy. No other objectives are recorded.The exclusive concentration on social objectives is surprising given thatmost student loans schemes are multi-objective, with due emphasis placedon economic outcomes – particularly enhanced cost recovery throughhigher tuition fees and lower public expenditures.
The declared aim of the Thai loans scheme to increase the access ofthe poor to upper secondary and tertiary education – through the targetingof loans to needy students under extremely favourable repaymentconditions – has been complemented, de facto, by other objectives.
The SLS has served as a means of easing the financial burdens ofthe non-poor. The upper limit on parental income of 300,000 baht set bythe scheme until 2000 (in practice, the MOE has reduced this to150,000 baht, still a sizeable income, for loans administered by thatministry) has meant that many non-poor university students are in receiptof loans. In Chapter 5, we present a table showing the percentage of loanrecipients by parental income group for 10 universities in a recent year;
International Institute for Educational Planning http://www.unesco.org/iiep

32
Student loans in Thailand: are they effective, equitable, sustainable?
on average, over a fifth of loan recipients were from families with annualparental income in excess of 150,000 baht (at two of the universities theproportion exceeded a third). In 1998, the percentage exceeded 26 percent at Khon Kaen University. The issue here is how large is the hiddengrant element in these loans to non-poor students and whether this levelof subsidy is justified. We return to this issue later.
While the SLS is not seen as a vehicle for extensive cost recovery,the introduction of the scheme in 1996 was accompanied by increases intuition fees at public educational institutions, though not all. Upper-secondary school fees, stable for many years, were raised by over 70 percent, placing them on a par with fees at public vocational schools. Tuitionfees at Rajabhat institutions were also raised sharply; fees at RITinstitutions and public universities have shown a more steady upwardtrend over recent years. While tuition fees at public universities are nowthree times higher than some eight years ago, they still represent only asmall proportion of unit costs.
It appears to be government policy to encourage the growth of privateeducation institutions (particularly universities) as a means of increasingthe number of student places, at low public cost.3 The average amount ofloan given to students at private institutions exceeds by a considerablemargin those for students enrolled at public institutions, because ofsizeable differences in tuition fee levels. Since all student loans are highlysubsidized, the availability of loans to students enrolled at privateeducation institutions results in the subsidization of the costs of privateeducation. In 2000, some 38 per cent of all private university studentswere in receipt of loans. Encouraging the expansion of private educationimplies a growing commitment to provide highly subsidized loans; howfar this represents a cost-effective method of increasing universityenrolments will depend in part on the average size of loans subsidization,an issue discussed in Chapter 5.
3. In this connection, a Revolving Fund for Developing Private Higher Education Institutionswas initiated by the Cabinet in 1999. The purpose is to provide loans to private institutionsfor building construction and the purchase of educational materials, in order to ease the ex-pansion of private higher education. By 2002, total allocations were in the order of 900 mil-lion baht. In addition, a Revolving Fund for Staff Development in Private Higher EducationInstitutions was set up in 1997, aiming at the promotion of staff development programmes forprivate higher education institutions, especially small, local institutions. Some 300 millionbaht had been allocated by 2002.
International Institute for Educational Planning http://www.unesco.org/iiep

33
Objectives and expectations
Particular characteristics of the Thai loans scheme
It seems likely that the strong emphasis on social objectives in theThai loans scheme may explain four of its particular characteristics.
Unusually, the scheme covers upper-secondary schooling, as wellas tertiary education. Student loans schemes almost exclusively relate totertiary education; a notable exception is the Swedish scheme, but evenhere the loans element in the total aid package available to students isvery small. Yet while loans schemes for upper-secondary schooling areunusual, it is at this level of non-compulsory schooling that enrolmentrates fall off drastically and the risk of drop-out increases. Poor studentsare particularly at risk, because of the effects of opportunity costs ofstudying rather than working. For this reason, government subsidy of theprivate costs of upper-secondary education, particularly of the poor, isseen as an important element of social policy; the question is whethersubsidized loans targeted at the poor (rather than grants) constitute thebest instrument for achieving the desired outcome.
Second, the loan repayment conditions are extremely generous,implying an extensive loan subsidy. Repayments are spread over 15 yearsfollowing a two-year grace period, with the repayment percentage fixedat very low rates initially and rising progressively over time; repaymentsare in nominal terms and the rate of interest charged is only 1 per cent.The introduction of these soft repayment terms may have resulted fromthe conception of the loans scheme as one that has essentially socialobjectives, with considerably less weight given to the financial aspectsof the scheme. The open issue however is the resulting size of the loansubsidy; an over-large subsidy not only brings the financial viability ofthe whole scheme into question; it may indicate that a regime of grantsoffers a more cost-effective alternative.
Third, there are all the signs that the scheme was introduced withhaste and minimal planning. There is always a dilemma to be faced inintroducing a socially-needed change. Effective implementation requirescareful preparation and planning spread over a period of time; but thiswill mean delaying the supply of the needed service, during what mightbe a lengthy preparation period. If there was such a trade-off betweenmore effective implementation and swifter implementation in the settingup of the loans scheme, the path taken veered towards the latter course.
International Institute for Educational Planning http://www.unesco.org/iiep

34
Student loans in Thailand: are they effective, equitable, sustainable?
Thus the scheme functioned in its initial years of operation on an ad hocbasis, without a formal Act, without full-time management or senior staffand without premises. Even today, no monitoring system is in place, sothat it is not known how far the scheme is achieving its objectives ofadequately reaching the poor.
Finally, the decision in favour of quick implementation may accountfor another characteristic of the scheme: the decision to use existingadministrative and organizational structures rather than design new onesaimed directly to achieve the purposes of the scheme. Thus while theguidelines for the operation of the scheme are set by the new CentralLoans Committee, its actual operation, and particularly loans budgetallocation, is in the hands of the Ministries of Education and UniversityAffairs. The system works to ensure that, as it were, a ‘fair share’ of theloans budget is received at each level of the ministry’s organizationalhierarchy, down to the level of the educational institution itself, whichactually distributes the loans to students. But, with the partial exceptionof MOE loans budget allocation to the provincial offices, this loans budgetallocation system essentially ignores the scheme’s central objective oftargeting the poor. To what extent, in practice, the system achieves thescheme’s combined objectives of targeting the poor and horizontal equityis the subject of Chapter 6.
International Institute for Educational Planning http://www.unesco.org/iiep

35
Chapter 3
Organizational structureand administration
The central institutions operating the student loans scheme in Thailandare: the Student Loans Scheme Committee (SLSC) and its administrativeoffice, the Krung Thai Bank (KTB); the Ministries of Education andUniversity Affairs, and the individual educational institutions themselves.Central control of the SLS lies with the SLSC; the KTB is responsiblefor banking arrangements. The SLSC apportions the annual student loansbudget between the Ministries of Education and University Affairs. Usingrather different allocation procedures, the two education ministriesallocate loans budgets to institutions within their purview (the MOE,mainly via its provincial offices) and have overall responsibility for loansdistribution to students enrolled in their institutions. The MOE alsoallocates loans budgets to educational institutions falling under the controlof other ministries. The actual allocation of loans to students is in thehands of the educational institutions themselves – secondary schools,the colleges and the universities.
Student Loans Scheme Committee
The SLSC, is the central body exercising overall control of thescheme; it is responsible for policy and the general working of the scheme,as well as for overall supervision and monitoring. The scheme startedoperations in 1996 under a cabinet regulation; the Student Loans SchemeAct was passed only in March 1998 (Student Loans Scheme Act, 1998)formally establishing the Student Loans Scheme as a legal body underthe jurisdiction of the Ministry of Finance (MOF).
Membership
Under the Act, the SLSC consists of the following members:
International Institute for Educational Planning http://www.unesco.org/iiep

36
Student loans in Thailand: are they effective, equitable, sustainable?
• Permanent Secretary, MOF (Chairman)• Permanent Secretary, MOE (Deputy Chairman)• Permanent Secretary, MUA (Deputy Chairman)• Director, Budget Bureau• Secretary-General, NESDB• Secretary-General, National Education Commission• Director-General, Internal Revenue Department• Director, Fiscal Policy Office• President, Private Higher Education Association• President, Private Education Association• Director-General, Comptroller-General’s Department (Secretary)• Manager, SLO (Assistant Secretary).
In addition, up to five additional committee members who are expertsin one of the fields of information technology, finance, accounting andlaw, may be appointed by the Minister of Finance.
Duties
The duties of the Student Loans Scheme Committee include: settinggeneral policy and controlling the overall operation of the Student LoansFund; assessing the annual budgetary needs of the fund and preparingthe annual budget proposal; setting the regulations, criteria and conditionsfor granting student loans and for loan repayment. It is also responsiblefor two appointments: that of the Loan Fund Manager, in charge of theStudent Loans Office and the day-to-day running of the scheme, and ofthe Loan Managing Director, responsible for maintaining individual loanaccounts. At the outset, the Krung Thai Bank (KTB) was appointed toundertake the latter function.
Functioning of the SLSC
Given its responsibility for setting general policy and controllingthe overall operation of the SLS, the central student loans committeeshould constitute the linchpin of the system. But for the SLSC to operatein accordance with its defined role, two conditions need to be satisfied.First, the appointed members of the committee should meet regularlyand, as a team, assume full control of the steering of the scheme throughproactive decision-making. Second, the SLSC needs to be served by anoffice and full-time professional staff, both in order for it to receive the
International Institute for Educational Planning http://www.unesco.org/iiep

37
Organizational structure and administration
necessary information on which to base decisions and to ensure that itsdecisions are fully implemented.
Most of the loans committee members are appointed through thekey national positions that they hold. To these may be added up to fiveindividuals, drawn from fields of expertise relevant to the work of theSLSC. In addition, some 20 representatives from organizations andministries are in attendance, but are not members. No doubt the intentionof the Act in appointing senior officials as members is to ensure that, inreaching major decisions, the SLSC takes account of diverse viewpointsand various interests. But the very seniority of the membership has beena stumbling block to the effective working of the SLSC. A review of theminutes of SLSC meetings shows that a number of ex officio committeemembers have not attended SLSC committee meetings with any degreeof regularity; instead, either they have been absent or represented bytheir junior staff.
This means that the appointed committee members as a group, inwhom national responsibility for the running of the loans scheme resides,in practice have not assumed their defined active role in running thescheme. Many individuals, particularly those not attached to the educationsector, attend the meetings and make their contributions to thedeliberations and decisions, but they are not formally responsible for themanagement of the scheme.
The problem of effective central control of the scheme iscompounded by the very slow progress in appointing the loans fundmanager and other full-time officials to run the scheme. Only in September1998 was the deputy manager appointed (not a statutory post), followedby that of the manager in December. Eighteen months later the managerresigned and was replaced six months later. Thus there has been aconspicuous lack of continuity in the overall management of the scheme.Initially, it operated for nearly three years without the input of a full-timemanager to run it on a day-to-day basis; subsequently it was run by anacting manager for half a year. During the crucial start-up period, anacting manager carried out these duties on a part-time basis in conjunctionwith other duties, with the result that many of the manager’s functions,such as steering the scheme and monitoring its development and targeting,were largely neglected. With so many institutional arrangements andprocedures already in place, there is a risk that the freedom of manoeuvre
International Institute for Educational Planning http://www.unesco.org/iiep

38
Student loans in Thailand: are they effective, equitable, sustainable?
of the managerial team to introduce structural change in the working ofthe scheme is limited, with the manager pressed to accept an adaptiverather than innovative role.
First and Second Payment Account Subcommittees
Under the Act, two additional committees play a central role inadministering the loans scheme: the First and the Second Payment AccountSubcommittees. The First Payment Account Subcommittee, located atand internal to the MOE, is responsible for the allocation of loan budgetsto educational institutions under the jurisdiction of the MOE as well asto educational institutions attached to other ministries. The SecondPayment Account Subcommittee is responsible for the allocation of loanbudgets to universities. There is a similar lack of attendance by appointedmembers at meetings of the First and Second Payment AccountSubcommittees, particularly for the MUA loans committee.
At present, the main brunt of the administrative effort of runningthe loans scheme falls on the MOE and the MUA; the small loans schemesections at these two ministries are understaffed, particularly at the MOE.A lack of suitable staff with data computing skills has seriously delayedthe development of a monitoring system; much available data, highlyrelevant for managerial purposes, remain unanalyzed.
International Institute for Educational Planning http://www.unesco.org/iiep

39
Organizational structure and administration
Figure 3.1 Student loans budget allocation
Banking functions
All of the banking functions of the loans scheme are undertaken onbehalf of the SLSC by the Krung Thai Bank (KTB), a commercial bankunder the supervision of the Thai Government. The KTB receives a feefrom the scheme for services provided. These include: managing the loanfund for the SLSC under various specified accounts, screening ofindividual applications (received via the educational institutions) andrelevant document and contract processing, the transfer of loans to students(via local KTB branches) and direct payments to educational institutions(for tuition and other school-related fees), responsibility for the loancollection process.
While the KTB has been charged with the development andmaintenance of a database, a necessary tool for monitoring and planning,most of the available statistical information relating to the working of
Student Loans Scheme Committee
MOE (First Payment Account
Subcommittee)
MUA (Second Payment
Account Subcommittee)
Central Loan Allocation
Provincial Loan Allocation
Non-MOE Ministries
Bangkok Department
Provincial Loan Committees
Universities
Departments Faculties
Educational institutions
Student loan applications
Student loan applications
Student loan applications
Student loan applications
Educational institutions
Educational institutions
International Institute for Educational Planning http://www.unesco.org/iiep

40
Student loans in Thailand: are they effective, equitable, sustainable?
the loans scheme is derived as a by-product of the banking functionsperformed by the KTB on behalf of the SLSC.
Allocating the national loans budget
Formally, the level of government commitment to the SLS is definedby that part of the national budget that is approved by parliament forallocation in each fiscal year to the Student Loans Fund, the revolvingfund concerned with the SLS.
Student loan recipients who apply for an additional loan to financestudy in the current academic year (‘old recipients’) are regarded asconstituting a fixed charge on the fund; loans tend to be renewed at thesame monetary level as of the previous year. The Budget Bureau estimatesthe budget allocation required for old recipients on the basis of the previousyear’s allocations. These allocations have risen each year, with theincreasing number of students entering the scheme. In contrast, there isbudgetary discretion with regard to new borrowers. With growing numbersof new loan recipients annually, unmatched by increases in budgetaryallocations to the SLS, a sharp decline in the value of individual loanshas resulted, both in real and in nominal terms. The figures will bepresented in the next chapter. This might seem to imply that the loansscheme is under-financed; however, in a real sense, the opposite is thecase. A dramatic expansion of the number of student loans, largelyuncontrolled from the centre, has resulted from insufficiently tight criteriafor loan eligibility and weak targeting; the scheme has now grownconsiderably beyond original plans.4
It was noted that the annual budgetary allocation for currentborrowers (‘old recipients’) is taken largely as given; these loans areautomatically renewed, as long as the old recipient remains eligible. Thusour attention will focus on the annual allocation of the loan budget fornew borrowers. This is allocated by the SLSC to the MOE and the MUA,which in turn allocate loan budgets down through their ministries. Theline of loan budget allocation for new borrowers is illustrated inFigure 3.1.
4. In 2001, in an attempt to hold down the budgetary cost of the scheme, the Ministry of Financeintroduced the rule that, for any educational institution, total loans distribution (the value oftotal loans for old and new borrowers) must not exceed 10 per cent of the value of loandisbursements in the preceding year (information provided by Professor Nonglak Wiratchai,8 May 2002).
International Institute for Educational Planning http://www.unesco.org/iiep

41
Organizational structure and administration
The SLSC is assigned an annual budget for new borrowers by theBudget Bureau. It decides on the eligibility criteria and maximum loanceilings and on the allocation of the budget between the First PaymentAccount Subcommittee (at the MOE) and the Second Payment AccountSubcommittee (at the MUA). Within the MOE, there are two allocationsubcommittees; the Central Loan Allocation Committee is responsiblefor the allocation of loans budgets to each department in the BangkokMetropolitan Area and to other ministries; the Provincial Loan AllocationCommittee allocates a loans budget to each of the 75 Provincial Officesof the MOE. In turn, these organizations allocate loans budgets to theeducational institutions under their control. In some provinces, theprovincial loans budget is allocated to the provincial specialistdepartments, which in turn allocate the institutional loans budgets. LoansCommittees at each educational institution/school distribute the loansbudget amongst eligible applicants; these committees work closely withlocal KTB branch offices in processing the loan applications.
The MUA allocates a loans budget to universities within its purview– public, private and open. Loans committees at the universities areresponsible for the administration and distribution of loans to studentsenrolled at their institution. At some universities, an additional budgetallocation stage is in place at the level of the faculty; at this level loansare distributed in practice, though the institution’s loans committee mustformally approve these loans decisions.
Financial planning
The budgetary allocation suffers from ineffective financial planningof the programme as a whole. The government fixes a largely arbitraryannual budget for new borrowers in nominal terms, without any attemptto measure loans need in terms of the objectives of the scheme. Allocatedbudgets are thus insufficient, not only because of the increasing demandfor loans but also because allocated loans budgets are falling in real terms.This in turn leads to changing criteria for granting loans and lower realaverage value of loans disbursed.
Since budget allocations are not based on student need this results,in turn, in loans officers at the provincial, departmental and institutionallevels having little incentive to engage in attempts at forward budgetaryplanning based on the number of potential needy students, an activity
International Institute for Educational Planning http://www.unesco.org/iiep

42
Student loans in Thailand: are they effective, equitable, sustainable?
that would improve the scheme’s ability to reach target groups. At theinstitutional level, many loan officers are unaware of the basis used forloans budget allocation, and are sceptical about the use of a formula,believing that political and other pressures were present. Moretransparency about loans allocation criteria and practice would improvethe understanding of the loans scheme at the institutional level.
In terms of financial planning, there is a need for a tentative long-range plan for loan budget size and allocation. This would be based onestimates of the number of needy students likely to require loans, byministry, provinces and institution. Unfortunately, no such forwardplanning is attempted.
The central purpose of the SLS, as outlined in the Act, is to offerfinancial assistance to poor students and to enlarge the educationalopportunities of youngsters from low-income families to continue theireducation, up to the level of the bachelor degree. These objectives can berealized only through a well-designed loans distribution system that targetsloans to reach the client population. Thus the question arises: how far isthe top-down loans budget allocation mechanism, described in the chart,consistent with the targeting objectives of the loans scheme? Indeed, thewhole concept of allocating a loans budget, down through successiveadministrative layers in the ministry, to the level of the educationalinstitution, may not be appropriate for a loans system at all. In allocatingan education budget, a major consideration is to ensure that a fair andappropriate budget is received at each administrative level, including theeducational institution itself. These considerations are not relevant for aloans scheme whose task is both to reach the needy student and also toensure that every poor student has the same opportunity to receive a loancommensurate with need. This will only happen if the loans allocationsystem is based on targeting the needy student; this would require thatthe loans budget received by the educational institution be proportionalto the number of needy students enrolled. The sections that follow examinethe extent to which targeting the needy student is incorporated into theloans budget allocation mechanism.
Loans budget allocation: the MOE-MUA split
The first stage of the process of loans budget allocation is the initialdivision of the annual loans budget for new recipients between the MUA
International Institute for Educational Planning http://www.unesco.org/iiep

43
Organizational structure and administration
and the MOE; the latter, in addition to its own institutions, is responsiblefor loans to students enrolled in educational institutions outside the twoeducation ministries. The MOE funds tertiary education institutions –teacher training colleges and technical institutions as well as upper-levelsecondary schools. The annual budgetary allocation to the MOE was setat 60 per cent in 1966 rising to two-thirds in 1998 where it has remained.Since this split is the first step in the budgetary allocation process, anunderstanding of the basis of the division is of more than passing interest.
The justification for the original 3:2 split is to be found in arecommendation from the National Education Commission to the MOF(ONEC, 1996). The recommendation was based on the ratio of totaleducation costs, in each ministry, of educating all new students enrolledin courses covered by the loans scheme (i.e. the number of new studentsat each level multiplied by the average educational cost at that level).But this allocation method, weighted by both the number of students andaverage educational costs in the two ministries, fails to take into accountthe poverty level of students and their families, and their ability to meeteducational expenses. Thus the initial allocation of the loans budgetbetween the MOE and the MUA is arbitrary, in terms of the targetingobjectives of the loans scheme; subsequent adjustments of the allocationratio have been ad hoc.
Yet while the MOE receives two-thirds of the budget for new loans,it accounts for over 80 per cent of the total number of borrowers; this isbecause MOE loans, at the secondary level particularly, are of smalleraverage size because of lower loans maxima and shorter duration of study.Detailed statistics on these issues are presented in Chapter 4. We nowmove forward to analyze the subsequent loans budget allocation withineach of the two ministries.
Loans budget allocation: the MOE
The MOE is responsible for the allocation of loans budgets to alleducational institutions both within the MOE and in other ministries (withthe exception of the MUA). An initial budget division is made betweenthe central allocation for educational institutions in the Bangkok areaand the Provincial Offices of Education, Religion and Culture (Figure 3.1).This division seems to be based on administrative criteria, unrelated tothe targeting objectives of the loans scheme.
International Institute for Educational Planning http://www.unesco.org/iiep

44
Student loans in Thailand: are they effective, equitable, sustainable?
Table 3.1 MOE loans budget allocation, 2000
Recipients Allocated to Number of Share of totalinstitutions budget allocation
MOE institutions, 8 MOE 278 8.9 %Bangkok departments
Non-MOE institutions 7 ministries 11 0.5 %in Bangkok
Institutions outside 75 provincial 3,747 90.6%Bangkok offices
All educational 4,036 100.0 %institutions(excluding MUA)
In 2000, over 90 per cent of the MOE budget allocation was assignedto the provincial offices (Table 3.1) for subsequent division amongst theactual educational institutions (upper-secondary schools and tertiary-levelcolleges) that assign loans to their students. Since the bulk of the MOEloans budget allocation goes to the 75 provincial offices, it is againinstructive to examine the criteria on which this inter-provincial budgetallocation is based.
This information is provided in Table 3.2, for each year of theworking of the scheme. While the allocation criteria used have variedfrom year to year, what is notable from the table is the very low weightgiven to levels of provincial poverty or other criteria related to theobjectives of the SLS. In 2001, the number of students in the province atthe upper-secondary level through to undergraduate level (excluding thoseat MUA institutions) was given a weight of 80 per cent. The povertylevel in the province, as measured by the average per capita income levelin the province, was accorded a weight of only 20 per cent. Thus not onlyis 80 per cent of the allocation weighting unrelated to targeting the poor,even the 20 per cent weighting given for provincial average income levelsis problematic, given that this measure constitutes only a blunt indicatorof poverty incidence. Better measures can be developed: in Chapter 6,we outline a method of measuring the relative incidence of poverty in theprovince, based on the number of poor children of upper-secondary-schoolage or on the number of poor upper-secondary students. While the poverty-
International Institute for Educational Planning http://www.unesco.org/iiep

45
Organizational structure and administration
related weighting was higher in the initial years of the scheme (1996-98), it was still less than a third.
The provincial offices allocate budgets directly to MOE educationalinstitutions within the province. Although there are general directives, inpractice, provincial offices have considerable freedom in deciding on themethod of loan budget allocation to the institutions. The poverty criterionis largely ignored in the absence of relevant data and most provincialoffices seem to rely on enrolment numbers. Some provincial offices (e.g.Khon Kaen) have added an additional tier to the allocation process andallocate loans budgets to provincial specialist departments rather thandirectly to the institutions.
Table 3.2 Criteria used to allocate MOE loan budgetsto the provincial offices
Year
Criterion 1996-1998 1999 2000 2001
Provincial student enrolment 60% 80%
Poverty level in the province 30%* 20%**
Provincial poverty and special 10% 20% 20%MOE policiesNumber of poor villages in the province 5%Special MOE policies – disabled etc. 5%Number of vocational students 5%Number of undergraduates 5%
Estimated number of loan applicants 80% 80%
* Provincial economic status (average household income).** Provincial average per capita income.
The MOE allocates a loans budget to each of the seven specialistdepartments serving the Bangkok area (in turn they allocate loans budgetsto their institutions); educational institutions attached to other ministriesreceive a budget direct from the MOE. In practice these allocations arebased largely on student numbers, but departments and other ministriescan present supportive arguments to justify additional budget allocations.
International Institute for Educational Planning http://www.unesco.org/iiep

46
Student loans in Thailand: are they effective, equitable, sustainable?
Loans budget allocations: the MUA
Unlike the hierarchical MOE loans allocation system, the MUAallocates its loans budget directly to the universities. The current allocationformula employs two criteria, with equal weighting. A university’s shareof the total MUA loans budget depends on the institution’s share of totalnew loan recipients in the previous year and on its share of total currentnew student enrolments. Modified criteria apply to the two openuniversities (Ramkhamhaeng and Sukhothai Thammathirat). The centralpoint of interest, once again, is that MUA allocation criteria are in noway related to student poverty within the university or to need.
Loan distribution
Criteria and conditions
Eligibility for a loan is defined by the SLSC in terms of householdincome. The ceiling defining a low family income was set at 120,000 bahtin 1996; since unallocated funds remained at the end of the first year ofthe scheme, the ceiling was raised to 300,000 baht in 1997. While theSLSC 300,000-baht threshold income remained in place until 1999, whenit was reduced to 150,000 baht, in practice the two education ministrieshave adopted different policies with regard to eligibility. The MUA usedthe SLSC ceiling but asked universities to give priority to students withfamily income falling below 150,000 baht. The MOE formally set amaximum income ceiling of 150,000 baht (though for the year 1999, theMOE requested institutions to give priority to students from familieswith an income ceiling of 120,000 baht).
These income ceilings were not defined objectively in terms ofpoverty incidence, as is necessary for the effective targeting of the poor.For example, in raising the income ceiling to 300,000 baht in 1997, theSLSC seemed to be aiming at the typical, rather than the poor, family.The justification for the 300,000-baht threshold was made out in termsof an average income level per head in 1997 of 77,501 baht, times four;this was because four is the typical family size (Minutes of the 5/1997meeting of the SLSC, 18 November 1997). Moreover, the use of differentincome ceilings has resulted in an inequitable reach amongst tertiary-level students enrolled in the institutions of the two ministries.
International Institute for Educational Planning http://www.unesco.org/iiep

47
Organizational structure and administration
The use of family income as the sole criterion for eligibility basedon household income is questionable. No weight is given to other factorsrelated to poverty or need, such as the number of family dependents(children and the aged), number of family members currently studying,whether head of household is female, private property owned and levelsof debt. Over time, more sophisticated measures of defining needy studentswill need to be developed.
The SLSC also defines the maximum-sized loan for different coursesof study and, within this, the ceilings for various expense categories.While the MUA uses the SLSC maxima, the MOE introduced lower loansceilings in 1997.
At the educational institution level, each institution sets its ownrules with regard to the actual level and composition of loans madeavailable to its students. Some institutions provide loans only for thetuition fee, some give smaller loans to new recipients as compared to theolder. This lack of consistency in practice across institutions leads tounjustified variability in the size of loan available to students with similarneed, a theme we develop further in later chapter. It also leads to abuse:since loans for tuition are paid directly to the educational institution,local loans committees (particularly at private institutions) have a clearincentive to distribute loans budgets as tuition loans only, to a largernumber of applicants.
Loans application process
The administrative issue that seems to have attracted most attention,and criticism, is the rather lengthy process of applying for a loan. This isperhaps inevitable; the process not only screens for eligibility, but alsosecures guarantors for the loan.
All applicants submit an application form together with: a statementof family income (certified by a government official, at least level 5, orthe village head); a statement of guaranty, countersigned by the guarantor(the student’s parent or guardian); a copy of the household record; thestudent, the parents’ and the guarantor’s identification cards; and theschool grades transcript. Subsequently, loan recipients must sign a loancontract with their educational institutions and deliver a copy to the KrungThai Bank (KTB), for vetting and approval. Approximately 60 days afterdelivery of the contract to the KTB, the student should receive the first
International Institute for Educational Planning http://www.unesco.org/iiep

48
Student loans in Thailand: are they effective, equitable, sustainable?
payment (credited to a KTB bank account) for the monthly allowanceand accommodation expenses; tuition-fee loans are paid directly to theeducational institution.
The loan application process has been the source of many problems,including time-consuming activities on the part of parents and students,delays both in obtaining loan approval and in the receipt of allowances.The Committees of the First Payment Account (MOE) and the SecondPayment Account (MUA) have made efforts to solve these problems.The MOE and MUA organize meetings of key institutional loan officersand visit schools/institutions to help clarify the administrative process.But overall, these efforts have been largely ad hoc and reactive, ratherthan sufficiently proactive and planned ahead of time.
Many of these problems of process are in the nature of teethingproblems and are being solved over time. Some unresolved issues remain.Inadequate checking of declared family income results in loans beinggranted to students from families with declared incomes within the legallimits but in practice in excess of the loans criteria. Low administrativebudgets have slowed down the process of home visits and general spot-checking of the information provided on application forms, particularlythat related to need. A lack of computer facilities at many educationalinstitutions, particularly upper-secondary schools, leads to a slowthroughput in dealing with applications, documentation and reporting,much of which is done manually.
The overall impression is of a loan application process that has beendesigned and implemented without sufficient preparation and planning.As problems arise, the process is adapted to achieve more satisfactoryoutcomes. For example, at first parents were required to travel from theirhometown to the institution where the student studied in order to sign thecontract; in order to reduce travel time and cost, since 1998 they are ableto sign in their hometown in the presence of the local officer.
Loans distribution: the role of educational institutions
In the Thai loans scheme, the distribution of student loans is highlydecentralized. It is at the level of the individual educational institution,be it school, institute or university, that loan applications are received,screened and processed. Each institution receives a loans budget
International Institute for Educational Planning http://www.unesco.org/iiep

49
Organizational structure and administration
allocation. The institution selects those applicants who will receive aloan and, within the limits set by the ministry, decides on the individualloan size and its composition, in terms of expenditure categories. Formally,institutional loans committees distribute the loans; these committeesconsist of senior officers of the institution together with independent,outside members. However, it is the institutional loans officers who runthe scheme in practice. In some of the larger institutions, particularly thelarge universities (such as Thammasart University or the Ramkhamaengopen university), there are full-time loans administrators responsible forrunning the loans scheme at the institution. But for the vast majority ofinstitutions, particularly the MOE schools and institutes, loans officersare part time, combining these duties with other administrative,counselling, or teaching activities. No budgetary allocations are madefor these staff costs, which are absorbed by the institution. With theincreasing workload, seasonal pressures may be very heavy, though smalladministrative budgets provide for clerical assistance.
Individual institutions are granted an extensive degree of autonomyin the distribution of loans budgets, with the result that distribution policiesdiffer widely from institution to institution. Some institutions focus onthe very poor, while others distribute smaller loans to a larger number ofrecipients, including the less poor. Abuse is not uncommon at privateinstitutions which have a vested interest in spreading loans widely, tocover tuition costs only, for a larger number of students with the aim ofaugmenting enrolments. The result is that, in many cases, poorer studentsdo not receive the loans to cover living expenses that it is the intention ofthe SLS to provide. Such decentralized decision-making, leading todiffering outcomes for students of similar background and need acrossinstitutions, appears to be inappropriate for the distribution of loans; issuesof horizontal equity and fair treatment are grossly neglected.
Against this, it is recognized that a major strength of the presentsystem lies in the ability to target the poor student at the institutionallevel, particularly when the institution is of small size, as at upper-secondary schools. Indeed, at the secondary-school level schoolcounsellors, doubling as loans officers, have a close knowledge of thesocial and financial backgrounds of their students. This familiarityfacilitates the vetting and ranking of applicants (and the rejection ofineligible applications). But it also allows loans officers to take a more
International Institute for Educational Planning http://www.unesco.org/iiep

50
Student loans in Thailand: are they effective, equitable, sustainable?
proactive stance in encouraging poor students to apply, thus extendingthe reach of the scheme. However, the problem of horizontal equity acrosssecondary-level institutions (and the lack of equality of opportunity toreceive a loan) remains.
Loan repayment
Following a two-year grace period after completion of studies,borrowers are required to begin repayments. The KTB is the central organfor debt collection. Due borrowers are required to report job and salarystatus to the KTB within 30 days after starting employment. The KTBinforms borrowers of amounts to be paid a month before the due date.Follow-up by mail and phone is made of borrowers who fail to repay.
The first round of repayments began in July 1999, following thetwo-year grace period: currently a third cohort of borrowers has begunrepayment. As discussed in the following chapter, non-repayment is high;about a third of due repayments was not received from the first tworepayment cohorts. Thus far, the SLSC has been reluctant to turn to theguarantor for repayment; the guarantors are usually the student’s parents– by definition, low earners. Consideration is now being given to thepossible use of credit rating as a device for discouraging default byrecalcitrant borrowers. Also, assignment of responsibility for repaymentcollection to the Department of Inland Revenue is being urged in manyquarters; the Inland Revenue may well be better placed than the KTB totrack the location of non-paying borrowers.
Concluding remarks
The central purpose of the SLS, as outlined in the Act, is to offerfinancial assistance to poor students and to enlarge the educationalopportunities of youngsters from low-income families to continue theireducation, up to the level of the bachelor degree. These objectives can berealized only through a well-designed loans distribution system that targetsloans to reach the client population. Unfortunately, the loans allocationmechanism adopted by the scheme is not designed to achieve this purpose.
Rather than using a centralized loans clearing-house to serviceindividual loans applications from potential borrowers, loans aredistributed to students at the level of the educational institution. Each
International Institute for Educational Planning http://www.unesco.org/iiep
51
Organizational structure and administration
institution receives a loans budget, through a top-down allocationmechanism that has been superimposed on the organizational andadministrative structure of the education system. This allocationmechanism poorly serves the twin objectives of targeting needy studentsand horizontal equity.
The allocation of the loans budget by the SLSC to the MUA and theMOE, and the subsequent allocation of loans budgets down the line, islargely arbitrary in terms of targeting needy students. This is true also ofthe MOE allocation of loans budgets to provincial offices, even thoughthe criteria for allocation to the provinces formally include a poverty-related element.
The MOE is considerably stricter than the MUA in setting criteriafor loans distribution in terms of the maximum size of loan and thepurposes for which loans may be made (particularly in relation toaccommodation). This leads to considerable inequalities in treatment offirst-degree students across the two ministries. Even within the sameministry the system lacks horizontal equity because of the lack of objectivecriteria (in terms of targeting) in the allocation of loans budgets toinstitutions and the widely differing institutional loan distribution policies.Individual youngsters, with similar need, receive dissimilar treatment,even when enrolled in the same type of institution. These themes will betaken up further in Chapter 6.
Finally, it is not known how far targeting is successful overall, northe extent of horizontal inequity; such vital information will not beavailable until an appropriate database is built and a monitoring systemput in place.
International Institute for Educational Planning http://www.unesco.org/iiep

International Institute for Educational Planning http://www.unesco.org/iiep

53
Chapter 4
Main lines of development:a statistical account
Against the background provided by the preceding institutional accountof how the SLS operates, this chapter traces the main lines of developmentof the scheme over its first five years of operation. It will be argued thatthis development has not been uniform; an initial period of ‘unbridledgrowth’ until 1999, with weak control from the centre and poor financialplanning, has now given way to one of ‘realistic contraction’. Theunderlying causes of these developments and their consequences will beexplored in this chapter.
Plans versus outcomes
Table 4.1 presents data on the outcomes of the scheme, in terms ofnumber of borrowers and total loans expenditure, in relation to originalplans. Information on the planned number of borrowers (column 1) isdrawn from the MOF planning document (Ministry of Finance, 1995) onwhich the scheme was based. The plan envisaged a build-up of loanrecipients in the early years, reaching a steady state of 300,000 borrowersin the fourth year of the scheme. These plans, which were revised upwardsover time, have been overtaken by events. The 300,000 borrowers targetwas exceeded in the second year of the scheme; currently the target numberof borrowers is outstripped by a factor of 3.
International Institute for Educational Planning http://www.unesco.org/iiep

54
Student loans in Thailand: are they effective, equitable, sustainable?
Table 4.1 Number of borrowers and total loans expenditure:planned and actual
Number of borrowers Loans expenditure (baht billion)
(1) (2) (3) (4) (5) (6)Year Planned* Actual** = (2/1) Planned* Actual*** = (5/4)
1 132,000 149,311 1.13 4,000 3,653 0.91
2 214,000 435,425 2.03 10,726 12,151 1.13
3 278,000 748,190 2.69 14,592 19,443 1.33
4 300,000 883,704 2.94 16,750 23,746 1.42
5 300,000 903,228 3.00 17,588 24,449 1.39
6 300,000 18,468
7 300,000 19,391
8 300,000 20,360
* As set out in MOF Loans Scheme Planning Document (MOF, 1995). ** As reported in Appendix Table 1. *** Allocated budget.
The scheme was planned originally to cover some 9 per cent ofenrolments at each education level; the coverage of the scheme is far inexcess of this. By 1998, overall coverage exceeded 23 per cent of allenrolments and is currently in excess of 26 per cent; for some educationalprogrammes, such as Rajabhat institutes, coverage exceeds 50 per cent.Coverage of the scheme is discussed more fully below.
In contrast to the growth in the number of borrowers, actual loansexpenditures have risen at a far slower pace. Table 4.1 shows plannedloans expenditures (with an assumed 5 per cent increase in the rate ofindividual student loans, in line with expected inflation) and actual loansexpenditures. While planned and actual loans expenditures were broadlyin line for the first two years of the scheme, actual loans expenditureshave since forged ahead and by the fourth year of the scheme (1999)were over 40 per cent in excess of planned levels.
A number of conclusions may be drawn from Table 4.1. The presentscope of the scheme is very considerably in excess of that planned,particularly in terms of the number of borrowers. The slower growth of
International Institute for Educational Planning http://www.unesco.org/iiep

55
Main lines of development: a statistical account
total loans expenditures is indicative of a much lower level of individualstudent support than originally envisaged, and this has been decliningover time. A major theme of this paper, which will be developed morefully in this chapter, is that there has been an insufficient commitment offunds to the scheme in relation to the uncontrolled growth in demand forloans. The brunt has been borne each year by new loans applicants, interms of a reduced, and declining, average loan size.
National loans scheme budget
The main budgetary developments are displayed in Table 4.2. Whilethe main pattern of spending seems to be quite clear – an increase in thelevel of expenditure at a declining rate over time, as the scheme buildsup – we shall argue that in reality the details contained in Table 4.2 reflect,on the contrary, a decreasing level of government commitment to theloans scheme, particularly after 1998. Confusion concerning the financialcommitment to the loans scheme often arises because the informationreported may be based on varying definitions. The figures may relate tothe fiscal year (October to September) or the academic year (May toApril); they may be presented on the basis of a semester or for the wholeacademic year; most important, they may comprise all loan recipients oronly new borrowers. Table 4.2 presents details of expenditure under theloans scheme, employing alternative definitions.
Formally, the level of government commitment to the SLS is definedby that part of the national budget that is approved by parliament forallocation to the revolving fund concerned with the loans scheme. Thisannual allocation, which covers the fiscal year, is shown in the top blockof Table 4.2. These fiscal year allocations may be redistributed accordingto the academic year, the actual calendar period covered by individualloans; this is shown in the second block (budget allocation in academicyear). In block 3, data on actual loans disbursement to students (byacademic year) are provided. In all three cases, a sharp upward trend isshown for the initial years 1996-98 as the scheme builds, subsequentlylevelling off; this closely parallels the growth pattern in the total numberof student borrowers (block 4).
However, this increase in total loans funding, and in the total numberof borrowers, does not indicate a healthy expansion of the scheme. Toexplain why this is so, a brief comment is necessary on how the annual
International Institute for Educational Planning http://www.unesco.org/iiep

56
Student loans in Thailand: are they effective, equitable, sustainable?
budgetary allotments are made, and in particular on the different treatmentaccorded to applications from current student borrowers for loan renewalto continue their studies (‘old recipients’) and to first-time borrowers.The former are automatically approved (subject to satisfactory academicperformance), at the same monetary level as the previous year; the totalbudgetary provision for old loan recipients is based on previous-yeartotal loan disbursements. Thus loans allocation for established borrowersconstitutes a fixed budgetary commitment.
Table 4.2 Total annual budget allocations and loans disbursement:1996-2002 (million baht)
Fiscal year 1996 1997 1998 1999 2000 2001 2002
1Budget allocation 3,000 8,450 18,300 20,000 25,600 28,000 28,000
Academic year 1996 1997 1998 1999 2000 2001*
2Budget allocationOld recipients - 3,500 15,300 17,000 24,000 24,500New recipients 6,000 9,900 6,000 6,000 3,200 7,000Total +2,500** +100*** +900**
6,000 13,400 23,800 23,100 28,100 31,500
3Loan disbursementOld recipients - 3,925 11,499 17,929 20,552New recipients 3,653 8,226 7,943 5,817 3,898Total 3,653 12,151 19,442 23,746 24,450 28,252
4Loan recipients(Number)Old recipients - 113,797 341,460 593,712 660,392New recipients 149,311 321,628 406,730 289,992 242,836Total 149,311 435,425 748,190 883,704 903,228 918,147
Source: SLSC report submitted to the Cabinet (30 April, 2001).* For academic year 2001, as of 30 November 2001.** Supplementary allocation.*** Special ADB payment for MOE loans.
International Institute for Educational Planning http://www.unesco.org/iiep

57
Main lines of development: a statistical account
In contrast, considerable budgetary discretion is available for totalallocations for new borrowers. For the early years (except for a temporaryincrease in 1997) the initial allocation has been fixed arbitrarily at 6,000million baht in current terms, though in practice supplementary allocationshave been made in 1998 and 2000.5 More telling than budgetary allocationsare the figures on the amount of actual loan disbursements (block 3).While disbursements for old borrowers and total disbursements roseannually, disbursements for new borrowers reached a peak in the secondyear of the scheme and have declined annually since. This decline intotal loans disbursement for new recipients is paralleled in an initial riseand subsequent fall after 1998 in the number of new borrowers and theaverage size of loans received; data are presented in following sections.
Table 4.3 Annual budget surplus (budgeted allocation less loansdistribution) (million baht)
Fiscal year
1996 1997 1998 1999 2000 2001
Surplus 1,174 584 2,503 -1,595 1,717 30
Source: Budget Bureau.
Annual total budgetary allocations have exceeded totaldisbursements in most years (1999 was a notable exception) giving riseto sizeable annual budget surpluses; until now, these have beenaccumulating at the KTB as unused reserves (Table 4.3). For the fiscalyear 2002, where total loans expenditure needs have been estimated inexcess of 30,000 million baht, budgetary allocations have been set at28,000 million baht, the difference to be made up from the loans fund’sreserves. The annual excess of budgeted loans allocation overdisbursements stems from a continuing overestimation of the collectivebudgetary needs of old recipients.
5. This fixed nominal allocation of 6,000 million baht was not based on any realistic examinationof the expected student demand for new loans. The original budgetary justification, preparedby the MOF (responsibility for budget preparation passed to the loans office when it wasestablished), is made out in terms of supplying loans to 100,000 new borrowers, at an averageloan value of 60,000 baht. These figures, which appear to have been drawn from early planningdocuments, have no relation to actuality; for example, in 1997 there were already well over300,000 new loan recipients, with an average loan size of only some 30,000 baht.
International Institute for Educational Planning http://www.unesco.org/iiep

58
Student loans in Thailand: are they effective, equitable, sustainable?
Number of borrowers and loans disbursement
Given the size and trends in annual budgetary allocations anddisbursements, we now examine the working of the SLS through a moredetailed statistical review of the scheme.
MOE and MUA compared
Following the initial allocation of the student loans budget to theMOE and MUA, subsequent loans budget allocation to the educationalinstitutions and detailed loans disbursement is the responsibility of thetwo ministries. Details of the inter-ministerial split, in terms of thepercentage distribution of actual loans disbursements (rather than loansbudget allocations) and the number of borrowers are shown in Figure 4.1;detailed statistics are presented in the Statistical Appendix (AppendixTable 6).
The figure shows a declining share of upper-secondary educationover the period 1996 to 2000, in terms of number of borrowers and totalsize of loan disbursements (from 63 to 47 per cent and 46 to 21 per cent,respectively). In contrast tertiary education, whether at MOE or MUAinstitutions, has captured a growing share of borrower numbers and loandisbursements. While the share of the upper-secondary-school sector intotal number of borrowers is about double its share in total loansdisbursement, the very opposite is shown for MUA (university)institutions; the shares are approximately matched for MOE tertiaryinstitutions, at about a third. This implies a relatively small-sized loanfor secondary-school borrowers and a large one for university students;this, in turn, means proportionally higher administrative costs per MOEloan, particularly at the upper-secondary level.
International Institute for Educational Planning http://www.unesco.org/iiep

59
Main lines of development: a statistical account
Figure 4.1 Number of borrowers and total loan disbursements:MOE and MUA, percentage distribution, 1996-2000
Percentage70.00
60.00
50.00
40.00
30.00
20.00
10.00
0.001996 1997 1998 1999 2000 1996 1997 1998 1999 2000
Number of borrowers (%) Loans disbursement (%)
MOE-Upper secondary MOE-Tertiary MUA-Universities
Coverage
With the growth of the loans scheme over time, it has reached anincreasing proportion of students enrolled in the programmes covered bythe scheme. Appendix Table 2 provides details of the coverage of thescheme, according to different types and levels of educational provision.Percentage coverage is defined as follows:
Coverage = (Number of loan recipients/Student enrolment) (100).
Figure 4.2 shows the situation in 2000 for the six major educationprogrammes for which student loans are available. About a quarter ofstudents at the upper-secondary level of schooling (general and vocationaleducation) receive loans. For MOE tertiary education, coverage is muchhigher; it exceeds 40 and 50 per cent for upper-vocational education andfor undergraduate studies, respectively. While somewhat over a quarterof all university students are in receipt of loans, this average figure masksconsiderable differences in coverage between the public and privateuniversities and between open and closed public universities.
International Institute for Educational Planning http://www.unesco.org/iiep

60
Student loans in Thailand: are they effective, equitable, sustainable?
Nearly 37 per cent of students enrolled at private universities receivea loan compared with less than 13 per cent of students at publicuniversities, as a whole. Yet while over a third of all loans to publicuniversity students accrue to students enrolled at the two public openuniversities, coverage is low (Table 4.4). Some 9 per cent ofRamkhamhaeng Open University students, and only a handful ofSukhothai students receive a loan, compared with some 30 per cent ofstudents enrolled at closed public universities. The minimal coverage atSukhothai Open University is to be expected, given that it is based ondistance learning for part-time students. The reasons for low coverage atRamkhamhaeng are less clear, given that most students are full-time andteaching is based on formal lectures at the Bangkok campus; low coverageseems to be the result of an inadequate loans budget allocation from theMUA.
Figure 4.2 Student Loans Scheme coverage, 2000 (%)
26.9%23.0%
40.0%
51.1%
12.7%
36.9%
60.00
50.00
40.00
30.00
20.00
10.00
0.00
Percentage
MOE –Upper
secondary
MOE –Lower
vocational
MOE –Upper
vocational
MOE –Under-
graduate
MUA –Public
universities
MUA –Private
universities
In 2002, for the first time, the absolute number of loans to privateuniversity students, and the percentage loans coverage, exceeded thoseat public closed tertiary education; the Thai scheme is unusual in termsof its sizeable impact on the private education sector. At the tertiary level,loan coverage at MOE (public) institutions and at MUA privateuniversities is high, somewhat greater than coverage at the closed public
International Institute for Educational Planning http://www.unesco.org/iiep

61
Main lines of development: a statistical account
universities, which are the usual focus of loans schemes. This patternreflects, in part, the elite status of the public universities. Competitiveentry to public universities militates against the chances of youngstersfrom less advantaged backgrounds – with poorer schooling preparation –securing a university place within the public sector (apart from at theopen university). Rather, many veer towards (lower quality) non-university, MOE tertiary institutions or to the expensive private sector.The inequity of the system is apparent.
Table 4.4 Number of loan recipients and loans coverage, open andclosed public universities and private universities, 2000
University type Number of loan recipients Loan coverage (%)
Open public universitiesRamkhahaeng Open University 36,757 9.1Sukhothai Open University 51 < 0.1
Closed public universities 65,771 30.5
Private universities 70,306 36.9
At the upper-secondary level, too, loans coverage amongst studentsenrolled in private institutions is high. While only a very small percentageof students enrolled in upper-secondary schooling attend private schools,a third of vocational students do so, under the jurisdiction of the PrivateEducation Commission. Over 40 per cent of students enrolled in privatelower-vocational education receive loans.
New versus old loan recipients
The growth in the total number of loan recipients hides some of themore important underlying trends, and particularly the inequitabletreatment accorded to new borrowers. This is illustrated in Figure 4.3; amore detailed breakdown is given in Appendix Tables 1 and 4. The upperpanel shows the total number of borrowers year-by-year, for the threemain recipient groups – MOE upper secondary and tertiary anduniversities. For all three groups, the number of recipients grew rapidlyin the initial years as the scheme built up, subsequently levelling offtowards a steady state (though a small percentage decline was registeredfor upper-secondary schooling in 2000); a similar picture emerges forfiner educational categories (Appendix Table 1).
International Institute for Educational Planning http://www.unesco.org/iiep

62
Student loans in Thailand: are they effective, equitable, sustainable?
A very different picture emerges from the lower panel, relating tonew loan recipients only. For all three education groups the number ofnew borrowers grew each year over the three-year period 1996-1998, butthen declined: this trend is evidenced also in the finer breakdown containedin Appendix Table 4. This initial sharp rise in the number of new borrowers,followed by falling numbers of new recipients is paralleled in the datapresented above in Table 4.2 for annual budget disbursements for newborrowers. Rising total loans allocations and numbers of new borrowersmask a declining government commitment to the scheme, reflected inlower budgetary allocations for new loans and falling numbers of newborrowers. This is the case for all the major educational programmes(Table 4.5). For each education category, loan disbursements rise initially(shown in bold), reach a peak and thereafter decline (italics); the peak isreached in 1998 for lower-level qualification and in 1997 for higher ones.
Table 4.5 Total loan disbursement by education category (‘000 baht)
Education category Academic year
1996 1997 1998 1999 2000
Upper-secondary general 858 1,249 1,360 1,110 683
Lower vocational 771 1,547 1,790 1,288 864
Upper vocational 570 1,456 1,493 969 696
Diploma 48 133 96 58 37
MOE undergraduate 382 1,018 718 423 369
Public university 652 1,558 1,222 957 567
Private university 475 1,264 1,255 1,005 678
International Institute for Educational Planning http://www.unesco.org/iiep

63
Main lines of development: a statistical account
Figure 4.3 Number of loan recipients: total and new,1996-2000
300 000
250 000
200 000
150 000
100 000
50 000
0
500 000
450 000
400 000
350 000
300 000
250 000
200 000
150 000
100 000
50 000
0
Students
Students
Total recipients
1996 1997 1998 1999 2000
1996 1997 1998 1999 2000
New recepients
MOE – Upper secondary MOE – Tertiary MOE – Undergraduate
International Institute for Educational Planning http://www.unesco.org/iiep

64
Student loans in Thailand: are they effective, equitable, sustainable?
Parallel developments may be seen in an examination of the trendsin average loan size displayed in Figure 4.4 (more details are furnishedin Appendix Table 5). The figure compares the average size of loanreceived by new and old borrowers, by major education categories, forthe period 1996-2000. There are two main features displayed in the figure.The first is the general tendency for loan size to decline over time; this istrue for both new and old loan recipients (except for new recipients attertiary-level education in 1997). The second is that, with the exceptionof university courses in 1997, the average size of loan for new borrowersconsistently falls short of loan amounts received for the same courses byold borrowers. Total loan disbursements for 1996-2000 are given inAppendix Table 3.
Figure 4.4 Average loan size, new and old recipients,1996-2000
100 000
90 000
80 000
70 000
60 000
50 000
40 000
30 000
20 000
10 000
0
1996
1997
1998
1999
2000
1996
1997
1998
1999
2000
1996
1997
1998
1999
2000
1996
1997
1998
1999
2000
Baht
MOE – Uppersecondary
MOE – Tertiary MOE – Publicuniversities
MOE – Privateuniversities
New Old
Two periods – ‘heady expansion’ followed by ‘steadyingcontraction’
The underlying theme of this section is that an examination of thestatistics relating to the development of the SLS during its first five yearsindicates that there have been two very contrasting periods of operation.
International Institute for Educational Planning http://www.unesco.org/iiep

65
Main lines of development: a statistical account
The first period, from 1996 to 1997/1998, was one of ‘headyexpansion’. A combination of minimal planning and weak control fromthe centre, combined with over-generous loan eligibility and repaymentconditions, led to a substantial and unplanned growth in loan recipientnumbers and unexpected, and unsustainable, funding obligations by thestate. Since the SLS was committed to maintain its support for currentborrowers, the main burden of contraction, when the brakes were applied,was borne by new borrowers in terms of lower loan budget allocations,fewer available loans and loans of smaller size. This second period of‘steadying contraction’ has been one in which the efficacy of the loansscheme has been diminished, with the erosion in the real, and nominal,value of individual loans and increasing horizontal inequities acrossstudent cohorts (issues of equity will be developed further in Chapter 6).
Loan repayment
Given that the loans scheme was introduced as recently as 1996and, in addition, borrowers are granted a two-year grace period beforebeginning repayment, it is only recently that data on loan repayment havebegun to be generated. Repayments are due in July of each year. Currently,three cohorts are required to make repayments to the fund – those whowere due to start in 1999, 2000 and 2001 (respectively, 23,000, 77,000 and154,000 borrowers). Since collection for 2001 relating to the three cohortsbegan in July and is still in progress, the data for 2001 are incomplete.Hence, we present information for the first two years of collection only(relating to borrowers who started repayment in either 1999 or 2000).
Table 4.6 presents loan repayment statistics as of end of June 2001,relating to some 100,000 borrowers; they will have taken out loans for eitherone or two years only and, in the case of those completing upper secondary,will not have gone on to tertiary education with additional loans. The tableprovides a mixed picture. During the two-year period, 74 per cent of borrowersmade payments to the SLF. While 5 per cent underpaid (though repaying onaverage about 70 per cent of the sum due at that time), about a quarter ofborrowers made payments considerably in excess of the amounts due, someeven paying off the total loan and closing the account. Over a quarter of allborrowers failed to make a single repayment.
Looking at the amounts involved, of 69.48 million baht due to berepaid, 48 million baht were received in payment; this represents a
International Institute for Educational Planning http://www.unesco.org/iiep

66
Student loans in Thailand: are they effective, equitable, sustainable?
payment default of about 31 per cent of the sum due. However, 158 millionbaht were received in practice, most of which was due to payment inexcess of repayment obligations at that point of time. These excesspayments of nearly 111 million baht considerably exceed repaymentdefault. So while, formally, a 30 per cent default rate was in evidence,the scheme was not in deficit on receipts, because of excess repaymentsmade by a proportion of borrowers. However, loan repayments reportedin Table 4.6 relate to relatively small-sized loans, for one or two yearsonly; the low repayment burden may have encouraged prepayment. Overtime, excess repayments may be expected to diminish, in line with theincreasing size of loans (extending up to six years) and consequent higherrequired annual repayments.
Table 4.6 Loan repayments, cohorts with repaymentsdue to commence in 1999 and 2000
Borrowers obliged to make repayments Number %
A: Borrowers repaying required amount only 43,030 43.15
B: Borrowers paying in excess of amount due 25,294 25.36
C: Borrowers repaying less than amount due 5,246 5.26
D: Defaulters 26,160 26.23
Total borrowers 99,730 100.0
Repayment million baht Percentage ofpayments due
Payments received from Group A 28.32 40.76
Due payments received from Group B 15.31 22.04
Payments received from Group C 4.41 6.35
Total due repayments received 48.04 69.14
Non-payment (amount in default) 21.44 30.86
Total payments due 69.48 100.00
Excess payments by Group B 110.62 -
Nevertheless, despite a contractual obligation, over a quarter ofborrows failed to make any repayment; this issue needs to be addressedseriously. Virtually all borrowers who made no payments were individualswith whom the KTB had failed to make contact; in addition, a few had
International Institute for Educational Planning http://www.unesco.org/iiep

67
Main lines of development: a statistical account
died or had applied for repayment deferral because of low earnings –below 4,700 baht a month. The key issue here is whether non-payment isdue to recalcitrant behaviour of former students or to low income; or isthe issue one of identifying the whereabouts of former students who arelost to the information system and making appropriate requests forpayment? To probe these issues, the KTB organized a ‘homes visit’ survey,in the summer of 2001 (see Table 4.7), of all 5,000 non-payers in the1999 repayment cohort; a survey questionnaire was administered by localKTB branch officials. The purpose of the home visit follow-up wastwofold: firstly, to explore the reasons for non-payment and to encouragecompliance; secondly, to signal to debtors that the SLO and the KTBintend to keep a close watch on, and contact with, non-payers.
First results of the survey have recently become available. Althoughthe non-response was minimal, for the most part KTB representativesmet with parents or relatives rather than with the loan recipientsthemselves – only some 850 loan recipients were reached, suggestingthat the information received was not always accurate. However, takenat their face value, some of the results are highly suggestive. Details ofmonthly income received are given in Table 4.7. The responses receivedindicate that the bulk of non-paying loan recipients was not obliged tomake repayments at the present time; over a third had no income andnearly a further 30 per cent were in receipt of monthly income below4,700 baht. Lack of income does not necessarily indicate unemployment;the number reporting ‘no income’ is closely matched by the numberspresently studying (but presumably not currently in receipt of a loan).
Table 4.7 Income of non-payers, 1999 repayment cohort
Income range (monthly) Number Percentage of responses
No income 1,168 34.95
4,700 baht or less 964 28.85
4,701 baht or above 1,210 36.20
Total responses to income question 3,342 100.00
Non-response 1,624 -
Total homes visited 4,966 -
Source: KTB Home Visit Survey, 2001.
International Institute for Educational Planning http://www.unesco.org/iiep

68
Student loans in Thailand: are they effective, equitable, sustainable?
Thus, on the basis of the limited evidence available from the firstyears of repayment under the scheme, it appears that the way forwarddoes not lie in the direction of the introduction, and use, of legal or othersanctions against defaulters. Genuine default is significantly lower thanis suggested in the official figures presented in Table 4.6. Much of theformal repayment default is in fact allowable under the loan agreement;this may lead to delays in the receipt of loan repayment rather than tooutright losses to the SLS. However, delayed repayments also imply areduction in the financial efficacy of the SLS as it now stands – we turnto financial issues in the next chapter.
International Institute for Educational Planning http://www.unesco.org/iiep

69
Chapter 5
Financial analysis
The preceding sections have argued that the SLS, as now constituted, isfound to be seriously lacking in a number of respects, in particular inrelation to current administrative arrangements; the next chapter pointsto additional problems in terms of targeting and horizontal equity. Someof these problems are to be seen as inevitable ‘teething troubles’ that faceall new organizations and administrative structures; other problems aremore fundamental and stem from deficiencies in the design of the scheme,in turn largely a result of the haste with which the scheme was set up.The first group of shortcomings may be solved with relative ease by minorchanges in the working of the scheme and over time many of the problemshave been addressed, albeit on an ad hoc basis. Others (particularly inrelation to targeting and equity) are more basic and will require a moreradical reform of the scheme as a whole.
Assuming that these issues are suitably dealt with, there will stillremain a more fundamental issue, which constitutes the central concernof the present chapter: this is the financial viability of the SLS.Surprisingly, little attention seems to have been paid to this issue. Yet wehave noted that sums involved are very large; annual loan allocationsnow exceed 30 billion baht (a sum equivalent to some 14 per cent of thenational education budget). This chapter has four parts. The first partpresents background information on formal conditions for receiving aloan. The second part is concerned with the individual borrower’s loanaccount. The question posed is: how much of a loan does a typical studentrepay to the fund? The third section asks the question: what proportionof a typical loan is likely to be recovered by the loans fund after takingaccount of the probability of repayment default and administration costs?Building on these findings, a final part draws conclusions concerning theoverall financial viability of the SLS.
A self-financing student loans scheme requires initially large andgrowing disbursements, as the scheme builds up. In principle, total
International Institute for Educational Planning http://www.unesco.org/iiep

70
Student loans in Thailand: are they effective, equitable, sustainable?
disbursements should then level off as the first cohorts of borrowerscomplete their studies and exit the education system; subsequently theloans fund becomes self-sustaining as loan repayments increasinglyfinance the loans to new borrowers.
In practice, such a positive outcome is highly unlikely. An extremelylow (1 per cent) interest rate, repayments in nominal (rather than real)terms; a lengthy repayment horizon of 17 years (including a two-yeargrace period); administrative costs and inevitable default: all these factorscombine to produce a highly subsidized loans scheme. It was found, onthe basis of computer simulations, that current repayment conditions implythat the typical borrower will return only about 20 per cent of the loanreceived, in real terms (implying the receipt of a hidden grant equivalentto some 80 per cent of the value of the loan). Moreover, the expectedburden of repayment is extremely light for the typical student. Annualrepayments out of annual income will be in the range of 2-3.5 per centonly. These calculations point to an overly generous loans scheme,providing borrowers with unnecessarily highly subsidized loans, whichmay be repaid effortlessly out of higher income received on completingcourses of education.
The overall recovery ratio to the loans fund on typical loans will beeven less favourable. Some students will not meet their repaymentobligations and the administration of the loans fund is not without cost.Taking account of the probability of repayment default and adopting alevel of administration costs in line with that from internationalexperience, results in recovery ratios in the range of 6 to10 per cent –indicating that loans would be only marginally preferable to scholarships,on purely financial grounds. The broad coverage of the Thai scheme mayresult in economies of scale and lower administration costs; yet even so,recovery ratios exceeding 15 per cent are unlikely to be forthcoming.
Formal loan conditions
To be eligible for a loan, a student must be a Thai national, bestudying at a Thai institution or school, have a satisfactory academicperformance and be poor. Poverty is defined by the SLSC in terms ofhousehold income; the ceiling defining a low family income is currentlyset at 150,000 baht a year.
International Institute for Educational Planning http://www.unesco.org/iiep

71
Financial analysis
Loan size
The SLSC also defines the maximum-sized loan for different coursesof study and, within this, the ceilings for various expense categories.While the MUA uses the SLSC maxima, the MOE introduced lowerceilings in 1997. Current various loan ceiling levels are set out in Table 5.1.It is seen, for example, that while the SLSC set a maximum loan forupper-secondary students at 55,440 baht, the MOE has lowered this ceilingto 20,000; again, while undergraduates enrolled at universities may receivea loan of up to 48,000 baht for living expenses (including accommodation)the maximum for undergraduates at Rajabhat Institutes is only36,000 baht.
Table 5.1 Loans maxima, # 1998 (baht)
Tuition* Other Accommo- Living Totaleducational dation+ expenses+ loan
expenditures* ceiling
Upper secondary SLSC 10,440 3,000 18,000 24,000 55,440
MOE 8,000 0 0 12,000 20,000
Vocational level 1 SLSC 16,500 4,000 18,000 24,000 62,500
MOE 12,000 4,000 12,000 12,000 40,000
Vocational level 2 SLSC 20,240 4,000 18,000 28,000 70,240
MOE 18,000 4,000 12,000 24,000 58,000
Undergraduate SLSC 46,000 6,000 18,000 30,000 100,000
MUA 46,000 6,000 18,000 30,000 100,000
MOE 18,000 6,000 12,000 24,000 60,000
# As defined by the Student Loans Committee, the Ministry of Education and the Ministry ofUniversity Affairs.
* Paid direct to educational institution.+ Credited to recipient’s bank account.
Repayment conditions
Loan repayments commence after a two-year grace period, followingcompletion of schooling. Repayment, spread over 15 years, is in nominalterms and covers principal and interest charged at 1 per cent annually.Annual repayments of principal, as a percentage of nominal loan size,are graduated, as follows:
International Institute for Educational Planning http://www.unesco.org/iiep

72
Student loans in Thailand: are they effective, equitable, sustainable?
Table 5.2 Student loans: annual repayment schedules
Year 1 2 3 4 5 6 7 8 9 10 11 12 13 14 15
Repayment 1.5 2.5 3.0 3.5 4.0 4.5 5.0 6.0 7.0 8.0 9.0 10.0 11.0 12.0 13.0(percentageof principal)
The individual loan account
The repayment ratio and hidden grants
The financial efficacy of any loan programme depends centrally onthe extent to which loans are repaid. From the viewpoint of the individualborrower, the size of the subsidy received on the loan (the hidden grant)depends on the extent to which repayment conditions (interest rates,repayment linkage to inflation, grace periods) depart from those oncommercial loans. The lower is the repayment ratio on an individualloan (the ratio of total cash repayments to the original loan), the larger isthe hidden grant element, and the more likely is the loan to be successfulin encouraging educational enrolment of needy youngsters. But higherhidden grants imply greater public subsidy.
From the perspective of the government, the overall recovery ratiodepends not only on cash repayments (reflected in the size of the hiddengrant received by students) but also on administrative costs (which areusually not passed on to the student) and the probability of repaymentdefault. In this section we compute the repayment ratio and hidden granton typical loan programmes from the borrower’s perspective; in thefollowing section we add in the effects of default and administration coststo measure the overall level of recovery of the loan: the recovery ratio.
Computing the repayment ratio
Based on the formal repayment conditions of the loan, we computethe repayment ratio on typical loan programmes (total loan repaymentsas a ratio of the initial loan). For this initial calculation, equal annualloan disbursements are assumed; a stream of annual repayments of thetotal outstanding loan are made according to the schedule shown inTable 5.2, starting from 1.5 per cent of the loan size and rising to 13 percent, plus 1 per cent interest a year on outstanding debt.
International Institute for Educational Planning http://www.unesco.org/iiep

73
Financial analysis
Since repayments are not linked to inflation, the value of annualsums repaid must be lowered to reflect the falling purchasing power ofthe baht. Actual rates of inflation for recent years were supplemented byestimates of future rates of inflation.6 Over the past decade, prior to theeconomic crisis, prices rose on average by 5.5 per cent annually. In 1998the inflation rate exceeded 8 per cent; it was assumed that this rate woulddecline gradually over subsequent years as the economy attained normalcy,towards the long-term inflation trend.
Discounted cash-flow techniques are used to compare the total ofannual loan disbursements with the stream of loan repayments (correctedfor inflation). This requires the ‘discounting’ of payments received in thefuture, to reflect their lower value in terms of the present. We make threealternative assumptions about the appropriate discount rate (reflectingthe loss from not using these funds in alternative uses), and test thesensitivity of the results to these alternative discount rates. We employalternative fixed discount rates of 8, 6 and 4 per cent, respectively. Detailsof the methodology used for the financial appraisals that follow areprovided in Ziderman and Albrecht, 1995.
Results for three typical loan programmes are provided in Table 5.3:three-year programmes such as upper-secondary and RIT courses; four-year undergraduate programmes, including those at universities andRajabhat institutes; and combined programmes, such as upper-secondarycourses followed by study for a first degree. Reading across the table it isnoted, as would be expected, that the longer the course of study, the lowerare the total repayments received in relation to loan size. Reading downthe table, we may see the effect of alternative discount rate assumptionson loan repayment. All the repayment ratios shown in the table arerelatively low, within a range of only 14 to 28 per cent. In all the resultspresented subsequently, we use 6 per cent discount for our central results,with the harsher 8 per cent discount giving an upper limit to feasibleresults.
The very low repayment ratios shown in Table 5.3 may seemsurprising for a loan programme, but they reflect four ingredients of thepresent loans scheme, that inescapably lead to low levels of repayment.
6. These estimates were provided by Dr Kitti Limskul of Chulalongkorn University.
International Institute for Educational Planning http://www.unesco.org/iiep

74
Student loans in Thailand: are they effective, equitable, sustainable?
These are: that interest is levied at the token rate of 1 per cent only; thatno interest is charged on outstanding loans during periods of study orgrace periods; that repayments are spread over a 17-year period oncompleting study, initially at very low rates of repayment; and, mostimportant, that repayments are made in nominal terms, not being raisedto reflect future inflation and the lower purchasing power of the baht.
Table 5.3 Hidden grant and repayment ratio on selected studentloans programmes: alternative discount rates (%)
Discount rate Programme
Upper secondary Undergraduate Upper secondary(3 years) (4 years) plus undergraduate
(7 years)
4%Repayment ratio 28 26 22Hidden grant 72 74 78
6%Repayment ratio 23 21 17Hidden grant 77 79 83
8%Repayment ratio 19 17 14Hidden grant 81 83 86
The repayment burden
One justification for soft loan repayment conditions in many nationalstudent loans schemes, leading in turn to low levels of repayment, is toavoid imposing unduly harsh repayment burdens on borrowers, especiallyneedy students. To minimize this disincentive to taking up loans, mostgovernments subsidize loans. But over-large subsidies, as in the Thaicase (see Table 5.3), may undermine the very purpose of the loan, asopposed to a scholarship, scheme. To probe how far such considerationsapply to the Thai scheme, we estimate very roughly the annual repaymentburden falling on borrowers (annual repayments in relation to expectedincome). We do so for three programmes: upper-secondary schooling,undergraduate courses at university and a combined course of studycomprising upper secondary followed by university study.
International Institute for Educational Planning http://www.unesco.org/iiep

75
Financial analysis
For the repayment calculations, we measure annual repaymentobligations from data on average annual loan disbursements. Expectedfuture annual incomes are derived from age-earnings data by educationlevel, drawn from the 1996 Socio-Economic Survey of the NESDB, withan assumption of real income growth of 3 per cent annually. Since labour-market earnings of females are lower than those of males, separaterepayment burden calculations are made for males and females. Two setsof calculations are made. The first expresses annual repayments as apercentage of annual income and provides an indication of the weight ofthe burden of repayment falling on the borrower each year. The secondcalculates the ratio of annual repayments to incremental income (theadditional income received as a result of completing the stage of educationin question) and measures how much of the annual increment in earningsresulting from extra education remains, after loan repayment.
Results are given in Table 5.4 for loans for university programmesof study; for upper-secondary courses and for upper secondary followedby university study, the results are of a similar general order of magnitude(full, detailed results are available in Ziderman, 1999). The annualrepayment burden in terms of annual income (column 1) is very light, inthe region of only about 2-4 per cent. Interesting differences in therepayment burden by gender are shown in the table: the annual repaymentburden of females exceeds that of males by some 50 per cent, because ofhigher male wages. Annual repayments, as a percentage of incrementalincome (column 2), are obviously much higher. While the effect is toreduce the private rate of return on investment university education,repayments are not onerous. They range from 6 to 8 per cent for femalegraduates, about double the rate for males.
Summary results are provided in the table in terms of present values;this measures the ratio of the present value of total repayments to the presentvalue of total income over the 17-year time horizon of outstanding debt.Total loan repayments in present-value terms comprise only 2.2 and 3.5 percent of total income over the period of debt for males and females, respectively;for incremental income the burden is about 50 per cent higher.
The general conclusion emerging from this analysis is that the ThaiStudent Loans Scheme is overly generous, providing borrowers withunnecessarily highly subsidized loans (effectively, hidden grants), whichmay be effortlessly repaid out of higher income received on completingcourses of schooling.
International Institute for Educational Planning http://www.unesco.org/iiep

76
Student loans in Thailand: are they effective, equitable, sustainable?
Table 5.4 Annual loan repayment burden: undergraduate courses,by gender (%)
Age (1) Repayment as a percentage (2) Repayment as a percentageof annual income of incremental income
Males Females Males Females
25 1.6 2.5 2.8 5.226 2.0 3.2 3.6 6.527 2.1 3.3 3.7 6.728 2.1 3.3 3.8 6.829 2.1 3.3 3.8 6.830 2.1 3.3 3.8 6.831 2.1 3.3 3.8 6.832 2.2 3.5 4.1 7.233 2.4 3.7 4.1 7.634 2.4 3.8 4.3 7.835 2.5 3.9 4.4 7.936 2.5 3.9 4.5 8.037 2.5 3.9 4.5 8.038 2.5 3.9 4.5 7.939 2.4 3.8 4.2 7.8
Present value 2.2* 3.5* 3.5* 6.1*(6%)*
* Excluding years of grace.
Loan recovery with default and administration costs(the loan recovery ratio)
Thus far we have looked at the repayments paid by the typicalborrower and the hidden grant received if the loan is repaid in conformitywith the established repayment conditions of the loans scheme. However,the repayment ratio (hidden grant) fails to show the overall recovery (loss)to the loans fund, from a national point of view. Overall, the fund willreceive back less than is indicated in the repayment ratio, because somestudents will not meet their repayment obligations and the administrationof the loans scheme is not without cost. In the following sections we takeaccount of the probability of repayment default and the incidence ofadministration costs.
International Institute for Educational Planning http://www.unesco.org/iiep

77
Financial analysis
Repayment default
Obligatory loan repayment under the scheme has only recentlycommenced at the time of writing. So far, full repayment information isavailable only for the first two cohorts of borrowers obliged to makerepayments under the scheme. Official figures put repayment default inthese initial years of the scheme at about 30 per cent, both in terms ofnumber of borrowers and repayment amounts due. We have argued (inChapter 4) that default is far less serious than these figures suggest.Moreover, there is every reason to suppose that repayments will improverapidly as the scheme develops. We have already noted the ad hocapproach to administration in the scheme. Special steps are now beingundertaken by the KTB to improve repayment rates and, we have noted,sharper sanctions are being developed by the SLO. In the absence of anyhard information on expected levels of loan default for the Thai scheme,we turn to guidance from international experience. While there isconsiderable variation in default rates amongst developing countries, manyschemes display a default ratio in the range of 5-10 per cent. We simulatethe effect of default on loan recovery, using alternative assumptions aboutthe extent of default. The probability of annual default is expressed as apercentage of annual repayment obligations (repayment of principal plusinterest). Simulations using rates of default ranging from 0-10 per cent(reported in Ziderman, 1999) rendered rather similar results. Given thelack of sensitivity to alternative default rates in the 0-10 per cent range,we adopt the optimistic assumption of a low 5 per cent default probability.
Administrative costs
To establish the net recovery ratio, administration costs, too, mustbe taken into account. For our present purpose, these would be expressedin terms of the average (per borrower) annual administrative cost ofrunning the loans scheme. No reliable data are available. Official SLSCallocations for administrating the loans scheme are only partial, becausea significant proportion of costs are absorbed by the institutions runningthe scheme, including the KTB central office and all the educationalinstitutions that distribute the loans. Moreover, existing administrationcost allocations are thus far concerned only with initial processing of theloans; subsequent overall maintenance costs and collection costs arelargely unknowns.
International Institute for Educational Planning http://www.unesco.org/iiep

78
Student loans in Thailand: are they effective, equitable, sustainable?
While there is no detailed comparative study of administrative costsof loans, a finance study of loans schemes in Latin America found manycountries with administrative costs of some 2 per cent of outstandingdebt, representing an overall cost of approximately 10 per cent of thetotal value of the loan (Carlsen, 1992); similar cost estimates were foundin many other schemes in developing countries (Ziderman and Albrecht,1995).
Table 5.5 presents alternative estimates of the net average recoveryratio on loans programmes, with an assumed default probability of 5 percent and differing administration cost assumptions. With an assumed 2 percent rate for administration costs (as a percentage of outstanding debt)the recovery ratio falls to the low range of 6 to 10 per cent recovery -indicating that loans would be only marginally preferable to scholarshipson purely financial grounds.
However, it is possible that administrative costs of the Thai schemewill fall significantly below 2 per cent. The small size of loans, particularlyat the upper-secondary level, does make them relatively costly. Againstthis, the Thai scheme is very large in terms of annual number of borrowers;loans schemes in developing countries typically number in the tens ofthousands only; this should yield sizeable economies of scale in managingthe loans scheme, as the scheme develops. This view is buttressed by thefindings of a special exercise we conducted, to estimate total currentadministration costs of the loans scheme (including hidden costs absorbedby participating institutions and organizations). Results, reported inZiderman (1999), estimate administrative costs to be at a level of some600 million baht in 1998 (or some 3 per cent of the annual loandisbursements). Some rough calculations, including augmented costestimates to include future debt maintenance and collection costs andestimates of probable levels of total loan debt, suggest that administrationcosts (as a percentage of outstanding debt) could fall to 0.5 to 1 per cent.At these administration cost levels, the loan recovery rate increases toabout double that shown for the 2 per cent administration cost case.
International Institute for Educational Planning http://www.unesco.org/iiep

79
Financial analysis
Table 5.5 Net recovery ratio on loans* (with 5 per cent default andalternative administration costs)
Administration costs**
0% 0% 0.25% 0.5% 1% 2%
No default Default rate: 5%
Upper secondary 23 22 20 19 16 10
Undergraduate 21 20 18 17 14 8
Upper secondary 17 16 15 13 11 6plus Undergraduate
* At 6% discount rate.** Percentage of outstanding debt.
Some caveats
The results presented in Tables 5.3 (loan repayment) and 5.5 (loanrecovery) are based on information available at the time at which thecalculations were carried out (early 1999). Thus they should be regardedas tentative, subject to revision as up-to-date data are generated overtime. This applies particularly to assumptions made concerning ongoingrates of inflation and default.
Because loan repayments are in nominal rather than real terms, highrates of future inflation will be reflected in lower repayment (and recovery)ratios. Lower inflation would result in higher repayment ratios, as thegap between nominal and real repayments narrows.7 In the event, actualrates of inflation have fallen more quickly and sharply than assumed inthe financial analysis reported above. Rather than maintaining highinflation rates as assumed, inflation fell to only 1.6 per cent in 1999 and2000 (the lowest rate in 15 years), though inflation is registering a rate of2.3 per cent in 2001.This could indicate that the results presented inTables 5.3 and 5.5 are more pessimistic than warranted. Against this, ourassumptions about default may have been over-optimistic, in the light ofrecent information on default rates from the first borrower cohorts. On
7. Indeed, with zero inflation the repayment and recovery ratios would rise dramatically. In thecase of undergraduate programmes, the repayment ratio would rise from 21 to 52 per cent (at6 per cent discount rate) and the recovery ratio from 8 to 30 per cent (at 6 per cent discountrate, 2 per cent administration costs and 5 per cent default).
International Institute for Educational Planning http://www.unesco.org/iiep

80
Student loans in Thailand: are they effective, equitable, sustainable?
balance, the general order of magnitude of our financial analysis, and thepolicy lessons to be derived from them, still stand.
Loans scheme viability: revolving fund or open-endedcommitment
A self-financing student loans scheme requires initially large andgrowing disbursements, as the scheme builds up. In principle, totaldisbursements should then level off as the first cohorts of borrowerscomplete their studies and exit the education system; subsequently theloans fund becomes self-sustaining as loan repayments increasinglyfinance the loans to new borrowers.
The expectation that the Thai SLS will operate in this way seems tobe widespread both in central government circles and at the educationalinstitution level. We have argued that, in practice, such a positive outcomerepresents little more than wishful thinking. An extremely low interestrate, repayments in nominal (rather than real) terms; a lengthy repaymenthorizon, administrative costs and inevitable repayment default: all thesefactors combine to produce a highly subsidized loans scheme. Using aset of realistic assumptions concerning administration costs, default andthe appropriate method of investment appraisal, our calculations showthat it is unlikely that more than 10 per cent of the average loan, in realterms, will be returned to the fund. More optimistic assumptions mayraise the recovery ratio somewhat, but still to well below 20 per cent.
Thus, as it operates at present, the loans scheme will not be self-financing, even over the long term; indeed, present arrangements imply alarge and continuing call on the public purse. Given the clear socialobjectives of the SLS, some continuing level of commitment of publicfunds to the scheme may be acceptable; but it seems clear that a subsidylevel of up to 90 per cent is excessive. Moreover, if student numberswere to continue to grow and the demand for loans continued apace, thiscommitment would be increasingly onerous, particularly if the currentlevel of support were maintained (in terms of the ratio of the number ofborrowers to total student enrolments).
It is government policy to encourage the growth of privateuniversities as a means of increasing the number of university places, atlow public cost. Loan levels to students at private institutions (particularly
International Institute for Educational Planning http://www.unesco.org/iiep

81
Financial analysis
universities) exceed those for students enrolled at public institutions,because of considerable differences in tuition-fee levels. The low levelof expected repayments in real terms (in relation to the size of a loan)implies something like an 85 per cent subsidy of the costs of privateeducation. Thus the expansion of private education, with a growingcommitment to provide highly subsidized loans, may not represent a cost-effective method of increasing university enrolments.
Clearly, the loans scheme, as it now stands, with its excessive levelof subsidy, is not viable. Change can go in one of two directions. Withsuch a high hidden grant element, a strong case could be made for replacingthe present loans scheme by a regime of grants.8 In order to maintain thepresent level of net costs, the scholarship scheme would operate at asomewhat lower level of total budgetary support; there would beconsiderable savings in administration costs and, of course, the issue ofrepayment and default does not arise. Alternatively, steps could be takento enhance the financial viability of the scheme by reducing the hiddengrant element, through replacing the over-generous repayment conditionswith more realistic ones that are somewhat closer to those of the market.This would imply a combination of higher interest rates, a shorterrepayment horizon and an annual repayments correction for inflation.
Our central conclusion is a dual one. At the upper-secondary level,the loans scheme would be replaced by a system of targeted scholarships.In parallel, the loans scheme would be retained for students at tertiary-level institutions, but it would be radically reformed in the direction ofimproved targeting, the unification of loan conditions across all tertiary-level institutions and improving the financial viability of the schemethrough a hardening of repayment conditions. These issues will bediscussed more fully in Chapter 7.
8. We use the terms ‘grants’ and ‘scholarships’ interchangeably in the text, though a more exactusage is to refer to student aid to the poor as ‘grants’ and awards for academic achievement as‘scholarships’.
International Institute for Educational Planning http://www.unesco.org/iiep

International Institute for Educational Planning http://www.unesco.org/iiep

83
Chapter 6
Targeting for equity and access
The central objective of the student loans scheme is to provide loans tostudents from poor families, to enable them to continue study at the upper-secondary and tertiary levels of education. How far the scheme succeedsin this objective depends on three main issues: reach, efficacy and equity.
First, we consider the reach of the scheme: does the scheme indeedreach the target group? Which groups are not reached? Are some ineligiblestudents in receipt of loans?
Second, we deal with the efficacy of the scheme: of those who arereached by the scheme and in receipt of a loan, does the loan indeed leadto continuation of study, thus preventing drop-out? What would happenin the absence of a loan?
And third, we turn to equity issues: are loan recipients treatedequitably? Do all potential recipients have equal chances of receiving aloan?
Reach of the scheme
In many projects, insufficient attention is given to the need to defineas clearly as possible the target group to which the programme is directed.Instead ad hoc criteria are used to define individual eligibility with theresult that the population of individuals screened for inclusion in theprogramme (the ‘recipients’) may only very loosely match the intendedtarget population. The outcome is doubly unfortunate. In the case of aproject directed to the poor, needy individuals may be excluded from theproject, while others, who are not in poverty, receive unneeded benefits.This is both wasteful and inequitable. We now apply these principles tothe targeting for the student loans scheme.
International Institute for Educational Planning http://www.unesco.org/iiep

84
Student loans in Thailand: are they effective, equitable, sustainable?
Identifying target groups: the egg diagram
The concept of targeting and reach may be clarified by reference toFigure 6.1. The outside (largest) ‘egg’ relates to the total population ofschool age and includes both youngsters who have left the school systemand those currently attending (the middle egg). Within the schoolingpopulation, some students are in receipt of loans (the smallest egg). Onthe basis of the poverty measure adopted, only part of this total youthpopulation is defined as poor – located in the north-east area of the chart.Total loan recipients are shown in Areas A and D of the chart. Those inArea A are poor and thus entitled to a loan, while D are not poor but arein receipt of loans either because the eligibility criteria used do notcoincide well with poverty definitions or the loans scheme is being abused.
The targeted school population consists of all poor youngstersenrolled in school (Areas A and B); of these only A receive loans and Bare not reached. The total target population consists of A and B plus C (aproportion of poor youngsters that have left school but could be drawnback through the availability of loans). Monitoring, on a continuing basis,will show how successfully the targeted population is being reached.
Figure 6.1 Reach of the loans scheme
Non-poor Poor
Non-school population
Students: Non-loan recepients
Students: Loan recepients
A = Target group: Loan recepientB = Target group: Not receiving a loanC = Target group: Potential enrolleesD = Not target group: Loan recepients
BA
D
CB
A
D
C
International Institute for Educational Planning http://www.unesco.org/iiep

85
Targeting for equity and access
Estimating the reach of the scheme
In this section, we provide some estimates of parameters relating tothe loans scheme’s reach to the target population (Areas A, B and C inFigure 6.1) based on data from the 1999 socio-economic survey (NESDB).For this exercise, we confine our estimates to the upper-secondary levelof education, where the data are more robust, though in principle it ispossible to estimate these parameters for tertiary-level education as well.
Using the socio-economic survey (SES) data set, a specialprogramme was run to identify the total number of youngsters aged 15-17 (the approximate age of upper-secondary enrolment) in poorhouseholds, defining a poor household as one with household incomebelow 150,000 baht, corresponding to loan eligibility ceilings used bythe MOE. Some 2 million poor youth (aged 15-17) were recorded. Weestimated separately the non-school population size and the numbersattending school; we then deducted from the latter estimate, the numberof upper-secondary students currently receiving loans (from Table 6.2).Results, which provide rough estimates only, are given in Table 6.1.
In 1999, while less than a third of poor upper-secondary schoolstudents were in receipt of loans, the vast majority of needy students(over two-thirds) were not. The proportion of poor students receiving aloan has grown each year with the increased take-up of the scheme (10 percent in 1996, 27 per cent in 1997 and 35 per cent in 1998). Looking at thenumber of loan recipients in relation to the total target population of pooryoungsters, we see that loans are received by less than a quarter of theultimate target population (compared with 6 per cent, 18 per cent and 24per cent in 1996, 1997 and 1998 respectively).
International Institute for Educational Planning http://www.unesco.org/iiep

86
Student loans in Thailand: are they effective, equitable, sustainable?
Table 6.1 Reach of the loans scheme:upper-secondary level of schooling,* 1999
Target sub-group Number Percentage Percentage(150,000 baht - of poor of poorparental income ceiling) students youth
(A) 452,810** 32.6 22.6Poor students: receiving a loan
(B) 936,800 67.4 46.8Poor students: not receiving a loan
(A+B) 1,389,610 100.0 -Total poor students in school
(C) 612,740 - 30.6Poor youth: out of school
(A+B+C) 2,002,350 - 100.0Total poor population, aged 15-17
* General order of magnitude only.** From Table 6.2.Source: SES, 1999 (NESDB).
Table 6.2 Upper-secondary school loan recipients
Number 1996 1997 1998 1999 2000of loanrecipients 110,040 307,712 410,891 452,808 419,241
In Table 6.1, we used for illustrative purposes the poverty definitionemployed by the loans scheme to define loan eligibility. We noted thatless than a quarter of poor youngsters were in receipt of a loan. However,there are differing intensities of poverty, related to the size of householdincome. From the SES data set, it was possible to break down theinformation shown in Table 6.1 by household income level; these resultsare presented in Table 6.3.
There are three features of the table that merit attention. First, it isseen that there are 512,000 very poor (with household income of up to50,000 baht), with nearly a third of a million at school and a further200,000 outside of the education system. This group of poor coincides
International Institute for Educational Planning http://www.unesco.org/iiep

87
Targeting for equity and access
most closely with the official NESDB poverty measure of 4,440 baht amonth for a family of five (53,280 baht a year). Second, the proportion ofyoungsters not enrolled at school is highest for this group (over a third)thus compounding the difficulties of reaching this population. Third, andmost important, the total number of loans given in 1999 (Table 6.2), notonly covered a small proportion of the target population, but was in factinsufficient even to cover the half a million very poor youth. The questionarises: did these loans reach the very poor or were the loans taken up bystudents who were less in need? Unfortunately there are no data availableon this issue.
Table 6.3 Number of youth aged 15-17 in poor households,by school attendance, 1999
Number of poor youth
Household At school Not at school Total Ratioincome (baht) (I) (II) (III) II/III
0-50,000 313,620 198,570 512,190 0.38
50,001-100,000 647,370 274,210 921,580 0.30
101,000-150,000 428,620 139,960 568,580 0.25
Total, incomeup to 150,000 1,389,610 612,740 2,002,350 0.31
Source: SES, 1999 (NESDB).
It is true that the formal loans scheme rules require that priority begiven to the poorer students. However, loans are distributed by educationalinstitutions, whose loans budgets are not fixed in proportion to the numberof poor students; thus in practice there is considerable difference in thecut-off point for household incomes, across institutions.
Information drawn from the Loans Interview Surveys, conducted asbackground to this review (see Appendix 1), is relevant to the issue of thedifferential reach of the loans scheme (Table 6.4). For the two high-povertyprovinces included in the survey, nearly 90 per cent of borrowers had ahousehold income of up to 50,000 baht; for the low-poverty provincesthis figure was only 31 per cent. Again, for the open university includedin the survey, borrowers are concentrated in the lower income ranges
International Institute for Educational Planning http://www.unesco.org/iiep

88
Student loans in Thailand: are they effective, equitable, sustainable?
whereas for closed universities the bulk of borrowers had higher householdincome, with over 32 per cent in excess of 150,000 baht.
Targeting versus screening
From the foregoing discussion, it appears that the SLS is less atargeting scheme than one of screening. The distinction between targetingand screening is subtle, but important. A loans scheme based on screeningfocuses on the vetting of applications for eligibility and inclusion, on thebasis of defined entry criteria. It is less concerned with the actualcomposition of those included (and whether they constitute the groupmost in need of the loan), nor with those self-excluded, but eligible,individuals that do not apply for a loan. It is essentially passive inapproach, emphasizing legal entitlement rather than satisfying need. Atargeted scheme, on the other hand, actively focuses on those most inneed; it aims at reaching out to a target population defined in terms ofthose most deserving of help, including such less easily reached targetpopulations as student drop-outs and the rural poor. The challenge facingthe Thai Student Loans Scheme is to reorient its approach, based onimproved information bases and monitoring, in the direction of a morehighly targeted, focused, proactive scheme.
Table 6.4 Annual household income of loan recipients,selected provinces and institutions (%)
Students at MOE institutions Students at Universities
Annual High poverty: Low poverty: Open Public andhousehold Mahasarakham Suratthani university Privateincome (baht) Mae Hong Son Ayuthaya university
Less than 50,000 89 31 50 1250,001-100,000 11 53 45.5 22100,001-150,000 0 15 4.5 34Over 150,000 0 1 0 32
Total 100 100 100 100Number in sample 54 92 22 42
Source: Loans Interview Surveys: loan recipients.
International Institute for Educational Planning http://www.unesco.org/iiep
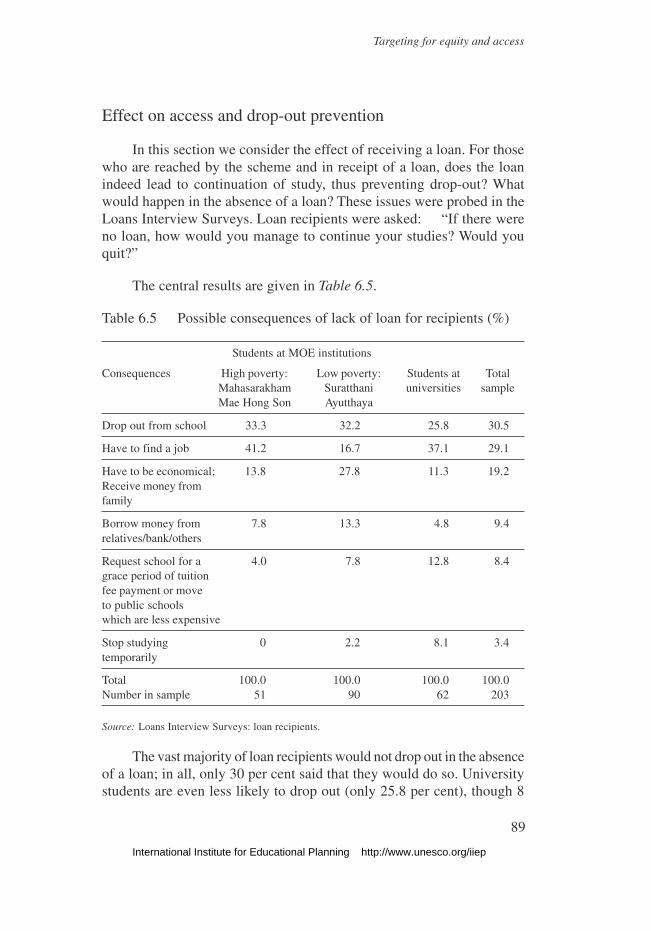
89
Targeting for equity and access
Effect on access and drop-out prevention
In this section we consider the effect of receiving a loan. For thosewho are reached by the scheme and in receipt of a loan, does the loanindeed lead to continuation of study, thus preventing drop-out? Whatwould happen in the absence of a loan? These issues were probed in theLoans Interview Surveys. Loan recipients were asked: “If there wereno loan, how would you manage to continue your studies? Would youquit?”
The central results are given in Table 6.5.
Table 6.5 Possible consequences of lack of loan for recipients (%)
Students at MOE institutions
Consequences High poverty: Low poverty: Students at TotalMahasarakham Suratthani universities sampleMae Hong Son Ayutthaya
Drop out from school 33.3 32.2 25.8 30.5
Have to find a job 41.2 16.7 37.1 29.1
Have to be economical; 13.8 27.8 11.3 19.2Receive money fromfamily
Borrow money from 7.8 13.3 4.8 9.4relatives/bank/others
Request school for a 4.0 7.8 12.8 8.4grace period of tuitionfee payment or moveto public schoolswhich are less expensive
Stop studying 0 2.2 8.1 3.4temporarily
Total 100.0 100.0 100.0 100.0Number in sample 51 90 62 203
Source: Loans Interview Surveys: loan recipients.
The vast majority of loan recipients would not drop out in the absenceof a loan; in all, only 30 per cent said that they would do so. Universitystudents are even less likely to drop out (only 25.8 per cent), though 8
International Institute for Educational Planning http://www.unesco.org/iiep
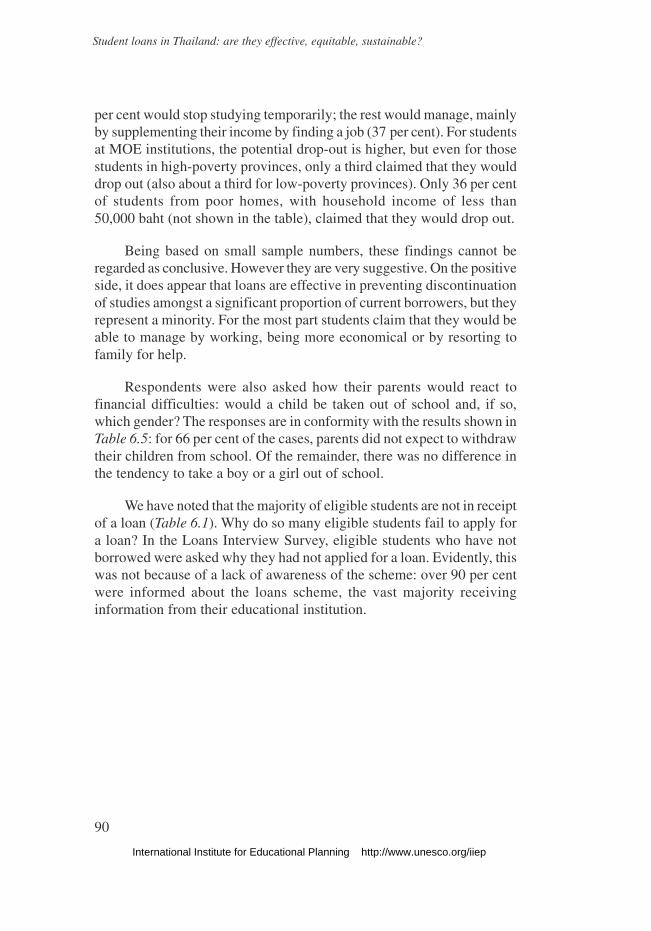
90
Student loans in Thailand: are they effective, equitable, sustainable?
per cent would stop studying temporarily; the rest would manage, mainlyby supplementing their income by finding a job (37 per cent). For studentsat MOE institutions, the potential drop-out is higher, but even for thosestudents in high-poverty provinces, only a third claimed that they woulddrop out (also about a third for low-poverty provinces). Only 36 per centof students from poor homes, with household income of less than50,000 baht (not shown in the table), claimed that they would drop out.
Being based on small sample numbers, these findings cannot beregarded as conclusive. However they are very suggestive. On the positiveside, it does appear that loans are effective in preventing discontinuationof studies amongst a significant proportion of current borrowers, but theyrepresent a minority. For the most part students claim that they would beable to manage by working, being more economical or by resorting tofamily for help.
Respondents were also asked how their parents would react tofinancial difficulties: would a child be taken out of school and, if so,which gender? The responses are in conformity with the results shown inTable 6.5: for 66 per cent of the cases, parents did not expect to withdrawtheir children from school. Of the remainder, there was no difference inthe tendency to take a boy or a girl out of school.
We have noted that the majority of eligible students are not in receiptof a loan (Table 6.1). Why do so many eligible students fail to apply fora loan? In the Loans Interview Survey, eligible students who have notborrowed were asked why they had not applied for a loan. Evidently, thiswas not because of a lack of awareness of the scheme: over 90 per centwere informed about the loans scheme, the vast majority receivinginformation from their educational institution.
International Institute for Educational Planning http://www.unesco.org/iiep

91
Targeting for equity and access
Table 6.6 Reasons for not taking a student loan,non-borrowing students
Total family annual income (baht)
Reason for not Up to 50,001- 100,001- Over Totaltaking a loan 50,000 100,000 150,000 150,000 (%)
(%) (%) (%) (%)
Adequate financialresources 39.2 38.7 56.8 62.9 46.9
Receiving ascholarship 5.9 0.0 0.0 0.0 1.5
Parental oppositionor fear of gettinginto debt 25.5 29.9 16.6 9.4 21.7
Technical reasonsfor not receivinga loan 23.5 26.9 19.9 16.3 22.7
Other 5.9 4.5 6.7 11.4 7.2
Total 100.0 100.0 100.0 100.0 100.0Number in sample 54 70 32 45 201
Source: Loans Interview Surveys: non-borrowing students.
In response to a question on why they had not applied for a loan,overall, nearly a half confirmed that they did not need a loan (Table 6.6);as expected, the higher is family income, the less is the need for a loan. Afurther 22 per cent did not apply, either because of parental opposition orbecause they feared entering into debt; the more impoverished familiesare less inclined to take up loans. But some 23 per cent were interested inreceiving a loan but did not do so for technical reasons (details not includedin Table 6.6): 10.3 per cent lacked the necessary documentation to apply,5.7 per cent had applied but had not been accepted, 3.1 per cent found theapplication form to be too complicated. Clearly, there remains someconsiderable scope for extending the reach of the scheme amongst eligiblestudents; but appropriate steps must be taken to ease applicationprocedures and explain more thoroughly the benefits and obligations ofborrowing.
International Institute for Educational Planning http://www.unesco.org/iiep
92
Student loans in Thailand: are they effective, equitable, sustainable?
Table 6.7 Reasons for discontinuing studies (drop-out),non-student youth aged 15-17
Total family annual income (baht)
Reasons for Up to 50,000 50,001-100,000 Totaldrop-out (%) (%) (%)
Financial reasons 91.2 57.1 77.5
Academic reasons 4.4 17.9 11.3
Other 4.4 25.0 11.2
Total 100.0 100.0 100.0Number in sample 48 32 80
Source: Loans Interview Surveys: non-student youth.
But what of working youngsters? A survey of poor, drop-out youth(aged 15-17), carried out as part of the background research, probed thereasons for discontinuation of studies (Table 6.7). Financial reasons werethe main cause of drop-out (77.5 per cent); for students in families withan annual income of less than 50,000 baht, over 90 per cent had droppedout for financial reasons. This suggests that there may be an importantrole for student loans in increasing educational access for youngsters inpoor families. However, some caution is in order, prior to accepting thisconclusion.
The central objective underlying the establishment of a targeted loanssystem is to aid needy students and to encourage continuity of educationand, thus, a larger enrolment of youngsters from poor families. With thesubsequent onset of the economic downturn there was a new emphasison student loans as a means of preventing drop-out from the educationsystem. But these objectives are not the same. Under economically stableconditions, the availability of loans can encourage poor parents to allowtheir children to continue with their education, certainly if tuition iscovered and the loan for living expenses can be set off against children’searnings forgone. Similarly, college-level students will be willing to takeon loan obligations because they see, in future enhanced earnings, therealistic possibility of making the required loan repayments.
However, times of economic crisis are different. There are twoopposite tendencies at work. On the one hand, conditions of higher
International Institute for Educational Planning http://www.unesco.org/iiep

93
Targeting for equity and access
unemployment and lower earnings possibilities, result in reducedopportunity costs of study and training. There is evidence in advancedeconomies of higher enrolment, especially at the college level, and forgreater willingness of workers to take off-the-job training in periods ofeconomic downturn. On the other hand, with lowered household income,there is increased pressure on all family members to contribute to familyincome and to be available to take up earnings opportunities that arise.Parents of out-of-school youngsters and potential college students maybe loath to assume loan burdens in such conditions. A period of economicdownturn may not be the most favourable for making long-term educationinvestments (unlike short training courses) nor taking on additional, futureloan repayment commitments. Trust in a better future may not be manifestamongst the poor, who may be influenced more by the clear evidence ofdiminished employment opportunities and lowered earnings thaneconomic forecasts. Time horizons of the poor tend to be short and thereis evidence that they have a tendency to discount the future more thanhigher socio-economic groups.
These considerations may be more strongly applicable to upper-secondary schooling than to education at the tertiary level. This isparticularly so for general secondary education, whose main benefit stemsfrom it serving as a bridge to higher education rather than earningsenhancement. These arguments also add support to our view that loansfor secondary-school children should be replaced by a regime of targetedgrants. Certainly, in terms of attacking the problem of drop-out, grantsare likely to be the more powerful instrument.
Horizontal equity
At the outset, we distinguish between inequality and inequity.Inequalities in the system of loan distribution are to be expected, and arejustified, if students have differing needs; some students do, and should,receive a more substantial loan than others. Tuition fees at vocationalschool are higher than those at general public schools, as are undergraduatestudies at universities in relation to Rajabhat institutes. Some universitycourses are very much more expensive than others. Again, studentsstudying away from home may be in need of a loan element foraccommodation, while those living at home are not. These are examplesof inequalities, but they are acceptable. Inequities arise when loanrecipients, of the same economic status and level of need, receive loans
International Institute for Educational Planning http://www.unesco.org/iiep

94
Student loans in Thailand: are they effective, equitable, sustainable?
of differing size. Again, equity would require that, regardless of provinceof residence or educational institution, students of similar socio-economicbackground should have equal opportunities for receiving a loan. Thesetenets of horizontal equity do not hold in practice in loans distribution inthe Thai scheme.
Inequities across individuals may arise in two ways. First, they maystem from inequalities that are formally sanctioned by institutionalarrangements for loan allocation and distribution. We give two examples.The system of loan budget allocation, from the SLSC down through theministries to the individual educational institution, is unrelated to objectivecriteria in terms of poverty or need (the MOE allocation of loan budgets tothe provincial offices constitutes a partial exception). For a number of years,the MOE and MUA operated on different criteria in relation to eligibility(household income level) and to size of loan maxima. Second, inequitiesmay be unintended, and arise because of a lack of sufficient informationgeneration, monitoring and feedback. For example, the individual educationalinstitutions that distribute loans are free to fashion their own policies withregard to the size and purpose of individual loans, within the maxima set bythe ministry. Falling budgets for new loans (in real terms) combined with apolicy of renewal of loans for current borrowers at existing rates, have resultedin differences in treatment between students of similar need, even whenenrolled at the same institution.
In the Thai loans scheme these kinds of inequities are rife. We provideconcrete examples of such horizontal inequity at three levels: there areinequities of treatment between similar institutions in different educationministries; inequities amongst institutions within the same ministry; andinequities in treatment of students enrolled at the same educational institution.
Inequity between ministries
The most known, and much quoted, case is that of undergraduatestudies at Rajabhat institutes and universities. While the MUA uses thehigh loan size maxima set by the central SLSC, the MOE has establisheda lower loans maxima (see Table 5.1). This has resulted in inequity oftreatment of students of similar status enrolled in the two ministries.Putting aside differences in the tuition element of the loan, the maximalsize loan for living expenses (including accommodation) is 48,000 bahtfor university undergraduates but only 36,000 baht for degree students at
International Institute for Educational Planning http://www.unesco.org/iiep

95
Targeting for equity and access
Rajabhat institutes. There are a number of cases of RIT and Rajabhatinstitutes in close proximity to universities, which only serves to highlightthe inequity here.
However, one source of inequity has now been eliminated, with thealignment of the eligibility criteria; this is now set at a household income ofup to 150,000 baht; formerly, the MUA employed a 300,000 baht ceiling.
But these inequities are not confined to tertiary-level education.Loans for students at the prestigious demonstration schools attached tosome universities are administered by the MUA, not the MOE. The MUAuses the central SLSC high loans size maximum. Average loan size at afew demonstration schools attached to universities in Bangkok, are shownin Table 6.8. Tuition aside, loans were provided for other educationalexpenses (not allowed under MOE regulations) and living expenses loanswere twice the MOE maximum. While it is the case that the number ofstudents and total loan amounts involved are quite small (some 200-250 students a year), the point remains that these generous loans are beingreceived by privileged non-poor students.
Table 6.8 Average loan size, recipients in MUA demonstrationschools, 1998
Tuition Other Living Totaleducation expenses
expenditures
Ramkamhaeng University 4,000 3,000 24,000 31,000(25 recipients)
Prasarnmitrs University 5,850 3,000 24,000 32,850(1 recipient)
Kasetsart University(11 recipients)
Grade 11 12,820 3,000 24,000 39,820Grade 12 14,300 3,000 24,000 41,300
MOE maximum 8,000 - 12,000 20,000
Inequities amongst institutions of a similar type
Institutions receive loans budgets unrelated to the poverty levels ofthe student body. Thus even if institutions distribute loans in strict order
International Institute for Educational Planning http://www.unesco.org/iiep

96
Student loans in Thailand: are they effective, equitable, sustainable?
on the basis of ascending household income, the income cut-off will differfrom institution to institution. This is illustrated in Figure 6.2 for aselection of universities for 1997 (data are provided in Appendix Table 7);at this time the MUA still operated on an income eligibility ceiling of300,000 baht. At the private universities Assumption and Mahanakorn,over a third of all loan recipients had household income in excess of150,000 baht; in contrast, at Mahidol and Suraneree technical universitiesless than 10 per cent of borrowers came from this parental income group.
Another source of inequities arises from the incentive system builtinto the method of loan budget allocation to institutions and its distribution.Evidence from the field visits confirms that some private institutions,with an eye to increasing their student enrolments, spread the loans budgetover a larger number of students by restricting loans to tuition fees only(that part of the loan that is paid directly to the institution). This meansthat the budget can reach up to less needy, but eligible, students, but atthe expense of poorer students who are denied the loan for living expensesthat they are entitled to under the scheme and which they would no doubtreceive if enrolled at a public institution.
Figure 6.2 Percentage of loan recipients, by income group:selected universities, 1997
PRIVATE UNIVERSITIES:
Yonok
Assumption (ABAC)
Mahanakorn Technology
PUBLIC UNIVERSITIES:
King Mongkut: N. Bangkok
King Mongkut: Thonbury
Suranaree Technology
Ubonratchatani
Mahidol
Thammasart
Chiangmai
TOTAL:
0% 20% 40% 60% 80% 100%
Up to 120,000
150,001 – 200,000
120,001 – 150,000
200,001 – 300,000
International Institute for Educational Planning http://www.unesco.org/iiep

97
Targeting for equity and access
Inequities amongst students within a given institution
Even within a given institution, loan size may vary for students insimilar circumstances but in different groups, years of study or cohorts.This stems from the loans scheme policy of maintaining the (nominal)value of renewed loans for current borrowers who continue study withinthe institution. In contrast budgetary pressures, buttressed by increasingloans demand from new borrowers, have led to a falling average size ofloan for new loan recipients. This point is illustrated for the RIT at KhonKaen.
Table 6.9 Maximum loan ceilings, RIT (Khon Kaen),1998 (baht)
Recipient Course level Tuition fee Other Accommodation Living Totalexpenditure expenses
New students - Lower vocational 5,000 1,000 - 7,200 13,200New recipients (PWC)
Upper vocational 8,000 1,000 - 9,600 18,600(PWS/T)Undergraduate 10,000 1,000 - 9,600 20,600(BA)
New students - Lower vocational 5,000 1,200 - 18,000 24,200Former (PWC)recipients Upper vocational 8,000 1,200 - 18,000 27,200
(PWS/T)Undergraduate 10,000 1,200 - 18,000 29,200(BA)
Old recipients Lower vocational 5,000 1,200 5,000 21,400 32,600(PWC)Upper vocational 8,000 1,200 5,000 21,400 35,600(PWS/T)Undergraduate 10,000 1,200 5,000 21,400 37,600(BA)
Table 6.9 and Figure 6.3 show maximum loan ceilings for threecategories of students: new students at the RIT who are first-timeborrowers (new recipients), new students who have borrowed previouslyat lower-level educational institutions (former recipients), and establishedstudents at the RIT who are renewing their loan for an additional year(old recipients). As expected, the tuition loans maxima remain intact.However for new students, the maximum living expenses loan is onlyabout a half of that for previous borrowers; these, in turn, are entitled toa maximum loan that falls short of that for old recipients. Additionally,
International Institute for Educational Planning http://www.unesco.org/iiep

98
Student loans in Thailand: are they effective, equitable, sustainable?
old recipients may receive an accommodation loan, which is unavailableto new students.
Figure 6.3 Loan ceilings, RIT, Khon Kaen, 1998 (baht)
40,000
35,000
30,000
25,000
20,000
15,000
10,000
5,000
0
PWC PWS/T BA
New recepients Former recepients Old recepients
There is one area in which we did not find any evidence of inequityin treatment, neither in the Loans Interview Survey nor in the field visits:this is the area of gender. Indeed, in some institutions, because of a largerfemale enrolment, the percentage of total loans received by femalestudents was in excess of that of males. At Thammasart University, femalestudents constitute some 60 per cent of all borrowers.
Case study: MOE provincial loans budget allocation
The purpose of the presentation in this section is fourfold. First, theallocation of loans budgets to the provinces is the only part of the totalloans budget allocation system which formally employs a poverty-basedelement in the allocation criteria; it is thus instructive to see how far thispart of the allocation system leads to acceptable targeting outcomes.Secondly, the MOE loans budget allocation through the provincial officesdown to the schools is, quantitatively, the largest part of the system. Thusan examination of the provincial loans allocations tells us much aboutthe system as a whole. Third, if the allocation to the provincial offices isinequitable, the whole basis of the next stage of the allocation system tothe schools is in question. Finally, the available data are richest for this
International Institute for Educational Planning http://www.unesco.org/iiep

99
Targeting for equity and access
part of the allocation system, facilitating a more in-depth analysis than ispossible for other sections.
Method of allocation
In 1998, over 85 per cent of the total MOE budget for new recipientswas allocated to the 75 Provincial Offices. As noted in Chapter 3, theprovincial allocation employed three criteria, as follows:
• number of students in the province at the upper-secondary levelthrough to undergraduate level (excluding those at MUA institutions)– 60 per cent weight;
• poverty level in the province, as measured by the average incomelevel in the province – 30 per cent weight;
• achievement of special objectives of the MOE, including policiesrelating to the handicapped, increasing the enrolment rate of femalesin Northern provinces and the reduction of prostitution – 10 percent weight.
The provincial offices then allocate loan budgets directly to MOEeducational institutions within the province.
We note that only 30 per cent of the weighting in the formula usedrelates to the level of poverty in the province, and only indirectly: averageprovincial income levels may constitute only a rough approximation forthe incidence of poverty. The question arises: how closely does themeasure used in the allocation formula relate to alternative, more directmeasures of the target population? As indicated in the egg diagram (Figure6.1), a preferable target measure is one that measures the population moredirectly, i.e. the incidence of poor upper-secondary school students byprovince. We examine this issue in the following section.
Alternative target measures
We used five sets of provincial-level data, representing alternativetargeting measures, as follows:
• average household income by province, 1997: INCOME;
International Institute for Educational Planning http://www.unesco.org/iiep

100
Student loans in Thailand: are they effective, equitable, sustainable?
• gross provincial product per capita: GPPPC;• percentage of poor families in the population, by province
(150,000 baht income ceiling): POOR;• percentage of poor students aged 15-19 in the population, by province
(150,000 baht income ceiling): POORST;• percentage of poor youth aged 15-17 in the population, by province
(150,000 baht income ceiling): POORYO.
Information on the poor (the last three listed measures) was derivedfrom the 1999 Socio-Economic Survey of the NESDB, normalized bysize of population in the province. Special analyses of the data set werecompleted to derive the measures POORST and POORYO, which arethe closest proxy measures for the target population thus far available.Following MOE definitions, we employed a (generous) upper householdincome level of 150,000 baht, to define poor families. Table 6.10 providesa correlation matrix for these five target measures.
Average household income (INCOME) corresponds to the measureused in the MOE allocation formula. Reading down column A, we notethat INCOME is positively correlated with GPPPC and negativelycorrelated with the overall incidence of poverty, by province; these resultsare expected. However, the significant correlation shown betweenINCOME and POORST is of the ‘wrong’ sign (the expected correlationis negative): the higher are average incomes in a province, the greater isthe incidence of poor students enrolled at the upper-secondary level. Thecorrelation between INCOME and POORYO is negative and significantas expected. Two points arise from these results. First, it illustrates thedanger of allocating budgets on the basis of proxy target measures thatare not sufficiently tested and may, in fact, be inappropriate. Second,given that INCOME was used in the allocation formula, rather thanPOORST, the question arises: how satisfactory, or otherwise, was theresulting loans budget allocation by province?
We examine this issue by looking at the bivariate correlation betweenall five target measures (but with a special focus on POORST) and twomeasures of loans allocation. The first, more important, measure ofprovincial loans allocation is the total provincial loans allocation dividedby size of student enrolment, thus normalizing to take account of differingprovincial size (ALS = average loan size). We also examine the relativenumber of loan recipients (in relation to the number of secondary-school
International Institute for Educational Planning http://www.unesco.org/iiep

101
Targeting for equity and access
students = RS). Since 1996 was very much a start-up year and data for1998 were not complete at the time of analysis, we use loan allocationdata for 1997.
Table 6.10 Correlation matrix of five target measures
Target measure A B C D EINCOME GPPPC POOR POORST POORYO
1. Average household income 1.00(INCOME)
2. Gross domestic product 0.255* 1.00per capita (GPPPC) 0.026
3. Percentage of poor families -0.538** -0.278 1.00in population with household 0.000 0.015income ≤ 150,000 (POOR)
4. Percentage of poor 0.273* 0.273* -0.351** 1.00students in population with 0.017 0.017 0.002household income≤ 150,000 (POORST)
5. Percentage of poor youth -0.481** -0.306** -0.344** -0.062 1.0015-17 in population with 0.000 0.007 0.002 0.597household income≤ 150,000 (POORYO)
Mean 9,736.34 70.39 10.24 1,549.97 22,277.34
Standard deviation 4,242.99 129.78 10.54 2,175.08 15,556.08
Note: Boldface in upper row = correlation coefficient.Regular typeface in lower row = p.* Correlation coefficient is significant at the 0.01 level (2 tailed).** Correlation coefficient is significant at the 0.05 level (2 tailed).
The correlation between ALS and RS per province, respectively,and each of the five provincial targeting measures are shown in Table 6.11.The highest correlation coefficients are shown for INCOME; this is notsurprising given that average household income is used in the MOEallocation formula. The coefficients for INCOME, GPPPC and POORare all of the expected sign (though the correlation between ALS andGPPPC is not statistically significant). The noteworthy result, however,relates to row 4, the main targeting measure (POORST); provincial loansallocation is seen to be negatively related to the provincial incidence ofpoor upper-secondary students (though the ALS coefficient is notsignificant), the opposite of the desired targeting outcome. The reported
International Institute for Educational Planning http://www.unesco.org/iiep

102
Student loans in Thailand: are they effective, equitable, sustainable?
correlation coefficients in row 5 (POORYO) are of the desired sign, butagain the ALS coefficient is not significant.
The foregoing analysis suggests that there has been a mal-allocationof provincial loans budgets (in terms of targeting the poor student), dueto the use of an insufficiently appropriate loans allocation formula by theMOE.
Table 6.11 Bivariate correlations between loan allocationand target measures
Loan allocationA B
Value of loans allocated Number of borrowersTarget measure per upper-secondary related to number
school student (ALS) of upper-secondaryschool students (RS)
Coefficient p Coefficient p
1. Average household income (INCOME) -0.331** 0.004 -0.516** 0.000
2. Gross provincial product per capita(GPPPC) -0.173 0.136 -0.286* 0.012
3. Percentage of poor families in populationwith household income ≤ 150,000 (POOR) 0.263* 0.002 0.489** 0.000
4. Percentage of poor students in populationwith household income ≤ 150,000 (POORST) -0.146 0.208 -0.288* 0.012
5. Percentage of poor youth 15-17 0.147 0.206 0.323** 0.004in population with household income≤ 150,000 (POORYO)
Note: Bivariate correlation coefficient between ALS and RS -0.853, p .000 ALS: Mean= 2,799.28 Standard deviation = 1,328.11 RS: Mean = 0.15 Standard deviation = 0.07
* Correlation coefficient is significant at the 0.01 level (2 tailed)** Correlation coefficient is significant at the 0.05 level (2 tailed)
International Institute for Educational Planning http://www.unesco.org/iiep

103
Chapter 7
Policy conclusionsand implications for reform
Two major areas for reform
Overall, within its short period of operation, the Thai Student LoansScheme has recorded a number of achievements: designing a nationwideloans scheme, setting the scheme in motion within a short time-frameand reaching well over a million and a half student-borrowers. A majorfailing of the scheme which, if uncorrected, will act as a constraint on thereform programme that is outlined in this chapter, is its weak centraldirection and lack of forward planning, monitoring and evaluation.Problems of process, as they arose, have been dealt with mainly on an adhoc basis. The scheme has tended to drift; it has not been steeredeffectively.
The following issues, concerned with providing the scheme withgreater focus and a stronger central direction, should be given urgentpriority. Attention will need to be given to the appointment of technicalexperts. These will establish frameworks for forward planning of thescheme (including financial planning), the setting up of a central databaseand monitoring system (no doubt in conjunction with the KTB) and forcarrying out evaluation and feedback on a continuing basis. Some of theanalytical work that has been undertaken as background to this papermay be seen as a preliminary start in this direction and as a base onwhich future efforts may be built.
However, the most pressing issues to be faced in loans scheme reformare not those of improvements in process but rather in two morefundamental areas: the organizational restructuring of the scheme toachieve better targeting and horizontal equity and its financial efficacy.These are the main concerns of the present chapter.
International Institute for Educational Planning http://www.unesco.org/iiep

104
Student loans in Thailand: are they effective, equitable, sustainable?
Organizational reform:improving targeting and horizontal equity
The present system of an arbitrary top-down allocation of loanbudgets, which is combined with inequitable institution-based(decentralized) loans distribution, has not served the loans scheme well.The direction for reform advocated here is its replacement by a bottom-up system of loans applications to a central loans distribution body, whichwould both facilitate targeting and avoid horizontal inequity. Since theneeds of secondary education differ dramatically from those at the tertiarylevel, reform will be considered separately for the two levels.
Tertiary-level education
The central element of reform is the establishment of a stronger,more independent and more committed central organization, which weterm the Students Loans and Scholarships Bureau (SLSB).9 The SLSBshould be comparable in status and method of operation to that of theboard of directors of a major company or national concern. Membershipof the SLSB should be of individuals of national status, with backgroundor interests relevant to the working of the scheme. Membership would beon a personal basis, rather than representative as at present.Representatives of relevant government bodies and other interested partieswould attend as non-voting participants.
The present system of top-down allocation of loan budgets toinstitutions and the institutional distribution of loans would be replacedby the direct distribution of all loans by the SLSB, to which all applicantsfor loans would apply. All applications received would be placed in acentral computer database. The distribution system across the wholetertiary education sector (universities, RITs and Rajabahts) would beunified to provide parallel treatment for all students, whether enrolled inMUA or MOE tertiary institutions.
Loans would be distributed in ascending order of parental incomesize, until the total available loans budget had been allocated; thus thepresent uniform cut-off level of parental income would ensure focusedloans targeting and horizontal equity. The actual cut-off level of parentalincome would vary somewhat from year to year, depending on the size of
9. The reason for extending the remit of the new Bureau to cover scholarships will becomeapparent from our discussion for arrangements at the upper-secondary level below.
International Institute for Educational Planning http://www.unesco.org/iiep

105
Policy conclusions and implications for reform
the loans budget and the number of loan applicants. It is recommended,however, that eligibility criteria be revised, on the basis of additionalresearch, to include additional elements such as family size andcomposition and number of children studying.
Apart from family income and background, it would be possible touse supplementary eligibility criteria, aimed at meeting societal objectives,such as encouraging students to enter shortage fields. However, it isarguable that these objectives are best dealt with through more favourablerepayment conditions for the students concerned, rather than weakeningthe principle of needs-based loans; in the next section we advocate astrengthening of general repayment conditions, in order to improve thefinancial standing of the scheme.
There would be fixed schedules for the maximum size of loan availableand its coverage of particular expenditure categories; all applicants would beeligible for a maximum loan. Existing loan recipients and new borrowerswould be treated on a more equal footing than at present.
There are many advantages in the suggested new arrangements fordirect student applications to a central loans bureau. Apart from easingthe task of operating a more horizontally-equitable scheme, a directrelationship between student-borrowers and the SLSB might lead togreater efficiency through quickness of loan turn-round and possibly loweradministration costs. However there are some advantages to be derivedfrom giving loan officers at individual institutions a continued role in theprocess. Thus an alternative arrangement would be for loan officers tocontinue with some of their present functions: advice to students on loanprocedures and eligibility and vetting the application forms. They wouldact as an intermediary between the applicant and the SLSB, but wouldnot distribute loans, as at present. To streamline the system and to reducethe administrative burden at the centre, it is suggested that loan officerswould submit all loan applications in bulk to the Bureau.
One disadvantage of the new arrangements outlined in the precedingparagraph is that institutional loan officers may now have little incentiveto ensure that the loans fund is properly used. No longer authorizing thedistribution of loans, they may now become partisan advocates of potentialborrowers enrolled at their institution, leading to possibilities of abuseand inequities. These dangers could be avoided by the adoption of analternative arrangement (along the lines of current practice at the MUA);
International Institute for Educational Planning http://www.unesco.org/iiep

106
Student loans in Thailand: are they effective, equitable, sustainable?
however, this alternative does not represent our central recommendation.Under this alternative, the SLSB would allocate a loans budget to eacheducational institution; the institution would be responsible for thedistribution of its loans allocation among student applicants. At the presenttime no objective criteria for loans allocation to individual educationalinstitutions are available. This alternative, then, would be feasible onlyto the extent that objective criteria for loan budget allocation to institutionsbecame available. Information on the socio-economic profile of the studentbody at each institution could serve this purpose. In principle, suchinformation could be generated without difficulty.
Figure 7.1 Alternative scenarios for loans allocation reform
D A B C
Student Loans and Scholarships Bureau
MOE provincialoffices
Upper secondaryschools
Student applications
Educational institutions
International Institute for Educational Planning http://www.unesco.org/iiep

107
Policy conclusions and implications for reform
Figure 7.1 presents these reform alternatives in schematic form.Path A is the favoured method adopted in many countries: a direct linebetween the student applicant and the central loans organization. Oncethe application has been vetted and approved, it is passed on to the KTB,the banking organization that administers the loan. It is noted that theeducation ministries or educational institutions are assigned no role inthese purely banking arrangements. In path B, the educational institutionacts as intermediary between the applicant and the SLSB: it offers counselon procedures and eligibility, receives loan applications, vets them forgeneral eligibility and submits them in bulk to the SLSB.
Path C is broadly parallel to current arrangements: each educationalinstitution is allocated a loans budget by the SLSB, which is distributedamongst eligible applicants. The system departs from existingarrangements in three major ways. First, all tertiary educational institutionsare brought within a common allocative framework. Second, the loansbudget is distributed to educational institutions on the basis of objectivecriteria related to student need and thus designed to ensure that loans aretargeted on poor students. Third, the actual loan size and eligibility criteria(including the cut-off ceiling for parental income) are standardized acrossall tertiary educational institutions, to ensure horizontal equity.
A final word is in order about the functions of the SLSB in relationto support of students at the tertiary level. We have noted that the studentloans scheme in Thailand (as in most other countries) offers subsidizedloans that fall between the continuum of commercial loans and outrightgrants. Given the hidden grant element, student loans share many of thesocial objectives of student scholarships aimed at the needy and requiresimilar procedures for their administration. For this reason, it would beadvantageous to unify the provision of student loans and nationalscholarships within the organizational framework of a single body, suchas the SLSB; however, a detailed treatment of these issues lies outsidethe purview of the present paper.
Secondary schools
Reform at the secondary-school level envisages dismantling thesystem of loans for upper-secondary school students and its replacementby scholarships (grants) to needy students. A number of considerationsunderlie this radical recommendation.
International Institute for Educational Planning http://www.unesco.org/iiep

108
Student loans in Thailand: are they effective, equitable, sustainable?
First, few countries have loans for school students. Technically thereis little difference if the student-borrower is at college or high school: inthe latter case, however, there may be an ethical issue involved withparents entering under-age youngsters into debt repayment obligationsthat extend up to a 20-year time horizon.
Second, at present levels of subsidy, the loans scheme (at alleducation levels) is not sustainable. The hidden grant element is so largethat in practice the loans scheme almost amounts to a grants scheme. Butovert grants would be far sharper in effect in influencing poor families tocontinue with their children’s education and administrative costs wouldbe lower. Ongoing plans to introduce free upper-level secondary schoolingfor all, considerably strengthens the case for transmuting student loansfor secondary students into a regime of scholarships to meet livingexpenses only. Over 70 per cent of the sample interviewed in the LoansInterview Survey stated that for them the tuition loan was the mostimportant element of the loan package. At the present time, a student loanmay be divided into two elements: a loan for educational expenses that ispaid directly to the institution, and a loan for living expenses that is receivedby the student. Educational expenditures represent investments in humancapital for which loans are clearly appropriate; living expenses areconsumption items for which subsidized loans are less clearly justified.Currently, the loan is provided as a package covering both elements. Onceliving expenses alone remain, the justification of a loans programme is lessclear, though it is true that very many countries do have loans programmes tocover living costs only, but at the tertiary educational level.
Third, the small average size of upper-secondary school loans(somewhat above 9,000 baht for new borrowers in 2000) implies far higheraverage administrative costs in relation to amounts lent, than at the tertiarylevel. Once the tuition-fee element in loans has been removed, averageadministrative costs, in relation to amounts borrowed, may be untenable.Moreover, because there is no element of loan servicing, the administrationcosts of a grant scheme are, by definition, considerably lower than thoseof running a loans scheme.
And fourth, moving to a straight scholarship scheme for livingexpenses, targeted to the poor, brings the upper-secondary level segmentinto line with lower levels, where the practice of grants for needy students
International Institute for Educational Planning http://www.unesco.org/iiep
109
Policy conclusions and implications for reform
is established, as for example in the emergency scholarship scheme forprimary and lower-secondary school drop-outs introduced in 1998.
It is clear that the process of operating a scholarship scheme isparallel to the lending stage of a loans scheme (except for the issue ofguarantors). Thus the scheme could operate along paths A or B, shown inFigure 7.1; needy students would apply for living-expense grants, eitherdirect to the SLSB or via their schools.
However, the sheer size of the administrative burden falling on theSLSB if it were required to deal with some 420,000 secondary schoolapplications (2000 figures), in addition to the half million or so at thetertiary level, may argue against a direct administrative arrangementbetween secondary-school student applicants and the SLSB. It is truethat the central loans body in the UK, the Student Loans Company,administered effectively and efficiently similarly high numbers of loanapplications. But it remains the case that the coverage of the Thai loans schemeis very large in comparison with loans schemes in other developing countries,which usually cover only tens of thousands of students. For this reason, wealso lay out the workings of a possible, more decentralized, scholarship schemeworking through the Ministry of Education provincial offices.
The SLSB would allocate scholarship budgets to the 75 provincialloans offices. Needy students would apply for grants, via their schools(MOE and other ministry schools including university demonstrationschools). Schools would vet the applications and submit them in bulk tothe provincial offices. Each provincial office would distribute its grantsbudget to student applicants using an identical mechanism employed bythe SLSB for tertiary-level student loans. All applications within a givenprovince are placed in a central provincial computer base and grants wouldbe distributed in ascending order of parental income size, until the totalavailable provincial budget has been distributed.
Inevitably, the actual cut-off point of parental income for grantsrecipients will differ from province to province. Non-distributed grantsbudgets in provinces that had reached the maximum parental income limitwould be returned to the SLSB. Remaining undistributed provincial grantsbudgets, together with a central unallocated reserve, would be allocated tothose provinces where there remained qualified scholarship applications.
International Institute for Educational Planning http://www.unesco.org/iiep

110
Student loans in Thailand: are they effective, equitable, sustainable?
The objective would be to equalize the cut-off point of parental incomeacross provinces.
In the first year of the scheme, it may be necessary to withhold afairly sizeable reserve and unallocated first-round loans may be large insome provinces. But once the general parameters of the scheme havebeen identified in the first year, only marginal second-round budgetallocations should be necessary in subsequent years.
The decentralized alternative is shown in path D of Figure 7.1. Ithas some similarities with present MOE loan arrangements, but there aretwo major differences. Unlike at present, the provincial budget allocationwould be based on objective criteria related to the incidence of need ineach province. Such criteria include average income levels, the povertyratio and the number of poor teenagers in each province (both studentsand drop-outs). Some of these data sets have been developed as part ofthe research underscoring the present paper (Chapter 6). Secondly,scholarship distribution to students would take place at the provincialoffice level, unlike the present cumbersome arrangements where some2,500 institutions distribute loans to their students.
Finance reform
Chapter 5 argued that the loans scheme is not financially viable inits present form. We have recommended, though not only for financialreasons, that the upper-secondary element of the loans scheme beconverted to one of grants. For tertiary education, there appears to be noalternative other than to raise recovery ratios to more acceptable levels.
The repayment and recovery ratios can be raised by tightening thepresent liberal repayment conditions. We ran simulations employing threeinstruments, separately and in combination, to examine how these mightimprove recovery. These were: raising the rate of interest on the loanfrom its present 1 per cent level, shortening the repayment period from15 to 8 years and fixing annual repayments in real (rather than nominal)terms. We also simulated the effect of these measures on the repaymentburden falling on the individual borrower. The simulations, and detailedresults, are described in Appendix 2.
International Institute for Educational Planning http://www.unesco.org/iiep
111
Policy conclusions and implications for reform
The simulations may provide a general framework that can aid thedecision-maker in developing new repayment conditions. Raising the rateof interest payable on loans or shortening the loan repayment period wouldleave the borrower still with a relatively light repayment burden; but therecovery ratio would rise to only some 30 per cent. Linking repayments tothe inflation rate will raise the recovery ratio (the return to the loans fund) tosome 40-47 per cent, depending on the level of administration costs. Thisoutcome is in line with comparative international standards. If, in addition,the rate of interest were raised to 3 per cent, then recovery ratios of up to56 per cent would be possible; this would be a very acceptable outcome incomparison with those for loans schemes in other countries.
Reform on these lines seems to be feasible in terms of the annualrepayment burden. While we have no hard information on what is anacceptable annual repayment burden level for Thai graduates, we mayfollow the practice in other studies of assuming a maximum feasiblerepayment burden of around 10 per cent. For males, the annual repaymentburden is acceptable under these options; it never reaches 10 per cent.The burden is heavier for women (because of gender differences inanticipated earnings), but except for the years towards the end of thepayment horizon, it is generally below 10 per cent.
Keeping the repayment burden relatively low decreases theprobability of repayment default. However, to the extent that evidencewas forthcoming that the repayment burden could be raised further withoutdeleterious effects on student incentives (say to about 12-13 per cent ofincome), then repayment conditions could be further hardened, withcommensurate improvements in the recovery ratio.
The loans scheme and educational reform
In this section, we consider how far ongoing plans for educationalreform in Thailand are consistent with the present working of the loansscheme and the changes proposed in this paper.
MOE decentralization
The Thai Government is committed to a programme of decentralizationof the administration of the national education system. It seems that a centralelement of this reform will be a downward movement of administrative
International Institute for Educational Planning http://www.unesco.org/iiep

112
Student loans in Thailand: are they effective, equitable, sustainable?
responsibility from the central ministry in Bangkok to new LocalEducation Authorities (LEAs) relating to local education districts that maybe below the level of the present provincial education offices. The new LEAswould be given considerably enhanced responsibilities and greater autonomythan the present provincial offices. However, no final decision has been made,at the time of writing, on the administrative level at which autonomy wouldreside. In contrast, our recommendations for the reform of the system of aidfor upper-secondary-level students, with a replacement of loans byscholarships, entail recentralization.
In advocating the replacement of loans by grants, we recommend acessation of current arrangements for upper-secondary schools todistribute loans (now replaced by scholarships) to their students. Instead,one scenario for reform of the loans scheme entails the administrationand granting of scholarships for upper-secondary-school students by the75 provincial education offices, thus leading to a greater centralizationof aid administration.
Such reform is consistent with current education decentralizationplans, to the extent that the new LEAs will be located at the level of theprovince. Even if this were not the case, scholarship administration shouldremain at the provincial level; we would not recommend scholarshipsadministration at a lower level, for a number of reasons, relating totargeting, equity and efficiency. First, the availability of provincial-leveldata (some of which were developed as part of the background work forthis paper) will make it possible to achieve an equitable allocation ofscholarship budgets in the future. Parallel data sets, relating to smallergeographical areas, are not available. Second, it is thought that it will bedifficult to maintain an efficient and horizontally equitable system ofscholarship budget allocation and distribution, based on a large numberof administrative units (numbering in the hundreds). Alternatively, theco-ordination and monitoring of 75 provincial loans administration unitsseems quite feasible.
As a final point, we emphasize the differences in objectives sought byreform of the student loans system and from educational managementdecentralization. The latter emphasizes local autonomy, local differences anddiversity of education services. But loans and scholarship schemes areessentially concerned with finance, not with the provision of educationservices. An underlying theme of this paper is the importance of maintaining
International Institute for Educational Planning http://www.unesco.org/iiep

113
Policy conclusions and implications for reform
horizontal equity and an acceptable degree of uniformity of treatment inrelation to need. To achieve these objectives, a loans/scholarship schemedoes not have to be tied to the formal system of educational managementand administration. Thus while it may be advantageous if the localadministrative unit of a loans/scholarship programme and of educationalmanagement were to coincide, this is by no means necessary.
Vouchers
Under the new Education Act a system of educational vouchers isto be put into place. A central objective of voucher schemes is to introducea greater degree of consumer (student and parental) choice, leading tointer-school competition and a more effective school system. This wouldbe achieved through making the education system more responsive toconsumer demand, i.e. it would become more demand-driven than atpresent. In most countries, student loans are seen as a mechanism formaking the education system (at the tertiary level) more demand driven.The loans system is often an element of a policy of greater cost recoveryand diversification of funding sources for universities. The introductionof higher university tuition fees, facilitated by the availability of studentloans, results in a diminished relative dependency on government fundingand a greater role for tuition fees. This leads to competition amongstuniversities. Universities will reach out to attract new students (and thetuition income they bring); course offerings move more in line with theneeds of the labour market, teaching quality will be enhanced andadministrative procedures will be improved.
The Thai Student Loans Scheme is unusual in not being supportiveof a demand-driven approach; indeed, it tends to strengthen the present,dominantly supply-driven direction of the schooling system. The keyelement here is the current arrangement for the distribution of studentloans by educational institutions, from individual institutional loanbudgets. Schools, colleges and universities, particularly in the privatesector, use student loans as a means of competing for students. Less weightis given to the quality and type of educational services offered to attractnew students; more attention is given to the availability of highlysubsidized student loans. The reforms in the loans system of distributionrecommended in this chapter are designed to be more supportive of ademand-driven system, by removing the task of loans distribution fromthe educational institutions.
International Institute for Educational Planning http://www.unesco.org/iiep

114
Student loans in Thailand: are they effective, equitable, sustainable?
Recommendations from the 1999 Policy Review and theirimplementation
We have noted that the present paper represents an updated andrevamped version of the policy review, prepared in 1999, as part of theAsian Development Bank Social Sector Programme Loan (Ziderman,1999). This review was based on the workings of the Thai loans schemeduring its early years (1996-1999), the period we have referred to as oneof ‘heady expansion’. We summarize in Table 7.1 the main findings ofthat review (which are no less applicable today) and the recommendationsput forward for policy reform; we also register the minimal extent towhich these recommended reforms have been implemented, thus far.
Table 7.1 Student Loans Scheme review (1999):summary matrix of findings and recommendations
1. Targetingpoor students
The loans scheme in practicedoes not realize its centralobjective of targeting thepoor because:• existing system of top-
down loan budgetsallocationto educational institutionsis inappropriate for thispurpose
• targeting criteria are toogeneral; eligibility ceilingstoo high
• loans distribution is basedmore on screening foreligibility than onproactive targeting
• many non-poor studentsare in receipt of loanswhile considerablenumbers of poor studentsdo not receive loans
1.1 Empower nationalStudents Loans andScholarships Bureau(SLSB) to run anintegrated scheme
1.2 Abolish MOE andMUA loans allocationcommittees
1.3 SLSB to distributeloans to all eligibleapplicants on equalbasis
1.4 SLSB to adopt morerealistic, stricter,definition of targetgroup
1.5 Adopt more proactivepolicies to reach targetgroup
Review findings Policy actionsrecommended
Implementedreforms
Policy issue
International Institute for Educational Planning http://www.unesco.org/iiep

115
Policy conclusions and implications for reform
Table 7.1 (continued)
2. Equitabledistribution of loans
3. Prevention ofdrop-outs
4. Financialsustainability
A considerable degree ofhorizontal inequity resultsfrom:• lack of conformity in
eligibility criteria and loansmaxima across the MUAand MOE
• autonomy of educationalinstitutions, to fix loans size(up to designated maximum)
Evidence suggests that theloans scheme does not preventdrop-outs:• the interview survey showed
that only 30% of borrowerswould drop out in theabsence of a loan
• in the present period ofunemployment and fallingincomes, the poor are loathto enter into long-termrepayment commitments
The scheme is over-subsidizedand financially non-viable:• it is not a revolving fund• loan recovery to the Fund
does not exceed 15% on anaverage loan
• the hidden grant (subsidy)element to the student istypically about 80% of loan
• the annual individualrepayment constitutes aminimal burden out ofexpected income (3-4%)
• financial performance isbelow comparativeinternational standards
2.1 SLSB to operate oncommon eligibilitycriteria and loancomposition/size acrossthe system
2.2 MOE and MUA nolonger to allocate loanbudgets
2.3 Educational institutionsno longer to distributeloans: to have afacilitating role only
3.1 Replace loans forupper-secondary-levelstudents with carefullytargeted grants
4.1 Tighten repaymentconditions by linkage toinflation, together withoption of either higher3% interest rate orshorter payback horizon(8 years)
4.2 Aim at achieving 50%recovery (with anacceptable 10-12%annual repaymentburden for females andlower for males)
2.1 Common incomeeligibility ceiling forthe MOE and MUAintroduced
Review findings Policy actionsrecommended
Implementedreforms
Policy issue
International Institute for Educational Planning http://www.unesco.org/iiep

116
Student loans in Thailand: are they effective, equitable, sustainable?
Review findings Policy actionsrecommended
Implementedreforms
Policy issue
There is no systematic budgetingof the scheme in relation todefined need. Growing numbersof applicants and fixed nominalbudgetary allocations for newborrowers have led to fallingaverage loan size, in bothnominal and real terms
There is a lack of strong centralcontrol. The scheme suffersfrom:• a weak central loans
committee• no appointment of full-time
manager• no central professional/
technical staff• no active forward planning• no central information or
monitoring system in place
The scheme neglects policyobjectives that are central toloans schemes in other countries.Many use a loans scheme tofacilitate the imposition ofrealistic tuition fees in publichigher education (and to alsoenhance the demand for privatehigher education), which in turnleads to:• generation of additional
funding for the universitysystem
• reduction of the burden ofgovernment from expansion ofthe university system
• more competition and greaterefficiency amongst universityinstitutions
5.1 Develop a systematicfinancial plan.
5.2 Plan simultaneouslyannual number ofborrowers and the levelof individual support
6.1 Introduce a strongcentral committee todirect the loans scheme,through personal (ratherthan representative)appointment
6.2 Immediate appointmentof full-time Managerand technical/professional staff
6.3 Design a centralplanning and monitoringsystem. Build integratedinformation database
7.1 Introduce, in stages, astreamlined, less-subsidized loansscheme focusing on thetertiary sector, with theaim of achieving thecomplementary roles ofgreater efficiency andexpansion, togetherwith revenue generationand reduced publicfinancing burdens
6.1 Relatively greaterpersonal(expertise-based)representation onstudent loanscommittee
6.2 Full-time managerappointed
5. Adequate financingof the scheme
6. Effectiveadministrationof the scheme
7. Expansion andefficiency of thehigher educationsystem
International Institute for Educational Planning http://www.unesco.org/iiep

117
Policy conclusions and implications for reform
However, it was never envisaged that the reform process wouldproceed at a swift pace. Institutional inertia and, perhaps, vested interestsmitigate against the acceptance and adoption of any new, far-reachingprogramme of reform. More recently, however, discussion of plans forthe reform of the student loans scheme has entered the public discourse.
The well-received report of Richupan and Visaruthvont (2001),emanating from the Office of Education Reform (which is concernedwith the implementation of the new National Education Act), recommendsa range of reforms of the SLS, aimed at enhancing the financialsustainability, equity and targeting of the scheme. Many of therecommendations of the report parallel those made in the earlier policy paper(Ziderman, 1999) and summarized in the matrix constituting Table 7.1. Theseinclude restricting student loans to tertiary-level enrolment, raising interestrates towards market levels and upgrading the professional/technical expertiseof the student loans office, which would give greater emphasis to co-ordination,planning and the financial sustainability of the fund.
Some of the suggested reforms in the report are more radical. Itrecommends that the responsibilities for repayments collection betransferred from the Krung Thai Bank to the Revenue Department, MOF;repayments could be deducted automatically from the wages of thoseborrowers who are subject to personal income tax.
Of broader interest is the strong recommendation that the burden onthe government of tertiary education funding should be lightened, througha reduction in direct budgetary allocations to institutions, in parallel withthe raising of tuition fees. This shift from supply-side (government)financing to demand-side finance (with more cost sharing being assumedby students and their families) would be facilitated by the broadavailability of student loans. Thus, with the aim of covering more students,the report recommends raising the official entitlement ceiling for loans –from the present family income maximum of 150,000 baht to a familyincome not exceeding five times annual tuition fees or 300,000 baht,depending on which amount is higher. If adopted, these recommendationswould imply a dramatic reorientation in the objectives of the studentloans scheme in Thailand; the aim of facilitating cost recovery wouldbecome a central concern, with less weight given to the more directlysocial objectives of greater equity and broader access to higher educationfor the poor.
International Institute for Educational Planning http://www.unesco.org/iiep

International Institute for Educational Planning http://www.unesco.org/iiep

119
References
Carlson, S. 1992. Private financing of higher education in Latin Americaand the Caribbean. Regional Studies Programme, Report No. 18.Latin American and the Caribbean Technical Department.Washington, DC: World Bank.
Chantavanich, S. 1999. “Analysis of the targeting of the Student LoansScheme”. In: UNESCO-Bangkok: Education management andfinancing in Thailand: review and recommendations - researchpapers. Compiled and prepared by UNESCO-Bangkok as part ofthe Asian Development Bank Social Sector Programme Loan, inthe framework of the Education Management and Finance Study(Project TA2997896-THA), July 1999. Bangkok: UNESCO.
Cresswell, A. M. 1999. Educational finance in Thailand: a review andrecommendations for improving allocative efficiency. Reportprepared for UNESCO-Bangkok as part of the Asian DevelopmentBank Social Sector Programme Loan, in the framework of theEducation Management and Finance Study (Project TA2997896-THA), July 1999. Bangkok: UNESCO.
Education Loan Fund Act. 1998. Rajakijja-nubegsa, Vol. 115,Section 15A, pp. 16-31.
Kakwani, N.; Pothong, J. 1998. “Impact of economic crisis on the standardof living in Thailand”. In: Indicators of Well-being and PolicyAnalysis, 4(2), October. Bangkok: National Economic and SocialDevelopment Board.
Lertpaitoon, S. 1999. Guidelines for setting the Higher EducationDevelopment Fund (in Thai). Bangkok: ONEC (Office of theNational Education Commission).
Ministry of Finance. 1995. The Student Loan Scheme. Report submittedto the Cabinet, 31 March. Bangkok: Ministry of Finance.
International Institute for Educational Planning http://www.unesco.org/iiep

120
Student loans in Thailand: are they effective, equitable, sustainable?
Office of the National Education Commission. 1996. Agreement onproportional allocation of the Student Loan Fund. Letter No. 1310/0246, 8 January 1996 (in Thai). Bangkok: ONEC.
Office of the National Education Commission. 1997. Education inThailand 1997. Bangkok: ONEC.
Office of the National Education Commission. 2000. Education inThailand 2000-2001. Bangkok: ONEC.
Office of the National Education Commission. 2001. Education inThailand 2001-2002. Bangkok: ONEC.
Richupan, S.; Visarthvont, C. 2001. Guidelines for administration andmanagement of the Education Loans Fund. Bangkok: Office ofEducational Reform (in Thai).
Ziderman, A. 1999. The Student Loans Scheme in Thailand: a reviewand recommendations for efficient and equitable functioning of theScheme. Report prepared for UNESCO-Bangkok as part of the AsianDevelopment Bank Social Sector Programme Loan, in the frameworkof the Education Management and Finance Study (ProjectTA2997896-THA) , July 1999. Bangkok: UNESCO.
Ziderman, A. 2002a. “Alternative objectives of national student loansschemes: implications for design, evaluation and policy”. Specialinternational issue on student fees, grants and loans. In: WelshJournal of Education, July, 2002.
Ziderman, A. 2002b. “Financing student loans in Thailand: revolvingfund or open-ended commitment?” In: Economics of EducationReview, August, 2002.
Ziderman, A.; Albrecht, D. 1995. Financing universities in developingcountries. The Stanford Series on Education and Public Policy.London: The Falmer Press.
International Institute for Educational Planning http://www.unesco.org/iiep

121
Appendix 1
Loans Interview Surveys
Purpose
In the last quarter of 1998, three field surveys were carried out toprovide background information for the loans scheme policy review(reported in Ziderman, 1999). The central purpose of the surveys was tocollect information, from loans scheme clients and potential clients, onthe efficacy of the scheme in meeting its central objectives. Key questionsin the surveys were: How important was the scheme in discouraging drop-out? How would loan recipients manage to finance education in theabsence of the loans scheme? Why did many eligible students not takeup a loan? What was the potential for the loans scheme in encouragingyouth to enrol in secondary education?
The survey populations for the three studies were: students in receiptof loans; poor, non-borrowing students; and non-student youth, aged 15-17, from poor families.
Sample design
The samples were identified via present and past student listings atlocal educational institutions. Using quota sample techniques, the studentsamples were representative in terms of gender and type of schooling(upper-general secondary and vocational-secondary schooling, Rajabhatinstitutes and open and closed universities).
The sample size in the three surveys was as follows:
SLS borrowers: 210Non-borrowing students: 210Non-student youth aged 15-17(family income < 100,000 baht): 80
International Institute for Educational Planning http://www.unesco.org/iiep

122
Student loans in Thailand: are they effective, equitable, sustainable?
The sample was drawn from five provinces. NESDB ranks the76 Thai provinces in order of per capita income. From this ranking it ispossible to identify provinces with a high incidence of poverty (‘poor’provinces) and those with low poverty (‘rich’ provinces). In addition tothe inclusion of Bangkok, Mae Hong Son (Northern region) andMahasarakham (North-eastern region) were selected as examples of poorprovinces and Ayutthaya (Central region) and Suratthani (Southern region)as rich provinces.
Fieldwork
Data collection for the surveys was subcontracted to ABAC-KSCInternet Poll Research Center, Assumption University.
Major findings
While the detailed survey results have not been published, selectedfinding of the three surveys are provided in Chantavanich (1999). Someof the central results from the surveys are presented in Chapter 6:Tables 6.4 and 6.5 are derived from the survey of loan recipients, Table 6.6from the survey of non-borrowing (but eligible) students, and Table 6.8is from the survey of non-student youth, aged 15-17.
International Institute for Educational Planning http://www.unesco.org/iiep

123
Appendix 2
Improving financial performance:a simulation approach
In this Appendix, we discuss alternative policies that may be adopted toraise the rate of loan recovery. We then probe the efficacy of thesealternative measures in improving the net recovery ratio and follow thisby an examination of the feasibility of such reforms. This we do by lookingat the burden on borrowers of the resulting higher loan repayments, inrelation to expected incomes. We confine the results presented to thecase of undergraduate study at university (simulations for otherprogrammes of study are available on request). There are two reasons forthis. First, the intention is to provide general broad areas of magnitudeonly and the results for different levels and types of courses do not differgreatly. Second, since we have recommended that the loans scheme beabrogated at the upper-secondary level, it did not seem appropriate topresent detailed simulations for the upper-secondary-level case here.
Lowering student subsidies: three instruments
The recovery ratio may be enhanced by increasing the level ofrepayments in relation to loans (reducing the hidden grant) or byeconomies in administration costs. Assuming the latter are forthcoming,we concentrate on the effects of a policy change to decrease the subsidyby raising the repayment level per loan. Basically, this requires a tighteningin the present liberal repayment conditions. We consider three instruments,which may be applied individually or in concert. Rates of interest on theprincipal can be raised closer to market levels; annual repayments can bemade in real rather than nominal terms (i.e. payments are linked toinflation); the 15-year repayment period can be shortened to provide amore rapid payback. We assume the following repayment schedule spreadover eight years (derived from merging repayment percentages foradjacent years), as follows (Table A2.1).
International Institute for Educational Planning http://www.unesco.org/iiep

124
Student loans in Thailand: are they effective, equitable, sustainable?
Table A2.1 Student loans: possible 8-year annual repaymentschedule*
Year 1 2 3 4 5 6 7 8
Repayment 1.5 5.5 7.5 9.5 13.0 17.0 21.0 25.0(percentage ofprincipal)
* Derived by merging current repayment percentages for adjacent years.
In Table A2.2 referring to first-degree courses at universities, wesimulate the effects on the repayment ratio of implementing these policies.Our point of reference is Box A I (the intersection of Column A andRow I), which shows the repayment ratio under present repaymentconditions. Moving down Column A, we may see the effects ofsuccessively more stringent repayment conditions. Shortening therepayment period from 15 to 8 years (Box A II) raises the repaymentratio from 21 to 30 per cent (for the 6 per cent discount rate case);alternatively, instituting full linkage of repayments to inflation wouldincrease the repayment ratio from 21 to 52 per cent (Box A III). Acombination of both policies, results in a 62 per cent repayment ratio(A IV). Moving across the table, we see the effect of higher interest rates:raising the interest rate from the present 1 per cent to 7 per cent (D I)enhances the repayment ratio from 21 to 38 per cent. With a combinationof all three instruments, very high repayment ratios in the 80 per centrange are indicated, reducing the hidden grant to borrowers to under 20per cent.
International Institute for Educational Planning http://www.unesco.org/iiep

125
Appendices
Table A2.2 Repayment ratio: the effect of alternative changes on loanrepayment conditions, undergraduate programmes (%)*
Interest payment on loans
A B C D
Loan repayment 1% 3 % 5% 7%conditions (present rate) (market rate)
I. Present conditions:• Non-linked to inflation• Long repayment horizon
(15 years) 21 27 33 38
II. Non-linked to inflation+ Short repayment horizon(8 years) 30 34 38 42
III. Linked to inflation+ Long repayment horizon 52 64 75 87
IV. Linked to inflation+ Short repayment horizon (8 years) 62 70 78 85
* Assumption: 6 % discount rate.
Improving the recovery ratio
The results given in Table A2.2 refer to the direct loan repaymentsfrom the typical borrower; to examine the effect of these policyinstruments in reducing losses to the fund (the overall recovery ratio),we must take account of default and administration costs. These resultsare given in Table A2.3, for alternative levels of administration costs andan assumed 5 per cent rate of repayment default. The recovery ratio underpresent policies is shown in Box A I, for alternative administration costsand 5 per cent default. Moving across the table shows the effect of higherinterest rates in raising the recovery ratio; moving down the table we seethe effects of other policies (shorter repayment horizon and inflationlinkage). With full inflation linkage, the shorter payment horizon and a5 per cent interest rate, the overall recovery ratio reaches 70 per cent; onthe basis of comparative international experience, this would be anextremely favourable outcome for a student loan programme of this type.But it is unlikely to prove feasible. Not all of the policy options presentedin Table A2.3 are viable, because of their deleterious effect in raising therepayment burden falling on borrowers.
International Institute for Educational Planning http://www.unesco.org/iiep

126
Student loans in Thailand: are they effective, equitable, sustainable?
The repayment burden
In the remaining part of this appendix, we examine the efficacy ofintroducing stricter repayment conditions by simulating their effect onthe repayment burden. Separate simulations were run measuring therepayment burden for each of the options shown in Table A2.3 in termsof the ratio of payment on the loan, to the probable level of annual income(for each year of repayment). Since it is cumbersome to present the fulldetailed simulations, we provide summary results only in Table A2.4.The figures in the table show the ratio of the present value of repaymentsto the present value of annual incomes, over the total repayment period.We have noted (in Table 5.4) that under present repayment conditions,first-degree graduates incur a very light repayment burden of only 2.2 percent and 3.5 per cent, for males and females respectively, in present valueterms (block I A of Table A2.4). From Table A2.4, we may note how therepayment burden rises with increasingly stringent repayment conditions.
Table A2.3 Recovery ratios on loans: the effect of changes inrepayment conditions at alternative levels ofadministration costs, undergraduate programmes* (%)
Interest payment on loans
A B C
Interest rate: 1% Interest rate: 3% Interest rate: 5%
Administration Administration AdministrationLoan repayment costs costs costsconditions 2% 1% 0.5% 0.25% 2% 1% 0.5% 0.25% 2% 1% 0.5% 0.25%
I. Present conditions:• Non-linked to inflation• Long repayment
horizon (15 years) 8 14 17 18 13 19 22 24 19 25 28 29
II. Non-linked to inflation+ short repaymenthorizon (8 years) 18 23 26 27 22 25 30 31 26 31 34 35
III. Linked to inflation+ long repaymenthorizon (15 years) 30 40 44 47 41 51 56 58 53 62 67 69
IV. Linked to inflation+ short repaymenthorizon (8 years) 44 52 55 57 52 59 63 64 59 66 70 72
* Assumptions: 5% default; 6% discount rate.
International Institute for Educational Planning http://www.unesco.org/iiep

127
Appendices
Table A2.4 Present values of repayment burden*: loan repayment as apercentage of annual income, alternative repaymentconditions (%)
Interest payment on loans
A B C
Loan repayment 1% 3% 5%conditions Males Females Males Females Males Females
I. Present conditions: 2.2 3.5 2.8 4.4 3.3 5.3• Non-linked to inflation• Long repayment
horizon (15 years)
II. Non-linked to inflation 5.3 8.3 6.0 9.4 6.6 10.4+ short repaymenthorizon (8 years)
III. Linked to inflation 5.7 8.5 7.0 10.3 8.2 12.1+ long repaymenthorizon (15 years)
IV. Linked to inflation 11.7 8.7 13.0 9.6 14.0 10.6+ short repaymenthorizon (8 years)
* Excluding years of grace, 6 % discount rate.
The simulations in Table A2.4 provide a general framework that canaid the decision-maker in developing new repayment conditions. Thetable suggests that just raising the rate of interest payable on loans or ashortening of the loan repayment period would, each, leave the borrowerwith a relatively light repayment burden; but the recovery ratio wouldrise to only some 30 per cent (Table A2.3).
Linking repayments to the rate of inflation, but with the repaymenthorizon and the rate of interest unchanged (block III A) or with 3 per centinterest rate (block III B), constitutes a possible framework for reformingthe repayment regime. It would secure recovery ratios in the order of50 per cent. Reform on these lines seems to be feasible in terms of theannual repayment burden. While we have no hard information on what isan acceptable annual repayment burden level for Thai graduates, we mayfollow the practice in other studies of assuming a maximum feasiblerepayment burden of around 10 per cent (see Carlson, 1992).
International Institute for Educational Planning http://www.unesco.org/iiep

128
Student loans in Thailand: are they effective, equitable, sustainable?
Table A2.5 shows the annual repayment burden (annual repaymentas a percentage of annual income) for these two options; this will differsomewhat from year to year. For males, the annual repayment burden isacceptable; it never reaches 10 per cent. The burden is heavier for womenin the 1 per cent interest case. At a 3 per cent interest rate, the annualrepayment burden is more substantial, but except for the years towardsthe end of the payment horizon, is generally below 10 per cent also.Moreover, even with these higher loan repayments, the bulk of theadditional earnings from completing an undergraduate course – over 85per cent of incremental earnings for males and somewhat less for females– would still accrue to the graduates (Table A2.6). Thus the return fromeducational investment is unlikely to be eroded unduly by the higherlevel of loan repayments.
Table A2.5 Annual loan repayment burden, undergraduate courses, by gender: alternative repayment conditions (%)
III A III BLinked to inflation, Linked to inflation,
1% interest rate 3% interest rate
Age Males Females Males Females
25 2.6 3.9 4.7 7.026 3.6 5.3 5.6 8.227 3.9 5.8 5.8 8.628 4.3 6.3 6.0 8.929 4.6 6.8 6.2 9.230 4.9 7.2 6.4 9.431 5.1 7.6 6.5 9.632 5.8 8.6 7.0 10.433 6.4 9.5 7.5 11.034 7.0 10.3 7.9 11.635 7.5 11.0 8.2 12.236 8.0 11.8 8.5 12.637 8.4 12.4 8.8 13.038 8.8 13.0 9.0 13.339 9.1 13.5 9.0 13.5
Present value (6%) 5.7* 8.5* 7.0* 10.3*
* Excluding years of grace.
International Institute for Educational Planning http://www.unesco.org/iiep

129
Appendices
Keeping the repayment burden relatively low decreases theprobability of repayment default. However, to the extent that evidencewas forthcoming that the repayment burden could be raised further withoutdeleterious effects on student incentives (say to about 12-13 per cent ofincome), then repayment conditions could be further hardened, withcommensurate improvements in the recovery ratio.
Table A2.6 Present values of repayment burden: loan repayment as apercentage of incremental income, alternative repaymentconditions (%)
Interest payment on loans
A B C
1% 3% 5%Loan repaymentconditions Males Females Males Females Males Females
I. Present conditions:• Non-linked to inflation
• Long repayment horizon(15 years) 3.5 6.1 4.4 7.7 5.3 9.2
II. Non-linked to inflation+ Short repaymenthorizon (8 years) 7.5 13.3 8.4 15.0 9.3 16.6
III. Linked to inflation+ Long repaymenthorizon (15 years) 8.9 15.0 10.8 18.2 12.7 21.3
IV. Linked to inflation+ Short repaymenthorizon (8 years) 16.5 17.9 18.3 20.0 20.0 21.8
Assumptions: excluding years of grace; 6% discount rate.
International Institute for Educational Planning http://www.unesco.org/iiep

International Institute for Educational Planning http://www.unesco.org/iiep

131
Appendix 3
Student aid: grants and scholarships10
Student aid is available not only through loans but also from grants (aimedat the poor) and scholarships (for academic achievement). A main thrustof the argument of this paper is that student loans in Thailand are moreakin to grants than to commercial loans because of the heavy governmentsubsidy of the student loans scheme, leading to a large hidden grantelement in each loan. This Appendix pulls together information fromdiverse sources on the extent to which grant and scholarship aid isavailable to students in upper secondary and tertiary education.
Upper-secondary education
Most of the grant and scholarship funds under the aegis of the MOEare aimed at offering assistance to teachers and educational personnel ordirected towards primary and lower-secondary schooling. There are onlytwo aid funds focussing directly on secondary-school students:
‘SEMA’ Life Development Fund. This fund was initiated by theCabinet in 2000, with an initial amount of 350 million baht (the full sizeof the fund is set at 600 million baht). Its objective is to provide supportfor poor students who have graduated from lower or upper-secondaryschool, to enable them to continue studies within vocational education.The fund is operated by a committee, chaired by the Permanent Secretary,MOE.
‘SEMA’ Life Development Fund to Assist Girl Students. Initiated in1994 to support and expand education, to continue schooling. At 2000,the amount of money is approximately 1.3 million baht. The fund isoperated by a committee chaired by the Deputy Permanent Secretary,MOE.
10. This Appendix is based on a report prepared by Professor Nonglak Wiratchai.
International Institute for Educational Planning http://www.unesco.org/iiep

132
Student loans in Thailand: are they effective, equitable, sustainable?
Table A3.1 shows the total number of grant recipients under theSEMA Life Development Fund, grant size and size of total grant funds.Grants are provided by the MOE to secondary-level students studying inschools/institutions under various ministries, including the MOE. Sincethe number and size of grants are relatively small, entailing highadministration costs, the possibility of merging these two funds withinthe student loans scheme is under consideration.
Table A3.1 SEMA Life Development Fund, classified by ministry
Area of study Number of Grant amount Total amount Periodgrants (baht) (baht)
Ministry of PublicHealth
B. Nursing degree, inmemory of the King’sMother 100 30,000 3,000,000 Only for 2000
Last 2 years of B.Nursingdegree 100 20,000 2,000,000 Only for 2000
Two-year Certificate 50 10,000 500,000 2001-02(not in nursing) per year per year
B. Nursing degree 87 30,000 2,610,000 2001-04per year per year
Co-operation with Toyota 43 10,000 430,000 2001-04and MOE per year per year
Ministry of Labour 280 5,000 1,400,000 2001and Social Welfare
MOE
Department of Vocational 812 5,000 4,060,000 2001Education
Rachmonkol Institute ofTechnology 40 5,000 200,000 2001
Receipts from the LotteryCommission 44,016
Total 1,512 14,244,016
International Institute for Educational Planning http://www.unesco.org/iiep

133
Appendices
These grants are the major source of student aid in upper-secondaryschools (apart from loans). Although each of the schools/institutions underMOE has its own aid funds which have been raised by the alumni andparent association or direct donation, the sums involved are quite smallin terms of those available from the SEMA funds.
In 1999, the ONEC conducted a survey of some of the major privatenon-profit foundations, concerning the number and amount of studentgrants they give to secondary schools. The following Table A3.2 providesdetails from that survey (with information on higher education, whereappropriate).
Table A3.2 Grants from various large private non-profit foundations
Foundation Year Provinces Number Amountof grants of grant
Child development 1999 7 in the North-EastUpper secondary 42 126,000
Dr Saem Pringpuangkaew 2000 6 in the NorthUpper secondary 10 58,680Higher education 3 51,000
Sahathai 2000 Bangkok and other provincesSecondary and vocational 217 654,022education
Mitr Mual Deak 1999 Bangkok and other provincesSecondary education 343 56,595Higher education 145 23,925
Muslim Women Help for 2000 Bangkok and other provincesorphansPrimary-higher education 50 80,000
Total 810 1,050,222
Higher education
There are two types of aid funds for university-level students: thosedonated by private foundations, but managed by the MUA, and those runby individual educational institutions.
International Institute for Educational Planning http://www.unesco.org/iiep

134
Student loans in Thailand: are they effective, equitable, sustainable?
Funds donated directly to the MUA
The Education Service Division of the MUA is responsible for theallocation of donated grants and scholarships to the 24 public universities;grants may be made on an annual basis or continue for the full term ofstudy. Details are shown in Table A3.3.
The process of allocating grants to the 24 public universities is asfollows:
• the Education Service Division, MUA, announces the grants thatare available each year and distributes the announcement, includingapplication forms, to every university/institution;
• universities/institutions process the grant applications, check theapplication forms and other evidence for accuracy, interview andscreen eligible students and send the list of the eligible students tothe MUA;
• the ‘Elected Subcommittee’ at the MUA selects recommendedstudents from the pool of eligible applicants from all the universitiesand submits a list to the Fund Committee for approval;
• students sign a contract, under which they are required to submit aneducational progress report, as determined by the MUA.
International Institute for Educational Planning http://www.unesco.org/iiep

135
Appendices
Table A3.3 Grants administered by the MUA, 2000
Types of grants Number of grants Size of grant Total funding
Continuing grants
Charoen Pokapan Company 113 10,000 1,130,000
Petroleum Oil Company 50 6,000 300,000
Takahachi Foundation 30 22,000 660,000
David Kiang 12 15,000 180,000
JCC Education for 21st Century 20 30,000 600,000
‘Chai Cheewin Likit’ Foundation 50 10,000 500,000
Annual grants
Esso’s Bangkok 200-year celebration 34 10,000 340,000
Cao Industrial Thailand, Co. 14 8,000 112,000
Phra Sangaratch Foundation 25 15,000 375,000
MALI Milk Fund 4 4,000 16,000
Diethhalm Co. 2 5,000 10,000
Noi Paorohit Foundation 40 10,000 400,000
Bank of America Fund’s Bangkok Temporarily ceased for this year200- year celebration
John F. Kennedy Foundation Temporarily ceased for this year
Children’s Education Fund Temporarily ceased for this year
Source: MUA.
In the past 10 years, the MUA has offered scholarships to enhancethe number of mathematics teachers. Scholarships, of 50,000 baht, areprovided for approximately 60 students in each Faculty of Education.Students are required to teach in schools for two years after graduation.However, due to the economic crisis, this project has been suspended,possibly temporarily.
University aid funds
These aid funds are derived from donations to the university itself.The funds emanate from various categories of donors, including banks,
International Institute for Educational Planning http://www.unesco.org/iiep

136
Student loans in Thailand: are they effective, equitable, sustainable?
alumni associations, professors emeritus, private non-profit organizations,etc. The grant fund usually bears the name of the donor and the occasionof donation. Forms of funding include grants providing full or partialsupport for poor but able students, and scholarships focused on very ablestudents. Table A3.4 provides information on grants/scholarships providedat selected universities – mainly from Silapakorn University (formerlyknown as University of Fine Arts), and Sukhothai Thammathirat OpenUniversity.
Table A3.4 Grants at the university level, selected examples
University / Title of the grant Year initiated Purpose Total initial funds
Silapakorn University
Professor Sill Peerasri 1997 Poor students 165,846
International Artist 1999 Students 48,813
SURA THIP Group 1998 Students 250,000
Phraya Wisugam Silprasit 1994 Students 3,200,000
Wang Ta Pra Welfare 2000 Students 10,000
The King’s 60th Birthday 1987 Arts students 80,000
Petcharatana 1997 Female students n/a
Songsri-Ouy 1981 Students n/a
Sla Tagdist 1990 Students 20,000
Sasithorrn-Chuan Ratanarak 1997 Poor and able students 100,000
Field Marshall ThanomKittikajorn 1997 Poor students n/a
Sukhothai Open University.
SRA THI Group 1997 Students 300,000
Phra Sangkharach 1987 Monk students 10,000 per year
University staff and student affairs 1991 Staff and students n/a
Raphi Patanasak 1987 Staff and students 1,000,000
100-year Ratanagosin 1983 Research 10,000,000
700-year Lai Sue Thai 1983 Teaching Thai 60,000,000
Professor Thamnong Singkalwanich 1984 Agriculture students 250,000
International Institute for Educational Planning http://www.unesco.org/iiep

137
Appendices
Suranaree Technological University
Staff development 1997 Staff members 50,000,000
Research and development 1997 Staff and students 50,000,000
NIDA
Staff development 1989 Staff members n/a
Research grant 1963 Research grant 50,000,000
Source: Lertpaitoon (1999).
In 1999, the ONEC conducted a survey of tertiary-level institutions,on the amount of student aid available at public and private universitiesand Rajabhat institutes, respectively. In all, 42 institutions responded:12 public universities, 11 private universities and 19 Rajabhat institutes.Survey data, derived from the original questionnaires, are presented inAppendix Table 9 and, in summary form, in Table A3.5.
In the 42 institutions for which information is available, there were1,352 separate grant/scholarship funds; aid was available for8,404 students to a total value of 179,661,444 baht. The average amountof grant/scholarship per recipient, at the surveyed institutions, was 7,779,87,825 and 4,573 baht at the public universities, private universities andRajabhat institutes respectively. These differences no doubt reflectdiffering levels of tuition fees at the three types of institution. The averageshide a wide range of support, from 1,000 baht up to 50,000 baht, dependingon the objective of the support offered.
Next, the average size of grant/scholarship per institution iscalculated. This average scholarship for each type of institution, basedon the sample of 42 institutions, is used to estimate total grant/scholarshipsupport nationally. Recognizing that data for only about a third of allhigher-education institutions may not be nationally representative, roughestimations of the total amount of scholarship support available areprovided in row h of Table A3.5. Overall, total grant and scholarshipfunding available in all three types of institutions totalled some 500 millionbaht in 1999 (based on average institution amount, across all institutions)or 713 million baht (based on summing the three individual estimates,based on type of institution). This compares with total loan disbursementsof some 17,500 million baht, for tertiary-level institutions in 1999.
International Institute for Educational Planning http://www.unesco.org/iiep

138
Student loans in Thailand: are they effective, equitable, sustainable?
Table A3.5 Total amount of student grant and scholarship aid, tertiaryinstitutions, 1999
Public Private Rajabhat Totaluniversities universities institutes
Survey data
a. Number of aid funds 794 122 436 1,352
b. Number of grant recipients 5,750 1,475 1,179 8,404
c. Total value of grants (‘000 baht) 44,728 129,542 5,392 179,661
d. Average grant size – c/b (baht) 7,779 87,825 4,573 21,378
e. Number of institutions surveyed 12 11 19 42
f. Value of total grants per institution 3,727 11,778 284 4,278– c/e (‘000 baht)
National total
g. Number of institutions 24 52 41 117
h. Estimated total grant funds 89,456 612,378 11,635 500,485– (f)(g) (‘000 baht)
Source: ONEC: questionnaire data.
Most of the universities/institutions, regardless of type, employ asimilar administration process to distribute grants and scholarships. Theadministrative structure (see Figure A3.1) usually consists of anadministering office (Educational Scholarship Unit) within the Divisionof Student Service and Welfare, under the Department of Student Affairs,which is chaired by the Vice-President for Student Affairs. This unit co-ordinates with similar units in each of the faculties, under an AssociateDean of Student Affairs.
International Institute for Educational Planning http://www.unesco.org/iiep

139
Appendices
Figure A3.1 Line of administration: student grants/scholarships
Conclusion
Grants and scholarships can constitute an important instrument forreducing inequality in educational opportunity. It is unfortunate that datapertaining to this issue are scarce. However, some general conclusionsmay be drawn on the relative importance of student grants and scholarshipsin Thailand. Scholarship aid under the MOE for upper-secondary studentsis quite modest, since most of the funding is aimed at primary and lower-secondary students and teachers. While grant and scholarship aid is muchmore generous at the tertiary level, total funding (about 500-700 millionbaht per year) is seen to be extremely low in comparison with studentloan annual allocations.
If a national Student Loans and Scholarships Bureau was to beestablished, as recommended in this paper, it could provide a frameworkfor combining the large number of small grant and scholarship fundsunder a single organizational framework and unifying regulations andprocedures.
Vice-President for Student Affairs Department of Student Affairs
Head, Division of Student Services and Welfare
Head, Educational Scholarship Unit
Associate Dean of Student Affairs: Faculty of Sciences Faculty of Education Faculty of Engineering Faculty of Commerce etc.
International Institute for Educational Planning http://www.unesco.org/iiep

International Institute for Educational Planning http://www.unesco.org/iiep

141
Statistical appendix
Appendix Table 1 Number of loan recipients, 1996-2000
Academic year 1996 1997 1998 1999 2000
MOE: Upper secondary
General 58,935 144,244 230,225 260,285 251,843
Lower vocational 34,306 102,583 180,666 192,523 167,398
Total 93,241 246,827 410,891 452,808 419,241
MOE: Tertiary
Upper vocational 20,019 71,302 136,324 166,061 178,098
Diploma 1,810 6,206 9,386 9,145 8,266
Undergraduate 12,651 46,782 77,461 100,291 121,501
Other level 60 243 2,018 3,188 3,237
Total 34,540 124,533 225,189 278,685 311,102
Total MOE 127,781 371,360 636,080 731,493 730,343
MUA: Universities
Public 14,352 43,158 71,877 94,795 102,579
Private 7,178 20,907 40,233 57,416 70,306
Total MUA 21,530 64,065 112,110 152,211 172,885
Grand total 149,311 435,425 748,190 883,704 903,228
Source: MOE – from SLS Office.MUA – from Ministry of University Affairs.
International Institute for Educational Planning http://www.unesco.org/iiep

142
Student loans in Thailand: are they effective, equitable, sustainable?
Aca
dem
ic y
ear
199
6 1
997
19
98
1999
2
000
Stud
ent
Loa
nSt
uden
tL
oan
Stud
ent
Loa
nSt
uden
tL
oan
Stud
ent
Loa
n e
nrol
men
tco
vera
geen
rolm
ent
cove
rage
enro
lmen
tco
vera
geen
rolm
ent
cove
rage
enro
lmen
tco
vera
ge (
%)
(%)
(%)
(%)
(%)
MO
E:
Upp
er s
econ
dary
Gen
eral
809,
262
7.28
882,
915
16.3
495
7,56
224
.04
1,03
0,46
525
.26
1,09
3,04
423
.04
Low
er v
ocat
iona
l66
3,96
85.
1774
2,42
213
.82
712,
483
25.3
668
7,12
928
.02
621,
491
26.9
3
Tota
l1,
473,
230
6.33
1,62
5,33
715
.19
1,67
0,04
524
.60
1,71
7,59
426
.36
1,71
4,53
524
.45
MO
E:
Tert
iary
Upp
er v
ocat
iona
l29
8,19
06.
7135
5,93
720
.03
390,
474
34.9
142
5,98
338
.98
438,
513
40.6
1
Dip
lom
a16
,548
10.9
420
,537
30.2
220
,083
46.7
418
,976
45.1
117
,736
46.6
1
Und
ergr
adua
te13
5,79
79.
3216
4,97
428
.36
181,
097
42.7
720
2,67
449
.48
237,
975
51.0
6
Tota
l**
452,
535
7.62
541,
448
22.9
659
1,65
437
.72
647,
633
42.5
469
4,22
444
.35
Tot
al M
OE
**1,
923,
765
6.64
2,16
6,78
517
.13
2,26
1,69
928
.03
2,36
5,22
730
.79
2,40
8,75
930
.19
MU
A:
Und
ergr
adua
te
Pub
lic
626,
669
2.29
685,
952
6.29
735,
956
9.77
740,
178
12.8
180
6,04
612
.73
Pri
vate
164,
613
4.36
178,
583
11.7
117
8,12
722
.59
159,
124
36.0
819
0,65
036
.88
Tot
al M
UA
791,
282
2.72
864,
535
7.41
914,
083
12.2
689
9,30
216
.93
996,
696
17.3
5
Gra
nd to
tal
2,71
5,04
75.
503,
031,
320
14.3
63,
175,
782
23.5
03,
264,
529
26.9
73,
405,
455
26.4
3
*C
over
age
(%)
= L
oan
reci
pien
ts /
Enr
olm
ent
x 10
0. L
oan
reci
pien
t da
ta a
re p
rovi
ded
in A
ppen
dix
Tabl
e 1.
**
Doe
s no
t in
clud
e ‘O
ther
lev
el’
in A
ppen
dix
Tabl
e 1.
App
endi
x Ta
ble
2L
oans
sch
eme
cove
rage
*, 1
996-
2000
International Institute for Educational Planning http://www.unesco.org/iiep

143
Appendices
Appendix Table 3 Total loan disbursements, 1996-2000(million baht)
Academic year 1996 1997 1998 1999 2000
MOE: Upper secondary
General 857.65 1,825.86 2,476.16 2,641.21 2,195.04
Lower vocational 770.60 2,199.06 3,507.14 3,685.77 2,875.71
Total 1,628.25 4,024.92 5,983.30 6,326.98 5,070.75
MOE: Tertiary
Upper vocational 569.77 2,148.97 3,881.65 476.53 4,949.63
Diploma 47.48 187.01 278.65 275.44 234.92
Undergraduate 381.84 1,592.90 2,608.29 3,317.87 3,875.85
Other level 1.39 8.23 86.47 156.98 179.05
Total 1,000.48 3,937.11 6,855.06 8,512.82 9,239.45
Total MOE 2,628.73 7,962.03 12,838.36 14,839.80 14,310.20
MUA: Undergraduate
Public 625.14 2,398.54 3,693.93 4,708.71 4,934.54
Private 475.17 1,796.66 2,977.78 4,320.46 5,371.11
Total MUA 1,100.31 4,196.20 6,671.71 9,029.17 10,305.65
Grand total 3,729.04 12,157.23 19,510.07 23,868.97 24,615.85
Source: MOE – from SLS Office.MUA – from Ministry of University Affairs.
International Institute for Educational Planning http://www.unesco.org/iiep

144
Student loans in Thailand: are they effective, equitable, sustainable?
App
endi
x Ta
ble
4N
umbe
r of
new
and
old
loan
rec
ipie
nts,
199
6-20
00
Aca
dem
ic y
ear
1996
1997
1998
1999
2000
Rec
ipie
nts
Rec
ipie
nts
Rec
ipie
nts
Rec
ipie
nts
Rec
ipie
nts
New
New
Old
New
Old
New
Old
New
Old
MO
E:
Upp
er s
econ
dary
Gen
eral
58,9
3511
0,56
233
,682
148,
537
81,6
8812
3,11
513
7,17
010
2,31
214
9,53
1
Low
er v
ocat
iona
l34
,306
79,7
4922
,834
111,
430
69,2
3673
,959
118,
564
63,0
7310
4,32
5
Tota
l93
,241
190,
311
56,5
1625
9,96
715
0,92
419
7,07
425
5,73
416
5,38
525
3,85
6
MO
E:
Tert
iary
Upp
er v
ocat
iona
l20
,019
52,4
9318
,809
69,5
1066
,814
39,4
9312
6,56
835
,128
142,
970
Dip
lom
a1,
810
4,62
71,
579
3,78
15,
605
2,14
66,
999
1,63
96,
627
Und
ergr
adua
te12
,651
31,4
2815
,354
25,2
8152
,180
13,8
1686
,475
13,8
0310
7,96
8
Oth
er le
vel
6019
251
1,20
781
194
82,
240
782
2,45
5
Tota
l34
,540
88,7
4035
,793
99,7
7912
5,41
056
,403
222,
282
51,3
5225
9,75
0
Tot
al M
OE
127,
781
279,
051
92,3
0935
9,74
627
6,33
425
3,47
747
8,01
621
6,73
751
3,60
6
MU
A:
Und
ergr
adua
te
Pub
lic
14,3
5227
,915
15,2
4327
,075
44,8
0220
,892
73,9
0313
,813
88,7
66
Pri
vate
7,17
814
,662
6,24
519
,909
20,3
2415
,623
41,7
9312
,286
58,0
20
Tot
al M
UA
21,5
3042
,577
21,4
8846
,984
65,1
2636
,515
115,
696
26,0
9914
6,78
6
Gra
nd to
tal
149,
311
321,
628
113,
797
406,
730
341,
460
289,
992
593,
712
242,
836
660,
392
Sour
ce:
MO
E –
fro
m S
LS
Off
ice.
MU
A –
fro
m M
inis
try
of U
nive
rsit
y A
ffai
rs
International Institute for Educational Planning http://www.unesco.org/iiep

145
Appendices
App
endi
x Ta
ble
5 A
vera
ge lo
an s
ize*
, new
and
old
rec
ipie
nts,
199
6-20
00 (
baht
)
Aca
dem
ic y
ear
1996
1997
1998
1999
2000
Rec
ipie
nts
Rec
ipie
nts
Rec
ipie
nts
Rec
ipie
nts
Rec
ipie
nts
New
New
Old
New
Old
New
Old
New
Old
MO
E:
Upp
er s
econ
dary
Gen
eral
14,5
5211
,294
17,1
349,
154
13,6
679,
016
11,1
636,
676
10,1
11
Low
er v
ocat
iona
l22
,463
19,4
0328
,540
16,0
6224
,804
17,4
2120
,220
13,6
9619
,285
Tota
l17
,463
14,6
9221
,743
12,1
1518
,776
12,1
7015
,362
9,35
313
,881
MO
E:
Tert
iary
Upp
er v
ocat
iona
l28
,461
27,7
4136
,831
21,4
8235
,748
24,5
3229
,974
19,8
2529
,749
Dip
lom
a26
,232
28,8
0534
,028
25,3
2732
,630
26,9
8031
,082
22,4
4129
,899
Und
ergr
adua
te30
,183
32,3
7637
,476
28,3
9836
,228
30,6
0433
,478
26,7
1532
,564
Oth
er le
vel
23,1
6732
,135
40,3
9241
,110
45,4
3839
,314
53,4
4235
,000
61,7
84
Tota
l28
,966
29,4
4736
,989
23,6
1735
,871
26,3
6131
,608
21,9
9231
,223
Tot
al M
OE
20,5
7219
,385
27,6
5415
,305
26,5
3415
,328
22,9
1712
,348
22,6
52
MU
A:
Und
ergr
adua
te
Pub
lic
43,5
5855
,822
55,1
2445
,117
55,1
8545
,794
50,7
6941
,047
49,2
03
Pri
vate
66,1
9886
,237
85,2
3063
,029
84,7
7464
,351
79,3
2255
,152
80,8
95
Tot
al M
UA
51,1
0666
,296
63,8
7452
,707
64,4
1953
,734
61,0
8347
,687
61,7
30
Gra
nd to
tal
24
,97
52
5,5
95
34
,49
419
,62
63
3,7
60
20
,16
43
0,3
54
16,1
46
31,3
38
Sour
ce:
MO
E –
fro
m S
LS
Off
ice.
MU
A –
fro
m M
inis
try
of U
nive
rsit
y A
ffai
rs. *
Ave
rage
loa
n si
ze =
Tot
al l
oans
dis
burs
emen
t /N
umbe
r of
loa
n re
cipi
ents
.
International Institute for Educational Planning http://www.unesco.org/iiep

146
Student loans in Thailand: are they effective, equitable, sustainable?
Appendix Table 6 Number of borrowers and total loansallocation, MOE and MUA, 1996-2000
Ministry of Education MUA
Academic year Upper-secondary Tertiary- levelschool institutions Universities
1996
Borrowers Number 93,241 34,540 21,530
Distribution 63 % 23 % 14 %
Loans allocation Million baht 1,628 1,000 1,024
Distribution 45 % 27 % 28 %
1997
Borrowers Number 246,827 124,533 64,065
Distribution 57 % 29 % 14 %
Loans allocation Million baht 4,025 3,937 4,193
Distribution 33 % 32 % 35 %
1998
Borrowers Number 410,891 225,189 112,110
Distribution 55 % 30 % 15 %
Loans allocation Million baht 5,983 6,855 6,672
Distribution 31 % 35 % 34 %
1999
Borrowers Number 452,808 278,685 152,211
Distribution 51 % 32 % 17 %
Loans allocation Million baht 6,327 8,513 9,029
Distribution 26 % 35 % 39 %
2000
Borrowers Number 419,241 311,102 172,885
Distribution 47 % 34 % 19 %
Loans allocation Million baht 5,071 9,239 10,306
Distribution 21 % 37 % 42 %
Source: SLO.
International Institute for Educational Planning http://www.unesco.org/iiep

147
Appendices
Appendix Table 7 Number and percentage of loanrecipients by income group andinstitution, selected universities, 1997
Parental income
Institution Up to 120 - 150 - 250 - Total120,000 150,000 200,000 300,000
baht baht baht baht
Number % Number % Number % Number % Number %
Public universities:
Chiangmai 1,955 54.6 640 17.9 489 13.6 499 13.9 3,583 100
Thammasart 450 66.5 51 7.5 97 14.3 79 11.7 677 100
Mahidol 993 87.5 63 5.5 52 4.6 27 2.4 1,135 100
Ubonratchatani 684 76.5 65 7.3 87 9.7 58 6.5 894 100
Suranaree 1,319 82.9 141 8.9 98 6.1 33 2.1 1,591 100Technology
King Mongkut: 906 75.8 86 7.2 104 8.7 99 8.3 1,195 100Thonburi
King Mongkut: 1,701 59.5 418 14.6 396 13.9 344 12 2,859 100N.Bangkok
Private universities:
Mahanakorn 175 54.3 29 9 68 21.1 50 15.5 322 100Technology
Assumption 240 58.7 31 7.6 55 13.4 83 20.3 409 100(ABAC)
Yonok 239 67.3 31 9 31 9 44 12.7 345 100
Total 8,662 66.6 1,555 12 1,477 11.3 1,316 10.1 13,010 100
Source: Minutes, SLSC meeting, 25 March, 1998.
International Institute for Educational Planning http://www.unesco.org/iiep

148
Student loans in Thailand: are they effective, equitable, sustainable?
Appendix Table 8 School/institution type classified by level/typeof education and unit of control
Level and type of education School/institution Unit of control
Upper-secondary education
Academic track (3 years) Public secondary schools MOE, DGEDemonstration schools affiliated with MOE, ORICRajabhat institutesSchools for disabled children MOE, DGEPrivate secondary schools MOE, OPECShort-course training programmes MOE, DNFEEcclesiastical schools for monks MOE, DRADemonstration schools affiliated with MUA,universities Universities
Vocational track (2-3 years) Vocational schools MOE, DVERajamangala Institutes of Technology MOE, ORITCDramatic arts, fine arts colleges MOE, DFASports schools MOE, DPEPrivate vocational schools MOE, OPECShort-course training programmes MOE, DNFE
Higher education
Diploma level (2 years) Rajabhat institutes MOE, ORICRajamangala Institutes of Technology MOE, ORITCPublic vocational schools MOE, DVEPrivate vocational schools MOE, OPECDramatic arts, fine arts colleges MOE, DFAColleges of physical education MOE, DPEPrivate vocational schools MOE, OPECShort-course training programmes MOE, DNFENursing colleges MPH, MODColleges for specialized fields Other ministries
Degree level (4-6 years) Universities/HE institutions MUARajabhat institutes MOE, ORICRajamangala Institutes of Technology MOE, ORITCDramatic arts, fine arts colleges MOE, DFAPrivate colleges and universities MOE, OPECColleges for specialized fields Other ministries
Key:DGE = Department of General Education MOE = Ministry of EducationDFA = Department of Fine Arts MUA = Ministry of University AffairsDVE = Department of Vocational Education MPH = Ministry of Public HealthDPE = Department of Physical Education MOD = Ministry of DefenceDNFE = Department of Non-formal educationDRA = Department of Religious AffairsORIC = Office of Rajabhat Institute CouncilORITC = Office of Rajamangala Institutes of Technology CouncilOPEC = Office of Private Education Commission
International Institute for Educational Planning http://www.unesco.org/iiep

149
Appendices
App
endi
x Ta
ble
9G
rant
/sch
olar
ship
aid
, by
type
: sel
ecte
d un
iver
sitie
s, 1
999
Inst
itutio
nSc
hola
rshi
p/G
rant
Con
tinui
ngA
nnua
lTo
tal
Num
ber
Num
ber
Tota
l fun
dN
umbe
rN
umbe
rTo
tal f
und
Num
ber
Num
ber
Tota
l fun
dof
fund
sof
reci
pien
tsam
ount
of fu
nds
of re
cipi
ents
amou
ntof
fund
sof
reci
pien
tsam
ount
(bah
t)(b
aht)
(bah
t)
Pub
lic u
nive
rsit
ies
Kas
etsa
rt32
240
2,74
3,50
079
203
1,79
9,00
023
544
34,
542,
500
Uni
vers
ity
Kho
nkae
n U
nive
rsity
3642
05,
210,
390
144
1,54
59,
013,
437
180
1,96
514
,223
,827
Mae
phal
uang
11
30,0
001
130
,000
22
60,0
00U
nive
rsity
Mae
jo U
nive
rsity
2496
1,06
3,00
012
3021
8,50
036
126
1,28
1,50
0
Mah
asar
akha
mU
nive
rsity
2069
726,
400
2910
879
7,08
649
981,
523,
486
Nar
aesu
arn
Uni
vers
ity15
8572
9,50
020
208
1,09
5,70
035
293
1,82
5,20
0
Nor
th B
angk
ok P
IT26
901,
037,
000
231,
505
6,03
4,50
049
1,59
57,
071,
500
Sura
nare
e13
723,
184,
660
1778
771,
000
3015
03,
955,
660
Tech
.Uni
vers
ity
Sila
pako
rn U
nive
rsity
1371
776,
000
1661
460,
100
2913
21,
236,
100
Tha
ksin
Uni
vers
ity9
2632
1,74
032
9471
8,50
041
120
1,04
0,24
0
Tha
mm
asar
t30
141
2,10
1,22
060
638
4,53
8,50
090
779
6,63
9,72
0U
nive
rsity
Wal
aila
k U
nive
rsity
1039
933,
600
842
394,
500
1847
1,32
8,10
0
All
publ
ic22
91,
350
18,8
57,0
1044
14,
513
25,8
70,8
2379
45,
750
44,7
27,8
33un
iver
siti
es
International Institute for Educational Planning http://www.unesco.org/iiep

150
Student loans in Thailand: are they effective, equitable, sustainable?
App
endi
x Ta
ble
9(C
ontin
ued)
Inst
itutio
nSc
hola
rshi
p/G
rant
Con
tinui
ngA
nnua
lTo
tal
Num
ber
Num
ber
Tota
l fun
dN
umbe
rN
umbe
rTo
tal f
und
Num
ber
Num
ber
Tota
l fun
dof
fund
sof
reci
pien
tsam
ount
of fu
nds
of re
cipi
ents
amou
ntof
fund
sof
reci
pien
tsam
ount
(bah
t)(b
aht)
(bah
t)
Pri
vate
uni
vers
itie
s
Ban
gkok
Uni
vers
ity7
340
13,9
54,2
951
161
883,
440
850
114
,837
,735
Chr
istia
n C
olle
ge3
728
,000
1223
93,5
0015
3012
1,50
0
Dus
ut T
hani
Col
lege
00
03
315
6,06
03
315
,660
Hat
yai C
olle
ge0
00
410
181,
581
410
181,
581
Hua
chew
Cha
lerm
p5
231,
081,
040
1123
697
1,55
016
259
2,05
2,59
0
Nor
th E
aste
rnU
nive
rsity
554
108,
000
571
1,45
0,00
010
125
1,55
8,00
0
Paya
p U
nive
rsity
1411
127
,442
,440
3317
62,
484,
540
4728
729
,926
,980
Ran
gsit
Uni
vers
ity10
149
73,0
76,9
001
220
,000
1115
173
,096
,900
Tata
naba
ndit
Uni
v.2
201,
840,
000
115
40,0
003
351,
880,
000
Sain
t Lou
is C
olle
ge2
1875
0,61
02
612
0,00
04
2487
0,61
0
Web
ster
Uni
vers
ity1
505,
000,
000
00
01
505,
000,
000
All
priv
ate
4977
212
3,28
1,28
573
703
6,40
0,67
112
21,
475
129,
541,
556
univ
ersi
ties
International Institute for Educational Planning http://www.unesco.org/iiep

151
Appendices
Raj
abha
t ins
titu
tes
Bur
eeru
m10
1614
1,50
02
118,
000
1227
149,
500
Chi
angr
ai7
5451
4,00
022
5725
5,50
029
111
769,
500
Jom
buen
g4
846
,500
1023
55,0
0014
3110
1,50
0
Kam
pang
petc
h4
661
,000
1463
230,
000
1869
291,
000
Lam
pang
1024
109,
000
24
8,00
012
2811
7,00
0
Nak
ornp
atho
m13
3127
1,60
027
5321
7,00
040
8448
8,60
0
Nak
orns
awan
473
24,5
0011
1711
6,50
015
9014
1,00
0
Pibo
olso
ngkr
am10
1916
6,50
05
2464
,000
1543
230,
500
Phet
chab
uri
513
185,
000
1132
170,
255
1645
355,
255
Phet
chab
uri W
ithay
00
019
6722
2,50
019
6722
2,50
0
Phet
chab
oon
27
43,0
0020
4511
1,50
022
5215
4,50
0
Phra
nako
rnsr
iayu
th7
2015
3,00
063
113
286,
500
7013
343
9,50
0
Phuk
et8
1413
1,00
013
3914
3,00
021
5327
4,00
0
Sako
lnak
ornI
510
187,
500
24
16,0
007
1420
3,50
0
Song
khla
1027
101,
000
1683
81,0
0026
110
182,
000
Sura
tthan
i9
1417
4,00
010
1673
,500
1930
247,
500
The
psat
ree
527
161,
000
4190
215,
000
4611
736
6,00
0
Udo
rnth
ani
714
259,
000
1024
117,
000
1738
376,
000
Uta
radi
t6
1121
0,00
012
2672
,700
1837
282,
700
All
Raj
abha
t12
638
82,
939,
100
310
791
2,46
2,95
543
61,
179
5,39
2,05
5in
stit
utes
Gra
nd to
tal
404
2,51
014
5,07
7,39
582
46,
007
34,7
34,4
491,
352
8,40
417
9,66
1,44
4
Sour
ce:
Sur
vey
cond
ucte
d by
ON
EC
on
scho
lars
hips
and
gra
nts
at t
erti
ary
inst
itut
ions
, in
1999
(ra
w d
ata
from
que
stio
nnai
res)
.
International Institute for Educational Planning http://www.unesco.org/iiep

International Institute for Educational Planning http://www.unesco.org/iiep

IIEP publications and documents
More than 1,200 titles on all aspects of educational planning have been publishedby the International Institute for Educational Planning. A comprehensive catalogueis available in the following subject categories:
Educational planning and global issuesGeneral studies – global/developmental issues
Administration and management of educationDecentralization – participation – distance education – school mapping –
teachers
Economics of educationCosts and financing – employment – international co-operation
Quality of educationEvaluation – innovation – supervision
Different levels of formal educationPrimary to higher education
Alternative strategies for educationLifelong education – non-formal education – disadvantaged groups – gender
education
Copies of the Catalogue may be obtained on request from: IIEP, Communication and Publications Unit
[email protected] of new publications and abstracts may be consulted at the following
website: http://www.unesco.org/iiep
International Institute for Educational Planning http://www.unesco.org/iiep

International Institute for Educational Planning http://www.unesco.org/iiep

The International Institute for Educational Planning
The International Institute for Educational Planning (IIEP) is an international centre foradvanced training and research in the field of educational planning. It was established byUNESCO in 1963 and is financed by UNESCO and by voluntary contributions from MemberStates. In recent years the following Member States have provided voluntary contributions tothe Institute: Denmark, Finland, Germany, Iceland, India, Ireland, Norway, Sweden andSwitzerland.
The Institute’s aim is to contribute to the development of education throughout the world,by expanding both knowledge and the supply of competent professionals in the field ofeducational planning. In this endeavour the Institute co-operates with interested training andresearch organizations in Member States. The Governing Board of the IIEP, which approves theInstitute’s programme and budget, consists of a maximum of eight elected members and fourmembers designated by the United Nations Organization and certain of its specialized agenciesand institutes.
Chairperson:
Dato’Asiah bt. Abu Samah (Malaysia)Director, Lang Education, Kuala Lumpur, Malaysia.
Designated Members:
Carlos FortínAssistant Secretary-General, United Nations Conference on Trade and Development(UNCTAD), Geneva, Switzerland.
Thelma KayChief, Emerging Social Issues, United Nations Economic and Social Commission for Asiaand the Pacific (UNESCAP), Bangkok, Thailand
Jean Louis SarbibSenior Vice-President, World Bank, Washington DC, USA.
Ester ZulbertiChief, Extension, Education and Communication for Development (SDRE), Food AgricultureOrganization (FAO), Roma, Italy.
Elected Members:
José Joaquín Brunner (Chile)Director, Education Programme, Fundación Chile, Santiago, Chile.
Klaus Hüfner (Germany)Professor, Freie Universität Berlin, Berlin, Germany.
Zeineb Faïza Kefi (Tunisia)Ambassador Extraordinary and Plenipotentiary of Tunisia to France and Permanent Delegateof Tunisia to UNESCO.
Philippe Mehaut (France)Deputy Director, Centre d’études et de recherches sur les qualifications, Marseille, France.
Teboho Moja (South Africa)Professor of Higher Education, New York University, New York, USA.
Teiichi Sato (Japan)Ambassador and Permanent Delegate of Japan to UNESCO.
Tuomas Takala (Finland)Professor, University of Tampere, Tampere, Finland.
Inquiries about the Institute should be addressed to:The Office of the Director, International Institute for Educational Planning,
7-9 rue Eugène Delacroix, 75116 Paris, France.
International Institute for Educational Planning http://www.unesco.org/iiep

International Institute for Educational Planning http://www.unesco.org/iiep

For countries in Asia and the Pacific, copies may be obtained on request fromUNESCO Bangkok, Planning and Sector Analysis Unit (PSA)
[email protected] and [email protected]
UNESCO Bangkok, Planning and Sector Analysis Unit
The Planning and Sector Analysis (PSA) Unit at the UNESCO Asia and Pacific RegionalBureau for Education in Bangkok (UNESCO Bangkok) provides Member States in Asiaand the Pacific with policy-oriented research and information as well as policy advice togovernments involved in education sector restructuring and reform. PSA work focuses oncountry-based capacity building activities to strengthen technical skills and know-how ofnational partner agencies in a range of areas. These include: education sector planningand resource management (personnel, facilities, finances), management audits andinformation systems combining geographic referencing capability and training in statisticsand quantitative and qualitative survey techniques. It collaborates with governments andnational stakeholder groups in the implementation of recommendations made at the WorldEducation Forum in Dakar (2000).
PSA works together with the International Institute for Educational Planning (UNESCO/IIEP), the UNESCO Institute for Statistics (UIS) and major development agencies in Asiaand the Pacific, such as the Asian Development Bank, the World Bank, UN agencies andbilateral donors. PSA helps mobilize resources for education throughout the region. Italso acts as a catalyst in dialogues among partners at the country level, such as ministries,local authorities, the research community, and international funding and technical assistanceagencies. As a provider of policy advice, UNESCO has earned a reputation as an ‘honestbroker’ for its professional independence and its sensitivity to the interests and concernsof the countries it serves.
Inquiries about UNESCO Bangkok, Planning and Sector Analysis Unit (PSA) should beaddressed to:
The Office of the Director, UNESCO Bangkok, 920 Sukhumvit Road, P.O. Box 967Prakanong Post Office, Bangkok 10110, Thailand
e-mail: [email protected] and [email protected]
International Institute for Educational Planning http://www.unesco.org/iiep