student managed investment fund (mba) st. john's university
TRANSCRIPT
Student Managed Investment Fund (MBA)
St. John’s University Spring 2015
Cecilia Bergeret, Kristi Cook and Kui Sun Dr. John Neumann
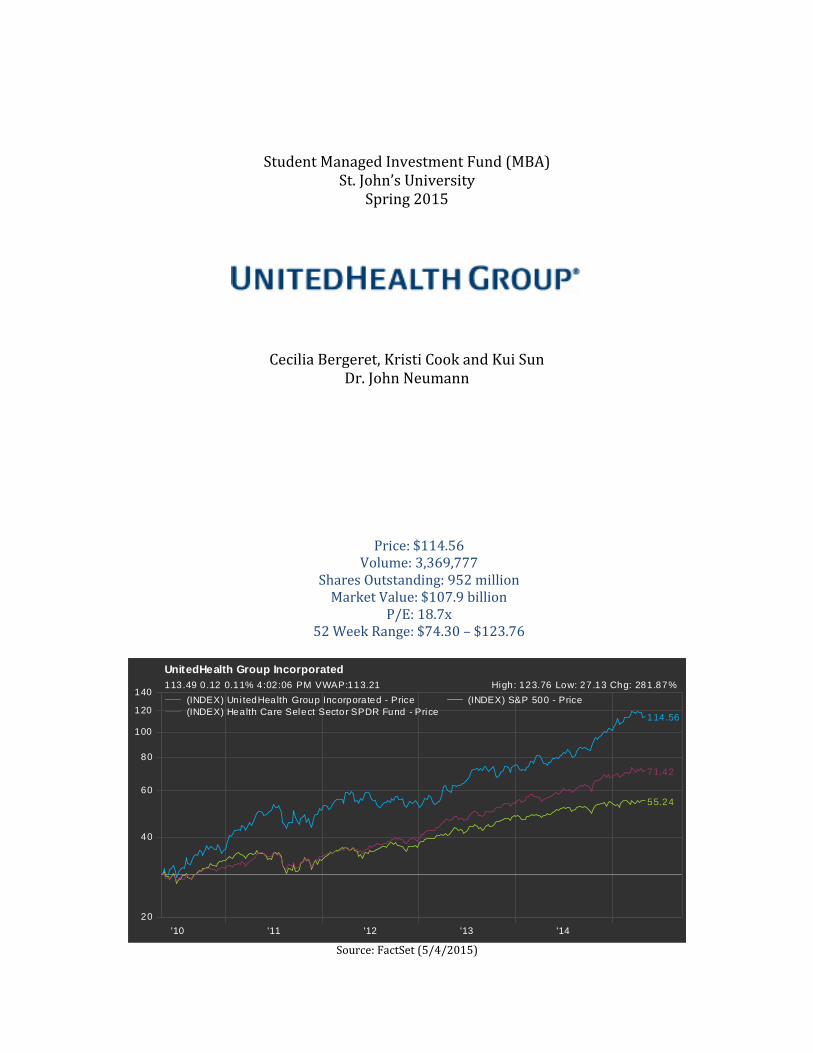
Price: $114.56 Volume: 3,369,777
Shares Outstanding: 952 million Market Value: $107.9 billion
P/E: 18.7x 52 Week Range: $74.30 – $123.76
'10 '11 '12 '13 '14
20
40
60
80
100
120
140
55.24
71.42
114.56
UnitedHealth Group Incorporated
113.49 0.12 0.11% 4:02:06 PM VWAP:113.21 High: 123.76 Low: 27.13 Chg: 281.87%
(INDEX) Uni tedHealth Group Incorporated - Price (INDEX) S&P 500 - Price
(INDEX) Health Care Select Sector SPDR Fund - Price
Source: FactSet (5/4/2015)

2
Table of Contents
I. EXECUTIVE OVERVIEW …………………………………………………………………………… 3 II. COMPANY OVERVIEW ……………………………………………………………………………... 4 III. INDUSTRY ANALYSIS ………………………………………………………………………………. 7 IV. FUNDAMENTAL ANALYSIS ………………………………………………………………........ 12 V. EARNINGS FORECAST ……………………………………………………………….................. 29 VI. RELATIVE VALUATION ………………………………………………………………................ 32 VII. ABSOLUTE VALUATION ……………………………………………………………………........ 34 VIII. RISK FACTORS ………………………………………………………………………………,.…….. 39 IX. CONCLUSION ………………………………………………………………..................................... 41 BIBLIOGRAPHY ……………………………………………………………………………………... 43
APPENDIX ………………………………………………………………........................................... 45

3
I. EXECUTIVE OVERVIEW The present study reviews UnitedHealth Group’s (“UNH”) historical and current information with the main objective of proposing a recommendation concerning its stock. To achieve this goal, our team completed a Business and Industry Analysis, a Fundamental Analysis, and a Relative and Absolute Valuation Analysis. Business Analysis: The Business Analysis shows an optimistic outlook for the company. UNH’s adaptable business model will allow the company to conform to the constantly changing health care industry environment, especially as it relates to the Affordable Care Act. UnitedHealth Group’s acquisition of Catamaran will help the company expand its pharmacy-benefit management sector, as spending on cutting edge drugs is a growing concern for health care companies.
Industry Analysis: Currently, UNH holds more than 30% of the managed health care industry’s market share. Our team selected five different competitors against which to compare UnitedHealth Group’s standing in the industry: Humana, Aetna, Cigna, Anthem, and WellCare Health Plans. An analysis of Porter’s Five-Force model has allowed us to characterize the industry as follows: high competition from rival sellers, low competition from potential new entrants, low competition from producers of substitute products, moderate supplier bargaining power, and moderate buyer bargaining power.
Fundamental Analysis: The Fundamental Analysis was comprised of a study of profitability ratios, efficiency ratios, liquidity ratios, leverage ratios, and a DuPont analysis. Overall, the study concludes that UNH has had a solid and stable performance throughout the last 10 years, aside from being an industry top performer. Relative Valuation: Upon completing the Relative Valuation of UnitedHealth Group, it became apparent that UNH’s current stock price was slightly higher than the average of our price estimates. However, considering the recent stock price fluctuations, our team decided to consider this valuation as neutral.
Absolute Valuation: Under the Absolute Valuation Analysis, UNH’s current price assumes a 15% DPS growth rate until 2020 with a subsequent infinite growth rate of 8.276% or less. Considering our team’s conservative approach in this phase of the study, UNH’s historical data and commitment to advance in its dividend policy brings an optimistic outlook for this analysis. Based on the overall analysis results, our team recommends the addition of 150 shares of UnitedHealth Group into the Graduate Student Managed Investment Fund.

4
II. COMPANY OVERVIEW Background UnitedHealth Group, founded in 1977, is a diversified health care company that is headquartered in Minnetonka, Minnesota1. Currently, UNH serves more than 100 million customers across the globe. Though UNH’s primary market exists within the United States, the company has also expanded to 125 foreign countries. UnitedHealth Group is determined to provide its customers “more for less”, or more high quality health care at a lower cost on behalf of both employers and governments alike. One of UNH’s claims to fame is their highly adaptable business model, which allows the company to quickly and easily meet the public’s needs, in a constantly evolving health care industry. UnitedHealth Group operates through two platforms: UnitedHealthcare and Optum. UnitedHealthcare addresses the health care needs of individual consumers, employers of any size, the public health marketplace, U.S. military personnel, and individuals that participate in the Medicare and Medicaid government programs. Optum is the sector of UNH which covers the management side of the business and is broken down into three areas: OptumHealth, OptumInsight, and OptumRx. OptumHealth accommodates the physical, emotional, and financial needs of its consumers; OptumInsight delivers software and information products, advisory consulting services and business process outsourcing to those in the health care industry; and OptumRx contributes pharmacy benefit management services to its customers2. Mission and Vision UNH has 5 core values:
Integrity – “Honor commitments. Never compromise ethics.” Compassion – “Walk in the shoes of people we serve and those with whom we
work.” Relationships – “Build trust through collaboration.” Innovation – “Invent the future, learn from the past.” Performance – “Demonstrate excellence in everything we do.”
UNH’s mission is simple: “To help people live healthier lives and to help make the health system work better for everyone”.
1 "Our History." UnitedHealth Group. 1 Jan. 2015. Web. 3 May 2015. 2 "Facts 2014 Q4." UnitedHealth Group Facts. UnitedHealth Group, 1 Jan. 2014. Web. 30 Apr. 2015.
5
“We seek to enhance the performance of the health system and improve the overall health and well-being of the people we serve and their communities.”
“We work with health care professionals and other key partners to expand access to quality health care so people get the care they need at an affordable price.”
“We support the physician/patient relationship and empower people with the information, guidance and tools they need to make personal health choices and decisions.”3
Acquisition of Catamaran Corporation On March 30, 2015, UnitedHealth Group announced its plans to acquire the pharmacy-benefit management company Catamaran. In its press release, UNH revealed its expectation to close the deal at an undisclosed date in the fourth quarter. Being that Catamaran (CTRX) is involved in pharmacy-benefit management, the company will be merged with the OptumRx sector at the point of acquisition. UnitedHealth Group also announced that it would pay out $12.8 billion in cash for the company, which is equal to $61.50 per share. By 2016, it is expected that $0.30 per share of net earnings will be attributed to the deal. The acquisition of Catamaran appears to be a beneficial action for UNH, with expenditures on cutting edge drugs becoming a growing preoccupation for employers and insurers alike4. The following is a snapshot of Catamaran Corporation’s stock on May 4, 2015, taken from FactSet:
Price: $59.58 Volume: 4,371,999 Shares Outstanding: 208 million Market Value: $12.4 billion P/E: 36.1 x 52 Week Range: $39.40 – $60.23
Affordable Care Act
The Affordable Care Act, otherwise known as Obama Care, was signed into law in March of 2010. However, the individual mandate, which requires all American citizens to have some form of health care, did not go into effect until November 15, 2014. By 2015 and 2016, all large employers (50+ workers) are required to insure all full-time employees5. While a major risk of the ACA is that the law restricts
3 "Mission & Values." UnitedHealth Group. 1 Jan. 2015. Web. 3 May 2015. 4 Mathews, Anna Wilde. "UnitedHealth to Buy Catamaran for $12.8 Billion in Cash.” WSJ. The Wall Street Journal, 30 Mar. 2015. Web. 1 May 2015. 5 "How Does ObamaCare Work?” ObamaCare Facts: Affordable Care Act, Health Insurance Marketplace. ObamaCare Facts, 1 Jan. 2015. Web. 1 May 2015.
6
insurers’ profitability on a per customer basis, according to Morningstar analyst Vishnu Lekraj, the law favors the larger firms. This is because the largest firms’ size allows them pricing leverage over health care providers6. Despite the industry’s overall drop in profitability, UnitedHealth Group has in fact seen an increase in the number of customers served since the law went into effect, as reported in their first quarter results of 2015. On March 31, 2014, UNH provided services to 87.4 million customers. As of December 31, 2014, after the individual mandate went into effect, the number of customers served increased to 88.5 million customers and then continued to increase to 101.5 million by March 31, 20157. This final increase in customers most probably resulted from the employer mandate that began in 2015. By 2016, it is safe to expect a continued increase in customers, as the remaining large employers are required to insure all full-time employees. One risk factor involving the ACA is the potential for a possible elected Republican president to either alter or do away with it in the future. However, as we will point out further on in this report, UNH experienced sustained success before the ACA was signed into law. Though Obama Care has undoubtedly benefited UNH, our team feels that the company would continue to thrive, even without the individual and employer mandate. Executive Officers and Directors
Stephen J. Hemsley – Chief Executive Officer David S. Wichmann – President and Chief Financial Officer Larry C. Renfro – Vice Chairman (UnitedHealth Group) and Chief Executive
Officer (Optum) Marianne D. Short – Executive Vice President and Chief Legal Officer D. Ellen Wilson – Executive Vice President, Human Capital Edson Bueno, M.D. – Chief Executive Officer (Amil) and Director Cory B. Alexander – Executive Vice President, External Affairs Terry Clark – Senior Vice President, Marketing & Brand Dirk McMahon – Executive Vice President, Chief of Enterprise Operations Richard Migliori, M.D. – Executive Vice President, Medical Affairs and Chief
Medical Officer William A. Munsell – Executive Vice President Don Nathan – Senior Vice President and Chief Communications Officer John S. Penshorn – Senior Vice President Eric S. Rangen – Senior Vice President and Chief Accounting Officer Jeannine M. Rivet – Executive Vice President Anthony Welters – Executive Vice President8
6 Petruno, Tom. "Seven Great Dow Stocks for Dividends." Kiplinger. Kiplinger, 11 Dec. 2014. Web. 3 May 2015. 7 "UNITEDHEALTH GROUP REPORTS FIRST QUARTER RESULTS." News Release. UnitedHealth Group, 16 Apr. 2015. Web. 1 May 2015. 8 "Executives." UnitedHealth Group. 1 Jan. 2015. Web. 3 May 2015.

7
III. INDUSTRY ANALYSIS Industry Overview The health care industry is divided into several different areas, which include hospitals, health insurance companies, pharmaceutical companies, biotechnology companies, and nursing homes, to name a few. In this research paper, our team focuses on UnitedHealth Group, as well as 5 different comparable health insurance companies that exist in the U.S. market. In the United States, health care insurance companies are largely owned and operated by private sector businesses. As of 2013, there were 835 health insurance companies in the United States9. Among the largest 125 companies of the 850, $755 billion in premiums was collected in 2013 (this is the most recent annual data available).10 However, of those 125 health insurance companies, only about 35 of them serve the American public, as a result of intense regulation and restrictions. The Health care industry in particular can form an enormous part of a country's economy. Based on the World Bank’s statistics11, the United States spent just over 17% of its GDP on health expenditures. With the Affordable Care Act’s individual and employer mandate being in full effect as of 2016, it is likely that this percentage will continue to increase. Thus, it presents a huge opportunity (along with some risks) for all health insurance companies. According to the United States Census Bureau's 2014 report12, in the 2013 calendar year, the percentage of individuals without health insurance coverage was 13.4%, or 42 million. The percentage of Americans with health insurance for all or part of 2013 was 86.6%. Among those individuals, 34.3% was covered by government health insurance and 17.3% was covered by Medicaid. Since Americans can get health insurance coverage individually or by their employers, the larger insurance companies must compete in both market segments. All in all, the health care industry in the United States is highly competitive and saturated. Porter’s Five Forces Competitive Analysis In order to analyze the principal competitive pressures for UNH, our team utilized Porter’s Five-force model of competition. The five competitive forces include competition from rival sellers, competition from potential new entrants to the industry, competition from producers of substitute products, supplier bargaining
9 "Industry Overview." Insurance Information Institute. N.p., n.d. Web. 6 May 2015. 10Heilbrunn, Evi. "Top Health Insurance Companies." US News. U.S.News & World Report, 5 Nov. 2014. Web. 5 May 2015. 11 "Health Expenditure, Total (% of GDP)." World Health Organization Global Health Expenditure Database. The World Bank, 2015. Web. 5 May 2015. 12 Smith, Jessica, and Carla Medalia. "Health Insurance Coverage in the United States: 2013." United States Census Bureau. U.S. Department of Commerce, 1 Sept. 2014. Web. 5 May 2015.

8
power, and customer bargaining power, respectively. We used this model to analyze UnitedHealth Group as follows: 1. Competition from rival sellers:
The rivalry intensity is high for UnitedHealth Group in the U.S. market. Based on a report from the Center for Medicare and Medicaid Services, health care spending increased 3.6% to reach $2.9 trillion, or $9,255 per person in 2013. This was the fifth consecutive year of a growth rate which remained in the 3.6% to 4.1% range13. This shows that the buyer demand in the health care industry in recent years has been growing slowly. The slow growth rate might be attributable to individuals buying one policy and sticking to it. The top three competitors of UnitedHealth Group are Humana, Aetna, and Anthem. Compared to these companies, UNH is the strongest based on financial performance and market share, though its competitors do present somewhat of a threat. However, as we know, it can be difficult to differentiate the products and services in the health care industry. Since health care management companies and companies that provide health care products are thrown into the mix with insurance companies, competition in the industry is intensified. Also, as a result of the limitation or elimination of price competition, insurance companies turn to non-price competition by offering buyers more agencies, expediency in claims settlement, and consumer accommodation through a generous interpretation of contract clauses. This idea of non-price competition increases the marginal cost of insurance companies. Lastly, from a consumer’s point of view, the costs for them to switch companies are very low and they have many options. For these reasons, our team concludes that the competition from rival sellers in the health care industry is very high.
2. Competition from potential new entrants: In the health care industry, the threat of new entrants is relatively low. The industry has certain barriers as a result of intense regulations and the high capital requirements that it takes for new companies to enter the market. Furthermore, consumers will be more likely to trust larger companies such as UNH because they believe them to have lower risk. In this way, the larger companies typically gain more brand loyalty as compared with smaller companies. In conclusion, the health care industry is a difficult place for new entrants to compete against existing players.
3. Competition from producers of substitute products:
13"National Health Expenditures 2013 Highlights." National Health Expend Data. Centers for Medicare & Medicaid Services, 2014. Web. 5 May 2015.

9
The threat from producers of substitute products is very low in the health care industry. There are no good substitutes for health care services or products.
4. Supplier bargaining power: The supplier bargaining power for UNH is moderate in the health care industry. The main suppliers for health care insurance companies are physicians, hospitals and other health care providers. These various health care providers may choose to not join specific networks or health care plans. They also have the power to demand the prices of their own services. Also, these suppliers’ products and services are very critical to health insurance companies and there are no substitutes for what the suppliers provide. However, it is important to note that there are an abundant number of suppliers, which gives health insurance companies the ability to pick and choose who is in their network.
5. Buyer bargaining power: The buyer bargaining power for UNH is moderate to high in the health care industry. Even though the buyer costs of switching to competing insurance companies are low and competitors offer similar products and services, the individual buyers do not have much power to influence the insurance price at large. Also, as a result of the recent health care reform in the U.S. (Obama Care), insurance enrollment has increased.
Main Competitors As previously discussed, the health care industry is highly competitive and saturated. In this section, we will describe and analyze the market situation in regards to our target company, UnitedHealth Group and its 5 main competitors based on the companies’ sales, net income, and their growth rates in recent years. The 5 health insurance companies that our team chose to utilize as comparables are Humana, Aetna, Cigna, Anthem, and WellCare. The following table shows the 2014 Sales & 10 and 5 year Growth Rate14:
14 Sales Data collected from FactSet

10
2014 Sales
(Mil.) Market Share 2004-2014 Growth
2009-2014 Growth
UNH 130,500.00 36.36% 13.37% 8.40%
HUM 48,500.00 13.51% 13.98% 9.39%
AET 58,007.80 16.16% 11.29% 10.72%
CI 34,950.00 9.74% 6.92% 13.62%
ANTM 73,981.40 20.61% 13.52% 3.70%
WCG 12,959.90 3.61% 24.97% 13.51%
Industry Total
358,899.10
12.52% 8.38%
Our team collected 6 companies’ 2014 sales data from FactSet and used them to build our total industry sales. From the table, we can see that UnitedHealth Group contributed 36.36% of total industry sales in 2014 (about $130,500 million). This percentage is much higher than any of its competitors’. Furthermore, UNH’s 10-year growth rate from 2004 to 2014 of 13.37% and 5-year growth rate from 2009 to 2014 of 8.40% are better than the industry growth rate in each of the two time periods. UnitedHealth Group has kept a relatively stable growth rate as compared to its peers and performance that has been consistently better than total industry sales. The follow table illustrates the 2014 Net Income & 10 and 5 year Growth Rate15
2014 Net Income (Mil.) 2004-2014 Growth 2009-2014 Growth
UNH 5,619.00 8.07% 8.01%
HUM 1,147.00 15.14% 1.98%
AET 2,040.80 5.32% 9.84%
CI 2,102.00 2.92% 10.07%
ANTM 2,560.10 10.30% -11.61%
WCG 63.70 2.61% 9.82%
Industry Total
13,532.60 7.33% 2.05%
The above table includes the 2014 net income of the 6 companies and an overall industry total. It also shows the 10-year and 5-year growth rate of each of the companies. It is apparent that UnitedHealth Group’s 10-year and 5-year growth
15 Net Income Data collected from FactSet

11
rates are all above the industry level. More specifically, the 5-year growth rate of 8.01% is about 6% higher than the industry total of 2.05%. Some competitors may yield better results than UNH in the 10-year or 5-year growth rate alone, but they also have significant differences between the two rates. For example, Humana has a 10-year growth rate of 15.14% but a 5-year growth rate of about 2%. Cigna and WellCare show about 10% growth in the 5-year rate in comparison to their 10-year growth rate of less than 3%. Since these growth rates are so drastically different and UNH’s growth rate has historically been quite stable, it is evident that UNH is less risky in this regard. UnitedHealth Group is therefore more likely to continue its stable net income growth rate in the future. Driving Forces There are several common drivers of change in the health care industry. The main driving forces in include technological change, emerging new Internet capabilities and applications, regulatory influences and government policy changes, changing societal concerns, attitudes, and lifestyles. The emergence of high-speed Internet, along with an ever-growing series of Internet applications, provides a special case of technological change which influences the health care industry. It has reshaped many aspects of the business landscape and can affect the five forces in various ways. Most insurance companies now offer online services to customers, which makes business more efficient and convenient. This may boost the companies’ revenue and net income because it leaves out a middle-man and saves companies the cost of labor. Also, it gives customers increasing power through unprecedented ability to research the product offerings of different insurance companies and shop the market for the best value. In other words, it allows customers to be better informed about the health care industry and increases their bargaining power. In our research, we found that in recent years, the major and biggest driving force of change in the health care industry has been the Affordable Care Act. The act created a new marketplace for all companies in the health insurance industry, including UnitedHealth Group. In 27 states, Medicaid is proving to be a major source of revenue growth for insurance companies. It has broken the dominance of some companies that had existed in many states. According to the U.S. government, as of March 2014, about 5 million Americans had already signed up for private health plans using Obama Care’s insurance exchanges. The exchanges created in the ACA were put in place “to ease access and improve transparency for people who shop for insurance on their own, about 5 percent of the U.S. population”16. Furthermore, Obama Care requires health insurance companies to accept anyone who applies, regardless of their income and health conditions. As a result, the act has decreased the profitability of the health insurance industry as a whole and has also increased the risk. 16Wayne, Alex. "Obamacare Shuffles Health Plan Market Share, Report Finds." Bloomberg.com. Bloomberg, 18 Mar. 2014. Web. 5 May 2015.
12
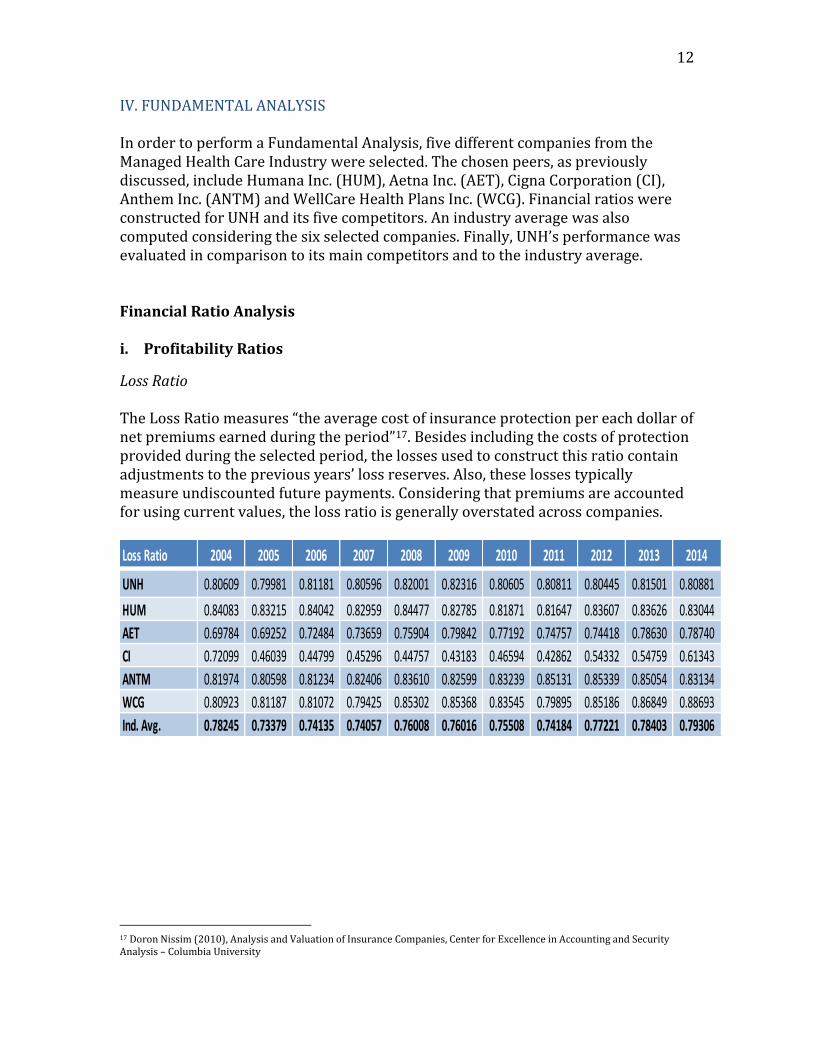
IV. FUNDAMENTAL ANALYSIS In order to perform a Fundamental Analysis, five different companies from the Managed Health Care Industry were selected. The chosen peers, as previously discussed, include Humana Inc. (HUM), Aetna Inc. (AET), Cigna Corporation (CI), Anthem Inc. (ANTM) and WellCare Health Plans Inc. (WCG). Financial ratios were constructed for UNH and its five competitors. An industry average was also computed considering the six selected companies. Finally, UNH’s performance was evaluated in comparison to its main competitors and to the industry average. Financial Ratio Analysis i. Profitability Ratios
Loss Ratio The Loss Ratio measures “the average cost of insurance protection per each dollar of net premiums earned during the period”17. Besides including the costs of protection provided during the selected period, the losses used to construct this ratio contain adjustments to the previous years’ loss reserves. Also, these losses typically measure undiscounted future payments. Considering that premiums are accounted for using current values, the loss ratio is generally overstated across companies.
17 Doron Nissim (2010), Analysis and Valuation of Insurance Companies, Center for Excellence in Accounting and Security Analysis – Columbia University
Loss Ratio 2004 2005 2006 2007 2008 2009 2010 2011 2012 2013 2014
UNH 0.80609 0.79981 0.81181 0.80596 0.82001 0.82316 0.80605 0.80811 0.80445 0.81501 0.80881
HUM 0.84083 0.83215 0.84042 0.82959 0.84477 0.82785 0.81871 0.81647 0.83607 0.83626 0.83044
AET 0.69784 0.69252 0.72484 0.73659 0.75904 0.79842 0.77192 0.74757 0.74418 0.78630 0.78740
CI 0.72099 0.46039 0.44799 0.45296 0.44757 0.43183 0.46594 0.42862 0.54332 0.54759 0.61343
ANTM 0.81974 0.80598 0.81234 0.82406 0.83610 0.82599 0.83239 0.85131 0.85339 0.85054 0.83134
WCG 0.80923 0.81187 0.81072 0.79425 0.85302 0.85368 0.83545 0.79895 0.85186 0.86849 0.88693
Ind. Avg. 0.78245 0.73379 0.74135 0.74057 0.76008 0.76016 0.75508 0.74184 0.77221 0.78403 0.79306

13
Assessing the Loss Ratio for the different companies, it can be concluded that UNH has been constantly positioned above the industry average in this indicator. UNH has a similar ratio compared to HUM and ANTM, while WCG has been showing an upward trend since 2012. AET has increased the average cost per net premium dollar over the last 10 years and has returned to levels closer to its peers. The company has increased its loss ratio from 0.69784 to 0.78740. Finally, CI is the company that shows the best performance in terms of this indicator. However, an upward trend can also be observed since 2011. Overall, UNH’s Loss Ratio has proven to be very stable during the last 10 years.
0.30000
0.40000
0.50000
0.60000
0.70000
0.80000
0.90000
1.00000
2009 2010 2011 2012 2013 2014
Loss Ratio
HUM AET CI ANTM WCG UNH Industry Avg.

14
Statutory Expense Ratio This ratio indicates the underwriting expense per dollar of premiums earned. Commissions, taxes and other operating expenses are included in its construction. As a result, the operational efficiency in underwriting can be evaluated18.
The evaluation of the Statutory Expense Ratio reveals how CI (which previously showed the best loss ratio of the industry) has higher underwriting costs than its peers. A similar situation comes with the evaluation of AET. UNH’s ratio is positioned in better condition with respect to the industry average until 2012, when it begins to approach industry levels. Combined Ratio This ratio, which measures the underwriting profitability of the insurance business, is computed by adding the Loss Ratio and the Statutory Expense Ratio. Thus, it involves the potential overstatement from the Loss Ratio. The indicator reveals the cost of protection and the cost of generating and maintaining the business as a proportion of the premiums earned19.
18 Doron Nissim (2010), Analysis and Valuation of Insurance Companies, Center for Excellence in Accounting and Security Analysis – Columbia University 19 Doron Nissim (2010), Analysis and Valuation of Insurance Companies, Center for Excellence in Accounting and Security Analysis – Columbia University
Statutory
Expense Ratio2004 2005 2006 2007 2008 2009 2010 2011 2012 2013 2014
UNH 0.17146 0.16947 0.15200 0.16544 0.17460 0.17304 0.17954 0.18135 0.18666 0.18928 0.20086
HUM 0.14799 0.15033 0.14576 0.14984 0.14841 0.14963 0.14607 0.16231 0.16666 0.17464 0.17346
AET 0.24158 0.23525 0.22836 0.21909 0.21198 0.21319 0.22472 0.23436 0.21583 0.20426 0.21225
CI 0.37539 0.37532 0.39938 0.31763 0.32988 0.32666 0.31180 0.30913 0.27445 0.25883 0.29779
ANTM 0.18526 0.18225 0.17539 0.16096 0.16298 0.17299 0.16564 0.15339 0.15672 0.15352 0.17490
WCG 0.12313 0.13932 0.13842 0.14452 0.14398 0.13003 0.16935 0.11648 0.09710 0.09350 0.09407
Ind. Avg. 0.20747 0.20866 0.20655 0.19291 0.19531 0.19426 0.19952 0.19284 0.18290 0.17900 0.19222
Combined Ratio 2004 2005 2006 2007 2008 2009 2010 2011 2012 2013 2014
UNH 0.97755 0.96928 0.96380 0.97140 0.99461 0.99621 0.98560 0.98945 0.99111 1.00429 1.00966
HUM 0.98882 0.98248 0.98618 0.97943 0.99317 0.97748 0.96478 0.97878 1.00273 1.01089 1.00389
AET 0.93942 0.92777 0.95320 0.95568 0.97102 1.01160 0.99664 0.98193 0.96001 0.99055 0.99964
CI 1.09638 0.83571 0.84737 0.77059 0.77745 0.75849 0.77774 0.73775 0.81777 0.80643 0.91122
ANTM 1.00500 0.98823 0.98772 0.98502 0.99909 0.99898 0.99803 1.00470 1.01011 1.00406 1.00624
WCG 0.93236 0.95120 0.94915 0.93876 0.99700 0.98371 1.00479 0.91542 0.94896 0.96199 0.98101
Ind. Avg. 0.98992 0.94245 0.94790 0.93348 0.95539 0.95441 0.95460 0.93467 0.95511 0.96304 0.98528

15
The chart for the Combined Ratio reveals that most of the industry players have an indicator close to one. The only company that stands out from its peers is Cigna. However, during the last three years CI has shown an upward trend. Since 2011 the ratio has increased significantly and has reached 0.911 in 2014. UNH displays a stable proportion of losses and expenses to premiums earned around the industry average ratio. Gross Margin The Gross Margin reflects the mark-up per dollar of sales in a company. This indicator includes the costs of goods sold and is computed for firms that sell products. Though UNH’s primary business does not include products and the company does not hold inventory, its financial statements disclosed certain costs of goods sold in its “Other Expenses” category. Under this circumstance, it was assumed that UNH’s sales include a reduced amount of products sold. Therefore, an additional ratio for Gross Margin 2 was added and defined as Revenues minus Cost of Goods Sold (which included Losses and Other Expenses) all divided by total Revenues [(Revenues – Losses – Other expenses) / Revenue]. This ratio measures the amount left from sales to cover SG&A expenses, Depreciation and Amortization, and other non-operating expenses.
0.60000
0.70000
0.80000
0.90000
1.00000
1.10000
2009 2010 2011 2012 2013 2014
Combined Ratio
HUM AET CI ANTM WCG UNH Industry Avg.
Gross Margin 2 2004 2005 2006 2007 2008 2009 2010 2011 2012 2013 2014
UNH 0.26450 0.26322 0.23718 0.25497 0.23928 0.23105 0.24657 0.24694 0.25198 0.24791 0.25639
HUM 0.17680 0.18295 0.17962 0.19848 0.18387 0.19978 0.20020 0.21834 0.20917 0.21402 0.21307
AET 0.30317 0.30954 0.29588 0.29743 0.28214 0.25013 0.27846 0.30364 0.27122 0.25714 0.26024
CI 0.42640 0.42267 0.44162 0.37140 0.31782 0.40057 0.36416 0.36820 0.34133 0.30925 0.33502
ANTM 0.25325 0.25787 0.25416 0.24346 0.22843 0.23824 0.23646 0.21635 0.21665 0.20909 0.23064
WCG 0.18773 0.19059 0.19568 0.21493 0.14879 0.14428 0.15573 0.18539 0.13807 0.12527 0.11020
Ind. Avg. 0.26864 0.27114 0.26736 0.26344 0.23338 0.24401 0.24693 0.25648 0.23807 0.22711 0.23426

16
The results for this indicator present UNH as close to the industry average and outperforming three of its comparable peers. EBIT Margin This ratio measures how much of each dollar of sales remains after all operating expenses are deducted. Cigna exhibits the best performance of the industry in terms of EBIT Margin, while WellCare Health Plans and Humana have the lowest ratios. The evolution of the EBIT Margin for all the companies has been very different over the past ten years. Throughout this period, UNH has been consistently above the industry average. Also, since 2009, UNH has shown a stable ratio that contrasts with some of its peers.
EBIT Margin 2004 2005 2006 2007 2008 2009 2010 2011 2012 2013 2014
UNH 0.11019 0.10958 0.09767 0.10413 0.08132 0.07366 0.08375 0.08320 0.08371 0.07862 0.07893
HUM 0.03350 0.03696 0.03854 0.05370 0.04049 0.05515 0.05912 0.06364 0.05153 0.04989 0.04870
AET 0.10078 0.11157 0.10417 0.11189 0.09840 0.06583 0.08551 0.10275 0.08422 0.07660 0.07090
CI 0.12775 0.11503 0.11325 0.10151 0.04133 0.11673 0.09631 0.09986 0.09461 0.07771 0.10315
ANTM 0.08618 0.09150 0.09427 0.09699 0.07942 0.08012 0.08452 0.07515 0.07344 0.06646 0.06896
WCG 0.06499 0.05253 0.05916 0.07272 0.00567 0.01446 -0.01330 0.06908 0.04108 0.03196 0.01645
Ind. Avg. 0.08723 0.08620 0.08451 0.09016 0.05777 0.06766 0.06598 0.08228 0.07143 0.06354 0.06451
-0.05000
0.00000
0.05000
0.10000
0.15000
2009 2010 2011 2012 2013 2014
EBIT Margin
HUM AET CI ANTM
WCG UNH Industry Avg.

17
Net Profit Margin The Net Profit Margin measures how much of each dollar of sales remains after all expenses are deducted. Unlike the EBIT Margin, interest and tax expenses are subtracted in this ratio. The pattern for the different companies inside this ratio is similar to the one shown in the EBIT Margin. As in the previous ratio, UNH is positioned above the industry average and has shown a more stable ratio since 2009.
ROA The Return on Assets measures the profitability of the company relative to its total assets. It indicates how efficiently assets are being used to generate earnings.
While evaluating the ROAs for the different companies, it stands out that CI (which has been previously positioned among the top performers in terms of profitability) has a stable and low ROA compared to its peers during the ten-year period. Moreover, HUM and WCG exhibit some periods with higher than average ROA contrasting with the bottom performances inside the EBIT Margin ratio. In UNH’s case, it has an ROA that is consistently above the industry average and has shown more stable returns since 2009.
Net Profit
Margin2004 2005 2006 2007 2008 2009 2010 2011 2012 2013 2014
UNH 0.06951 0.06640 0.05813 0.06169 0.03659 0.04383 0.04920 0.05047 0.04995 0.04592 0.04306
HUM 0.02137 0.02140 0.02276 0.03296 0.02228 0.03358 0.03246 0.03853 0.03123 0.02980 0.02365
AET 0.06104 0.06995 0.06703 0.06604 0.04381 0.03662 0.05154 0.05877 0.04529 0.04043 0.03518
CI 0.08813 0.07637 0.06986 0.06341 0.01490 0.07047 0.06282 0.06034 0.05572 0.04557 0.06014
ANTM 0.04612 0.05457 0.05429 0.05449 0.03988 0.07694 0.04907 0.04353 0.04295 0.03701 0.03460
WCG 0.03530 0.02763 0.03334 0.04011 -0.00565 0.00580 -0.00982 0.04327 0.02493 0.01840 0.00492
Ind. Avg. 0.05358 0.05272 0.05090 0.05312 0.02530 0.04454 0.03921 0.04915 0.04168 0.03619 0.03359
ROA 2004 2005 2006 2007 2008 2009 2010 2011 2012 2013 2014
UNH 11.368% 8.915% 9.283% 9.381% 5.579% 6.655% 7.590% 7.853% 7.429% 6.912% 6.679%
HUM 5.114% 4.925% 5.735% 7.247% 4.993% 7.646% 7.267% 8.394% 6.485% 5.957% 5.048%
AET 2.925% 3.615% 3.644% 3.723% 3.197% 3.431% 4.632% 5.203% 4.140% 4.189% 3.952%
CI 1.822% 2.013% 2.634% 2.691% 0.701% 3.049% 2.982% 2.690% 3.029% 2.671% 3.738%
ANTM 3.552% 5.354% 6.000% 6.445% 4.958% 9.442% 5.645% 5.180% 4.786% 4.445% 4.209%
WCG 6.971% 6.158% 9.501% 11.542% -1.719% 1.845% -2.446% 11.160% 7.155% 5.723% 1.603%
Ind. Avg. 5.292% 5.163% 6.133% 6.838% 2.952% 5.345% 4.278% 6.747% 5.504% 4.983% 4.205%
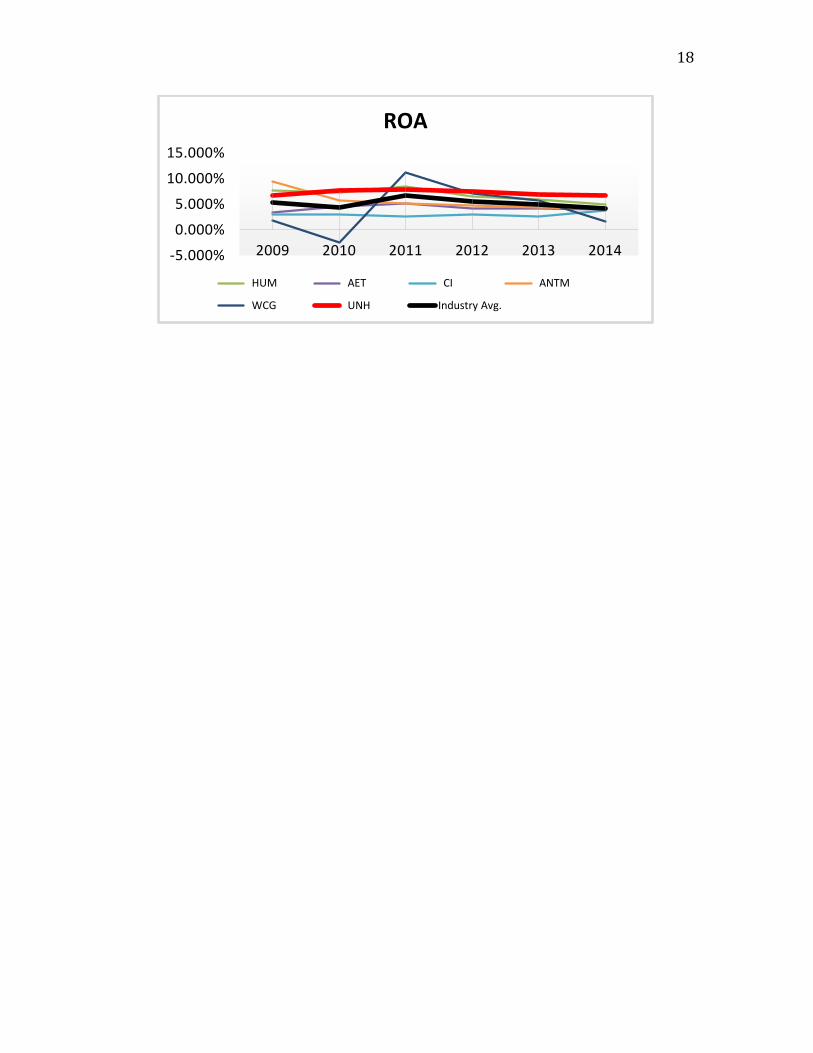
18
-5.000%
0.000%
5.000%
10.000%
15.000%
2009 2010 2011 2012 2013 2014
ROA
HUM AET CI ANTM
WCG UNH Industry Avg.

19
ii. Efficiency Ratios
Asset Turnover The Asset Turnover Ratio reflects the amount of sales per dollar of assets. The analysis of this ratio indicates that each company inside the industry has different levels of efficiency in terms of total assets. Cigna exhibits a very low efficiency compared to its peers, while Humana and WellCare Health Plans are the most efficient. UNH has, once again, a solid ratio near the industry average.
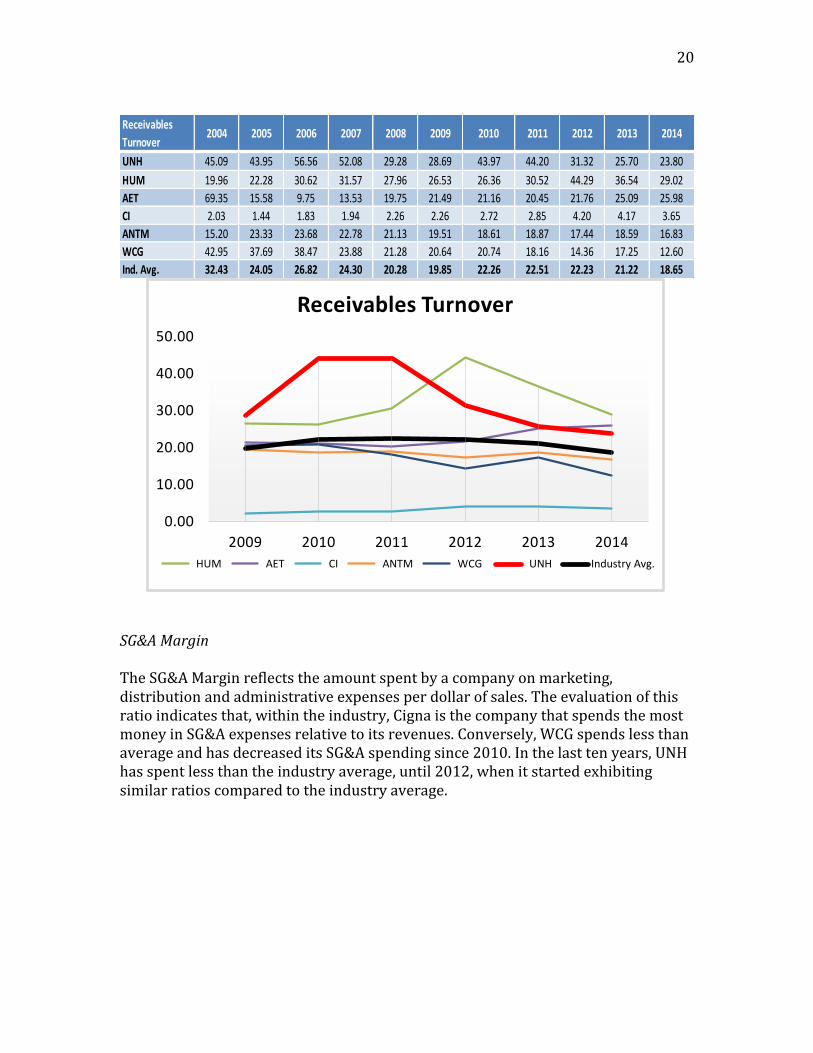
Receivables Turnover This ratio indicates how quickly the firm collects on its credit sales. Since 2007, UNH and HUM have had the best performances of the industry in terms of Receivables Turnover. On the other hand, CI shows a very low ratio compared to its peers. Overall, UNH has a higher than average ratio and its recent downward trend resembles HUM’s decline. Nevertheless, it must be considered that part of the differences across companies in this ratio can be associated with different cash and credit proportions inside each of the companies’ revenues.
Asset Turnover 2004 2005 2006 2007 2008 2009 2010 2011 2012 2013 2014
UNH 1.635 1.343 1.597 1.521 1.525 1.518 1.543 1.556 1.487 1.505 1.551
HUM 2.393 2.302 2.520 2.199 2.241 2.277 2.239 2.179 2.076 1.999 2.134
AET 0.479 0.517 0.544 0.564 0.730 0.937 0.899 0.885 0.914 1.036 1.123
CI 0.207 0.264 0.377 0.424 0.471 0.433 0.475 0.446 0.544 0.586 0.622
ANTM 0.770 0.981 1.105 1.183 1.243 1.227 1.150 1.190 1.114 1.201 1.216
WCG 1.975 2.229 2.850 2.877 3.043 3.183 2.492 2.579 2.870 3.111 3.262
Ind. Avg. 1.243 1.273 1.499 1.461 1.542 1.596 1.466 1.472 1.501 1.573 1.651
0.000
0.500
1.000
1.500
2.000
2.500
3.000
3.500
2009 2010 2011 2012 2013 2014
Asset Turnover
HUM AET CI ANTM WCG UNH Industry Avg.
20
SG&A Margin The SG&A Margin reflects the amount spent by a company on marketing, distribution and administrative expenses per dollar of sales. The evaluation of this ratio indicates that, within the industry, Cigna is the company that spends the most money in SG&A expenses relative to its revenues. Conversely, WCG spends less than average and has decreased its SG&A spending since 2010. In the last ten years, UNH has spent less than the industry average, until 2012, when it started exhibiting similar ratios compared to the industry average.
Receivables
Turnover2004 2005 2006 2007 2008 2009 2010 2011 2012 2013 2014
UNH 45.09 43.95 56.56 52.08 29.28 28.69 43.97 44.20 31.32 25.70 23.80
HUM 19.96 22.28 30.62 31.57 27.96 26.53 26.36 30.52 44.29 36.54 29.02
AET 69.35 15.58 9.75 13.53 19.75 21.49 21.16 20.45 21.76 25.09 25.98
CI 2.03 1.44 1.83 1.94 2.26 2.26 2.72 2.85 4.20 4.17 3.65
ANTM 15.20 23.33 23.68 22.78 21.13 19.51 18.61 18.87 17.44 18.59 16.83
WCG 42.95 37.69 38.47 23.88 21.28 20.64 20.74 18.16 14.36 17.25 12.60
Ind. Avg. 32.43 24.05 26.82 24.30 20.28 19.85 22.26 22.51 22.23 21.22 18.65
0.00
10.00
20.00
30.00
40.00
50.00
2009 2010 2011 2012 2013 2014
Receivables Turnover
HUM AET CI ANTM WCG UNH Industry Avg.

21
SG&A Margin 2004 2005 2006 2007 2008 2009 2010 2011 2012 2013 2014
UNH 0.15431 0.15364 0.13950 0.15084 0.15796 0.15739 0.16282 0.16374 0.16827 0.16929 0.17746
HUM 0.14330 0.14599 0.14108 0.14477 0.14338 0.14463 0.14108 0.15470 0.15764 0.16414 0.16437
AET 0.20238 0.19797 0.19171 0.18554 0.18374 0.18431 0.19296 0.20089 0.18699 0.18054 0.18934
CI 0.29865 0.30764 0.32837 0.26989 0.27648 0.28384 0.26785 0.26834 0.24672 0.23155 0.23187
ANTM 0.16707 0.16637 0.15989 0.14647 0.14900 0.15811 0.15194 0.14120 0.14321 0.14262 0.16168
WCG 0.12275 0.13806 0.13652 0.14221 0.14312 0.12982 0.16903 0.11631 0.09699 0.09332 0.09375
Ind. Avg. 0.18141 0.18494 0.18285 0.17329 0.17561 0.17635 0.18095 0.17420 0.16664 0.16358 0.16975
0.00000
0.05000
0.10000
0.15000
0.20000
0.25000
0.30000
2009 2010 2011 2012 2013 2014
SG&A Margin
HUM AET CI ANTM WCG UNH Industry Avg.

22
iii. Liquidity Ratios
Current Ratio The Current Ratio measures the amount of current assets per dollar of current liabilities. It indicates how well the firm would be able to pay off its short-term obligations with its short-term assets. The assessment of the following table indicates dissimilar levels of liquidity across the different companies. HUM, WCG and ANTM have the highest ratios, which are placed above 1.5 in several periods. On the other hand, CI has very low liquidity as measured by the Current Ratio and maxes out at a ratio of 0.23986. In this case, UNH reveals lower liquidity than the industry average during the studied period.
Quick Ratio with Long-Term Investments Another widely used Liquidity Ratio is the Quick Ratio, which measures how well the company is able to pay off its short-term obligations using its more liquid assets. Considering different definitions of liquidity, there are two types of most commonly used Quick Ratios. The first includes the more liquid assets by subtracting the inventory from the current assets. The second looks for the most liquid assets by adding cash, short-term investments and receivables. When computing this ratio, the available information was not adequate enough to use any of these definitions or to include only the investments that were measured at its quoted prices. In addition, UNH has stated that “Because of regulatory requirements, certain investments are included in long-term investments regardless of their maturity date”20. Consequently, a new Quick Ratio was constructed and defined as the sum of cash, total investments and receivables over current liabilities [(Cash + Total Investments + Receivables)/Current Liabilities].
20 UnitedHealth Group, Form 10-K for fiscal year ended December 31, 2014
Current Ratio 2004 2005 2006 2007 2008 2009 2010 2011 2012 2013 2014
UNH 0.727 0.633 0.867 0.841 0.759 0.821 0.776 0.851 0.776 0.731 0.769
HUM 1.546 1.306 1.428 1.508 1.620 1.759 1.765 1.846 1.837 1.945 2.000
AET 2.784 2.394 0.653 0.686 0.651 0.823 0.801 0.691 0.976 0.771 0.766
CI 0.117 0.141 0.118 0.142 0.111 0.112 0.120 0.224 0.170 0.240 0.188
ANTM 1.671 0.775 0.768 0.906 0.808 1.913 1.866 1.704 1.835 1.819 1.719
WCG 1.828 1.708 1.435 1.407 1.249 1.455 1.531 1.887 1.887 2.177 1.822
Ind. Avg. 1.446 1.160 0.878 0.915 0.866 1.147 1.143 1.201 1.247 1.280 1.211

23
The new Quick Ratio shows all of the companies, excluding Aetna, within a range from 0.921 to 2.057. Although AET has constantly exhibited the highest Quick Ratio, it has significantly dropped since 2012 and in 2014 it approached its peers with a 1.861 ratio. As in the Current Ratio, during the 2004-2014 period, UNH reflects lower liquidity than the industry average when measured by the Quick Ratio. Nevertheless, its ratio is stable throughout the period and it is over 1 for every year since 2006. Thus, the firm is able to meet all its short-term obligations using cash, total investments and receivables. iv. Leverage Ratios
Long-Term Debt to Equity Ratio This ratio reflects the amount of long-term debt per dollar of equity. Between 2004 and 2014, most of the selected companies have a long-term debt to equity ratio that varies within the 0.2 to 0.6 range and present an upward trend for the total period. WCG presents a different pattern compared to the rest of its peers. Starting at a ratio close to 0.6, the firm expands its equity with a peak increase in 2007, when it pays off its long-term debt. The ratio remains at zero until 2010. After 2010, WCG began
Quick Ratio
w/LT Inv.2004 2005 2006 2007 2008 2009 2010 2011 2012 2013 2014
UNH 1.162 0.972 1.184 1.290 1.293 1.193 1.185 1.279 1.246 1.209 1.115
HUM 1.564 1.308 1.176 1.317 1.607 1.958 1.989 1.959 1.864 1.972 1.808
AET 2.916 2.853 2.998 2.700 2.604 2.727 2.656 2.659 3.099 2.125 1.861
CI 1.004 1.075 1.025 1.067 0.921 1.022 1.044 1.165 1.057 1.095 1.080
ANTM 1.500 1.531 1.541 1.676 1.361 1.763 1.662 1.510 1.636 1.612 1.525
WCG 1.738 1.572 1.321 1.382 1.326 1.387 1.518 1.886 1.801 2.057 1.740
Ind. Avg. 1.647 1.552 1.541 1.572 1.519 1.675 1.676 1.743 1.784 1.678 1.522
0.000
1.000
2.000
3.000
4.000
2009 2010 2011 2012 2013 2014
Quick Ratio with Long-Term Investments
HUM AET CI ANTM WCG UNH Industry Avg.

24
raising long-term debt and continued to increase it every year. By 2014, WCG once again shows one of the highest ratios in the industry. Since 2009, HUM has also exhibited lower levels than the industry average when considering its long-term debt compared to its equity. In UNH’s case, the ratio has been set above the industry average since 2007, but in recent years has merged into it. In 2013 and 2014 UNH has a Long-Term Debt to Equity ratio that is almost equal to the industry average.
Times Interest Earned (TIE) The TIE ratio holds this name as an abbreviation for Times Interest Earned. This indicator, also known as the Coverage Ratio, gives information on how many times the operating earnings of the firm can cover its interest costs.
Long-Term Debt
to Equity Ratio2004 2005 2006 2007 2008 2009 2010 2011 2012 2013 2014
UNH 0.31259 0.21521 0.28703 0.45173 0.54562 0.38164 0.33541 0.37664 0.45035 0.46319 0.49322
HUM 0.30462 0.20767 0.41557 0.41893 0.43459 0.29054 0.24102 0.20575 0.29513 0.27909 0.39654
AET 0.17725 0.11343 0.26706 0.31265 0.44443 0.38295 0.35210 0.39305 0.62285 0.56079 0.54217
CI 0.27638 0.26194 0.31894 0.38037 0.58630 0.45394 0.34432 0.59803 0.51039 0.47450 0.46454
ANTM 0.21978 0.25306 0.26421 0.39249 0.36553 0.33537 0.34216 0.36160 0.59534 0.54809 0.58253
WCG 0.58938 0.42002 0.28679 0.00000 0.00000 0.00000 0.00000 0.12088 0.09198 0.39528 0.56395
Ind. Avg. 0.31333 0.24522 0.30660 0.32603 0.39608 0.30741 0.26917 0.34266 0.42767 0.45349 0.50716
0.00000
0.20000
0.40000
0.60000
0.80000
2009 2010 2011 2012 2013 2014
Long-term Debt to Equity
HUM AET CI ANTM WCG UNH Industry Avg.

25
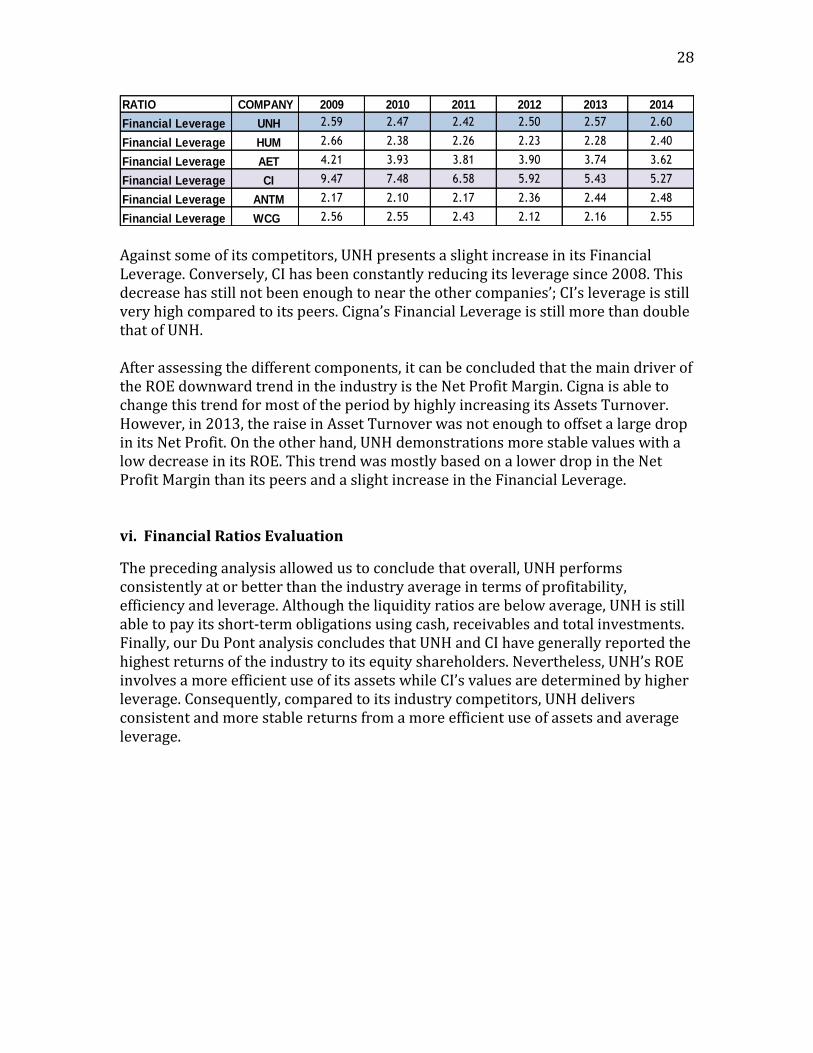
Because of the low levels of WCG’s debt described in the previous ratio and a negative EBIT in 2010, WCG greatly diverges from its peers between 2009 and 2013. WCG’s performance affects the industry average for the period. UNH’s data reveals that every year it has been able to cover more than ten times its interest expenses with its EBIT. In addition, since 2010 its EBIT has covered more than 14 times the interest expense. In a scenario where WCG is removed from the industry average, UNH has a ratio above the average for each year since 2010 and is only behind Humana when compared to its main competitors. Financial Leverage The Financial Leverage Ratio was computed as Average Assets divided by Average Shareholder Equity. This indicator measures the firm’s use of all types of leverage including debt and other liabilities. The evaluation of the Financial Leverage for the different companies shows stable levels for each company except for Cigna. CI’s ratio exhibits a downward trend that starts at a very high level close to 18. Even though it has been decreasing, its leverage is still high compared to its peers. UNH is positioned with stable levels of leverage throughout the period and its ratio is consistently below the industry average.
TIE 2004 2005 2006 2007 2008 2009 2010 2011 2012 2013 2014
UNH 32.04 21.11 15.32 14.44 10.35 11.66 16.40 16.78 14.65 13.60 16.67
HUM 18.95 13.56 13.07 19.72 14.65 16.13 19.06 21.50 19.20 14.72 15.24
AET 19.16 20.43 17.66 17.18 13.15 9.43 11.51 14.06 11.47 10.86 12.49
CI 21.36 18.30 18.07 14.70 5.47 12.98 11.33 10.87 10.28 9.32 13.60
ANTM 12.61 18.26 13.32 13.62 10.15 11.04 11.91 10.66 8.94 7.91 8.56
WCG 8.92 7.28 15.27 27.93 3.14 15.51 (315.99) 64.80 73.84 25.59 5.41
Ind. Avg. 18.84 16.49 15.45 17.93 9.49 12.79 14.04 23.11 23.06 13.67 12.00
0.00
5.00
10.00
15.00
20.00
25.00
2009 2010 2011 2012 2013 2014
TIE
HUM AET CI ANTM UNH Industry Avg.

26
v. Du Pont Analysis
The Du Pont Analysis started with a review of the ROE ratio, not only for UNH but also for its peers. Since 2011, every company in the industry has exhibited a downward trend in this ratio except for Cigna. CI was the only company able to experience an upward trend (except for the decrease seen in 2013). UNH, however, exhibits one of the lowest declines during this period (only behind Anthem) and has overall higher returns than its peers in terms of ROE. CI’s ratio has shown more variability than UNH’s ROE but still exhibits the highest return in 2014. The rest of the competitors had periods with good ROEs, but the recent trends have greatly affected their returns. Consequently, UNH and CI were selected as the companies with the overall highest returns over the owners’ capital during the most recent period.
Financial
Leverage2004 2005 2006 2007 2008 2009 2010 2011 2012 2013 2014
UNH 2.87 2.42 2.32 2.43 2.61 2.59 2.47 2.42 2.50 2.57 2.60
HUM 2.79 2.74 3.07 3.25 3.05 2.66 2.38 2.26 2.23 2.28 2.40
AET 4.89 4.52 4.79 5.13 4.75 4.21 3.93 3.81 3.90 3.74 3.62
CI 17.81 12.00 9.08 9.17 9.85 9.47 7.48 6.58 5.92 5.43 5.27
ANTM 2.14 2.07 2.08 2.18 2.26 2.17 2.10 2.17 2.36 2.44 2.48
WCG 2.67 2.48 2.81 2.79 2.66 2.56 2.55 2.43 2.12 2.16 2.55
Ind. Avg. 5.53 4.37 4.03 4.16 4.20 3.94 3.49 3.28 3.17 3.10 3.15
0.00
2.00
4.00
6.00
8.00
10.00
2009 2010 2011 2012 2013 2014
Financial Leverage
HUM AET CI ANTM WCG UNH Industry Avg.

27
Next, the Du Pont analysis was executed for all of the companies with special emphasis in the evolution of UNH and CI.
Since 2011, the Net Profit Margin of the industry has seen a downward trend. All six companies experienced a decrease in the ratio except for Cigna in 2014. However, UNH shows the lowest drop in the industry until 2013 and is only surpassed by CI in 2014. Cigna was also experiencing a decrease in its ratio and in 2013 it showed the largest drop in Net Profit Margin that greatly affected its ROE. Comparing the Net Profit Margin for UNH and CI, the latter shows a higher profitability in this ratio, a fact that was also reviewed in the majority of the profitability ratio analysis.
The Asset Turnover shows varying development for each company. UNH appears as more stable than its peers and had almost remained unchanged between 2011 and 2014. HUM and ANTM present overall small changes but with more variability inside the period. AET, CI and WCG are the companies that experienced high growth in the ratio during the 2011 to 2014 period. Although Cigna has experienced a large increase since 2009, UNH has more than doubled Cigna’s ratios. Thus, it indicates that UNH uses its assets in a more efficient way than Cigna.
RATIO COMPANY 2009 2010 2011 2012 2013 2014
ROE UNH 17.222% 18.749% 19.003% 18.584% 17.765% 17.395%
ROE HUM 20.320% 17.313% 18.936% 14.453% 13.555% 12.098%
ROE AET 14.432% 18.220% 19.846% 16.154% 15.665% 14.317%
ROE CI 28.882% 22.301% 17.706% 17.921% 14.516% 19.699%
ROE ANTM 20.503% 11.863% 11.238% 11.278% 10.848% 10.446%
ROE WCG 4.728% -6.235% 27.118% 15.142% 12.340% 4.091%
RATIO COMPANY 2009 2010 2011 2012 2013 2014
Net Profit Margin UNH 0.04383 0.04920 0.05047 0.04995 0.04592 0.04306
Net Profit Margin HUM 0.03358 0.03246 0.03853 0.03123 0.02980 0.02365
Net Profit Margin AET 0.03662 0.05154 0.05877 0.04529 0.04043 0.03518
Net Profit Margin CI 0.07047 0.06282 0.06034 0.05572 0.04557 0.06014
Net Profit Margin ANTM 0.07694 0.04907 0.04353 0.04295 0.03701 0.03460
Net Profit Margin WCG 0.00580 -0.00982 0.04327 0.02493 0.01840 0.00492
RATIO COMPANY 2009 2010 2011 2012 2013 2014
Asset Turnover UNH 1.518 1.543 1.556 1.487 1.505 1.551
Asset Turnover HUM 2.277 2.239 2.179 2.076 1.999 2.134
Asset Turnover AET 0.937 0.899 0.885 0.914 1.036 1.123
Asset Turnover CI 0.433 0.475 0.446 0.544 0.586 0.622
Asset Turnover ANTM 1.227 1.150 1.190 1.114 1.201 1.216
Asset Turnover WCG 3.183 2.492 2.579 2.870 3.111 3.262
28
Against some of its competitors, UNH presents a slight increase in its Financial Leverage. Conversely, CI has been constantly reducing its leverage since 2008. This decrease has still not been enough to near the other companies’; CI’s leverage is still very high compared to its peers. Cigna’s Financial Leverage is still more than double that of UNH. After assessing the different components, it can be concluded that the main driver of the ROE downward trend in the industry is the Net Profit Margin. Cigna is able to change this trend for most of the period by highly increasing its Assets Turnover. However, in 2013, the raise in Asset Turnover was not enough to offset a large drop in its Net Profit. On the other hand, UNH demonstrations more stable values with a low decrease in its ROE. This trend was mostly based on a lower drop in the Net Profit Margin than its peers and a slight increase in the Financial Leverage. vi. Financial Ratios Evaluation
The preceding analysis allowed us to conclude that overall, UNH performs consistently at or better than the industry average in terms of profitability, efficiency and leverage. Although the liquidity ratios are below average, UNH is still able to pay its short-term obligations using cash, receivables and total investments. Finally, our Du Pont analysis concludes that UNH and CI have generally reported the highest returns of the industry to its equity shareholders. Nevertheless, UNH’s ROE involves a more efficient use of its assets while CI’s values are determined by higher leverage. Consequently, compared to its industry competitors, UNH delivers consistent and more stable returns from a more efficient use of assets and average leverage.
RATIO COMPANY 2009 2010 2011 2012 2013 2014
Financial Leverage UNH 2.59 2.47 2.42 2.50 2.57 2.60
Financial Leverage HUM 2.66 2.38 2.26 2.23 2.28 2.40
Financial Leverage AET 4.21 3.93 3.81 3.90 3.74 3.62
Financial Leverage CI 9.47 7.48 6.58 5.92 5.43 5.27
Financial Leverage ANTM 2.17 2.10 2.17 2.36 2.44 2.48
Financial Leverage WCG 2.56 2.55 2.43 2.12 2.16 2.55

29
V. EARNINGS FORECAST As a way to obtain the Earnings per Share to be used in the Relative and Absolute Valuation, UNH’s Income Statement and Weighted Average Diluted Shares were forecasted for the fiscal year 2016. Next, we discuss the main assumptions made during this process. Revenues Our estimate started by selecting an adequate 2016 industry revenue forecast. We chose to consider the 2016 estimate from FactSet for the Managed Health Care Industry, which is mostly composed by our previously studied industry. As of April 23rd, this estimate was set at $488,895 million. Later, considering the 2004-2014 percentages of UNH’s sales to those of the total industry, we selected 33% as UNH’s market share for 2016, which is closer to the latest five-year period. Computing this percentage to the industry revenue estimate, we set UNH’s revenue forecast at $161,335.35 million. Cost of Sales For this item of the Income Statement we added “Losses, Claims & Reserves” to “Other Operating Expense”. Next, we reviewed the figures disclosed for these items since 2004 and compared them to each year’s Total Sales. Every year UNH showed a stable percentage, and averages over different time periods were found to be approximately 75%, which was our chosen cost ratio to use for 2016. Using this information and the previous sales forecast, the final estimate for 2016’s cost of sales was $121,001.51 million. Selling, General & Administrative Expenses The SG&A estimate was computed without the Depreciation and Amortization expense. As in the prior analysis, the historical percentage to total sales was studied. In this case, we notice a slight upward trend and selected 17% for our forecast under the assumption that it will keep increasing. We considered the 2016 SG&A expense to be $27,427.01 million. Depreciation and Amortization Expense UNH annually reports Depreciation of Property, Plant & Equipment, Amortization of Capitalized Software, and Amortization of Intangibles. As part of our forecast, we included the estimate for Amortization of Intangibles that the company disclosed in the 2014 10-K Form, which is expected to be $487 million. For the other components of this expense, we considered the following different estimations:

30
D&A (M) Method employed
Forecast 1 $ 1,125.35
D&A as % of current year forecasted gross PP&E and Capitalized Software
Forecast 2 $ 1,227.08
D&A as % of prior year forecasted gross PP&E and Capitalized Software
Forecast 3 $ 1,050.37 D&A computed using total geometric growth rate Forecast 4 $ 1,051.05
D&A using separate geometric growth rate for PP&E and Capitalized Software
Next, we compared each result to the historical D&A percentages from gross and net values of PP&E and Capitalized Software, which were computed for current and prior years. In this process, we selected Forecast 1 as the most adequate, which is also close to an average of the different forecasts. Adding the previous estimate of intangible’s amortization, we arrived to the total D&A expense forecast of $1,612.35 million. At this point, we were able to obtain an “Operating Income before Interest Expense” projection of $11,294.48 million. Interest Expense UNH’s Interest Expense forecast included a review of the actual interest reported (between 2012 and 2014) and its estimate computed from the prior year debt detail obtained from FactSet. We noticed that the firm reported zero interest capitalization for each fiscal year. Next, we constructed three different scenarios for 2016 from the current debt data of the company. The first one assumed that all debt maturing in 2015 will be replaced by debt at an average interest rate of 2.3%. The second forecast anticipated a 50% replacement with debt and 50% replacement with commercial paper. The remaining scenario considered that the maturing debt will be replaced by 100% commercial paper. Also, we obtained the commercial paper interest rate from the 2014’s 10-K Form. After evaluating the results, we estimated the total interest expense in $671.88 million that corresponds to the second scenario. Unusual Expense In order to forecast this item of the Income Statement, we used the 2010-2014 historical average. The information prior to 2010 contains great variability and was assessed as not related to the company’s recent history.

31
Income Taxes After studying UNH’s realized tax rate for the last ten years, we noticed that 2014 exhibited a higher tax that accounted for 41.81% of the Pretax Income. In its 10-K Form, UNH disclosed that this higher percentage corresponded to the non-deductibility of industry tax. Thus, we assumed that this characteristic will remain unchanged for 2016 and estimated Income Taxes as 42% of the Pretax Income. Minority Interest Inside the historical data, this item only revealed values for the 2013 fiscal year. We studied the company’s financial statements to obtain additional information and concluded that the forecast for this item is zero. Net Income Having estimated gains and losses for 2016, we computed the Net Income that is expected to be $6,152.41 million. Weighted Average Diluted Shares For this estimation we considered the announced slow-down in UNH’s current share repurchase program. We expect this repurchase to be 8 million shares per quarter, as shown during 2015’s first quarter when the slow-down was announced. Also, evaluating the historical quarterly change in shares, we forecasted the annual change in the number of shares as a decrease of 24 million shares. Finally, we projected the Weighted Average Diluted Shares to be 938 million in 2016, after considering the historical relationship between the diluted average and the actual number of shares outstanding. Earnings per Share (EPS) The Net Income and Weighted Average Diluted Shares forecasts allowed us to compute the expected EPS for UNH, which resulted in $6.559. However, until this point the analysis did not include the impact of Catamaran’s acquisition. As previously stated, UNH expects the deal to add $0.30 per share in 201621. Consequently, the final expected 2016 EPS was set at $6.859 per share.
21 Anna Wilde Mathews (2015) United Health to Buy Catamaran for $12.8 Billion in Cash, The Wall Street Journal

32
VI. RELATIVE VALUATION Relative Valuation Relative Valuation is a set of calculations which aid analysts in the estimation of a company’s relative value to other companies in the same industry. In our team’s Relative Valuation Model, we used UNH’s comparable companies’ P/E ratios, UNH’s EPS forecast based on our income statement forecast, and an adjustment factor to calculate UNH’s stock price. The basic equation is as following: Estimation of firm’s current price=E (EPS)*P/E FY2 (2016)*Adjustment Factor
Taking the 5 previously chosen comparables along with the Health Care Select Sector SPDR Fund (XLV) and UNH, we calculated P/E ratios from FY 2005 to FY 2014 and LTM as of May 4, 201522. The data is shown in the following table:
P/E 2005 2006 2007 2008 2009 2010 2011 2012 2013 2014
UNH 25.06 18.09 17.02 11.08 9.41 8.81 10.71 10.27 13.69 17.74
HUM 29.05 19.07 15.34 9.73 7.14 8.46 10.36 9.18 13.35 19.51
AET 17.46 14.44 16.64 10.07 11.16 7.30 8.08 9.63 12.87 15.64
CI 8.92 12.80 13.88 16.05 7.46 7.50 8.68 9.53 16.89 13.14
ANTM 20.25 16.33 15.78 8.85 5.90 8.19 9.14 7.45 10.57 13.98
WCG 30.95 20.09 8.22 -- 38.69 -- 8.61 11.54 17.69 56.99
XLV 19.44 18.91 15.75 10.01 12.78 12.13 12.37 14.33 19.15 19.51
In this table, it is worth mentioning that WCG’s P/E ratios over the 10-year period are not constant. The company is missing P/E ratios in both 2008 and 2010, which is attributable to the negative earnings in those years. In addition, the year-over-year change in P/E ratios is substantial, which signifies that WCG’s P/E ratios are not stable. Finally, the P/E ratios in 2009 and 2014 are extreme outliers in comparison to the company’s other P/E ratios since the stock price did not react
22Data collected from FactSet

33
negatively to the lower earnings in those years. For this reason, the P/E is drastically elevated in 2009 and 2014. Next, our team conducted a study of the P/E to P/E relationships between UNH and its comparables. In order to do so, we divided UNH’s P/E ratios from 2005 to 2014 by the P/E ratios of its comparables. The results are shown in the following table:
P/E to P/E Relationships
2005 2006 2007 2008 2009 2010 2011 2012 2013 2014 Mean Median
Adj. F
UNH/ HUM
0.862 0.949 1.109 1.139 1.318 1.041 1.035 1.119 1.025 0.909 1.051 1.038 1.000
UNH/ AET
1.435 1.253 1.023 1.101 0.843 1.207 1.326 1.067 1.064 1.134 1.145 1.117 1.145
UNH/ CI
2.808 1.414 1.226 0.691 1.262 1.175 1.235 1.078 0.811 1.349 1.305 1.230 1.130
UNH/ ANTM
1.237 1.108 1.079 1.252 1.595 1.075 1.173 1.379 1.295 1.269 1.246 1.245 1.245
UNH/ WCG
0.810 0.901 2.071 - 0.243 - 1.245 0.890 0.774 0.311 0.906 0.850 0.850
UNH/ XLV
1.289 0.957 1.080 1.108 0.736 0.726 0.866 0.717 0.715 0.909 0.910 0.888 0.888
34
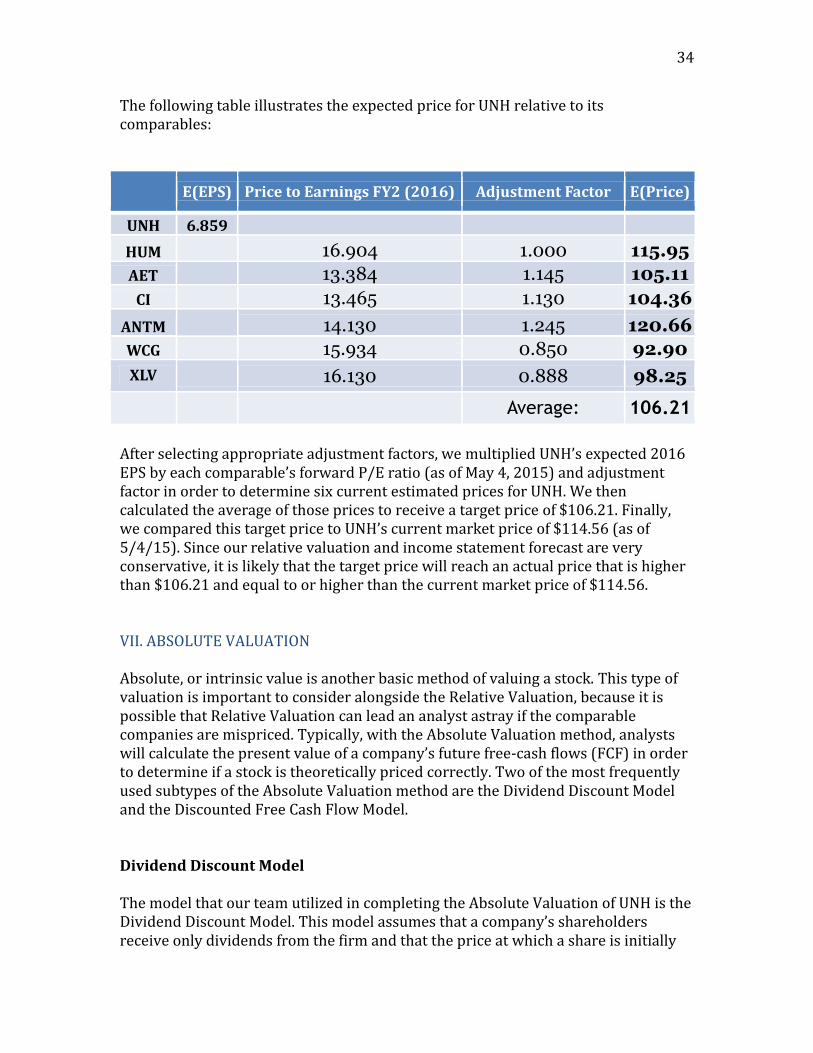
The following table illustrates the expected price for UNH relative to its comparables:
E(EPS) Price to Earnings FY2 (2016) Adjustment Factor E(Price)
UNH 6.859
HUM 16.904 1.000 115.95
AET
13.384 1.145 105.11
CI 13.465 1.130 104.36
ANTM 14.130 1.245 120.66
WCG
15.934 0.850 92.90
XLV
16.130 0.888 98.25
Average: 106.21
After selecting appropriate adjustment factors, we multiplied UNH’s expected 2016 EPS by each comparable’s forward P/E ratio (as of May 4, 2015) and adjustment factor in order to determine six current estimated prices for UNH. We then calculated the average of those prices to receive a target price of $106.21. Finally, we compared this target price to UNH’s current market price of $114.56 (as of 5/4/15). Since our relative valuation and income statement forecast are very conservative, it is likely that the target price will reach an actual price that is higher than $106.21 and equal to or higher than the current market price of $114.56. VII. ABSOLUTE VALUATION Absolute, or intrinsic value is another basic method of valuing a stock. This type of valuation is important to consider alongside the Relative Valuation, because it is possible that Relative Valuation can lead an analyst astray if the comparable companies are mispriced. Typically, with the Absolute Valuation method, analysts will calculate the present value of a company’s future free-cash flows (FCF) in order to determine if a stock is theoretically priced correctly. Two of the most frequently used subtypes of the Absolute Valuation method are the Dividend Discount Model and the Discounted Free Cash Flow Model. Dividend Discount Model The model that our team utilized in completing the Absolute Valuation of UNH is the Dividend Discount Model. This model assumes that a company’s shareholders receive only dividends from the firm and that the price at which a share is initially

35
purchased is the negative cash outflow. Following the initial outlay of cash, the dividends received by the shareholder are positive cash flows. An investor can then decide, based on the intrinsic value of the expected future dividends and considering the risk, whether or not an investment is worthwhile. In order to determine the required rate of return, which is one of the major components of the DDM, our team utilized the Capital Asset Pricing Model. The formula for CAPM is as follows:
E(R) = Rf + β(E[Rmkt] - Rf)
Where: E(R): Expected return
Rf : Risk-free rate E(Rmkt): Expected Market return
E(Rmkt) - Rf: Market risk premium β: Beta
First, we took the 10-year and 30-year treasury rates from both Bloomberg and FactSet to use as our risk-free rate. We found the current 10-year treasury rate to be 1.981% and the 30-year rate to be 2.662%. Next, we took both the raw and adjusted 5-year and 10-year beta from Bloomberg. Considering all four of these betas, we ended up choosing the highest beta of 0.900 (measured with monthly data over the last 10 years) in an effort to take a more conservative approach. We also used Bloomberg to discover the 9.362% market risk rate. Next, we calculated a variety of market risk premium rates to use in our expected return scenario analysis. Of the eight MRPs calculated, we decided that three of the rates would render us the most useful results: 7.382%, 6.701%, and 8.395%. Our team chose the third rate, 8.395%, by selecting a number between the total past average market risk premium (1926-2013) of 8.370% and the recent past average market risk premium (1986-2013) of 8.420%.
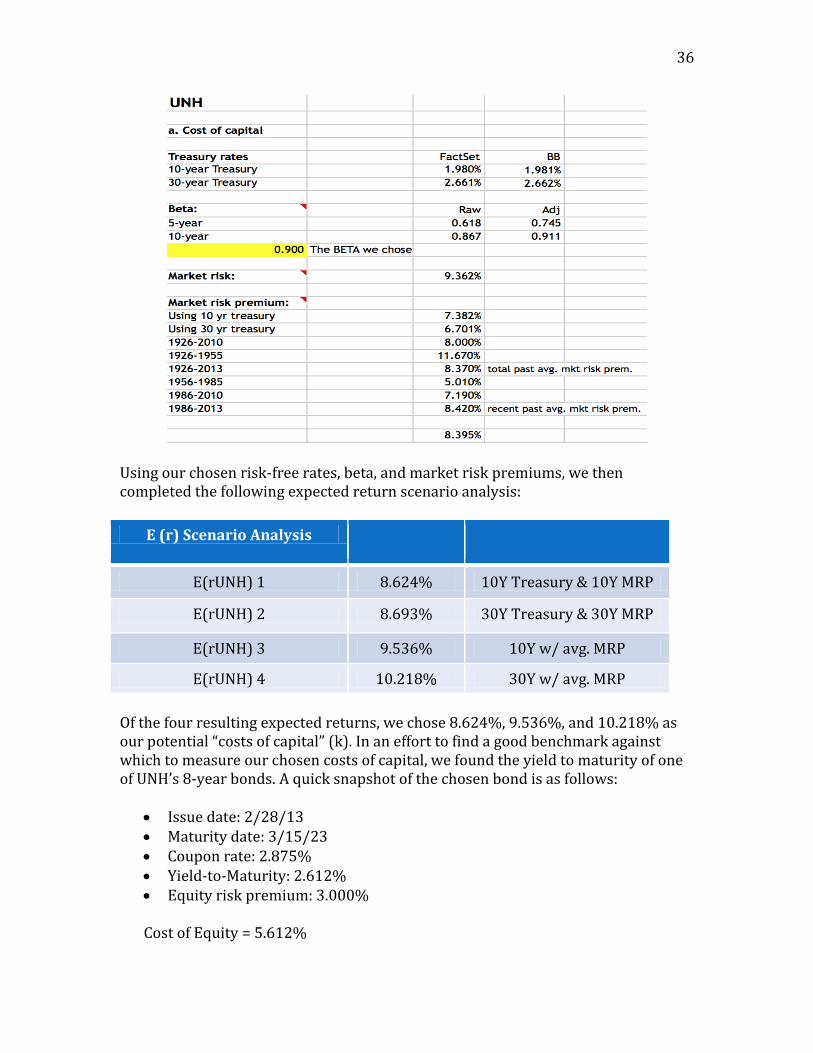
36
Using our chosen risk-free rates, beta, and market risk premiums, we then completed the following expected return scenario analysis:
E (r) Scenario Analysis
E(rUNH) 1 8.624% 10Y Treasury & 10Y MRP
E(rUNH) 2 8.693% 30Y Treasury & 30Y MRP
E(rUNH) 3 9.536% 10Y w/ avg. MRP
E(rUNH) 4 10.218% 30Y w/ avg. MRP
Of the four resulting expected returns, we chose 8.624%, 9.536%, and 10.218% as our potential “costs of capital” (k). In an effort to find a good benchmark against which to measure our chosen costs of capital, we found the yield to maturity of one of UNH’s 8-year bonds. A quick snapshot of the chosen bond is as follows:
Issue date: 2/28/13 Maturity date: 3/15/23 Coupon rate: 2.875% Yield-to-Maturity: 2.612% Equity risk premium: 3.000%
Cost of Equity = 5.612%

37
Our team determined that because the equity costs of capital were significantly higher than the yields on UNH’s bonds, the costs of capital that we calculated must be reasonable. For this reason, we decided to further disregard this 5.612% calculation.
Dec ‘10 Dec ‘11 Dec ‘12 Dec ‘13 Dec ‘14 Dec ‘16
DPS 0.41 0.61 0.80 1.05 1.41 1.85
EPS (dil.) 4.10 4.73 5.28 5.50 5.70 6.86
Payout Ratio
9.88% 12.95% 15.15% 19.14% 24.65% 27.00%
Change in Payout
8.95% 3.07% 2.20% 3.98% 5.51% 2.35%
Change in DPS
51.23% 30.61% 31.56% 33.49% 31.83%
After studying UNH’s 10k, we discovered that up until 2009, the company paid dividends annually, at $0.03 a share. UNH then increased that number to $0.41 annually and started paying the dividends quarterly. For this reason, when we calculated the DPS, payout ratio, and the percentage change in both, we chose to focus on the time period ranging from December 2010 to December 2014. Our team estimated that in December of 2016, the DPS and EPS would equal $1.85 and $6.86 (taken from the income statement forecast), respectively. These estimates yield a payout ratio of 27.00%, a change in payout ratio of 2.35%, and a two-year change in DPS of 31.83% in December 2016. The $1.85 DPS for 2016 was calculated by multiplying the 2016 forecasted diluted EPS ($6.86) by the 2016 forecasted payout ratio (27.00%).
Average Geo. Growth Rate for DPS
2004-2014 2007-2014 2009-2014 2010-2014 2014-2016
57.456% 73.241% 115.830% 36.38% 14.82%
Our team discovered that the average geometrical growth rate of DPS over the past four years returned a rate of 36.38% and that the year-over-year change in DPS in that same period was about 30% per year. For that reason, we had originally

38
estimated a DPS growth rate of 32% for 2016. However, after recognizing that Bloomberg’s forecasted future 3-year average growth rate was 14.3%, we decided to dig a little deeper. We later came to the realization that Bloomberg had likely chosen this number as a result of the acquisition of Catamaran that UNH had been planning. Thus, after considering the fact that UNH would be paying $12.8 billion in cash for Catamaran in Q4 of 2015 while still maintaining share repurchase that will cost $3,665.92 million23, we resolved to project an annual DPS growth rate of 15% for 2014 out to 2020. Next, we completed a scenario analysis using growth rates ranging from 1% to 9% and costs of capital 8.62%, 9.54%, and 10.22%:
In the worst-case scenario, using 10.22% as the cost of capital, we found that the current price (as of 5/4/2015) of $114.56 would equal the total intrinsic value at a growth rate of precisely 8.276%. With a 9.54% cost of capital, the current price equaled the total intrinsic value when the growth rate reached 7.535%. Finally, in the best-case scenario, with an 8.62% cost of capital, the current price equaled the total intrinsic value at a growth rate of 6.540%. In an effort to be conservative, we focused on the worst-case scenario growth rate of 8.276%. If UNH’s growth rate
23 See Appendix C

39
exceeds 8.276% after 2020, then the stock is undervalued and if it grows at a rate less than 8.276%, then the stock would be considered overvalued.
2011 2012 2013 2014 2015 2016 2017 2018 2019 2020 2020+
51.23% 30.61% 31.56% 33.49%
15% 15% 15% 15% 15% 15% 8.276%
Lastly, our team compared UNH’s historical DPS growth rates (the top row in the above table) over the past four years to our own estimated growth rate of 15% and calculated growth rate of 8.276% for all years succeeding 2020. The estimate using data from the last 5 years is much more applicable than the preceding years because the landscape of the industry has changed so drastically with the introduction of the Affordable Care Act (written into law in March of 2010). Therefore, it is likely that the growth rate will not only reach 15% for years 2015 to 2020 and then 8.276% thereafter, but also that it will exceed it. VIII. RISK FACTORS24 Regulation UnitedHealth Group is regulated by federal, state and local governments in the United States, as well as abroad. The laws and rules that govern its business are subject to frequent change. According to UnitedHealth Group’s 10-K, “Our business activities are highly regulated and new laws or regulations or changes in existing laws or regulations or their enforcement or application could materially and adversely affect our business.” In recent years, the Affordable Care Act is one regulation that has exposed a major risk by decreasing the industry’s profitability as a whole, on a per customer basis. The ACA has also created a change from an employer-based market to an individual market, thus impacting capital requirements, market share, and profitability. As previously stated, another risk factor involving the ACA is the potential for a possible elected Republican president to either alter or do away with it in the future. Furthermore, UNH has recognized that the Affordable Care Act, or any other change in the regulation of the managed health care industry could “change how they do business, restrict revenue and enrollment, increase their health care and administrative costs and capital requirements, or expose them to increased liability in courts for coverage determinations, contract interpretation and other actions.”
24UnitedHealth Group, Form 10-K for fiscal year ended December 31, 2014

40
Operational Risk UnitedHealth Group’s plans to acquire Catamaran Corporation in the fourth quarter of 2015 could also pose a potential threat to the company. UNH has addressed the possible risk of an acquisition in its 10-K by stating the following: “Any failure by us to manage successfully our strategic alliances or complete, manage or integrate acquisitions and other significant strategic transactions or relationships could materially and adversely affect our business, prospects, results of operations, financial position and cash flows. Success in completing acquisitions is also dependent upon efficiently integrating the acquired business into our existing operations, including our internal control environment, or otherwise leveraging its operations, which may present challenges that are different from those presented by organic growth and that may be difficult for us to manage. If we cannot successfully integrate these acquisitions and to realize contemplated revenue growth opportunities and cost savings, our business, prospects, results of operations, financial position and cash flows could be materially and adversely affected.”
Market Risk Though UnitedHealth Group increased its participation in public exchanges in 2015, the company’s limited participation in 2014 led to a loss of enrollments. In their 2014 10-K form, UNH states that “If we fail to compete effectively to maintain or increase our market share, including maintaining or increasing enrollments in businesses providing health benefits, our results of operations, financial position and cash flows could be materially and adversely affected.”
Cost Risk UnitedHealth Group uses underwriting criteria, product design, care management programs, and negotiation of favorable provider contracts to manage medical costs. If the company were to fail at estimating, pricing, or managing medical costs effectively, profits and cash flows could be negatively affected. In their 2014 10-K form, UNH states that “Although we base the premiums we charge and our Medicare bids on our estimates of future medical costs over the fixed contract period, many factors may cause actual costs to exceed those estimated and reflected in premiums or bids. These factors may include medical cost inflation, increased use of services, increased cost of individual services, natural catastrophes or other large-scale medical emergencies, epidemics, the introduction of new or costly drugs, treatments and technology, new mandated benefits (such as the expansion of essential benefits coverage) or other regulatory changes and insured population characteristics.”
Supplier Risk

41
As discussed in the Industry Analysis, UnitedHealth Group’s suppliers consist of physicians, hospitals and other health care providers. These suppliers provide crucial products and services that generally have no substitutes. According to UnitedHealth Group’s 10-K form “If we fail to develop and maintain satisfactory relationships with physicians, hospitals and other service providers, our business could be materially and adversely affected. If these providers refuse to contract with us, use their market position to negotiate favorable contracts or place us at a competitive disadvantage, our ability to market products or to be profitable in those areas could be materially and adversely affected.” Macroeconomic Trends As with any company across all industries, UnitedHealth Group faces a host of Macroeconomic risks. Certain economic conditions may impact the demand of products and services that UnitedHealth Group provides. One example is that a slower pace of growth in the market may affect the ability of UNH to provide coverage at an acceptable rate of return. The company has established in its 10-K form that “Unfavorable economic conditions could materially and adversely affect our revenues and our results of operations…impact our ability to increase premiums or result in the cancellation by certain customers of our products and services.” IX. CONCLUSION UnitedHealth Group has been in business since 1977. Currently serving more than 100 million individuals, it holds more than 36% of the industry market. The Affordable Care Act, written into law in 2010 increased the industry’s customer base by adding the previous uninsured population. Although this recent regulation could also lower the industry profitability per customer, larger companies are more likely to succeed due to their pricing leverage. Being that UNH the largest of its industry, we believe it will keep growing in this new business environment. The Fundamental Analysis showed us that, during the last ten years, the company has been a top performer inside the industry. Measured by the different financial ratios, UNH has been overall above or at the industry average level. Its return over the owner’s capital involves profitability, efficient use of its assets and an average use of leverage. Consequently, we reviewed this analysis as positive. Our Relative Valuation Analysis resulted in a target price that is close but still below the current stock price. However, after evaluating UNH’s recent stock price fluctuation we valued this analysis as neutral towards our recommendation.

42
Finally, the Absolute Valuation Analysis indicates that an annual DPS growth of 15% until 2020 and a subsequent annual DPS growth in the 6.540% to 8.276% range would indicate a fair current price. Considering the recent DPS historical data and the company’s stated commitment to advance its dividend policy, we expect the future growth to be at higher levels than the ones shown by this analysis. Therefore, we believe that the Absolute Valuation yields a positive evaluation for UNH. Based on the overall analysis results, our team recommends the addition of 150 shares of UnitedHealth Group into the Graduate Student Managed Investment Fund.

43
BIBLIOGRAPHY
Doron Nissim. “Analysis and Valuation of Insurance Companies, Center for Excellence in Accounting and Security Analysis”. Columbia University. 2010. Web. 3 May 2015.
"Executives." UnitedHealth Group. 1 Jan. 2015. Web. 3 May 2015. "Facts 2014 Q4." UnitedHealth Group Facts. UnitedHealth Group, 1 Jan. 2014. Web.
30 Apr. 2015. "Health Expenditure, Total (% of GDP)." World Health Organization Global Health
Expenditure Database. The World Bank, 2015. Web. 5 May 2015. Heilbrunn, Evi. "Top Health Insurance Companies." US News. U.S.News & World
Report, 5 Nov. 2014. Web. 5 May 2015. "How Does ObamaCare Work?” ObamaCare Facts: Affordable Care Act, Health
Insurance Marketplace. ObamaCare Facts, 1 Jan. 2015. Web. 1 May 2015. "Industry Overview." Insurance Information Institute. N.p., n.d. Web. 6 May 2015. Mathews, Anna Wilde. "UnitedHealth to Buy Catamaran for $12.8 Billion in Cash.”
WSJ. The Wall Street Journal, 30 Mar. 2015. Web. 1 May 2015. "Mission & Values." UnitedHealth Group. 1 Jan. 2015. Web. 3 May 2015. “National Health Expenditures 2013 Highlights." National Health Expend Data.
Centers for Medicare & Medicaid Services, 2014. Web. 5 May 2015. "Our History." UnitedHealth Group. 1 Jan. 2015. Web. 3 May 2015. Petruno, Tom. "Seven Great Dow Stocks for Dividends." Kiplinger. Kiplinger, 11 Dec.
2014. Web. 3 May 2015. Smith, Jessica, and Carla Medalia. "Health Insurance Coverage in the United States:
2013." United States Census Bureau. U.S. Department of Commerce, 1 Sept. 2014. Web. 5 May 2015.
“UnitedHealth Group – Catamaran and OptumRx to Combine.” Newsroom. UnitedHealth Group, 30 Mar. 2015. Web. 3 May 2015.
"UNITEDHEALTH GROUP REPORTS FIRST QUARTER RESULTS." News Release.
UnitedHealth Group, 16 Apr. 2015. Web. 1 May 2015. UnitedHealth Group, Form 10-K for fiscal year ended December 31, 2014

44
Wayne, Alex. "Obamacare Shuffles Health Plan Market Share, Report Finds."
Bloomberg.com. Bloomberg, 18 Mar. 2014. Web. 5 May 2015.
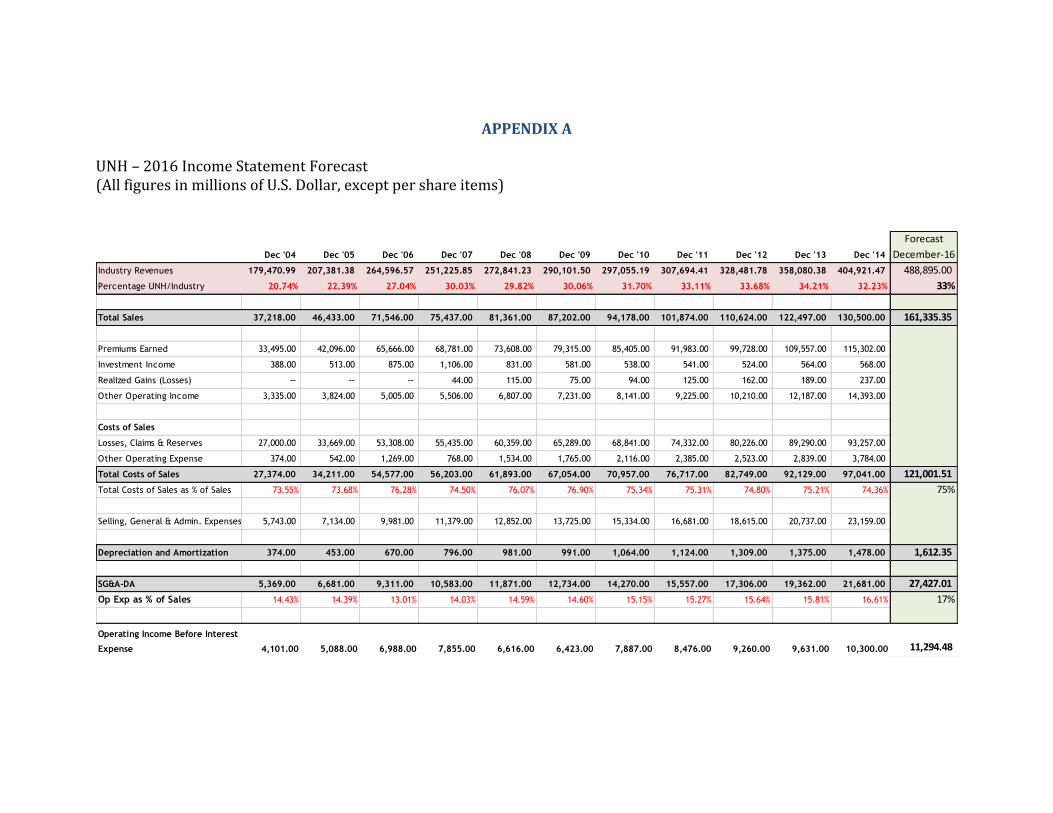
APPENDIX A UNH – 2016 Income Statement Forecast (All figures in millions of U.S. Dollar, except per share items)
Forecast
Dec '04 Dec '05 Dec '06 Dec '07 Dec '08 Dec '09 Dec '10 Dec '11 Dec '12 Dec '13 Dec '14 December-16
Industry Revenues 179,470.99 207,381.38 264,596.57 251,225.85 272,841.23 290,101.50 297,055.19 307,694.41 328,481.78 358,080.38 404,921.47 488,895.00
Percentage UNH/Industry 20.74% 22.39% 27.04% 30.03% 29.82% 30.06% 31.70% 33.11% 33.68% 34.21% 32.23% 33%
Total Sales 37,218.00 46,433.00 71,546.00 75,437.00 81,361.00 87,202.00 94,178.00 101,874.00 110,624.00 122,497.00 130,500.00 161,335.35
Premiums Earned 33,495.00 42,096.00 65,666.00 68,781.00 73,608.00 79,315.00 85,405.00 91,983.00 99,728.00 109,557.00 115,302.00
Investment Income 388.00 513.00 875.00 1,106.00 831.00 581.00 538.00 541.00 524.00 564.00 568.00
Realized Gains (Losses) -- -- -- 44.00 115.00 75.00 94.00 125.00 162.00 189.00 237.00
Other Operating Income 3,335.00 3,824.00 5,005.00 5,506.00 6,807.00 7,231.00 8,141.00 9,225.00 10,210.00 12,187.00 14,393.00
Costs of Sales
Losses, Claims & Reserves 27,000.00 33,669.00 53,308.00 55,435.00 60,359.00 65,289.00 68,841.00 74,332.00 80,226.00 89,290.00 93,257.00
Other Operating Expense 374.00 542.00 1,269.00 768.00 1,534.00 1,765.00 2,116.00 2,385.00 2,523.00 2,839.00 3,784.00
Total Costs of Sales 27,374.00 34,211.00 54,577.00 56,203.00 61,893.00 67,054.00 70,957.00 76,717.00 82,749.00 92,129.00 97,041.00 121,001.51
Total Costs of Sales as % of Sales 73.55% 73.68% 76.28% 74.50% 76.07% 76.90% 75.34% 75.31% 74.80% 75.21% 74.36% 75%
Selling, General & Admin. Expenses 5,743.00 7,134.00 9,981.00 11,379.00 12,852.00 13,725.00 15,334.00 16,681.00 18,615.00 20,737.00 23,159.00
Depreciation and Amortization 374.00 453.00 670.00 796.00 981.00 991.00 1,064.00 1,124.00 1,309.00 1,375.00 1,478.00 1,612.35
SG&A-DA 5,369.00 6,681.00 9,311.00 10,583.00 11,871.00 12,734.00 14,270.00 15,557.00 17,306.00 19,362.00 21,681.00 27,427.01
Op Exp as % of Sales 14.43% 14.39% 13.01% 14.03% 14.59% 14.60% 15.15% 15.27% 15.64% 15.81% 16.61% 17%
Operating Income Before Interest
Expense 4,101.00 5,088.00 6,988.00 7,855.00 6,616.00 6,423.00 7,887.00 8,476.00 9,260.00 9,631.00 10,300.00 11,294.48

46
APPENDIX B UNH – 2016 Income Statement Forecast (All figures in millions of U.S. Dollar, except per share items)
Forecast
Dec '04 Dec '05 Dec '06 Dec '07 Dec '08 Dec '09 Dec '10 Dec '11 Dec '12 Dec '13 Dec '14 December-16
Interest Expense, Net of Interest
Capitalized 128.00 241.00 456.00 544.00 639.00 551.00 481.00 505.00 632.00 708.00 618.00 671.88
Operating Income After Interest
Expense 3,973.00 4,847.00 6,532.00 7,311.00 5,977.00 5,872.00 7,406.00 7,971.00 8,628.00 8,923.00 9,682.00 10,622.60
Unusual Expense - 8.00 4.00 6.00 1,353.00 64.00 23.00 12.00 6.00 8.00 26.00 15.00
Pretax Income 3,973.00 4,839.00 6,528.00 7,305.00 4,624.00 5,808.00 7,383.00 7,959.00 8,622.00 8,915.00 9,656.00 10,607.60
Income Taxes 1,386.00 1,756.00 2,369.00 2,651.00 1,647.00 1,986.00 2,749.00 2,817.00 3,096.00 3,242.00 4,037.00 4,455.19
Realized Tax Rate 34.89% 36.29% 36.29% 36.29% 35.62% 34.19% 37.23% 35.39% 35.91% 36.37% 41.81% 42%
Consolidated Net Income 2,587.00 3,083.00 4,159.00 4,654.00 2,977.00 3,822.00 4,634.00 5,142.00 5,526.00 5,673.00 5,619.00 6,152.41
Minority Interest - - - - - - - - - 48.00 - -
Net Income 2,587.00 3,083.00 4,159.00 4,654.00 2,977.00 3,822.00 4,634.00 5,142.00 5,526.00 5,625.00 5,619.00 6,152.41
938.00
6.559
0.30
6.859
Weighted Average Diluted Shares (in millions)
Expected EPS UNH 2016
Expected EPS from Catamaran unit
Expected EPS 2016 UNH (with Catamaran)

APPENDIX C