student name - s3.amazonaws.coms3.amazonaws.com/scschoolfiles/300/sciencefairhandbo… · web...
TRANSCRIPT

OHS Science Fair Project 2015
STUDENT NAME: ________________________________________________________
HOUR: ____________________________________________________________________________
1
2015

OHS Science Fair Project 2015
ASSIGNMENT DUE DATE POINTS POSSIBLE
Handbook ReceivedOctober 19
25 bonus points if returned with (2) parent signatures by Friday 10.23.15
Topic Form October 2750 points
Experimental Design & Approval Sheet November 3 100 points
Abstract November 10 50 points
Final Draft Research Paper/ Lab Report November 13 100 points
Display Board or Power Point File November 17 100 points
Total Project Points Possible:
400 points
1 of 2 Parent’s Signature _______________________________ Date____________
2

OHS Science Fair Project 2015
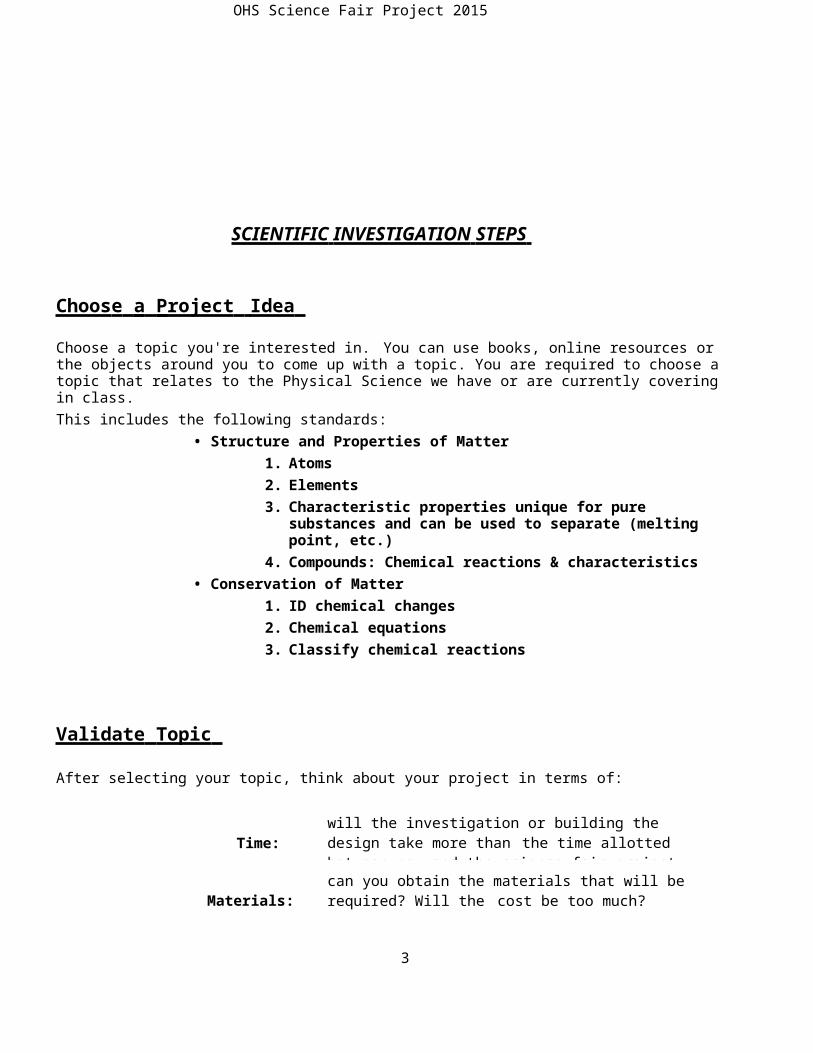
SCIENTIFIC INVESTIGATION STEPS
Choos e a Project Idea
Choose a topic you're interested in. You can use books, online resources or the objects around you to come up with a topic. You are required to choose a topic that relates to the Physical Science we have or are currently covering in class. This includes the following standards:
• Structure and Properties of Matter1. Atoms2. Elements3. Characteristic properties unique for pure substances and can
be used to separate (melting point, etc.)4. Compounds: Chemical reactions & characteristics
• Conservation of Matter1. ID chemical changes2. Chemical equations3. Classify chemical reactions
Validate Topic
After selecting your topic, think about your project in terms of:
Time:will the investigation or building the design take more than the time allotted between now and the science fair project due date?
Materials:can you obtain the materials that will be required? Will the cost be too much?
Safety:
are the tools and other materials safe for you to use? Will an adult be available to help with anything that might not be safe for you to do alone? Are any of the materials ones that someone could be allergic to?
Appropriateness:is the topic something that you can understand? Will the research require you to read things that are too hard?
3
OHS Science Fair Project 2015
I nvestigation
While scientists study a whole area of science, each experiment is focused on learning just one thing at a time. This is essential if the results are to be trusted by the entire science community.
In an investigation, you:
Ask a testable question Research the topic Make a hypothesis about the outcome based on the research or their own knowledge Design the investigation Conduct the investigation Collect Data Make sense of the data and draw a conclusion Present your findings for peer review
What is a Testable Question?
The key to a good and manageable investigation is to choose a topic of interest, then ask what is called a “testable question.” Testable questions are those that can be answered through hands-on investigation by the student. The key difference between a general interest science question and a testable question is that testable questions are always about changing one thing to see what the effect is on another thing.
Here are some examples of broader science questions and testable questions:
Broad Questions (lead to science reports) Testable questions (lead to investigations)
How do plants grow? What amount of water is best to grow tomatoes? or What type of soil is best to grow petunias? or what amount of sunlight is best to grow daffodils?
What makes something sink or float? How well do different materials sink or float in water?
How do rockets work? How does changing the shape of a rocket’s fins change its flight?How does the sun heat up water? Does the sun heat salt water and fresh water at the same rate?
What happens when something freezes? Do different liquids freeze at the same rate?
What makes cars move? How does the surface on which a car moves affect how fast it goes?
4

OHS Science Fair Project 2015
Conduct Background Research
Once you have a testable question, it is important to do some background research. What do scientists think they already know about the topic? What are the processes involved and how do they work? Background research can be gathered first hand from primary sources such as interviews with a teacher, scientist at a local university, or other person with specialized knowledge. Or you can use secondary sources such as books, magazines, journals, newspapers, online documents, or literature from non-profit organizations. Don’t forget to make a record of any resource used so that credit can be given in a bibliography.
Gathering Back ground Research
Helps you gain in depth knowledge about the topic and processes you will be observing during the investigation.
Sparks ideas about different variables to test when setting up the investigation. Provides the basis for predicting what will happen in the investigation when making a
hypothesis. Provides the understanding needed to interpret and explain the results to others –especially
your teacher!
Compose Hypothesis
After gathering background research, you will be better prepared to formulate a hypothesis. More than a random guess, a hypothesis is a testable statement based on background knowledge, research, or scientific reason. A hypothesis states the anticipated cause and effect that may be observed during the investigation. Consider the following hypothesis:
If ice is placed in a Styrofoam container, it will take longer to melt than if placed in a plastic or glass container. I think this is true because my research shows that a lot of people purchase Styrofoam coolers to keep drinks cool.
The time it takes for ice to melt (dependent variable) depends on the type of container used (independent variable.). A hypothesis shows the relationship among variables in the investigation and often (but not always) uses the words if and then.
Take a look at these additional examples:
If a mixture of vinegar and baking soda are used, then more stains may be removed. I think this because vinegar and baking soda are used in many different cleaning products.
When an object has a volume greater than 30 cubic centimeters, then it will sink in water. In the past, I have seen big objects sink.
5

OHS Science Fair Project 2015
D esign Experiment
Once you formulate a hypothesis for their investigation, they must design a procedure to test it. A well-designed investigation contains procedures that take into account all of the factors that could impact the results of the investigation. These factors are called variables.
There are three types of variables to consider when designing the investigation procedure.
The independent variable is the one variable the investigator chooses to change. Controlled variables are variables that are kept the same each time. The dependent variable is the variable that changes as a result of /or in response to the
independent variable.
Talking through the investigation with a parent or a friend will help you to clarify the different variables involved in the experimental design. What factors will change? What factors will stay the same?
Step A – Clarify the variables involved in the investigation by developing a table such as the one below.
Testable Question
What is changed? (independent variable)
What stays the same? (controlled variables)
Data Collected (dependent variable)
What detergent removes stains the best?
Type of detergent, type of stain
Type of cloth, physical process of stain removal
Stain fading over time for combinations of detergents and stains
Step B – Make a list of materials that will be used in the investigation.
Step C – List the steps needed to carry out the investigation.
Step D – Estimate the time it will take to complete the investigation. Will the data be gathered in one sitting or over the course of several weeks?
Step E – Check the work. Ask someone else to read the procedure to make sure the steps are clear. Are there any steps missing? Double check the materials list to be sure all to the necessary materials are included.
6

OHS Science Fair Project 2015
Se t Up and Collect Data
After designing the procedure and gathering the materials, it is time to set up and to carry out the investigation. When setting up the investigation, students will need to consider…
The locationChoose a low traffic area to reduce the risk of someone accidentally tampering with the investigation results—especially if the investigation lasts for several weeks.
Safety
Avoid harmful accidents by using safe practices.
The use of construction tools or potentially harmful chemicals will require adult supervision.
Locate the nearest sink or fire extinguisher as a safety precaution. Determine how to dispose of materials. For example, some chemicals
should not be mixed together or put down a sink drain. Wear protective clothing such as goggles and gloves. Tie back loose
hair so that it does not get caught on any of the equipment.
Documentation Making a rough sketch or recording notes of the investigation set up is helpful if the experiment is to be repeated in the future. (Lab notebook)
Carrying out the investigation involves data collection. There are two types of data that may be collected—quantitative data and qualitative data.
Quantitative Datao Uses numbers to describe the amount of something.o Involves tools such as rulers, timers, graduated cylinders, etc.o Uses standard metric units (For instance, meters and centimeters for length, grams for
mass, and degrees Celsius for volume.o May involve the use of a scale such as in the example below.
Qualitative Datao Uses words to describe the datao Describes physical properties such as how something looks, feels, smells, tastes, or
sounds.
As data is collected it can be organized into lists and tables. Organizing data will be helpful for identifying relationships later when making an analysis.
7
OHS Science Fair Project 2015
Analyz e Data and Draw Conclusions
After you have collected your data the next step is to analyze it. The goal of data analysis is to determine if there is a relationship between the independent and dependent variables. In student terms, this is called “looking for patterns in the data.” Did the change I made have an effect that can be measured?
Besides analyzing data on tables or charts, graphs should be used to make a picture of the data. Graphing the data can often help make those relationships and trends easier to see. Graphs are called “pictures of data.” The important thing is that appropriate graphs are selected for the type of data. For example, bar graphs, pictographs, or circle graphs should be used to represent categorical data (sometimes called “side by side” data). Line plots are used to show numerical data. Line graphs should be used to show how data changes over time. Graphs can be drawn by hand using graph paper or generated on the computer from spreadsheets for students who are technically able.
You can use these questions to help guide students in analyzing their data:
What can be learned from looking at the data? How does the data relate to the student’s original hypothesis? Did what you changed (independent variable) cause changes in the results (dependent
variable)?
After analyzing the data, you will be able to answer these questions as you draw some conclusions. You should not change your hypothesis if it does not match your findings. The accuracy of a hypothesis is NOT what constitutes a successful science fair investigation. Other scientists will want to see that the conclusions stated match the data that was collected.
7

OHS Science Fair Project 2015
The Laboratory Notebook
A properly maintained laboratory notebook is one of a researcher's most valuable tools. It contains the permanent written record of the scientist's or engineer's mental and physical activities from both experiment and observation, to the ultimate understanding of the question or solution they are going to obtain from their research project. The act of writing in the notebook forces the researcher tostop and think about what he/she is about to do and what is actually done. Because of this, the proper writing of a project laboratory notebook is an essential part of doing "good" science. The following guidelines are consistent with those of many major industrial laboratories and universities.
Guidelines:1. The front cover of the notebook should contain a title that describes the research, and the time period covered for the data recorded in the book. If more than one notebook is used, then this should also be indicated by adding Volume I, II, etc. The first two pages of the book should be reserved for a table of contents. All remaining pages should be numbered on the top outside corner of the page. The table of content entries should be added as the project progresses2. The right-hand pages should be used for making formal entries. The left-hand pages should be used for calculations, doodling, scratch paper, etc. All right-hand pages should be dated when information is recorded on them.3. No pages should be removed from the notebook. If information on a particular page becomes invalid for whatever reason, a single diagonal line should be drawn through the information and a brief sentence or two added explaining why the material is no longer valid. If an error is made in recording something, it should not be erased or obliterated in any way. Instead, draw one line through the incorrect entry and write the correct entry as near to it as possible. Never write a number or wordover another number or word.4. Photographs, computer printouts, recorded printouts, etc. should be properly labeled and taped or glued onto one of the right-hand pages. All numbers should be recorded in the notebook using the correct number of digits and labeled with the proper units. Students are required to use the International System of Units (SI) in the final presentation of the data. Always enter data directly in the notebook, in ink, at the time it is obtained (unless the data is being recorded automatically by an instrument).5. If a detailed experimental procedure is being followed that is available in a readily available reference source (such as a textbook), the procedure should only be summarized in the notebook and the reference listed for the exact procedure. Any changes from the referenced procedure should be recorded and explained in the notebook.6. Mathematical type formulas used in the project should be recorded on the right hand pages with a definition of each term in the formula along with at least one sample calculation. Again, the proper physical units should always be recorded next to the respective numerical values.7. When chemicals are used, the name, formula, purity, and manufacturer of the chemical should be recorded.8. When instruments are used, the name and operational settings for the instrument should be recorded in the notebook.9. The purpose of each experiment in the project should be clearly stated in the notebook as it is performed, along with the corresponding procedures, data, assumptions, conclusions, etc. In summary, a project notebook is not supposed to be an attractive document; it is a working document. Yes, it may even have a few chemical stains on it and a torn page or two. However, the entries should be legible, complete, reasonably neat, and logically presented. In summary, a project notebook is not supposed to be an attractive document; it is a working document. Yes it may even have a few chemical stains on it and a torn page or two. However, the entries should be legible, complete, reasonably neat, and
8

OHS Science Fair Project 2015
logically presented.
9

OHS Science Fair Project 2015
Research Paper/ Lab Report (based on http://sciencebuddies.org/science-fair-projects/SciF_Project_Guide_Research_Paper.pdf)
Your final research paper must be typed all in black font with either Arial or Time New Roman at 12pts. It may also include colored images or graphs. The research paper/lab report must follow the outline as follows.
On a separate sheet of paper include the Title Page as follows;
Title of your Science Fair Project
Your Name
Science Section
Date
Your second page should include your title centered at the top.
Title of your Science Fair Project
Problem/Question
Write your problem for your experiment, the importance of doing your experiment. Why are you doing this experiment?
Background
Write at least three sentences explaining why the project was done. This can include information about when things were discovered and why there is a need to do your experiment.
Hypothesis
What is your opinion about what will happen? Proposed explanation for the problem.
10

OHS Science Fair Project 2015
Variables
Independent Variable: What will you be changing?
Dependent Variables: What will you be measuring or observing?
Controlled variables: What will remain the same?
Materials
List all the material that will be needed for this experiment.
Procedure
1. List the steps needed for your experiment. Write it as an informative; do not use the word “I”. DO NOT say “I put water in a cup” instead write “put water into a cup”.
Observations
Include any pictures you have of your experiment here.
Results and Conclusions
Include a summary of your results and an explanation of how it satisfies the purpose. This also includes graphs and data tables.
Include if your hypothesis was supported or not with your results. Write if you had any problems with the experiment. Also include a good future experiment of your experiment. How would you improve your experiment? After doing your experiment what would be something else that would be interesting to learn.
Acknowledgements
Recognize all who provided significant assistance in the form of materials and guidance.
11

OHS Science Fair Project 2015
Bibliography
List all sources. Sources without authors should be arranged alphabetically by title within the authors.
1. Biggs, A., Daniel, L., Feather, R. M., Snyder, S. L., & Zike, D. (2002). Science in Action.
Texas Science Grade 6. New York: McGraw-Hill Companies, Inc., 12-29.
Author’s of textbook alphabetically last name, first name initial & last name, first name
initial. (Year). Title of Section. Title of textbook. (Edition). Place of publication :
Publisher, page number.
2. Brown, S. (2000, Dec ). Best flowers every. Real Simple Magazine. (32),4-5.
Author of article last name, first name initial. (Year, Month Day). Title of article. Name
of the Magazine italicized, Volume number (issue number ), Page number.
3. Owen, M. (1996). How to Preserve Fresh Cut Flowers-Naturally. Plan Tea, Inc.
Retrieved on September 1, 2011 from http://www.plantea.com/cutflowers.htm
Author of site Last name, first name initial. (Year). Title. Retrieved date, from website.
4. Smith, S., & Thomas, G. (1990). Encyclopedia Britannica. (4th ed., 1-10). New York:
New York Press.
Editors of encyclopedia alphabetically last name, first name initial & last name, first
name initial. (Year). Title of encyclopedia-italicized. (Edition, volumes). Place of
publication : Publisher.
5. Star, F. (2005). Plant. New York: New York, Glencoe McGraw-Hill. 4-5.
“Author’s Last name, first name initial”. (Year). Title of book italicized, page numbers.
12

OHS Science Fair Project 2015
Power Point Presentation
What is PPT?
PPT is a presentation software program. It allows creating slides in an outline type format that is easy to read and works as a great aid for oral presentation.
What if I don’t have access to a computer at home?
If you do not have access to PPT or a computer at home, special arrangements can be made at school for the assignment to be completed. You will need to let me know immediately that you need to have access to a computer before or after school so that proper arrangements can be made and ample time for the assignments completion can be provided.
What do I need to include in my PPT presentation?
Title Slide (name, section, and project title)
Question (or purpose) slide
Hypothesis and Variables/Control slide (stated in a cause and effect statement)
Materials slide (all quantities must be listed)
Safety and Methods slide (methods must be listed in numerical order-no paragraph format, please.) (all safety precautions must be noted)
Data Tables slide (data tables will not necessarily be filled in with data, but should be set up to accept your data)
Preliminary Results and Conclusions
Bibliography (APA format must be used) (at least 3 reliable, scientific resources must be noted)
See the PowerPoint Rubric for more information located at the end of the handbook.
13

Purpose
Hypothesis
Variables
Materials
BackgroundResearch
Results andConclusion
Bibliography
OHS Science Fair Project 2015
Display Board
Your display can reflect your personality:
Is every inch of my locker or bedroom covered with magazine clippings, posters, stickers, and sticky notes? Or am I more of a minimalist? What’s my idea of a good time: scrapbooking or skateboarding? Is the presentation the part of the science fair I’ve been waiting for, or is that the part I dread?
Stand Out from the Crowd
Whether you are the kind of person who loves to design and decorate and dabble with computer graphics, or the one who always opts for the standard black-and-white report cover, this is a time for students to get creative. The stakes are high here and you will want your personality to shine through.
You can learn how to edit your text down to the essentials, pick and choose the best photos and graphics, and display them all in the most clear and compelling way possible. Through creative use of color, type and graphic elements, you can make your ideas pop and bring your projects to life.
Everything associated with your display must fit into the space allocated from your project, which is 76 cm deep x 122 cm wide x 274 cm high if floor mounted. Only use floor mounted projects for extra tall or extra heavy display boards and/or equipment if table mounted, the height limit is still 274 cm, including the table which is about 76 cm high. If you would like for me to purchase a display board for you, please let me know ASAP. I will require the money to be due fairly quickly so that I am able to purchase the boards in plenty of time. I hope to keep the cost at or less than $5 per board.
There are many searchable poster board examples online and in reference books.
This is an example:
Project TitleProcedure
Observations and Data
14

OHS Science Fair Project 2015
The following MUST be on the board.
Title limited to 6 words or less, and a maximum of 50 letters/characters. Abstract (If applicable) Question/Purpose Hypothesis Variables Background research Materials list Experimental procedure Data analysis and discussion including data chart (s) and graph (s) Conclusions (including ideas for future research) Acknowledgements Bibliography
Oral presentation for your classmates
You may be randomly selected to present your project to the rest of the class. The presentation should be 3-5 minutes long, briefly covering most of the parts of the project. This could earn you bonus points!
Project Abstract
The abstract must contain a title page with your title, name, class section, and date. It should also be done neatly using proper grammar and punctuation. It should not contain more than 250 words. A sample abstract is shown below.
SOLUTION TO POLLUTION: ENERGY FROM WASTE MATERIALSSewage sludge and solid wastes are an unavoidable by product of modern society. High disposal costs for these waste materials, coupled with a projected increase in waste production over the next decade, form a serious problem. This experiment was aimed at contributing to a partial solution of the waste disposal and energy shortage enigma.For this experiment, sewage sludge, wood and sludge/wood mixture were pyrolized in a batch reactor to produce oil. The production rates of oil were compared for the three materials. The average production rates of oil from all materials were excellent. The boiling range of the wood-derived oil proved to be slightly better than that of the sludge-derived oil, with the sludge/wood-derived oil being intermediate.Sludge, waste wood and sludge/solid waste pyrolysis should be economically attractive, as the feedstocks are both renewable and inexpensive. Plant attractiveness is increased when the costs of alternate methods of waste disposal are taken into account.
15

OHS Science Fair Project 2015
In general, an abstract should include the following:(a) purpose of the experiment• An introductory statement of the reason for investigating the topic of the project.• A statement of the problem and/or hypothesis being studied.(b) procedures used• A summarization of the key points and an overview of how the investigation was conducted.• An abstract does not give details about the materials used unless it greatly influenced the procedure or had to be developed to do the investigation.• An abstract should only include procedures done by the student. Work done by a mentor (such as surgical procedures) or work done prior to student involvement should not be included.(c) dataThis section should provide key results that lead directly to the conclusions you have drawn. It should not give too many details about the results nor include tables or graphs.(d) conclusions• Conclusions from the investigation should be described briefly.• The summary paragraph should reflect on the process and possibly state some applications and extensions of the investigation.The abstract should not include:b) acknowledgements (including naming the research institution and/or mentor with which you were working), orc) work or procedures done by a mentor or a supervisor.
Works cited for this Handbook: This document was created with the help of resources from:
http://www.education.com/ http://school.discoveryeducation.com/sciencefaircentral/ http://www.sciencebuddies.org/ http://www.juliantrubin.com/fairprojects.htmlhttp://hsshigh.org/pdfs/ScienceFairHandbook.pdfhttp://hunstem.uhd.edu/SEFH/documents/ruleguid09.pdf http://www.apastyle.org http://www.library.cornell.edu/resrch/citmanage/apa
16

OHS Science Fair Project 2015
Science Fair Final Research Paper RubricTitle Page (4pts) Point Value Points EarnedReport has no title page 0Title, name, section or date missing 2Title appropriate, name, section and date present 4
ScoreFont of Paper (4pts)Wrong color, font AND size 0Color, font OR size incorrect 2Black font, Arial or Time New Roman, AND 12 pt font 4
ScoreOrder of Information (8pts)Information is all out of order 0Some things are in order, but others are not 4Order followed completely 8
ScoreBackground Research (8pts)Proper information not provided 0
Less than three sentence, incomplete information, or sentences are incomplete
4
3 or more complete sentences fully explaining why the project was done 8
ScoreProblem (4pts)None stated 0
Incomplete sentences, or importance and reasons for experiment not explained
2
Complete sentences with importance and reasons of experiment explained 4
ScoreHypothesis (8pts)No hypothesis stated 0Not a testable hypothesis 2Hypothesis not a complete sentence 4Proper testable hypothesis stated in a complete sentence 8
Score
17

OHS Science Fair Project 2015
Science Fair Final Research Paper RubricVariables (8pts) Point Value Points EarnedNo variables included 0Only one variable mentioned 2Independent or Dependent Variable, or Constant not mentioned 6Independent or Dependent Variable, or Constant included 8
ScoreMaterials (4pts)No materials listed 0Some materials not listed 2All materials listed 4
ScoreProcedures (8pts)Procedures not included 0Proper Pronouns used (I, You, Me) 2Some Procedures left out 4-6All Procedures included and no proper pronouns are used 8
ScoreResults and Conclusions (12pts)No results and conclusions included 0Incomplete conclusion given or graphs and data table not included 4Conclusion given in incomplete sentences or graphs and tables not included 8
Graphs and Tables included and explained. Summary of results included, and statement of whether or not the hypothesis was supported
12
ScoreAcknowledgements (4 pts)None included 0Names spelled incorrectly 2All people that assisted included, with names spelled correctly 4
ScoreBibliography (8pts)Not included 0Proper format not followed 4Format followed and all sources included 8
ScoreEffort (4pts)No effort shown 0Only shows some effort 2Paper shows effort by student 4
ScoreResearch Paper Worksheets (4pts)Most worksheets missing 0Some worksheets missing 2All worksheets included 4
Score
18

OHS Science Fair Project 2015
Science Fair Final Research Paper RubricFormat, spelling, punctuation and overall editing of paper (12pts) Point Value Points EarnedFormatting not followed, many spelling and punctuation mistakes 0
Formatting not followed, but only some spelling and punctuation mistakes 2
Formatting followed, but many spelling and punctuation mistakes 4-6
Formatting followed, and very little editing to be done 8Formatting followed, no editing to be done 12
ScoreFinal Grade (100 pts)
Comments:
19

OHS Science Fair Project 2015
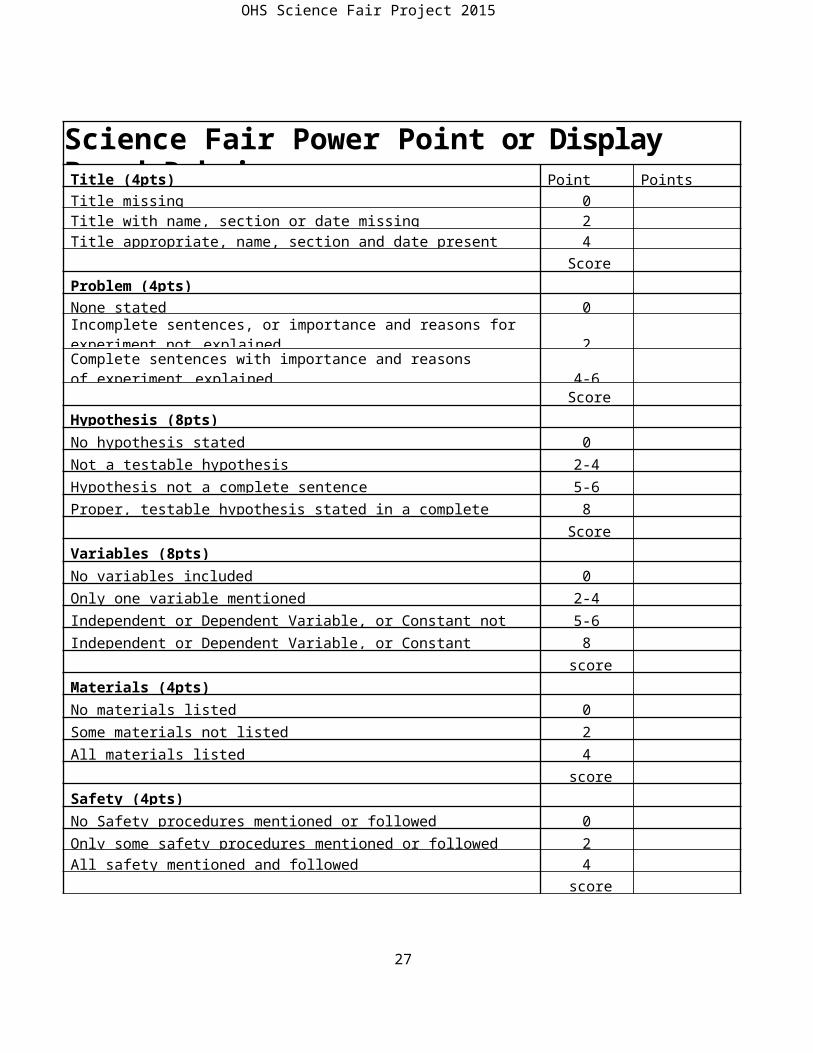
Science Fair Power Point or Display Board RubricTitle (4pts) Point Value Points EarnedTitle missing 0Title with name, section or date missing 2Title appropriate, name, section and date present 4
ScoreProblem (4pts)None stated 0Incomplete sentences, or importance and reasons for experiment not explained 2Complete sentences with importance and reasons of experiment explained 4-6
ScoreHypothesis (8pts)No hypothesis stated 0Not a testable hypothesis 2-4Hypothesis not a complete sentence 5-6Proper, testable hypothesis stated in a complete sentence 8
ScoreVariables (8pts)No variables included 0Only one variable mentioned 2-4Independent or Dependent Variable, or Constant not mentioned 5-6Independent or Dependent Variable, or Constant included 8
scoreMaterials (4pts)No materials listed 0Some materials not listed 2All materials listed 4
scoreSafety (4pts)No Safety procedures mentioned or followed 0Only some safety procedures mentioned or followed 2All safety mentioned and followed 4
score
20

OHS Science Fair Project 2015
Science Fair Power Point or Display Board Rubric Procedures (8pts) Point Value Points EarnedProcedures not included 0Some Procedures left out 4All Procedures included and no proper pronouns are used 8
ScoreData Tables (8pts)No data tables included 0Some data included or information not presented in a table 4-6All data presented in a proper table 8
ScoreConclusions consistent with the data obtained and with the relevant principles of science or engineering (if not, is there an adequate explanation of the inconsistency) (8pts.)
No correlation with conclusion and data obtained. 0Little correlation with conclusion and data obtained 2Some correlation with conclusion and data obtained 4-6Conclusions consistent with the data obtained and with the relevant principles of science or engineering
8
ScoreBibliography (4pts)Not included 0Proper format not followed 2Format followed and all sources included 4
ScoreThoroughness of experimentation or development used to reach objectives; proper recording of data in laboratory notebook (20pts)
No order for experiment 0Some order for experimentation to reach objectives but no lab notebook 5Experimentation was developed to reach objectives with incomplete lab notebook
10-12
Experimentation was developed to reach objectives and proper lab notebook
20
Score
21

OHS Science Fair Project 2015
Science Fair Power Point or Display Board RubricKnowledge and understanding by student of the scientific or engineering principles relevant to the project (10pts.)
Point Value Points Earned
Student has no understanding of the scientific principles relevant to project
0
Student has little understanding of the scientific principles relevant to project
2
Student has some understanding of the scientific principles relevant to project
4-6
Student clearly understands the scientific principles relevant to project 10
ScorePROJECT DESIGNCreativity and originality (10pts.)
No effort shown toward project 0Only shows some effort toward project 2Project shows effort by student 4-6The design of the project shows student to have gone beyond requirements.
10
ScoreFinal Grade (100 pts)
Comments:
22

OHS Science Fair Project 2015
Science Fair Topic FormA good science fair project topic has a problem that can be answered only by experimenting. If a topic is too broad or general, too many factors (variables) might exist that cannot be controlled. If that is the case, you will find it difficult to produce reliable results.Pick 3 topics that interest you. You will be spending quite a bit of time planning and completing your science fair project so choose your topics with care. You will pick one topic from your list to use for your science fair project. Research your topic and record your findings. If you cannot find much information on your topic, you should probably find a new topic.
Topic 1 -- The testable and engaging question I will be investigating is:
My research about this topic:
Can you find 3 good sources for this topic (with a least one being a book)?
23

OHS Science Fair Project 2015
Topic 2 -- The testable and engaging question I will be investigating is:
My research about this topic:
24
OHS Science Fair Project 2015
Can you find 3 good sources for this topic (with a least one being a book)?
Topic 3 -- The testable and engaging question I will be investigating is:
My research about this topic:
Can you find 3 good sources for this topic (with a least one being a book)?
25

OHS Science Fair Project 2015
Experimental Design and Approval Sheet
Project Title:
Student Name: Date:
1. Identify a testable question:
Problem:
2. Research the topic:
What have people learned about ?
Compose 1-2 pages Background research stating what others have found and how this might lead to your hypothesis. (Add paper on the back of this page if extra space is needed as you do your research.)
My sources:
26

OHS Science Fair Project 2015
27

OHS Science Fair Project 2015
Experimental Design and Approval Sheet
3. Write a hypothesis:What I will do: (If…)
What I think will happen: (then…)
4. Design a Procedure:What I will change (independent variable):
What I will keep the same (controlled variables):
What I will measure (dependent variable(s) :
Steps in my procedure:
28

OHS Science Fair Project 2015
Experimental Design and Approval Sheet
Materials:
5. Validation:
□ My project is safe
□ I can get the materials
□ I have enough time to build, test, and report the project
□ My project will not harm organisms
□ My project will not harm or bother other people
How will you know if the change you made had an effect?(What data will you collect and what will you look for?)
29
OHS Science Fair Project 2015
Final Approval to Begin Project:
Project Approved: (Student Signature) (Date)
Project Approved: (Parent Signature) (Date)
Notes from teacher(s):
30
Assignment Student’s Initials
Science Teacher
Points Rcvd
Parent’s Initials
Receive HandbookMonday Oct. 19
Topic FormPoints Possible: 50ptsDeadline: Tuesday Oct. 27Returned: Friday Oct. 30
Experimental Design & Approval SheetPoints Possible: 100ptsDeadline: Tues Nov. 3Returned: Friday Nov. 6
AbstractPoints Possible: 50ptsDeadline: Tuesday Nov. 10
Research Paper/Lab ReportPoints Possible: 100ptsDeadline: Friday Nov. 13
Display Board or Power Point FilePoints Possible: 100ptsDeadline: Tuesday Nov. 17

OHS Science Fair Project 2015
With each deadline, bonus points are possible. After points received has been recorded, if you present your handbook with your parent’s initials for points received, 10 bonus points will be added to the following assignment.
Student Name: __________________________________________________
2 of 2 Parent Signature: ______________________________________________ (worth 25 bonus points)
31