student performance analytics for blended moocs on iitbombayx · student performance analytics for...
TRANSCRIPT
Student Performance Analytics for Blended MOOCs onIITBombayX
Rahul Dev Parashar
Guided by: Prof. Deepak B Phatak
Indian Institute of Technology, Bombay
June 23, 2016
Rahul Dev Parashar (IIT Bombay) MTP Final Presentation June 23, 2016 1 / 66

Overview
1 IntroductionPedagogical DriftMotivation & Problem Statement
2 IITBombayX SystemVarious ComponentsEvent Tracking Logs
3 System DesignVarious Data ModulesSystem ArchitectureData Cleaning / Loading
4 Analytics ModelEvent Specific AnalyticsStudent TimelineTin Can API - Statements and Recipes
5 Observations6 Future Work
Rahul Dev Parashar (IIT Bombay) MTP Final Presentation June 23, 2016 2 / 66

Introduction
Introduction
Rahul Dev Parashar (IIT Bombay) MTP Final Presentation June 23, 2016 3 / 66
Introduction Pedagogical Drift
Pedagogical Drift
Various methodologies
Traditional learning
MOOCs (Massive Open Online Courses)
Blended MOOCs
Rahul Dev Parashar (IIT Bombay) MTP Final Presentation June 23, 2016 4 / 66

Introduction Pedagogical Drift
Pedagogical Drift
Various methodologies
Traditional learning
MOOCs (Massive Open Online Courses)
Blended MOOCs
Rahul Dev Parashar (IIT Bombay) MTP Final Presentation June 23, 2016 4 / 66

Introduction Pedagogical Drift
Pedagogical Drift
Various methodologies
Traditional learning
MOOCs (Massive Open Online Courses)
Blended MOOCs
Rahul Dev Parashar (IIT Bombay) MTP Final Presentation June 23, 2016 4 / 66

Introduction Pedagogical Drift
Traditional Learning
Advantages
Learning through interaction with other students
Teachers can motivate students. Human touch is there betweenstudent and instructor.
Disadvantages
Difficult to handle large class size
Learning habit of students can be different
Learning may be hindered by the ability of teacher to teach thesubject
Rahul Dev Parashar (IIT Bombay) MTP Final Presentation June 23, 2016 5 / 66
Introduction Pedagogical Drift
MOOCs
Flexibility to view content anytime, anywhere
Short-videos, quizzes, assignments, etc.
On-line forum for peer assessment and discussion
Quizzes can be taken on-line and checked by system.(Not descriptivetype)
Advantages
Can be delivered to millions of students via web
A lone professor can support a large class with the help of few TAs
Disadvantages
Lack of active feedback for assessments.
Learning habit of students can be different[1]. Personalized tutoringsystems needed.
Rahul Dev Parashar (IIT Bombay) MTP Final Presentation June 23, 2016 6 / 66

Introduction Pedagogical Drift
Blended MOOCs
Blend of traditional learning and MOOCs
Advantages
Includes most of the advantages of traditional learning and MOOCs
Disadvantages
Not much data is collected from classroom learning in blended modelfor analytics
Blended MOOCs through IITBombayX
IIT Bombay has started providing courses in blended model throughIITBombayX[2]
Various institutes in India are partnering with IIT Bombay to improvelearning of students
Course content may differ in classroom and online learning
Rahul Dev Parashar (IIT Bombay) MTP Final Presentation June 23, 2016 7 / 66

Introduction Challenges in blended learning
Challenges in blended learning
Consolidating marks for local and on-line assessment
Mr. Rajeev Gautam (M.Tech student) has built system for this
Providing performance analytics of students
Teachers from participating institutes should get performancesummary of their students
Comparison of students performance (in class and online)
Rahul Dev Parashar (IIT Bombay) MTP Final Presentation June 23, 2016 8 / 66

Introduction Challenges in blended learning
Questions to be asked
Kind of questions that we need to ask:
How many students are solving questions before going through studymaterial?
What are grades of students for a particular class in comparison withother students?
Is there any relation between performance on MOOC and classroomlearning?
Any other feedback that might help for better learning?
Rahul Dev Parashar (IIT Bombay) MTP Final Presentation June 23, 2016 9 / 66

Introduction Motivation
Motivation
Teachers want to learn more about the performance of their studentsin MOOCs. This will bridge the gap between students and instructor.
As students are learning the same course on-line. Instructors wouldlike to see the reports for that.
Students need active feedback for self-regulated learning.
Long term goal is to provide intelligent tutoring systems.
Rahul Dev Parashar (IIT Bombay) MTP Final Presentation June 23, 2016 10 / 66

Introduction Problem Statement
Problem Statement
This project proposes to understand design and implementation of asystem which permits performance analytics of students in MOOCs &Blended MOOCs.
Tasks to be completed:
Clean, transform and load data from various data modules.
Understand and analyze events present in tracking logs and how tomake use of that data.
Create timeline for students to learn their learning behavior. (Thisdata can be used to provide self-regulated learning for students.– Notcompleted)
View the event log analytics to compare learning habits of students.
Rahul Dev Parashar (IIT Bombay) MTP Final Presentation June 23, 2016 11 / 66

IITBombayX System
IITBombayX System
Rahul Dev Parashar (IIT Bombay) MTP Final Presentation June 23, 2016 12 / 66

IITBombayX System
IITBombayX System
Open edX is a web-based platform for creating, delivering, andanalyzing online courses
IITBombayX uses architecture of open edX to provide MOOC facility
Blended model is integrated with open edX by providing separateauthentication mechanism
Rahul Dev Parashar (IIT Bombay) MTP Final Presentation June 23, 2016 13 / 66

IITBombayX System Various Components
Various Components
CMS (Content management system): This component allows forthe authoring of tools. A Django application uses MongoDB(NoSQL)for content management.
LMS (Learning Management System): The part of OpenEdX thatstudents interact with. It displays content, runs quizzes andinteractive applications. Its subcomponents are Wiki, DiscussionForum, etc.
Open edX Insights and Analytics: Insights is a developmentversion of a Python, Mongo, and Django framework for creatingsimple, pluggable analytics based on streaming events. This does notinclude the analysis of every event from logs.
Authentication for blended model: Separate component is used foridentifying students from various institutions.
Rahul Dev Parashar (IIT Bombay) MTP Final Presentation June 23, 2016 14 / 66
IITBombayX System Course Dashboard
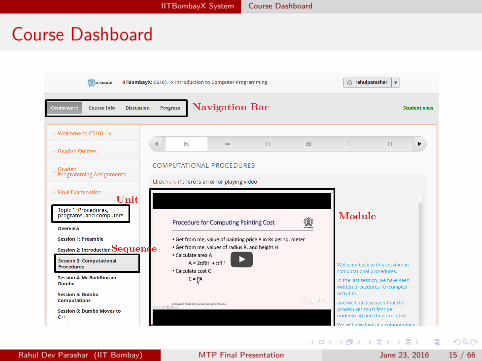
Course Dashboard
Rahul Dev Parashar (IIT Bombay) MTP Final Presentation June 23, 2016 15 / 66
IITBombayX System Course Dashboard
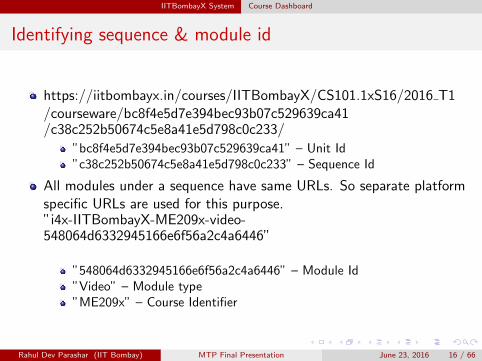
Identifying sequence & module id
https://iitbombayx.in/courses/IITBombayX/CS101.1xS16/2016 T1/courseware/bc8f4e5d7e394bec93b07c529639ca41/c38c252b50674c5e8a41e5d798c0c233/
”bc8f4e5d7e394bec93b07c529639ca41” – Unit Id”c38c252b50674c5e8a41e5d798c0c233” – Sequence Id
All modules under a sequence have same URLs. So separate platformspecific URLs are used for this purpose.”i4x-IITBombayX-ME209x-video-548064d6332945166e6f56a2c4a6446”
”548064d6332945166e6f56a2c4a6446” – Module Id”Video” – Module type”ME209x” – Course Identifier
Rahul Dev Parashar (IIT Bombay) MTP Final Presentation June 23, 2016 16 / 66

IITBombayX System Course Dashboard
Event Tracking Logs
Every interaction with system is stored as JSON object
Logs can be classified based on event type
These logs are semi structured and very large in size
Rahul Dev Parashar (IIT Bombay) MTP Final Presentation June 23, 2016 17 / 66

IITBombayX System Course Dashboard
Event Types
Enrollment Event
Navigational Events
Video Interaction Events
Textbook Interaction Events
Problem Interaction Events
Discussion Forum Events
Rahul Dev Parashar (IIT Bombay) MTP Final Presentation June 23, 2016 18 / 66

IITBombayX System Course Dashboard
Sample log record for video interaction event
Example log for seek video event
Rahul Dev Parashar (IIT Bombay) MTP Final Presentation June 23, 2016 19 / 66

IITBombayX System Course Dashboard
Fields in seek video event log
Common FieldsContext: contains course id, organization id, path, user id, etc.Event Source: browser or mobile devicePage: URL of the page, the user was visiting when the event wasemittedTime: UTC time at which the event was emittedEvent TypeUser Name, etc.
Event Specific FieldsCommon fields to video events: Video id, event type, etc.Fields specific to seek video event: old time, new time
Rahul Dev Parashar (IIT Bombay) MTP Final Presentation June 23, 2016 20 / 66

IITBombayX System Course Dashboard
Video Interaction Events
load video: When the video is fully rendered and ready to play
play video: When play button is clicked by user
seek video: When user chooses to click on different time frame
pause video: When pause button is clicked by user
stop video: When the video player reaches the end of the video fileand play automatically stops
speed change video: When a user selects a different playing speedfor the video
show transcript: When a user toggles show transcript to display thevideo transcript
hide transcript: When a user toggles hide transcript to hide thevideo transcript
Rahul Dev Parashar (IIT Bombay) MTP Final Presentation June 23, 2016 21 / 66

IITBombayX System Course Dashboard
Problem Interaction Events
problem check: When a problem is successfully checked(Fields: answers, attempts, grade, max grade, problem id, success)
problem graded: Each time a user selects ”Check” for a problemand it is graded successfully (emitted by server)(Fields: answers, problem text, choices)The array includes each problem in a problem component that hasmultiple problems.
show answer: Generated when the answer to a problem is shown.Followed by problem show event when user clicks on ”Show Answer”button. (Fields: problem id, value checked by the user)The array includes each problem in a problem component that hasmultiple problems.
Rahul Dev Parashar (IIT Bombay) MTP Final Presentation June 23, 2016 22 / 66

IITBombayX System Course Dashboard
Discussion Forum Events
Events: comment created, response created, response voted,forum searched, thread created, thread voted
Rahul Dev Parashar (IIT Bombay) MTP Final Presentation June 23, 2016 23 / 66
IITBombayX System Course Dashboard
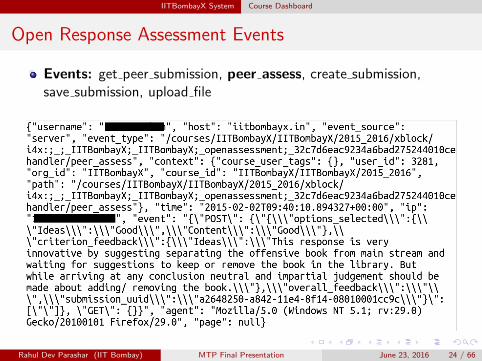
Open Response Assessment Events
Events: get peer submission, peer assess, create submission,save submission, upload file
Rahul Dev Parashar (IIT Bombay) MTP Final Presentation June 23, 2016 24 / 66

System Design
System Design
Rahul Dev Parashar (IIT Bombay) MTP Final Presentation June 23, 2016 25 / 66
System Design Various Data Modules
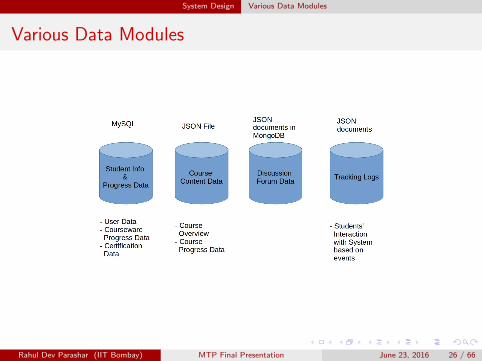
Various Data Modules
Rahul Dev Parashar (IIT Bombay) MTP Final Presentation June 23, 2016 26 / 66

System Design Various Data Modules
Important points
Use of available data to analyze performance of students
Tracking log data is unstructured
Static data should also be loaded for data analytics purpose
Open EdX Insights preprocesses and cleans the tracking log data, butdo not capture all fields
To get complete information, pre-process the tracking logs for eachevent type
Rahul Dev Parashar (IIT Bombay) MTP Final Presentation June 23, 2016 27 / 66

System Design System Architecture
System Architecture
Rahul Dev Parashar (IIT Bombay) MTP Final Presentation June 23, 2016 28 / 66

System Design Data Cleaning
Data Cleaning
Java code has been written for log processing
Logs are read based on event type they are generated from
Depending on event type, fields are extracted and stored
Each event is also given a unique id for identification
Rahul Dev Parashar (IIT Bombay) MTP Final Presentation June 23, 2016 29 / 66

System Design Data Cleaning
Objects and Event Tables
Each event has it’s associated Java object
Hive tables are used for storing data from these objects
Objects/Tables
EventCourseInteract, EventEnrollment, EventForumInteract, UserSession,EventProbInteract, EventVideoInteract, StudentCourseGrade, etc.
Rahul Dev Parashar (IIT Bombay) MTP Final Presentation June 23, 2016 30 / 66

System Design Data Cleaning
Data Loading
Data is loaded in Hive tables from Java objects for event logs
Along with this, data is also loaded from other data modules usingSqoop(SQL->Hadoop->Hive)
Both Single Node Cluster setup and Multi Node Cluster Setup(1Master and 3 Slaves) have been used for experimentation
Rahul Dev Parashar (IIT Bombay) MTP Final Presentation June 23, 2016 31 / 66
System Design Data Analytics
Data Analytics
Data generated from logs are moved to Hive schema.
Basic analysis like active users, watched videos and others can bedirectly achieved in real-time(HDFS can easily scale for our data size)
Using this we created timeline of students. This can then be used foridentifying learning style of a student.[5]
Open edX Insights, with the addition of events which were notconsidered, can be used for MOOC’s analysis. To use this for ablended model, we need to wrap results using authenticationmechanism provided for blended model.
Rahul Dev Parashar (IIT Bombay) MTP Final Presentation June 23, 2016 32 / 66

System Design Data Analytics
Typical Analytic Report
Weekly student engagement chart displays the number of students whoengaged in different activities over time in some particular course.
Source: Open edX Insights[7]
Rahul Dev Parashar (IIT Bombay) MTP Final Presentation June 23, 2016 33 / 66
Analytics Model
Analytics Model
Rahul Dev Parashar (IIT Bombay) MTP Final Presentation June 23, 2016 34 / 66

Analytics Model Event Specific Analytics
Event Specific Analytics
Video Interaction Events
load video: Time when the video was loaded is captured
play video: ”CurrentTime” when video played is captured
pause video: ”CurrentTime” when video paused is captured
seek video: ”old time” and ”new time” are captured to show seekduration
Problem Interaction Events
problem check: Choice selected, Correctness of answer, Problem idare captured
problem graded: More detailed information about available choicesare collected
Rahul Dev Parashar (IIT Bombay) MTP Final Presentation June 23, 2016 35 / 66

Analytics Model Event Specific Analytics
Number of distinct users week wise for courses
Rahul Dev Parashar (IIT Bombay) MTP Final Presentation June 23, 2016 36 / 66

Analytics Model Event Specific Analytics
Some Observations
Sudden changes(ascent, plunge) can explain activities of users in thecourse. (Students are more active when quiz is published for someweek.)
Users activities can show which part of the course was not interesting,after which most users interest decreased. (Can be used to improvecourse completion rate.)
Rahul Dev Parashar (IIT Bombay) MTP Final Presentation June 23, 2016 37 / 66
Analytics Model Event Specific Analytics
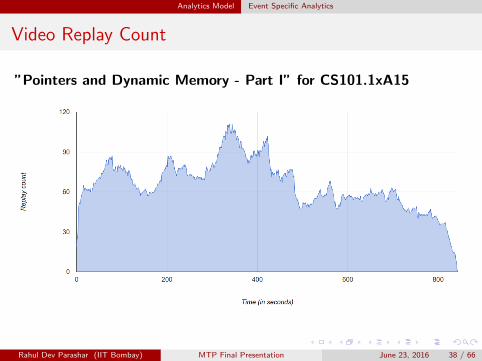
Video Replay Count
”Pointers and Dynamic Memory - Part I” for CS101.1xA15
Rahul Dev Parashar (IIT Bombay) MTP Final Presentation June 23, 2016 38 / 66

Analytics Model Event Specific Analytics
Some Observations
Which part of the video was replayed most by users
It can also be done for 5 sec. duration blocks, etc.
It can give idea about which part of the video is difficult tounderstand and can be simplified by instructor
Rahul Dev Parashar (IIT Bombay) MTP Final Presentation June 23, 2016 39 / 66

Analytics Model Event Specific Analytics
Video Watched In Fast Speed(For CS101.1xA15)
Rahul Dev Parashar (IIT Bombay) MTP Final Presentation June 23, 2016 40 / 66

Analytics Model Event Specific Analytics
Video Watched In Slow Speed(For CS101.1xA15)
Rahul Dev Parashar (IIT Bombay) MTP Final Presentation June 23, 2016 41 / 66

Analytics Model Event Specific Analytics
Video Watched More Than Once By Same User(ForCS101.1xA15)
Rahul Dev Parashar (IIT Bombay) MTP Final Presentation June 23, 2016 42 / 66

Analytics Model Student Timeline
Student Timeline
Rahul Dev Parashar (IIT Bombay) MTP Final Presentation June 23, 2016 43 / 66

Analytics Model Student Timeline
Student Timeline
Timeline of a student shows in which order they interact with acourse and what is their learning style.
It can be used in intelligent tutoring systems and self-regulatedlearning.
How much time they are spending on course, time spent on eachmodule or quiz, etc. can be found easily.
One event type can be related to others. Like, for a questionanswered wrong we can see that if video associated with thatquestion was watched or not and can give appropriate suggestions.
Rahul Dev Parashar (IIT Bombay) MTP Final Presentation June 23, 2016 44 / 66
Analytics Model Further Data Cleaning
Further Data Cleaning
At the time of data loading, all available data was stored in tables. Someof which is not required in data analytics. Some such fields are removed.
Load video event doesn’t give much required information. It can beobtained from play video event.
When a student plays a video, the system automatically generatesplay video event every 2 minutes.
Information present in problem check event can be found inproblem graded event with additional information.
Rahul Dev Parashar (IIT Bombay) MTP Final Presentation June 23, 2016 45 / 66

Analytics Model Further Data Cleaning
Further Data Cleaning
Duplicate system generated play video event log records
Rahul Dev Parashar (IIT Bombay) MTP Final Presentation June 23, 2016 46 / 66

Analytics Model Timeline Example
Timeline Example
Rahul Dev Parashar (IIT Bombay) MTP Final Presentation June 23, 2016 47 / 66
Analytics Model Timeline Example
Use of Timeline
Kind of suggestions we can give using timeline are:
If the video is not watched for some topic and for which student hasgiven an incorrect answer, suggestion can be given to watch the video.
In a quiz, time spent on each question separately can be shown. Also,if a student has spent too much time on an incorrectly answeredquestion, then suggestions can be given.
Outliers
We can find the best way to learn through MOOC. Find a pattern whichgave best results for students.
Outlier students can be found and suggestions can be given to correct theirlearning style.
Rahul Dev Parashar (IIT Bombay) MTP Final Presentation June 23, 2016 48 / 66

Analytics Model Tin Can API - Statements and Recipes
Tin Can API - Statements and Recipes
Rahul Dev Parashar (IIT Bombay) MTP Final Presentation June 23, 2016 49 / 66
Analytics Model Tin Can API - Statements and Recipes
Introduction
Provides common standards for data representation
Statement
Way of expressing information in standard format.
Properties such as actor, verbs, objects, etc. are used to showinformation
Recipes
A recipe is a standard way of expressing a particular type ofexperience.
Prevents the use of different words saying the same thing.
Examples of experience: Watched, Attempted, Passed, Failed, etc.
Rahul Dev Parashar (IIT Bombay) MTP Final Presentation June 23, 2016 50 / 66

Analytics Model Tin Can API - Statements and Recipes
Activities and Verbs
Acivities
Assessment, Attempt, Course, Interaction, Lession, Module,Objective, Performance, Profile, Question, File, etc.
Verbs
Abandoned, Answered, Asked, Attempted, Attended, Completed,Exited, Passed, Experienced, Failed, Interacted, Logged-in,Logged-out, Mastered Commented, Progressed, Registered,Responded, Resumed, Terminated, etc.
Rahul Dev Parashar (IIT Bombay) MTP Final Presentation June 23, 2016 51 / 66

Analytics Model Uses
Uses
Not all the information in event logs is properly structured. Tin Canstandards can be used in event logs for information representation.
Rahul Dev Parashar (IIT Bombay) MTP Final Presentation June 23, 2016 52 / 66

Analytics Model Uses
Uses
We can also show user timeline in plain English using verbs, statementfields (objects, agent, etc.).
Video ”Structures and unions” from Chapter-2 of course’CS101.1xA15’ is watched by user ”XYZ”.
Problem ”question 5” from quiz-1 of course ’CS101.1xA15’ isattempted correctly by user ”XYZ”.
Video ”Arrays” from Chapter-1 of course ’CS101.1xA15’ is seekedfrom ”107.53” sec. to ”198.234” sec. by user ”XYZ”.
Rahul Dev Parashar (IIT Bombay) MTP Final Presentation June 23, 2016 53 / 66

Observations
Observations
Rahul Dev Parashar (IIT Bombay) MTP Final Presentation June 23, 2016 54 / 66

Observations
Summary of processed logs
Around 35 million IITBombayX tracking log records were processed.
There were JSON objects which were not in proper format arerecorded.
There were some events which are not documented in Open EdXdocumentation.
Rahul Dev Parashar (IIT Bombay) MTP Final Presentation June 23, 2016 55 / 66

Observations Invalidated JSON records
Invalidated JSON records
Some log records are not properly structured
Unable to parse these objects and get required data
Issue with code from where these logs are generated
Some events are triggered by system. For these events field data is inhtml format.
Rahul Dev Parashar (IIT Bombay) MTP Final Presentation June 23, 2016 56 / 66

Observations Invalidated JSON records
Sample Invalidated JSON record
Rahul Dev Parashar (IIT Bombay) MTP Final Presentation June 23, 2016 57 / 66

Observations Invalidated JSON records
System Generated Events - Data in HTML Format
Rahul Dev Parashar (IIT Bombay) MTP Final Presentation June 23, 2016 58 / 66

Observations Unclassified events/fields
Unclassified events/fields
We found some records in which, their event/fields are not in Open EdXdocumentation.(Either there is an issue in Open edX code or it wasmodified for IITBombayX.)For the purpose of understanding and storing these in tables, these areclassified in existing events based on their nature.
Navigational: goto position, dashboard, jsi18n, i18n.js,jump to discussion, progress, view courses, logout, how it works,calculate, jump to vertical, etc.
Video interaction events: save user state, transcript translation,transcript download, /transcript/translation, /transcript/download,etc.
Discussion forum events: users, reply, upvote, flagAbuse, follow,unfollow, upload, etc.
Rahul Dev Parashar (IIT Bombay) MTP Final Presentation June 23, 2016 59 / 66

Observations Unclassified events/fields
Reporting issues
It is proposed to examine these issues in the context of the new Dogwoodrelease of Open edX. Some of the points may have been alreadyaddressed. Points which are found to be relevant will be addressed andcommunicated to Open edX.
Rahul Dev Parashar (IIT Bombay) MTP Final Presentation June 23, 2016 60 / 66

Future Work
Future Work
Rahul Dev Parashar (IIT Bombay) MTP Final Presentation June 23, 2016 61 / 66

Future Work
Future Work
The data generated can be used to create various data models and to dofurther analytics. Some possible applications are proposed.
Rahul Dev Parashar (IIT Bombay) MTP Final Presentation June 23, 2016 62 / 66

Future Work
Future Work
APIs for Customizable Timeline
Models For Clustering And Classifying students
Intelligent Tutoring System
Analytics For Blended Model
Hadoop User Experience(Hue)
Rahul Dev Parashar (IIT Bombay) MTP Final Presentation June 23, 2016 63 / 66

Thank You...
Rahul Dev Parashar (IIT Bombay) MTP Final Presentation June 23, 2016 64 / 66

References
Thanasis Daradoumis, and Roxana Bassi, and Fatos Xhafa, and Santi Caballe(2013)
A review on massive e-learning (MOOC) design, delivery, and assessment
P2P, Parallel, Grid, Cloud and Internet Computing (3PGCIC), 2013 EighthInternational Conference on 208 – 213
Deepak B Phatak (2015)
Adopting MOOCs for quality engineering education in India
Proceedings of the International Conference on Transformations in EngineeringEducation 208 – 213
Open edX Architecture
https://open.edx.org/contributing-to-edx/architecture
Retrieved on 2015-10-11
Events in the Tracking Logs
http://edx.readthedocs.org/projects/devdata/en/latest/internal data formats/tracking logs.html
Retrieved on 2015-10-11
Rahul Dev Parashar (IIT Bombay) MTP Final Presentation June 23, 2016 65 / 66

References
Cristobal Romero, and Sebastian Ventura (2007)
Educational data mining: A survey from 1995 to 2005
Expert systems with applications 33(1), 135 – 146.
Using edX Insights
http://edx-insights.readthedocs.org/en/latest/index.html
Retrieved on 2015-10-11
Sample image for data analytics report
https://open.edx.org/sites/default/files/wysiwyg/Engagement Chart.png
Retrieved on 2015-10-11
Edx Analytics Dashboard
https://github.com/edx/edx-analytics-dashboard
Retrieved on 2015-10-11
Rahul Dev Parashar (IIT Bombay) MTP Final Presentation June 23, 2016 66 / 66