student reports of bullying and cyber-bullying: results ... · student reports of bullying and...
TRANSCRIPT
Student Reports of Bullying and
Cyber-Bullying: Results From the 2011 School Crime Supplement to the National
Crime Victimization Survey This document reports data from the 2011 School Crime Supplement (SCS) of the National Crime Victimization Survey (NCVS).1 The Web Tables show the extent to which students with different personal characteristics report bullying and cyber-bullying. Estimates include responses by student characteristics: student sex, race/ethnicity, grade, and household income. The U.S. Census Bureau (Census) appended additional data from the 2009–10 Common Core of Data (CCD) and the 2009–10 Private School Universe Survey (PSS) to generate tables showing the extent to which bullying and cyber-bullying are reported by students in schools with different characteristics.2 School characteristics examined are region; sector (public or private); locale; level; enrollment size; student-to-full-time-equivalent (FTE) teacher ratio; percentage of combined American Indian/Alaska Native, Asian/ Native Hawaiian/Other Pacific Islander, Black/African American, Hispanic/Latino, and students of two or more races; and
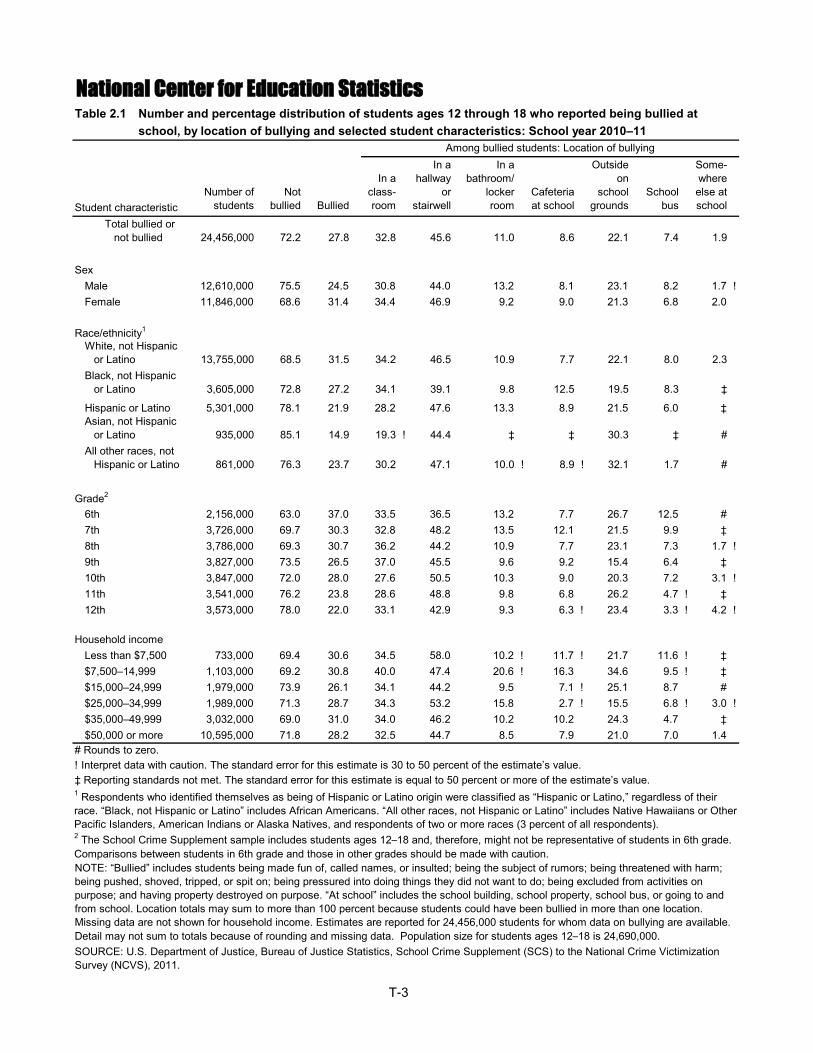
percentage of students eligible for free or reduced-priced lunch. The SCS data tables show the relationship between bullying and cyber-bullying victimization and other crime-related variables, such as reported presence of gangs, guns, drugs, and alcohol at school; selected school security measures; student criminal victimization; and personal fear, avoidance behaviors, fighting, and weapon carrying at school. The tables appear in four sections. Section 1 is an overview table, showing the number and percentage of students ages 12 through 18 who reported being bullied at school and cyber-bullied anywhere, by type of bullying or cyber-bullying (table 1.1). Section 2 displays estimates for where in school bullying occurred, the percentage distribution of the frequency, and the type of bullying reported by students ages 12
These Web Tables were prepared for the National Center for Education Statistics under Contract No. ED-IES-12D-0010/0004 with Synergy Enterprises, Incorporated (SEI). Mathematica Policy Research is a subcontractor to SEI on this project. Mention of trade names, commercial products, or organizations does not imply endorsement by the U.S. Government. These Web Tables were prepared by Deborah Lessne and Sayali Harmalkar of SEI.
2
through 18, by selected student and school characteristics (tables 2.1–2.6). Section 3 provides estimates for the percentage distribution of the frequency and the type of cyber-bullying reported by students ages 12 through 18, by selected student and school characteristics (tables 3.1–3.4). Section 4 displays the percentages of students bullied at school or cyber-bullied anywhere by student reports of unfavorable school conditions; selected school security measures; criminal victimization at school; and personal fear, avoidance behaviors, fighting, and weapon carrying at school (tables 4.1–4.4).
Data The estimates presented in the tables originate from the 2011 SCS to the NCVS. The SCS collects information about student and school characteristics related to criminal victimization on a national level. The SCS was conducted in 1989, 1995, and biennially since 1999. Census selects households for the NCVS using a stratified, multistage cluster sampling design. Within the sample, all persons in the household ages 12 and older participate in the NCVS every 6 months (for a total of seven interviews over a 3-year period) to determine the extent of their victimization during the 6 months preceding the interview. The SCS is administered to all eligible NCVS respondents ages 12 through 18 within NCVS households between January and June of the year of data collection. In 2011, approximately 79,800 households participated in the NCVS sample, and those NCVS households included 10,341 members
between the ages of 12 and 18. To be eligible for the SCS, these 12- to 18-year-olds must complete the NCVS and meet certain criteria specified in a set of SCS screening questions. These criteria require students to be currently enrolled in a primary or secondary education program leading to a high school diploma or enrolled sometime during the school year of the interview; not enrolled in fifth grade or under3; and not exclusively homeschooled during the school year.4 To be included in the analysis for this report, students had to be enrolled in grades 6 through 12, and could not have received any part of their education through homeschooling during the school year. In 2011, a total of 6,547 NCVS respondents were screened for the 2011 SCS, 5,857 met the criteria for completing the survey, and 5,739 met the additional criteria for inclusion in this report. Details about specific variables used to define the report criteria appear in the glossary. Among newly sampled households, the NCVS/SCS interview is administered face-to-face using computer-assisted personal interviewing (CAPI). Interviews with recurring households are administered by telephone using CAPI. The survey data file used to produce the SCS estimates, as well as the SCS questionnaire, are available for download through the Student Surveys link at the NCES Crime and Safety Surveys portal, located at http://nces.ed.gov/programs/crime. The final data file is available in multiple software formats and contains variables collected in the SCS and cleared for release. Additionally, selected variables that were collected in the NCVS Basic Screen Questionnaire (NCVS-1) and NCVS Crime
3
Incident Report (NCVS-2) are appended to the SCS data file. The statistical programs used to calculate the population estimates, percentages, and standard errors for these Web Tables are SAS 9.3 and SAS-Callable SUDAAN Release 11.0. The model applied in the calculation of standard errors was the Taylor series method with replacement and clustering (NEST variables PSEUDOSTRATUM and SEUCODE). The statistical program used by Census for the tables, which include school characteristics, is SAS 9.2; since SAS does not handle extremely small sample sizes when computing standard errors, Census collapsed strata in SAS where necessary for standard error calculations. The model applied was the Taylor series method with replacement using the cluster (variable SEUCODE) and strata options (using a custom variable derived from PSEUDOSTRATUM).
Response rates Because the SCS interview is conducted with students after their households had responded to the NCVS, the unit completion rate for the SCS reflects both the household interview completion rate (90.7 percent) and the student interview completion rate (63.3 percent). The overall unweighted SCS unit response rate (calculated by multiplying the household completion rate by the student completion rate) was 57.4 percent. Furthermore, as in most surveys, some individuals did not give a response to every item. The mean weighted item response rate in 2011 was 98 percent, with only three survey items having response rates lower than 85 percent: SC086 (77.7 percent), SC115 (83.2 percent), and SC104 (84.9 percent).5
NCES requires that any stage of data collection within a survey that has a base-weighted response rate of less than 85 percent be evaluated for nonresponse bias before the data or any analyses are released. In the 2011 SCS, both unit and item nonresponse bias analyses were performed. The unit nonresponse bias analysis takes into account nonresponses on both the NCVS and the SCS. For the 2011 NCVS interview, Census found evidence of unit nonresponse bias within Hispanic origin and age subgroups. For the SCS interview, most subgroups were found to have nonresponse bias estimates that were less than 0.3 percent. The exception was the age 18 category, which had a nonresponse bias estimate of 1.7 percent. Census reported no evidence of item nonresponse bias on the 2011 SCS.6
Other data sources The characteristics of the schools attended by SCS respondents appear in tables 2.2, 2.4, 2.6, 3.2, and 3.4. In the SCS interview, respondents provided the school name, school location, and other information that was linked to school data in the 2009–10 CCD or 2009–10 PSS. Census captured the school characteristics from those external datasets to produce the estimates. The school information provided by the respondents and the school characteristic variables are not available to the public. Further information about the CCD is available at http://nces.ed.gov/ccd/ and information on the PSS is available at http://nces.ed.gov/surveys/pss/.
Missing data When calculating column totals, readers should note that there are several sources of missing data. Among the 5,739 SCS students included in the analysis, 5,482 (or
4
95.5 percent) were matched to schools on the CCD or PSS files. The remaining 257 students, who represent a total weighted number of 1,098,000, could not be matched to schools and were excluded from the tables showing school characteristics (tables 2.2, 2.4, 2.6, 3.2, and 3.4). Additional sources of missing data should be considered when examining the row variables. Student characteristic data on household income contain some missing values (20 percent), as do school characteristic data on locale; level; enrollment size; student-to-FTE teacher ratio; percentage of combined American Indian/Alaska Native, Asian/Native Hawaiian/Other Pacific Islander, Black/African American, Hispanic/Latino, and two or more races students; and percentage of students eligible for free or reduced-price lunch. For these row variables, Census provided percentages for the additional missing school characteristic variables (ranging from 0.2 to 2.5 percent), which were calculated separately, but are not shown. Furthermore, across all tables, about 50 student records had missing bullying data and about 60 student records had missing cyber-bullying data. These students were excluded from the analysis and represent a total weighted number of 234,000 students with missing bullying data and 279,000 students with missing cyber-bullying data. The total weighted number of students with bullying data is 24,456,000, and the total weighted number of students with cyber-bullying data is 24,411,000. Due to the missing data, table details do not reflect the total weighted student population (24,690,000).
For more information, contact Kathryn A. Chandler Project Officer National Center for Education Statistics 1990 K Street NW Washington, DC 20006-5652 (202) 502-7486 [email protected] ENDNOTES 1 The SCS data are available for download through the Student Surveys link at the National Center for Education Statistics (NCES) Crime and Safety Survey portal, located at http://nces.ed.gov/programs/crime. 2 Estimates for school characteristics, produced by Census, were calculated from data appended to the SCS from the 2009–10 CCD and the 2009–10 PSS and appear only in a data file that is not available for public use, housed at Census. 3 Students in ungraded programs can complete the SCS. 4 Persons who have dropped out of school, have been expelled or suspended from school, or are temporarily absent from school for any other reason, such as illness or vacation, can complete the SCS as long as they have attended school at any time during the school year of the interview. 5 These response variables correspond to the following questions:
• SC086: Question 28b. Have you actually seen another student with a gun at school during this school year?
• SC115: Question 33b. During the last 4 weeks of school, on how many days did you skip at least one class?
• SC104: Question 18b. During this school year, how many times have you been in a physical fight at school?
6 A full copy of the U.S. Census Bureau report Evaluating Nonresponse Bias in the 2011 School Crime Supplement to the National Crime Victimization Survey may be downloaded from http://www.reginfo.gov/public/do/DownloadDocument?documentID=351462&version=0.
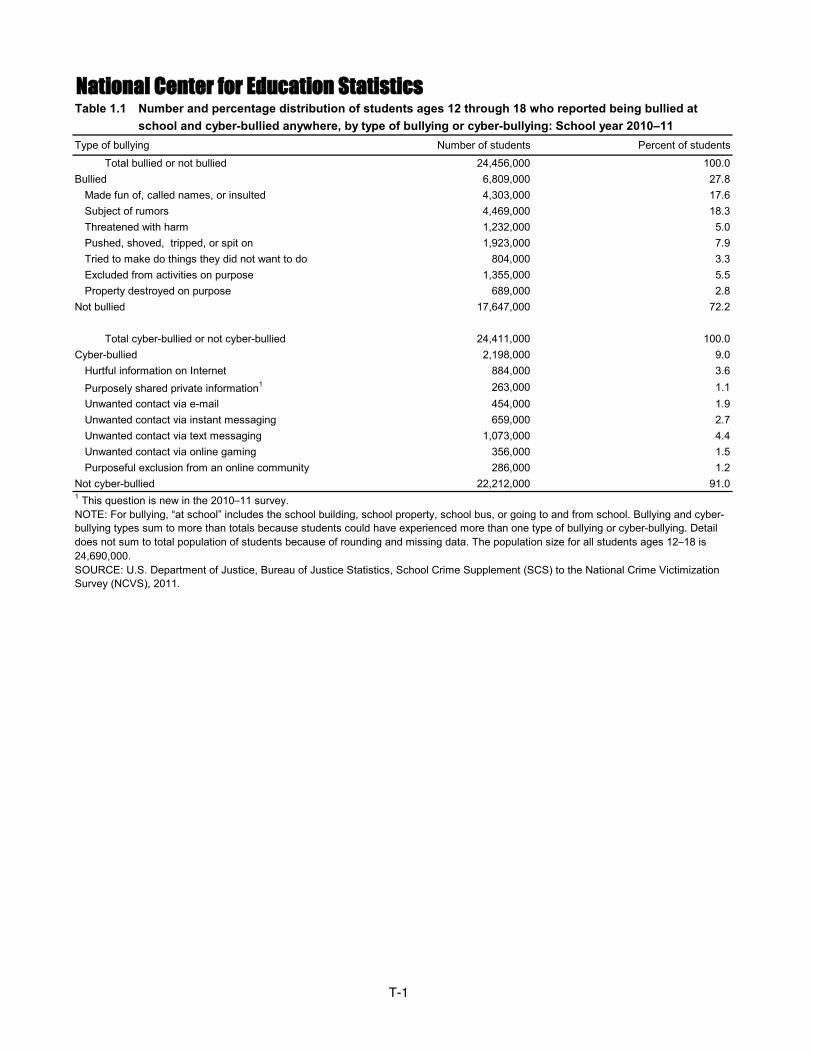
Type of bullying Number of students Percent of students
Total bullied or not bullied 24,456,000 100.0Bullied 6,809,000 27.8
Made fun of, called names, or insulted 4,303,000 17.6Subject of rumors 4,469,000 18.3Threatened with harm 1,232,000 5.0Pushed, shoved, tripped, or spit on 1,923,000 7.9Tried to make do things they did not want to do 804,000 3.3Excluded from activities on purpose 1,355,000 5.5Property destroyed on purpose 689,000 2.8
Not bullied 17,647,000 72.2
Total cyber-bullied or not cyber-bullied 24,411,000 100.0Cyber-bullied 2,198,000 9.0
Hurtful information on Internet 884,000 3.6Purposely shared private information1 263,000 1.1Unwanted contact via e-mail 454,000 1.9Unwanted contact via instant messaging 659,000 2.7Unwanted contact via text messaging 1,073,000 4.4Unwanted contact via online gaming 356,000 1.5Purposeful exclusion from an online community 286,000 1.2
Not cyber-bullied 22,212,000 91.0
National Center for Education StatisticsTable 1.1—Number and percentage distribution of students ages 12 through 18 who reported being bullied at
1 This question is new in the 2010–11 survey.NOTE: For bullying, “at school” includes the school building, school property, school bus, or going to and from school. Bullying and cyber-bullying types sum to more than totals because students could have experienced more than one type of bullying or cyber-bullying. Detail does not sum to total population of students because of rounding and missing data. The population size for all students ages 12–18 is 24,690,000.SOURCE: U.S. Department of Justice, Bureau of Justice Statistics, School Crime Supplement (SCS) to the National Crime Victimization Survey (NCVS), 2011.
Table 1.1—school and cyber-bullied anywhere, by type of bullying or cyber-bullying: School year 2010–11
T-1
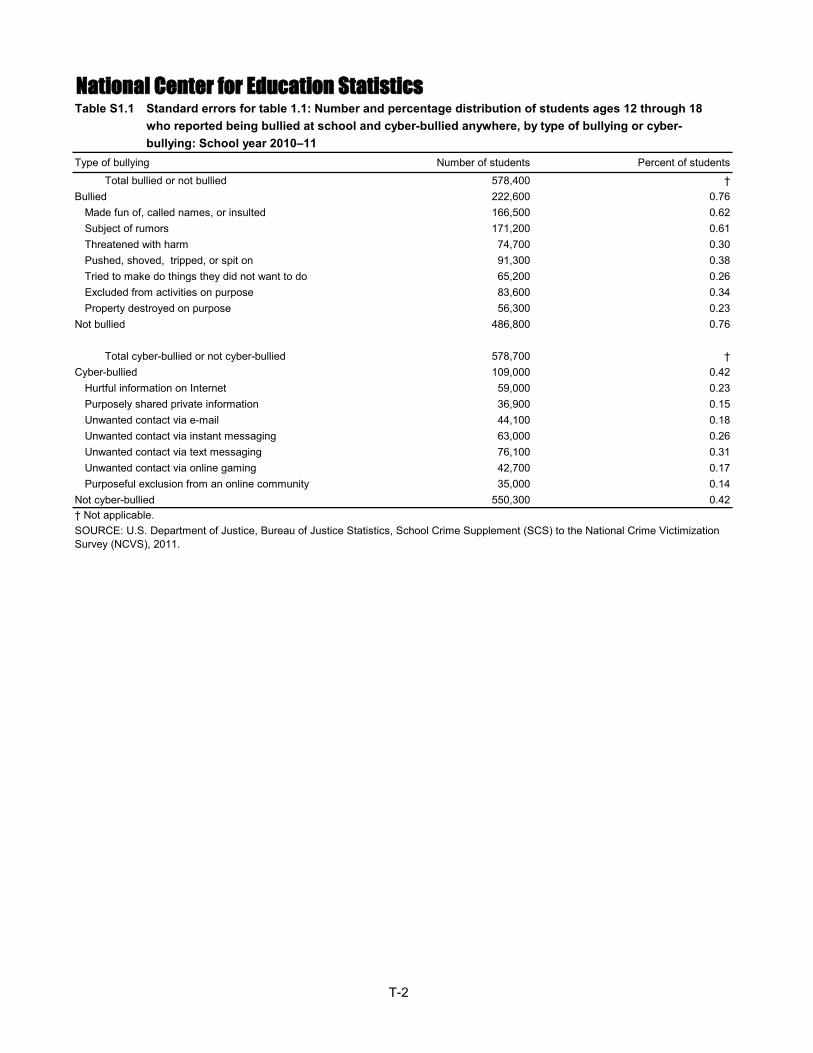
Type of bullying Number of students Percent of students
Total bullied or not bullied 578,400 †Bullied 222,600 0.76
Made fun of, called names, or insulted 166,500 0.62Subject of rumors 171,200 0.61Threatened with harm 74,700 0.30Pushed, shoved, tripped, or spit on 91,300 0.38Tried to make do things they did not want to do 65,200 0.26Excluded from activities on purpose 83,600 0.34Property destroyed on purpose 56,300 0.23
Not bullied 486,800 0.76
Total cyber-bullied or not cyber-bullied 578,700 †Cyber-bullied 109,000 0.42
Hurtful information on Internet 59,000 0.23Purposely shared private information 36,900 0.15Unwanted contact via e-mail 44,100 0.18Unwanted contact via instant messaging 63,000 0.26Unwanted contact via text messaging 76,100 0.31Unwanted contact via online gaming 42,700 0.17Purposeful exclusion from an online community 35,000 0.14
Not cyber-bullied 550,300 0.42
National Center for Education StatisticsTable S1.1—Standard errors for table 1.1: Number and percentage distribution of students ages 12 through 18
† Not applicable.SOURCE: U.S. Department of Justice, Bureau of Justice Statistics, School Crime Supplement (SCS) to the National Crime Victimization Survey (NCVS), 2011.
Table S1.1—who reported being bullied at school and cyber-bullied anywhere, by type of bullying or cyber-Table S1.1—bullying: School year 2010–11
T-2
Student characteristicNumber of
studentsNot
bullied Bullied
In a class-room
In a hallway
or stairwell
In a bathroom/
locker room
Cafeteria at school
Outside on
school grounds
School bus
Some-where else at school
Total bullied or not bullied 24,456,000 72.2 27.8 32.8 45.6 11.0 8.6 22.1 7.4 1.9
SexMale 12,610,000 75.5 24.5 30.8 44.0 13.2 8.1 23.1 8.2 1.7 !Female 11,846,000 68.6 31.4 34.4 46.9 9.2 9.0 21.3 6.8 2.0
Race/ethnicity1
White, not Hispanic or Latino 13,755,000 68.5 31.5 34.2 46.5 10.9 7.7 22.1 8.0 2.3Black, not Hispanic or Latino 3,605,000 72.8 27.2 34.1 39.1 9.8 12.5 19.5 8.3 ‡
Hispanic or Latino 5,301,000 78.1 21.9 28.2 47.6 13.3 8.9 21.5 6.0 ‡Asian, not Hispanic or Latino 935,000 85.1 14.9 19.3 ! 44.4 ‡ ‡ 30.3 ‡ #All other races, not Hispanic or Latino 861,000 76.3 23.7 30.2 47.1 10.0 ! 8.9 ! 32.1 1.7 #
Grade2
6th 2,156,000 63.0 37.0 33.5 36.5 13.2 7.7 26.7 12.5 #7th 3,726,000 69.7 30.3 32.8 48.2 13.5 12.1 21.5 9.9 ‡8th 3,786,000 69.3 30.7 36.2 44.2 10.9 7.7 23.1 7.3 1.7 !9th 3,827,000 73.5 26.5 37.0 45.5 9.6 9.2 15.4 6.4 ‡10th 3,847,000 72.0 28.0 27.6 50.5 10.3 9.0 20.3 7.2 3.1 !11th 3,541,000 76.2 23.8 28.6 48.8 9.8 6.8 26.2 4.7 ! ‡12th 3,573,000 78.0 22.0 33.1 42.9 9.3 6.3 ! 23.4 3.3 ! 4.2 !
Household incomeLess than $7,500 733,000 69.4 30.6 34.5 58.0 10.2 ! 11.7 ! 21.7 11.6 ! ‡$7,500–14,999 1,103,000 69.2 30.8 40.0 47.4 20.6 ! 16.3 34.6 9.5 ! ‡$15,000–24,999 1,979,000 73.9 26.1 34.1 44.2 9.5 7.1 ! 25.1 8.7 #$25,000–34,999 1,989,000 71.3 28.7 34.3 53.2 15.8 2.7 ! 15.5 6.8 ! 3.0 !$35,000–49,999 3,032,000 69.0 31.0 34.0 46.2 10.2 10.2 24.3 4.7 ‡$50,000 or more 10,595,000 71.8 28.2 32.5 44.7 8.5 7.9 21.0 7.0 1.4
SOURCE: U.S. Department of Justice, Bureau of Justice Statistics, School Crime Supplement (SCS) to the National Crime Victimization Survey (NCVS), 2011.
‡ Reporting standards not met. The standard error for this estimate is equal to 50 percent or more of the estimate’s value.
Among bullied students: Location of bullying
# Rounds to zero.! Interpret data with caution. The standard error for this estimate is 30 to 50 percent of the estimate’s value.
National Center for Education StatisticsTable 2.1—Number and percentage distribution of students ages 12 through 18 who reported being bullied at
1 Respondents who identified themselves as being of Hispanic or Latino origin were classified as “Hispanic or Latino,” regardless of their race. “Black, not Hispanic or Latino” includes African Americans. “All other races, not Hispanic or Latino” includes Native Hawaiians or Other Pacific Islanders, American Indians or Alaska Natives, and respondents of two or more races (3 percent of all respondents).2 The School Crime Supplement sample includes students ages 12–18 and, therefore, might not be representative of students in 6th grade. Comparisons between students in 6th grade and those in other grades should be made with caution.NOTE: “Bullied” includes students being made fun of, called names, or insulted; being the subject of rumors; being threatened with harm; being pushed, shoved, tripped, or spit on; being pressured into doing things they did not want to do; being excluded from activities on purpose; and having property destroyed on purpose. “At school” includes the school building, school property, school bus, or going to and from school. Location totals may sum to more than 100 percent because students could have been bullied in more than one location. Missing data are not shown for household income. Estimates are reported for 24,456,000 students for whom data on bullying are available. Detail may not sum to totals because of rounding and missing data. Population size for students ages 12–18 is 24,690,000.
Table 2.1—school, by location of bullying and selected student characteristics: School year 2010–11
T-3
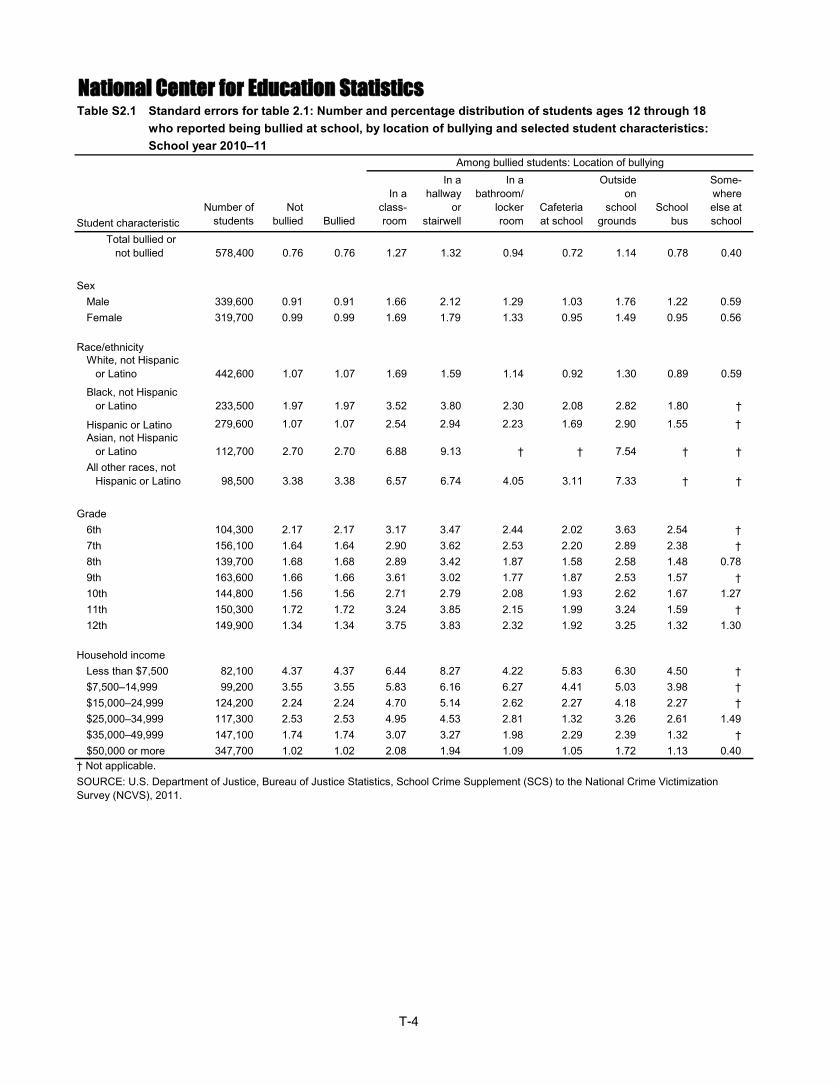
Student characteristicNumber of
studentsNot
bullied Bullied
In a class-room
In a hallway
or stairwell
In a bathroom/
locker room
Cafeteria at school
Outside on
school grounds
School bus
Some-where else at school
Total bullied or not bullied 578,400 0.76 0.76 1.27 1.32 0.94 0.72 1.14 0.78 0.40
SexMale 339,600 0.91 0.91 1.66 2.12 1.29 1.03 1.76 1.22 0.59Female 319,700 0.99 0.99 1.69 1.79 1.33 0.95 1.49 0.95 0.56
Race/ethnicityWhite, not Hispanic or Latino 442,600 1.07 1.07 1.69 1.59 1.14 0.92 1.30 0.89 0.59
Black, not Hispanic or Latino 233,500 1.97 1.97 3.52 3.80 2.30 2.08 2.82 1.80 †
Hispanic or Latino 279,600 1.07 1.07 2.54 2.94 2.23 1.69 2.90 1.55 †Asian, not Hispanic or Latino 112,700 2.70 2.70 6.88 9.13 † † 7.54 † †All other races, not Hispanic or Latino 98,500 3.38 3.38 6.57 6.74 4.05 3.11 7.33 † †
Grade6th 104,300 2.17 2.17 3.17 3.47 2.44 2.02 3.63 2.54 †7th 156,100 1.64 1.64 2.90 3.62 2.53 2.20 2.89 2.38 †8th 139,700 1.68 1.68 2.89 3.42 1.87 1.58 2.58 1.48 0.789th 163,600 1.66 1.66 3.61 3.02 1.77 1.87 2.53 1.57 †10th 144,800 1.56 1.56 2.71 2.79 2.08 1.93 2.62 1.67 1.2711th 150,300 1.72 1.72 3.24 3.85 2.15 1.99 3.24 1.59 †12th 149,900 1.34 1.34 3.75 3.83 2.32 1.92 3.25 1.32 1.30
Household incomeLess than $7,500 82,100 4.37 4.37 6.44 8.27 4.22 5.83 6.30 4.50 †$7,500–14,999 99,200 3.55 3.55 5.83 6.16 6.27 4.41 5.03 3.98 †$15,000–24,999 124,200 2.24 2.24 4.70 5.14 2.62 2.27 4.18 2.27 †$25,000–34,999 117,300 2.53 2.53 4.95 4.53 2.81 1.32 3.26 2.61 1.49$35,000–49,999 147,100 1.74 1.74 3.07 3.27 1.98 2.29 2.39 1.32 †$50,000 or more 347,700 1.02 1.02 2.08 1.94 1.09 1.05 1.72 1.13 0.40
National Center for Education Statistics
† Not applicable.SOURCE: U.S. Department of Justice, Bureau of Justice Statistics, School Crime Supplement (SCS) to the National Crime Victimization Survey (NCVS), 2011.
Among bullied students: Location of bullying
Table S2.1—Standard errors for table 2.1: Number and percentage distribution of students ages 12 through 18 Table S2.1—who reported being bullied at school, by location of bullying and selected student characteristics:Table S2.1—School year 2010–11
T-4
School characteristicNumber of
studentsNot
bullied Bullied
In a class-room
In a hallway
or stairwell
In a bathroom/
locker room
Cafeteria at school
Outside on
school grounds
School bus
Some-where else at school
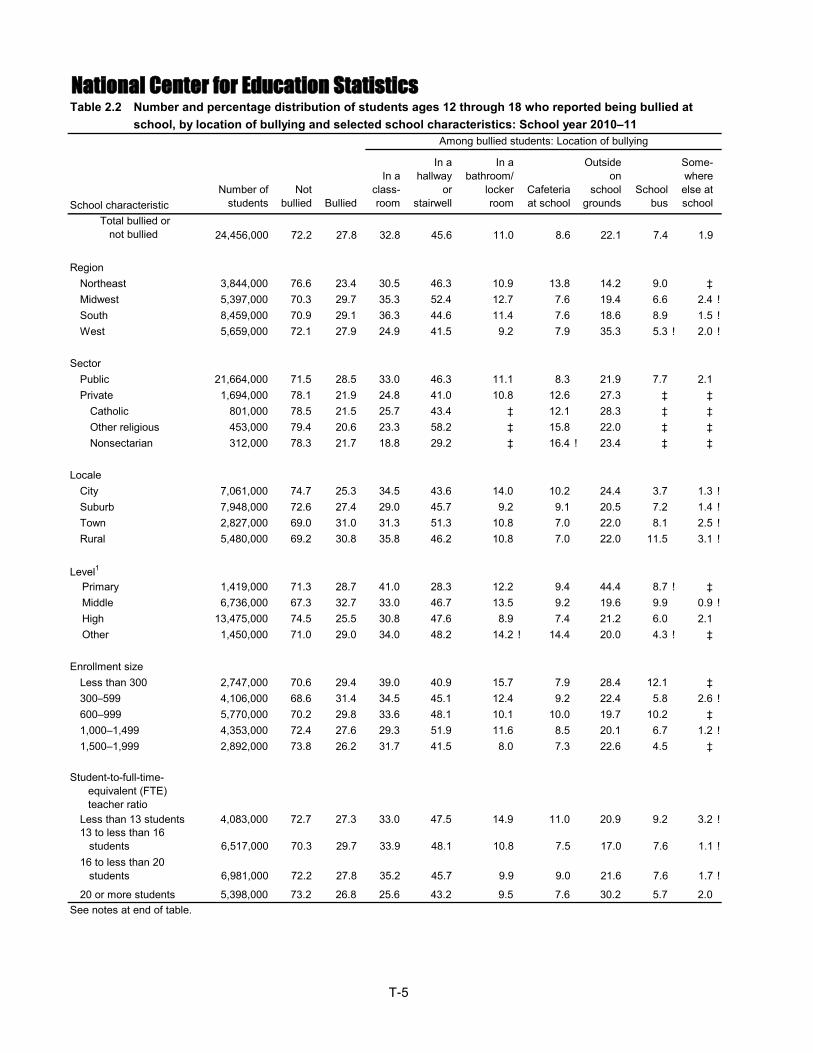
Total bullied or not bullied 24,456,000 72.2 27.8 32.8 45.6 11.0 8.6 22.1 7.4 1.9
Region Northeast 3,844,000 76.6 23.4 30.5 46.3 10.9 13.8 14.2 9.0 ‡ Midwest 5,397,000 70.3 29.7 35.3 52.4 12.7 7.6 19.4 6.6 2.4 !South 8,459,000 70.9 29.1 36.3 44.6 11.4 7.6 18.6 8.9 1.5 !West 5,659,000 72.1 27.9 24.9 41.5 9.2 7.9 35.3 5.3 ! 2.0 !
SectorPublic 21,664,000 71.5 28.5 33.0 46.3 11.1 8.3 21.9 7.7 2.1 Private 1,694,000 78.1 21.9 24.8 41.0 10.8 12.6 27.3 ‡ ‡
Catholic 801,000 78.5 21.5 25.7 43.4 ‡ 12.1 28.3 ‡ ‡ Other religious 453,000 79.4 20.6 23.3 58.2 ‡ 15.8 22.0 ‡ ‡ Nonsectarian 312,000 78.3 21.7 18.8 29.2 ‡ 16.4 ! 23.4 ‡ ‡
LocaleCity 7,061,000 74.7 25.3 34.5 43.6 14.0 10.2 24.4 3.7 1.3 !Suburb 7,948,000 72.6 27.4 29.0 45.7 9.2 9.1 20.5 7.2 1.4 !Town 2,827,000 69.0 31.0 31.3 51.3 10.8 7.0 22.0 8.1 2.5 !Rural 5,480,000 69.2 30.8 35.8 46.2 10.8 7.0 22.0 11.5 3.1 !
Level1
Primary 1,419,000 71.3 28.7 41.0 28.3 12.2 9.4 44.4 8.7 ! ‡ Middle 6,736,000 67.3 32.7 33.0 46.7 13.5 9.2 19.6 9.9 0.9 ! High 13,475,000 74.5 25.5 30.8 47.6 8.9 7.4 21.2 6.0 2.1 Other 1,450,000 71.0 29.0 34.0 48.2 14.2 ! 14.4 20.0 4.3 ! ‡
Enrollment sizeLess than 300 2,747,000 70.6 29.4 39.0 40.9 15.7 7.9 28.4 12.1 ‡ 300–599 4,106,000 68.6 31.4 34.5 45.1 12.4 9.2 22.4 5.8 2.6 !600–999 5,770,000 70.2 29.8 33.6 48.1 10.1 10.0 19.7 10.2 ‡ 1,000–1,499 4,353,000 72.4 27.6 29.3 51.9 11.6 8.5 20.1 6.7 1.2 !1,500–1,999 2,892,000 73.8 26.2 31.7 41.5 8.0 7.3 22.6 4.5 ‡
Student-to-full-time- equivalent (FTE) teacher ratio
Less than 13 students 4,083,000 72.7 27.3 33.0 47.5 14.9 11.0 20.9 9.2 3.2 !13 to less than 16 students 6,517,000 70.3 29.7 33.9 48.1 10.8 7.5 17.0 7.6 1.1 !16 to less than 20 students 6,981,000 72.2 27.8 35.2 45.7 9.9 9.0 21.6 7.6 1.7 !
20 or more students 5,398,000 73.2 26.8 25.6 43.2 9.5 7.6 30.2 5.7 2.0
National Center for Education Statistics
See notes at end of table.
Table 2.2—Number and percentage distribution of students ages 12 through 18 who reported being bullied at
Among bullied students: Location of bullyingTable 2.2—school, by location of bullying and selected school characteristics: School year 2010–11
T-5
School characteristicNumber of
studentsNot
bullied Bullied
In a class-room
In a hallway
or stairwell
In a bathroom/
locker room
Cafeteria at school
Outside on
school grounds
School bus
Some-where else at school
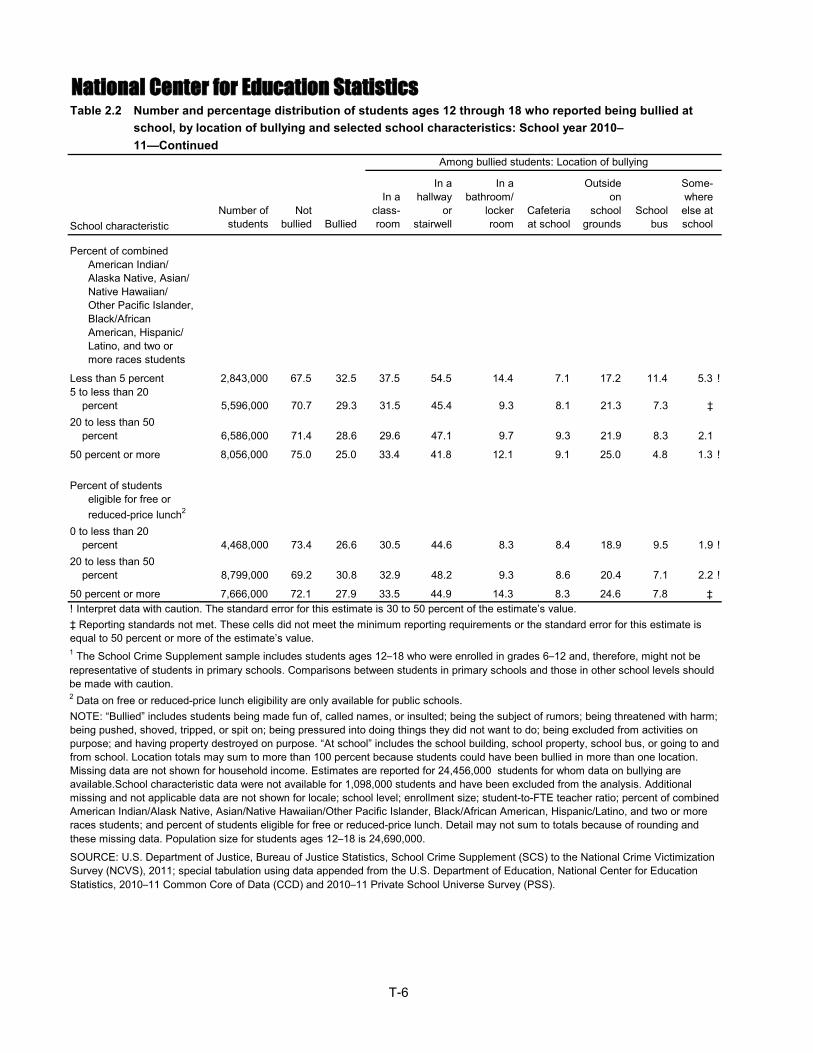
Percent of combined American Indian/ Alaska Native, Asian/ Native Hawaiian/ Other Pacific Islander, Black/African American, Hispanic/ Latino, and two or more races students
Less than 5 percent 2,843,000 67.5 32.5 37.5 54.5 14.4 7.1 17.2 11.4 5.3 !5 to less than 20 percent 5,596,000 70.7 29.3 31.5 45.4 9.3 8.1 21.3 7.3 ‡ 20 to less than 50 percent 6,586,000 71.4 28.6 29.6 47.1 9.7 9.3 21.9 8.3 2.1
50 percent or more 8,056,000 75.0 25.0 33.4 41.8 12.1 9.1 25.0 4.8 1.3 !
Percent of students eligible for free or reduced-price lunch2
0 to less than 20 percent 4,468,000 73.4 26.6 30.5 44.6 8.3 8.4 18.9 9.5 1.9 !20 to less than 50 percent 8,799,000 69.2 30.8 32.9 48.2 9.3 8.6 20.4 7.1 2.2 !
50 percent or more 7,666,000 72.1 27.9 33.5 44.9 14.3 8.3 24.6 7.8 ‡
NOTE: “Bullied” includes students being made fun of, called names, or insulted; being the subject of rumors; being threatened with harm; being pushed, shoved, tripped, or spit on; being pressured into doing things they did not want to do; being excluded from activities on purpose; and having property destroyed on purpose. “At school” includes the school building, school property, school bus, or going to and from school. Location totals may sum to more than 100 percent because students could have been bullied in more than one location. Missing data are not shown for household income. Estimates are reported for 24,456,000 students for whom data on bullying are available.School characteristic data were not available for 1,098,000 students and have been excluded from the analysis. Additional missing and not applicable data are not shown for locale; school level; enrollment size; student-to-FTE teacher ratio; percent of combined American Indian/Alask Native, Asian/Native Hawaiian/Other Pacific Islander, Black/African American, Hispanic/Latino, and two or more races students; and percent of students eligible for free or reduced-price lunch. Detail may not sum to totals because of rounding and these missing data. Population size for students ages 12–18 is 24,690,000.
SOURCE: U.S. Department of Justice, Bureau of Justice Statistics, School Crime Supplement (SCS) to the National Crime Victimization Survey (NCVS), 2011; special tabulation using data appended from the U.S. Department of Education, National Center for Education Statistics, 2010–11 Common Core of Data (CCD) and 2010–11 Private School Universe Survey (PSS).
! Interpret data with caution. The standard error for this estimate is 30 to 50 percent of the estimate’s value.‡ Reporting standards not met. These cells did not meet the minimum reporting requirements or the standard error for this estimate is equal to 50 percent or more of the estimate’s value.1 The School Crime Supplement sample includes students ages 12–18 who were enrolled in grades 6–12 and, therefore, might not be representative of students in primary schools. Comparisons between students in primary schools and those in other school levels should be made with caution.2 Data on free or reduced-price lunch eligibility are only available for public schools.
National Center for Education StatisticsTable 2.2—Number and percentage distribution of students ages 12 through 18 who reported being bullied at
Among bullied students: Location of bullying
Table 2.2—school, by location of bullying and selected school characteristics: School year 2010–Table 2.2—11—Continued
T-6
School characteristicNumber of
studentsNot
bullied Bullied
In a class-room
In a hallway
or stairwell
In a bathroom/
locker room
Cafeteria at school
Outside on school
groundsSchool
bus
Some-where
else at school
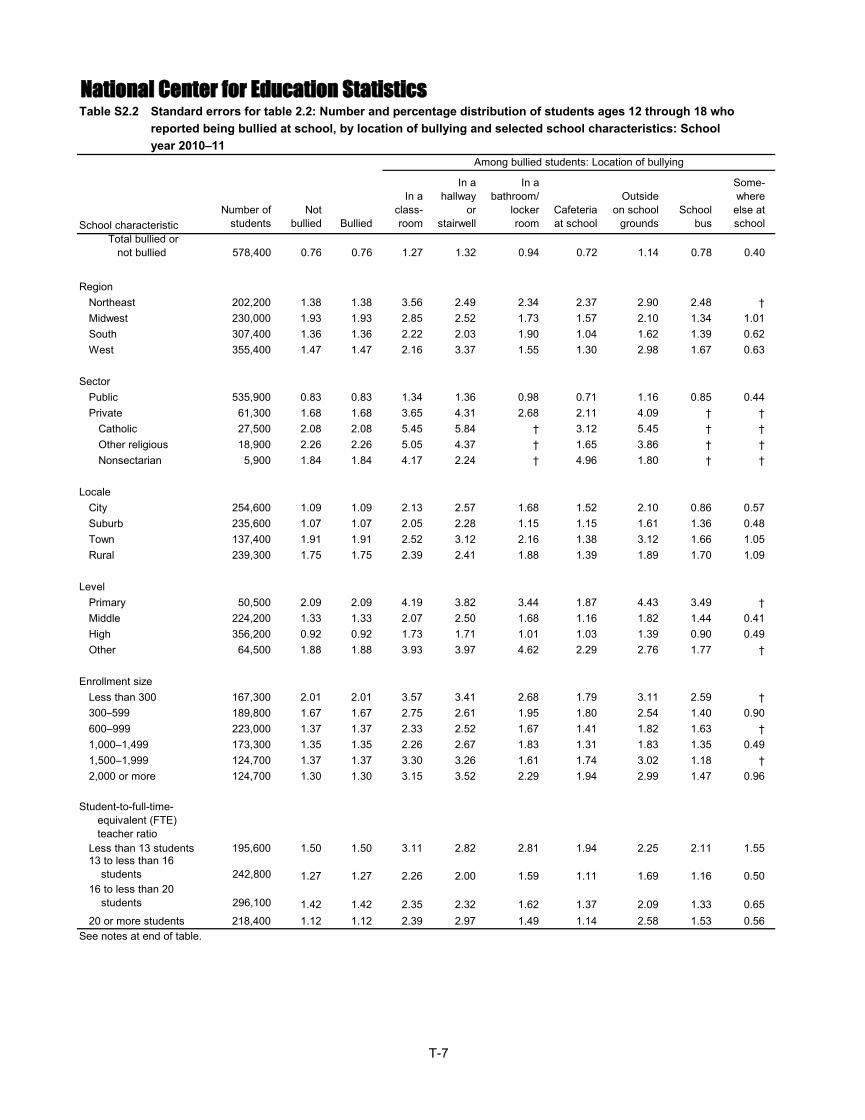
Total bullied or not bullied 578,400 0.76 0.76 1.27 1.32 0.94 0.72 1.14 0.78 0.40
Region Northeast 202,200 1.38 1.38 3.56 2.49 2.34 2.37 2.90 2.48 †Midwest 230,000 1.93 1.93 2.85 2.52 1.73 1.57 2.10 1.34 1.01South 307,400 1.36 1.36 2.22 2.03 1.90 1.04 1.62 1.39 0.62West 355,400 1.47 1.47 2.16 3.37 1.55 1.30 2.98 1.67 0.63
SectorPublic 535,900 0.83 0.83 1.34 1.36 0.98 0.71 1.16 0.85 0.44Private 61,300 1.68 1.68 3.65 4.31 2.68 2.11 4.09 † †
Catholic 27,500 2.08 2.08 5.45 5.84 † 3.12 5.45 † †Other religious 18,900 2.26 2.26 5.05 4.37 † 1.65 3.86 † †Nonsectarian 5,900 1.84 1.84 4.17 2.24 † 4.96 1.80 † †
LocaleCity 254,600 1.09 1.09 2.13 2.57 1.68 1.52 2.10 0.86 0.57Suburb 235,600 1.07 1.07 2.05 2.28 1.15 1.15 1.61 1.36 0.48Town 137,400 1.91 1.91 2.52 3.12 2.16 1.38 3.12 1.66 1.05Rural 239,300 1.75 1.75 2.39 2.41 1.88 1.39 1.89 1.70 1.09
LevelPrimary 50,500 2.09 2.09 4.19 3.82 3.44 1.87 4.43 3.49 †Middle 224,200 1.33 1.33 2.07 2.50 1.68 1.16 1.82 1.44 0.41High 356,200 0.92 0.92 1.73 1.71 1.01 1.03 1.39 0.90 0.49Other 64,500 1.88 1.88 3.93 3.97 4.62 2.29 2.76 1.77 †
Enrollment sizeLess than 300 167,300 2.01 2.01 3.57 3.41 2.68 1.79 3.11 2.59 †300–599 189,800 1.67 1.67 2.75 2.61 1.95 1.80 2.54 1.40 0.90600–999 223,000 1.37 1.37 2.33 2.52 1.67 1.41 1.82 1.63 †1,000–1,499 173,300 1.35 1.35 2.26 2.67 1.83 1.31 1.83 1.35 0.491,500–1,999 124,700 1.37 1.37 3.30 3.26 1.61 1.74 3.02 1.18 †2,000 or more 124,700 1.30 1.30 3.15 3.52 2.29 1.94 2.99 1.47 0.96
Student-to-full-time- equivalent (FTE) teacher ratio
Less than 13 students 195,600 1.50 1.50 3.11 2.82 2.81 1.94 2.25 2.11 1.5513 to less than 16 students 242,800 1.27 1.27 2.26 2.00 1.59 1.11 1.69 1.16 0.5016 to less than 20 students 296,100 1.42 1.42 2.35 2.32 1.62 1.37 2.09 1.33 0.6520 or more students 218,400 1.12 1.12 2.39 2.97 1.49 1.14 2.58 1.53 0.56
National Center for Education StatisticsTable S2.2—Standard errors for table 2.2: Number and percentage distribution of students ages 12 through 18 who
See notes at end of table.
Among bullied students: Location of bullying
Table S2.2—reported being bullied at school, by location of bullying and selected school characteristics: SchoolTable S2.2—year 2010–11
T-7

School characteristicNumber of
studentsNot
bullied Bullied
In a class-room
In a hallway
or stairwell
In a bathroom/
locker room
Cafeteria at school
Outside on school
groundsSchool
bus
Some-where
else at school
Percent of combined American Indian/ Alaska Native, Asian/ Native Hawaiian/ Other Pacific Islander, Black/African American, Hispanic/ Latino, and two or more races students
Less than 5 percent 154,800 1.91 1.91 3.29 3.06 2.99 2.05 2.09 1.98 2.125 to less than 20 percent 336,900 1.45 1.45 2.37 2.27 1.41 1.21 1.99 1.21 †20 to less than 50 percent 236,200 1.37 1.37 2.31 2.46 1.42 1.23 1.78 1.46 0.6150 percent or more 279,700 1.07 1.07 2.27 2.34 1.64 1.30 2.40 0.95 0.40
Percent of students eligible for free or reduced-price lunch
0 to less than 20 percent 202,400 1.39 1.39 3.06 3.13 1.80 1.39 2.12 1.99 0.6920 to less than 50 percent 319,200 1.19 1.19 1.95 1.70 1.24 1.11 1.51 1.22 0.6950 percent or more 292,300 1.22 1.22 2.04 2.31 1.76 1.25 2.07 1.39 †
† Not applicable.SOURCE: U.S. Department of Justice, Bureau of Justice Statistics, School Crime Supplement (SCS) to the National Crime Victimization Survey (NCVS), 2011; special tabulation using data appended from the U.S. Department of Education, National Center for Education Statistics, 2010–11 Common Core of Data (CCD) and 2010–11 Private School Universe Survey (PSS).
National Center for Education Statistics
Among bullied students: Location of bullying
Table S2.2—reported being bullied at school, by location of bullying and selected school characteristics: SchoolTable S2.2—Standard errrors for table 2.2: Number and percentage distribution of students ages 12 through 18 who
Table S2.2—year 2010–11—Continued
T-8
Student characteristicNumber of
studentsNot
bullied Bullied
Once or twice in the school year
Once or twice a month
Once or twice a
weekAlmost
every dayAdult was
notified
Student was
injured2
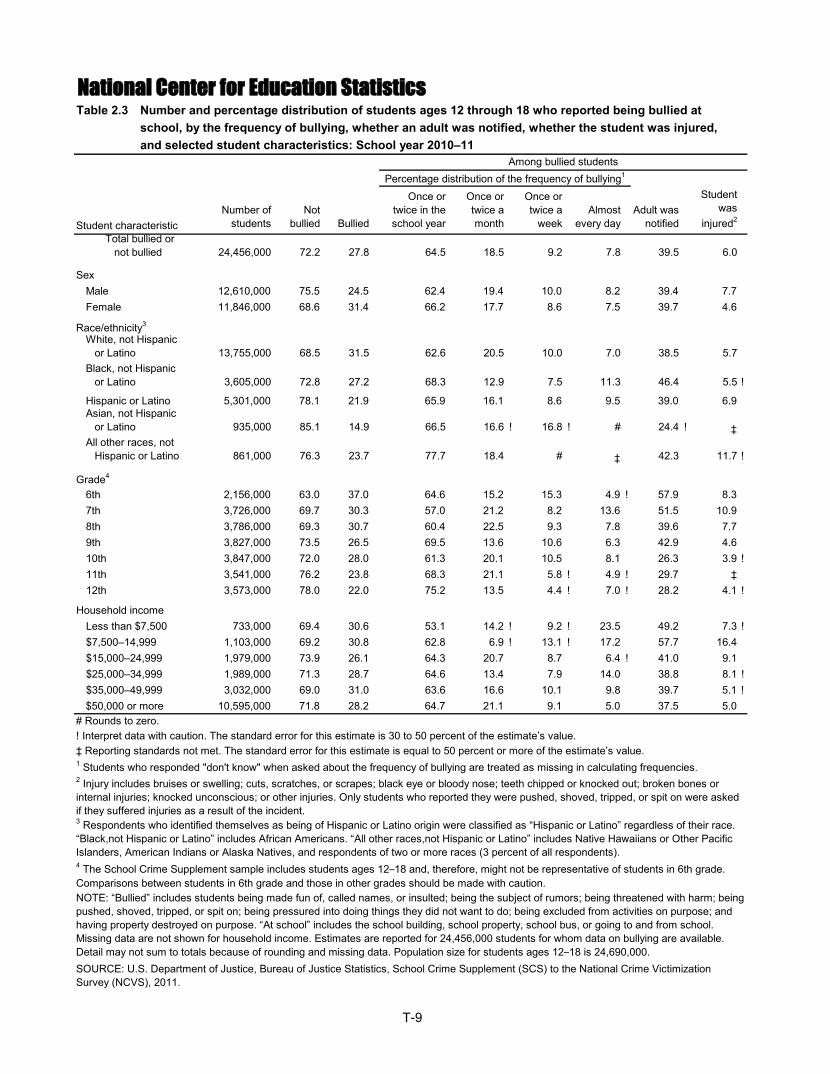
Total bullied or not bullied 24,456,000 72.2 27.8 64.5 18.5 9.2 7.8 39.5 6.0
SexMale 12,610,000 75.5 24.5 62.4 19.4 10.0 8.2 39.4 7.7Female 11,846,000 68.6 31.4 66.2 17.7 8.6 7.5 39.7 4.6
Race/ethnicity3
White, not Hispanic or Latino 13,755,000 68.5 31.5 62.6 20.5 10.0 7.0 38.5 5.7Black, not Hispanic or Latino 3,605,000 72.8 27.2 68.3 12.9 7.5 11.3 46.4 5.5 !
Hispanic or Latino 5,301,000 78.1 21.9 65.9 16.1 8.6 9.5 39.0 6.9Asian, not Hispanic or Latino 935,000 85.1 14.9 66.5 16.6 ! 16.8 ! # 24.4 ! ‡All other races, not Hispanic or Latino 861,000 76.3 23.7 77.7 18.4 # ‡ 42.3 11.7 !
Grade4
6th 2,156,000 63.0 37.0 64.6 15.2 15.3 4.9 ! 57.9 8.37th 3,726,000 69.7 30.3 57.0 21.2 8.2 13.6 51.5 10.98th 3,786,000 69.3 30.7 60.4 22.5 9.3 7.8 39.6 7.79th 3,827,000 73.5 26.5 69.5 13.6 10.6 6.3 42.9 4.610th 3,847,000 72.0 28.0 61.3 20.1 10.5 8.1 26.3 3.9 !11th 3,541,000 76.2 23.8 68.3 21.1 5.8 ! 4.9 ! 29.7 ‡12th 3,573,000 78.0 22.0 75.2 13.5 4.4 ! 7.0 ! 28.2 4.1 !
Household incomeLess than $7,500 733,000 69.4 30.6 53.1 14.2 ! 9.2 ! 23.5 49.2 7.3 !$7,500–14,999 1,103,000 69.2 30.8 62.8 6.9 ! 13.1 ! 17.2 57.7 16.4$15,000–24,999 1,979,000 73.9 26.1 64.3 20.7 8.7 6.4 ! 41.0 9.1$25,000–34,999 1,989,000 71.3 28.7 64.6 13.4 7.9 14.0 38.8 8.1 !$35,000–49,999 3,032,000 69.0 31.0 63.6 16.6 10.1 9.8 39.7 5.1 !$50,000 or more 10,595,000 71.8 28.2 64.7 21.1 9.1 5.0 37.5 5.0
National Center for Education Statistics
SOURCE: U.S. Department of Justice, Bureau of Justice Statistics, School Crime Supplement (SCS) to the National Crime Victimization Survey (NCVS), 2011.
Table 2.3—Number and percentage distribution of students ages 12 through 18 who reported being bullied at
Among bullied studentsPercentage distribution of the frequency of bullying1
# Rounds to zero.! Interpret data with caution. The standard error for this estimate is 30 to 50 percent of the estimate’s value.‡ Reporting standards not met. The standard error for this estimate is equal to 50 percent or more of the estimate’s value.1 Students who responded "don't know" when asked about the frequency of bullying are treated as missing in calculating frequencies.2 Injury includes bruises or swelling; cuts, scratches, or scrapes; black eye or bloody nose; teeth chipped or knocked out; broken bones or internal injuries; knocked unconscious; or other injuries. Only students who reported they were pushed, shoved, tripped, or spit on were asked if they suffered injuries as a result of the incident.3 Respondents who identified themselves as being of Hispanic or Latino origin were classified as “Hispanic or Latino” regardless of their race. “Black,not Hispanic or Latino” includes African Americans. “All other races,not Hispanic or Latino” includes Native Hawaiians or Other Pacific Islanders, American Indians or Alaska Natives, and respondents of two or more races (3 percent of all respondents).4 The School Crime Supplement sample includes students ages 12–18 and, therefore, might not be representative of students in 6th grade. Comparisons between students in 6th grade and those in other grades should be made with caution.NOTE: “Bullied” includes students being made fun of, called names, or insulted; being the subject of rumors; being threatened with harm; being pushed, shoved, tripped, or spit on; being pressured into doing things they did not want to do; being excluded from activities on purpose; and having property destroyed on purpose. “At school” includes the school building, school property, school bus, or going to and from school. Missing data are not shown for household income. Estimates are reported for 24,456,000 students for whom data on bullying are available. Detail may not sum to totals because of rounding and missing data. Population size for students ages 12–18 is 24,690,000.
Table 2.3—Table 2.3—
school, by the frequency of bullying, whether an adult was notified, whether the student was injured,and selected student characteristics: School year 2010–11
T-9
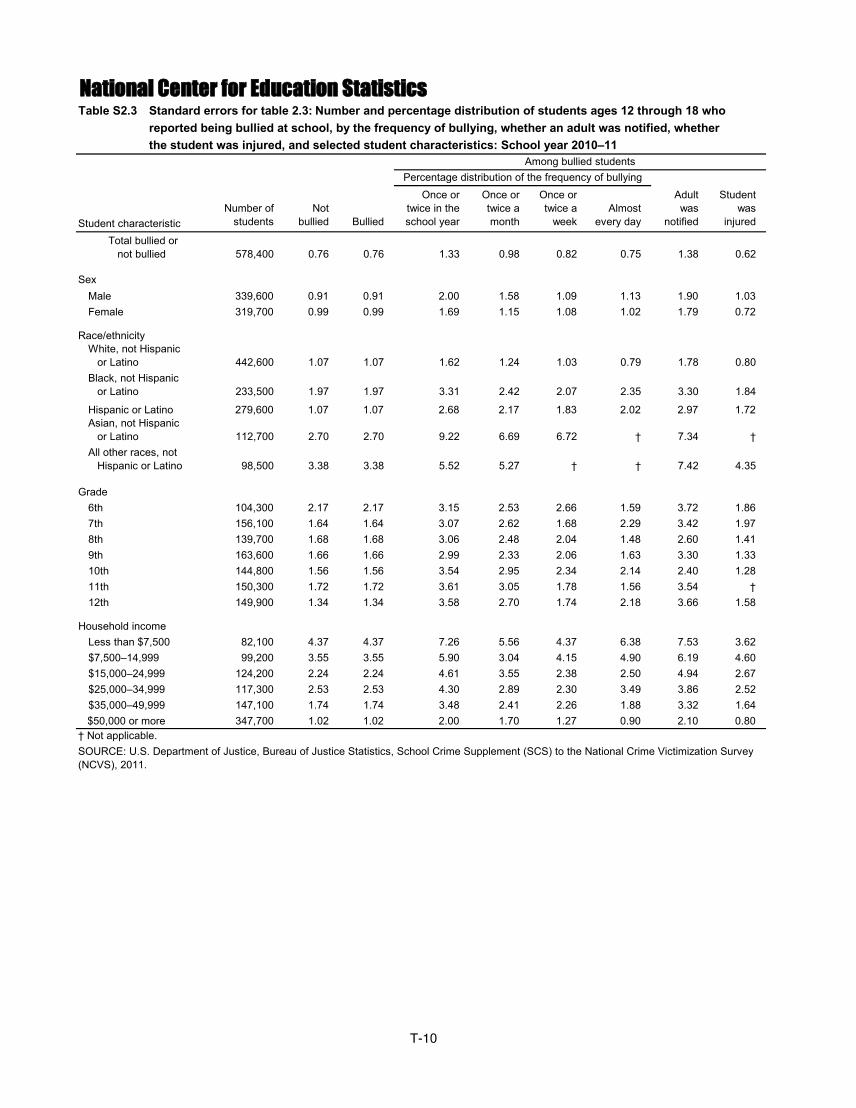
Student characteristicNumber of
studentsNot
bullied Bullied
Once or twice in the school year
Once or twice a month
Once or twice a
weekAlmost
every day
Adult was
notified
Student was
injured
Total bullied or not bullied 578,400 0.76 0.76 1.33 0.98 0.82 0.75 1.38 0.62
SexMale 339,600 0.91 0.91 2.00 1.58 1.09 1.13 1.90 1.03Female 319,700 0.99 0.99 1.69 1.15 1.08 1.02 1.79 0.72
Race/ethnicityWhite, not Hispanic or Latino 442,600 1.07 1.07 1.62 1.24 1.03 0.79 1.78 0.80Black, not Hispanic or Latino 233,500 1.97 1.97 3.31 2.42 2.07 2.35 3.30 1.84
Hispanic or Latino 279,600 1.07 1.07 2.68 2.17 1.83 2.02 2.97 1.72Asian, not Hispanic or Latino 112,700 2.70 2.70 9.22 6.69 6.72 † 7.34 †All other races, not Hispanic or Latino 98,500 3.38 3.38 5.52 5.27 † † 7.42 4.35
Grade6th 104,300 2.17 2.17 3.15 2.53 2.66 1.59 3.72 1.867th 156,100 1.64 1.64 3.07 2.62 1.68 2.29 3.42 1.978th 139,700 1.68 1.68 3.06 2.48 2.04 1.48 2.60 1.419th 163,600 1.66 1.66 2.99 2.33 2.06 1.63 3.30 1.3310th 144,800 1.56 1.56 3.54 2.95 2.34 2.14 2.40 1.2811th 150,300 1.72 1.72 3.61 3.05 1.78 1.56 3.54 †12th 149,900 1.34 1.34 3.58 2.70 1.74 2.18 3.66 1.58
Household incomeLess than $7,500 82,100 4.37 4.37 7.26 5.56 4.37 6.38 7.53 3.62$7,500–14,999 99,200 3.55 3.55 5.90 3.04 4.15 4.90 6.19 4.60$15,000–24,999 124,200 2.24 2.24 4.61 3.55 2.38 2.50 4.94 2.67$25,000–34,999 117,300 2.53 2.53 4.30 2.89 2.30 3.49 3.86 2.52$35,000–49,999 147,100 1.74 1.74 3.48 2.41 2.26 1.88 3.32 1.64
$50,000 or more 347,700 1.02 1.02 2.00 1.70 1.27 0.90 2.10 0.80
National Center for Education Statistics
SOURCE: U.S. Department of Justice, Bureau of Justice Statistics, School Crime Supplement (SCS) to the National Crime Victimization Survey (NCVS), 2011.
† Not applicable.
Among bullied studentsPercentage distribution of the frequency of bullying
Table S2.3Table S2.3
—reported being bullied at school, by the frequency of bullying, whether an adult was notified, whether—the student was injured, and selected student characteristics: School year 2010–11
Table S2.3—Standard errors for table 2.3: Number and percentage distribution of students ages 12 through 18 who
T-10
School characteristicNumber of
studentsNot
bullied Bullied
Once or twice in the school year
Once or twice a month
Once or twice a
weekAlmost
every dayAdult was
notified
Student was
injured2
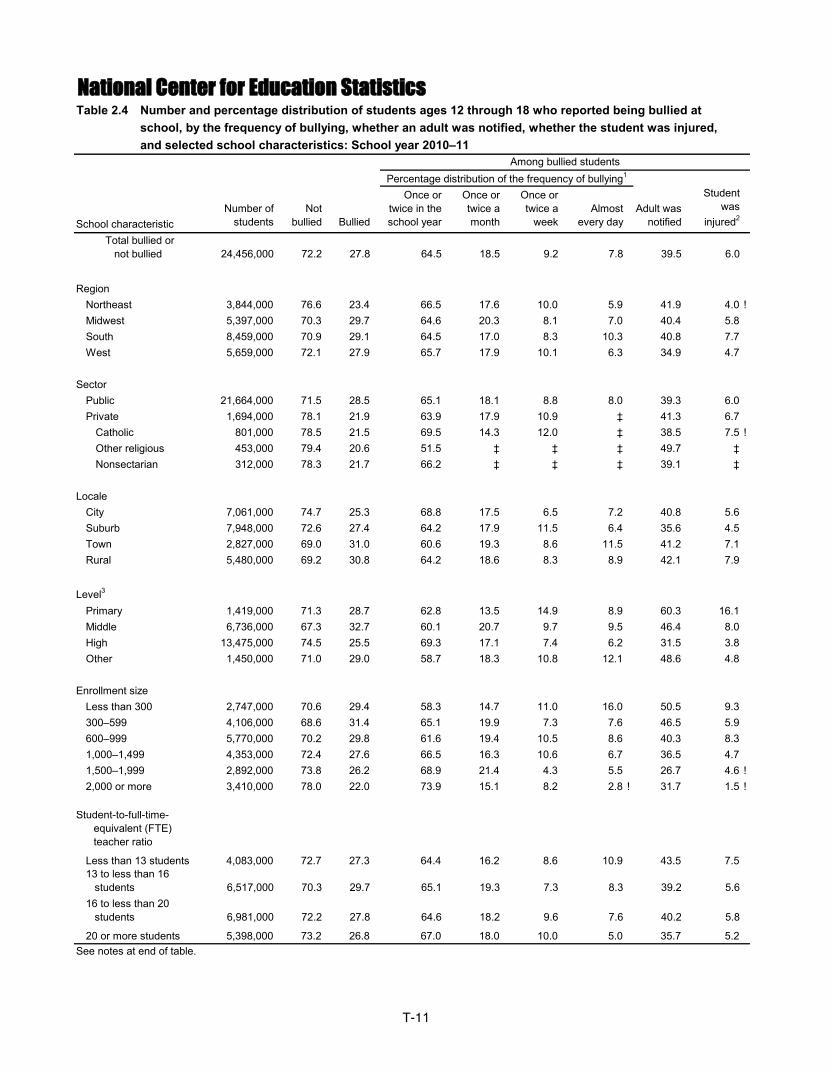
Total bullied or not bullied 24,456,000 72.2 27.8 64.5 18.5 9.2 7.8 39.5 6.0
Region Northeast 3,844,000 76.6 23.4 66.5 17.6 10.0 5.9 41.9 4.0 !Midwest 5,397,000 70.3 29.7 64.6 20.3 8.1 7.0 40.4 5.8South 8,459,000 70.9 29.1 64.5 17.0 8.3 10.3 40.8 7.7West 5,659,000 72.1 27.9 65.7 17.9 10.1 6.3 34.9 4.7
SectorPublic 21,664,000 71.5 28.5 65.1 18.1 8.8 8.0 39.3 6.0Private 1,694,000 78.1 21.9 63.9 17.9 10.9 ‡ 41.3 6.7
Catholic 801,000 78.5 21.5 69.5 14.3 12.0 ‡ 38.5 7.5 !Other religious 453,000 79.4 20.6 51.5 ‡ ‡ ‡ 49.7 ‡Nonsectarian 312,000 78.3 21.7 66.2 ‡ ‡ ‡ 39.1 ‡
LocaleCity 7,061,000 74.7 25.3 68.8 17.5 6.5 7.2 40.8 5.6Suburb 7,948,000 72.6 27.4 64.2 17.9 11.5 6.4 35.6 4.5Town 2,827,000 69.0 31.0 60.6 19.3 8.6 11.5 41.2 7.1Rural 5,480,000 69.2 30.8 64.2 18.6 8.3 8.9 42.1 7.9
Level3
Primary 1,419,000 71.3 28.7 62.8 13.5 14.9 8.9 60.3 16.1Middle 6,736,000 67.3 32.7 60.1 20.7 9.7 9.5 46.4 8.0High 13,475,000 74.5 25.5 69.3 17.1 7.4 6.2 31.5 3.8Other 1,450,000 71.0 29.0 58.7 18.3 10.8 12.1 48.6 4.8
Enrollment sizeLess than 300 2,747,000 70.6 29.4 58.3 14.7 11.0 16.0 50.5 9.3300–599 4,106,000 68.6 31.4 65.1 19.9 7.3 7.6 46.5 5.9600–999 5,770,000 70.2 29.8 61.6 19.4 10.5 8.6 40.3 8.31,000–1,499 4,353,000 72.4 27.6 66.5 16.3 10.6 6.7 36.5 4.71,500–1,999 2,892,000 73.8 26.2 68.9 21.4 4.3 5.5 26.7 4.6 !2,000 or more 3,410,000 78.0 22.0 73.9 15.1 8.2 2.8 ! 31.7 1.5 !
Student-to-full-time- equivalent (FTE) teacher ratio
Less than 13 students 4,083,000 72.7 27.3 64.4 16.2 8.6 10.9 43.5 7.513 to less than 16 students 6,517,000 70.3 29.7 65.1 19.3 7.3 8.3 39.2 5.616 to less than 20 students 6,981,000 72.2 27.8 64.6 18.2 9.6 7.6 40.2 5.8
20 or more students 5,398,000 73.2 26.8 67.0 18.0 10.0 5.0 35.7 5.2
National Center for Education StatisticsTable 2.4—Number and percentage distribution of students ages 12 through 18 who reported being bullied at
See notes at end of table.
Among bullied studentsPercentage distribution of the frequency of bullying1
Table 2.4—Table 2.4—
school, by the frequency of bullying, whether an adult was notified, whether the student was injured,and selected school characteristics: School year 2010–11
T-11
School characteristicNumber of
studentsNot
bullied Bullied
Once or twice in the school year
Once or twice a month
Once or twice a
weekAlmost
every dayAdult was
notified
Student was
injured2
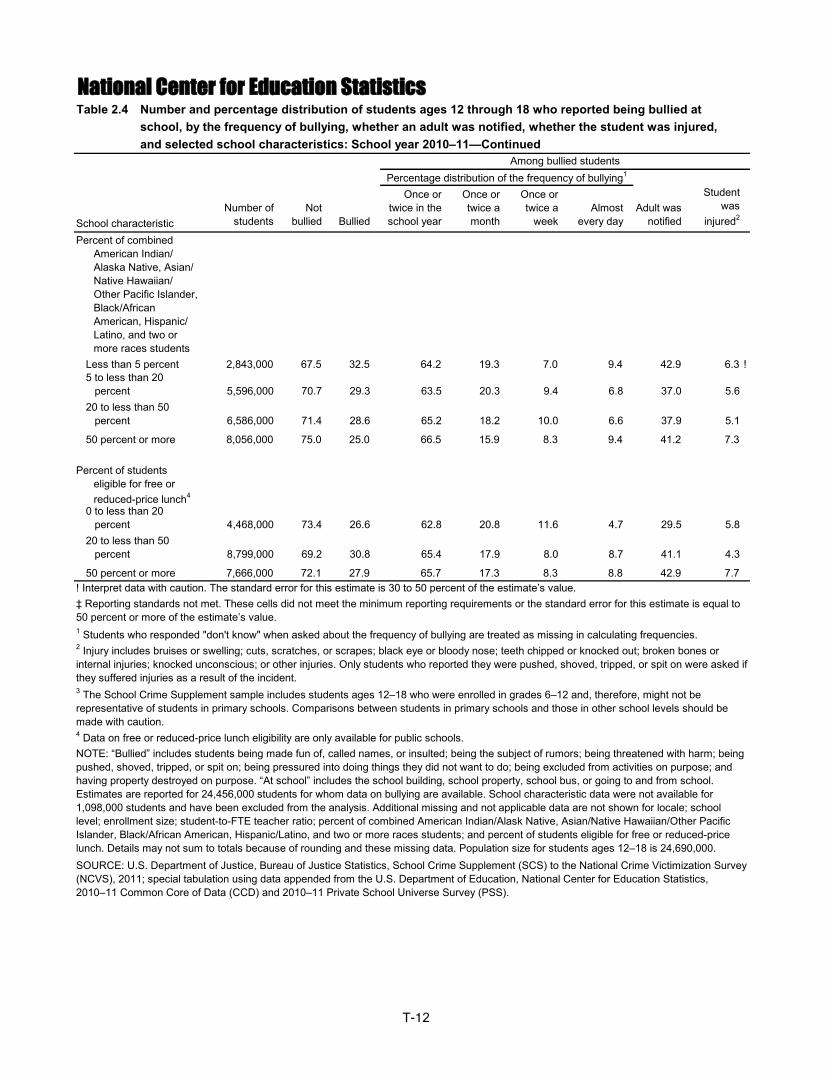
Percent of combined American Indian/ Alaska Native, Asian/ Native Hawaiian/ Other Pacific Islander, Black/African American, Hispanic/ Latino, and two or more races students
Less than 5 percent 2,843,000 67.5 32.5 64.2 19.3 7.0 9.4 42.9 6.3 !5 to less than 20 percent 5,596,000 70.7 29.3 63.5 20.3 9.4 6.8 37.0 5.620 to less than 50 percent 6,586,000 71.4 28.6 65.2 18.2 10.0 6.6 37.9 5.1
50 percent or more 8,056,000 75.0 25.0 66.5 15.9 8.3 9.4 41.2 7.3
Percent of students eligible for free or reduced-price lunch4
0 to less than 20 percent 4,468,000 73.4 26.6 62.8 20.8 11.6 4.7 29.5 5.820 to less than 50 percent 8,799,000 69.2 30.8 65.4 17.9 8.0 8.7 41.1 4.3
50 percent or more 7,666,000 72.1 27.9 65.7 17.3 8.3 8.8 42.9 7.7
2 Injury includes bruises or swelling; cuts, scratches, or scrapes; black eye or bloody nose; teeth chipped or knocked out; broken bones or internal injuries; knocked unconscious; or other injuries. Only students who reported they were pushed, shoved, tripped, or spit on were asked if they suffered injuries as a result of the incident.3 The School Crime Supplement sample includes students ages 12–18 who were enrolled in grades 6–12 and, therefore, might not be representative of students in primary schools. Comparisons between students in primary schools and those in other school levels should be made with caution.4 Data on free or reduced-price lunch eligibility are only available for public schools.NOTE: “Bullied” includes students being made fun of, called names, or insulted; being the subject of rumors; being threatened with harm; being pushed, shoved, tripped, or spit on; being pressured into doing things they did not want to do; being excluded from activities on purpose; and having property destroyed on purpose. “At school” includes the school building, school property, school bus, or going to and from school. Estimates are reported for 24,456,000 students for whom data on bullying are available. School characteristic data were not available for 1,098,000 students and have been excluded from the analysis. Additional missing and not applicable data are not shown for locale; school level; enrollment size; student-to-FTE teacher ratio; percent of combined American Indian/Alask Native, Asian/Native Hawaiian/Other Pacific Islander, Black/African American, Hispanic/Latino, and two or more races students; and percent of students eligible for free or reduced-price lunch. Details may not sum to totals because of rounding and these missing data. Population size for students ages 12–18 is 24,690,000.SOURCE: U.S. Department of Justice, Bureau of Justice Statistics, School Crime Supplement (SCS) to the National Crime Victimization Survey (NCVS), 2011; special tabulation using data appended from the U.S. Department of Education, National Center for Education Statistics, 2010–11 Common Core of Data (CCD) and 2010–11 Private School Universe Survey (PSS).
National Center for Education Statistics
1 Students who responded "don't know" when asked about the frequency of bullying are treated as missing in calculating frequencies.
! Interpret data with caution. The standard error for this estimate is 30 to 50 percent of the estimate’s value.‡ Reporting standards not met. These cells did not meet the minimum reporting requirements or the standard error for this estimate is equal to 50 percent or more of the estimate’s value.
Table 2.4—Number and percentage distribution of students ages 12 through 18 who reported being bullied at
Percentage distribution of the frequency of bullying1
Among bullied students
Table 2.4—school, by the frequency of bullying, whether an adult was notified, whether the student was injured,Table 2.4—and selected school characteristics: School year 2010–11—Continued
T-12

School characteristicNumber of
studentsNot
bullied Bullied
Once or twice in the school year
Once or twice a month
Once or twice a
weekAlmost
every day
Adult was
notified
Student was
injuredTotal bullied or not bullied 578,400 0.76 0.76 1.31 0.98 0.81 0.73 1.36 0.62
Region Northeast 202,200 1.38 1.38 4.48 3.18 2.07 1.45 2.72 1.44Midwest 230,000 1.93 1.93 2.43 2.18 1.33 1.44 2.62 1.40South 307,400 1.36 1.36 1.96 1.49 1.15 1.36 2.33 1.09West 355,400 1.47 1.47 2.41 1.83 1.77 1.24 2.95 1.06
SectorPublic 535,900 0.83 0.83 1.30 0.98 0.80 0.75 1.41 0.66Private 61,300 1.68 1.68 2.17 2.06 0.14 † 1.37 1.69
Catholic 27,500 2.08 2.08 3.28 2.33 0.08 † 2.28 2.33Other religious 18,900 2.26 2.26 6.73 † † † — †Nonsectarian 5,900 1.84 1.84 9.66 † † † — †
LocaleCity 254,600 1.09 1.09 2.05 1.50 1.09 1.09 1.75 1.03Suburb 235,600 1.07 1.07 2.00 1.54 1.38 0.97 2.03 0.82Town 137,400 1.91 1.91 2.70 2.17 1.59 1.80 2.34 1.58Rural 239,300 1.75 1.75 2.01 1.49 1.09 1.24 2.67 1.44
LevelPrimary 50,500 2.09 2.09 2.54 1.87 2.44 1.87 2.37 3.52Middle 224,200 1.33 1.33 1.85 1.47 1.29 1.00 1.97 1.13High 356,200 0.92 0.92 1.64 1.23 0.99 0.86 1.69 0.68Other 64,500 1.88 1.88 2.33 2.55 0.86 1.67 2.74 1.27
Enrollment sizeLess than 300 167,300 2.01 2.01 2.29 2.17 1.38 1.74 2.89 2.37300–599 189,800 1.67 1.67 2.12 1.81 1.23 1.13 2.18 1.29600–999 223,000 1.37 1.37 1.90 1.61 1.29 1.01 2.13 1.131,000–1,499 173,300 1.35 1.35 2.08 1.55 1.78 1.16 2.11 1.371,500–1,999 124,700 1.37 1.37 2.48 2.30 1.21 1.15 2.79 1.442,000 or more 124,700 1.30 1.30 2.96 2.27 1.95 1.21 3.16 0.67
Student-to-full-time- equivalent (FTE) teacher ratio
Less than 13 students 195,600 1.50 1.50 2.25 1.87 1.60 1.34 2.05 1.7813 to less than 16 students 242,800 1.27 1.27 1.87 1.44 1.08 1.09 1.86 0.9716 to less than 20 students 296,100 1.42 1.42 2.03 1.59 1.04 1.11 1.81 1.08
20 or more students 218,400 1.12 1.12 2.11 1.90 1.71 1.02 2.56 1.10
National Center for Education Statistics
See notes at end of table.
Percentage distribution of the frequency of bullyingAmong bullied students
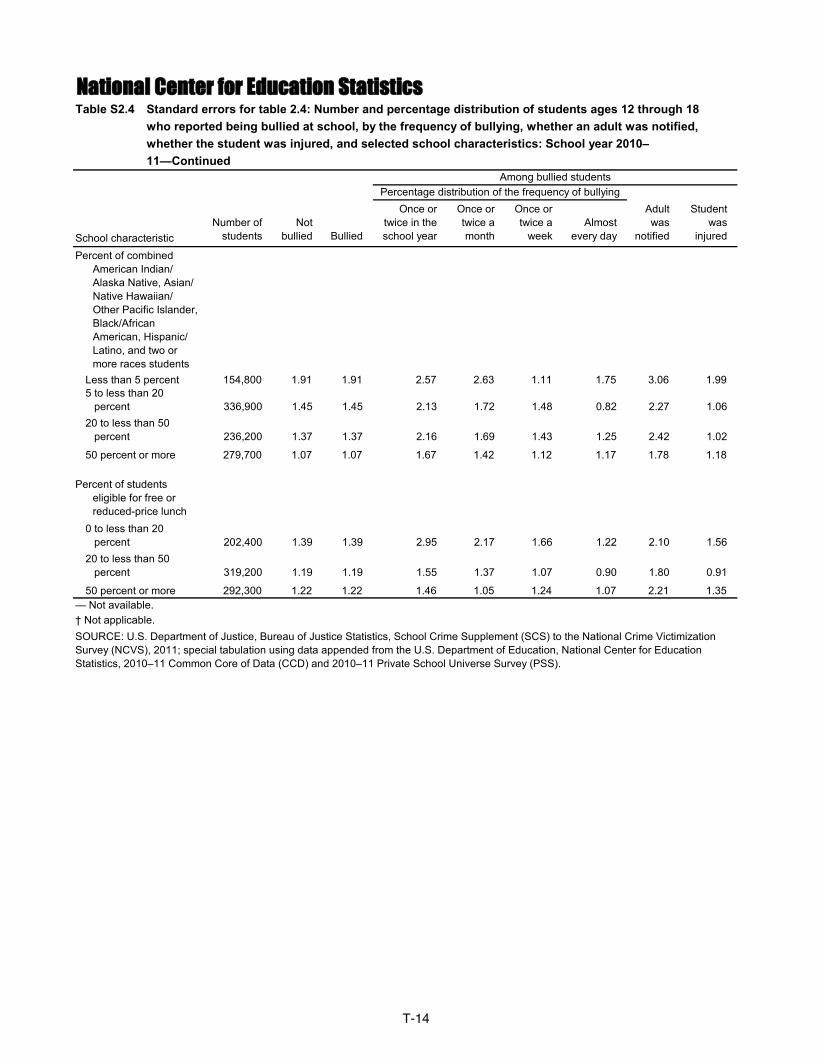
Table S2.4—Standard errors for table 2.4: Number and percentage distribution of students ages 12 through 18 Table S2.4—Table S2.4—
who reported being bullied at school, by the frequency of bullying, whether an adult was notified,whether the student was injured, and selected school characteristics: School year 2010–11
T-13
School characteristicNumber of
studentsNot
bullied Bullied
Once or twice in the school year
Once or twice a month
Once or twice a
weekAlmost
every day
Adult was
notified
Student was
injured
Percent of combined American Indian/ Alaska Native, Asian/ Native Hawaiian/ Other Pacific Islander, Black/African American, Hispanic/ Latino, and two or more races students
Less than 5 percent 154,800 1.91 1.91 2.57 2.63 1.11 1.75 3.06 1.995 to less than 20 percent 336,900 1.45 1.45 2.13 1.72 1.48 0.82 2.27 1.0620 to less than 50 percent 236,200 1.37 1.37 2.16 1.69 1.43 1.25 2.42 1.02
50 percent or more 279,700 1.07 1.07 1.67 1.42 1.12 1.17 1.78 1.18
Percent of students eligible for free or reduced-price lunch
0 to less than 20 percent 202,400 1.39 1.39 2.95 2.17 1.66 1.22 2.10 1.5620 to less than 50 percent 319,200 1.19 1.19 1.55 1.37 1.07 0.90 1.80 0.91
50 percent or more 292,300 1.22 1.22 1.46 1.05 1.24 1.07 2.21 1.35
Table S2.4—whether the student was injured, and selected school characteristics: School year 2010–Table S2.4—who reported being bullied at school, by the frequency of bullying, whether an adult was notified,Table S2.4—Standard errors for table 2.4: Number and percentage distribution of students ages 12 through 18 National Center for Education Statistics
SOURCE: U.S. Department of Justice, Bureau of Justice Statistics, School Crime Supplement (SCS) to the National Crime Victimization Survey (NCVS), 2011; special tabulation using data appended from the U.S. Department of Education, National Center for Education Statistics, 2010–11 Common Core of Data (CCD) and 2010–11 Private School Universe Survey (PSS).
† Not applicable.
Among bullied studentsPercentage distribution of the frequency of bullying
— Not available.
Table S2.4—11—Continued
T-14

Student characteristicNumber of
studentsNot
bullied Bullied
Made fun of, called names or
insultedSpread rumors
Threatened with harm
Pushed, shoved, tripped,
or spit on
Tried to make do
things they did
not want to do
Excluded from
activities on
purpose
Property destroyed
on purpose
Total bullied or not bullied 24,456,000 72.2 27.8 17.6 18.3 5.0 7.9 3.3 5.5 2.8
SexMale 12,610,000 75.5 24.5 16.2 13.2 5.0 8.9 3.6 4.8 3.3Female 11,846,000 68.6 31.4 19.1 23.8 5.1 6.8 3.0 6.4 2.3
Race/ethnicity1
White, not Hispanic or Latino 13,755,000 68.5 31.5 20.6 20.3 5.8 8.6 3.3 7.1 3.1Black, not Hispanic or Latino 3,605,000 72.8 27.2 16.4 18.6 5.5 9.3 4.3 4.7 3.3
Hispanic or Latino 5,301,000 78.1 21.9 12.7 15.1 3.3 6.2 2.9 2.8 2.4Asian, not Hispanic or Latino 935,000 85.1 14.9 9.0 7.7 ‡ 2.1 ! 2.7 ! 2.9 ! ‡ All other races, not Hispanic or Latino 861,000 76.3 23.7 15.0 17.0 6.5 7.2 ‡ 5.0 ! ‡
Grade2
6th 2,156,000 63.0 37.0 27.0 23.1 4.9 12.7 3.9 6.6 3.77th 3,726,000 69.7 30.3 22.4 18.3 6.9 12.6 4.5 7.8 4.08th 3,786,000 69.3 30.7 20.7 19.0 5.3 10.8 2.9 6.4 4.09th 3,827,000 73.5 26.5 16.4 16.3 5.4 7.3 3.3 4.1 2.510th 3,847,000 72.0 28.0 16.9 19.6 5.1 6.7 3.9 5.3 2.211th 3,541,000 76.2 23.8 12.7 17.1 4.0 3.9 2.4 4.7 1.812th 3,573,000 78.0 22.0 10.6 16.7 3.5 2.7 2.3 4.3 1.9
Household incomeLess than $7,500 733,000 69.4 30.6 20.7 20.7 7.4 11.8 2.7 ! 4.8 ! 3.8 !$7,500–14,999 1,103,000 69.2 30.8 21.7 23.8 6.9 11.2 3.2 ! 7.1 4.7$15,000–24,999 1,979,000 73.9 26.1 18.2 16.4 6.6 9.2 3.7 6.1 3.1$25,000–34,999 1,989,000 71.3 28.7 16.3 19.4 6.6 8.1 4.2 5.9 3.0$35,000–49,999 3,032,000 69.0 31.0 20.8 20.5 6.5 9.9 3.6 5.0 2.5$50,000 or more 10,595,000 71.8 28.2 17.2 18.4 4.0 7.1 3.1 6.2 2.7
National Center for Education Statistics
! Interpret data with caution. The standard error for this estimate is 30 to 50 percent of the estimate’s value.
SOURCE: U.S. Department of Justice, Bureau of Justice Statistics, School Crime Supplement (SCS) to the National Crime Victimization Survey (NCVS), 2011.
Table 2.5—Number and percentage distribution of students ages 12 through 18 who reported being bullied at
Type of bullying
‡ Reporting standards not met. The standard error for this estimate is equal to 50 percent or more of the estimate’s value.1 Respondents who identified themselves as being of Hispanic or Latino origin were classified as “Hispanic or Latino,” regardless of their race. “Black, not Hispanic or Latino” includes African Americans. “All other races, not Hispanic or Latino” includes Native Hawaiians or Other Pacific Islanders, American Indians or Alaska Natives, and respondents of two or more races (3 percent of all respondents).2 The School Crime Supplement sample includes students ages 12–18 and, therefore, might not be representative of students in 6th grade. Comparisons between students in 6th grade and those in other grades should be made with caution.NOTE: “Bullied” includes students being made fun of, called names, or insulted; being the subject of rumors; being threatened with harm; being pushed, shoved, tripped, or spit on; being pressured into doing things they did not want to do; being excluded from activities on purpose; and having property destroyed on purpose. “At school” includes the school building, school property, school bus, or going to and from school. Bullying types may sum to more than total because students could have experienced more than one type of bullying. Missing data are not shown for household income. Estimates are reported for 24,456,000 students for whom data on bullying are available. Detail may not sum to totals because of rounding and missing data. Population size for students ages 12–18 is 24,690,000.
Table 2.5—school, by type of bullying and selected student characteristics: School year 2010–11
T-15
Student characteristicNumber of
studentsNot
bullied Bullied
Made fun of, called names or
insultedSpread rumors
Threatened with harm
Pushed, shoved, tripped,
or spit on
Tried to make do
things they did not want
to do
Excluded from
activities on
purpose
Property destroyed
on purpose
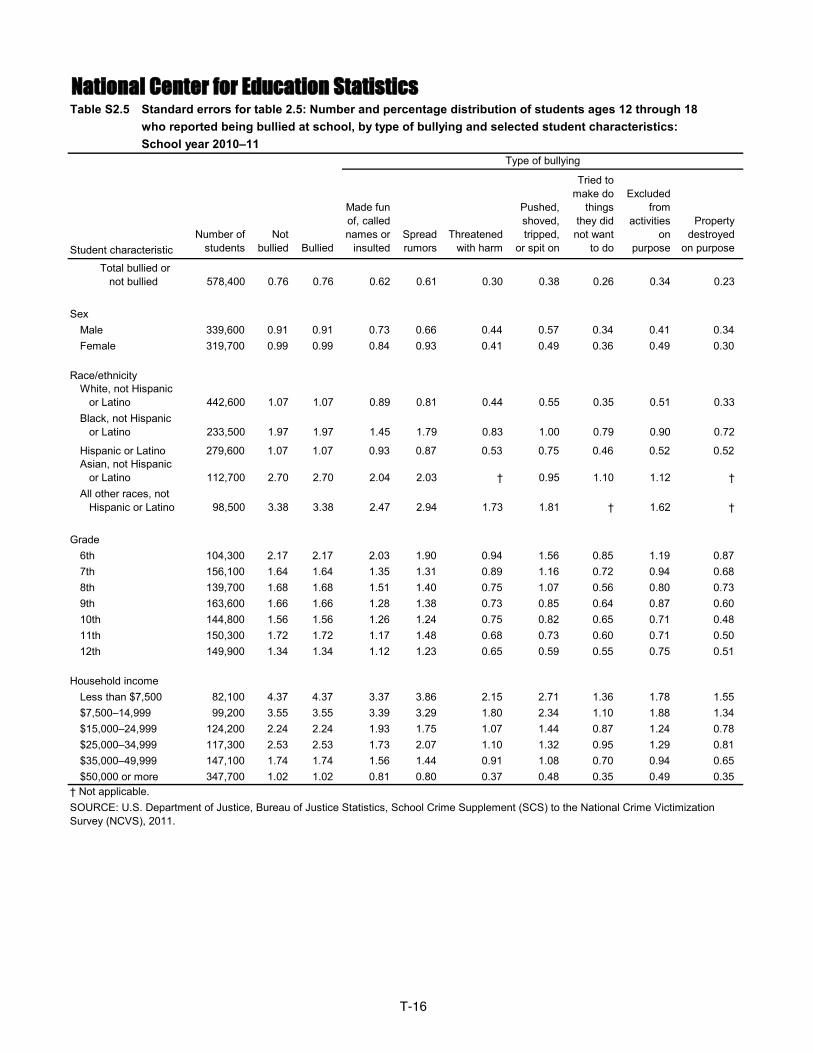
Total bullied or not bullied 578,400 0.76 0.76 0.62 0.61 0.30 0.38 0.26 0.34 0.23
SexMale 339,600 0.91 0.91 0.73 0.66 0.44 0.57 0.34 0.41 0.34Female 319,700 0.99 0.99 0.84 0.93 0.41 0.49 0.36 0.49 0.30
Race/ethnicityWhite, not Hispanic or Latino 442,600 1.07 1.07 0.89 0.81 0.44 0.55 0.35 0.51 0.33Black, not Hispanic or Latino 233,500 1.97 1.97 1.45 1.79 0.83 1.00 0.79 0.90 0.72
Hispanic or Latino 279,600 1.07 1.07 0.93 0.87 0.53 0.75 0.46 0.52 0.52Asian, not Hispanic or Latino 112,700 2.70 2.70 2.04 2.03 † 0.95 1.10 1.12 †All other races, not Hispanic or Latino 98,500 3.38 3.38 2.47 2.94 1.73 1.81 † 1.62 †
Grade6th 104,300 2.17 2.17 2.03 1.90 0.94 1.56 0.85 1.19 0.877th 156,100 1.64 1.64 1.35 1.31 0.89 1.16 0.72 0.94 0.688th 139,700 1.68 1.68 1.51 1.40 0.75 1.07 0.56 0.80 0.739th 163,600 1.66 1.66 1.28 1.38 0.73 0.85 0.64 0.87 0.6010th 144,800 1.56 1.56 1.26 1.24 0.75 0.82 0.65 0.71 0.4811th 150,300 1.72 1.72 1.17 1.48 0.68 0.73 0.60 0.71 0.5012th 149,900 1.34 1.34 1.12 1.23 0.65 0.59 0.55 0.75 0.51
Household incomeLess than $7,500 82,100 4.37 4.37 3.37 3.86 2.15 2.71 1.36 1.78 1.55$7,500–14,999 99,200 3.55 3.55 3.39 3.29 1.80 2.34 1.10 1.88 1.34$15,000–24,999 124,200 2.24 2.24 1.93 1.75 1.07 1.44 0.87 1.24 0.78$25,000–34,999 117,300 2.53 2.53 1.73 2.07 1.10 1.32 0.95 1.29 0.81$35,000–49,999 147,100 1.74 1.74 1.56 1.44 0.91 1.08 0.70 0.94 0.65$50,000 or more 347,700 1.02 1.02 0.81 0.80 0.37 0.48 0.35 0.49 0.35
National Center for Education Statistics
† Not applicable.SOURCE: U.S. Department of Justice, Bureau of Justice Statistics, School Crime Supplement (SCS) to the National Crime Victimization Survey (NCVS), 2011.
Type of bullyingTable S2.5—Table S2.5—
School year 2010–11who reported being bullied at school, by type of bullying and selected student characteristics:
Table S2.5—Standard errors for table 2.5: Number and percentage distribution of students ages 12 through 18
T-16

School characteristicNumber of
studentsNot
bullied Bullied
Made fun of, called names or
insultedSpread rumors
Threatened with harm
Pushed, shoved, tripped,
or spit on
Tried to make do
things they did not want
to do
Excluded from
activities on
purpose
Property destroyed
on purpose
Total bullied or not bullied 24,456,000 72.2 27.8 17.6 18.3 5.0 7.9 3.3 5.5 2.8
Region Northeast 3,844,000 76.6 23.4 14.3 14.6 3.5 5.8 2.4 5.0 2.9Midwest 5,397,000 70.3 29.7 19.7 19.2 6.3 8.0 2.9 7.3 2.3South 8,459,000 70.9 29.1 18.0 20.3 5.6 9.1 3.9 5.0 2.8West 5,659,000 72.1 27.9 17.5 17.7 4.3 7.4 3.2 4.6 2.8
SectorPublic 21,664,000 71.5 28.5 18.0 18.9 5.4 8.2 3.3 5.5 2.8Private 1,694,000 78.1 21.9 13.9 13.0 ‡ 4.4 2.5 4.9 1.5
Catholic 801,000 78.5 21.5 13.4 12.3 ‡ 3.8 ! ‡ 5.0 ‡Other religious 453,000 79.4 20.6 13.3 13.3 ‡ 3.9 ! 2.7 ! ‡ ‡Nonsectarian 312,000 78.3 21.7 11.5 12.9 ‡ 4.8 ‡ ‡ ‡
LocaleCity 7,061,000 74.7 25.3 16.3 16.2 5.1 7.7 3.2 4.2 2.6Suburb 7,948,000 72.6 27.4 17.1 17.9 4.0 7.5 3.4 5.2 2.5Town 2,827,000 69.0 31.0 18.8 20.5 6.2 7.9 3.8 5.9 3.1Rural 5,480,000 69.2 30.8 19.7 21.2 6.1 8.7 3.0 7.1 3.1
Level1
Primary 1,419,000 71.3 28.7 21.3 19.4 5.2 10.8 1.9 ! 7.9 3.1Middle 6,736,000 67.3 32.7 23.2 19.3 5.9 12.6 4.1 6.2 3.9High 13,475,000 74.5 25.5 14.5 17.6 4.8 5.3 2.9 4.5 1.9Other 1,450,000 71.0 29.0 17.1 21.4 4.5 7.3 4.4 8.0 2.8 !
Enrollment sizeLess than 300 2,747,000 70.6 29.4 18.9 21.3 6.8 10.5 2.6 7.1 2.4300–599 4,106,000 68.6 31.4 21.1 20.8 5.8 8.4 3.5 6.1 3.6600–999 5,770,000 70.2 29.8 19.9 18.0 5.0 9.3 3.6 5.8 3.31,000–1,499 4,353,000 72.4 27.6 17.2 19.0 5.2 7.8 3.8 5.1 2.61,500–1,999 2,892,000 73.8 26.2 13.5 17.3 4.7 6.5 3.0 5.0 1.92,000 or more 3,410,000 78.0 22.0 13.0 14.5 3.2 4.1 2.5 3.4 1.6
Student-to-full-time- equivalent (FTE) teacher ratio
Less than 13 students 4,083,000 72.7 27.3 16.8 18.1 4.9 8.1 3.2 5.9 3.013 to less than 16 students 6,517,000 70.3 29.7 18.8 19.5 5.6 8.3 3.4 5.4 2.716 to less than 20 students 6,981,000 72.2 27.8 18.6 18.4 5.3 8.5 3.1 5.9 3.1
20 or more students 5,398,000 73.2 26.8 15.6 17.5 4.1 6.1 3.4 4.5 1.7
National Center for Education Statistics
See notes at end of table.
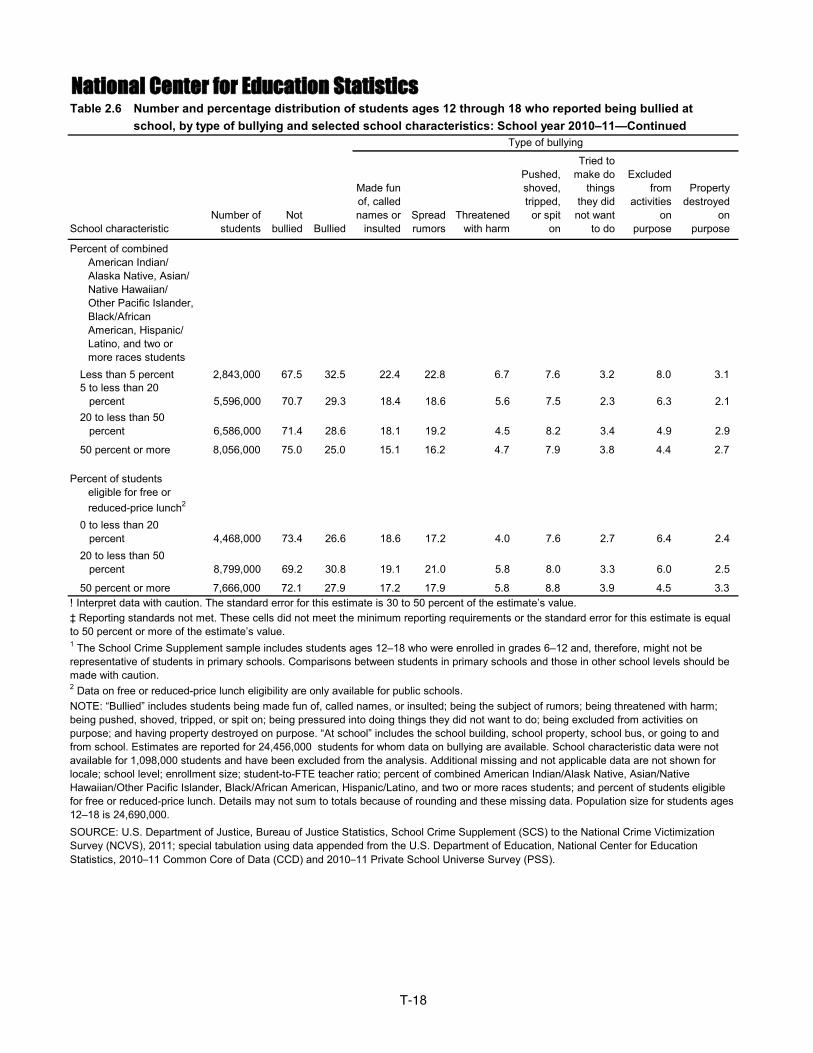
Table 2.6—Number and percentage distribution of students ages 12 through 18 who reported being bullied at
Type of bullyingTable 2.6—school, by type of bullying and selected school characteristics: School year 2010–11
T-17
School characteristicNumber of
studentsNot
bullied Bullied
Made fun of, called names or
insultedSpread rumors
Threatened with harm
Pushed, shoved, tripped,
or spit on
Tried to make do
things they did not want
to do
Excluded from
activities on
purpose
Property destroyed
on purpose
Percent of combined American Indian/ Alaska Native, Asian/ Native Hawaiian/ Other Pacific Islander, Black/African American, Hispanic/ Latino, and two or more races students
Less than 5 percent 2,843,000 67.5 32.5 22.4 22.8 6.7 7.6 3.2 8.0 3.15 to less than 20 percent 5,596,000 70.7 29.3 18.4 18.6 5.6 7.5 2.3 6.3 2.120 to less than 50 percent 6,586,000 71.4 28.6 18.1 19.2 4.5 8.2 3.4 4.9 2.9
50 percent or more 8,056,000 75.0 25.0 15.1 16.2 4.7 7.9 3.8 4.4 2.7
Percent of students eligible for free or reduced-price lunch2
0 to less than 20 percent 4,468,000 73.4 26.6 18.6 17.2 4.0 7.6 2.7 6.4 2.420 to less than 50 percent 8,799,000 69.2 30.8 19.1 21.0 5.8 8.0 3.3 6.0 2.5
50 percent or more 7,666,000 72.1 27.9 17.2 17.9 5.8 8.8 3.9 4.5 3.3
Type of bullying
! Interpret data with caution. The standard error for this estimate is 30 to 50 percent of the estimate’s value.
SOURCE: U.S. Department of Justice, Bureau of Justice Statistics, School Crime Supplement (SCS) to the National Crime Victimization Survey (NCVS), 2011; special tabulation using data appended from the U.S. Department of Education, National Center for Education Statistics, 2010–11 Common Core of Data (CCD) and 2010–11 Private School Universe Survey (PSS).
‡ Reporting standards not met. These cells did not meet the minimum reporting requirements or the standard error for this estimate is equal to 50 percent or more of the estimate’s value.1 The School Crime Supplement sample includes students ages 12–18 who were enrolled in grades 6–12 and, therefore, might not be representative of students in primary schools. Comparisons between students in primary schools and those in other school levels should be made with caution.2 Data on free or reduced-price lunch eligibility are only available for public schools.NOTE: “Bullied” includes students being made fun of, called names, or insulted; being the subject of rumors; being threatened with harm; being pushed, shoved, tripped, or spit on; being pressured into doing things they did not want to do; being excluded from activities on purpose; and having property destroyed on purpose. “At school” includes the school building, school property, school bus, or going to and from school. Estimates are reported for 24,456,000 students for whom data on bullying are available. School characteristic data were not available for 1,098,000 students and have been excluded from the analysis. Additional missing and not applicable data are not shown for locale; school level; enrollment size; student-to-FTE teacher ratio; percent of combined American Indian/Alask Native, Asian/Native Hawaiian/Other Pacific Islander, Black/African American, Hispanic/Latino, and two or more races students; and percent of students eligible for free or reduced-price lunch. Details may not sum to totals because of rounding and these missing data. Population size for students ages 12–18 is 24,690,000.
Table 2.6—school, by type of bullying and selected school characteristics: School year 2010–11—Continued
National Center for Education StatisticsTable 2.6—Number and percentage distribution of students ages 12 through 18 who reported being bullied at
T-18
School characteristicNumber of
studentsNot
bullied Bullied
Made fun of, called names or
insultedSpread rumors
Threatened with harm
Pushed, shoved, tripped,
or spit on
Tried to make do
things they did not want
to do
Excluded from
activities on
purpose
Property destroyed
on purpose
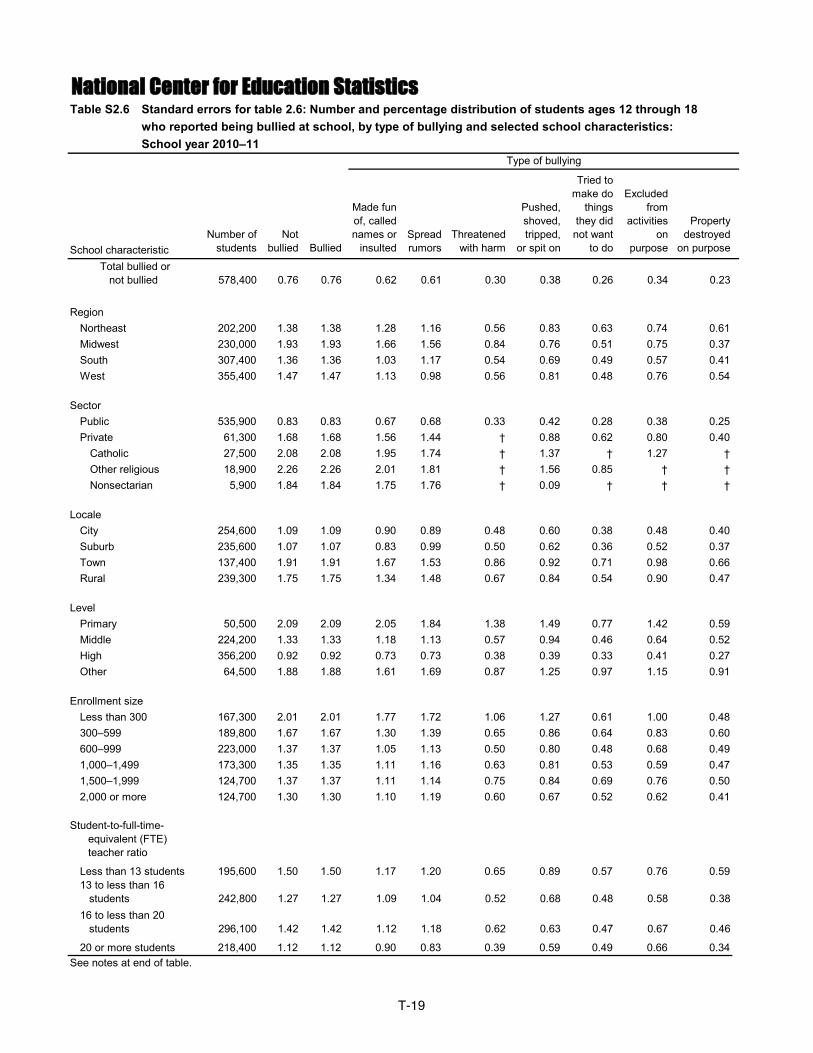
Total bullied or not bullied 578,400 0.76 0.76 0.62 0.61 0.30 0.38 0.26 0.34 0.23
Region Northeast 202,200 1.38 1.38 1.28 1.16 0.56 0.83 0.63 0.74 0.61Midwest 230,000 1.93 1.93 1.66 1.56 0.84 0.76 0.51 0.75 0.37South 307,400 1.36 1.36 1.03 1.17 0.54 0.69 0.49 0.57 0.41West 355,400 1.47 1.47 1.13 0.98 0.56 0.81 0.48 0.76 0.54
SectorPublic 535,900 0.83 0.83 0.67 0.68 0.33 0.42 0.28 0.38 0.25Private 61,300 1.68 1.68 1.56 1.44 † 0.88 0.62 0.80 0.40
Catholic 27,500 2.08 2.08 1.95 1.74 † 1.37 † 1.27 †Other religious 18,900 2.26 2.26 2.01 1.81 † 1.56 0.85 † †Nonsectarian 5,900 1.84 1.84 1.75 1.76 † 0.09 † † †
LocaleCity 254,600 1.09 1.09 0.90 0.89 0.48 0.60 0.38 0.48 0.40Suburb 235,600 1.07 1.07 0.83 0.99 0.50 0.62 0.36 0.52 0.37Town 137,400 1.91 1.91 1.67 1.53 0.86 0.92 0.71 0.98 0.66Rural 239,300 1.75 1.75 1.34 1.48 0.67 0.84 0.54 0.90 0.47
LevelPrimary 50,500 2.09 2.09 2.05 1.84 1.38 1.49 0.77 1.42 0.59Middle 224,200 1.33 1.33 1.18 1.13 0.57 0.94 0.46 0.64 0.52High 356,200 0.92 0.92 0.73 0.73 0.38 0.39 0.33 0.41 0.27Other 64,500 1.88 1.88 1.61 1.69 0.87 1.25 0.97 1.15 0.91
Enrollment sizeLess than 300 167,300 2.01 2.01 1.77 1.72 1.06 1.27 0.61 1.00 0.48300–599 189,800 1.67 1.67 1.30 1.39 0.65 0.86 0.64 0.83 0.60600–999 223,000 1.37 1.37 1.05 1.13 0.50 0.80 0.48 0.68 0.491,000–1,499 173,300 1.35 1.35 1.11 1.16 0.63 0.81 0.53 0.59 0.471,500–1,999 124,700 1.37 1.37 1.11 1.14 0.75 0.84 0.69 0.76 0.502,000 or more 124,700 1.30 1.30 1.10 1.19 0.60 0.67 0.52 0.62 0.41
Student-to-full-time- equivalent (FTE) teacher ratio
Less than 13 students 195,600 1.50 1.50 1.17 1.20 0.65 0.89 0.57 0.76 0.5913 to less than 16 students 242,800 1.27 1.27 1.09 1.04 0.52 0.68 0.48 0.58 0.3816 to less than 20 students 296,100 1.42 1.42 1.12 1.18 0.62 0.63 0.47 0.67 0.46
20 or more students 218,400 1.12 1.12 0.90 0.83 0.39 0.59 0.49 0.66 0.34
National Center for Education Statistics
See notes at end of table.
Table S2.6—Standard errors for table 2.6: Number and percentage distribution of students ages 12 through 18
Type of bullying
Table S2.6—Table S2.6—
who reported being bullied at school, by type of bullying and selected school characteristics:School year 2010–11
T-19
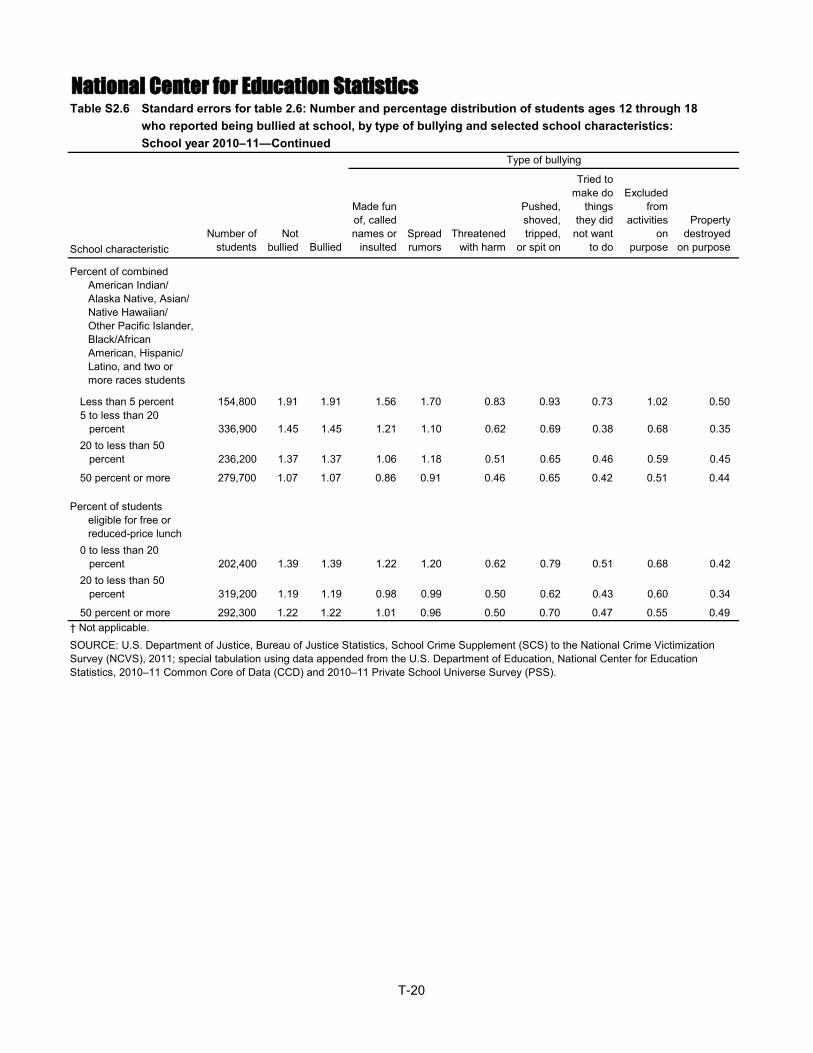
School characteristicNumber of
studentsNot
bullied Bullied
Made fun of, called names or
insultedSpread rumors
Threatened with harm
Pushed, shoved, tripped,
or spit on
Tried to make do
things they did not want
to do
Excluded from
activities on
purpose
Property destroyed
on purpose
Percent of combined American Indian/ Alaska Native, Asian/ Native Hawaiian/ Other Pacific Islander, Black/African American, Hispanic/ Latino, and two or more races students
Less than 5 percent 154,800 1.91 1.91 1.56 1.70 0.83 0.93 0.73 1.02 0.505 to less than 20 percent 336,900 1.45 1.45 1.21 1.10 0.62 0.69 0.38 0.68 0.3520 to less than 50 percent 236,200 1.37 1.37 1.06 1.18 0.51 0.65 0.46 0.59 0.45
50 percent or more 279,700 1.07 1.07 0.86 0.91 0.46 0.65 0.42 0.51 0.44
Percent of students eligible for free or reduced-price lunch
0 to less than 20 percent 202,400 1.39 1.39 1.22 1.20 0.62 0.79 0.51 0.68 0.4220 to less than 50 percent 319,200 1.19 1.19 0.98 0.99 0.50 0.62 0.43 0.60 0.34
50 percent or more 292,300 1.22 1.22 1.01 0.96 0.50 0.70 0.47 0.55 0.49
SOURCE: U.S. Department of Justice, Bureau of Justice Statistics, School Crime Supplement (SCS) to the National Crime Victimization Survey (NCVS), 2011; special tabulation using data appended from the U.S. Department of Education, National Center for Education Statistics, 2010–11 Common Core of Data (CCD) and 2010–11 Private School Universe Survey (PSS).
† Not applicable.
National Center for Education Statistics
Type of bullying
Table S2.6—who reported being bullied at school, by type of bullying and selected school characteristics:Table S2.6—School year 2010–11—Continued
Table S2.6—Standard errors for table 2.6: Number and percentage distribution of students ages 12 through 18
T-20
Student characteristicNumber of
studentsNot cyber-
bulliedCyber-bullied
Once or twice in the school year
Once or twice a month
Once or twice a
weekAlmost
every dayAdult was
notified
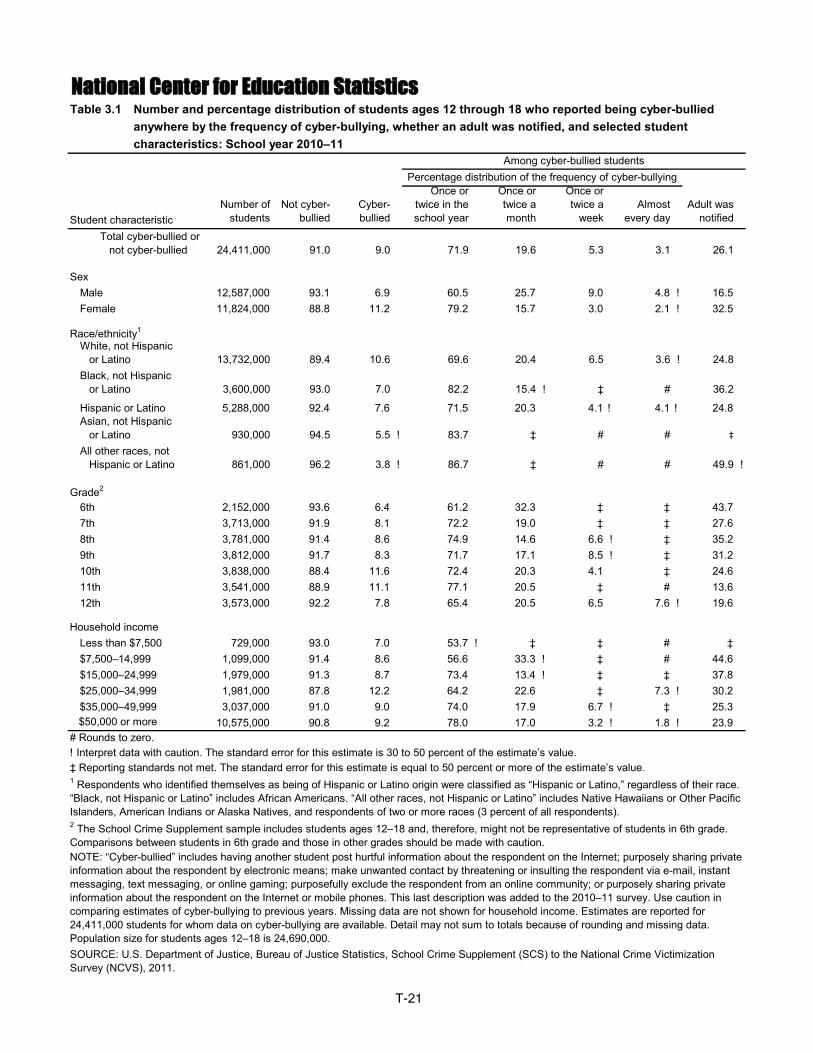
Total cyber-bullied or not cyber-bullied 24,411,000 91.0 9.0 71.9 19.6 5.3 3.1 26.1
SexMale 12,587,000 93.1 6.9 60.5 25.7 9.0 4.8 ! 16.5Female 11,824,000 88.8 11.2 79.2 15.7 3.0 2.1 ! 32.5
Race/ethnicity1
White, not Hispanic or Latino 13,732,000 89.4 10.6 69.6 20.4 6.5 3.6 ! 24.8Black, not Hispanic or Latino 3,600,000 93.0 7.0 82.2 15.4 ! ‡ # 36.2
Hispanic or Latino 5,288,000 92.4 7.6 71.5 20.3 4.1 ! 4.1 ! 24.8Asian, not Hispanic or Latino 930,000 94.5 5.5 ! 83.7 ‡ # # ‡All other races, not Hispanic or Latino 861,000 96.2 3.8 ! 86.7 ‡ # # 49.9 !
Grade2
6th 2,152,000 93.6 6.4 61.2 32.3 ‡ ‡ 43.77th 3,713,000 91.9 8.1 72.2 19.0 ‡ ‡ 27.68th 3,781,000 91.4 8.6 74.9 14.6 6.6 ! ‡ 35.29th 3,812,000 91.7 8.3 71.7 17.1 8.5 ! ‡ 31.210th 3,838,000 88.4 11.6 72.4 20.3 4.1 ‡ 24.611th 3,541,000 88.9 11.1 77.1 20.5 ‡ # 13.612th 3,573,000 92.2 7.8 65.4 20.5 6.5 7.6 ! 19.6
Household incomeLess than $7,500 729,000 93.0 7.0 53.7 ! ‡ ‡ # ‡$7,500–14,999 1,099,000 91.4 8.6 56.6 33.3 ! ‡ # 44.6$15,000–24,999 1,979,000 91.3 8.7 73.4 13.4 ! ‡ ‡ 37.8$25,000–34,999 1,981,000 87.8 12.2 64.2 22.6 ‡ 7.3 ! 30.2$35,000–49,999 3,037,000 91.0 9.0 74.0 17.9 6.7 ! ‡ 25.3
$50,000 or more 10,575,000 90.8 9.2 78.0 17.0 3.2 ! 1.8 ! 23.9
National Center for Education Statistics
1 Respondents who identified themselves as being of Hispanic or Latino origin were classified as “Hispanic or Latino,” regardless of their race. “Black, not Hispanic or Latino” includes African Americans. “All other races, not Hispanic or Latino” includes Native Hawaiians or Other Pacific Islanders, American Indians or Alaska Natives, and respondents of two or more races (3 percent of all respondents).2 The School Crime Supplement sample includes students ages 12–18 and, therefore, might not be representative of students in 6th grade. Comparisons between students in 6th grade and those in other grades should be made with caution.NOTE: “Cyber-bullied” includes having another student post hurtful information about the respondent on the Internet; purposely sharing private information about the respondent by electronic means; make unwanted contact by threatening or insulting the respondent via e-mail, instant messaging, text messaging, or online gaming; purposefully exclude the respondent from an online community; or purposely sharing private information about the respondent on the Internet or mobile phones. This last description was added to the 2010–11 survey. Use caution in comparing estimates of cyber-bullying to previous years. Missing data are not shown for household income. Estimates are reported for 24,411,000 students for whom data on cyber-bullying are available. Detail may not sum to totals because of rounding and missing data. Population size for students ages 12–18 is 24,690,000.SOURCE: U.S. Department of Justice, Bureau of Justice Statistics, School Crime Supplement (SCS) to the National Crime Victimization Survey (NCVS), 2011.
Table 3.1—Number and percentage distribution of students ages 12 through 18 who reported being cyber-bullied
Among cyber-bullied studentsPercentage distribution of the frequency of cyber-bullying
# Rounds to zero.! Interpret data with caution. The standard error for this estimate is 30 to 50 percent of the estimate’s value.‡ Reporting standards not met. The standard error for this estimate is equal to 50 percent or more of the estimate’s value.
Table 3.1—Table 3.1—
anywhere by the frequency of cyber-bullying, whether an adult was notified, and selected studentcharacteristics: School year 2010–11
T-21
National Center for Education Statistics
Student characteristicNumber of
studentsNot cyber-
bulliedCyber-bullied
Once or twice in the school year
Once or twice a month
Once or twice a
weekAlmost
every dayAdult was
notified
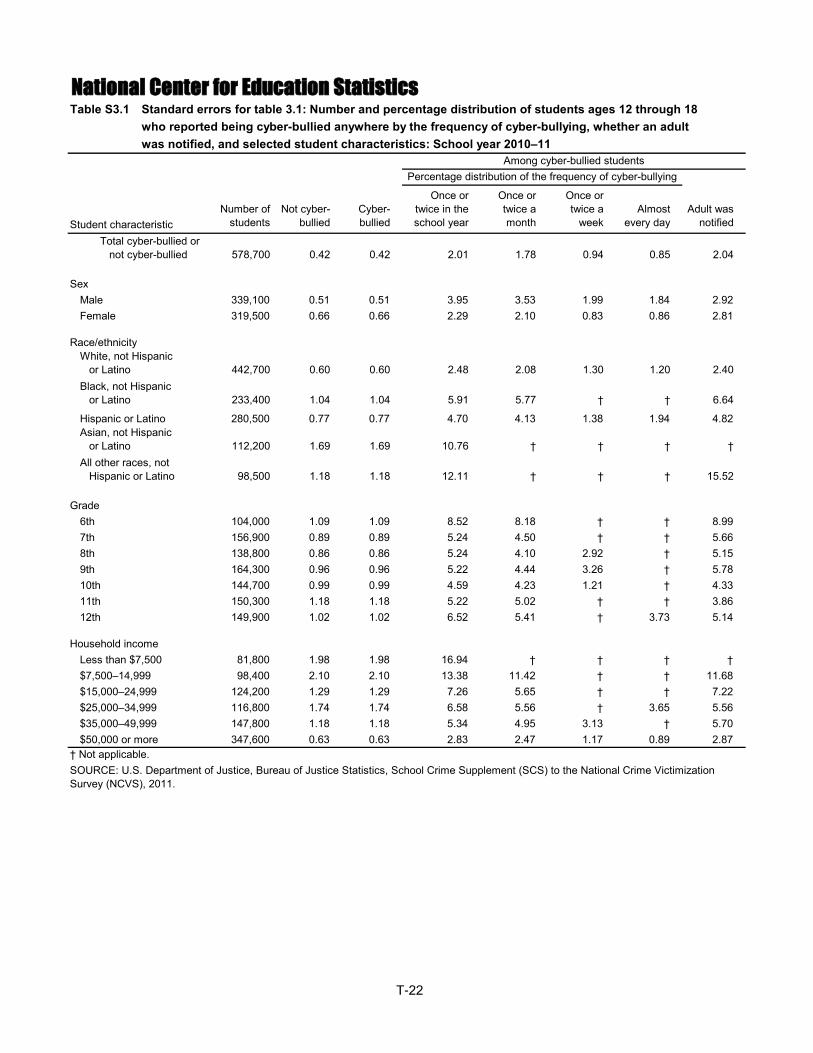
Total cyber-bullied or not cyber-bullied 578,700 0.42 0.42 2.01 1.78 0.94 0.85 2.04
SexMale 339,100 0.51 0.51 3.95 3.53 1.99 1.84 2.92Female 319,500 0.66 0.66 2.29 2.10 0.83 0.86 2.81
Race/ethnicityWhite, not Hispanic or Latino 442,700 0.60 0.60 2.48 2.08 1.30 1.20 2.40Black, not Hispanic or Latino 233,400 1.04 1.04 5.91 5.77 † † 6.64
Hispanic or Latino 280,500 0.77 0.77 4.70 4.13 1.38 1.94 4.82Asian, not Hispanic or Latino 112,200 1.69 1.69 10.76 † † † †All other races, not Hispanic or Latino 98,500 1.18 1.18 12.11 † † † 15.52
Grade6th 104,000 1.09 1.09 8.52 8.18 † † 8.997th 156,900 0.89 0.89 5.24 4.50 † † 5.668th 138,800 0.86 0.86 5.24 4.10 2.92 † 5.159th 164,300 0.96 0.96 5.22 4.44 3.26 † 5.7810th 144,700 0.99 0.99 4.59 4.23 1.21 † 4.3311th 150,300 1.18 1.18 5.22 5.02 † † 3.8612th 149,900 1.02 1.02 6.52 5.41 † 3.73 5.14
Household incomeLess than $7,500 81,800 1.98 1.98 16.94 † † † †$7,500–14,999 98,400 2.10 2.10 13.38 11.42 † † 11.68$15,000–24,999 124,200 1.29 1.29 7.26 5.65 † † 7.22$25,000–34,999 116,800 1.74 1.74 6.58 5.56 † 3.65 5.56$35,000–49,999 147,800 1.18 1.18 5.34 4.95 3.13 † 5.70$50,000 or more 347,600 0.63 0.63 2.83 2.47 1.17 0.89 2.87
SOURCE: U.S. Department of Justice, Bureau of Justice Statistics, School Crime Supplement (SCS) to the National Crime Victimization Survey (NCVS), 2011.
† Not applicable.
Among cyber-bullied studentsPercentage distribution of the frequency of cyber-bullying
Table S3.1—Standard errors for table 3.1: Number and percentage distribution of students ages 12 through 18 Table S3.1—Table S3.1—
who reported being cyber-bullied anywhere by the frequency of cyber-bullying, whether an adultwas notified, and selected student characteristics: School year 2010–11
T-22
School characteristicNumber of
studentsNot cyber-
bulliedCyber-bullied
Once or twice in the school
year
Once or twice a month
Once or twice a
weekAlmost
every dayAdult was
notified
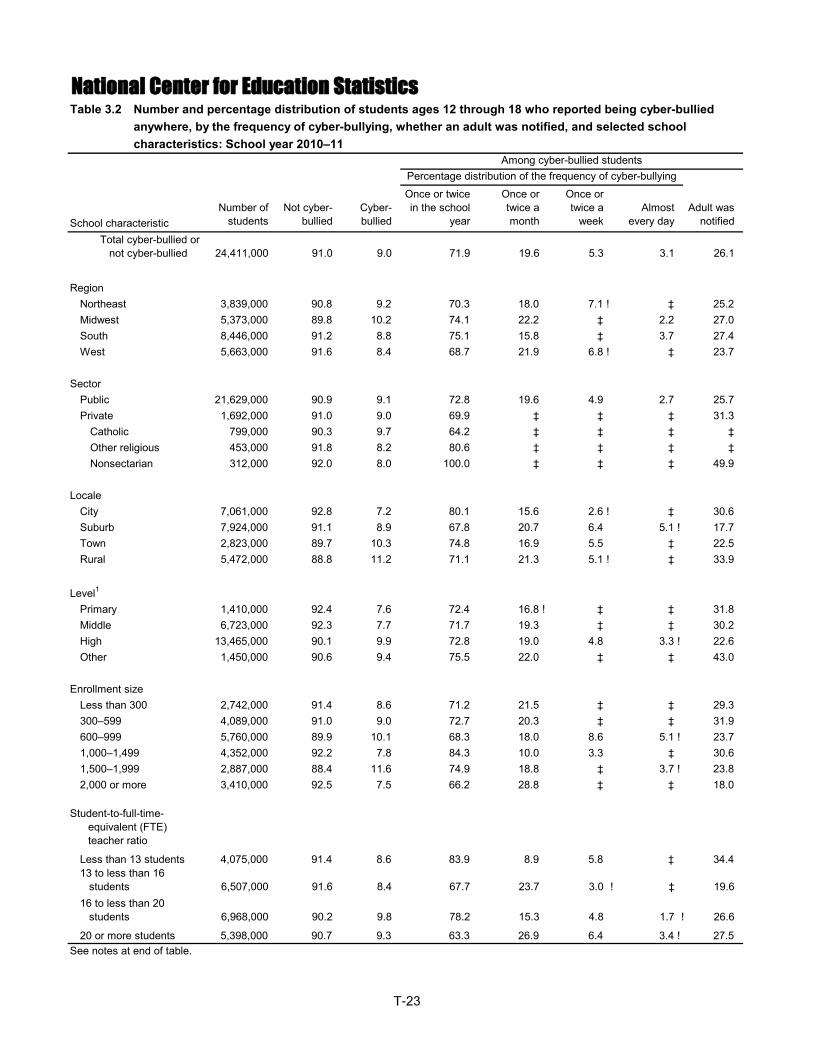
Total cyber-bullied or not cyber-bullied 24,411,000 91.0 9.0 71.9 19.6 5.3 3.1 26.1
Region Northeast 3,839,000 90.8 9.2 70.3 18.0 7.1 ! ‡ 25.2Midwest 5,373,000 89.8 10.2 74.1 22.2 ‡ 2.2 27.0South 8,446,000 91.2 8.8 75.1 15.8 ‡ 3.7 27.4West 5,663,000 91.6 8.4 68.7 21.9 6.8 ! ‡ 23.7
SectorPublic 21,629,000 90.9 9.1 72.8 19.6 4.9 2.7 25.7Private 1,692,000 91.0 9.0 69.9 ‡ ‡ ‡ 31.3
Catholic 799,000 90.3 9.7 64.2 ‡ ‡ ‡ ‡Other religious 453,000 91.8 8.2 80.6 ‡ ‡ ‡ ‡Nonsectarian 312,000 92.0 8.0 100.0 ‡ ‡ ‡ 49.9
LocaleCity 7,061,000 92.8 7.2 80.1 15.6 2.6 ! ‡ 30.6Suburb 7,924,000 91.1 8.9 67.8 20.7 6.4 5.1 ! 17.7Town 2,823,000 89.7 10.3 74.8 16.9 5.5 ‡ 22.5Rural 5,472,000 88.8 11.2 71.1 21.3 5.1 ! ‡ 33.9
Level1
Primary 1,410,000 92.4 7.6 72.4 16.8 ! ‡ ‡ 31.8Middle 6,723,000 92.3 7.7 71.7 19.3 ‡ ‡ 30.2High 13,465,000 90.1 9.9 72.8 19.0 4.8 3.3 ! 22.6Other 1,450,000 90.6 9.4 75.5 22.0 ‡ ‡ 43.0
Enrollment sizeLess than 300 2,742,000 91.4 8.6 71.2 21.5 ‡ ‡ 29.3300–599 4,089,000 91.0 9.0 72.7 20.3 ‡ ‡ 31.9600–999 5,760,000 89.9 10.1 68.3 18.0 8.6 5.1 ! 23.71,000–1,499 4,352,000 92.2 7.8 84.3 10.0 3.3 ‡ 30.61,500–1,999 2,887,000 88.4 11.6 74.9 18.8 ‡ 3.7 ! 23.82,000 or more 3,410,000 92.5 7.5 66.2 28.8 ‡ ‡ 18.0
Student-to-full-time- equivalent (FTE) teacher ratio
Less than 13 students 4,075,000 91.4 8.6 83.9 8.9 5.8 ‡ 34.413 to less than 16 students 6,507,000 91.6 8.4 67.7 23.7 3.0 ! ‡ 19.616 to less than 20 students 6,968,000 90.2 9.8 78.2 15.3 4.8 1.7 ! 26.6
20 or more students 5,398,000 90.7 9.3 63.3 26.9 6.4 3.4 ! 27.5
Table 3.2—Number and percentage distribution of students ages 12 through 18 who reported being cyber-bullied
Among cyber-bullied studentsPercentage distribution of the frequency of cyber-bullying
National Center for Education Statistics
See notes at end of table.
Table 3.2—Table 3.2—
anywhere, by the frequency of cyber-bullying, whether an adult was notified, and selected schoolcharacteristics: School year 2010–11
T-23
School characteristicNumber of
studentsNot cyber-
bulliedCyber-bullied
Once or twice in the school
year
Once or twice a month
Once or twice a
weekAlmost
every dayAdult was
notified
Percent of combined American Indian/ Alaska Native, Asian/ Native Hawaiian/ Other Pacific Islander, Black/African American, Hispanic/ Latino, and two or more races students
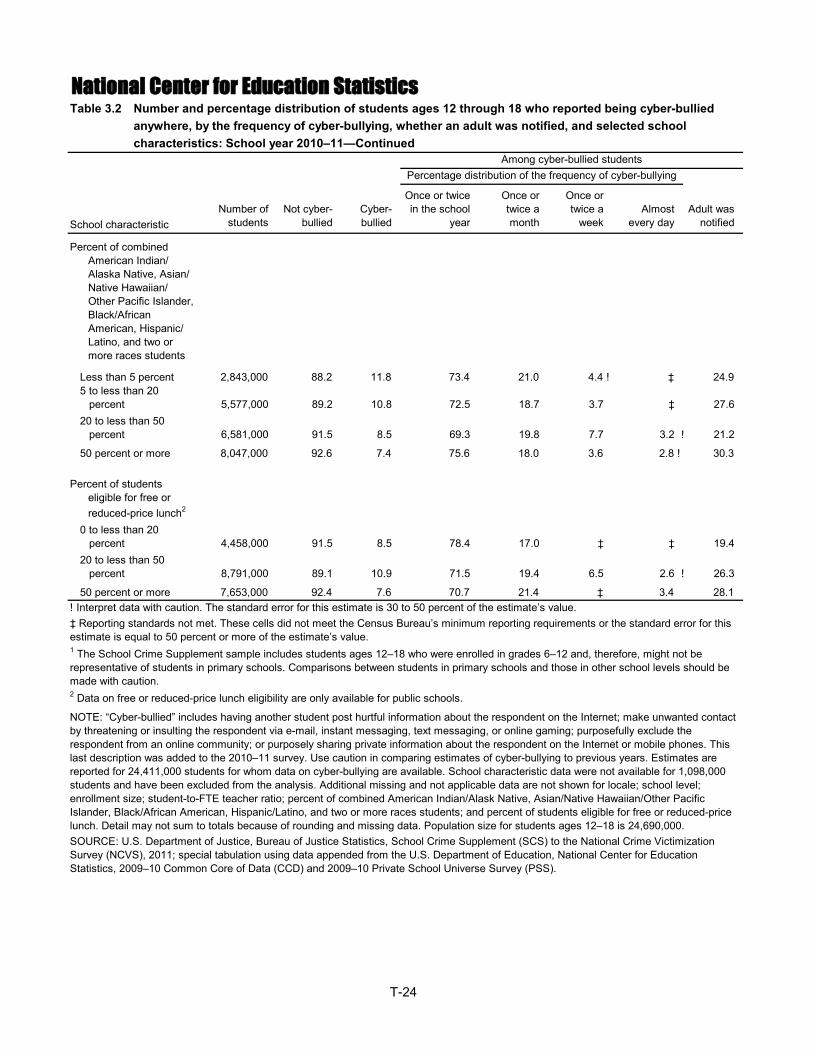
Less than 5 percent 2,843,000 88.2 11.8 73.4 21.0 4.4 ! ‡ 24.95 to less than 20 percent 5,577,000 89.2 10.8 72.5 18.7 3.7 ‡ 27.620 to less than 50 percent 6,581,000 91.5 8.5 69.3 19.8 7.7 3.2 ! 21.2
50 percent or more 8,047,000 92.6 7.4 75.6 18.0 3.6 2.8 ! 30.3
Percent of students eligible for free or reduced-price lunch2
0 to less than 20 percent 4,458,000 91.5 8.5 78.4 17.0 ‡ ‡ 19.420 to less than 50 percent 8,791,000 89.1 10.9 71.5 19.4 6.5 2.6 ! 26.3
50 percent or more 7,653,000 92.4 7.6 70.7 21.4 ‡ 3.4 28.1
2 Data on free or reduced-price lunch eligibility are only available for public schools.
NOTE: “Cyber-bullied” includes having another student post hurtful information about the respondent on the Internet; make unwanted contact by threatening or insulting the respondent via e-mail, instant messaging, text messaging, or online gaming; purposefully exclude the respondent from an online community; or purposely sharing private information about the respondent on the Internet or mobile phones. This last description was added to the 2010–11 survey. Use caution in comparing estimates of cyber-bullying to previous years. Estimates are reported for 24,411,000 students for whom data on cyber-bullying are available. School characteristic data were not available for 1,098,000 students and have been excluded from the analysis. Additional missing and not applicable data are not shown for locale; school level; enrollment size; student-to-FTE teacher ratio; percent of combined American Indian/Alask Native, Asian/Native Hawaiian/Other Pacific Islander, Black/African American, Hispanic/Latino, and two or more races students; and percent of students eligible for free or reduced-price lunch. Detail may not sum to totals because of rounding and missing data. Population size for students ages 12–18 is 24,690,000.SOURCE: U.S. Department of Justice, Bureau of Justice Statistics, School Crime Supplement (SCS) to the National Crime Victimization Survey (NCVS), 2011; special tabulation using data appended from the U.S. Department of Education, National Center for Education Statistics, 2009–10 Common Core of Data (CCD) and 2009–10 Private School Universe Survey (PSS).
! Interpret data with caution. The standard error for this estimate is 30 to 50 percent of the estimate’s value.‡ Reporting standards not met. These cells did not meet the Census Bureau’s minimum reporting requirements or the standard error for this estimate is equal to 50 percent or more of the estimate’s value.1 The School Crime Supplement sample includes students ages 12–18 who were enrolled in grades 6–12 and, therefore, might not be representative of students in primary schools. Comparisons between students in primary schools and those in other school levels should be made with caution.
Percentage distribution of the frequency of cyber-bullying
National Center for Education StatisticsTable 3.2—Number and percentage distribution of students ages 12 through 18 who reported being cyber-bullied
Among cyber-bullied students
Table 3.2—anywhere, by the frequency of cyber-bullying, whether an adult was notified, and selected schoolTable 3.2—characteristics: School year 2010–11—Continued
T-24
School characteristicNumber of
studentsNot cyber-
bulliedCyber-bullied
Once or twice in the school
year
Once or twice a month
Once or twice a
weekAlmost
every dayAdult was
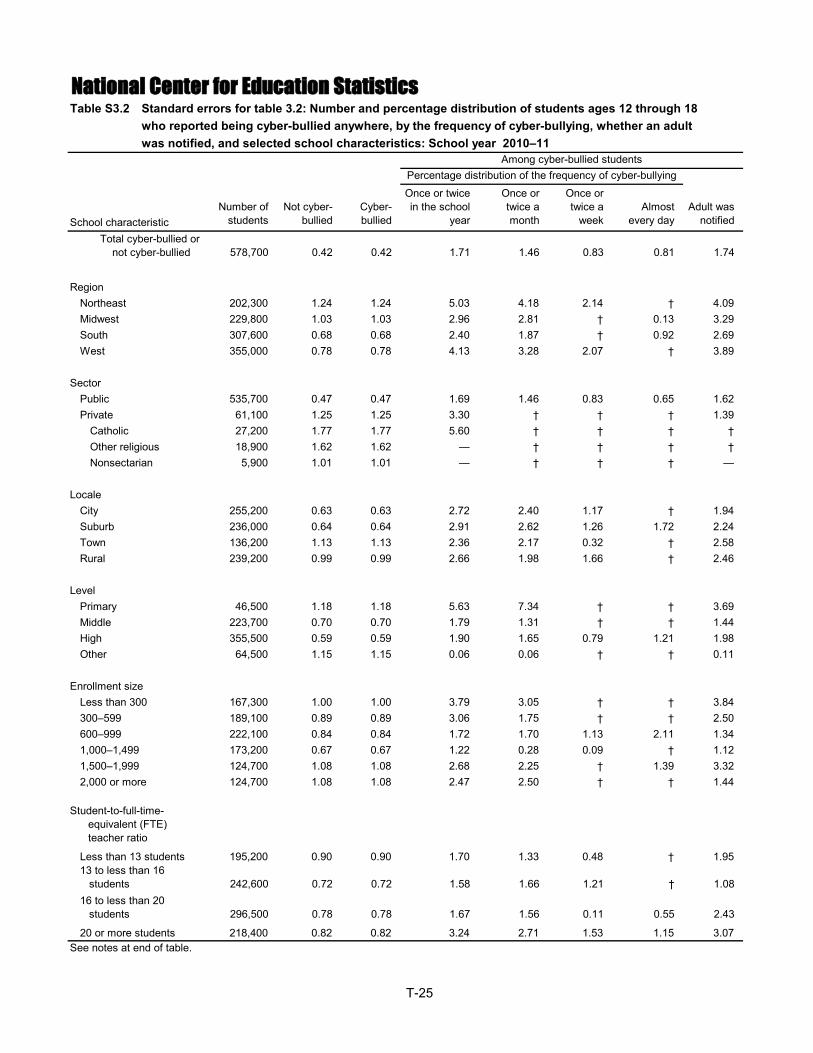
notified
Total cyber-bullied or not cyber-bullied 578,700 0.42 0.42 1.71 1.46 0.83 0.81 1.74
Region Northeast 202,300 1.24 1.24 5.03 4.18 2.14 † 4.09Midwest 229,800 1.03 1.03 2.96 2.81 † 0.13 3.29South 307,600 0.68 0.68 2.40 1.87 † 0.92 2.69West 355,000 0.78 0.78 4.13 3.28 2.07 † 3.89
SectorPublic 535,700 0.47 0.47 1.69 1.46 0.83 0.65 1.62Private 61,100 1.25 1.25 3.30 † † † 1.39
Catholic 27,200 1.77 1.77 5.60 † † † †Other religious 18,900 1.62 1.62 — † † † †Nonsectarian 5,900 1.01 1.01 — † † † —
LocaleCity 255,200 0.63 0.63 2.72 2.40 1.17 † 1.94Suburb 236,000 0.64 0.64 2.91 2.62 1.26 1.72 2.24Town 136,200 1.13 1.13 2.36 2.17 0.32 † 2.58Rural 239,200 0.99 0.99 2.66 1.98 1.66 † 2.46
LevelPrimary 46,500 1.18 1.18 5.63 7.34 † † 3.69Middle 223,700 0.70 0.70 1.79 1.31 † † 1.44High 355,500 0.59 0.59 1.90 1.65 0.79 1.21 1.98Other 64,500 1.15 1.15 0.06 0.06 † † 0.11
Enrollment sizeLess than 300 167,300 1.00 1.00 3.79 3.05 † † 3.84300–599 189,100 0.89 0.89 3.06 1.75 † † 2.50600–999 222,100 0.84 0.84 1.72 1.70 1.13 2.11 1.341,000–1,499 173,200 0.67 0.67 1.22 0.28 0.09 † 1.121,500–1,999 124,700 1.08 1.08 2.68 2.25 † 1.39 3.322,000 or more 124,700 1.08 1.08 2.47 2.50 † † 1.44
Student-to-full-time- equivalent (FTE) teacher ratio
Less than 13 students 195,200 0.90 0.90 1.70 1.33 0.48 † 1.9513 to less than 16 students 242,600 0.72 0.72 1.58 1.66 1.21 † 1.0816 to less than 20 students 296,500 0.78 0.78 1.67 1.56 0.11 0.55 2.43
20 or more students 218,400 0.82 0.82 3.24 2.71 1.53 1.15 3.07
National Center for Education Statistics
See notes at end of table.
Table S3.2—Standard errors for table 3.2: Number and percentage distribution of students ages 12 through 18
Among cyber-bullied studentsPercentage distribution of the frequency of cyber-bullying
Table S3.2—Table S3.2—
who reported being cyber-bullied anywhere, by the frequency of cyber-bullying, whether an adultwas notified, and selected school characteristics: School year 2010–11
T-25
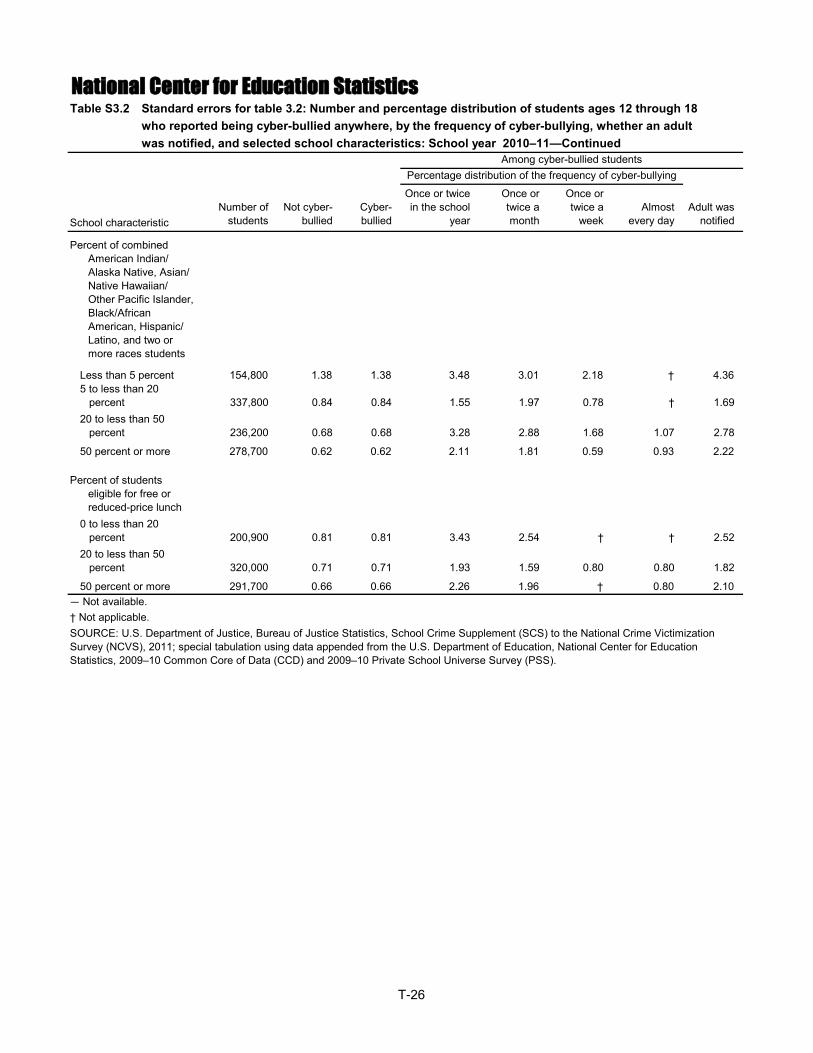
School characteristicNumber of
studentsNot cyber-
bulliedCyber-bullied
Once or twice in the school
year
Once or twice a month
Once or twice a
weekAlmost
every dayAdult was
notified
Percent of combined American Indian/ Alaska Native, Asian/ Native Hawaiian/ Other Pacific Islander, Black/African American, Hispanic/ Latino, and two or more races students
Less than 5 percent 154,800 1.38 1.38 3.48 3.01 2.18 † 4.365 to less than 20 percent 337,800 0.84 0.84 1.55 1.97 0.78 † 1.6920 to less than 50 percent 236,200 0.68 0.68 3.28 2.88 1.68 1.07 2.78
50 percent or more 278,700 0.62 0.62 2.11 1.81 0.59 0.93 2.22
Percent of students eligible for free or reduced-price lunch
0 to less than 20 percent 200,900 0.81 0.81 3.43 2.54 † † 2.5220 to less than 50 percent 320,000 0.71 0.71 1.93 1.59 0.80 0.80 1.82
50 percent or more 291,700 0.66 0.66 2.26 1.96 † 0.80 2.10— Not available.† Not applicable.SOURCE: U.S. Department of Justice, Bureau of Justice Statistics, School Crime Supplement (SCS) to the National Crime Victimization Survey (NCVS), 2011; special tabulation using data appended from the U.S. Department of Education, National Center for Education Statistics, 2009–10 Common Core of Data (CCD) and 2009–10 Private School Universe Survey (PSS).
National Center for Education StatisticsTable S3.2—Standard errors for table 3.2: Number and percentage distribution of students ages 12 through 18
Among cyber-bullied studentsPercentage distribution of the frequency of cyber-bullying
Table S3.2—who reported being cyber-bullied anywhere, by the frequency of cyber-bullying, whether an adult Table S3.2—was notified, and selected school characteristics: School year 2010–11—Continued
T-26
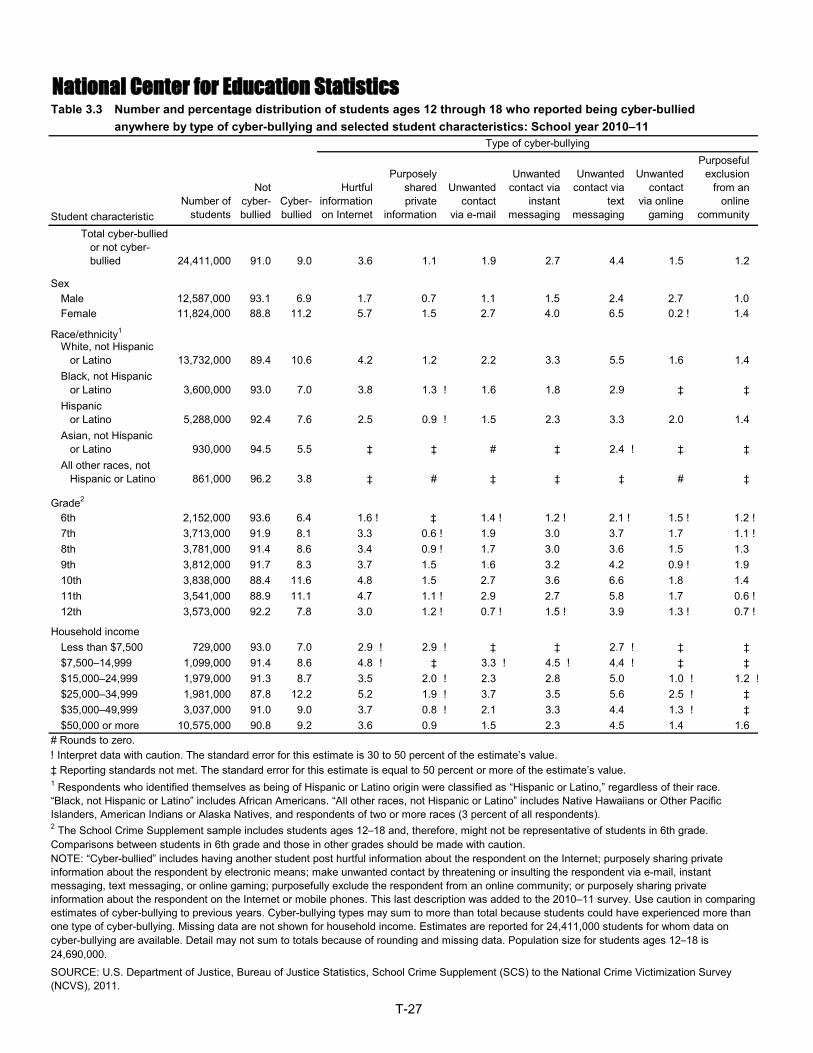
Student characteristicNumber of
students
Not cyber-bullied
Cyber-bullied
Hurtful information on Internet
Purposely shared private
information
Unwanted contact
via e-mail
Unwanted contact via
instant messaging
Unwanted contact via
text messaging
Unwanted contact
via online gaming
Purposeful exclusion
from an online
community
Total cyber-bullied or not cyber- bullied 24,411,000 91.0 9.0 3.6 1.1 1.9 2.7 4.4 1.5 1.2
SexMale 12,587,000 93.1 6.9 1.7 0.7 1.1 1.5 2.4 2.7 1.0Female 11,824,000 88.8 11.2 5.7 1.5 2.7 4.0 6.5 0.2 ! 1.4
Race/ethnicity1
White, not Hispanic or Latino 13,732,000 89.4 10.6 4.2 1.2 2.2 3.3 5.5 1.6 1.4Black, not Hispanic or Latino 3,600,000 93.0 7.0 3.8 1.3 ! 1.6 1.8 2.9 ‡ ‡Hispanic or Latino 5,288,000 92.4 7.6 2.5 0.9 ! 1.5 2.3 3.3 2.0 1.4Asian, not Hispanic or Latino 930,000 94.5 5.5 ! ‡ ‡ # ‡ 2.4 ! ‡ ‡All other races, not Hispanic or Latino 861,000 96.2 3.8 ! ‡ # ‡ ‡ ‡ # ‡
Grade2
6th 2,152,000 93.6 6.4 1.6 ! ‡ 1.4 ! 1.2 ! 2.1 ! 1.5 ! 1.2 !7th 3,713,000 91.9 8.1 3.3 0.6 ! 1.9 3.0 3.7 1.7 1.1 !8th 3,781,000 91.4 8.6 3.4 0.9 ! 1.7 3.0 3.6 1.5 1.39th 3,812,000 91.7 8.3 3.7 1.5 1.6 3.2 4.2 0.9 ! 1.910th 3,838,000 88.4 11.6 4.8 1.5 2.7 3.6 6.6 1.8 1.411th 3,541,000 88.9 11.1 4.7 1.1 ! 2.9 2.7 5.8 1.7 0.6 !12th 3,573,000 92.2 7.8 3.0 1.2 ! 0.7 ! 1.5 ! 3.9 1.3 ! 0.7 !
Household incomeLess than $7,500 729,000 93.0 7.0 2.9 ! 2.9 ! ‡ ‡ 2.7 ! ‡ ‡$7,500–14,999 1,099,000 91.4 8.6 4.8 ! ‡ 3.3 ! 4.5 ! 4.4 ! ‡ ‡$15,000–24,999 1,979,000 91.3 8.7 3.5 2.0 ! 2.3 2.8 5.0 1.0 ! 1.2 !$25,000–34,999 1,981,000 87.8 12.2 5.2 1.9 ! 3.7 3.5 5.6 2.5 ! ‡$35,000–49,999 3,037,000 91.0 9.0 3.7 0.8 ! 2.1 3.3 4.4 1.3 ! ‡$50,000 or more 10,575,000 90.8 9.2 3.6 0.9 1.5 2.3 4.5 1.4 1.6
National Center for Education Statistics
2 The School Crime Supplement sample includes students ages 12–18 and, therefore, might not be representative of students in 6th grade. Comparisons between students in 6th grade and those in other grades should be made with caution.NOTE: “Cyber-bullied” includes having another student post hurtful information about the respondent on the Internet; purposely sharing private information about the respondent by electronic means; make unwanted contact by threatening or insulting the respondent via e-mail, instant messaging, text messaging, or online gaming; purposefully exclude the respondent from an online community; or purposely sharing private information about the respondent on the Internet or mobile phones. This last description was added to the 2010–11 survey. Use caution in comparing estimates of cyber-bullying to previous years. Cyber-bullying types may sum to more than total because students could have experienced more than one type of cyber-bullying. Missing data are not shown for household income. Estimates are reported for 24,411,000 students for whom data on cyber-bullying are available. Detail may not sum to totals because of rounding and missing data. Population size for students ages 12–18 is 24,690,000.
SOURCE: U.S. Department of Justice, Bureau of Justice Statistics, School Crime Supplement (SCS) to the National Crime Victimization Survey (NCVS), 2011.
Table 3.3—Number and percentage distribution of students ages 12 through 18 who reported being cyber-bullied
Type of cyber-bullying
# Rounds to zero.! Interpret data with caution. The standard error for this estimate is 30 to 50 percent of the estimate’s value.‡ Reporting standards not met. The standard error for this estimate is equal to 50 percent or more of the estimate’s value.1 Respondents who identified themselves as being of Hispanic or Latino origin were classified as “Hispanic or Latino,” regardless of their race. “Black, not Hispanic or Latino” includes African Americans. “All other races, not Hispanic or Latino” includes Native Hawaiians or Other Pacific Islanders, American Indians or Alaska Natives, and respondents of two or more races (3 percent of all respondents).
Table 3.3—anywhere by type of cyber-bullying and selected student characteristics: School year 2010–11
T-27
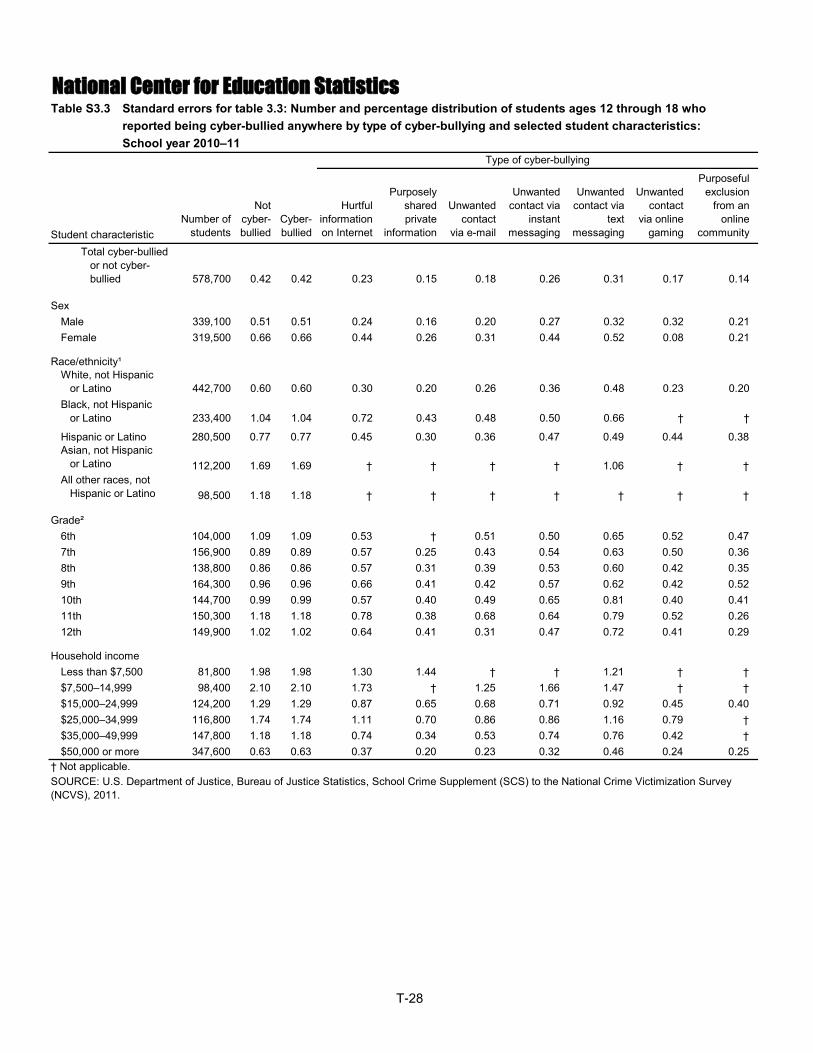
Student characteristicNumber of
students
Not cyber-bullied
Cyber-bullied
Hurtful information on Internet
Purposely shared private
information
Unwanted contact
via e-mail
Unwanted contact via
instant messaging
Unwanted contact via
text messaging
Unwanted contact
via online gaming
Purposeful exclusion
from an online
community
Total cyber-bullied or not cyber- bullied 578,700 0.42 0.42 0.23 0.15 0.18 0.26 0.31 0.17 0.14
SexMale 339,100 0.51 0.51 0.24 0.16 0.20 0.27 0.32 0.32 0.21Female 319,500 0.66 0.66 0.44 0.26 0.31 0.44 0.52 0.08 0.21
Race/ethnicity¹White, not Hispanic or Latino 442,700 0.60 0.60 0.30 0.20 0.26 0.36 0.48 0.23 0.20Black, not Hispanic or Latino 233,400 1.04 1.04 0.72 0.43 0.48 0.50 0.66 † †
Hispanic or Latino 280,500 0.77 0.77 0.45 0.30 0.36 0.47 0.49 0.44 0.38Asian, not Hispanic or Latino 112,200 1.69 1.69 † † † † 1.06 † †All other races, not Hispanic or Latino 98,500 1.18 1.18 † † † † † † †
Grade²6th 104,000 1.09 1.09 0.53 † 0.51 0.50 0.65 0.52 0.477th 156,900 0.89 0.89 0.57 0.25 0.43 0.54 0.63 0.50 0.368th 138,800 0.86 0.86 0.57 0.31 0.39 0.53 0.60 0.42 0.359th 164,300 0.96 0.96 0.66 0.41 0.42 0.57 0.62 0.42 0.5210th 144,700 0.99 0.99 0.57 0.40 0.49 0.65 0.81 0.40 0.4111th 150,300 1.18 1.18 0.78 0.38 0.68 0.64 0.79 0.52 0.2612th 149,900 1.02 1.02 0.64 0.41 0.31 0.47 0.72 0.41 0.29
Household incomeLess than $7,500 81,800 1.98 1.98 1.30 1.44 † † 1.21 † †$7,500–14,999 98,400 2.10 2.10 1.73 † 1.25 1.66 1.47 † †$15,000–24,999 124,200 1.29 1.29 0.87 0.65 0.68 0.71 0.92 0.45 0.40$25,000–34,999 116,800 1.74 1.74 1.11 0.70 0.86 0.86 1.16 0.79 †$35,000–49,999 147,800 1.18 1.18 0.74 0.34 0.53 0.74 0.76 0.42 †$50,000 or more 347,600 0.63 0.63 0.37 0.20 0.23 0.32 0.46 0.24 0.25
National Center for Education Statistics
† Not applicable.SOURCE: U.S. Department of Justice, Bureau of Justice Statistics, School Crime Supplement (SCS) to the National Crime Victimization Survey (NCVS), 2011.
Table S3.3—Standard errors for table 3.3: Number and percentage distribution of students ages 12 through 18 who
Type of cyber-bullying
Table S3.3—Table S3.3—
reported being cyber-bullied anywhere by type of cyber-bullying and selected student characteristics:School year 2010–11
T-28
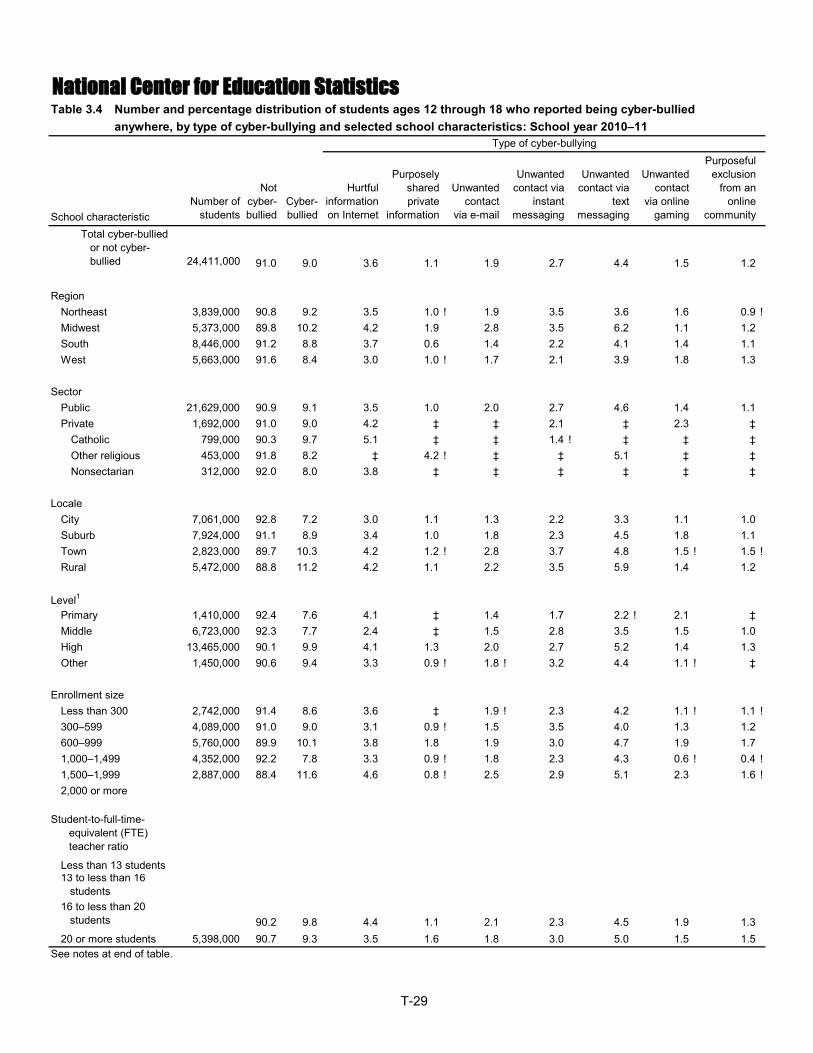
School characteristicNumber of
students
Not cyber-bullied
Cyber-bullied
Hurtful information on Internet
Purposely shared private
information
Unwanted contact
via e-mail
Unwanted contact via
instant messaging
Unwanted contact via
text messaging
Unwanted contact
via online gaming
Purposeful exclusion
from an online
community
Total cyber-bullied or not cyber- bullied 24,411,000 91.0 9.0 3.6 1.1 1.9 2.7 4.4 1.5 1.2
Region Northeast 3,839,000 90.8 9.2 3.5 1.0 ! 1.9 3.5 3.6 1.6 0.9 !Midwest 5,373,000 89.8 10.2 4.2 1.9 2.8 3.5 6.2 1.1 1.2South 8,446,000 91.2 8.8 3.7 0.6 1.4 2.2 4.1 1.4 1.1West 5,663,000 91.6 8.4 3.0 1.0 ! 1.7 2.1 3.9 1.8 1.3
SectorPublic 21,629,000 90.9 9.1 3.5 1.0 2.0 2.7 4.6 1.4 1.1Private 1,692,000 91.0 9.0 4.2 ‡ ‡ 2.1 ‡ 2.3 ‡
Catholic 799,000 90.3 9.7 5.1 ‡ ‡ 1.4 ! ‡ ‡ ‡Other religious 453,000 91.8 8.2 ‡ 4.2 ! ‡ ‡ 5.1 ‡ ‡Nonsectarian 312,000 92.0 8.0 3.8 ‡ ‡ ‡ ‡ ‡ ‡
LocaleCity 7,061,000 92.8 7.2 3.0 1.1 1.3 2.2 3.3 1.1 1.0Suburb 7,924,000 91.1 8.9 3.4 1.0 1.8 2.3 4.5 1.8 1.1Town 2,823,000 89.7 10.3 4.2 1.2 ! 2.8 3.7 4.8 1.5 ! 1.5 !Rural 5,472,000 88.8 11.2 4.2 1.1 2.2 3.5 5.9 1.4 1.2
Level1
Primary 1,410,000 92.4 7.6 4.1 ‡ 1.4 1.7 2.2 ! 2.1 ‡Middle 6,723,000 92.3 7.7 2.4 ‡ 1.5 2.8 3.5 1.5 1.0High 13,465,000 90.1 9.9 4.1 1.3 2.0 2.7 5.2 1.4 1.3Other 1,450,000 90.6 9.4 3.3 0.9 ! 1.8 ! 3.2 4.4 1.1 ! ‡
Enrollment sizeLess than 300 2,742,000 91.4 8.6 3.6 ‡ 1.9 ! 2.3 4.2 1.1 ! 1.1 !300–599 4,089,000 91.0 9.0 3.1 0.9 ! 1.5 3.5 4.0 1.3 1.2600–999 5,760,000 89.9 10.1 3.8 1.8 1.9 3.0 4.7 1.9 1.71,000–1,499 4,352,000 92.2 7.8 3.3 0.9 ! 1.8 2.3 4.3 0.6 ! 0.4 !1,500–1,999 2,887,000 88.4 11.6 4.6 0.8 ! 2.5 2.9 5.1 2.3 1.6 !2,000 or more
Student-to-full-time- equivalent (FTE) teacher ratio
Less than 13 students13 to less than 16 students16 to less than 20 students 90.2 9.8 4.4 1.1 2.1 2.3 4.5 1.9 1.320 or more students 5,398,000 90.7 9.3 3.5 1.6 1.8 3.0 5.0 1.5 1.5
Table 3.4—Number and percentage distribution of students ages 12 through 18 who reported being cyber-bullied
Type of cyber-bullying
National Center for Education Statistics
See notes at end of table.
Table 3.4—anywhere, by type of cyber-bullying and selected school characteristics: School year 2010–11
T-29
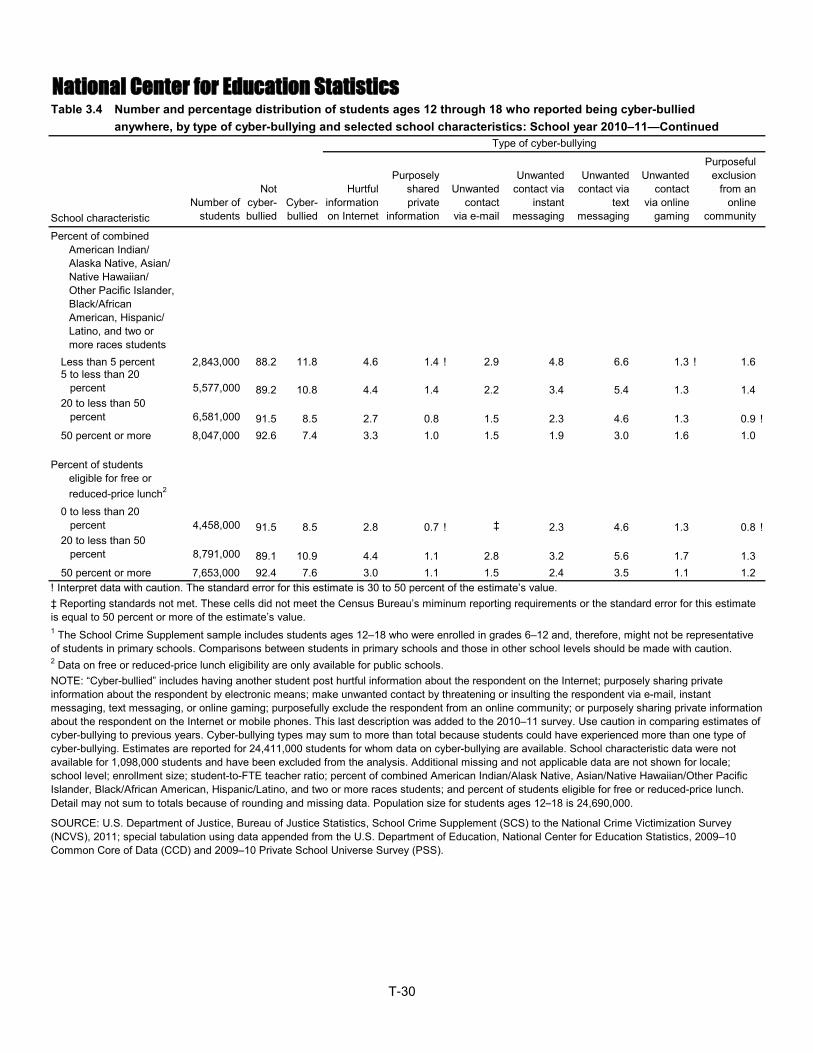
School characteristicNumber of
students
Not cyber-bullied
Cyber-bullied
Hurtful information on Internet
Purposely shared private
information
Unwanted contact
via e-mail
Unwanted contact via
instant messaging
Unwanted contact via
text messaging
Unwanted contact
via online gaming
Purposeful exclusion
from an online
community
Percent of combined American Indian/ Alaska Native, Asian/ Native Hawaiian/ Other Pacific Islander, Black/African American, Hispanic/ Latino, and two or more races students
Less than 5 percent 2,843,000 88.2 11.8 4.6 1.4 ! 2.9 4.8 6.6 1.3 ! 1.65 to less than 20 percent 5,577,000 89.2 10.8 4.4 1.4 2.2 3.4 5.4 1.3 1.420 to less than 50 percent 6,581,000 91.5 8.5 2.7 0.8 1.5 2.3 4.6 1.3 0.9 !50 percent or more 8,047,000 92.6 7.4 3.3 1.0 1.5 1.9 3.0 1.6 1.0
Percent of students eligible for free or reduced-price lunch2
0 to less than 20 percent 4,458,000 91.5 8.5 2.8 0.7 ! ‡ 2.3 4.6 1.3 0.8 !20 to less than 50 percent 8,791,000 89.1 10.9 4.4 1.1 2.8 3.2 5.6 1.7 1.350 percent or more 7,653,000 92.4 7.6 3.0 1.1 1.5 2.4 3.5 1.1 1.2
SOURCE: U.S. Department of Justice, Bureau of Justice Statistics, School Crime Supplement (SCS) to the National Crime Victimization Survey (NCVS), 2011; special tabulation using data appended from the U.S. Department of Education, National Center for Education Statistics, 2009–10 Common Core of Data (CCD) and 2009–10 Private School Universe Survey (PSS).
! Interpret data with caution. The standard error for this estimate is 30 to 50 percent of the estimate’s value.‡ Reporting standards not met. These cells did not meet the Census Bureau’s miminum reporting requirements or the standard error for this estimate is equal to 50 percent or more of the estimate’s value.1 The School Crime Supplement sample includes students ages 12–18 who were enrolled in grades 6–12 and, therefore, might not be representative of students in primary schools. Comparisons between students in primary schools and those in other school levels should be made with caution.2 Data on free or reduced-price lunch eligibility are only available for public schools.
Type of cyber-bullying
National Center for Education StatisticsTable 3.4—Number and percentage distribution of students ages 12 through 18 who reported being cyber-bullied
NOTE: “Cyber-bullied” includes having another student post hurtful information about the respondent on the Internet; purposely sharing private information about the respondent by electronic means; make unwanted contact by threatening or insulting the respondent via e-mail, instant messaging, text messaging, or online gaming; purposefully exclude the respondent from an online community; or purposely sharing private information about the respondent on the Internet or mobile phones. This last description was added to the 2010–11 survey. Use caution in comparing estimates of cyber-bullying to previous years. Cyber-bullying types may sum to more than total because students could have experienced more than one type of cyber-bullying. Estimates are reported for 24,411,000 students for whom data on cyber-bullying are available. School characteristic data were not available for 1,098,000 students and have been excluded from the analysis. Additional missing and not applicable data are not shown for locale; school level; enrollment size; student-to-FTE teacher ratio; percent of combined American Indian/Alask Native, Asian/Native Hawaiian/Other Pacific Islander, Black/African American, Hispanic/Latino, and two or more races students; and percent of students eligible for free or reduced-price lunch. Detail may not sum to totals because of rounding and missing data. Population size for students ages 12–18 is 24,690,000.
Table 3.4—anywhere, by type of cyber-bullying and selected school characteristics: School year 2010–11—Continued
T-30
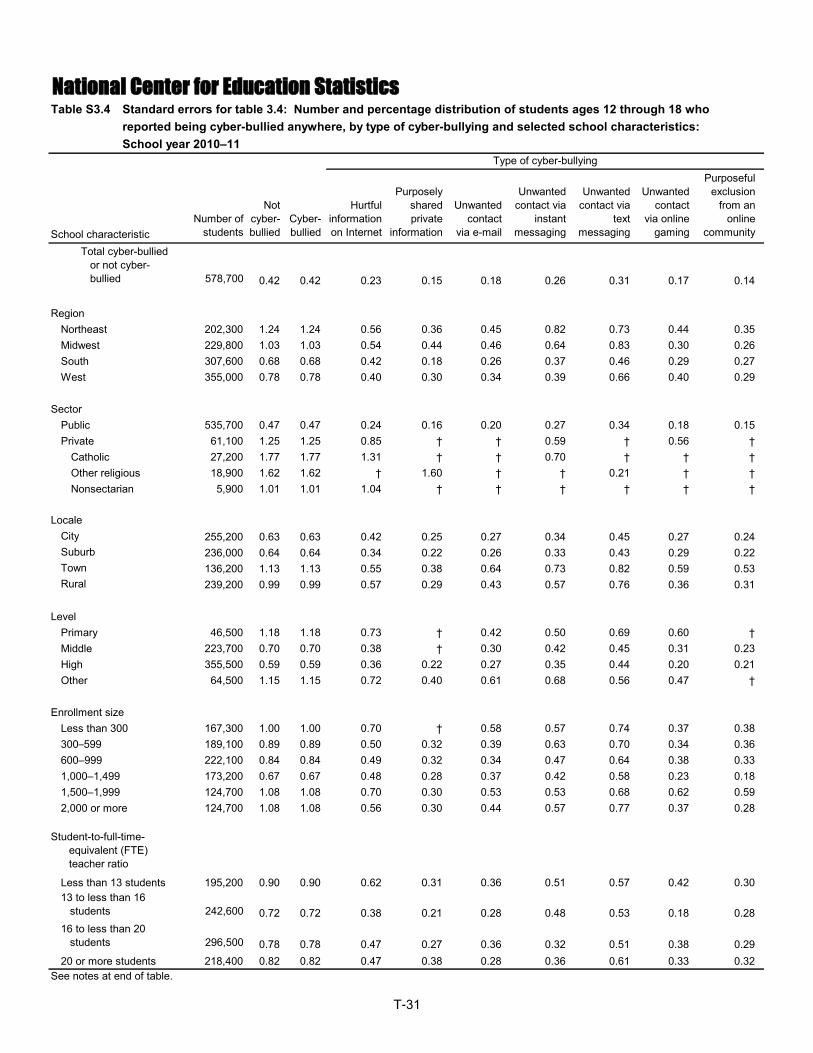
School characteristicNumber of
students
Not cyber-bullied
Cyber-bullied
Hurtful information on Internet
Purposely shared private
information
Unwanted contact
via e-mail
Unwanted contact via
instant messaging
Unwanted contact via
text messaging
Unwanted contact
via online gaming
Purposeful exclusion
from an online
community
Total cyber-bullied or not cyber- bullied 578,700 0.42 0.42 0.23 0.15 0.18 0.26 0.31 0.17 0.14
Region Northeast 202,300 1.24 1.24 0.56 0.36 0.45 0.82 0.73 0.44 0.35Midwest 229,800 1.03 1.03 0.54 0.44 0.46 0.64 0.83 0.30 0.26South 307,600 0.68 0.68 0.42 0.18 0.26 0.37 0.46 0.29 0.27West 355,000 0.78 0.78 0.40 0.30 0.34 0.39 0.66 0.40 0.29
SectorPublic 535,700 0.47 0.47 0.24 0.16 0.20 0.27 0.34 0.18 0.15Private 61,100 1.25 1.25 0.85 † † 0.59 † 0.56 †
Catholic 27,200 1.77 1.77 1.31 † † 0.70 † † †Other religious 18,900 1.62 1.62 † 1.60 † † 0.21 † †Nonsectarian 5,900 1.01 1.01 1.04 † † † † † †
LocaleCity 255,200 0.63 0.63 0.42 0.25 0.27 0.34 0.45 0.27 0.24Suburb 236,000 0.64 0.64 0.34 0.22 0.26 0.33 0.43 0.29 0.22Town 136,200 1.13 1.13 0.55 0.38 0.64 0.73 0.82 0.59 0.53Rural 239,200 0.99 0.99 0.57 0.29 0.43 0.57 0.76 0.36 0.31
LevelPrimary 46,500 1.18 1.18 0.73 † 0.42 0.50 0.69 0.60 †Middle 223,700 0.70 0.70 0.38 † 0.30 0.42 0.45 0.31 0.23High 355,500 0.59 0.59 0.36 0.22 0.27 0.35 0.44 0.20 0.21Other 64,500 1.15 1.15 0.72 0.40 0.61 0.68 0.56 0.47 †
Enrollment sizeLess than 300 167,300 1.00 1.00 0.70 † 0.58 0.57 0.74 0.37 0.38300–599 189,100 0.89 0.89 0.50 0.32 0.39 0.63 0.70 0.34 0.36600–999 222,100 0.84 0.84 0.49 0.32 0.34 0.47 0.64 0.38 0.331,000–1,499 173,200 0.67 0.67 0.48 0.28 0.37 0.42 0.58 0.23 0.181,500–1,999 124,700 1.08 1.08 0.70 0.30 0.53 0.53 0.68 0.62 0.592,000 or more 124,700 1.08 1.08 0.56 0.30 0.44 0.57 0.77 0.37 0.28
Student-to-full-time- equivalent (FTE) teacher ratio
Less than 13 students 195,200 0.90 0.90 0.62 0.31 0.36 0.51 0.57 0.42 0.3013 to less than 16 students 242,600 0.72 0.72 0.38 0.21 0.28 0.48 0.53 0.18 0.2816 to less than 20 students 296,500 0.78 0.78 0.47 0.27 0.36 0.32 0.51 0.38 0.2920 or more students 218,400 0.82 0.82 0.47 0.38 0.28 0.36 0.61 0.33 0.32
National Center for Education Statistics
See notes at end of table.
Table S3.4—Standard errors for table 3.4: Number and percentage distribution of students ages 12 through 18 who
Type of cyber-bullying
Table S3.4—Table S3.4—
reported being cyber-bullied anywhere, by type of cyber-bullying and selected school characteristics:School year 2010–11
T-31
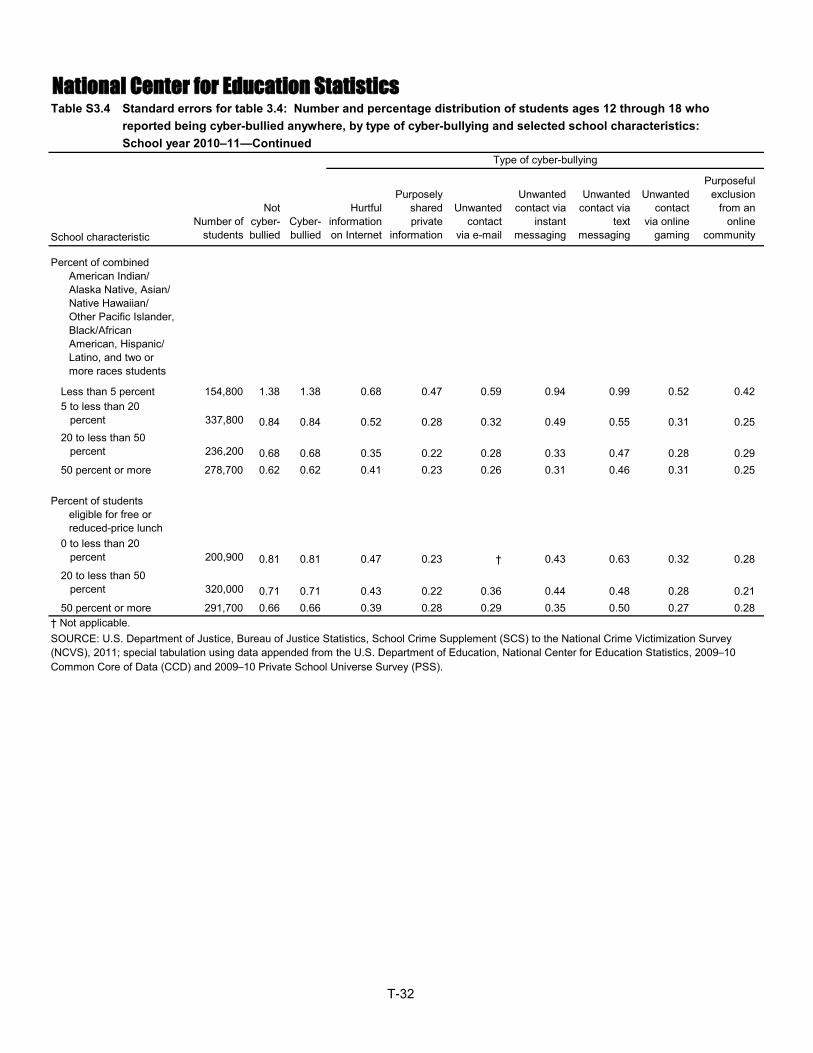
School characteristicNumber of
students
Not cyber-bullied
Cyber-bullied
Hurtful information on Internet
Purposely shared private
information
Unwanted contact
via e-mail
Unwanted contact via
instant messaging
Unwanted contact via
text messaging
Unwanted contact
via online gaming
Purposeful exclusion
from an online
community
Percent of combined American Indian/ Alaska Native, Asian/ Native Hawaiian/ Other Pacific Islander, Black/African American, Hispanic/ Latino, and two or more races students
Less than 5 percent 154,800 1.38 1.38 0.68 0.47 0.59 0.94 0.99 0.52 0.425 to less than 20 percent 337,800 0.84 0.84 0.52 0.28 0.32 0.49 0.55 0.31 0.2520 to less than 50 percent 236,200 0.68 0.68 0.35 0.22 0.28 0.33 0.47 0.28 0.2950 percent or more 278,700 0.62 0.62 0.41 0.23 0.26 0.31 0.46 0.31 0.25
Percent of students eligible for free or reduced-price lunch
0 to less than 20 percent 200,900 0.81 0.81 0.47 0.23 † 0.43 0.63 0.32 0.2820 to less than 50 percent 320,000 0.71 0.71 0.43 0.22 0.36 0.44 0.48 0.28 0.2150 percent or more 291,700 0.66 0.66 0.39 0.28 0.29 0.35 0.50 0.27 0.28
† Not applicable.SOURCE: U.S. Department of Justice, Bureau of Justice Statistics, School Crime Supplement (SCS) to the National Crime Victimization Survey (NCVS), 2011; special tabulation using data appended from the U.S. Department of Education, National Center for Education Statistics, 2009–10 Common Core of Data (CCD) and 2009–10 Private School Universe Survey (PSS).
National Center for Education StatisticsTable S3.4—Standard errors for table 3.4: Number and percentage distribution of students ages 12 through 18 who
Type of cyber-bullying
Table S3.4—reported being cyber-bullied anywhere, by type of cyber-bullying and selected school characteristics:Table S3.4—School year 2010–11—Continued
T-32
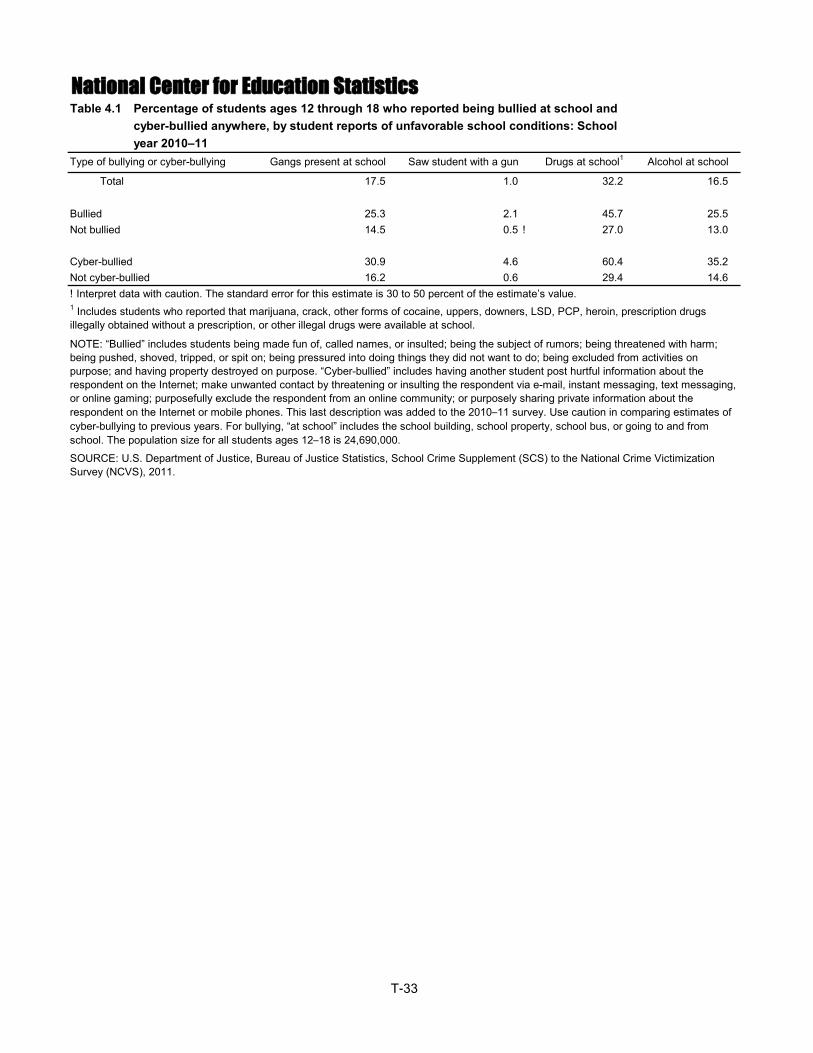
Type of bullying or cyber-bullying Gangs present at school Saw student with a gun Drugs at school1 Alcohol at school
Total 17.5 1.0 32.2 16.5
Bullied 25.3 2.1 45.7 25.5Not bullied 14.5 0.5 ! 27.0 13.0
Cyber-bullied 30.9 4.6 60.4 35.2Not cyber-bullied 16.2 0.6 29.4 14.6
SOURCE: U.S. Department of Justice, Bureau of Justice Statistics, School Crime Supplement (SCS) to the National Crime Victimization Survey (NCVS), 2011.
National Center for Education StatisticsTable 4.1—Percentage of students ages 12 through 18 who reported being bullied at school and
! Interpret data with caution. The standard error for this estimate is 30 to 50 percent of the estimate’s value.1 Includes students who reported that marijuana, crack, other forms of cocaine, uppers, downers, LSD, PCP, heroin, prescription drugs illegally obtained without a prescription, or other illegal drugs were available at school.
NOTE: “Bullied” includes students being made fun of, called names, or insulted; being the subject of rumors; being threatened with harm; being pushed, shoved, tripped, or spit on; being pressured into doing things they did not want to do; being excluded from activities on purpose; and having property destroyed on purpose. “Cyber-bullied” includes having another student post hurtful information about the respondent on the Internet; make unwanted contact by threatening or insulting the respondent via e-mail, instant messaging, text messaging, or online gaming; purposefully exclude the respondent from an online community; or purposely sharing private information about the respondent on the Internet or mobile phones. This last description was added to the 2010–11 survey. Use caution in comparing estimates of cyber-bullying to previous years. For bullying, “at school” includes the school building, school property, school bus, or going to and from school. The population size for all students ages 12–18 is 24,690,000.
Table 4.1—Table 4.1—
cyber-bullied anywhere, by student reports of unfavorable school conditions: Schoolyear 2010–11
T-33
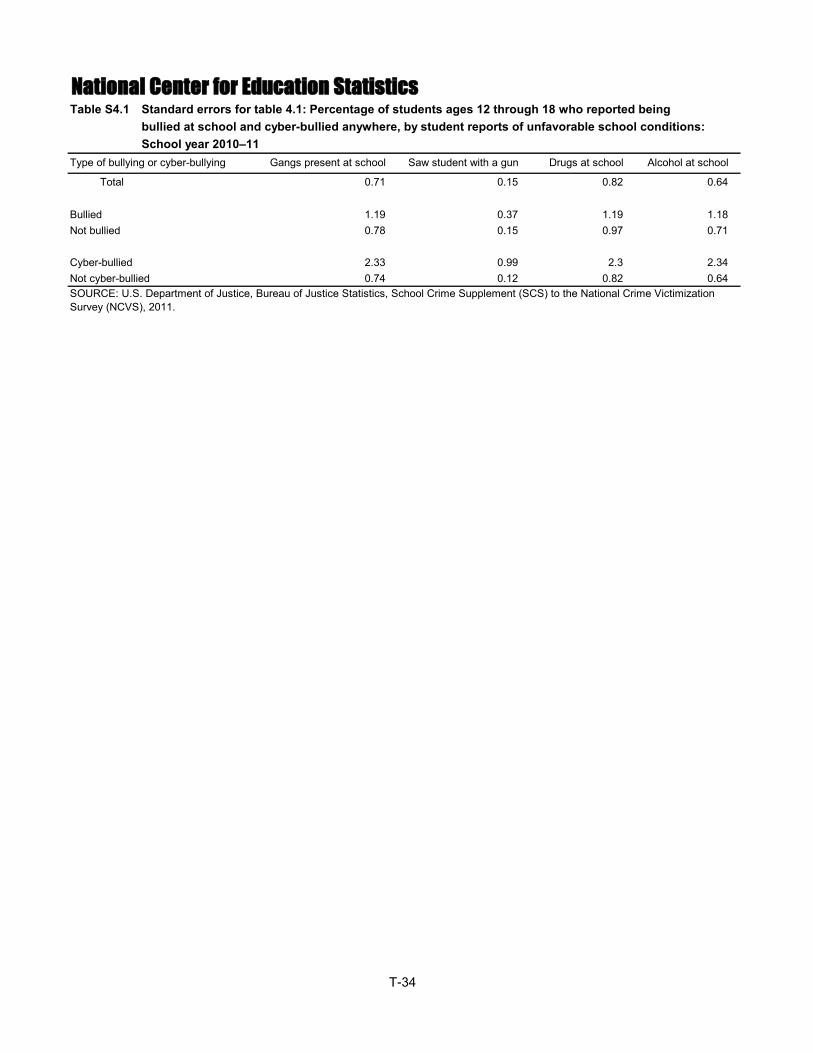
Type of bullying or cyber-bullying Gangs present at school Saw student with a gun Drugs at school Alcohol at school
Total 0.71 0.15 0.82 0.64
Bullied 1.19 0.37 1.19 1.18Not bullied 0.78 0.15 0.97 0.71
Cyber-bullied 2.33 0.99 2.3 2.34Not cyber-bullied 0.74 0.12 0.82 0.64SOURCE: U.S. Department of Justice, Bureau of Justice Statistics, School Crime Supplement (SCS) to the National Crime Victimization Survey (NCVS), 2011.
National Center for Education StatisticsTable S4.1—Standard errors for table 4.1: Percentage of students ages 12 through 18 who reported being Table S4.1—Table S4.1—
bullied at school and cyber-bullied anywhere, by student reports of unfavorable school conditions:School year 2010–11
T-34
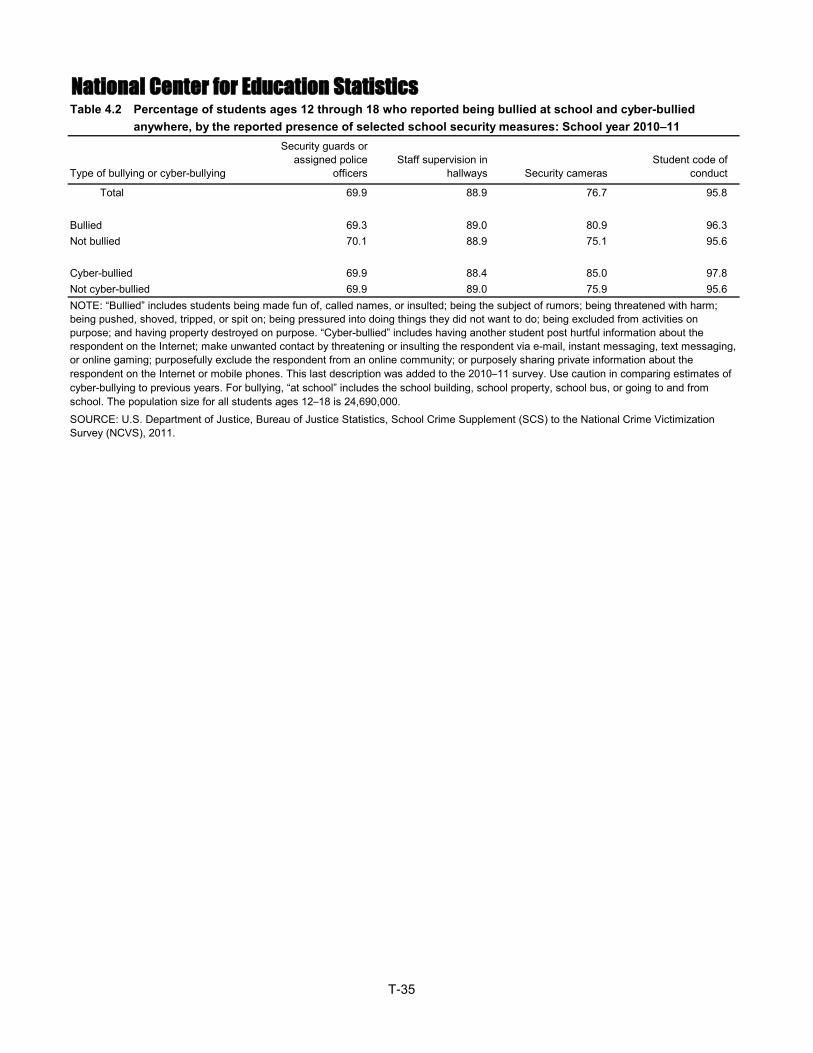
Type of bullying or cyber-bullying
Security guards or assigned police
officersStaff supervision in
hallways Security camerasStudent code of
conduct
Total 69.9 88.9 76.7 95.8
Bullied 69.3 89.0 80.9 96.3Not bullied 70.1 88.9 75.1 95.6
Cyber-bullied 69.9 88.4 85.0 97.8Not cyber-bullied 69.9 89.0 75.9 95.6
Table 4.2—Percentage of students ages 12 through 18 who reported being bullied at school and cyber-bullied
NOTE: “Bullied” includes students being made fun of, called names, or insulted; being the subject of rumors; being threatened with harm; being pushed, shoved, tripped, or spit on; being pressured into doing things they did not want to do; being excluded from activities on purpose; and having property destroyed on purpose. “Cyber-bullied” includes having another student post hurtful information about the respondent on the Internet; make unwanted contact by threatening or insulting the respondent via e-mail, instant messaging, text messaging, or online gaming; purposefully exclude the respondent from an online community; or purposely sharing private information about the respondent on the Internet or mobile phones. This last description was added to the 2010–11 survey. Use caution in comparing estimates of cyber-bullying to previous years. For bullying, “at school” includes the school building, school property, school bus, or going to and from school. The population size for all students ages 12–18 is 24,690,000.SOURCE: U.S. Department of Justice, Bureau of Justice Statistics, School Crime Supplement (SCS) to the National Crime Victimization Survey (NCVS), 2011.
National Center for Education StatisticsTable 4.2—anywhere, by the reported presence of selected school security measures: School year 2010–11
T-35

Type of bullying or cyber-bullying
Security guards or assigned police
officersStaff supervision in
hallways Security camerasStudent code of
conduct
Total 1.02 0.46 0.82 0.30
Bullied 1.38 0.80 1.19 0.54Not bullied 1.16 0.53 0.93 0.35
Cyber-bullied 2.30 1.38 1.38 0.75Not cyber-bullied 1.04 0.47 0.88 0.32SOURCE: U.S. Department of Justice, Bureau of Justice Statistics, School Crime Supplement (SCS) to the National Crime Victimization Survey (NCVS), 2011.
National Center for Education StatisticsTable S4.2—Standard errors for table 4.2: Percentage of students ages 12 through 18 who reported being bullied Table S4.2—Table S4.2—
at school and cyber-bullied anywhere, by the reported presence of selected school securitymeasures: School year 2010–11
T-36
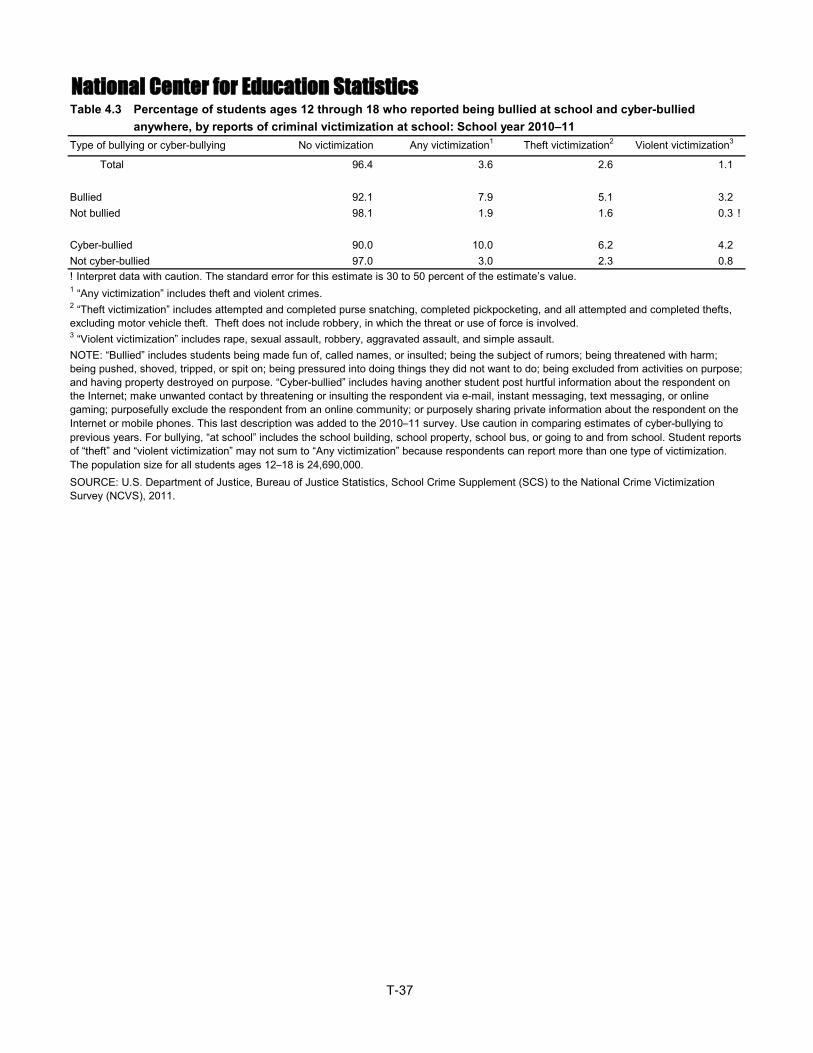
Type of bullying or cyber-bullying No victimization Any victimization1 Theft victimization2 Violent victimization3
Total 96.4 3.6 2.6 1.1
Bullied 92.1 7.9 5.1 3.2Not bullied 98.1 1.9 1.6 0.3 !
Cyber-bullied 90.0 10.0 6.2 4.2Not cyber-bullied 97.0 3.0 2.3 0.8
National Center for Education Statistics
SOURCE: U.S. Department of Justice, Bureau of Justice Statistics, School Crime Supplement (SCS) to the National Crime Victimization Survey (NCVS), 2011.
Table 4.3—Percentage of students ages 12 through 18 who reported being bullied at school and cyber-bullied
! Interpret data with caution. The standard error for this estimate is 30 to 50 percent of the estimate’s value.1 “Any victimization” includes theft and violent crimes.2 “Theft victimization” includes attempted and completed purse snatching, completed pickpocketing, and all attempted and completed thefts, excluding motor vehicle theft. Theft does not include robbery, in which the threat or use of force is involved.3 “Violent victimization” includes rape, sexual assault, robbery, aggravated assault, and simple assault.NOTE: “Bullied” includes students being made fun of, called names, or insulted; being the subject of rumors; being threatened with harm; being pushed, shoved, tripped, or spit on; being pressured into doing things they did not want to do; being excluded from activities on purpose; and having property destroyed on purpose. “Cyber-bullied” includes having another student post hurtful information about the respondent on the Internet; make unwanted contact by threatening or insulting the respondent via e-mail, instant messaging, text messaging, or online gaming; purposefully exclude the respondent from an online community; or purposely sharing private information about the respondent on the Internet or mobile phones. This last description was added to the 2010–11 survey. Use caution in comparing estimates of cyber-bullying to previous years. For bullying, “at school” includes the school building, school property, school bus, or going to and from school. Student reports of “theft” and “violent victimization” may not sum to “Any victimization” because respondents can report more than one type of victimization. The population size for all students ages 12–18 is 24,690,000.
Table 4.3—anywhere, by reports of criminal victimization at school: School year 2010–11
T-37

Type of bullying or cyber-bullying No victimization Any victimization Theft victimization Violent victimization
Total 0.28 0.28 0.23 0.15
Bullied 0.74 0.74 0.57 0.46Not bullied 0.27 0.27 0.23 0.09
Cyber-bullied 1.35 1.35 1.10 0.93Not cyber-bullied 0.26 0.26 0.22 0.14SOURCE: U.S. Department of Justice, Bureau of Justice Statistics, School Crime Supplement (SCS) to the National Crime Victimization Survey (NCVS), 2011.
National Center for Education StatisticsTable S4.3—Standard errors for table 4.3: Percentage of students ages 12 through 18 who reported being bullied Table S4.3—Table S4.3—
at school and cyber-bullied anywhere, by reports of criminal victimization at school: School year2010–11
T-38
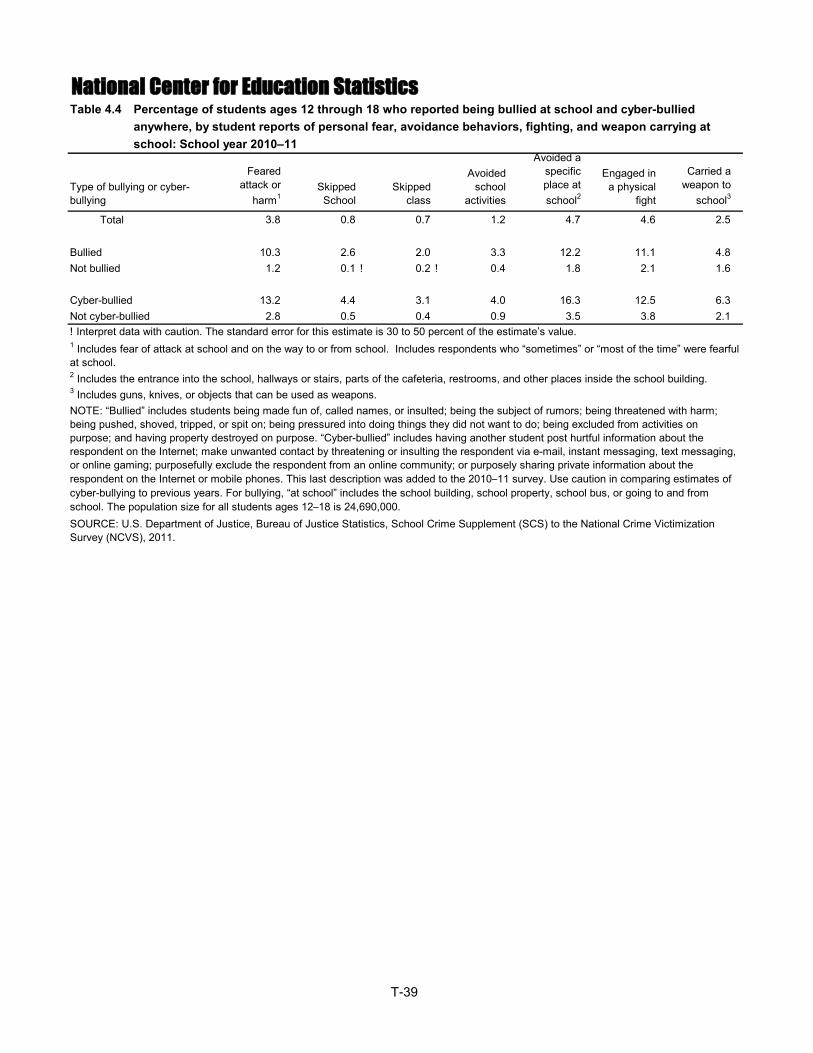
Type of bullying or cyber-bullying
Feared attack or
harm1Skipped School
Skipped class
Avoided school
activities
Avoided a specific place at school2
Engaged in a physical
fight
Carried a weapon to
school3
Total 3.8 0.8 0.7 1.2 4.7 4.6 2.5
Bullied 10.3 2.6 2.0 3.3 12.2 11.1 4.8Not bullied 1.2 0.1 ! 0.2 ! 0.4 1.8 2.1 1.6
Cyber-bullied 13.2 4.4 3.1 4.0 16.3 12.5 6.3Not cyber-bullied 2.8 0.5 0.4 0.9 3.5 3.8 2.1
National Center for Education Statistics
NOTE: “Bullied” includes students being made fun of, called names, or insulted; being the subject of rumors; being threatened with harm; being pushed, shoved, tripped, or spit on; being pressured into doing things they did not want to do; being excluded from activities on purpose; and having property destroyed on purpose. “Cyber-bullied” includes having another student post hurtful information about the respondent on the Internet; make unwanted contact by threatening or insulting the respondent via e-mail, instant messaging, text messaging, or online gaming; purposefully exclude the respondent from an online community; or purposely sharing private information about the respondent on the Internet or mobile phones. This last description was added to the 2010–11 survey. Use caution in comparing estimates of cyber-bullying to previous years. For bullying, “at school” includes the school building, school property, school bus, or going to and from school. The population size for all students ages 12–18 is 24,690,000.SOURCE: U.S. Department of Justice, Bureau of Justice Statistics, School Crime Supplement (SCS) to the National Crime Victimization Survey (NCVS), 2011.
Table 4.4—Percentage of students ages 12 through 18 who reported being bullied at school and cyber-bullied
! Interpret data with caution. The standard error for this estimate is 30 to 50 percent of the estimate’s value.1 Includes fear of attack at school and on the way to or from school. Includes respondents who “sometimes” or “most of the time” were fearful at school.2 Includes the entrance into the school, hallways or stairs, parts of the cafeteria, restrooms, and other places inside the school building.3 Includes guns, knives, or objects that can be used as weapons.
Table 4.4—Table 4.4—
anywhere, by student reports of personal fear, avoidance behaviors, fighting, and weapon carrying atschool: School year 2010–11
T-39

Type of bullying or cyber-bullying
Feared attack or
harmSkipped School
Skipped class
Avoided school
activities
Avoided a specific place at
school
Engaged in a physical
fight
Carried a weapon to
school
Total 0.28 0.12 0.10 0.16 0.30 0.28 0.26
Bullied 0.82 0.41 0.31 0.47 0.88 0.78 0.63Not bullied 0.19 0.05 0.07 0.10 0.25 0.27 0.22
Cyber-bullied 1.46 0.82 0.69 0.80 1.56 1.46 1.17Not cyber-bullied 0.25 0.11 0.09 0.15 0.27 0.29 0.24SOURCE: U.S. Department of Justice, Bureau of Justice Statistics, School Crime Supplement (SCS) to the National Crime Victimization Survey (NCVS), 2011.
National Center for Education StatisticsTable S4.4—Standard errors for table 4.4: Percentage of students ages 12 through 18 who reported being bullied Table S4.4—Table S4.4—
at school and cyber-bullied anywhere, by student reports of personal fear, avoidance behaviors,fighting, and weapon carrying at school: School year 2010–11
T-40
G - 1
Glossary
All variables used in these tables appear in this glossary. The 2011 School Crime Supplement (SCS) data file contains the variables used here, additional variables collected in the SCS Questionnaire, and selected variables collected in the National Crime Victimization Survey (NCVS) Basic Screen Questionnaire (NCVS-1) and NCVS Crime Incident Report (NCVS-2). Records for all individuals ages 12 through 18 in NCVS households are included in the data file. The SCS data file and questionnaire can be downloaded from the Inter-University Consortium for Political and Social Research (ICPSR) via the Student Surveys link at NCES’s Crime and Safety Surveys portal, located at http://nces.ed.gov/programs/crime/surveys.asp. The NCVS questionnaires are also available through ICPSR. Prior to analysis, the 2011 SCS data file was filtered to include only students who met all criteria for this report: participated in an SCS interview (using SC004 [Type of SCS Interview]), enrolled in grades 6 through 12 (using SC008 [GRADE LEVEL IN SCHOOL]), enrolled in school in the current school year (using SC006 [ATTEND SCHOOL THIS SCHOOL YEAR]), and not homeschooled during that time (using SC092 [HOMESCHOOLED]). Records excluded from the analyses came from 3,794 individuals not interviewed, and 808 students who did not fulfill one or more of these requirements: grade (278 cases), enrollment in the current school year (293 cases), and any homeschooling (237 cases). The final unweighted sample size is 5,739. The U.S. Census Bureau (Census) produced the estimates appearing in tables 2.2, 2.4, 2.6, 3.2, and 3.4, which show the characteristics of schools attended by SCS respondents. The tables include variables taken from the 2009–10 Common Core of Data (CCD) and the 2009–10 Private School Universe Survey (PSS), which are not available in the 2011 SCS data file, but are included in the glossary as a reference.
Variables Taken From the National Crime Victimization Survey (NCVS) Basic Screen Questionnaire (NCVS-1)
Household income (SC214) Household income refers to income as reported by the head of household and was collapsed into the following categories:
(1) Less than $7,500; (2) $7,500–14,999; (3) $15,000–24,999; (4) $25,000–34,999; (5) $35,000–49,999; and (6) $50,000 or more.
Race/ethnicity, Hispanic origin (SC412R and SC413) SC412R asked respondents their race, and SC413 asked respondents whether they are of Hispanic or Latino origin. Respondents who identified themselves as being of Hispanic or Latino origin were classified as
G - 2
“Hispanic or Latino,” regardless of their race. Students who indicate they are not of Hispanic or Latino origin were classified according to the race they identified (e.g., White, not Hispanic or Latino; Black, not Hispanic or Latino; All other races, not Hispanic or Latino). Black, not Hispanic or Latino includes African Americans. All other races, not Hispanic or Latino includes Native Hawaiians or Other Pacific Islanders, American Indians or Alaska Natives, and respondents of two or more races (3 percent of all respondents). Sex (SC407A) SC407A asked respondents whether they are male or female. Type of victimization (TOCNEW_1 through TOCNEW_5) Each SCS respondent could have reported as many as five incidents of victimization in the NCVS-1 in 2011. For each incident of victimization reported, an NCVS Crime Incident Report (NCVS-2) was completed. Data from incidents reports, along with a “type of crime” (TOC) code derived from NCVS-2 responses, were appended to the SCS data file for each respondent who reported at least one victimization in the 6 months prior to the survey. These five TOC codes were used to construct the any, violent, and theft crime categories used in these Web Tables. However, only incidents which occurred at school, or on the way to or from school, were included in these Web Tables (see below). Therefore, the figures presented in the tables represent the prevalence of such victimization at school. Violent crimes include rape, sexual assault, robbery, aggravated assault, simple assault with injury, assault without a weapon and without injury, and verbal threat of assault. Theft includes attempted and completed purse snatching, completed pickpocketing, and all attempted and completed thefts, excluding motor vehicle theft. Theft does not include robbery, in which the threat or use of force is involved. “Any” crimes include one or more reports of any of the crimes listed above.
Variables Taken From the National Crime Victimization Survey (NCVS) Crime Incident Report (NCVS-2)
Activity at time of incident (SC832) Students were asked what they were doing at the time of the criminal victimization incident; specifically, incidents included in these tables are those which students indicated had occurred while they were on their way to or from school. Location where incident occurred (SC616) Students were asked where the criminal victimization incident occurred; specifically, incidents included in these tables are those which students indicated had occurred inside the school building or on school property (school parking area, play area, school bus, etc.).
Variables Taken From the 2011 School Crime Supplement (SCS) to the NCVS
Adult notification (bullying) (SC147) Students were asked if a teacher or some other adult at school was notified about (this event/any of these events) with regard to reported bullying. Adult notification (cyber-bullying) (SC166) Students were asked if a teacher or some other adult at school was notified about (this event/any of these events) with regard to reported cyber-bullying.
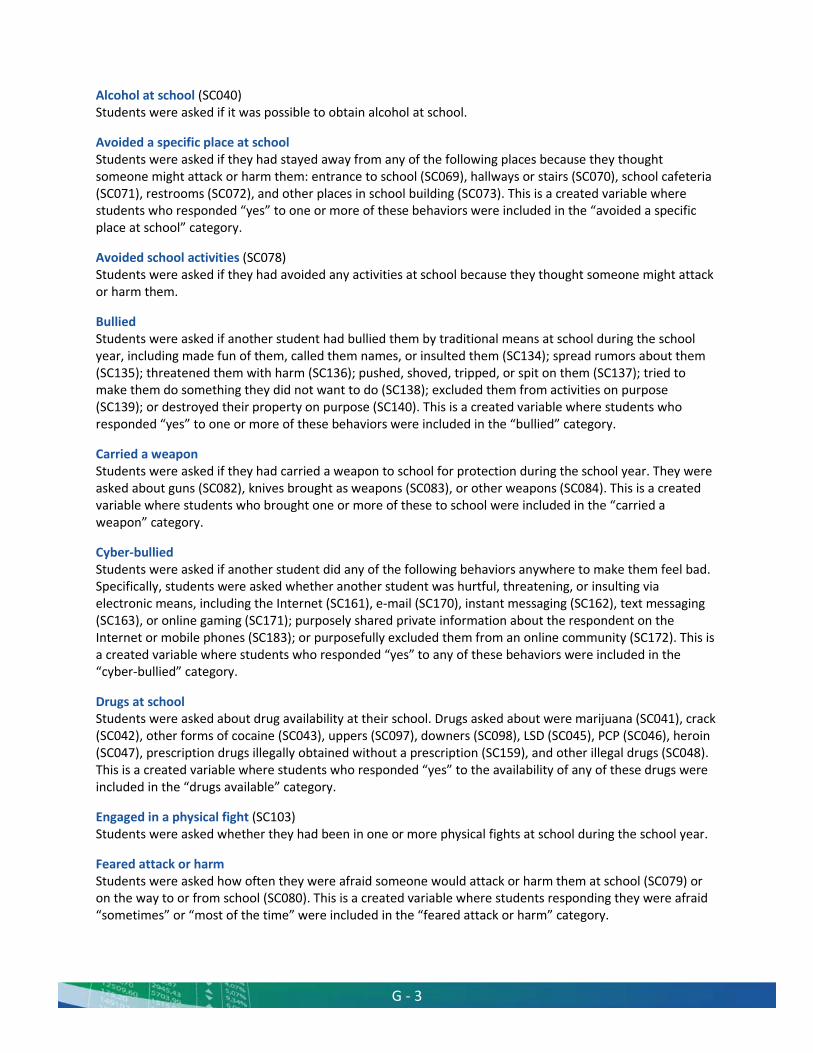
G - 3
Alcohol at school (SC040) Students were asked if it was possible to obtain alcohol at school. Avoided a specific place at school Students were asked if they had stayed away from any of the following places because they thought someone might attack or harm them: entrance to school (SC069), hallways or stairs (SC070), school cafeteria (SC071), restrooms (SC072), and other places in school building (SC073). This is a created variable where students who responded “yes” to one or more of these behaviors were included in the “avoided a specific place at school” category. Avoided school activities (SC078) Students were asked if they had avoided any activities at school because they thought someone might attack or harm them. Bullied Students were asked if another student had bullied them by traditional means at school during the school year, including made fun of them, called them names, or insulted them (SC134); spread rumors about them (SC135); threatened them with harm (SC136); pushed, shoved, tripped, or spit on them (SC137); tried to make them do something they did not want to do (SC138); excluded them from activities on purpose (SC139); or destroyed their property on purpose (SC140). This is a created variable where students who responded “yes” to one or more of these behaviors were included in the “bullied” category. Carried a weapon Students were asked if they had carried a weapon to school for protection during the school year. They were asked about guns (SC082), knives brought as weapons (SC083), or other weapons (SC084). This is a created variable where students who brought one or more of these to school were included in the “carried a weapon” category. Cyber-bullied Students were asked if another student did any of the following behaviors anywhere to make them feel bad. Specifically, students were asked whether another student was hurtful, threatening, or insulting via electronic means, including the Internet (SC161), e-mail (SC170), instant messaging (SC162), text messaging (SC163), or online gaming (SC171); purposely shared private information about the respondent on the Internet or mobile phones (SC183); or purposefully excluded them from an online community (SC172). This is a created variable where students who responded “yes” to any of these behaviors were included in the “cyber-bullied” category. Drugs at school Students were asked about drug availability at their school. Drugs asked about were marijuana (SC041), crack (SC042), other forms of cocaine (SC043), uppers (SC097), downers (SC098), LSD (SC045), PCP (SC046), heroin (SC047), prescription drugs illegally obtained without a prescription (SC159), and other illegal drugs (SC048). This is a created variable where students who responded “yes” to the availability of any of these drugs were included in the “drugs available” category. Engaged in a physical fight (SC103) Students were asked whether they had been in one or more physical fights at school during the school year. Feared attack or harm Students were asked how often they were afraid someone would attack or harm them at school (SC079) or on the way to or from school (SC080). This is a created variable where students responding they were afraid “sometimes” or “most of the time” were included in the “feared attack or harm” category.
G - 4
Frequency of bullying (SC142) Students were asked how often they were bullied during the school year. Frequency of cyber-bullying (SC165) Students were asked how often they were cyber-bullied during the school year. Gangs present at school (SC058) Students were asked whether there are street gangs present at their school. Grade (SC008) Students were asked what grade they were in. Response options included “fifth or under,” “sixth,” “seventh,” “eighth,” “ninth,” “tenth,” “eleventh,” and “twelfth” grades; “other”; and “college/GED/ postgraduate/other noneligible.” Only respondents in grades 6 through 12 were included in the analysis. Location of bullying Students were asked about the location of the bullying behavior. Response options included in a classroom at school (SC143), hallway or stairwell at school (SC168), bathroom or locker room at school (SC169), outside on school grounds (SC144), on a school bus (SC145), and somewhere else at school (SC146). Cafeteria at school (SC173) did not appear as a response option on the questionnaire, but was completed based on additional information provided by respondents during the interview. Beginning in 2013, this option will be added to the questionnaire. Saw student with a gun (SC086) Students were asked if they had actually seen another student with a gun at school during the school year. Security cameras (SC095) Students were asked if there were one or more security cameras to monitor the school to ensure student safety. Security guards or assigned police officers (SC028) Students were asked if there were security guards or assigned police officers present at their school to ensure student safety. Skipped class (SC077) Students were asked if they had avoided any classes because they thought someone might attack or harm them. Skipped school (SC078) Students were asked if they had stayed home from school because they thought someone might attack or harm them in the school building, on school property, on a school bus, or going to or from school. Staff supervision in hallways (SC029) Students were asked whether there was hallway supervision by school staff or other adults at school to ensure student safety. Student code of conduct (SC096) Students were asked if there was a code of student conduct, that is, a set of written rules or guidelines that the school provides to ensure student safety. Student was injured Students were asked about any injuries that resulted from being pushed, shoved, tripped, or spit on during bullying. Injuries asked about were bruises or swelling (SC149); cuts, scratches, or scrapes (SC150);, black eye/bloody nose (SC151); teeth chipped or knocked out (SC152); broken bones/internal injuries (SC153);
G - 5
being knocked unconscious (SC154); and other (SC155). This is a created variable where students who responded “yes” to any of these injuries were included in the “student was injured” category. Type of bullying Students were asked if any student had bullied them during the school year. Specifically, students were asked if another student had made fun of them, called them names, or insulted them (SC134); spread rumors about them (SC135); threatened them with harm (SC136); pushed, shoved, tripped, or spit on them (SC137); tried to make them do something they did not want to do (SC138); excluded them from activities (SC139); or destroyed their property (SC140). Type of cyber-bullying Students were asked if another student did any of the following behaviors anywhere to make them feel bad. Specifically, students were asked whether another student posted hurtful information about the respondent on the Internet (SC161); purposely shared private information about the respondent on the Internet or mobile phones (SC183); made unwanted contact by threatening or insulting the respondent via e-mail (SC170), instant messaging (SC162), text messaging (SC163), or online gaming (SC171); or purposefully excluded the student from an online community (SC172).
School Characteristic Variable Appended From the 2009–10 Common Core of Data (CCD)
Enrollment size (MEMBER09) This variable contains the total number of students for all grades or the reported total membership of the school. Percentage of students eligible for free or reduced-price lunch This is a created variable where the total number of free-lunch eligible and reduced-price lunch eligible students (TOTFRL09) is divided by the reported total membership of the school (MEMBER09). The TOTFRL09 variable is only available if both details (i.e., number of free lunch and reduced-price lunch eligible students) were reported in the CCD. Level (LEVEL09) This is the variable for school level. The following codes were calculated from the school’s corresponding values for lowest and highest grades:
1 = Primary (low grade = PK through 03; high grade = PK through 08); 2 = Middle (low grade = 04 through 07; high grade = 04 through 09); 3 = High (low grade = 07 through 12; high grade = 12 only); and 4 = Other (any other configuration not falling within the above three categories, including ungraded).
Locale This is a created variable based on the National Center for Education Statistics (NCES) urban-centric locale code (ULOCAL09).
1 = City, which includes 11 = City, Large Territory inside an urbanized area and inside a principal city with a
population of 250,000 or more. 12 = City, Mid-Size Territory inside an urbanized area and inside a principal city with a
population less than 250,000 and greater than or equal to 100,000. 13 = City, Small Territory inside an urbanized area and inside a principal city with a
population less than 100,000; 2 = Suburb, which includes
21 = Suburb, Large Territory outside a principal city and inside an urbanized area with a population of 250,000 or more.
G - 6
22 = Suburb, Mid-Size Territory outside a principal city and inside an urbanized area with a population less than 250,000 and greater than or equal to 100,000.
23 = Suburb, Small Territory outside a principal city and inside an urbanized area with a population less than 100,000;
3 = Town, which includes 31 = Town, Fringe Territory inside an urban cluster that is less than or equal to 10 miles
from an urbanized area. 32 = Town, Distant Territory inside an urban cluster that is more than 10 miles and less than
or equal to 35 miles from an urbanized area. 33 = Town, Remote Territory inside an urban cluster that is more than 35 miles from an
urbanized area; and 4 = Rural, which includes
41 = Rural, Fringe Census-defined rural territory that is less than or equal to 5 miles from an urbanized area, as well as rural territory that is less than or equal to 2.5 miles from an urban cluster.
42 = Rural, Distant Census-defined rural territory that is more than 5 miles but less than or equal to 25 miles from an urbanized area, as well as rural territory that is more than 2.5 miles but less than or equal to 10 miles from an urban cluster.
43 = Rural, Remote Census-defined rural territory that is more than 25 miles from an urbanized area and is also more than 10 miles from an urban cluster.
Percentage of combined American Indian/Alaska Native, Asian/Native Hawaiian/Other Pacific Islander, Black/African American, Hispanic/Latino, and two or more races students This is a created variable and is the sum of the following: American Indian/Alaska Native students (AM09), Asian/Pacific Islander students (ASIAN09), Black/African American students (BLACK09), and Hispanic/Latino students (HISP09), divided by the reported total membership of the school (MEMBER09). If the number of American Indian/Alaska Native students was not reported, this field was calculated by summing the American Indian/Alaska Native male (AMALM09), female (AMALF09), and unidentified (AMALU09) fields; if the number of Asian/Pacific Islander students was not reported, this field was calculated by summing the Asian/Pacific Islander male (ASALM09), female (ASALF09), and unidentified (ASALU09) fields; if the number of Black/African American students was not reported, this field was calculated by summing the Black/African American male (BLALM09), female (BLALF09), and unidentified (BLALU09) fields; and if the number of Hispanic/Latino students was not reported, this field was calculated by summing the Hispanic/Latino male (HIALM09), female (HIALF09), and unidentified (HIALU09) fields. Beginning with the 2008–09 school year, NCES began transitioning from five race/ethnicity categories for collection of aggregated data to seven race/ethnicity categories, which includes the additional categories ‘Native Hawaiian/Other Pacific Islander’ and ‘Two or more races.’ States had the option of reporting based on the 5-category or the 7-category system until 2010–11. For the 2009–10 CCD used in this report, Native Hawaiian is assumed to be included with the Pacific Islander category, and students of two or more races was reported by 14 states. For more information on this change, please refer to the October 19, 2007 Federal Register notice, Final Guidance from the Secretary on Maintaining, Collecting, and Reporting Racial and Ethnic Data to the U.S. Department of Education, located at http://www2.ed.gov/legislation/FedRegister/other/2007-4/101907c.html. Region This is a created variable based on the two-letter U.S. Postal Service abbreviation of the state where the school is located (LSTATE09). The following regions were created based on the state in which the school was located:
1 = Northeast (CT, ME, MA, NH, NJ, NY, PA, RI, VT); 2 = Midwest (IL, IN, IA, KS, MI, MN, MO, NE, ND, OH, SD, WI); 3 = South (AL, AR, DE, DC, FL, GA, KY, LA, MD, MS, NC, OK, SC, TN, TX, VA, WV); and 4 = West (AK, AZ, CA, CO, HI, ID, MT, NV, NM, OR, UT, WA, WY).
G - 7
Sector This is a created variable to denote public or private school sector based on the source of the data. Data from the CCD were coded as sector = 1 (public). Student-to-full-time-equivalent (FTE) teacher ratio (PUPTCH09) This variable provides the student-to-FTE teacher ratio.
School Characteristic Variables Appended From the 2009–10 Private School Universe Survey (PSS)
Enrollment size (NUMSTUDS) This variable represents the total number of students in the school. Level This is a created variable representing school level. The following categories were constructed using the school’s corresponding values for lowest (LOGR2010) and highest (HIGR2010) grades:
1 = Primary (low grade = PK through 03; high grade = PK through 08); 2 = Middle (low grade = 04 through 07; high grade = 04 through 09); 3 = High (low grade = 07 through 12; high grade = 12 only); and 4 = Other (any other configuration not falling within the above three categories, including ungraded).
Locale This is a created variable based on the National Center for Education Statistics urban-centric locale code (ULOCALE).
1= City, which includes 11 = City, Large Territory inside an urbanized area and inside a principal city with a
population of 250,000 or more. 12 = City, Mid-Size Territory inside an urbanized area and inside a principal city with a
population less than 250,000 and greater than or equal to 100,000. 13 = City, Small Territory inside an urbanized area and inside a principal city with a
population less than 100,000; 2 = Suburb, which includes
21 = Suburb, Large Territory outside a principal city and inside an urbanized area with population of 250,000 or more.
22 = Suburb, Mid-Size Territory outside a principal city and inside an urbanized area with a population less than 250,000 and greater than or equal to 100,000.
23 = Suburb, Small Territory outside a principal city and inside an urbanized area with a population less than 100,000;
3 = Town, which includes 31 =Town, Fringe Territory inside an urban cluster that is less than or equal to 10 miles from
an urbanized area. 32 = Town, Distant Territory inside an urban cluster that is more than 10 miles and less than
or equal to 35 miles from an urbanized area. 33 = Town, Remote Territory inside an urban cluster that is more than 35 miles from an
urbanized area; and 4 = Rural, which includes
41 = Rural, Fringe Census-defined rural territory that is less than or equal to 5 miles from an urbanized area, as well as rural territory that is less than or equal to 2.5 miles from an urban cluster.
G - 8
42 = Rural, Distant Census-defined rural territory that is more than 5 miles but less than or equal to 25 miles from an urbanized area, as well as rural territory that is more than 2.5 miles but less than or equal to 10 miles from an urban cluster.
43 = Rural, Remote Census-defined rural territory that is more than 25 miles from an urbanized area and is also more than 10 miles from an urban cluster.
Percentage of combined American Indian/Alaska Native, Asian/Native Hawaiian/Other Pacific Islander, Black/African American, Hispanic/Latino, and two or more races students This is a created variable that represents the sum of the percentages of Black/African American students (P_BLACK), Hispanic/Latino students (P_HISP), Asian students (P_ASIAN), Native Hawaiian/Other Pacific Islander students (P_ISLAND), American Indian/Alaska Native students (P_INDIAN), and students of two or more races (P_TWO). Region This is a created variable based on the two-letter U.S. Postal Service abbreviation of the state where the school is located (PL_STABB). The following regions were calculated based on the state in which the school was located: 1 = Northeast (CT, ME, MA, NH, NJ, NY, PA, RI, VT); 2 = Midwest (IL, IN, IA, KS, MI, MN, MO, NE, ND, OH, SD, WI); 3 = South (AL, AR, DE, DC, FL, GA, KY, LA, MD, MS, NC, OK, SC, TN, TX, VA, WV); and 4 = West (AK, AZ, CA, CO, HI, ID, MT, NV, NM, OR, UT, WA, WY). Sector This is a created variable to denote public or private school sector based on the source of the data. Data from the PSS were coded as sector = 2 (private). Catholic, other religious, and nonsectarian were reported using the RELIG variable, which is based on PSS variables P430 and P440. Variable P430 asks, “Does School Have Religious Orientation?” where 1 = Yes and 2 = No. Variable P440 asks for the school/program’s religious orientation or affiliation. Responses include: 01 = Roman Catholic, 02 = African Methodist Episcopal, 03 = Amish, 04 = Assembly of God, 05 = Baptist, 06 = Brethren, 07 = Calvinist, 08 = Christian (no specific denomination), 09 = Church of Christ, 10 = Church of God, 11 = Church of God in Christ, 12 = Church of the Nazarene, 13 = Disciples of Christ, 14 = Episcopal, 15 = Friends, 16 = Greek Orthodox, 17 = Islamic, 18 = Jewish, 19 = Latter Day Saints, 20 = Lutheran Church - Missouri Synod, 21 = Evangelical Lutheran Church in America, 22 = Wisconsin Evangelical Lutheran Synod, 23 = Other Lutheran, 24 = Mennonite, 25 = Methodist, 26 = Pentecostal, 27 = Presbyterian, 28 = Seventh-Day Adventist, and 29 = Other. The RELIG variable includes the following categories: 1 = Catholic (P430 = 1 and P440 = 1); 2 = Other religious (P430 = 1 and P440 = 02–29); and 3 = Nonsectarian (P430 = 2). Student-to-full-time-equivalent (FTE) teacher ratio This is a created variable that provides the student-to-FTE teacher ratio. It is calculated by dividing the total number of students in school (NUMSTUDS) by the number of K–12 teachers (NUMTEACH), in estimated FTEs.