student voices: the influence of the university campus
TRANSCRIPT

1
Student Voices: The influence of the University Campus
environment on physical activity and healthy eating habits
Nehal Natasha
Auckland University of Technology
A thesis submitted to Auckland University of Technology in partial fulfilment of the
requirements for the Master of Health Science degree
2019
School of Sport and Recreation

2

3
Thesis Abstract
This study investigated the experience of Auckland University of Technology (AUT)’s
students in terms of the campus environment and how it affected their physical activity,
eating and sedentary behaviours. The research question that this study aimed to answer
was: How does the physical environment of AUT City Campus affect students’ physical
activity levels, sedentary behaviour and eating behaviours?
Tertiary students have been found to spend most of their time in lectures and studying.
Both of which mainly consists of sitting for long periods of time (Rouse & Biddle, 2010).
There is limited research on prolonged sedentary behaviour in university students and its
effect on health and wellbeing. Health and wellbeing, in this study, is defined as the
absence of non-communicable diseases and maintaining a healthy lifestyle by being
physically fit and having a balanced nutrition. Extensive research has been conducted on
the determinants of students’ eating and physical activity behaviour-however, there is
limited amounts of research on the ways a university campus can facilitate healthy physical
and eating habits using students’ own suggestions.
In a case-design, eight participants were recruited to obtain what they considered as
barriers and facilitators to being sedentary, physically active and eating healthy in the
university campus. The citizen science for health equity methodology and participatory
action research approach using the first two stages were followed: Discover (campus walk
using an app and online surveys) and Discuss (action group). PhotoCap, an app, gathered
information on individuals’ perception of enablers and barriers by capturing photos of the
area or item and captioning it with brief explanations. Three surveys were included which
investigated the participants’ physical and eating habits. An action group was formed to
4
discuss possible solutions to overcome identified barriers from the campus walk. Thematic
analysis of the campus walks showed the following themes related to barriers and
facilitators: indoor and outdoor environment, affordability, variety, convenience,
promotions and advertisements. In particular, barriers relating to: unhealthy content of
vending machines, high cost of foods and gym membership, escalators and elevators that
discourage stair use. Common perceived facilitators were healthy campus eateries, student
kitchen areas to prepare home-cooked meals, bike racks that encourage active transport,
convenient on-campus gym, basketball court and stairs promoting physical activity. Other
barriers discovered in the action group were the lack of time, prioritising studying, lacking
the knowledge of student benefits such as rental of sport equipment, gym location, student
membership price, team sport opportunities.
In summary, a need for change was identified in the lifestyle of tertiary students to
facilitate physical activity, decrease sedentary activity and eat healthy through the
environmental barriers identified. This study aimed to set the foundation of future research
relating to the different aspects of tertiary students’ wellbeing and how it can be improved
with the input of students. A case-study design gave an in-depth understanding of the
campus environment effect on students and gave an insight into underlying effects.

5
Table of Contents
Thesis Abstract ........................................................................................................... 3
List of Figures ........................................................................................................... 11
Attestation of Authorship ......................................................................................... 13
Acknowledgements .................................................................................................. 14
Chapter 1: Introduction ............................................................................................ 15
Background .......................................................................................................... 15
Research Question ................................................................................................ 18
Thesis Rationale ................................................................................................... 19
Choice of Research Design .................................................................................. 20
Choice of Participants .......................................................................................... 20
Data Collection Methods...................................................................................... 21
Choice of Analysis ............................................................................................... 22
Uniqueness of the Thesis ..................................................................................... 23
Thesis Organisation .............................................................................................. 24
Chapter 2: A Literature Review................................................................................ 27
Summary .............................................................................................................. 27
Introduction ...................................................................................................... 28
Methods ............................................................................................................ 30
6
Study Selection ................................................................................................ 31
Physical Activity .................................................................................................. 32
Prevalence of Physical Activity and Inactivity in the Global and Local Context
...................................................................................................................................... 32
The Association between Physical Activity and Inactivity with Health
Outcomes. .................................................................................................................... 33
Determinants and Habits of Physical Activity of University Students ............ 34
Perceived Barriers and Facilitators of Physical Activities ............................... 35
Sedentary behaviour and activities....................................................................... 42
The association between sedentary behaviour levels and non-communicable
diseases ......................................................................................................................... 42
Sedentary patterns and behaviour amongst university/tertiary students .......... 43
Determinants of Sedentary behaviour and Activities ....................................... 44
Barriers and Facilitators of Sedentary Behaviour ............................................ 46
Nutrition and Diet ................................................................................................ 52
Dietary factors and Health outcomes ............................................................... 52
Habits and determinants of healthy food consumption .................................... 53
Perceived Barriers, Facilitators and Promotion of Healthy Food Consumption
...................................................................................................................................... 57
Authors ..................................................................................................................... 58
Main objectives ........................................................................................................ 58
7
Samples .................................................................................................................... 58
Methodology and methods ....................................................................................... 58
Summary of outcomes.............................................................................................. 58
Location of study...................................................................................................... 58
Implications and Recommendations for Future Studies ...................................... 63
Limitations ........................................................................................................... 63
Conclusion ....................................................................................................... 64
Chapter 3: Method.................................................................................................... 65
Introduction: ......................................................................................................... 65
Design .................................................................................................................. 65
Participants ....................................................................................................... 66
Qualitative Research Method ........................................................................... 67
Research Paradigm ........................................................................................... 69
Participatory Action Research Method ............................................................ 70
Citizen Science Approach ................................................................................ 71
Quantitative Research Method ......................................................................... 72
Case-study Method .......................................................................................... 73
Stages of the Study ............................................................................................... 74
Stage One ......................................................................................................... 74
Stage Two ......................................................................................................... 75

8
Procedures ............................................................................................................ 77
Tools ................................................................................................................. 78
Data Collection..................................................................................................... 80
Campus Walk ................................................................................................... 80
Action Group .................................................................................................... 81
Thematic analysis ............................................................................................. 82
Chapter 4: Findings and Interpretations ................................................................... 86
Participants ........................................................................................................... 86
International Physical Activity Questionnaire (IPAQ) scoring ........................ 88
Health Fair Questionnaire ................................................................................ 89
Health-promoting Lifestyle Survey II .............................................................. 91
Sedentary Behaviour ........................................................................................ 92
Nutritional Labels............................................................................................. 93
Campus Walk Photos ....................................................................................... 95
Campus Walk Findings ...................................................................................... 101
Variety ............................................................................................................ 101
Price (affordability) ........................................................................................ 101
Advertisements and Promotions .................................................................... 103
Outdoor Environment..................................................................................... 104
Indoor Environment ....................................................................................... 106

9
Convenience ................................................................................................... 107
Stage Two: Action group Findings ...................................................................... 110
Themes produced by action group discussion .................................................... 110
Elevators and Escalators ................................................................................. 112
Vending Machines ........................................................................................... 113
Campus Gym ................................................................................................... 114
Healthy Eating ................................................................................................. 115
Advertising ...................................................................................................... 116
Other Barriers .................................................................................................. 119
Chapter 5: Discussion ............................................................................................ 122
Stage One Interpretation .................................................................................... 122
Survey Interpretation .......................................................................................... 123
Stage Two Discussion (action group)................................................................. 126
Affordability ................................................................................................... 126
Promotion and Advertising ............................................................................ 128
Variety and Options ........................................................................................ 131
Chapter 6: Conclusion ............................................................................................ 133
Future Research and Practise Recommendations .............................................. 133
Limitations of Study ........................................................................................... 134
References .............................................................................................................. 138

10
Appendices ............................................................................................................. 152
Appendix 1: Ethics Approval ............................................................................. 153
Appendix 2: Ethics Amendment Approval ........................................................ 154
Appendix 3: Recruitment Advertisements ......................................................... 155
Appendix 4: Survey Questions and Questionnaires ........................................... 156
Appendix 5: Participant Information Sheet ....................................................... 160
Date Information Sheet Produced: ......................................................................... 160
Project Title ............................................................................................................ 160
What is the purpose of this research? ..................................................................... 160
How was I identified and why am I being invited to participate in this research? 160
How do I agree to participate in this research? ...................................................... 160
Inclusion & Exclusion criteria ............................................................................... 161
How will the research be measured? ...................................................................... 161
What are the discomforts and risks? ...................................................................... 162
How will these discomforts and risks be alleviated? ............................................. 162
What are the benefits? ............................................................................................ 162
What compensation is available for injury or negligence? .................................... 163
How will my privacy be protected? ....................................................................... 163
What are the costs of participating in this research? .............................................. 163
What opportunity do I have to consider this invitation? ........................................ 163

11
Will I receive feedback on the results of this research? ......................................... 163
What do I do if I have concerns about this research? ............................................ 163
Whom do I contact for further information about this research? ........................... 164
Researcher Contact Details: ............................................................................... 164
Project Supervisor Contact Details: ................................................................... 164
Appendix 6: Consent and Release Form ............................................................ 165
Appendix 7: Examples of data from the campus walk ...................................... 166
List of Figures
Figure 1: Summary of study design and phases ................................................................... 26
Figure 2: Graph showing the amount of energy spent by each participant over an average
week, using the IPAQ scoring system .................................................................................. 89
Figure 3: Graph showing participants' results of the Health Fair Questionnaire using the
scoring system ...................................................................................................................... 91
Figure 4: Graph showing each participants' score in the HPL survey using the HPL scoring
system ................................................................................................................................... 92
Figure 5: Graph showing the amount of perceived time participants spent on sedentary
activities on an average weekday. ........................................................................................ 93
Figure 6: Graph showing regularity of participants reading the nutritional labels of
consumed foods/drinks from the HPL survey ...................................................................... 93

12
Figure 7: Thematic Network of key words of barriers and facilitators of the campus
environment.......................................................................................................................... 98
Figure 8: Thematic Network of Stage One findings (campus walk). The red-outlined
bubbles represent the major themes derived from Stage One and the Blue-outlined bubbles
further breakdown the major themes.................................................................................. 100
Figure 9: Solutions to identified barriers generated from the action group ........................ 111
Table 1: Summary of all studies included in the review assessing physical activity with
health outcomes, prevalence, barriers, and enablers ............................................................ 41
Table 2: Summary of all studies included in the review assessing sedentary behaviour and
activity with the health outcomes, prevalence, barriers and enablers .................................. 51
Table 3: Summary of all studies included in the review assessing nutrition with health
outcomes, determinants, barriers and enablers .................................................................... 62
Table 4: Summary of Sage One's (campus walk) definitions .............................................. 85
Table 5: AUT participants' demographics from online surveys ........................................... 87
Table 6: Summary table showing each participants' survey response ................................. 94
Table 7: Number of pictures taken by each participant and grouped according to topic from
Stage One (campus walk) ..................................................................................................... 96
Table 8: Summary of barriers and solutions generated in the action/action group discussion
............................................................................................................................................ 121

13
Attestation of Authorship
I hereby declare that this submission is my own work and that, to the best of my knowledge
and belief, it contains no material previously published or written by another person nor
material to which a substantial extent has been accepted for the award of any degree or
diploma of a university or other institution of higher learning, except where due
acknowledgement is made.
Name Nehal Natasha
Date 3rd March, 2019

14
Acknowledgements
First and foremost, I would like to say a big thanks to my supervisor Dr. Erica
Hinckson for the guidance and support throughout the whole research and writing process.
She had spent a lot of time going through every part of the thesis and giving me
constructive criticism over the past year which I very much appreciated. She also motivated
me to better my writing and helped me to always take it an extra step.
Thank you to all the participants who took out time from their busy schedules to be
involved all stages of this study and being honest when answering and discussing
questions. All participants were very cooperative and without them this research wouldn’t
have been possible.
I would also like to say thanks to my family and friends for their mental and moral
support over my postgraduate study. They also constantly encouraged me to keep up with
my study and writing when I would have any difficulty.
Since this research involved human participants, I would like to acknowledge the
ethics approval by the Auckland University of Technology Ethics Committee. Date of
approval 1st October 2018, reference number 17/346. See Appendix 1 and 2 for complete
proof.

15
Chapter 1: Introduction
Background
In the past few years, obesity in New Zealand has drastically increased as well as in most
OECD (organisation for economic co-operation and development) countries such as
Australia and United States of America. According to the World Health Organisation
(WHO), obesity has globally increased by more than 50% since 1980 with 39% of adults
being overweight ("Obesity and overweight", 2017). Thirteen percent of which are obese.
Being obese or overweight is categorised by one’s body mass index (BMI). A BMI of 25 or
more is categorised as being overweight; 30 or more is classed as obese (Mei et al., 2002).
There are many factors that can contribute to being overweight such as diet, lifestyle,
physical activity, environmental factors and sedentary behaviour (Salbe et al., 2002;
Haslam & James, 2005). These factors can also lead to non-communicable diseases such as
type 2 diabetes, cardiovascular diseases, high blood pressure and metabolic syndromes
(Mokdad et al., 2003; Luppino et al., 2010). All of which are preventable.
In New Zealand, the recommended amount of physical activity for adults is 2.5 hours of
moderate or 1.25 hours of vigorous intensity physical activity per week ("Physical activity",
2018). For children and teenagers, at least one hour of moderate or vigorous physical
activity per day is recommended. However, only 51% of all adults are physically active for
at least 30 minutes per week and only 10% of high school students meet the recommended
60 minutes per week ("Physical activity", 2018). Physical inactivity identifies people who
don’t meet the recommended amount of regular physical activity as established by the
Ministry of Health or other health departments per their country (Kohl et al., 2012).

16
Sedentary behaviour refers to any waking behaviour with an energy expenditure of less
than 1.5 metabolic equivalents. This includes lying down, sitting, driving, sitting in a
reclining position, and engaging in screen-based and non-screen-based behaviours (Pate,
O'Neill & Lobelo, 2008; Sedentary Behaviour Research Network, 2012; Tremblay et al.,
2017). Metabolic equivalent is a measure of exercise based on energy consumption per unit
of body weight. Currently, there are no official guidelines or recommendations on sedentary
behaviour for youth from the Ministry of Health New Zealand, other than mentioning to
limit the behaviour. According to University of Auckland’s Youth 12 survey, 28% of high
school students watch television for 3 or more hours. Thirty-five percent use the internet for
3 or more hours (Clark, Fleming, Bullen, Denny, Crengle, Dyson, & Rossen, 2013). Long
periods of sedentary behaviour, regardless of physical activity levels, can lead to weight
gain, certain types of cancers, cardiovascular diseases, and adiposity (Thorp, Owen,
Neuhaus & Dunstan, 2011). An association between increased screen time and depression
has been identified in children and adolescence (Rezende, Rodrigues Lopes, Rey-López,
Matsudo & Luiz, 2014). Sedentary behaviour and physical inactivity are independent from
one another and both need to be considered separately when undertaking a healthy lifestyle
(Pate, O'Neill & Lobelo, 2008; Sedentary Behaviour Research Network, 2012; Tremblay et
al., 2017).
Having an unhealthy diet is a major risk factor for non-communicable diseases as it can
lead to type 2 diabetes, high blood pressure, cholesterol, strokes, heart diseases and
reproductive issues (Popkin, 2006; Loef & Walach, 2012). There are official recommended
dietary intakes for nutrients, food groups, vitamins and minerals on the New Zealand’s
Ministry of Health and the Nutrition Foundation websites. However, New Zealanders are
now spending more on fast food and restaurant meals rather than spending it on grocery

17
items and home cooked meals (Eyles et al., 2018). Fast foods are usually high in sodium,
saturated fat, and carbohydrates; all of which when consumed in high amounts can be
detrimental to health (Bowman, Gortmaker, Ebbeling, Pereira & Ludwig, 2003). Due to the
convenience and affordability, fast food consumption has increased over the years (Eyles et
al., 2018).
The three factors: nutrition, physical activity and sedentary behaviour, are few of the
major risk factors for developing non-communicable diseases. There has been extensive
research on primary school children and high school students in terms of the environmental
risk factors affecting their heath and how certain changes of the schools’ environment can
decrease the risks; changes such as introducing standing desks, incorporating more sport
activities in the curriculum, and educating both students and parents on nutritional
guidelines (Veitch, Salmon & Ball, 2010; Hinckson et al, 2013; Salmon et al, 2011).
However, there is a limited amount of research conducted on tertiary students, compared to
high school and primary school students, in terms of what affects their health and what
changes can be made in order to improve it. Tertiary students tend to spend the majority of
their time on campus; the environment will tend to influence students’ lifestyle in terms of
eating choices, engaging in physical activity and leisure activities (Keating, Guan, Piñero &
Bridges, 2005). Since tertiary institutes do not integrate physical activity in the curriculum
and students have more independence in making their lifestyle decisions, it may lead to
unhealthy choices based on external factors. Barriers in and around the campus can be
changed to facilitate healthy habits of students. There has been previous research conducted
on tertiary students to understand what factors influence their food consumption decision.
Price, taste, convenience and weight control were important factors that influenced their
choice (Glanz, Basil, Maibach, Goldberg & Snyder, 1998). As for physical activity

18
engagement, it was found that when students had begun attending university, the number of
students’ gym memberships had decreased (Deliens, Deforche, De Bourdeaudhuij &
Clarys, 2015). Sedentary behaviour had also increased substantially due to increased study
periods, screen time and video game usage (Greenwood-Hickman, Renz, & Rosenberg,
2015; Shuval, Hébert, Siddiqi, Leonard, Lee, & Tiro, 2013). Time was the most important
influencer for students partaking in physical activity (Greenwood-Hickman, Renz &
Rosenberg, 2015). Most students preferred engaging in sedentary activities during their
leisure time due to mental and physical fatigue (Shuval, Hébert, Siddiqi, Leonard, Lee, &
Tiro, 2013). Students who were physically active reported that perceived enjoyment of the
activity was one of the important factors in partaking (Deliens, Deforche, De
Bourdeaudhuij & Clarys, 2015). Availability and accessibility to the gym and sport
equipment were also important influences; this includes the price of the gym membership
(Deliens, Deforche, De Bourdeaudhuij & Clarys, 2015; Buckworth & Nigg, 2004).
Considering what students themselves perceived to be important factors in their choices can
help in altering the environment to improve health choices. This can also help set in healthy
habits that people can carry on with as they get older to prevent the onset of non-
communicable diseases.
Research Question
The research question: “How does the physical environment of AUT City Campus affect
students’ physical activity levels, sedentary behaviour and eating behaviours?” was
developed to address the lack of research in the solutions, catered to tertiary students,
required to overcome environmental barriers to physical activity, sedentary behaviour and
healthy eating.

19
The aim was to generate realistic solutions to overcome the identified perceived barriers
in regard to physical activity, sedentary behaviour and heathy eating using the Citizen
Science approach. This was done by:
1) Asking each participant what they perceived to be the environmental barriers to
and facilitators of healthy eating, physical activity and sedentary behaviour via
PhotoCap
2) Collecting data on their eating and physical activity habits via three online
surveys
3) Forming an action group to discuss the found barriers and facilitators and using
that process to generate realistic solutions and interventions.
Thesis Rationale
This project aimed to explore and understand university students’ perception of what
they considered the barriers and facilitators to be for physical activity, sedentary behaviour
and healthy eating. It used the PhotoCap application which enables users to take pictures of
areas and/or items and generate a caption to explain why they consider it a barrier or
facilitator. GPS Trip Tracker was also used. This application has a feature that tracks the
route and length of the walk during a campus walk.
This study used a case study approach to identify the perceived environmental barriers
and facilitators that may affect students. Using a case study design enabled the researcher to
have a deeper understanding of participants’ personal experiences through various methods
as it is a flexible data collection method. Using a participatory action research approach,
participants discussed realistic solutions and interventions to overcome the identified
barriers in order to improve the campus environment to be a better facilitator of a healthy
lifestyle catered to AUT students.

20
Choice of Research Design
A mixed methods research design was used to answer the research question as it mostly
required the experience and opinions of participants rather than objective, close ended
questions; as in quantitative study designs. Using a qualitative approach for this research
was appropriate because:
• It gave an insight and understanding into the experiences and perceptions of
participants regarding their environment
• It allowed the researcher flexibility to ask in depth questions regarding the factors
that influence participants’ eating, physical activity and sedentary behaviour and
patterns.
• Emerged themes from discussions and interviews allowed for an understanding of
problems and issues that might not have been foreseen otherwise.
A qualitative study is mainly used for exploratory research as it is used to gain
understanding of underlying motivations, reasons, meanings and opinions of participants
that may not be fully explored via a quantitative method. Qualitative approach is a method
of observation to gather data that is non-numerical and is best for researching and
understanding the human experience. The data from this type of research cannot be
generalised as the experiences and thoughts of each person may be different and the
students of AUT may have different opinions compared to students of other universities. In
this research, a qualitative study was used to reflect the participants’ opinions on the
perceived barriers and enablers of students’ wellbeing on campus.
Choice of Participants
This research required the involvement of participants that attend the AUT City campus
as students; either postgraduate or undergraduate. Students were recruited from the City

21
campus. Recruited participants were also required to be able to walk or wheel around the
campus freely.
Participants were selected using sample of convenience which is a non-probability
sampling technique. This is a technique in which participants are selected due to their
accessibility to the researcher. Samples are gathered in a process whereby the individuals in
the population do not have equal chances of being selected. A sample of convenience is
useful for this research as a limited number of participants are required and limited time
was given to obtain the participants (Etikan, Musa & Alkassim, 2016). Informative posters
were placed around the campus to recruit participants. The poster was also used on social
media to increase awareness. Posters included the purpose and stages of the study, along
with the researcher’s contact information and ethics approval number.
Data Collection Methods
Surveys, action groups and individual interviews were employed to collect in-depth data
in regard to the physical environment of the campus effect on participants’ physical activity,
sedentary behaviour and diet. Each of these methods were useful in obtaining more
information regarding the different stages of the study (see Figure 1 below for summary of
study design). Stage One, Part One required the opinions of participants in terms of what
they perceived to be barriers and facilitators of healthy eating, physical activity and
sedentary behaviour. Data were collected using an application on an iPad that enables the
user to take photos and add captions to those photos. Participants were required to state
what they perceived to be barriers and facilitators and had to explain their reasons. Stage
One, Part Two obtained data on participants’ eating and physical activity habits using three
surveys: Health Fair Questionnaire, International Physical Activity (Fogelholm et al., 2006)
and Health Promoting Lifestyle survey (Pinar, Celik & Bahcecik, 2009). The surveys
22
included both qualitative and quantitative questions. These surveys were online, which
allowed the participants to access them via a link if they required more time than the
allocated time of an hour to complete it. Stage Two involved an action group in which
participants discussed the barriers identified from Stage One and generated potential
solutions catering to students.
Choice of Analysis
Thematic analysis was used to identify key themes and categories from Stages One and
Two (Figure 1, page 26). Thematic analysis aids in the recognition of patterns or themes
across the data sets that may be important to understand a phenomenon or that can help to
answer a research question. It is mainly used in qualitative studies (Clarke & Braun, 2016).
Themes were identified through a process of data coding, familiarisation and theme
development. One of the advantages is the flexibility that it provides when used in different
frameworks to answer different types of research questions (Clarke & Braun, 2016). It
assists in the understanding of the meaning of the data from the in-depth data sets and in the
interpretation of the perceptions of participants. In this study, thematic analysis enabled the
researcher to find common themes amongst participants in regard to their thoughts and
opinions.
The findings from the online surveys were mainly quantitative data that were analysed
via scoring the three surveys. The mean, maximum and minimum values from each survey
are shown to highlight the difference in data between the participants.
The International Physical Activity Questionnaire (IPAQ) was analysed by using the
IPAQ scoring system. The amount of time participants spent in low-, moderate- and high
intensity activity levels were multiplied by the metabolic equivalent of task (MET)
associated with the reported level of activity. The value was then multiplied by the number

23
of days they reported engaging in those activities. This calculates the amount of a
participants’ spent energy.
The Health Fair questionnaire captures participants’ self-reported eating habits by
inquiring about participants’ frequency of fruit and vegetables consumption in a daily and
weekly basis. This questionnaire was analysed via grouping the most common answers as
to how often they eat certain foods with either ‘regularly’, ‘often’, ‘sometimes’ and ‘never’
as represented by A, B, C and D, respectively, on the survey (see Appendix 4).
To measure health promoting behaviour, in terms of healthy eating habits, the self-
reported Health Promoting Lifestyle Survey was used as a tool. The original survey has 52
items that measures a few domains of heath promoting behaviour such as: health
responsibility, spiritual growth, nutrition, stress management, physical activity and
interpersonal relationships. This survey was amended to only include questions relating to
nutrition for the purpose of the study. The survey measures the frequency of self-reported
behaviours related to eating habits. The data was analysed by calculating the mean of the
participants’ response to the questions which shows whether the participant has healthy
eating habits and behaviours.
Uniqueness of the Thesis
Over the last few years, the prevalence of obesity has been increasing in both children
and adults. There are many factors that can lead to this which can further lead to non-
communicable diseases. There has been research conducted in preschool, primary and high
schools, both locally and internationally, to understand the factors that lead to obesity
through qualitative and quantitative research methods. Also, interventions to reduce the
prevalence were studied.

24
However, there are not many published studies related to the health of university students
especially in New Zealand; particularly regarding how the university environment affects
their physical activity, sedentary behaviour and eating habits. This study is unique as the
citizen science approach and participatory research are applied to gather information,
understand student perception and identify possible solutions.
The Citizen Science approach for health equity was particularly important as it identified
the needs of the students which may be different from what other populations may perceive
as barriers (Bonney et al, 2009). The study also allowed students to be part of solving
identified issues through the action group. This approach has a high effectiveness in
suggesting solutions for the identified issues as those solutions are catered to students,
especially students who attend the City campus (Ottinger, 2010). The action group also
allowed participants to highlight other issues that may not have been identified from Stage
One (campus walk) and discuss potential interventions to overcome it.
Thesis Organisation
This thesis contains six chapters: Introduction, Literature Review, Methods, Findings and
Interpretations, Discussion and Conclusion. The Literature Review critically analyses and
reviews various published literatures relating to healthy eating, physical activity and
sedentary behaviour findings. These findings are mainly of health outcomes and perceived
barriers of each wellbeing factor from other university students. The Methods chapter
highlights and justifies the research and data collection methods used. It also outlines the
research design, participants’ description, data collection and analysis implemented in the
study. The Findings and Interpretation chapter states key findings from all two stages.
Graphs, figures, tables and thematic networks are also utilised to illustrate the findings.
Chapter 5, Discussion, analysed and reflected on the findings. It also related it back to the
25
Literature Review to compare and contrast key findings from this and previous relevant
research. It also contains a subsection for practise recommendations based on findings. The
Conclusion chapter summarises the findings and evaluates the study in terms of strengths
and limitations.

26
Campus Walk
• Identifyenvironmentalbarriers andfacilitators
• PhotoCap andGPS TripTracker
Questions
• Demographics
• Three onlinesurveys (HPL,HFQ & IPAQ)
Phase Two
• Action group
• Discussidentifiedbarriers
• Generaterealisticsolutions
Figure 1: Summary of study design and phases
Phase One

27
Chapter 2: A Literature Review
Summary
In this review, the aim was to investigate the influence of the university environment on
health outcomes and behaviours such as diet and physical activity in university students and
adults in the general population. MEDLINE via PubMed and EBSCO, Wiley and
ScienceDirect via Google Scholar with full text databases were used to search for literature
and studies from 1995 up to May 2018. The inclusion criteria were studies with: original
research which included university students who were at least 17 years of age, full text,
English articles, with regards to health outcomes, and reviews of university environment by
students. The search identified 37000 articles altogether and 28 were selected for a full
review. Out of the 28, only 15 studies were included for a full review as they met all of the
inclusion criteria. The review identified a number of studies related to objectively measured
physical activity in children and adults. Studies relating to sedentary behaviour were
uncommon for the population of tertiary students. The review showed a common theme of
university students’ level of physical activity declining when starting university and
increasing sedentary behaviour and activities instead. Cost, accessibility and availability of
nutritious foods on and around campus were major barriers to eating healthier. For physical
activity, time and fatigue were barriers as university students tend to spend most of their
time studying and are usually too tired to partake in sports and recreation. Students also
liked to indulge in sedentary behaviour such as watching television and gaming as they
found it relaxing and inexpensive. The theme of cost and limited time was common
amongst studies regarding physical activity and inactivity despite the different populations

28
and study methods. Future research should focus on examining New Zealand universities’
environment from students’ perspective and performing interventions that would increase
intake of healthy foods, physical activity and/or decrease of sedentary behaviour to observe
the effectiveness in the global and local context.
Introduction
There has been an increase in the prevalence of non-communicable diseases (NCD) such
as obesity, cerebrovascular accident (stroke), some cancers, myocardial infarction, and
diabetes in both New Zealand and in other first world countries (WHO, 2018). Non-
communicable diseases are preventable, long-term diseases that are not caused by
infectious agents and have a slow progression. People of 30 to 70-year olds living in New
Zealand have a 11% chance of dying due to a non-communicable disease (WHO, 2014).
Preventative measures of NCDs include the reduction of alcohol, physical inactivity,
tobacco use and having a healthy diet (WHO, 2018).
University students spend an average of 37.6 hours per week on campus either studying
or attending classes (Balslev, 2017). Although studying has a positive effect on students’
learning, sitting down for long periods of time can result in increased levels of physical
inactivity and sedentary behaviour which can increase the risk of NCD (Saunders, Chaput
& Tremblay, 2014; Owen, Salmon, Koohsari, Turrell & Giles-Corti, 2014). The physical
indoor and outdoor environment of the university campus can have an influence on the
choices of students’ health behaviours such as diet, physical activity patterns which are
determining factors of NCDs (Lee & Loke, 2005). The topic of health behaviours in
university/ tertiary students has been researched globally however there are relatively few
studies conducted in New Zealand that provide the local context and understanding of how
environment affects students’ choices and how these choices can be altered. This chapter

29
will critically review findings from international and New Zealand studies (Table 1. Page
41.)
The term ‘University students’ refers to students who are enrolled full time at a tertiary
institution in either an undergraduate or postgraduate qualification. The terms ‘physical
inactivity’ and ‘sedentary behaviour’, are often used interchangeably even though they are
used to define different concepts. Physical inactivity refers to people who do not meet the
recommended physical activity guideline whereas sedentary behaviour is used to define any
waking behaviour that has an energy expenditure of less than 1.5 metabolic equivalent in a
sitting, lying or reclining posture (METs) (Robbins, Pis, Pender & Kazanis, 2004; Pate,
O'Neill & Lobelo, 2008; Sedentary Behaviour Research Network, 2012; Tremblay et al.,
2017). Some studies reviewed do not define their terms, however they are relevant to the
thesis as many of these studies do capture physical activity and inactivity behaviours and
patterns of tertiary students.
Currently, there are loose or broad definitions for the term ‘highly nutritional’; although
most papers use this to classify foods and beverages that have low calories or energy
density such as fruits, vegetables, lean meats, fat-free and low-fat dairy products,
wholegrains and legumes. For the purpose of this research foods and beverages with a high
amount of vitamins and minerals relative to low calories will be referred to as ‘highly
nutritional’ or ‘nutritionally dense’ (Drewnowski & Fulgoni, 2008).
Auckland University of Technology’s library database was used find research studies and
journal articles for this literature review. Google Scholar and MEDLINE were used as the
main sources as they include journal articles in the fields of health sciences and allied
health. The keywords used to collect literature were: physical inactivity, sedentary
behaviour, eating behaviours, college students, university students, campus and

30
environment, in different combinations. Fifteen literatures reviews and individual articles
from 1995 to 2018 were included from the search. Earlier studies were not included due to
outdated data and information. Other sources were used to support the claims and results
from the mentioned studies.
This chapter reviews literature and studies of global and local context of nutrition,
sedentary behaviour and physical activity in university/college students. It firstly discusses
the evidence supporting the association between physical activity, sedentary behaviour, and
nutrition with non-communicable diseases and other chronic health conditions. Secondly,
the physical activity and sedentary behaviour levels of university students are discussed,
drawing attention to the declining rate of physical activity and nutrition after attending
secondary school and commencing a tertiary institute. Thirdly, the factors that influence
eating patterns and behaviours amongst adults and university students are explored. Lastly,
perceived facilitators and barriers of all physical activity, sedentary behaviour and diet are
discussed, along with possible recommendations generated from the literature itself to
overcome the recognised barriers.
Methods
Searches were conducted using MEDLINE via PubMed and EBSCO, Wiley, Springer
Link and ScienceDirect via Google Scholar. Only studies that were from 1995 to 2018 were
included for its updated data and information. Any studies or literature reviews that
reported on the eating and/or exercise habits, and sedentary behaviour of tertiary students
were searched through the databases. Health outcomes of eating, exercise habits and
sedentary behaviour were also searched. The key words used to conduct the search were
‘nutrition’, ‘eating habits’, ‘physical activity’, ‘sedentary behaviour’, ‘university/college
students’, and ‘health outcomes’. Only full-text, English literatures and articles were used
31
for the review. Searches were limited to peer reviewed journals, articles written in English
and were available in full-text.
Study Selection
All abstracts of all articles generated by the database search were reviewed and selected
in terms of what was relevant to the literature review. Studies were excluded from the
review if at least one of the following exclusion criteria were met: studies based in high
schools and primary schools, participants who were less than 17 years old, and studies that
focused on other factors of a healthy lifestyle such as drugs and alcohol. Studies were also
excluded if full-texts were not available and if they were written in any languages other
than English.
The first step of the search process of study selection had identified 37000 articles. After
limiting to articles that were available in English, full-text, from peer reviewed journals and
was published after 1995, 10,735 articles had remained. Additional limitations of tertiary
students, barriers and facilitators of campus environment, and self-reported answers were
applied. The second step of the search process had resulted in the exclusion of 10,707
articles based on the abstracts of these articles. Many articles were excluded as they were
duplicates, didn’t discuss self-reported results and/or focused on one ethnicity. The 28
remaining articles were selected for a full review and 15 of these texts had met all of the
inclusion criteria.

32
Physical Activity
Prevalence of Physical Activity and Inactivity in the Global and Local Context
The term ‘physically inactive’ is defined as someone who is not achieving the
recommended physical activity guidelines of engaging in moderate to vigorous intensity
activities for at least 150 minutes per week (Bauman et al., 2012). Whereas the term
‘physically active’ is used to describe an individual who meets the recommended
guidelines. Out of the 15 studies reviewed, 3 studies assessed the prevalence of physical
activity and inactivity as detailed in Table 1, page 41. Around 45-50% of university/college
students were physically inactive in a study conducted in America (Keating, Guan, Piñero,
& Bridges, 2005). Globally, 23% of adults did not meet the physical activity guidelines
(WHO, 2018). In high income countries, 26% of males and 35% of females were physically
inactive compared to 12% of males and 24% of females from low income countries (WHO,
2018). Just over half of New Zealand adults (51%) were physically active for at least 30
minutes on 5 days or more per week and it was also reported that men were more likely to
be physically active compared to women (55% and 48% respectively) (MOH, 2014). In
terms of ethnic differences, Pacific and Asian adults were less likely to be physically active
compared to non-Pacific and Asians (MOH, 2014). A large reduction in physical activity
occurs in New Zealand adolescents towards the end of secondary school education, when
tertiary education begins (Sinclair, Hamlin, & Steel, 2005). There is currently no data on
the physical activity level of New Zealand’s university students’ or the statistics of
participation that occurs before, during and/or after university in terms of physical activity.
However, a pilot study, with a small, non-representative sample, was conducted in a New
Zealand university and found that only 40% of participants complied with the physical
33
activity guidelines (Sinclair, Hamlin, & Steel, 2005). This statistic cannot be used to
generalise the entire tertiary student population as there were only 60 participants involved
in the study (Table 1. Page 41).
The Association between Physical Activity and Inactivity with Health
Outcomes.
Physical inactivity is a modifiable risk factor for heart diseases such as coronary disease,
myocardial infarction, diabetes mellitus, osteoporosis, blood pressure and depression
(Reiner, Niermann, Jekauc, & Woll, 2013; Janssen & LeBlanc, 2010). A systematic,
quantitative review of 15 longitudinal studies were assessed by Reiner, Niermann, Jekauc,
& Woll for the association between physical activity and inactivity with health outcomes.
This is detailed in Table 1, page 37. There is an overall negative relationship between
physical activity and weight gain and/or obesity; with a required 45-60 minutes of brisk
walking performed daily to maintain weight. Interestingly, a reduced weight gain of 0.25 kg
per year for males and 0.53 kg per year for females was observed for every 30-minute walk
they engaged in (Reiner, Niermann, Jekauc, & Woll, 2013; Swift, Johannsen, Lavie, Earnest
& Church, 2014). People with a higher body fat mass at baseline had shown a greater
weight reduction with regular physical activity compared to people with a leaner mass.
Physical activity has been associated with a reduction in the incidence of type 2 diabetes
mellitus (T2D) overtime, even after adjusting for BMI. A moderate to vigorous intensity
activity was needed to be performed at least once per week to have a positive effect to
reduce the risk of type 2 diabetes mellitus (Reiner, Niermann, Jekauc, & Woll, 2013). This
is due to the increased muscle contraction which induces the translocation of glucose
transporters (GLUT4) to facilitate the diffusion of glucose into adipose and muscle cells.
This decreases blood glucose levels and also contributes to improved insulin action and
34
glucose disposal (Richter & Hargreaves, 2013). Increasing the intensity and frequency of
activities with an increasing age was necessary to achieve the same risk reduction. Other
risk factors for T2D included obesity and lack of physical fitness (Reiner, Niermann,
Jekauc, & Woll, 2013). Physical fitness is defined as the ability to perform occupational,
sports and daily activities without undue fatigue (Corbin, Pangrazi, & Franks 2000).
Physically active people have a lower risk of developing cognitive impairment and have
a higher cognitive ability (Saxena, Van Ommeren, Tang & Armstrong, 2005; Reiner,
Niermann, Jekauc, & Woll, 2013). Activities of low intensity have been found to have a
negative association with the incidence of dementia (Saxena, Van Ommeren, Tang &
Armstrong, 2005).
Determinants and Habits of Physical Activity of University Students
Social influence impacts on physical activity (Sinclair, Hamlin, & Steel, 2005). It was
reported that as peer support increased, frequency of physical activity at university also
increased (Sinclair, Hamlin, & Steel, 2005). Four out of the 15 reviewed studies were
related to the determinants of physical activity of tertiary students which are detailed in
Table 1, page 41. In a New Zealand university, students who were members of a recreation
club or gym spent an average of 709 minutes per week on physical activity; whereas non-
members spent an average of 401 minutes per week. Unfortunately, memberships to these
clubs had decreased by 47% when participants had commenced university (Sinclair,
Hamlin, & Steel, 2005). Age was found to be a determinant of physical activity as younger
students tended to participate more frequently in vigorous intensity physical activities
compared to older students (Buckworth & Nigg, 2004). The older the males, the more
regular their exercise participation was whereas the opposite was true for females; the older
the females were, there was less participation in moderate to vigorous intensity physical
35
activity (Buckworth & Nigg, 2004). Even though males reported a higher engagement in
physical activity, they also reported spending more time engaged in sedentary activities
such as television watching, and computer use. For females, television watching was
negatively correlated with physical activity participation although studying was positively
correlated (Buckworth & Nigg, 2004).
Perceived enjoyment of participation in physical activity was one of the main factors
influencing regular engagement as students were more likely to be physically active if they
enjoyed doing so (Deliens, Deforche, De Bourdeaudhuij & Clarys, 2015). Other influencers
were availability and accessibility of sport lessons and facilities. In addition to this, cost of
membership of sports clubs was an important factor as college students tended to have a
tight budget (Deliens, Deforche, De Bourdeaudhuij & Clarys, 2015; Buckworth & Nigg,
2004). Students who lived in the university residence used active transport such as cycling
and walking less often compared to when they attended secondary school. During exam or
test periods, most students became physically inactive due to studying for long periods of
time. Time and convenience were both important factors in physical activity levels as
students often had limited free time owing to lectures, studying and working. When they
had free time, they preferred to spend it on relaxing activities such as reading or watching
television rather than engaging in physical activity of any intensity as that resulted in more
physical fatigue, as reported by students (Deliens, Deforche, De Bourdeaudhuij & Clarys,
2015).
Perceived Barriers and Facilitators of Physical Activities
Enablers or facilitators for university students to be active were enjoyment, motivation to
lose weight, social support of their peers, social interaction, and availability of safe parks to
exercise in (Deliens, Deforche, De Bourdeaudhuij, & Clarys, 2015; Shuval, Hébert, Siddiqi,

36
Leonard, Lee, & Tiro, 2013; Grubbs & Carter, 2002). Students also reported that they
appreciated sports as they enjoyed healthy competitions with different teams. Peer and
social support were also enablers as students were more likely to be physically active if
their room-mates or friends joined them too and peers also helped them to be accountable
to their goals (Deliens, Deforche, De Bourdeaudhuij & Clarys, 2015; Buckworth & Nigg,
2004). Students found that engaging in physical activity would leave them with positive
feelings associated with relaxation, improved mood and energy, and being in shape. This
motivated them to engage in such activities more regularly (LaCaille, Dauner, Krambeer
&Pedersen, 2011). Having facilities on campus that provided free or discounted rates for
students was a facilitator for physical activity as it helped students stick to their budget and
lead a healthy lifestyle (Shuval, Hébert, Siddiqi, Leonard, Lee, & Tiro,2013).
Lack of time was perceived as the biggest barrier to physical activity due to busy class
schedule followed by insufficient finances, physical exertion and fatigue, and
neighbourhood crimes (Shuval, Hébert, Siddiqi, Leonard, Lee, & Tiro,2013; Deliens,
Deforche, Deeteame Bourdeaudhuij & Clarys, 2015; Grubbs & Carter, 2002).
Neighbourhood crimes were a factor as a barrier as students sometime may have felt unsafe
to go for a run around the block or park (Grubbs & Carter, 2002). In a study mentioned
earlier, cost, availability and accessibility of sport clubs and facilities were also major
determinants of physical activity. Since students tend to have limited funds, a perceived
barrier to physical activity are expensive memberships as students are unwilling or unable
to spend a large amount (Deliens, Deforche, De Bourdeaudhuij & Clarys, 2015; Buckworth
& Nigg, 2004). Being uninformed about sports events was surprisingly found to be a
barrier to physical activity as the free sports events that were offered on campus often went
unnoticed as students claimed that they were unaware or not well informed by the

37
university about free or discounted campus facilities and sport lessons (Deliens, Deforche,
De Bourdeaudhuij & Clarys, 2015). Even though there were free or discounted facilities
available, some found the crowds in the facilities to be a barrier. Also added cost of group
fitness classes and not knowing how to use fitness equipment was seen as a challenge by
students, hence their motivation and frequency of participation decreased (Deliens,
Deforche, De Bourdeaudhuij & Clarys, 2015; Buckworth & Nigg, 2004). The transition
from secondary school to a tertiary institute was found to be challenging as changes in
policy and requirements had been seen as a barrier. In secondary school, sports and physical
activity were part of the compulsory curriculum whereas in university, there was no
obligation to participate in activities so students tended not to (Deliens, Deforche, De
Bourdeaudhuij & Clarys, 2015).
38
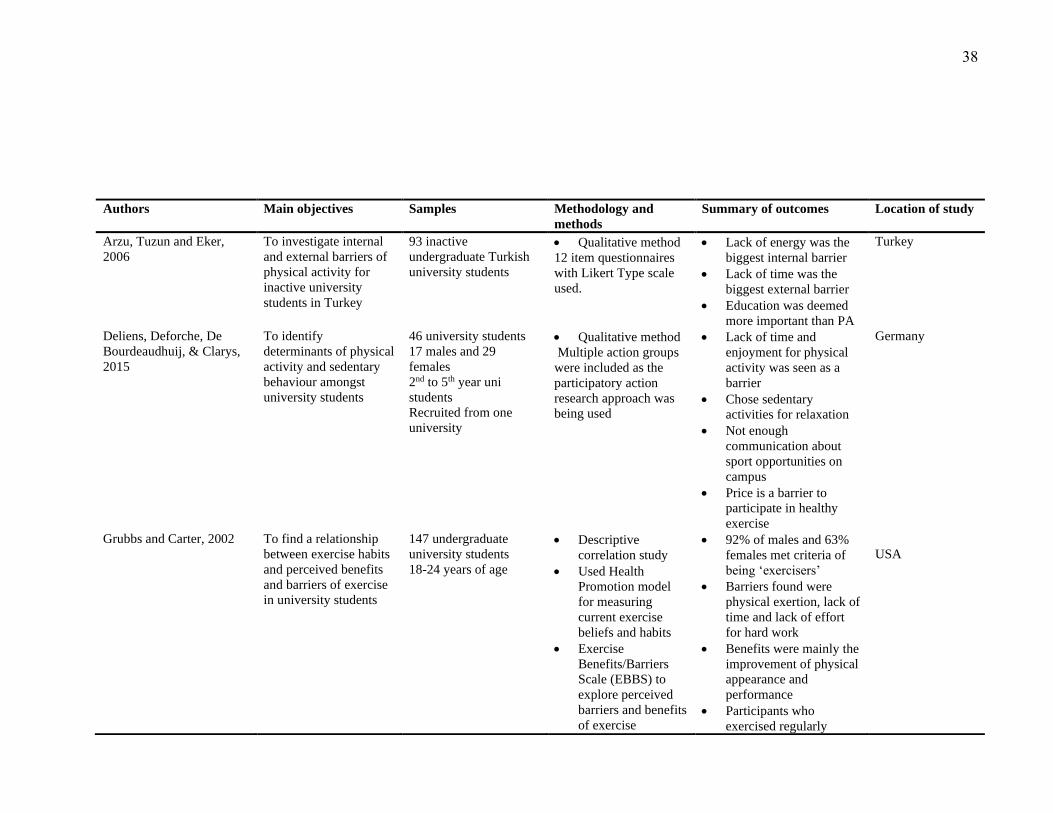
Authors Main objectives Samples Methodology and
methods
Summary of outcomes Location of study
Arzu, Tuzun and Eker,
2006
To investigate internal
and external barriers of
physical activity for
inactive university
students in Turkey
93 inactive
undergraduate Turkish
university students
• Qualitative method
12 item questionnaires
with Likert Type scale
used.
• Lack of energy was the
biggest internal barrier
• Lack of time was the
biggest external barrier
• Education was deemed
more important than PA
Turkey
Deliens, Deforche, De
Bourdeaudhuij, & Clarys,
2015
To identify
determinants of physical
activity and sedentary
behaviour amongst
university students
46 university students
17 males and 29
females
2nd to 5th year uni
students
Recruited from one
university
• Qualitative method
Multiple action groups
were included as the
participatory action
research approach was
being used
• Lack of time and
enjoyment for physical
activity was seen as a
barrier
• Chose sedentary
activities for relaxation
• Not enough
communication about
sport opportunities on
campus
• Price is a barrier to
participate in healthy
exercise
Germany
Grubbs and Carter, 2002
To find a relationship
between exercise habits
and perceived benefits
and barriers of exercise
in university students
147 undergraduate
university students
18-24 years of age
• Descriptive
correlation study
• Used Health
Promotion model
for measuring
current exercise
beliefs and habits
• Exercise
Benefits/Barriers
Scale (EBBS) to
explore perceived
barriers and benefits
of exercise
• 92% of males and 63%
females met criteria of
being ‘exercisers’
• Barriers found were
physical exertion, lack of
time and lack of effort
for hard work
• Benefits were mainly the
improvement of physical
appearance and
performance
• Participants who
exercised regularly
USA

39
perceived more benefits
than non-exercising.
Janet Buckworth and
Claudio Nigg, 2004
To find the correlation
of physical activity,
exercise and sedentary
behaviour with
demographics of
university students
493 university students
from a Midwestern
University from various
year of studies
Both males and females
Qualitative study using
questionnaires to
measure physical
activity, exercise &
sedentary behaviours
• Average of 30 hours per
week spent on sedentary
activities (mostly
studying)
• Males reported spending
more time watching TV
and also engaged in
more time either
exercising or moderate-
vigorous intensity
activities than females
• Age positively correlated
with hours spent on
computer use
• Age and exercise had a
positive correlation for
males but negative for
females
• Men were physically
active but
simultaneously engaged
in more sedentary
behaviour compared to
females
USA
Driskell, Kim, & Goebel,
2005
To explore the
differences between the
demographics of lower
and upper level
university students in
terms of their eating and
physical activity habits
258 university students
144 lower level students
114 upper level
19-25 year olds
• Qualitative and
quantitative mixed
method study
Used 2 self-reported
surveys
• No difference between
groups for eating fast
foods, at restaurants, or
from vending machines
• Lower levels eat more at
university campus
compared to higher level
(25.2% and 15.6%
respectively)
USA
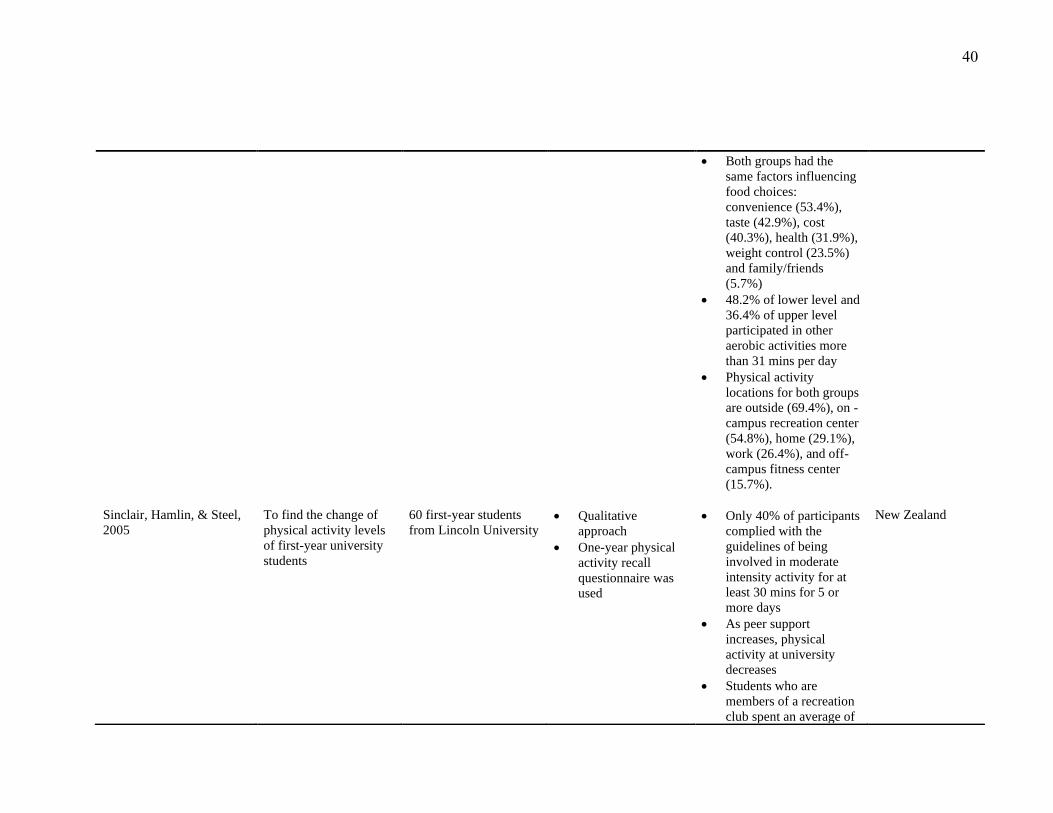
40
• Both groups had the
same factors influencing
food choices:
convenience (53.4%),
taste (42.9%), cost
(40.3%), health (31.9%),
weight control (23.5%)
and family/friends
(5.7%)
• 48.2% of lower level and
36.4% of upper level
participated in other
aerobic activities more
than 31 mins per day
• Physical activity
locations for both groups
are outside (69.4%), on -
campus recreation center
(54.8%), home (29.1%),
work (26.4%), and off-
campus fitness center
(15.7%).
Sinclair, Hamlin, & Steel,
2005
To find the change of
physical activity levels
of first-year university
students
60 first-year students
from Lincoln University
• Qualitative
approach
• One-year physical
activity recall
questionnaire was
used
• Only 40% of participants
complied with the
guidelines of being
involved in moderate
intensity activity for at
least 30 mins for 5 or
more days
• As peer support
increases, physical
activity at university
decreases
• Students who are
members of a recreation
club spent an average of
New Zealand

41
709 mins per week on
physical activity, 401
mins for non-members
• Memberships to these
clubs had decreased
since they commenced
university (47%)
Reiner, Niermann, Jekauc,
& Woll, 2013 • To review the
effect of physical
activity on weight
gain, obesity, CHD,
T2D, dementia and
Alzheimer’s
• Age between 18-85
• Participants were
healthy at baseline
• Systematic,
quantitative review
• 15 longitudinal
studies with at least
a 5 year follow up
• Overall negative
relationship between
physical activity and
weight gain/obesity
• Overall negative
association between the
emergence of CHD and
overall cardiovascular
mortality with physical
activity
• Activities with low
intensity have a negative
association with the
incidence of dementia
USA
Table 1: Summary of all studies included in the review assessing physical activity with health outcomes, prevalence, barriers, and enablers

42
Sedentary behaviour and activities
The association between sedentary behaviour levels and non-communicable
diseases
As mentioned previously, sedentary behaviour is defined as engaging in activities that do
not cause a substantial increase in energy expenditure; only 1.0-1.5 METs. Activities such
as laying whilst awake, watching television and sitting are considered to be sedentary (Pate,
O'Neill & Lobelo, 2008; Sedentary Behaviour Research Network, 2012; Tremblay et al.,
2017). Establishing the difference between physical activity and sedentary behaviour is
important as they both have different physiological effects and also have differing barriers
and facilitators. It is possible to both engage in regular physical activity and also engage in
large amounts of sedentary activity, as they have been found to be largely uncorrelated
(Rouse, & Biddle, 2010).
A meta-analysis of 18 cross-sectional and prospective cohort studies highlighted
the association of a high sedentary behaviour and health outcomes (Wilmot et al., 2012)
The studies included in the meta-analysis used literature that related to the terms ‘health
outcomes’ and ‘sedentary behaviour’. All included studies were exclusive of the term
‘inactivity’. Studies that assessed the health outcomes, determinants, barriers and
facilitators of sedentary behaviour and activities are detailed in Table 2, page 51. The
findings revealed that increased hours spent engaging in sedentary behaviour has been
linked to an increased risk in health conditions such as obesity, heart diseases, heart
disease-related mortality and type 2 diabetes (Wilmot et al., 2012). High sedentary time had
the greatest association with diabetes as it could increase the relative risk by 112%,
followed by 147% increase in the risk of cardiovascular disease, 90% for cardiovascular
mortality and 49% increase of all-cause mortality risk (Wilmot et al., 2012). Even though
43
cohort studies were included in the meta-analysis, RCTs were also included to support the
evidence which increased the strength of this systematic analysis. Since this study only
measured sedentary behaviour and was exclusive of physical inactivity, it further
emphasised that despite the unknown physical activity levels and exercise measurements of
participants, sedentary behaviour does have an overall independent detrimental effect on
health and health outcomes.
Sedentary patterns and behaviour amongst university/tertiary students
In the global context, there are many studies covering the topic of sedentary behaviour.
However, there are very few studies focusing on sedentary behaviour and habits among
university or tertiary students specifically; even more so in New Zealand.
Physical activity, exercise and sedentary behaviour in university students were explored
by demographics variables in a study containing 493 participants in the United States of
America. The findings showed that participants spent an average amount of 30 hours per
week engaged in sedentary activities (Buckworth, & Nigg, 2004). Interestingly, a large
portion of that time was spent on studying and attending lectures where they sat for long
periods of time. There was also a difference between males and females’ sedentary patterns
and determinants. Males reported to have spent significantly more hours than females
watching television and engaging in computer use (Buckworth, & Nigg, 2004; Rouse &
Biddle, 2010). Males had also reported spending more time engaged in sedentary activities
overall compared to females even though males had testified to participating in physical
activity more frequently (Buckworth, & Nigg, 2004; Rouse & Biddle, 2010). These results
corroborate the findings of a great deal of other studies that state sedentary and physically
active are mutually independent of each other while also having the possibility of co-
existing (Ekelund et al., 2016; Henson et al., 2013). An average of 79.9 minutes per day

44
was spent on studying, 72.1 minutes on sitting and talking, and 64 minutes on hanging out
(Rouse & Biddle, 2010). Interestingly, a positive correlation was found between age and
computer use of university students. However, this was not consistent with other sedentary
activities such as watching television and studying (Buckworth, & Nigg, 2004). The lack of
objective measurement of sedentary activities is a limitation in this study. It is difficult to
measure sedentary activities in an unbiased manner and non-subjective ways as it is not
cost-effective and requires many devices and tools to do so. Subjective surveys and
questionnaires may bring bias towards this study as it is hard to admit to flaws and also
there may be misunderstanding of the terms ‘sedentary’, ‘inactive’, and ‘physically active’
by participants which affects the validity of the studies.
Determinants of Sedentary behaviour and Activities
Multiple focus groups of university students have been conducted in Germany to explore
and discuss perceived determinants of sedentary behaviour. Discussions amongst students
showed an emergence of four major levels of determinants of sedentary behaviour:
intrapersonal, interpersonal, physical environment and university characteristics (Shuval,
Hébert, Siddiqi, Leonard, Lee, & Tiro, 2013).
Intrapersonal or individual determinants consists of perceived enjoyment, time and
convenience, daily structure, values, norms and beliefs. Participants claimed that it was
easy to be engaged in sedentary activities and enjoyed doing so. For example, laying down
and watching television (Shuval, Hébert, Siddiqi, Leonard, Lee, & Tiro, 2013). They were
also not self-aware of whether they were sedentary in their day-to-day lives and never
questioned themselves on that matter as this was normal to them as per their routine
(Shuval, Hébert, Siddiqi, Leonard, Lee, & Tiro, 2013). Participants had associated
sedentary activities with relaxation methods as to reward themselves for studying and

45
exams. This increases the enjoyment they receive from partaking in sedentary activities
which, in turn, further increases the possibility of spending more time being sedentary
(Shuval, Hébert, Siddiqi, Leonard, Lee, & Tiro, 2013).
The social environment (interpersonal) had an influence on students in terms of social
support, peer pressure, modelling and lack of parental control. The independence from
parental control was a major contributor to the determinants of sedentary behaviour among
students that did not live at their parents’ house anymore. These students felt that since they
were no longer bounded by rules that minimized sedentary activity at home, they could
indulge in those activities in their dorms or flats which eventually led to excessive
engagement (Shuval, Hébert, Siddiqi, Leonard, Lee, & Tiro, 2013). They were also
influenced by their peers; if their peers were highly sedentary, participants were most likely
to be sedentary too (Greenwood-Hickman, Renz, & Rosenberg, 2015; Shuval, Hébert,
Siddiqi, Leonard, Lee, & Tiro, 2013). Students were strongly influenced by their peers who
were their roommates. Peers could have a positive influence when they encouraged
participants to be more active with them. Having social support in terms of encouraging
being more active, increased the likelihood that participants would agree and follow them.
This was the same for engaging in sedentary behaviour (Greenwood-Hickman, Renz, &
Rosenberg, 2015).
Physical environment was- comprised of cost, availability and accessibility, weather and
travel distance. Students responded unanimously that watching television was the cheapest
way to spend time as most recreational activities would be unfordable such as gym
memberships (Shuval, Hébert, Siddiqi, Leonard, Lee, & Tiro, 2013). However,
interestingly, students living in student residence would not have access to their own
televisions which would force them to go outdoors and hence be less sedentary (Shuval,

46
Hébert, Siddiqi, Leonard, Lee, & Tiro, 2013). Walking was deemed a great way to decrease
sedentary behaviour and also travel to destinations on a budget. Travelling long distances
would compel students to use private vehicles instead of walking (Shuval, Hébert, Siddiqi,
Leonard, Lee, & Tiro, 2013). This was more apparent during the winter season as students
would stay indoors more frequently and engage in sedentary activities, and also would use
their vehicles more regularly compared to warmer climates and seasons. Students also
mentioned not being aware of on-campus recreational facilities or sports teams and if they
were, they found it unaffordable to join (Deliens, Deforche, De Bourdeaudhuij, & Clarys,
2015; Shuval, Hébert, Siddiqi, Leonard, Lee, & Tiro, 2013).
As for the university characteristics; students tended to spend a large amount of time
using computers and studying for exams which contributed to their sedentary behaviour.
Attending lectures and workshops also enforced sitting more often (Shuval, Hébert,
Siddiqi, Leonard, Lee, & Tiro, 2013).
These reviewed studies emphasised how individuals interacted with a variety of
microenvironments or settings such as schools and homes, which in turn were influenced
by the microenvironments such as society and social influence. Engaging students in
discussions about determinants may lead them to critically analyse their environments
which can aid in generating solutions to overcoming the negative determinants using health
promotional interventions.
Barriers and Facilitators of Sedentary Behaviour
The physical indoor and outdoor environment, along with social factors, could encourage
or inhibit sedentary behaviour and activities. A study with older, overweight adults showed
that having a habit of being engaged in sedentary activities was a large barrier as it was
difficult to break old habits (Greenwood-Hickman, Renz & Rosenberg, 2015). Other

47
barriers included having a chronic illness that made changes to sedentary behaviour
challenging, the perceived enjoyment of sedentary activities, environmental factors such as
weather and hilly landscapes that lead to physical fatigue (Greenwood-Hickman, Renz &
Rosenberg, 2015). A common misconception was that being physically active compensated
for participating in long periods of sedentary activities which was also a barrier in reducing
sedentary behaviour (Shuval et al., 2013; Greenwood-Hickman, Renz & Rosenberg, 2015).
This was associated with the lack of understanding of the definition of sedentary behaviour
and its independent physiological effect (Shuval et al., 2013).
Motivators included increased awareness of sedentary behaviour and its impact on
health, incorporating easy, adaptable changes in their lifestyle, and the enjoyment of non-
sedentary activities such as taking long walks (Greenwood-Hickman, Renz & Rosenberg,
2015). People also enjoyed setting goals in terms of aiming to reduce the amount of time
spent on sedentary activities and revealed in the competition with themselves (Greenwood-
Hickman, Renz & Rosenberg, 2015).

48
Authors Main objectives Samples Methodology and
methods
Summary of outcomes Location of study
Deliens, Deforche, De
Bourdeaudhuij, & Clarys,
2015
To identify determinants of
physical activity and
sedentary behaviour
amongst university students
46 university students
17 males and 29 females
2nd to 5th year uni
students
Recruited from one
university
• Qualitative method
Multiple action groups
were included as the
participatory action
research approach was
being used
• Lack of time and
enjoyment for
physical activity was
seen as a barrier
• Chose sedentary
activities for
relaxation
• Not enough
communication about
sport opportunities on
campus
Price is a barrier to
participate in healthy
exercise
Germany
Janet Buckworth and
Claudio Nigg, 2004
To find the correlation of
physical activity, exercise
and sedentary behaviour
with demographics of
university students
493 university students
from a Midwestern
University from various
year of studies
Both males and females
Qualitative study using
questionnaires to
measure physical
activity, exercise &
sedentary behaviours
• Average of 30 hours
per week spent on
sedentary activities
(mostly studying)
• Males reported
spending more time
watching TV and also
engaged in more time
either exercising or
moderate-vigorous
intensity activities
than females
USA

49
Authors Main objectives Samples Methodology and
methods
Summary of outcomes Location of study
• Age positively
correlated with hours
spent on computer use
• Age and exercise had
a positive correlation
for males but negative
for females
• Men were physically
active but
simultaneously
engaged in more
sedentary behaviour
compared to females
Rouse, & Biddle, 2010 To observe sedentary
behaviour patterns of
university students
84 university students • Qualitative method
Assessment diaries used
every 15 mins by
participants for two
consecutive days
• Participants reported
predominantly
studying, watching
TV, sitting and
hanging out.
• Video gaming
activity higher in
males
Sitting and talking higher
in females
UK

50
Authors Main objectives Samples Methodology and
methods
Summary of outcomes Location of study
Wilmont, Edwardson,
Achana, Davies, Gorely and
Gary, 2012
To find a risk factors and
relative risks of sedentary
behaviour in adults amongst
a variety of relative studies
794,577 participants
from various countries
>18 years of age
• 18 studies, 16 of
which was
prospective and 2
were cross-sectional
• 15 studies were of
moderate to high
quality
• Studies found using
the term ‘sedentary
behaviour’
• Studies were
exclusive of
‘inactivity’
• Self-reported studies
• High sedentary time
was significantly
associated with type 2
diabetes.
• Sedentary behaviour
are associated with a
112% increase in the
RR of diabetes
• 147% increase of
cardiovascular disease
• 90% increase of
cardiovascular
mortality
49% increase in the risk of
all-cause mortality
Australia England Canada
Germany
Japan
Scotland
USA

51
Authors Main objectives Samples Methodology and
methods
Summary of outcomes Location of study
Greenwood-Hickman, Renz
& Rosenberg, 2015 • To explore social,
individual,
environmental barriers
and impacts of
sedentary behaviour
reduction
24 participants
Males and females, 60
years and over
Qualitative study using
phone interviews • Motivators: increased
awareness of SB,
healthy choice, easy
adaptable change in
their lifestyle, goal
settings, enjoyment of
non-sedentary
activities
• Barriers: illness or
chronic health
condition that make
changes to SB
challenging,
enjoyment of
sedentary activities,
environmental factors
such as weather, hilly
landscapes.
USA
Table 2: Summary of all studies included in the review assessing sedentary behaviour and activity with the health outcomes, prevalence, barriers and
enablers

52
Nutrition and Diet
Dietary factors and Health outcomes
A lifestyle of consuming excess unhealthy foods and beverages can have a negative
impact on health and health outcomes such as obesity, coronary heart disease (CHD),
stroke, hypertension and some cancers (Kant, 2004; Norat, Bingham & Riboli, 2005;
Popkin, 2001). A systematic review was conducted to find an association between dietary
factors and coronary heart disease (CHD) (Mente, de Koning, Shannon, & Anand, 2009).
CHD, also referred to as ischemic heart disease, is the build-up of plague in the coronary
artery which reduces or blocks the flow of oxygen-rich blood to the cardiac muscle. This
can lead to angina or a heart attack (Luepker, 2003). The findings reported a strong
association between beverages and foods containing trans fatty acids and high glycaemic
index and the prevalence of CHD; making them harmful factors (Mente, de Koning,
Shannon, & Anand, 2009). A weak association was made between some saturated fats,
polyunsaturated and total fats intake with CHD as they were protective factors (Mente, de
Koning, Shannon, & Anand, 2009). Other protective factors included high consumption of
vegetables, nuts, wholegrains, monosaturated fatty acids and the Mediterranean diet
(Mente, de Koning, Shannon, & Anand, 2009). The systematic review contained 146 cohort
studies which is a limitation as causal claims cannot be made from prospective studies; only
association and trends can be made. However, 43 randomised controlled trials (RCT)s were
also included to support the evidence from the cohort studies which strengthened the
association and causality.
Out of the 15 reviewed studies, 6 studies assessed the health outcomes, determinants,
barriers and enablers of physical activity, diet and sedentary behaviour as detailed in Table
3, page 62.
53
Furthermore, a Brazilian study was conducted where they reported evidence supporting
the increase in obesity prevalence with a high consumption of ultra-processed foods
(Louzada et al., 2015). The cross-sectional study revealed that 29% of the samples’ total
energy intake was from ultra-processed foods (Louzada et al., 2015). ‘Ultra-processed’, in
this study, was defined as formulations made by food industries mostly from substances
extracted from foods with the further processing of food constituents or chemical synthesis
with little to no content of whole foods such as ice-cream, cookies, and cakes. It was found
that participants’ 68.6% of energy intake was from unprocessed or moderately processed
foods (Louzada et al., 2015). The most striking result to emerge from these data is that the
mean body mass index (BMI) had an increase of 0.94kg/m2 with a high consumption of
ultra-processed foods (Louzada et al., 2015). Ultra-processed foods commonly have less
fiber and protein, high added sugar content, and high energy density which overall gives it
no nutritional value (Monteiro, 2009). This study only used a 2-day, non-consecutive 24-
hour recalls recording food and beverage consumption which does not give an absolute idea
of what participants’ food behaviours are. The study also did not mention on which days the
recall took place, for example whether it was a weekday, weekend or both as this can have
an impact on the results as food behaviours tend to differ on weekends. An RCT would not
have been suitable for this study as it is not ethical for participants to overfeed on ultra-
processed foods; therefore, a cross-sectional study was more appropriate.
Habits and determinants of healthy food consumption
There can be many factors that influence food and beverage consumptions and
understanding them can give us solutions to overcome factors that inhibit healthy eating. A
study conducted in America used two surveys which measured consumption of fruit and

54
vegetables and fast foods (Glanz, Basil, Maibach, Goldberg & Snyder, 1998). They also
utilised a food diary. This was to examine self-reported importance of factors that influence
personal dietary choices. The findings from this study showed that taste, cost, nutrition,
convenience and weight-control have an influence on participants’ food choices, in that
order (Glanz, Basil, Maibach, Goldberg & Snyder, 1998). Taste, nutrition, and weight
control was found to be more important determinants for females compared to males
(Glanz, Basil, Maibach, Goldberg & Snyder, 1998). Nutrition was an important influence
on older respondents and certain ethnic groups but had no relationship with income. Cost
was important to younger participants, females, people with lower income and non-
Caucasian respondents (Glanz, Basil, Maibach, Goldberg & Snyder, 1998). It was also
found that age was predictive of nutrition and weight control in older participants; whereas
cost and convenience was associated with the younger age group (Glanz, Basil, Maibach,
Goldberg & Snyder, 1998). Younger participants also had the highest consumption of fast
foods due to its convenience factor. Not surprisingly, income was predictive of cost and
convenience (Glanz, Basil, Maibach, Goldberg & Snyder, 1998). This study included a
large sample size of 2967 adult participants which can be used to generalise the results. The
use of surveys and food diaries could be used to support each other and give more
information about their day-today consumption as it was a 7-day food diary.
Food consumption within any group will have common determinants of food
consumption as there are many factors that influence their choices and habits. Six focus
groups with students from a New Zealand university discussed the psychosocial
determinants of fruit and vegetable consumption among university students in particular
(Hartman, Wadsworth, Penny, van Assema, & Page, 2013). Reporting from the focus
groups revealed that 76% of participants met the recommended guideline of consuming at
55
least 3 servings of vegetables per day, while 72% met the guidelines for fruit. Interestingly,
79% were aware of the 5+ a day recommendation but only 26% correctly identified the
recommendation of 2 servings of fruit and 3 of vegetables per day (Hartman, Wadsworth,
Penny, van Assema, & Page, 2013).
The determinants for the motivation of eating fruits and vegetables were taste, health
consequences and satiety, in that order (Hartman, Wadsworth, Penny, van Assema, & Page,
2013). A large social influence came from room/flat mates and partners. If they were
nutritionally conscience and had apt food behaviours, participants’ choice in food
consumption were heavily influenced and were more likely to meet the recommended food
guidelines (Hartman, Wadsworth, Penny, van Assema, & Page, 2013). Participants were
also more susceptible to eating readily convenient fruits and vegetables rather than
consuming meals which required preparation of vegetables. Fruits could be seen as snacks,
whereas vegetables were only perceived as ingredients in a meal rather than snacks such as
carrot and celery sticks (Hartman, Wadsworth, Penny, van Assema, & Page, 2013). In all
the focus groups discussions, cost, availability, lack of variety and seasonal influence were
seen as barriers to fruit and vegetable consumption. They had also commented on the
limited availability, cost and quality of fruit and vegetables on the university campus which
they perceived to have decreased their fruit and vegetable intake and hence consuming
more affordable ready-to-eat and processed foods instead for satiety (Hartman, Wadsworth,
Penny, van Assema, & Page, 2013). It was conveyed that participants who resided in their
parents’ homes had higher consumption of fruit and vegetables as it was purchased and
readily made available by their parents, compared to students who lived in university
residence or other rented places (Hartman, Wadsworth, Penny, van Assema, & Page, 2013).
56
A discussion with students from different demographics showed the lack of
understanding of the promotional guidelines of 5+ a day, despite being of a higher
education level. Having focus group discussions and interviews rather than taking surveys
is a good way to understand groups and their perceived behaviour and knowledge as
surveys can miss out a lot of unknown information. It is also a great way to invoke other
ideas and discussions that may be related.
Another study was conducted to find and understand the differences in the typical eating
habits of undergraduates and postgraduate university students in USA. A survey was used
to assess demographics and eating habits (Driskell, Kim & Goebel, 2005). Findings
revealed that there were no differences between groups for eating fast foods, at restaurants
or from vending machines. However, it was found that undergraduate students ate more at
the university campus compared to higher levels (25.2% and 15.6% respectively). Two
thirds of both groups typically ate at their houses or dorms at least 6-8 times weekly
(Driskell, Kim & Goebel, 2005). Participants who ate in dorm rooms had a stable eating
pattern, as meals were provided in student residential, compared to students who rented
other places or lived with their parents. Both groups also had the same factors influencing
food choices: convenience (53.4%), taste (42.9%), cost (40.3%), health (31.9%), weight
control (23.5%) and family/friends influence (5.7%) (Driskell, Kim & Goebel, 2005).
Using surveys, as mentioned before, does not give all the information required and related.
Using a large sample size (undergraduates n=144 and postgraduates n=114) gives the study
more credibility and can use as a generalisation for students in that university. However, it
cannot be used to generalise eating habits for students from other universities.

57
Perceived Barriers, Facilitators and Promotion of Healthy Food Consumption
Barriers, in this thesis, are factors that inhibit or discourage others in consuming
nutritionally dense and healthy foods. Facilitators are factors that encourage the
consumption. To generate interventions, barriers and facilitators from the target or sample
group must be known in order to stage an effective intervention.
A systematic review of barriers and facilitators reported that perceived barriers to healthy
food consumption were poor availability of healthy meals at school, overpriced healthy
foods and a wide availability of fast and processed foods (Shepherd et al, 2005). To
facilitate healthy eating, participants encouraged the ideas of reducing the prices of healthy
snacks, better availability of healthy foods at school and removing vending machines from
the premises. Participants acknowledge the lack of awareness and understandings of
nutritional labels and suggested the provision of information on nutritional content of meals
at school and to also have better food labelling which are easier to interpret (Shepherd et al,
2005). From the study reviewed earlier (Hartman, Wadswort, Penny, van Assema, & Page,
2013), participants suggested using social media to advocate nutrition information to
educate themselves and others as social media has an immense outreach to the population
and demographics such as young adolescents to adults and even the elderly. Information
about where to purchase affordable fruit and vegetables could be promoted on social media
to overcome expense. Since students’ priority is convenience, this platform could also be
used to share quick and easy recipes.

58
Authors Main objectives Samples Methodology and
methods
Summary of outcomes Location of study
Glanz, Basil, Maibach,
Goldberg & Snyder, 1998
To examine self-reported
importance of factors
that influence personal
dietary choices
2967 participants
Over the age of 18
From United States of America
• Qualitative and
quantitative
• 2 self-reported
surveys (cross-
sectional)
• Taste, cost, nutrition,
convenience and then
weight control influenced
diet
• Age predicts importance
of nutrition and weight
control (more evident in
older people) as well as
cost and convenience
(more evident in
younger)
• Cost was important to
younger participants,
women and people with
lower income and non-
white respondents
• Taste had no significant
relationship with age or
income. However, it did
show that taste was more
important to women and
certain ethnic groups
USA
Driskell, Kim, & Goebel,
2005
To explore the
differences between the
demographics of lower
and upper level
university students in
terms of their eating and
physical activity habits
258 university students
144 lower level students
114 upper level
19-25-year olds
• Qualitative and
quantitative mixed
method study
• Used 2 self-
reported surveys
• No difference between
groups for eating fast
foods, at restaurants, or
from vending machines
• Lower levels eat more at
university campus
compared to higher level
(25.2% and 15.6%
respectively)
• Both groups had the
same factors influencing
food choices:
USA

59
convenience (53.4%),
taste (42.9%), cost
(40.3%), health (31.9%),
weight control (23.5%)
and family/friends
(5.7%)
• 48.2% of lower level and
36.4% of upper level
participated in other
aerobic activities more
than 31 mins per day
• Physical activity
locations for both groups
are outside (69.4%), on -
campus recreation center
(54.8%), home (29.1%),
work (26.4%), and off-
campus fitness center
(15.7%).
•
Mente, de Koning,
Shannon, & Anand, 2009
To systematically
analyse the association
between dietary factors
and CHD
7204 participants altogether from
USA, Europe and Asia
Mean age of participants were 58
years.
Systematic review
included 146
prospective cohorts and
43 randomised
controlled trials
investigating dietary
exposures and coronary
heart disease (CHD)
• Protective factors include
consumption of
vegetables, nuts, whole
grains, Mediterranean
diet, and
monounsaturated fatty
acids
• Harmful factors include
foods with high trans
fatty acids, content and
high glycaemic index.
• Weak association of
intake of saturated,
polyunsaturated and total
fat with CHD
Canada
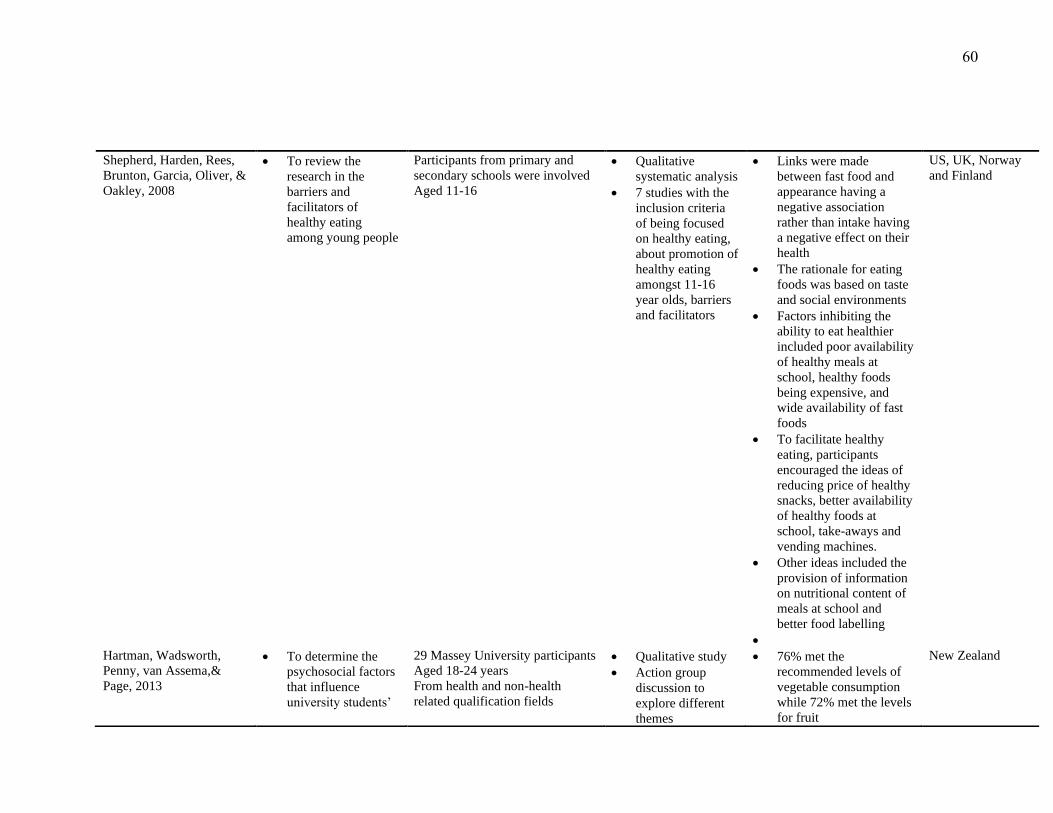
60
Shepherd, Harden, Rees,
Brunton, Garcia, Oliver, &
Oakley, 2008
• To review the
research in the
barriers and
facilitators of
healthy eating
among young people
Participants from primary and
secondary schools were involved
Aged 11-16
• Qualitative
systematic analysis
• 7 studies with the
inclusion criteria
of being focused
on healthy eating,
about promotion of
healthy eating
amongst 11-16
year olds, barriers
and facilitators
• Links were made
between fast food and
appearance having a
negative association
rather than intake having
a negative effect on their
health
• The rationale for eating
foods was based on taste
and social environments
• Factors inhibiting the
ability to eat healthier
included poor availability
of healthy meals at
school, healthy foods
being expensive, and
wide availability of fast
foods
• To facilitate healthy
eating, participants
encouraged the ideas of
reducing price of healthy
snacks, better availability
of healthy foods at
school, take-aways and
vending machines.
• Other ideas included the
provision of information
on nutritional content of
meals at school and
better food labelling
•
US, UK, Norway
and Finland
Hartman, Wadsworth,
Penny, van Assema,&
Page, 2013
• To determine the
psychosocial factors
that influence
university students’
29 Massey University participants
Aged 18-24 years
From health and non-health
related qualification fields
• Qualitative study
• Action group
discussion to
explore different
themes
• 76% met the
recommended levels of
vegetable consumption
while 72% met the levels
for fruit
New Zealand

61
consumption of fruit
and vegetables
• To find suggestions
for nutrition
promotional
interventions
• Used participatory
action research
methods to
generate solutions
and ideas
• Flatmates and partners
had the greatest influence
on fruit and vegetable
consumption
• In all interviews,
participants commented
on the limited
availability, cost, quality
of fruit and vegetables on
campus
• Cost, availability, lack of
variety and seasonal
influenced were seen as
barriers to fruit and
vegetable consumption
• 79% were aware of 5+
day recommendation but
only 26% correctly
identified the
recommendation of 2
servings of fruit and 3 of
vegetables
• Promotional intervention
suggestion included
using social media to
advocate, accessibility to
quick and easy recipes,
and information about
where to purchase
affordable fruits and
vegetables
Louzada, Baraldi, Steele,
Martins, Canella &
Moubarac, 2015
• To evaluate the
relationship between
consumption of
ultra-processed
30243 participants over the age of
10
• Cross-sectional
study
• 2 non-consecutive
24-hour recall
diary over a week
• 41% were overweight
and 12% obese
• 68.6% of energy intake
was from unprocessed or
Brazil
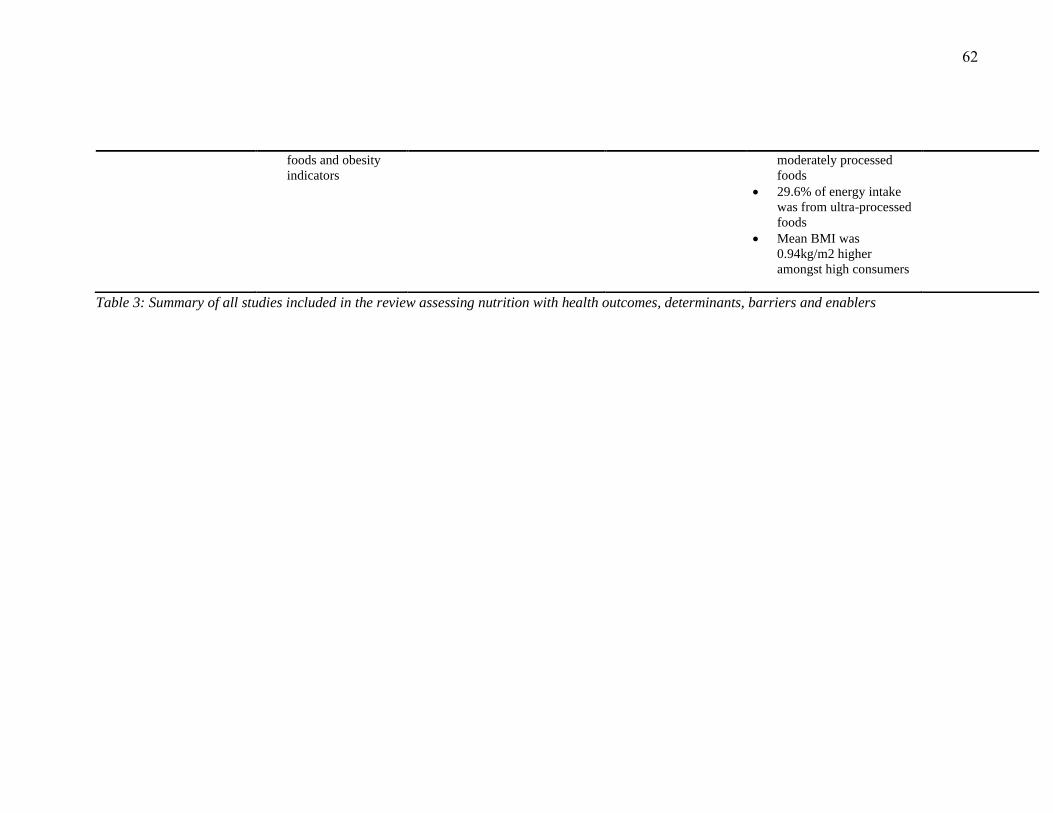
62
foods and obesity
indicators
moderately processed
foods
• 29.6% of energy intake
was from ultra-processed
foods
• Mean BMI was
0.94kg/m2 higher
amongst high consumers
Table 3: Summary of all studies included in the review assessing nutrition with health outcomes, determinants, barriers and enablers

63
Implications and Recommendations for Future Studies
The reviewed studies showed how physical activity, sedentary behaviour and nutrition
play an important role in maintaining health in university students. Knowledge about the
barriers to healthful behaviour can be used to plan interventions according to what
university students deem important. This thesis research uses the Citizen Science approach
as researchers work alongside participants to have a better understanding of what
participants perceive as barriers in their day to day lives. This may even lead to new
insights on the matter. There have been studies where university students were asked to
suggest interventions to overcome nutrition and healthy eating habits barriers; however,
there was a lack of studies that asked students about potential intervention strategies to
increase physical and decrease sedentary activities. The reviewed studies enquired about
barriers and enablers/facilitators which then can be used to plan interventions but lacked the
involvement of students’ perceptions of solutions to overcoming identified barriers which
would give a better understanding of what may be effective interventions.
There were currently very few studies based in New Zealand universities and other
tertiary institutes as to what students perceive as barriers and facilitators. Studies that have
been reviewed are mostly from America and Europe which cannot be used to generalise the
perception of New Zealand university students as there is a difference in physical, cultural
and multi-ethnic environment, legislation and policies. There is also a lack of statistics on
tertiary institute students in terms of physical activity and sedentary behaviour whereas it is
available for secondary school students and other younger age groups.
Limitations
The findings from studies that involve the environment of universities may not be used to
generalise to other universities as they all have differing physical and social components.
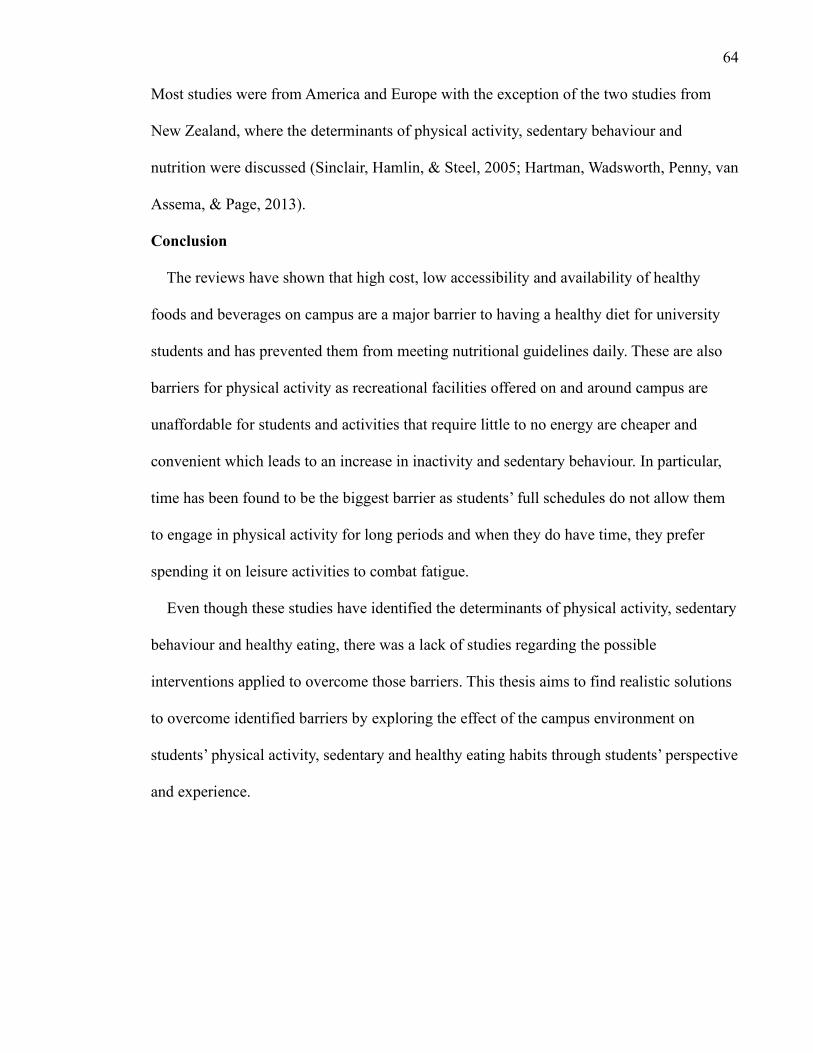
64
Most studies were from America and Europe with the exception of the two studies from
New Zealand, where the determinants of physical activity, sedentary behaviour and
nutrition were discussed (Sinclair, Hamlin, & Steel, 2005; Hartman, Wadsworth, Penny, van
Assema, & Page, 2013).
Conclusion
The reviews have shown that high cost, low accessibility and availability of healthy
foods and beverages on campus are a major barrier to having a healthy diet for university
students and has prevented them from meeting nutritional guidelines daily. These are also
barriers for physical activity as recreational facilities offered on and around campus are
unaffordable for students and activities that require little to no energy are cheaper and
convenient which leads to an increase in inactivity and sedentary behaviour. In particular,
time has been found to be the biggest barrier as students’ full schedules do not allow them
to engage in physical activity for long periods and when they do have time, they prefer
spending it on leisure activities to combat fatigue.
Even though these studies have identified the determinants of physical activity, sedentary
behaviour and healthy eating, there was a lack of studies regarding the possible
interventions applied to overcome those barriers. This thesis aims to find realistic solutions
to overcome identified barriers by exploring the effect of the campus environment on
students’ physical activity, sedentary and healthy eating habits through students’ perspective
and experience.
65
Chapter 3: Method
Introduction:
The study in this thesis utilised mixed methods as it incorporated both qualitative and
quantitative components. It involved case-study to understand what factors of the university
campus influence eating, physical activity habits and sedentary behaviour of AUT students.
There were two stages altogether. Stage One required participants to evaluate the campus
for barriers to and facilitators of physical activity, nutrition and sedentary behaviour using a
combination of photo-voice and online surveys. The surveys measured physical activity,
sedentary behaviour and eating habits. Stage Two involved an action group to discuss
findings from Stage One to generate ideas for interventions (see Figure 1 on page 26 for a
summary of the study design). Participants were recruited by placing informative posters of
the study around AUT City campus and through social media advertising. Data from Stage
One were analysed via case study and thematic analysis to group and identify key themes.
The online surveys’ results were analysed using Microsoft Excel and TypeForm to find the
percentage response for each answer and the mean for quantitative questions. The action
group discussion was also analysed using thematic analysis to find key themes that had
emerged from the discussion. An action group was utilised as the discussion revolved
around finding solutions and taking action to overcome the identified barriers.
Design
Mixed methods study design. The qualitative method was used in regard to participants’
case studies which involved the campus walk and action group. The online survey that
participants were required to complete is the quantitative portion of the study.

66
Participants
The inclusion criteria for participants were that: (1) They had to be enrolled in AUT City
campus as a student and (2) Participants could walk or wheel freely around campus.
Participants also could have been of any gender, ethnicity, qualification or age. The aim of
the study was to recruit 8 participants.
Posters were used to recruit participants. Informative posters of the study, along with
contact details were displayed all around the AUT City campus in order to reach the target
sample group (see Appendix 3 for recruitment poster). A posting of the poster- on social
media- was also used as a recruitment method to reach a wider audience. Social media
posts about the study potentially have the ability to increase awareness and interest which
aids the process of recruitment.
Non-probability sampling was used as a sampling method in this study. Convenience or
opportunity sampling was used as it uses people from target population of AUT students
who are willing and available to participate. This method has the advantages of simple
sampling, and of being the cheapest method to implement (Kam, Wilking & Zechmeister,
2007). It also has a disadvantage as it may not provide a representative sample for the
research study. However, the study had been advertised in multiple locations and social
media to create a larger outreach to different types of students who may be interested in
participating. The snowballing sampling method was also used. This method required
asking current participants to refer other students who may also be interested in
participating in the study (Noy, 2008). This then also contributed to the larger outreach and
also brought awareness to students who may not have social media.

67
Qualitative Research Method
The qualitative approach is used to facilitate the exploration of a phenomenon in a
certain context by using a variety of sources. The phenomenon has to be viewed from
multiple views in order to understand the phenomenon as a whole rather than viewing it
from one point of view (Baxter & Jack, 2016; Amaratunga, Baldry, Sarshar & Newton,
2002). It seeks to find issues of concern via interviews, observations, and accessing texts
and/or voice recordings of participants (Biggerstaff & Thompson, 2008; Baxter & Jack,
2016). This helps to uncover the meaning that already exists in people’s experiences in
order to understand what can help to improve the issue. In this case, participants were
recruited in order to understand what participants perceive to be barriers to and facilitators
of physical activity, sedentary behaviour, and healthful eating in the university campus and
also what they perceive to be solutions or interventions to overcome barriers. The
qualitative approach involves the exploration of human experience. This experience is
captured or recorded in words rather than statistics or numbers such as in quantitative
studies (Biggerstaff & Thompson). The recorded words or text from Stage One and Two
were then analysed as categories or themes that would describe the experience of each
participant. This study was about uncovering people’s experience with the university
campus which gave a range of data from individuals that cannot be generalised to a
population and hence cannot be used to make an absolute claim which is one of the
limitations of qualitative methods (Amaratunga, Baldry, Sarshar & Newton, 2002). The
opinions of AUT students on their campus cannot be used to make generalisations about
other universities or other campuses due to the vast difference of their campus environment
and student population’s experience with their campus. It is very specific to the studied
population and hence the response to the results can be only be applied to AUT City
68
campus. The outcome of a qualitative research approach gives meaning, description and
change to ideas and are left open to be analysed by readers that may be interested in that
field of topic.
Finding the “truth” in terms of what is correct in an issue or practice has been ever
changing and an open-mindedness is needed by researchers to explore how the truth can
change and evolve. The truth for many people can be different based on experience and
understanding which is why a qualitative method is appropriate for the study (Amaratunga,
Baldry, Sarshar & Newton, 2002). By using interviews and action groups, the researcher
understood how the university campus and the surrounding area had an effect on each
participant, and as a group of AUT’s students which is why a qualitative research method
was appropriate for this study.
It is important for the researcher to have an open-mind to the response from each
participant to limit bias from the questions they are asking as a response to the answer.
Qualitative researchers inevitably bring their own bias in one way or another but must
always reflect on the bias that researchers are bringing in and consider how it will affect the
study (Giacomini & Cook, 2000). Biases that may arise from a qualitative study can be
biased questions, moderator bias, procedural bias, and sample group bias (Morgan, 2009).
Since this was a case study research and the findings will not be used to generalise the
population, a small sample size of 8 was appropriate for its method. The questions asked by
the researcher, to the participants in the campus walk and action group, have been discussed
and approved by the supervisor. A potential bias may be introduced into the process by the
questions that are asked spontaneously by the researcher in the action group to either
stimulate the discussion or get specific answers. The researcher must seek to ensure that the
questions asked aren’t biased or prompting participants to get a certain response (Morgan,
69
2009). Participants also need to have enough time to complete all stages of the study in
order to get data that is truly representative of the participant. To ensure this, participants
were given sufficient time to complete all stages by asking them when they are available to
complete it. Participants were given 35 minutes, maximum, to complete the campus walk.
If they did require more time, the researcher allowed this to obtain relevant data.
Participants were also given the choice of completing the survey right after the campus
walk or they could have completed it in their own time. This was so that participants didn’t
feel rushed and took time to understand and answer the questions appropriately.
The action group involved open-ended questions in order for participants to provide an
in-depth response to each question. This encourages a discussion amongst the group as
participants may have different responses to the question and may also lead to impromptu
questions that are relevant to come up by the researcher and/or other participants (Morgan,
2009). This enables the researcher to further explore the deeper interactions of the campus
with participants, and understanding their experiences (Morgan, 2009).
Research Paradigm
A paradigm framework is a theory and/or analysis of how a researcher does or should
proceed with their method of conduct (Morgan & Smircich, 1980). Most research is based
on some underlying philosophical assumptions as to what establishes a valid research study
and which research method may be suitable for the study. This study adopted the
interpretive paradigm. This involves listening to people and collecting information of felt
experience from participants (Scotland, 2012). Researchers interact with participants in a
way that will help researchers understand their experience. With the interpretive paradigm,
the interview method is usually used to capture the participants’ experience and perception
(Morgan & Smircich, 1980; Scotland, 2012). It is also founded on the belief that reality is

70
socially constructed and fluid therefore what is known is affected by cultures, relationships
with others and social settings (Scotland, 2012). Stages One and Two involve this paradigm
as it required the perception and opinions from participants on their campus based on
experience and observation. This was acquired through the action group and the campus
walk. It also required participants’ suggestions on interventions and strategies to overcome
barriers in a way that is effective on the population of AUT students. Each participant had
their own perceived truth and reality which needs to be explored by the researcher. There
even might be a “shared reality” amongst the participants. Effective communication
between the researcher and participant is required to enable the researcher to understand the
phenomena in depth; hence qualitative research method is essential.
Participatory Action Research Method
Participatory action research (PAR) is a type of qualitative approach that is usually used
when communities are essential to the research question or topic to understand a social
context (Wang, 1999; Minkler, 2000). Participants’ active involvement in the research helps
to reduce inequities which leads to improving the communities’ overall health status
(Minkler, 2000). In this study, university students’ active involvement as participants was
essential to the action group as they were acting as co-researchers to generate solutions and
interventions to overcome the perceived barriers. Participants were researched with rather
than being researched on which was an important aspect with this approach (Leung,
Minkler & Yen, 2004). PAR enables participants to bring up issues and solutions by
working with researchers to fulfil the needs of the campus which may have not been known
by the researcher initially since researchers are usually not part of the community nor are
they directly affected by the issues that face the community (Wang, 1999; Minkler, 2000).
The action group was where this approach was applied as participants were part of the

71
discussions regarding improvement of the university campus. Their inputs and opinions
were highly appreciated and taken into consideration as their experiences and perception
will help voice the change to the Student Council. The outcome and changes made will
ultimately affect students of AUT City campus the most. However, this study had a small
sample therefore the potential changes, as suggested by participants, should be voted on by
the rest of the AUT student population. This to ensure that the student population also has a
voice in implementing changes that will affect them. In the future, this approach may
encourage other students and community members to be actively involved in change in
their local community after witnessing change in response to their opinions.
Citizen Science Approach
The citizen science approach is a qualitative method that empowers participants to
collect information about their community and environment (Silvertown, 2009). The citizen
science approach can be described as public participation in scientific research (Bonney et
al., 2009). This helps the researcher to understand what the participants perceive as the
major issues of concern and enables participants to collaborate with researchers to generate
practical and effective solutions (Bonney et al., 2009). This is advantageous as solutions to
barriers cannot be generalised to different communities and environments, hence this
approach allows participants to be involved in various roles such as data collectors,
interventionists, and data interpreters to generate solutions that is specific to that
environment and its residents (Hinckson et al., 2017; King et al., 2016; King, Winter,
Chrisinger, Hua &Banchoff, 2018). This approach relies on participants to produce reliable
data. It also enables researchers to conduct research with participants rather than
researching on them (Bonney et al., 2009; Silvertown, 2009). Participants are not the
72
subject. Instead, participants are encouraged to be involved in and to facilitate the research
(Cohn, 2008).
This research used the application, PhotoCap, for participants to capture photographic
images as to what they perceive to be issues around the campus regarding their wellbeing.
The participants themselves had the role of being researchers and data collectors to gather
information to emphasise barriers and facilitators. Participants further went on to being
collaborators in generating solutions that are practical and effective for that particular
population during the action group. This also gave the opportunity for participants to learn
more about their environment through the research and encourages them to be actively
involved in voicing their opinions regarding their community when changes are needed, in
the future.
Quantitative Research Method
For the online survey, a quantitative method was mostly used. Quantitative methods are
used in research to figure out risks, predictions of certain variables, to find cause and
effects of variables, also to find the strength of relationships between variables (Elo &
Kyngäs, 2008). The result or outcome can then be used as a generalised statistic for that
certain population; whereas qualitative methods cannot (Elo & Kyngäs, 2008). Compared
to a qualitative method, participants do not share experience or opinions but rather provide
researchers with self-reported answers. The survey measured eating and exercising habits
from the past 7 days by asking a series of questions derived from the International Physical
Activity questionnaire and the Health Promoting Lifestyle survey. Some questions in the
survey were open-ended to allow any answer from participants and to allow more context
to the response. The survey was conducted as a web-based survey. Participants were
requested to complete it right after the campus walk. If there was a lack of time, the link to
73
the survey was emailed to participants and was followed up until they completed the
survey. Since this was a case-study of 8 participants, the results from the survey cannot be
used to generalise AUT students. Instead it provides an understanding of the common
practices of the participants in question in terms of nutrition and physical activity
behaviours.
Case-study Method
A case study research approach enables the researcher to produce an in-depth study of a
particular situation and to narrow down a broad field of research. This approach is an in-
depth investigation of a community, group, event or a single person in relation to a
phenomenon. A variety of sources of are typically used to gather data and different methods
can be used such as observations and interviews. It also offers flexibility to the researcher
as researchers can select methods of data collection and analysis to generate suitable
material (Eisenhardt, 1989). A case study is defined by individual cases rather than the
methods of inquiry or process used. A case study design should be implemented when
either: 1) the focus of the study is to explain the “how” and “why”; 2) the researcher aims
to cover contextual conditions of the phenomena; 3) the boundaries between phenomena
and context are not clear; or 4) the researcher cannot manipulate the behaviour of
participants involved in the study (Seawright & Gerring, 2008; Eisenhardt, 1989; Yin,
1981). This research study aimed to explore the experiences and opinions of different AUT
students regarding how the City campus affects their physical activity, heathy eating and
sedentary behaviour. A case study design allows the researcher to evaluate the situation
from multiple perspectives and within local contexts (Seawright & Gerring, 2008;
Eisenhardt, 1989). Smaller sample sizes are usually drawn in a case study research;
however, this can reveal a large number of factors in relation to the phenomena with a close

74
examination of the participants’ perception and experience (Seawright & Gerring, 2008;
Yin, 1981). This might not be possible with a large sample size with the aim of averaging
and generalising. It also allows an observation on aspects of human behaviour and thinking
that would be impractical to be studied in other ways. This is due to the in-depth and multi-
sided design of case studies (Gerring, 2004). Measurable aspects of human behaviour in
unlikely to give descriptive insights to the subjective dimension of experience.
This study was an exploratory case study type as it was used to explore links in real-life
interventions that may be too complex for surveys or experimental designs (Gerring, 2004).
The explanations found from the cases were used to link the campus effect on participants’
behaviours. Exploratory case studies can aid in generating new ideas based on the
participants’ experience and what they perceive will be an effective solution for issues
raised (Ogawa & Malen, 1991). Case study design takes on a constructivism paradigm
(Seale, 2002). According to constructivists, the ‘truth’ and objective reality does not exist
but rather, they believe that it is a construct that needs to be learned by researchers in order
to understand the idea or perception of the reality that participants have, not the reality itself
(Rolfe, 2006). In this study, the researcher learned what participants perceived as their
reality in relation to the campus and their health through the different methods of data
collection and analysis. Constructivism is related to the interpretivism paradigm as
interpretivism addresses shared meanings and understanding, whereas constructivism
extends this further with knowledge as being produced and interpreted (Rolfe, 2006).
Stages of the Study
Stage One
Participants were recruited from AUT and were asked to evaluate the indoor and outdoor
spaces of the campus in terms of what they perceive to be barriers and facilitators of

75
physical activity, sedentary behaviour and healthy eating habits. An app called PhotoCap
was used on a provided iPad for participants to use. PhotoCap allows users to take pictures
and write accompanying text. Before the perceived evaluation, the participants were given
the definition of ‘physical activity’, ‘sedentary behaviour’ and ‘nutritionally dense’ in order
to help them understand as participants may not be familiar with the widely recognised
definitions (see Table 4, page 85). Participants took pictures of perceived barriers and
facilitators in and around campus for an average of 15 minutes. The pictures taken included
a description of why they perceived that particular area or item to be a barrier or facilitator.
Participants were asked to write a given numbered code in the captions of the pictures they
had taken in order for the researcher to know which and how many pictures the particular
participants had taken. Numbered codes help to keep the participants’ anonymity and
privacy (see Figure 1 for a summary of study stages on page 26).
Right after the campus walk, participants were asked to fill out the three online surveys
(HPL, IPAQ and Health Fair questionnaire). The surveys included questions that measured
eating and exercise habits over the last 7 days. It takes an average amount of 5 minutes to
complete. The survey also includes questions regarding demographic such as age, current
qualification, ethnicity, gender, and years attending AUT. Understanding exercise and
eating habits of students may help to correlate to their perceived barriers and facilitators.
Stage Two
An action group was conducted with 5 participants in the group which lasted for 50
minutes. Three of the 8 initial participants had decided not to participate in the action group
due to scheduling issues. The library group room was booked in the AUT City campus to
conduct it. Participants were asked to pair up and discuss their findings from the campus
walk amongst each other. Each pair were then asked to share their findings with the group.

76
Barriers found from participants were discussed to generate solutions and interventions to
overcome them. Findings from the action group were analysed using thematic analysis to
group key ideas and themes.

77
Procedures
Ethics for this study was written and approved on 31st October 2017 and 1st October
2018. The AUT Ethics Committee reference number is 17/346 (see Appendix 1 for proof of
ethics approval, page 148). Information sheets were provided to all participants before
being involved in the study (see Appendix 5, page 154). The information sheet included
details about the researchers who were included in the study, purpose of the research, and
the procedure of agreeing to participate. Details of the different stages were also
highlighted in the information sheet and risks and protection of privacy were explained.
Incentives for participating and the time required to be involved were explained. The
incentives were shopping vouchers valued at $20. Participants were made sure to be told
about the option of withdrawing from the study, along with the withdrawal of their data and
contact details. Participants had also received contact details of both the researcher and the
supervisor if they had any concerns regarding the conduct of the research or if they had any
questions.
After participants had read over the information sheet, they were required to sign two
consent forms; one for participants to keep for reference and one for the researcher to
document their consent (see Appendix 6, page 159). Information sheets were emailed to
participants when they showed interested in the study by sending the researcher emails and
messages to participate. One of the requirements to be able to consent was to complete
reading the information sheet. This was to ensure that potential participants completely
understood the requirements of the study and how they would be involved. Consent forms
were required to be signed before the commencement of the campus walk as that was the
first time the researcher and participants had met.

78
After participants had completed Stage One, they joined the action group. The action
group was organised according to when most participants were available for a certain time.
Tools
The tool used in this study was an app called PhotoCap; it was used on the provided
iPad. PhotoCap is an application that allows users to take pictures and caption them with
unlimited characters. Pictures are then saved to the gallery of the device. Unfortunately,
PhotoCap does not have tracking or location features, therefore another application had to
be installed. GPS Trip Tracker was installed on the iPad so that the researcher could track
the route taken by participants. This included a map, duration of the walk, time and the date
of when the walk was done. A track or route of participants’ walks were necessary to have
confirmation that Stage One was indeed completed by all participants (see Appendix 8,
page 164).
To run all the applications, an iPad from the university was provided. Participants were
given this device to complete Stage One. If there was enough time, participants also used
this to complete the online surveys.
The three questionnaires used in this study were the Health Fair questionnaire, Health
Promoting Lifestyle (Pinar, Celik & Bahcecik, 2009) and the International Physical Activity
Questionnaire (Fogelholm et al., 2006). The Health Fair questionnaire measured habits of
healthy eating in terms of just consuming fruits and vegetables. It measured whether or not
participants meet the nutritional guideline of consuming 5 portions of fruits and vegetables
in a day. The consumption of potatoes was not considered as a vegetable due to its high
carbohydrate content; therefore, could not be counted as meeting the guidelines when
consumed. This survey had been included to get an understanding of participants’ eating
habits, particularly university students. Some questions were removed from the original

79
survey as they promoted unhealthy choices. For example, one of the questions measured
how often one consumed fruit juices. This question was removed as fruit juices have a high
fructose content and the scoring system would consider this as a healthy choice.
The Health Promoting Lifestyle Profile questionnaire measures health promoting
behaviour, perceptions to maintain or enhance the level of wellness, fulfilment and self-
actualisation of the individual who fills of the survey (Pinar, Celik & Bahcecik, 2009).
Originally, the questionnaire had 52 questions with a 4-point response format. The main
domains of the survey were health responsibility, nutrition, spiritual growth, physical
activity, stress management and interpersonal relationships. For the purpose of this study,
only the questions for nutrition were utilised. Physical activity questions were not used to
avoid repetition as the International Physical Activity questionnaire was used instead. The
Lifestyle Profile is scored from 1 (never) to 4 (routinely). All responses to the questions
related to nutrition were obtained by calculating the mean. A higher mean shows that
participants have a perception that their nutritional habits are adequate whilst a lower score
shows that it’s inadequate and needs to be improved. The survey has a good reliability scale
(r=0.84) in a study conducted on college students and was observed to be adequate to be
utilised in future research (Huang & Chiou, 1996).
The International Physical Activity Questionnaire is an instrument for monitoring
physical activity and inactivity in populations (Fogelholm et al., 2006). It consisted of 7
questions which measures low, moderate and vigorous activity levels and patterns over the
last 7 days. This also included sedentary behaviour habits. The questions had both open
ended and multiple-choice questions. The open-ended questions measured an approximate
amount of time spent on physical activity. The response from all participants were
calculated as a mean for different groups for comparison reasons. This survey has been

80
tested for its validity and has been found to have a strong relationship with the activity
monitor data for total and vigorous physical activity in a study of 46 participants
(Hagströmer, Oja & Sjöström, 2006). However, there was a weaker relationship between
moderate physical activity and activity monitor data. Overall, the self-administered
questionnaire has acceptable validity for assessing patterns and levels of physical activity in
adults (Hagströmer, Oja & Sjöström, 2006).
Data Collection
The purpose of data collecting for this study was to find the habits and patterns of
healthy eating, sedentary and physical activity over the past 7 days in university students.
This was collected via the three questionnaires. The research question: “What are the
effects of the physical environment of AUT City Campus on students’ physical activity and
sedentary behaviour levels and eating behaviours?” was answered and explored through the
one-on-one campus walk using PhotoCap and through the action group discussion. The
action group discussion was audio recorded and later transcribed by the researcher.
Campus Walk
Participants were asked to use the app, PhotoCap, to capture pictures of different areas of
the indoor and outdoor spaces of the campus to identify the barriers and facilitators of
physical activity, sedentary behaviour and nutrition. The brief captions written by
participants explained the reason as to why they perceive those areas to be barriers and
enablers which answers the research question. The caption also included the participants’
identification number, statement of whether the area or object of the picture taken was good
or bad and a brief statement explaining why participants have that opinion. The statement
included what the captured photo consists of and how they affect their wellbeing. Some
even included possible solutions and interventions for areas that were found to be barriers.

81
Action Group
Using the participatory action research method, an action group was held with 5
participants for a duration of 50 minutes in the session. Participants were asked for consent,
prior, to record the session using a voice recorder which was used to transcribe the action
group discussion for data and thematic analysis. To encourage participants joining the
action groups, snacks and drinks were provided in the session. Snacks such as mixed nuts,
arrangement of fruits, cheese and crackers, bottled water and drinks with a low sugar
content were provided. This also helped make the participants feel more comfortable and at
ease, hence helping them to collaborate with other participants more in a relaxed manner.
Questions and structure of the action group were planned by the researcher and
supervisor prior to prevent the discussion from deviating into irrelevant subjects and
discussion. Open-ended questions were used by the researcher to lead a larger discussion
about issues and to stimulate conversations amongst participants to generate ideas and
solutions such as: “Why have you taken these pictures?”; “What do you think the issues
are?”; “How can we overcome the barriers with realistic solutions and interventions?”. The
researcher also asked impromptu questions in between discussions to clarify answers and to
help participants think about the questions on a deeper level. The findings of barriers from
Stage One (campus walk) were discussed as to what those issues were and why they were
perceived as barriers to healthy eating, physical activity and sedentary behaviour. From that
discussion, the action group as a whole generated realistic solutions and interventions to
overcome barriers in the university campus setting. Brief strategies were planned as to how
those solutions will take place.

82
The voice recorder was used to record the whole discussion. The contents were also used
to derive direct quotes from participants for relevant topics. Thematic analysis was used to
decipher the conversations and to generate emerged themes from the discussions.
Thematic analysis
For the qualitative portion of this research study, thematic analysis was used to interpret
the data. This included Stage One and Stage Two’s data from campus walks and action
groups. Thematic analysis aims to extract the themes in a text or verbal discussion in
different levels to help others understand it more in depth and to use those themes to answer
the research question (Braun & Clarke, 2006). It is also a flexible framework that can suit
different types of research questions. It mainly suits research questions regarding
experiences, views and perceptions of participants ’in a study (Braun & Clarke,2006).
To find the emerged themes, coding and transcribing the text from the two phases was
completed. Since the campus walks’ data are in text, the text was dissected into manageable
and meaningful groups of themes based on common barriers and facilitators perceived by
the participants. The action group’s data were verbal, stored on a voice recorder and
transcribed to be analysed by the researcher. Emerged, basic themes, from both stages, were
then refined further into specific themes that were used to summarise texts and related to
the main issue or the global theme. Global themes are macro themes that encompass the
principal themes in the data as a whole. It shows the main themes in the given context
(Attride-Stirling, 2001).
Thematic networks analysis is a method that aims to explore the basis or understanding
of a problem or idea (Attride-Stirling, 2001). It is a way of organising the analysis of
qualitative data in a visual manner using illustrations as a tool of the emerged themes. The
illustration of the network systemises and groups the themes, also it shows the relationship

83
between the themes and how they affect and relate to each other (Fereday & Muir-
Cochrane, 2006). Using this tool as a visual illustration helps to present the qualitative
data’s summary in a manner that is easily understood. It supports the researcher’s
interpretation and exploration of the results (Fereday & Muir-Cochrane, 2006; Attride-
Stirling, 2001).
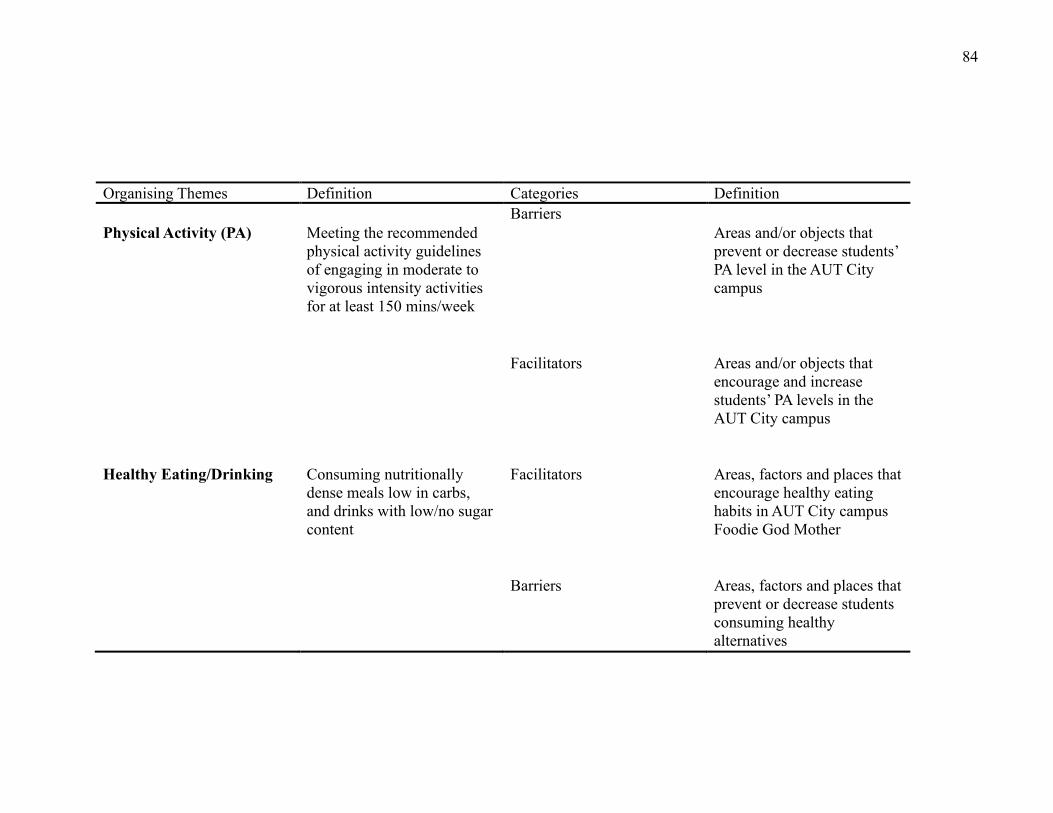
84
Organising Themes Definition Categories Definition
Barriers
Physical Activity (PA) Meeting the recommended
physical activity guidelines
of engaging in moderate to
vigorous intensity activities
for at least 150 mins/week
Areas and/or objects that
prevent or decrease students’
PA level in the AUT City
campus
Facilitators Areas and/or objects that
encourage and increase
students’ PA levels in the
AUT City campus
Healthy Eating/Drinking Consuming nutritionally
dense meals low in carbs,
and drinks with low/no sugar
content
Facilitators Areas, factors and places that
encourage healthy eating
habits in AUT City campus
Foodie God Mother
Barriers Areas, factors and places that
prevent or decrease students
consuming healthy
alternatives

85
Organising Themes Definition Categories Definition
Sedentary Behaviour Sitting or lying down
(awake) for long periods of
time
Facilitators Areas and objects used by
students that promotes
standing and/or walking
rather than sitting or lying
down
Barriers Areas and objects used by
students that may encourage
long periods of leisure such
as sitting and laying for long
periods of time
Table 4: Summary of Stage One's (campus walk) definitions

86
Chapter 4: Findings and Interpretations
This chapter presents the findings of the campus walk, online surveys and the action
group discussion with university students of AUT. It consists of analysing and deciphering
the qualitative data using thematic and case study analysis. The qualitative data is
represented via thematic networks as a visual tool to understand the main contents
discussed and found. It is also presented using a profile for each participant and the data
collected from them to understand each case individually. Similarities and differences
found amongst the participants have been reported. The interpretation of the graphs, tables
and thematic networks of the data is presented along with key ideas and themes that have
emerged.
Participants
A total of eight participants from different ethnic groups, current qualification and age
range met the inclusion criteria and were involved in the study. The descriptive
characteristics of the participants involved are presented in Table 5, page 87.

87
Table 5: AUT participants' demographics from online surveys
The study recruited 8 participants altogether from diverse backgrounds. Three participants
were males and 5 were female. The age range was quite large; ranging from 18 to 39. Only
one participant was a post-graduate student and the rest were completing their under-
graduate courses. None of the students were taking any courses relating to nutrition,
physical activity, health or physiology, as those courses are undertaken in the North and
South campus. Participant 6 had a health-related background. The participants recruited
have spent between 1 to 3 years in the City campus; most participants have spent 2 years
Participant Age Gender Current
qualification
Ethnicity Years
enrolled
in AUT
Postcode
area
Participant
1 (104)
22 Female Undergrad
Event
Management
Filipino 2
East
Tamaki
Participant
2 (105)
27 Male Bachelor of
Medical
Laboratory
Science
Chinese 2 Glen
Innes
Participant
3 (102)
19 Male Bachelor of
Computer
Science
Maori 2 Westmere
Participant
4 (110)
20 Male Bachelor of
Computer
Science
Indian 2.5 Auckland
City
Participant
5
18 Female Bachelor of
Communications
European 1 Te Atatu
Participant
6 (224)
39 Female MSc in
Transport design
French 1 Westmere
Participant
7 (221)
24 Female Bachelor of
Mathematical
Sciences
Tongan 3 Waimauku
Participant
8 (101)
33 Female Bachelor of
Communications
European 2 Arch Hill

88
enrolled in AUT. The participants recruited are from different parts of Auckland; only two
participants share the same post code.
All 8 participants completed the online survey that contained questions from the Health
Fair questionnaire, International Physical Activity and Health Promoting Lifestyle survey.
All questionnaires were scored in relation to the scoring system.
International Physical Activity Questionnaire (IPAQ) scoring
To determine the amount of energy each participant spent, the amount of time, in
minutes, in low, moderate and vigorous activity levels were multiplied by the number of
days participants had engaged in. This was further multiplied by the given value of METs
of each activity level (walking = 3.3, moderate activity = 4, vigorous activity = 8). Six
participants had scored High on the IPAQ. Those who scored High either engaged:
• In vigorous intensity activity on at least 3 days of the week, achieving a minimum
total physical activity of at least 1500 MET minutes per week.
• In 7 or more days having a combination of walking, vigorous or moderate intensity
activities achieving a minimum of 3000 MET minutes per week.
Participants who scored High were Participants 2,3,4,5,7, and 8. Two participants had
scored Moderate, which means they were engaging in some activity that was more than
likely to be equivalent to half an hour of at least moderate intensity physical activity
(see Table 6, on page 94 for a summary of all participants’ survey response). Those who
scored Moderate on the questionnaire engage in either:
• At least 3 days of vigorous intensity activity and/or walking at least 30 minutes
a day
• At least 5 days of moderate intensity activity and/or walking at least 30 minutes
a day
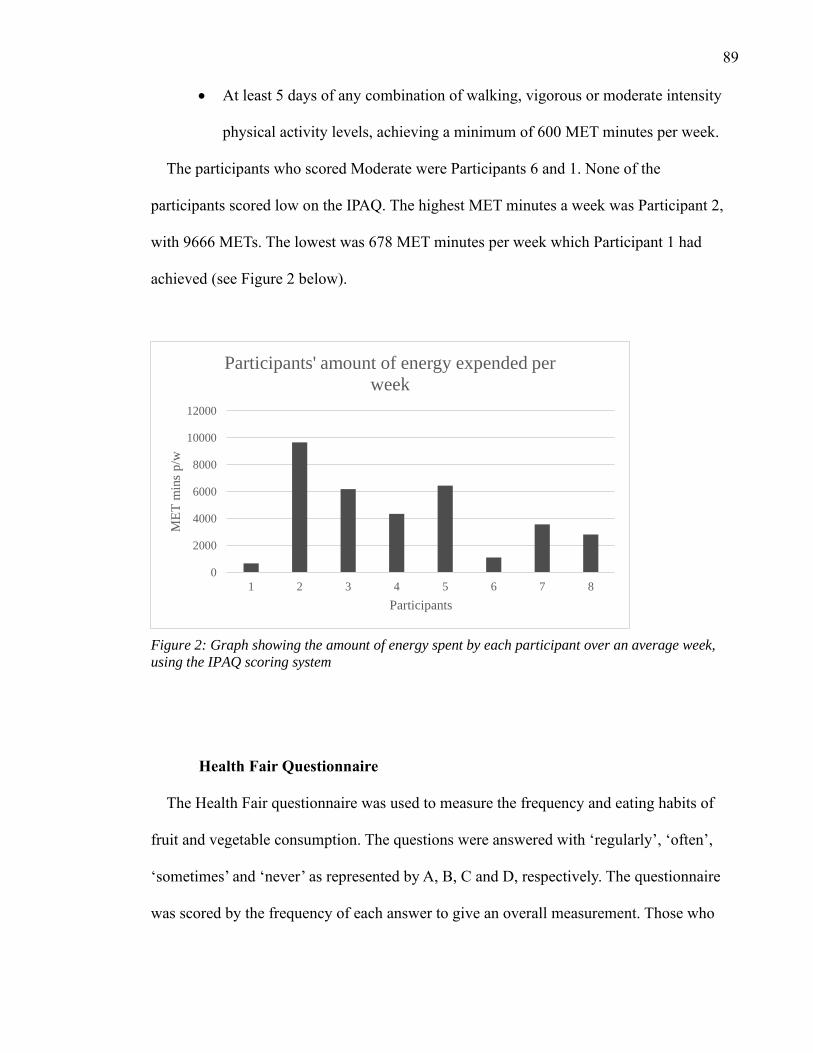
89
• At least 5 days of any combination of walking, vigorous or moderate intensity
physical activity levels, achieving a minimum of 600 MET minutes per week.
The participants who scored Moderate were Participants 6 and 1. None of the
participants scored low on the IPAQ. The highest MET minutes a week was Participant 2,
with 9666 METs. The lowest was 678 MET minutes per week which Participant 1 had
achieved (see Figure 2 below).
Figure 2: Graph showing the amount of energy spent by each participant over an average week,
using the IPAQ scoring system
Health Fair Questionnaire
The Health Fair questionnaire was used to measure the frequency and eating habits of
fruit and vegetable consumption. The questions were answered with ‘regularly’, ‘often’,
‘sometimes’ and ‘never’ as represented by A, B, C and D, respectively. The questionnaire
was scored by the frequency of each answer to give an overall measurement. Those who
0
2000
4000
6000
8000
10000
12000
1 2 3 4 5 6 7 8
ME
T m
ins
p/w
Participants
Participants' amount of energy expended per
week

90
score Mostly As consume at least 5 portions of fruit and vegetables per day. A score of
Mostly Bs may just be meeting the recommended minimum 5 portions of fruit and
vegetables most days per week; but need to increase the consumption of it. Mostly Cs score
meant that enough fruit and vegetables were not consumed per day and a minimum of 2
serving of fruits and 3 servings of vegetables was recommended. A score of Mostly Ds
meant that increased consumption of fruit and vegetables is drastically required and that the
recommended consumption is not being met.
Three participants, 1,3 and 7, scored Mostly Cs which showed that they weren’t meeting
the recommended portions of fruit and vegetables and needed an increase in consumption.
Participants 2 and 3 had scored Mostly Bs. They were just meeting the recommended
amount but improvement could be made. Participants 5 and 6 scored Mostly As. They
consumed at least 5 portions of fruit and vegetables and did not need an increase in portion.
Participant 8, however, had a mixed result. She had answered the questions with an equal
frequency of A, B, C and Ds (see Figure 3, below). Participant 8’s results were
inconclusive. The HPL survey would show a better understanding of Participant 8’s eating
behaviour.

91
Figure 3: Graph showing participants' results of the Health Fair Questionnaire
Health-promoting Lifestyle Survey II
The Health Promoting Lifestyle survey is a tool used to measure health promoting
behaviour, conceptualised as a multifactorial pattern of self-perception that serves to
enhance or maintain the level of wellness of the individual or participant in question (Pinar,
Celik & Bahcecik, 2009). The original 52-item survey uses a 4-point response format to
measure the frequency of the health-promoting behaviours in the areas of health
responsibility, physical activity, nutrition, spiritual growth, stress management and
interpersonal relationships. For this study, only the questions relating to nutrition were
utilised.
The questions are answered with ‘routinely, ‘often’, ‘sometimes’ and ‘never’ as
represented by the numbers 4, 3, 2 and 1 respectively. The scoring is calculated by finding
the mean of the participants’ response to the 8 questions used (see Figure 4, page 92).
0
0.5
1
1.5
2
2.5
3
3.5
Mostly A Mostly B Mostly C Mostly D Mixed
Num
ber
of
Par
tici
pan
ts
Categories
Participants' catergories from the Health Fair
Questionnaire

92
Figure 4: Graph showing each participants' score in the HPL survey
A high score, maximum 4, shows that the individual has a knowledgeable selection and
consumption of foods which are essential for health, wellbeing, and sustenance. A low
score, minimum 1, means that the individual has a lack of knowledge and has an unhealthy
eating habit and pattern. The highest score was of Participant 6’s with 3.375 and the lowest
was Participant 1 with 1.75. The average score for all participants is 2.45. An overall
improvement could be made to all participants eating behaviour through their
environmental factors to facilitate a better diet.
Sedentary Behaviour
There was a large variation amongst the participants; from 3 to 12 hours a day spent
engaged in sedentary activities (see Figure 5, page 93). The average hours spent on
sedentary activities of these participants was 6.25 hours per day. However, Participant 1’s
low MET; from the IPAQ, does not correctly correlate with her perceived low amount of
sedentary activity (see Table 6, page 94 for comparison).
0
0.5
1
1.5
2
2.5
3
3.5
4
1 2 3 4 5 6 7 8
Sco
re
Participants
Participants Score in HPL survey
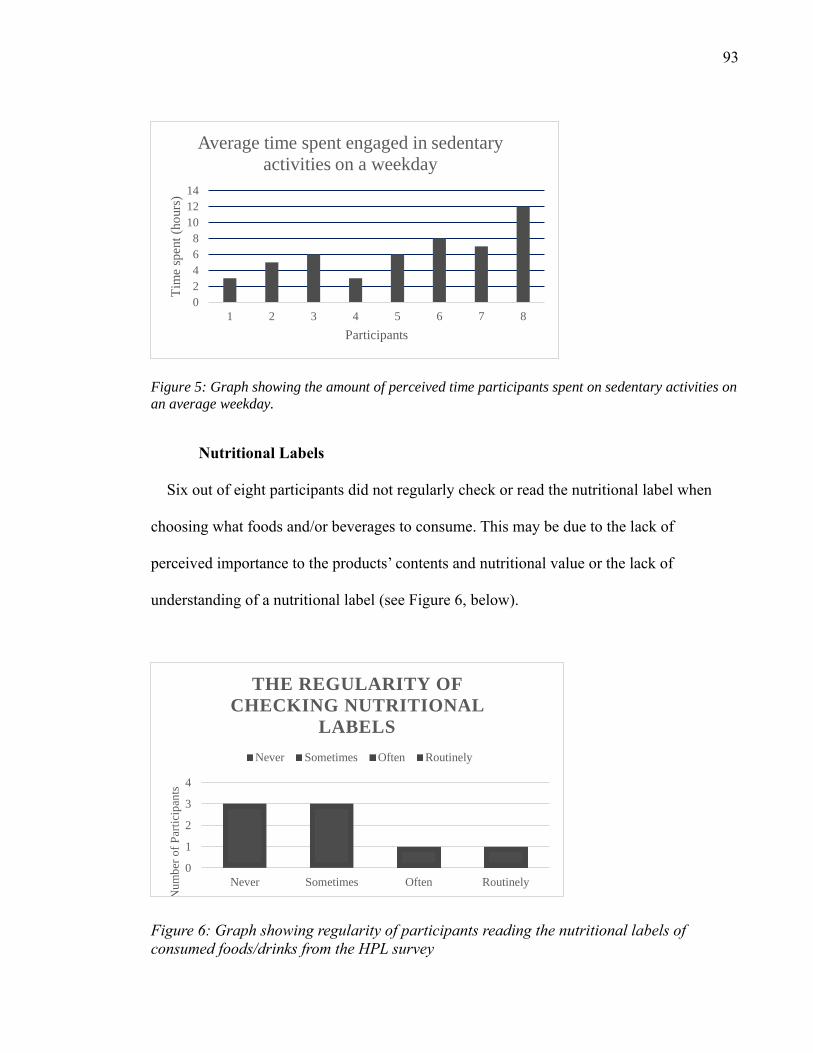
93
Figure 5: Graph showing the amount of perceived time participants spent on sedentary activities on
an average weekday.
Nutritional Labels
Six out of eight participants did not regularly check or read the nutritional label when
choosing what foods and/or beverages to consume. This may be due to the lack of
perceived importance to the products’ contents and nutritional value or the lack of
understanding of a nutritional label (see Figure 6, below).
Figure 6: Graph showing regularity of participants reading the nutritional labels of
consumed foods/drinks from the HPL survey
0
1
2
3
4
Never Sometimes Often Routinely
Nu
mb
er o
f P
arti
cip
ants
THE REGULARITY OF
CHECKING NUTRITIONAL
LABELS
Never Sometimes Often Routinely
0
2
4
6
8
10
12
14
1 2 3 4 5 6 7 8
Tim
e sp
ent
(ho
urs
)
Participants
Average time spent engaged in sedentary
activities on a weekday

94
Participants IPAQ (MET) Physical activity
levels
Health Fair
Questionnaire
HPL survey Sedentary
behaviour
engagement
(hrs/day)
1 678 Moderate Mostly C 1.75 3
2 9666 High Mostly B 2.125 5
3 6186 High Mostly B 2.125 6
4 4350 High Mostly C 2.875 3
5 6453 High Mostly A 2.25 6
6 1116 Moderate Mostly A 3.375 8
7 3573 High Mostly C 2.5 7
8 2826 High Mixed 2.625 12
Table 6: Summary table showing each participants' survey response
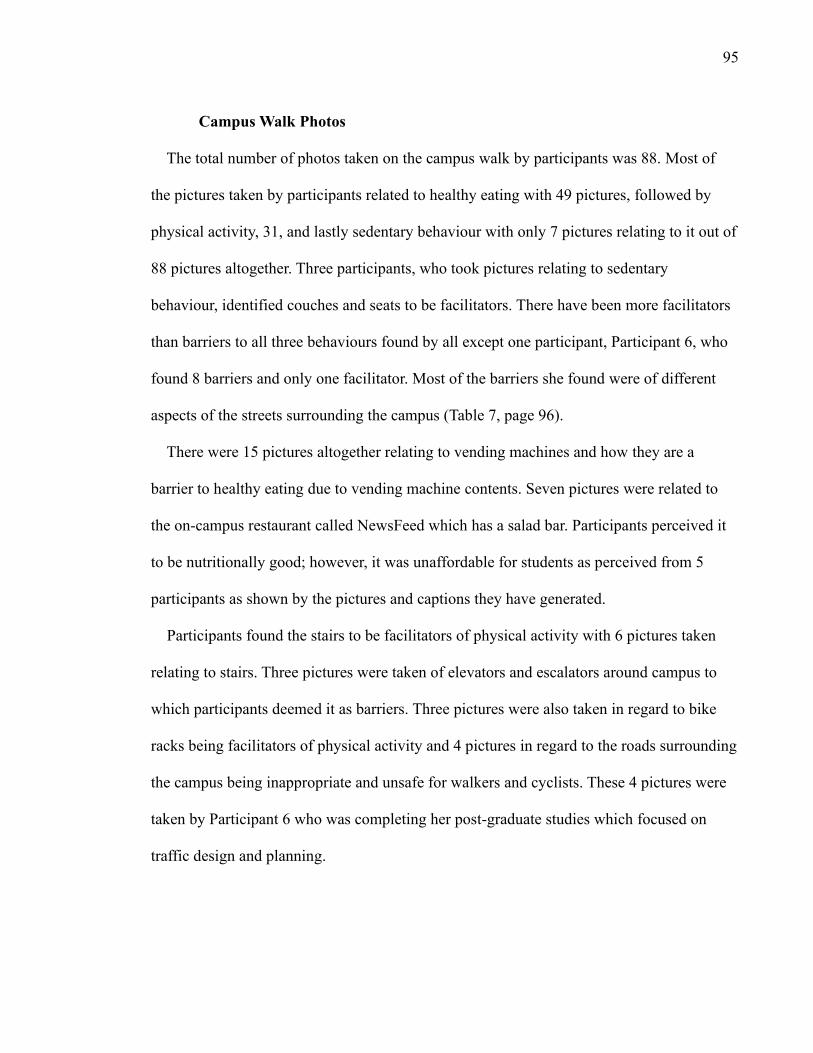
95
Campus Walk Photos
The total number of photos taken on the campus walk by participants was 88. Most of
the pictures taken by participants related to healthy eating with 49 pictures, followed by
physical activity, 31, and lastly sedentary behaviour with only 7 pictures relating to it out of
88 pictures altogether. Three participants, who took pictures relating to sedentary
behaviour, identified couches and seats to be facilitators. There have been more facilitators
than barriers to all three behaviours found by all except one participant, Participant 6, who
found 8 barriers and only one facilitator. Most of the barriers she found were of different
aspects of the streets surrounding the campus (Table 7, page 96).
There were 15 pictures altogether relating to vending machines and how they are a
barrier to healthy eating due to vending machine contents. Seven pictures were related to
the on-campus restaurant called NewsFeed which has a salad bar. Participants perceived it
to be nutritionally good; however, it was unaffordable for students as perceived from 5
participants as shown by the pictures and captions they have generated.
Participants found the stairs to be facilitators of physical activity with 6 pictures taken
relating to stairs. Three pictures were taken of elevators and escalators around campus to
which participants deemed it as barriers. Three pictures were also taken in regard to bike
racks being facilitators of physical activity and 4 pictures in regard to the roads surrounding
the campus being inappropriate and unsafe for walkers and cyclists. These 4 pictures were
taken by Participant 6 who was completing her post-graduate studies which focused on
traffic design and planning.

96
Table 7: Number of pictures taken by each participant and grouped according to topic from Stage One (campus walk)
Participants Barriers Facilitators Barrier/Facilitator Total no. of
pics
Physical
Activity
Healthy
eating
Sedentary
Behaviour
Participant 1
(104)
6 9 0 15 5 8 2
Participant 2
(105)
1 11 2 14 6 7 0
Participant 3
(102)
3 9 0 12 4 6 2
Participant 4
(110)
1 5 0 6 1 4 1
Participant 5 6 7 2 14 2 12 0
Participant 6
(224)
8 1 1 10 8 2 0
Participant 7
(221)
1 3 4 8 3 5 0
Participant 8
(101)
2 7 0 9 2 5 2
Total 28 52 9 88 31 49 7

97
Figure 7 (see below) presents the key-words from the captions on the photos taken by
participants during the campus walk. The key-words are the most commonly written words
from all the participants. The key-words are grouped by which aspect of wellbeing they
relate to: sedentary behaviour, heathy eating and physical activity. It is further grouped into
the perceived barriers and facilitators of each factor.

98
Figure 7: Thematic Network of key words of barriers and facilitators of the campus environment

99
Themes were identified by using Braun and Clarke’s approach to thematic analysis (see
Figure 8 below). The key words from Figure 8 were grouped together according to
common factors and significant broader patterns of ideas and themes. The grouping of each
keyword lead to collective names of themes being assigned to those groups based on the
scope and focus of each theme.
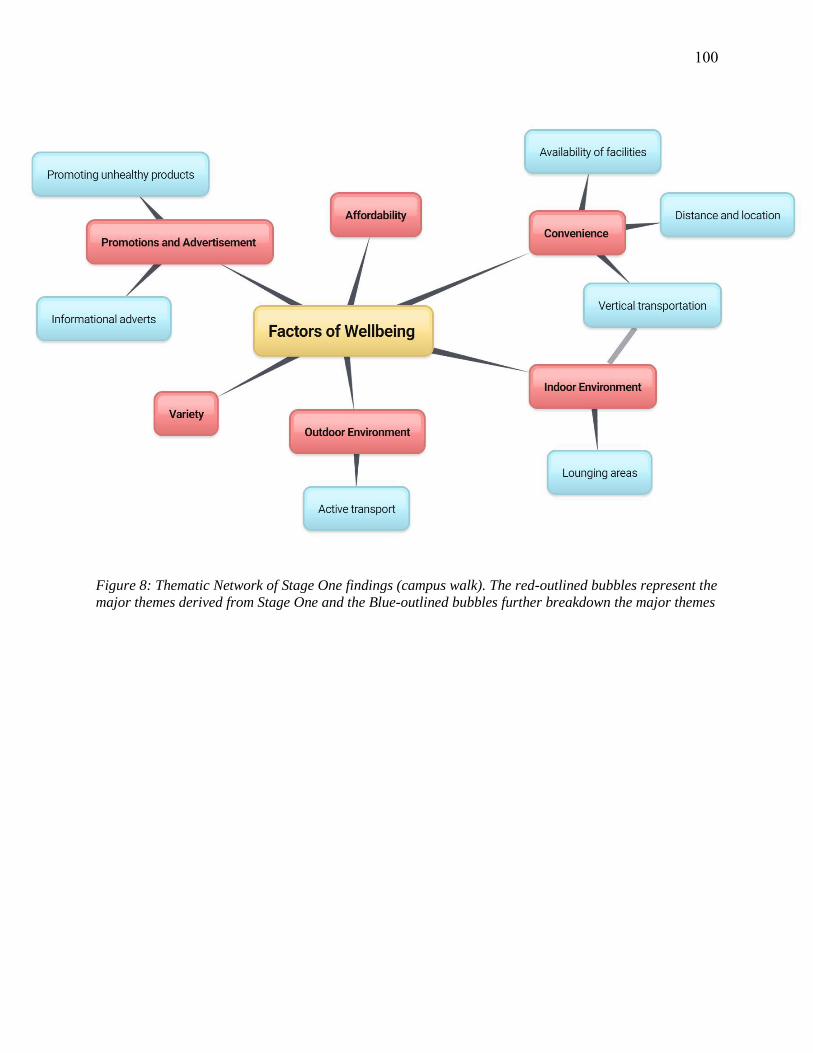
100
Figure 8: Thematic Network of Stage One findings (campus walk). The red-outlined bubbles represent the
major themes derived from Stage One and the Blue-outlined bubbles further breakdown the major themes
101
Campus Walk Findings
Variety
There were a few cafes on the campus and these cafes sold fruits for a dollar each or fruit
salads. Participants have identified this as a facilitator of healthy eating as it gave students
healthy eating options. However, the need for organic fruits was present. Participant 6 said:
“Good to have fruit but they are not organic. AUT could provide organic fruit without making
profit.” Participants also perceived NewsFeed and Refuel, which were restaurants on campus, to
have a variety of healthy meals. Refuel had different options of meals every day, for $6.50 per
meal. NewsFeed is a salad bar on campus that had a fixed menu along with some different meal
options every day which encourages students to be open to healthier options compared to other
places in and around the city campus.
Price (affordability)
Water fountains were available throughout the campus for students. This was identified as a
facilitator as students could consume water instead of other beverages which may be high in
sugar, also it was free, and there’s no limit of consumption. “Gives free water to students instead
of buying sodas or energy drinks that are unhealthy.”
NewsFeed, an on-campus salad bar, was perceived to be unaffordable by two participants
(Participants 7 and 1). “Salad bar encourages students to eat healthier options rather than
buying junk food. The meals sold are a bit pricy though.” “Really nice food and it’s on the main
level of the WG building (3) but it’s sometimes high priced and there’s not a lot of options. It’d be
nice to have more alternative easy access healthy food places.” Participants perceived Refuel to
be reasonable for its price, hence identifying it as a facilitator of healthy eating; “Lots of
102
vegetables. $60 for 10 meals. An investment that some people think is worthwhile. Or $6.50 per
meal without a voucher. The restaurant is called Refuel,” (Participant 2).
Piko2Go was a café that was run by AUT students who are in culinary classes. They oversee
making different types of foods and products for the café, which is done right next to the café.
Participants have identified this as a facilitator of healthy eating due to foods and drinks being
made by students, using ingredients that they are aware of. “The student café sells food made
from the other students to provide healthy options for students and allows the food makers to
understand what is perfected and what isn’t.” The prices of these foods were also perceived to be
reasonably priced.
Every Tuesday, there was a stall that sold vegan food for $5. Participants had perceived this as
a facilitator of healthy eating due to the meal being vegan, promoting to students that there were
other appealing diets, and it was at a reasonable price. “Pop up stalls like this one offer some
change to the students’ typical diet and it’s cheap too!” The stall was in the plaza and only takes
place once per week.
The food choices in the university food court were seen as healthy options by Participant 3;
“In terms of healthy eating the low prices encourages students to eat food at a lower price in
order to eat healthy and not spend as much money for food while on campus”. This caption was
on a picture, taken by the participant, that shows a fries and drink combo for $5 at Kebab King,
an on-campus eatery.
Unhealthy food and beverage options seemed to be cheaper than healthy items available in the
food court, cafes, and vending machines. “Bad but good value. Encourages unhealthy eating.”
Students are unable to afford the healthy options and opt for the alternative unhealthy option due
to its price factor. This was perceived as a barrier as students are drawn towards the cheaper

103
option despite the products’ nutritional value or lack of. “They have healthy options but they’re
way more expensive than the sweets,” (Participant 5). NewsFeed was also perceived as being
unaffordable by Participant 4; “Good nutrition when it comes to food, bad at cost.” Participant 5
said: “The build you won salad option is very expensive,” when showed a picture of the salad
options’ price. A small size is $6.50, and a large size is $8.00. Participant 6 observed that
affordable options are usually unhealthy; “Cheap options for eating are nutritionally poor
(except when Veda makes lunches).” Veda is the club responsible for vegan lunches on campus.
There have been mixed reviews on Refuel as Participant 7 said: “Good/bad- Although the food is
good, there’s not that many healthy options or alternatives that the students can have-at least in
the WG building.” Vending machines that were placed around campus did not all have the same
prices for the same products. Some are priced higher or lower in different machines. The reason
for the variation in price is unknown since the proximity of the vending machines are quite close
and are in accessible areas.
Vesbar was a student bar located on campus, right next to the food court. It was open from
noon till 7pm. Many participants have found this to be a barrier due to promoting drinking and
eating bar foods. Bar foods usually tend to sell unhealthy meals and snacks such as fries, burgers,
onion rings, etc. “…promotes alcoholism and binge eating of junk food.” The drinks served were
also found to be affordable which further encourages drinking. The bar, on Wednesday nights,
had a discounted special where AUT students are able to buy drinks for a cheaper price.
Advertisements and Promotions
Although the campus gym was an overall facilitator of physical activity, there were many
factors of it that participants had identified as barriers. Many participants claimed that they did
not know where the campus gym was located due to the lack of signs and posters. The gym was

104
located in an area that was not easily seen by others. “It’s good that we have a fitness centre but
there’s not much publicity and it’s in a pretty secluded area…doesn’t reach out to the public?”
(Participant 7).
There were placements of notices on those the vending machines that border a couple of rows
of beverages, stating that they were low in sugar and a healthier choice. “Good and bad, it
encourages students to drink water, however only 4 rows are of water,” (Participant 5). She
found that the drinks that are being promoted as “healthy” are deceiving; “Arguably bad,
because it’s selling the fake notion of ‘healthy fizzy’. This was used as a caption on a picture that
Participant 5 took showing the contents of the vending machine with carbonated drinks placed in
the section that claims it has low sugar and is a healthy option.
Some participants have found posters and advertisements of unhealthy food products around
campus such as advertisements for KitKats. “…encourages unhealthy eating patterns.” There
were also temporary stalls that gave out unhealthy products to students for free for promotional
reasons such as Red bull and chocolate milkshakes. “Free drink! But it’s chocolate…enough
said.” This was found to be a barrier as participants, in the action group, have claimed that
advertisements do have an influence on their eating choices and habits.
Outdoor Environment
The physical environment of AUT City campus had some structures and areas that encouraged
their students to meet the guidelines of physical activity. This is: being involved in moderate to
vigorous intensity physical activity for at least 150 minutes per week.
One of those areas being the multiple bike stands that were located around the campus, which
allows students to park their bikes. There were four bike stands that are in different parts of the
campus and are safe to keep bikes as the areas are under surveillance. This encouraged students

105
to travel via bikes rather than indulging in sedentary behaviour in cars and/or buses. “Bike stands
around campus encourage biking rather than driving etc.” It contributed to them meeting their
physical activity guideline as well as incorporating a method of exercise in their routines.
Participants had also identified a benefit on the environment when using bikes instead of
alternative transport methods which can contribute to the greenhouse effect. “Promotes biking to
uni which not only good physically but environmentally as well.”
Many participants had observed that the basketball court had encouraged many students to
play basketball during their free time. Participant 2 states: “In terms of physical activity the
basketball court is a simple way for students to get active and social with other people while
enjoying a relaxed game of basketball.” The AUT student council office also lends out sport
equipment for free, such as volleyball nets, and balls, to students. This encouraged students to be
involved in different types of sports and games which causes them to be more physically active.
The bike racks were facilitators of physical activity, however, there were a lack of bike lanes
around the campus area which may have discouraged bikers. The city area was busy with large
buses and cars. The lack of bike lanes posed a safety issue. Participant 6, who was postgraduate
student said: “bad environment for walking and cycling, a lot of use buses and walk between the
university and AUT, the environment doesn’t support it. The universities should work with the
council and AT to retrofit.” Participant 6 had said this in regard to the lack of bike lanes on
Symonds Street and had provided a suggestion for a solution to overcome the barrier which was
to work with the council to design and plan better roads for students and/or cyclists.
The only facilitator for sedentary behaviour, identified by participants, were standing tables.
Standing tables located outdoors had been identified as a facilitator as it encouraged students
106
standing more often rather than sitting down for long periods of time. “More opportunity to be
active rather than sedentary.”
Indoor Environment
AUT had buildings with multiple stories and had many flights of stairs that students could use.
Participant 2 states: “Most buildings on campus have stairs going up to the higher levels and in
some cases the escalators don’t go upwards to the top floor so both students and staff would have
to climb the stairs to reach the top floor as elevators are mostly unreliable.” Participants had
identified and perceived that stairs in and around the campus had benefits for their health and
assisted them to meet their recommended physical activity requirement. “Students and staff gets
a chance to have a bit of exercise when going around the university.” The stairs also had good
accessibility purposes for able-bodied students. “No elevator so encourages walking for able
bodied people.” This was a caption on a picture of a flight of stairs. There were elevators
available for people on wheelchairs and crutches.
Escalators had been found to be a major barrier to participants as it prevented students from
walking and incorporating more physical activity into their routine. Instead it promoted an
inactive lifestyle when students got used to standing still when using a convenient method of
transportation. “Students can get lazy and ride the escalators instead of taking the stairs which
can benefit them physically.” Elevators also encouraged this. “Students can get lazy and not take
the stairs instead. This won’t give them any physical benefits.” There were many elevators
situated around the campus that should have been used for students and staff that were unable to
walk freely. Participants had found this to be a barrier as it limited the opportunity of walking
many flights of stairs that could contribute to students’ recommended physical activity. Students

107
were aware of stairs that they can use, however, they preferred using elevators instead was it is
convenient and effortless.
Treehouses had been identified as a beneficial area of the campus by participant 8 who stated,
“Good space sedentary, can relax and destress,” captioned on a picture of the Treehouses.
Treehouses are covered, comfortable, bed-like seats that students can use to take a nap in, have
privacy to study or to just lay on. Participant 8 had identified seats to be a facilitator; “Good-
seats rather than couches that don’t encourage lounging,” was captioned on a photo of the large
number of seats in the library. Participant 3 perceived a lounging area with lots of seats and
couches to also be a facilitator; “The lobby area of level 1 is a casual area that students can
come to hang out with their friends, socialise and study without having to be quite like the
library”.
Participants had identified that the large amount of seating areas located indoors and outdoors
as a barrier as it promotes sedentary activity. Participant 1 stated that indoor seating areas are
“bad-promotes sedentary behaviour.” Another participant (Participant 8) agreed and stated:
“Encourages lounging rather than active study” on a picture of an indoor couch.
Convenience
Participants had also found the gym to be a facilitator of physical activity as it was accessible,
and convenient to them since it was located closely. It also allowed students to have a work-out
during their breaks, before or after lectures, at their convenience. “Good as access to the gym
facilities encourages students to be more physically fit after classes. Students don’t have to find a
gym outside.” Right next to the gym was group exercise programme which had indoor and
outdoor classes, held by trained instructors. The range of classes include Zumba, circuit, box
skills, yoga and Pilates. Participants had also identified this as a facilitator of physical activity as

108
it gave a range of different classes that students can choose from. Since it was a group session, it
encouraged students to invite their other friends to join as well, making it more enjoyable and
more likely for students to keep joining classes. “The gym offers the students a cheap method of
fitness with various fitness machines which can help out with students looking to get active and
also provide a place to socialise with more students,” (Participant 3).
The student kitchen areas in the campus contained microwaves, sinks with hot water and
seating areas. Participant 1 claimed that this area encouraged students from bringing home-
cooked meals as they can microwave it on campus. “Clean up space encourages people to bring
cooked meals from home (might be healthier).” Home-cooked meals may be healthier than
buying processed foods, or meals that they aren’t aware of what it contains. However, Participant
1 also perceived that the low numbers of microwaves available may be an issue. “Limited
microwaves for a large campus, might discourage people from bringing home meals.”
Vending machines that were located all over the campus had found to be perceived as a barrier
as participants deem most of the items to be unhealthy. This was due to its high sugar and salt
content. “Vending machines are a cheap option for people to buy snacks from however often. The
food products inside are junk food consisting of high sugar and fat levels which is unhealthy for
the people who purchase from it.” The ratio of healthy and unhealthy items were in the favour of
unhealthy food items and beverages. The easy accessibility and convenience to those unhealthy
products had also been found to be a barrier to healthy eating. “Although there are healthy foods
like nuts and water, majority of the food in the vending machines are unhealthy snack foods and
energy drinks. Again, not much of a healthy variety/options compared to unhealthy.” The
placements of vending machines had also been found to be an issue as participants found
vending machines sold products high in sugar and saturated fat right in front of the gym.
109
Unhealthy items were sometimes placed at eye level in some vending machines. However, there
were other vending machines that had placed healthy drinks that were low in sugar at eye level.
Interestingly, Participant 2 perceived vending machines to be necessary despite the unhealthy
snack options; “Bad but necessary. Unhealthy food rich vending machines very tempting to
stressed students.”

110
Stage Two: Action group Findings
Themes produced by action group discussion
Five participants were able to take part in the action group discussion. The aim of the
discussion was to focus on the barriers identified by participants in the campus walk and to
generate potential, realistic solutions to overcome those barriers. The discussion was moderated
by the researcher who already had a set of questions prepared to guide the conversation.
The discussed barriers were high use of elevators, inaccessibility to healthy eating and the
gym, unhealthy influence of advertisements and the contents of vending machines. Participants
collectively generated solutions to those identified barriers that were deemed suitable to them
and other AUT students (see Figure 9 below).

111
Figure 9: Solutions to identified barriers generated from the action group
112
Elevators and Escalators
As discussed in the action group and campus walk, elevators and escalators were found
to be to barriers to physical activity as it prevents and/or decreases the amount of walking
done by a person. Participant 3 uses stairs instead of elevators as it can take a while and
stairs tend to be faster. “I have all my classes which are up level 8, level 9 and I’m standing
there pressing that button for so long. So, then I just take the stairs.”
Participants in the action group recommended to encourage using the stairs instead of
elevators and escalators by having a few of the stairs around campus turn into musical stairs
that are away from classes as to not cause disturbances. Participants said that they would
definitely use stairs if that is the case. “That would be pretty cool. I remember they had a
thing at Aotea Square where you walk up the stairs and they had like piano noises.”
Adding aesthetic items to staircases was also a suggestion such as mosaics to interest
students in their environment and to encourage walking. Motivational posters or
informative posters about the benefits of choosing to use stairs instead was also a
suggestion. Participant 3 suggested: “We could maybe put up posters and stuff like that.
Like posters that has motivational words to walk more and use stairs instead of, say,
elevators and escalators.” Participant 5 agreed and added to the suggestion. “Yeah, posters
that could say the benefits of using stairs instead like using the escalator burns this many
calories or something like that so it brings awareness.” The informative posters could be
placed around the area of escalators and near the elevator buttons so frequent users would
see the benefits of making a simple choice of increased walking and the impact on their
health.

113
Vending Machines
The products in the vending machines along with the price of certain items have been
found to be barriers from the campus walk. To overcome this, participants recommended to
change the placement of healthy products, so the healthy items are more visible to the
students who use the machines. “Yeah, it makes sense, right? Stock the healthy products at
the top” (Participant 3). For the pricing of the vending machine products, participants have
noticed an unfairness of cost. Participant 3 said: “That’s the thing though, they overprice the
expensive stuff and the healthy stuff.” Participant 4 seemed to agree about the unfairness of
the products’ price; “If you’re placing vending machines, they should be more convenient.
So, they should have convenient prices.” High prices of healthy products are found to be a
hindrance to their purchase as participants are not willing to spend a high amount on them;
“I don’t really want to pay 5 bucks for small bottle of water or whatever else.”
Participants have found that convenient stores by the university have more affordable
prices for the same products compared to on-campus vending machines. Participants
suggested to decrease or subsidise the price of healthy products in order for students to
choose the healthier options rather than the junk foods. Participant 5 perceives this as a
factor that will skew the students’ choices to healthy ones instead as price is a huge
deciding factor. “Like a little bit cheaper so that people can buy it and then when they see
something that’s more healthy, they’ll be like ‘oh might as well just buy water.’”
Participants have identified the need for a larger variety or options of healthy snacks in
the vending machines during the campus walk and action group. “They have nuts,
crackers…they should also add more healthy things cos there’s not much options”
(Participant 3). The only healthy snacks found in the vending machines were nuts and

114
cheese and crackers, with most of them being junk food consisting of high sodium, sugar
and/or other carbohydrates.
Campus Gym
The campus gym was perceived to be both a barrier and a facilitator. It was accessible
however it was hidden and was perceived as being unaffordable for students. Participant 4
said: “It’s good but they’ve hiked the prices up and with that kind of price I’d rather go to
another gym than this one,” and “It’s 520 bucks per year. Used to be cheaper. The year
before it was 390 or something. That was still doable but 520 is just too much.” The price
of a student membership was $490 per year if payed up front and in full amount for all
campuses. It was $325 for a 6-month membership. Participant 4 also pointed out that he
was actually a member of the University of Auckland’s (UA) gym as it was cheaper
compared to AUT. The price of a UA student membership was $319 per year and $205 for a
6-month membership with an up-front payment. Even with a $60 one-off payment, for if
the payment is done through a debit card, the price of UA student gym membership was
drastically cheaper. “I have the membership there so yes. Also, they have the thing where if
you sign up for the first half of the year, so from March to June- I mean April to June they
have this deal that if you sign up it’s 200 bucks for the rest of the year” (Participant 4). He
was referring to the prices that were being offered to students at UA which were much more
affordable to students compared to the prices AUT has to offer. Participant 5 also agreed
that the price was too high and should be decreased further for the students as a solution.
The AUT gym also needs an upgrade or revamp as their facilities were not up to
standards as suggested by Participant 3; “I just know form ours, I’ve only been to the gym a
few times, but their facilities kind of need improving. They need an upgrade.” Participant 1
agreed with this saying: “True. We need to get more machines and stuff. I don’t think there’s

115
much there because it’s quite small.” Having more variety in facilities at the gym may
attract more students to have a membership as the added benefits may appeal to them for
the price. This would in turn help students meet their recommended level of physical
activity and decrease the likelihood of having a non-communicable disease.
Healthy Eating
From the action group, it was apparent that participants found the cost of the on-campus
meals to be unaffordable when asked by the researcher. They claimed they would rather go
to places off-campus for a cheap meal. “For me, I like to go to-there’s a food court
underneath The Warehouse. It’s a bit of a walk but I like to kind of go and stretch my legs to
get some lunch before or in between my classes. Just because yeah the prices here are kind
of too much” (Participant 3). Participant 3 also prefers to eat off-campus to a place where
it is more affordable; “Yeah like I go to Star Kebabs on Queens street and that’s like 5
bucks from Mondays to Friday.”
“We were also talking about how he brings food from home (participant 3). He doesn’t
buy food from here. But for me sometimes when I don’t bring food, it’s close for me, when
I’m busy or in a rush, it’s accessible so that’s the main thing. But we also discussed the
price and how it’s quite expensive so sometimes we prefer to go outside. For example, to
the city or me, I go to St. Pierre’s or Subway because it’s cheaper,” (Participant 5).
One of the suggestions to have emerged from the discussion group was that the prices for
healthier options should decrease for students to be able to afford it and become more
accessible to them as Participant 4 perceived; “Again, they need to make the healthy stuff
cheaper for us.” Another suggestion, by Participant 5, was that each café or restaurant on
campus should offer a healthy combo for an inexpensive price to promote healthy eating
and to overcome the barrier of price. “Yeah like maybe each place on campus should like

116
maybe offer a healthy combo for quite cheap. So, like a bottle of water plus a salad for 5 or
6 bucks.”
Participant 1 agreed and added a suggestion of her own; “Yeah same like all café’s should
have a special deal so more students can afford healthy meals. And I reckon they need to
add more healthy meals cos there’s not that many options like on campus…” Price and a
variety of options was needed on campus to promote healthy eating and give students real
options when it comes to consuming nutritionally dense food especially if it’s affordable
and a wider choice of appealing options is present.
The university sometimes had temporary food stalls that advertised new types of food
products and had vegan food stalls once per week. Participant 3 suggested involving stalls
that promote and sell products that are healthy to students, so they are aware of other
healthy options. “How about those vegan stalls? Like that I reckon there should be more
stalls to like advertise healthy meals so we’re aware of other diets I guess?” The
participant also perceived this to help raise awareness of other diets such as the Vegan stall
does, at a cheap price.
Advertising
Often on campus, there were free giveaways such as Red Bull energy drinks to promote
products which had been found to be a barrier as it introduced unhealthy items to students.
When discussing photos from the campus walk, Participant 3 said this about a picture with
free chocolate milk giveaway: “This one’s the free chocolate drinks. I know that in the
square they do a lot of free giveaways. In this case, we were just discussing that it’s cool
that they’re giving away free stuff but it’s chocolate milk so that’s not really healthy. I mean
I remember recently they were giving away free V’s as well like maybe they should be giving
away healthy stuff as well to balance it out.” The suggestion of promoting healthy products

117
by giving a sample to students for free can be a solution to overcome the barrier.
Participants perceive advertisement to be an influence on their choices of what to consume;
“Yeah like with the example of KitKat at the gym thing is like you know, I could be coming
out after a work out and see a KitKat and I’ll feel like KitKat just because of that
advertisement,” (Participant 3).
A barrier that was not found from the campus walk but rather from the group discussion
was that participants were unaware of the many benefits of being a student at AUT, which
can be enablers of physical health, and that better advertisement and promotion was
needed. Participant 2 had acknowledged this when discussing how students weren’t aware
of Refuel and other aspects of the campus: “…Yeah because you know how you were saying
that there’s so many things like free stuff, you can get equipment from AUTSA, not many
people know about this.” She was referring to students being unaware of free hiring of
sport equipment from the student council office. Participant 3 agreed with this statement:
“See I know that I, last semester, signed up for the volunteer force for AUTSA and then
through them I learnt about different services and stuff. But I was here for a whole year last
year and I didn’t know anything about the services.” Even students who had been enrolled
in AUT for a considerably long amount of time aren’t aware of the facilities and services
that they are entitled to if required. With regards to Refuel, Participant 4 perceived the
location of it to be a barrier as many students weren’t aware of it; “Like the two main
places that are good for students are NewsFeed café at the entrance of WG and then
Refuel… Plus it’s hidden unless you really look out for it, if not you’re not going to find it.”
The solution was to overcome the barrier by advertising healthy food places more around
campus, so students will be aware. Another solution was to advertise the gym area, free
sport equipment hires and other services during orientation through student ambassadors

118
who give campus tours to new students. However, as pointed out by Participant 4, student
ambassadors were unreliable, and the student council was trying to tackle this issue; “We do
but the thing is that the student ambassadors when they give campus tours, they don’t really
give a ... Yeah, the ambassadors are like I can’t be bothered. Because in order to get a
certificate to show that you can be an ambassador, you need to go on a campus tour and
you check a couple of things off the boxes; campus tour is one of them. So, you need to go
on one campus tour or one orientation workshop each.” Participant 4 suggested that
students who undertake workshops to become ambassadors should have a test they need to
pass in order to qualify and to ensure they are well informed enough to show new students
around; “If they’re relying on someone showing them around…it should be with
ambassadors who are fully trained. Maybe they should do a test after workshops to see if
they can become ambassadors.”
Participant 2 suggested the use of social media to raise awareness since there are AUT
pages on Facebook which can be used to promote sport events; “…Yeah cos there’s so many
things that can help out, but we just don’t know about it. We can have more of a social
media presence to let others know what’s happening like tournaments they can be part of.”
The university displayed advertisements around campus which were paid for by
companies to promote their products. There had been some advertisements of unhealthy
products that participants had identified as barriers to healthy eating in Stage One as they
can be an influence on eating choices; “So yeah I’ve seen ads of like KitKats and chocolate
milk and stuff around campus so that would like influence students. Like oh yeah, I want
some, and there’s vending machines right there so they can get some,” (Participant 1).
Participant recommended to lower or subsidise the price of advertising for companies that
have healthy food or drink products that they would like to promote; “So basically, I guess

119
it’ll be charging a higher rate for people for paid advertisements for unhealthy stuff and
subsiding companies who want to promote healthier stuff. Like for a fact that we are
sponsored by a company that provides menstrual cups, like they stock stuff in Foodie God
Mother. So, anyone can just go and grab them.” Foodie God Mother is a space in the
student council office that was stocked with non-perishable items and supplies such as
tampons, toilet paper, toothbrushes etc. Students were able to take anything they need for
free as long as they have their AUT student IDs with them. With a low rate for advertising
offered to companies that are deemed healthy, it is likely that it will encourage other health
companies to promote their products or messages on campus through the university
magazine, posters and/or stall.
Other Barriers
The lack of time had been perceived to be a hindrance to participants in terms of physical
activity. This was because with the available time that they do have, they prioritised
studying rather than engaging in physical activity. “For me it does but it’s because I’m
busy. Even though I want to walk more, exercise more, it’s because I have things that I
value more such as studying. So, I guess it’s just time,” (Participant 5). The rest of the
participants in the action group agreed that time is an issue for them as well.
Price of food in general is a barrier as the food on campus is unaffordable for some
students as acknowledged by the participants; “Like I know for a fact that people who
literally survive on coffee and energy drinks for the whole day and then they go back home
and that when they eat their first proper meal. Which is dinner… There are people who do
that because when they’re studying they don’t really feel like eating and the options
available aren’t suitable enough for their wallets and their appetites,” (Participant 4).
Skipping meals is essentially unhealthier compared to eating junk foods as it can cause a

120
negative effect physiologically. Appeal for the type of food is also a factor in influencing
their choice of consumption, regardless of nutritional value; “Like if I see a fruit for a
dollar and a muffin for a dollar, I’m going to pick the muffin,” (Participant 4).

121
Table 8: Summary of barriers and its solutions generated in the action group discussion
Barriers Suggested Solutions and Interventions
Elevators and escalators Motivational and informational posters about choosing to walk
Aesthetically pleasing stairs eg musical stairs
Vending machines Increased healthy foods and snacks
Cheaper healthy snacks
Healthy foods placed at eye level
Gym Decrease of membership price
Increase awareness about gym, sport equipment, sports teams
Upgrade gym facilities
Healthy eating Healthy food should be affordable
Offer more variety
Have healthy stalls
Offer cheap, healthy combos
Advertising Heathy food product advertisements
Promote university benefits such as gym, sport equipment, Foodie
Godmother
Train university ambassadors better
Increase social media influence
122
Chapter 5: Discussion
Stage One Interpretation
Findings from the campus walk had similar results to previous literatures in that
participants identified cost, lack of promotion and information about physical activity, such
as clubs and sports teams, to be barriers to physical activity and facilitators to sedentary
behaviour (Greenwood-Hickman, Renz, & Rosenberg, 2015; Shuval, Hébert, Siddiqi,
Leonard, Lee, & Tiro, 2013).
Perceptions and opinions of the gym were mixed in regard to affordability and attraction
to join as a member. Participants all had identified the gym as a strong facilitator of
physical activity due to the gym having equipment for working out and having a gym on
campus. However, price and lack of information about location of the gym prevented
participants from becoming members. Cost, availability and accessibility of sport facilities
and clubs have been found to be major determinants of physical activity in previous
literature as well as tertiary students tend to have limited funds, where an unaffordable gym
membership isn’t prioritised (Shuval, Hébert, Siddiqi, Leonard, Lee, & Tiro,2013; (Deliens,
Deforche, De Bourdeaudhuij & Clarys, 2015; Grubbs & Carter, 2002). Previous studies
also mentioned time and physical exertion to be barriers. Engaging in social settings such
as team sports or fitness classes also encouraged students to participate as having friends
encouraged them to partake often (Deliens, Deforche, De Bourdeaudhuij & Clarys, 2015;
Buckworth & Nigg, 2004). AUT gym does provide fitness classes which is included in the
membership price at no extra cost.
123
Overall, there were more facilitators than barriers found and most of the pictures and
captions taken were related to healthy eating, followed by physical activity and then
sedentary behaviour. Most of the barriers found were related to vending machines,
elevators/escalators and the unaffordable price of healthy eating. Most perceived facilitators
were related to stairs, student kitchen areas, basketball court and bike racks. There were
some barriers found that were already being resolved by the university. For example, some
participants identified couches and seats as an enabler of sedentary behaviour, however in
the City Campus, there are outdoor and indoor standing tables as a solution to overcome the
issue and to promote standing. Some of the participants had identified this. If the research
had a larger sample size, perhaps more participants may have noticed this. Another example
was the perceived barrier of advertising unhealthy drinks and food by handing out free
samples. There have been other companies that give out free samples to students of which
the products have been substantially healthier such as vegan foods. Participants also failed
to identify this, but this may be due to the products being given out only on certain, rare
days.
Survey Interpretation
All participants reported having either a moderate or high energy expenditure from the
International Physical Activity Questionnaire, achieving a minimum of 600 MET minutes
per week. These participants include at least 150 minutes per week of moderate intensity
activity and/or 3 days of vigorous intensity activity. New Zealand’s Ministry of Health
recommends at least 2 ½ hours of moderate or 1 ¼ hours of vigorous physical activity
throughout the week for adults. None of the participants failed to meet the recommended
guidelines, hence they were all deemed to be physically active. The activity levels of this
sample are higher than the previous study conducted by Sinclair, Hamlin and Steel. This
124
was a pilot study, which was conducted in a New Zealand university, where only 40% of
participants met the recommended guidelines (Sinclair, Hamlin, & Steel, 2005). However,
this research had a sample size of 8; a larger sample size may have yielded similar results
as the pilot study. This study did not collect information from participants with reported
low-physical activity. If the sample had a variety of physical activity levels, the collected
information from the campus walk and action group may have been different.
The Health Fair questionnaire completed by participants showed that only 2 participants
met the recommended guidelines of consuming a minimum of 5 portions of fruit and
vegetables. Five of the other participants’ responses to the survey showed the need to
increase their portion consumption to meet the recommended guideline. Participant 8,
however, had mixed results as her response was of equal numbers of A, B, C and Ds;
therefore, her results were inconclusive. The previous study conducted in New Zealand
with university students showed that 76% met the guideline, which is substantially higher
than this research’s group of participants (Hartman, Wadsworth, Penny, van Assema, &
Page, 2013).
The Health Promotion survey, however, yielded different results from the Health Fair
questionnaire. According to the HPL survey, all but one participant, has perceived to be
well educated in their choice of food consumption and had limited unhealthy options in
their diet for their wellbeing. This includes limiting added sugars, saturated fat and
consuming the recommended portions of fruit and vegetables. The survey was scored from
1 to 4 with the average score for all participants being 2.45. Overall, participants have
perceived to have decent diets with considerably healthy eating behaviours. One of the
questions from the HPL survey asked for the regularity of reading the nutritional labels on
foods and beverages. Only one participant, Participant 6, consulted the nutritional label

125
when deciding to consume the products’ contents. There are many possibilities as to why
these participants do not regularly check the labels of products. One of which may be that
they simply don’t understand or can interpret the labels. Other reasons may be that
participants do not contemplate nutritional value of products and foods to be an important
factor or influence on food choices, hence they don’t take labels into consideration.
Participants from this research claim that cost, taste and convenience are mainly the
determining factors when deciding where and what to consume when on campus. This is
similar to previous findings from literatures where determinants of food choices were
discussed; taste, cost, nutrition, convenience and weight-control had been found to be major
influences on participants’ food choices (Glanz, Basil, Maibach, Goldberg & Snyder, 1998;
Shepherd et al, 2005).
One of the questions from the survey measured participants’ sedentary behaviour and the
average amount was 6.25 hours on a typical weekday. This is higher than previous studies
where the reported amount was 4.27 hours per day or 30 hours per week. (Buckworth, &
Nigg, 2004; Rouse & Biddle, 2010). Those participants were also from tertiary institutes;
however, the study was based in America.
Males, from this research, on average spent less time on sedentary activities compared to
all females except one, Participant 1. However, Participant 1 had inconclusive results as her
low MET minutes per day did not align with her low amount of time spent engaged in
sedentary activities (see Table 6, page 94). Buckworth and Nigg had reported that males
had spent significantly more hours engaged in sedentary activities compared to females
despite males reporting to participating in physical activity more frequently (Buckworth, &
Nigg, 2004; Rouse & Biddle, 2010). Comparing this research to Buckworth and Niggs
study, the data for males regarding sedentary behaviour does not correlate. However, this

126
may have been different if this research contained a larger sample size as it would provide
more accurate and comprehensive data that would be appropriate for comparative reasons.
Stage Two Discussion (action group)
This stage required the collaboration of participants to generate realistic and practical
solutions to overcome the barriers that were identified from the campus walk. Affordability,
low awareness and lack of variety were some of the main barriers that needed solutions
catered for students.
Affordability
Prices of healthy foods, snacks and gym membership were decided by participants to be
lowered as it hindered them from being able to afford to consume healthier options and
affording a membership. From previous relevant studies, participants from a high school
had encouraged the ideas of reducing the prices of healthy foods and snacks to facilitate
healthy eating for students (Shepherd et al, 2005). They had even proposed the idea of
eliminating vending machines altogether (Shepherd et al, 2005). In this action group,
participants prioritised lowering the price of healthy snacks rather than removing vending
machines as they do find vending machines convenient for their needs. As one of the
participants had stated in the action group: “Vending machines are unhealthy but necessary
for university students”. This statement also emphasises the increasing need for health and
wellbeing education as this statement shows disregard for the negative health impacts of
unhealthy snack consumption and shows the perceived importance of convenience.
Labelling vending machines as being “necessary” despite its contents may reflect on
students unhealthy reliance on it. Swapping the products for nutritionally dense/r products
can change this into a healthy reliance whilst also maintaining the convenience factor.

127
Healthy foods in the campus tend to be overpriced, while unhealthy and junk foods were
more affordable which attracted students’ attention. This can eventually lead to an increase
in unhealthy food consumption which can then form an unhealthy eating pattern and habit
which can be detrimental to their health in the future (Garcia, Sykes, Matthews, Martin, &
Leipert, 2010).
To overcome the barrier of overpriced healthy foods, participants had suggested that
every eating place on campus must have at least one healthy meal option or combo deal.
For example, a salad with a bottle of water for $5. Having a cheap and healthy alternative at
every café and restaurant for students may encourage them to eat healthier without having
price as a barrier. A previous study conducted in America showed that an average of an
additional $29 per week was needed for tertiary students to adhere to the national health
guidelines (Clark et al, 2019). It would be convenient having healthy options on campus,
which may lead them to consume healthy meals more regularly. This also gives students a
wider range and variety of healthy meals to integrate into their diets if all cafés and
restaurants are willing to comply. This solution utilises the themes, affordability and
convenience, to overcome the barrier of overpriced, healthy options. This also overcomes
the lack of variety by introducing healthy options through multiple eateries on campus.
Participants found the price of the gym membership to be unreasonable and compared
the facilities and price of University of Auckland’s (UOA) gym. The price of the
membership was suggested to be decreased substantially as participants found it to be
unreasonable due to the lack of variety and facilities when compared to UOA. One of the
participants confessed to having a student membership at UOA due to their cheaper price
and the gym being 3 floors high with many different facilities. Most importantly,
participants found the price to be unreasonable due to the low amount of machineries

128
available and thought they were over-paying even with a student discount. Decreasing the
price of the student gym membership price would encourage students to join as it would
eliminate the barrier of unaffordability and would prove to be a better cost-to-goods ratio as
perceived by students if the facilities aren’t upgraded. An increase in student memberships
would increase students’ and facilitate meeting the recommended physical activity levels.
Promotion and Advertising
From the action group and campus walk, it was apparent that participants were unaware
of campus facilities and benefits such as the location of the gym, sport equipment rental
from AUTSA, and team sport opportunities. To overcome this barrier of lack of awareness,
participants proposed improving the training of ambassadors. AUT ambassadors have the
role of showing new students around campus during orientation week and informing them
about campus features and facilities such as the nurses’ office, counselling, dentist,
equipment hires and student services. Participants have suggested adding a test that
ambassadors are required to pass after undertaking training, so trainers are confident that
ambassadors are well equipped and educated about their campus. A well-educated
ambassador would be likely to fully inform other new students about the campus if they are
well equipped and informed themselves. If new students were aware of such facilities, there
would be a higher chance of joining the gym and being involved in team sports which
would enable students to meet the recommended physical activity guidelines.
Using social media to promote campus features and facilities was also suggested.
However, AUTSA have already begun expanding their social media outreach to increase
awareness on events and student services using Facebook groups and pages. Using social
media for promotion and advertising is useful as it has a wider reach to students. It can also
enable students to interact with each other and AUTSA if there are any questions, concerns
129
with their respective campus, or if they would like to promote events or search to be a part
of one. Social media utilises the themes, convenience, promotions and advertisements, to
overcome the barrier of lack of awareness. This is convenient as social media is easily
available and accessible to all students to gather information about their campus. It can also
facilitate students and AUTSA to promote events and to post health-related information for
educational purposes.
Multiple posters are placed around campus to promote products. Participants had
observed that these posters advertised unhealthy products. When asked if they perceive
advertisements to be an influence on their food choices, participants had responded “yes”
which makes advertising of unhealthy products a barrier to healthy eating. To overcome
this barrier, participants had suggested charging a higher rate to companies who would like
to advertise unhealthy products and offering a subsidy or discount to companies who would
like to promote healthy products or restaurants. This includes advertisements in the Debate
magazine. This would encourage healthy food companies to advertise more and to bring
awareness to their products. It would also influence students’ consumption choices via
promotion and may cause an improvement in their diets and eating habits when they are
exposed to alternative healthy food options. Advertisements of nutritious foods has been
found to promote positive attitudes concerning healthy foods; therefore, this intervention
may be effective in altering food behaviours and habits in students (Dixon, Scully,
Wakefield, White & Crawford, 2007).
Temporary stalls that promote food and/or drink products by giving out free samples
have been found to be a barrier to healthful eating due to most of the samples being
unhealthy. Free samples of products have been proven to be an effective method of
advertising to increase sales; therefore, participants had suggested giving away healthy
130
products as well (Bawa & Shoemaker, 2004). Again, this may cause an improvement to
students’ diet if they are exposed to and given an opportunity to try healthier products at no
cost. If participants are only given free samples of unhealthy products, they are likely to
consume more of it in the future. Giving students an opportunity to sample healthy products
for free overcomes the barrier of unaffordability and lack of awareness; facilitating a
potential healthier diet for students.
To decrease the use of elevators and escalators to increase physical activity, the use
motivational and informational posters were proposed. Motivational posters would promote
and encourage students and staff to use stairs instead of escalators. This is an effective
method that has been proven to increase stair use significantly when placing posters at a
choice point between stairs and escalators (Mutrie & Blamey, 2000; Eckhardt, Kerr &
Taylor, 2015). Examples of motivational quotes are: “Raise your fitness level one step at a
time”, “Take a break, take a lap” and “Race the elevator”. Motivational posters have been
extensively used in hospitals and work places to inspire people to increase their physical
activity levels. Informational posters placed around the campus would also be helpful as it
would enlighten students as to why they should aim to meet the physical activity guidelines
and how increasing it would be beneficial to their health. The AUT City campus does not
undertake much health science or health related classes, hence there are less students who
understand the need for physical activity to prevent non-communicable diseases. Unless,
they are personally interested in the topic. To help students understand the physiological
and mental benefits of increased physical activities, informational posters would be a good
tool as it would motivate them to choose stairs instead of escalators and elevators.
Another suggestion to increase stair use was to make staircases aesthetically pleasing to
students. Examples of added aesthetics from participants were art mosaics or a piano
131
staircase. Volkswagen had executed original Piano Staircase project in Sweden as a social
experiment. This experiment aimed to redesign common, everyday items to encourage
people to change their lifestyle and behaviour for the better (Peeters, Megens, van den
Hoven, Hummels, & Brombacher, 2013). The project also aimed to encourage the members
of the public to use the piano stairs instead of escalators. An installation of the piano stairs
in a subway, succeeded in attracting 66% of pedestrians to use stairs in preference of
escalators. The Piano Staircase project showed the potential of how effective technology
can be utilised to persuade people to change a behaviour through social and environmental
influence. Aesthetics such as mosaics art would increase staircase foot traffic as it would
intrigue students to view and appreciate the art, hence altering their behaviour to choose
stairs over elevators and escalators. This would facilitate students to meet their
recommended physical activity guideline.
Variety and Options
Lack of variation has also been a hindrance to students’ heath. Participants have
identified the need for a larger variety in healthy food and drink products in order to have
more options when it comes to choosing nutritionally valuable meals. Currently, there are
substantially more options of junk foods on and around campus that students have easy
access to. The vending machines also has a high proportion of no or low nutritionally
valued snacks compared to snacks that are considered healthy. Vending machines that
typically have energy dense and nutritionally poor snacks and beverages make the
unhealthy choice, the easier choice. An increase in healthy snacks would give the students
more options and it may lead to a higher chance of students choosing a healthier option.
Interventions where vending machine snacks have eliminated all energy dense snacks and
beverages with added sugar and increased the pries of high calorie snacks, has been found

132
to be successful in the work and school environment. It stimulated healthier choices and
was found to be accepted highly by participants as the number of products vended did not
reduce nor have a negative financial impact (Bos, van der Lans, van Kleef & van Trijp,
2018; Grivois-Shah et al., 2017). Having nutritionally dense or valued contents in vending
machines would effectively facilitate students having a healthier diet by altering their eating
habits through environmental influence.
The campus gym has been compared to the UA campus gym several times in the action
group. Another comparison was the variety in fitness machines and the large space of the
UA gym. Suggestions have been made to improve the AUT campus gym by upgrading the
facilities and increasing the number of machineries. Improving the facilities would
encourage students to obtain a membership and would also justify the unaffordable
membership price to the students as currently students perceive the price to be unjust and
unreasonable. Giving students more work-out options would help them to focus on
different muscles, therefore, offering them a variety in their workout routines. By keeping
their interest in the facilities of the gym, student membership may increase, hence
increasing their physical activity levels.

133
Chapter 6: Conclusion
The findings from this study suggested that further improvement to the AUT City
campus could be instrumental for facilitating healthful behavioural choices among the
student body. The study identified several actions that could be taken by the university,
including changes to vending machines, advertising of healthy products, lower gym
membership prices and educating the students more on their choices. Barriers such as
fatigue and lack of time may be difficult to overcome by the university and are something
that students may need to prioritise themselves through self-motivation. Educating them
through motivational and informational posters for physical activity and explaining the
importance of scheduling or incorporating it into their routine may encourage students to
prioritise sitting less and moving more (Russell, Dzewaltowski, & Ryan, 1999).
Tertiary students tend to be too physically and mentally fatigued to focus on improving
their lifestyle. Having a campus, that they spend majority of their time in, that makes it
easier by catering for their needs would make a significant difference to their health and
behaviour. The facilities that the university provides to the students for free or at a
discounted price that do promote a healthy lifestyle often go unnoticed and need to be
promoted more throughout the university and social media. Educating the students on their
lifestyle choices and health effects in a simplified manner may prevent unhealthy behaviour
becoming a habit in the long run.
Future Research and Practise Recommendations
For future studies, it would be worthwhile to investigate this study on a larger scale with
more participants to understand the eating and physical activity habits in a population level.
It would also be useful to understand in more detail what sedentary activities students

134
engage in and the periods of time that they do so as this study did not involve a survey that
focuses solely on sedentary behaviour. This would help in the planning and implementation
of interventions that aid in reducing the time spent on those activities; specifically, in the
university setting.
It would also be interesting to conduct research on interventions such as implementing
one or more of the solutions suggested to test its success, validity and acceptance on the
students and by taking the financial effects to the university in consideration. This may help
tertiary institutes with similar environments to see the effects of the interventions enough if
they chose to implement it.
Limitations of Study
Having one coder to transcribe and analyse the theme from the action group was a
limitation as there is a possibility of biases. There is a higher chance of subjectivity
involved in analysing the themes when there is only one coder. This would bring in the
limitation of the coder failing to recognise possible themes from another perspective
(Olson, McAllister, Grinnell, Gehrke & Appunn, 2016). However, visiting the data multiple
times during a period of times may give the coder different insights and perhaps lessen the
bias, which was done during this study (Olson, McAllister, Grinnell, Gehrke & Appunn,
2016).
Misunderstanding of the term ‘sedentary behaviour’ and ‘sedentary activity’ from
participants was a limitation. Being unaware of these terms may be the effect of being
uneducated about different aspects, impact and importance of health and wellbeing. During
the campus walk, a couple of participants perceived the Treehouses and lounging seats as
being an advantage in terms of sedentary behaviour. Where, in fact, it is the opposite as
these areas and items promote prolonged sitting which can be detrimental to health.
135
Participants were all given the definitions and examples of the terms ‘physically active’,
‘sedentary behaviour’, and ‘nutritionally valued foods’ prior to the commencement of the
campus walk (see Table 4, page 83). However, based on the photos taken and captions
generated by participants, sedentary behaviour was not comprehended. This term may not
be common knowledge as research on it has begun fairly recently. There are also currently
no guidelines relating to sedentary behaviour in New Zealand’s Ministry of Health
guidelines; other than reducing screen time to two hours to minimise sitting. Promotion and
education on sedentary activity is needed in the City campus as misinformation may lead to
ignorance and a lifestyle that doesn’t account for a crucial factor that heavily impacts health
and wellbeing.
Having a small sample size was a limitation to this research as it does not allow for
generalisations of quantitative data to other tertiary students. It also reduces the power of
the study and increases the margin of error. The data from the online surveys cannot be
reflective on the population of AUT City campus students and hence cannot be used to
draw conclusions on their eating and physical activity habits. Having more participants
would have generated more data and may have brought more issues into light in the campus
walk and would also highlight the successes of what the campus has to offer in terms of
improving and maintaining a healthy wellbeing. The current data from the online surveys
helped the researcher understand the eating and physical habits of participants and also
helped participants think about their lifestyle in depth if they hadn’t heeded to it before.
However, having a small sample size for qualitative studies, such as for the campus walk
and action group, is ideal as it allows the researcher to ask all participants in depth
questions in a limited amount of time.

136
Having two stages may have also been a limitation as it was time consuming for
participants to commit throughout the entire study. The campus walk, online survey and
action group had an estimated accumulated time of 1 hour and 10 minutes. Some
participants took the campus walk during their breaks and had limited time to fully explore
the campus. This may have prevented a higher amount of data and issues being identified.
However, if participants were running out of time to complete the surveys with the
researcher’s supervision, they were sent links to the online survey which they could do at
home in their spare time in order to answer all questions with thought and honesty, which
had provided a better reflection of their behaviours and habits. There were also scheduling
issues when deciding the time for the action group as many participants’ available time did
not coincide with others or they didn’t have sufficient time to partake which decreased the
number of participants to 5 in the action group.
The discussion at the action group did tend to talk about other topics that may not have
been a direct answer to the questions asked. A stricter moderation of the discussion would
have helped the discussion to stay on track and leave more time to discuss ideas on
solutions to overcome issues. Nevertheless, the veered off discussion was still relevant to
the study and did highlight other barriers such as lack of time to be involved in physical
activity and how price of meals is a huge determinant of consumption.
An objective tool to measure the participants’ physical activity and sedentary behaviour,
such as a pedometer or accelerometer, would have been useful as the surveys relied on
participants’ perception of their measure which some have been proven to be inaccurate.
This would’ve been useful to understand participants’ sedentary behaviour and walking
habits more accurately to see where an improvement could be made and also would have

137
been interesting for the participants to know how active they think they are and how active
they actually are.

138
References
Arzu, D., Tuzun, E. H., & Eker, L. (2006). Perceived barriers to physical activity in
university students. Journal of sports science & medicine, 5(4), 615.
Amaratunga, D., Baldry, D., Sarshar, M., & Newton, R. (2002). Quantitative and
qualitative research in the built environment: application of “mixed” research approach. Work
study, 51(1), 17-31.
Attride-Stirling, J. (2001). Thematic networks: an analytic tool for qualitative
research. Qualitative Research, 1(3), 385-405. doi: 10.1177/146879410100100307
Bawa, K., & Shoemaker, R. (2004). The Effects of Free Sample Promotions on
Incremental Brand Sales. Marketing Science, 23(3), 345-363. doi: 10.1287/mksc.1030.0052
Baxter, P., & Jack, S. (2016). Exploring Quantitative and Qualitative Methodologies: A
Guide to Novice Nursing Researchers. European Scientific Journal, 12(18).
doi: 10.19044/esj.2016.v12n18p107
Biggerstaff, D., & Thompson, A. (2008). Interpretative Phenomenological Analysis
(IPA): A Qualitative Methodology of Choice in Healthcare Research. Qualitative Research In
Psychology, 5(3), 214-224. http://dx.doi.org/10.1080/14780880802314304
Bonney, R., Cooper, C. B., Dickinson, J., Kelling, S., Phillips, T., Rosenberg, K. V., &
Shirk, J. (2009). Citizen science: a developing tool for expanding science knowledge and
scientific literacy. BioScience, 59(11), 977-984.
Bos, C., van der Lans, I., van Kleef, E., & van Trijp, H. (2018). Promoting healthy
choices from vending machines: Effectiveness and consumer evaluations of four types of
interventions. Food Policy, 79, 247-255. doi: 10.1016/j.foodpol.2018.07.001

139
Bowman, S., Gortmaker, S., Ebbeling, C., Pereira, M., & Ludwig, D. (2003). Effects of
Fast-Food Consumption on Energy Intake and Diet Quality Among Children in a National
Household Survey. PEDIATRICS, 113(1), 112-118. http://dx.doi.org/10.1542/peds.113.1.112
Braun, V., & Clarke, V. (2006). Using thematic analysis in psychology. Qualitative
Research In Psychology, 3(2), 77-101. http://dx.doi.org/10.1191/1478088706qp063oa
Buckworth, J., & Nigg, C. (2004). Physical Activity, Exercise, and Sedentary Behavior in
College Students. Journal Of American College Health, 53(1), 28-34.
http://dx.doi.org/10.3200/jach.53.1.28-34
Clark, T., Fleming, T., Bullen, P., Denny, S., Crengle, S., Dyson, B., & Rossen, F.
(2013). Youth'12 Overview: The health and wellbeing of New Zealand secondary school students
in 2012. University of Auckland, Faculty of Medical and Health Sciences.
Clarke, V., & Braun, V. (2016). Thematic analysis. The Journal Of Positive
Psychology, 12(3), 297-298. http://dx.doi.org/10.1080/17439760.2016.1262613
Clark, R. L., Famodu, O. A., Barr, M. L., Hagedorn, R. L., Ruseski, J., White, J. A., ... &
McFadden, J. W. (2019). Monetary Cost of the MyPlate Diet in Young Adults: Higher Expenses
Associated with Increased Fruit and Vegetable Consumption. Journal of nutrition and
metabolism, 2019.
Cohn, J. (2008). Citizen Science: Can Volunteers Do Real Research?. Bioscience, 58(3),
192-197. http://dx.doi.org/10.1641/b580303
Corbin, C. B., Pangrazi, R. P., & Franks, B. D. (2000). Definitions: Health, fitness, and
physical activity. President's Council on Physical Fitness and Sports Research Digest.

140
Deliens, T., Deforche, B., De Bourdeaudhuij, I., & Clarys, P. (2015). Determinants of
physical activity and sedentary behaviour in university students: a qualitative study using action
group discussions. BMC Public Health, 15(1), 201.
Dixon, H. G., Scully, M. L., Wakefield, M. A., White, V. M., & Crawford, D. A. (2007).
The effects of television advertisements for junk food versus nutritious food on children's food
attitudes and preferences. Social science & medicine, 65(7), 1311-1323.
Drewnowski, A., & Fulgoni, V. (2008). Nutrient profiling of foods: creating a nutrient-
rich food index. Nutrition Reviews, 66(1), 23-39. http://dx.doi.org/10.1111/j.1753-
4887.2007.00003.x
Driskell, J., Kim, Y., & Goebel, K. (2005). Few Differences Found in the Typical Eating
and Physical Activity Habits of Lower-Level and Upper-Level University Students. Journal Of
The American Dietetic Association, 105(5), 798-801.http://dx.doi.org/10.1016/j.jada.2005.02.004
Eckhardt, M., Kerr, J., & Taylor, W. (2015). Point-of-Decision Signs and Stair Use in a
University Worksite Setting: General versus Specific Messages. American Journal Of Health
Promotion, 29(5), 291-293. http://dx.doi.org/10.4278/ajhp.120816-arb-398
Eisenhardt, K. (1989). Building Theories from Case Study Research. Academy Of
Management Review, 14(4), 532-550. http://dx.doi.org/10.5465/amr.1989.4308385
Ekelund, U., Steene-Johannessen, J., Brown, W., Fagerland, M., Owen, N., & Powell, K.
et al. (2016). Does physical activity attenuate, or even eliminate, the detrimental association of
sitting time with mortality? A harmonised meta-analysis of data from more than 1 million men
and women. The Lancet, 388(10051), 1302-1310. http://dx.doi.org/10.1016/s0140-
6736(16)30370-1

141
Elo, S., & Kyngäs, H. (2008). The qualitative content analysis process. Journal Of
Advanced Nursing, 62(1), 107-115. http://dx.doi.org/10.1111/j.1365-2648.2007.04569.x
Eyles, H., Jiang, Y., Blakely, T., Neal, B., Crowley, J., Cleghorn, C., & Ni Mhurchu, C.
(2018). Five year trends in the serve size, energy, and sodium contents of New Zealand fast
foods: 2012 to 2016. Nutrition Journal, 17(1). http://dx.doi.org/10.1186/s12937-018-0373-7
Etikan, I., Musa, S., & Alkassim, R. (2016). Comparison of Convenience Sampling and
Purposive Sampling. American Journal Of Theoretical And Applied Statistics, 5(1), 1.
http://dx.doi.org/10.11648/j.ajtas.20160501.11
Fereday, J., & Muir-Cochrane, E. (2006). Demonstrating Rigor Using Thematic Analysis:
A Hybrid Approach of Inductive and Deductive Coding and Theme Development. International
Journal Of Qualitative Methods, 5(1), 80-92. http://dx.doi.org/10.1177/160940690600500107
Fereday, J., & Muir-Cochrane, E. (2006). Demonstrating Rigor Using Thematic Analysis:
A Hybrid Approach of Inductive and Deductive Coding and Theme Development. International
Journal Of Qualitative Methods, 5(1), 80-92. http://dx.doi.org/10.1177/160940690600500107
Fogelholm, M., Malmberg, J., Suni, J., Santtila, M., Kyroleinen, H., Mantysaari, M., &
Oja, P. (2006). International Physical Activity Questionnaire. Medicine & Science In Sports &
Exercise, 38(4), 753-760. http://dx.doi.org/10.1249/01.mss.0000194075.16960.20
Garcia, A. C., Sykes, L., Matthews, J., Martin, N., & Leipert, B. (2010). Perceived
facilitators of and barriers to healthful eating among university students. Canadian Journal of
Dietetic Practice and Research, 71(2), e28-e33.
GERRING, J. (2004). What Is a Case Study and What Is It Good for?. American Political
Science Review, 98(02), 341-354. http://dx.doi.org/10.1017/s0003055404001182
142
Giacomini, M., & Cook, D. (2000). Users' Guides to the Medical
Literature. JAMA, 284(3), 357. http://dx.doi.org/10.1001/jama.284.3.357
Glanz, K., Basil, M., Maibach, E., Goldberg, J., & Snyder, D. A. N. (1998). Why
Americans eat what they do: taste, nutrition, cost, convenience, and weight control concerns as
influences on food consumption. Journal of the American Dietetic Association, 98(10), 1118-
1126.
Greenwood-Hickman, M., Renz, A., & Rosenberg, D. (2015). Motivators and Barriers to
Reducing Sedentary Behavior Among Overweight and Obese Older Adults. The
Gerontologist, 56(4), 660-668. http://dx.doi.org/10.1093/geront/gnu163
Grivois-Shah, R., Gonzalez, J., Khandekar, S., Howerter, A., O’Connor, P., & Edwards,
B. (2017). Impact of Healthy Vending Machine Options in a Large Community Health
Organization. American Journal Of Health Promotion, 32(6), 1425-1430.
http://dx.doi.org/10.1177/0890117117734989
Grubbs, L., & Carter, J. (2002). The relationship of perceived benefits and barriers to
reported exercise behaviors in college undergraduates. Family & Community Health, 25(2), 76-
84.
Hagströmer, M., Oja, P., & Sjöström, M. (2006). The International Physical Activity
Questionnaire (IPAQ): a study of concurrent and construct validity. Public health nutrition, 9(6),
755-762.
Hartman, H., Wadsworth, D., Penny, S., van Assema, P., & Page, R. (2013). Psychosocial
determinants of fruit and vegetable consumption among students in a New Zealand university.
Results of action group interviews. Appetite, 65, 35-42. http://dx.doi.org/10.1016/j.appet.2013.02.005
143
Haslam, D., & James, W. (2005). Obesity. The Lancet, 366(9492), 1197-1209.
http://dx.doi.org/10.1016/s0140-6736(05)67483-1
Henson, J., Yates, T., Biddle, S., Edwardson, C., Khunti, K., & Wilmot, E. et al. (2013).
Associations of objectively measured sedentary behaviour and physical activity with markers of
cardiometabolic health. Diabetologia, 56(5), 1012-1020. http://dx.doi.org/10.1007/s00125-013-
2845-9
Hinckson, E. A., Aminian, S., Ikeda, E., Stewart, T., Oliver, M., Duncan, S., & Schofield,
G. (2013). Acceptability of standing workstations in elementary schools: a pilot study. Preventive
medicine, 56(1), 82-85.
Hinckson, E., Schneider, M., Winter, S., Stone, E., Puhan, M., & Stathi, A. et al. (2017).
Citizen science applied to building healthier community environments: advancing the field
through shared construct and measurement development. International Journal Of Behavioral
Nutrition And Physical Activity, 14(1). http://dx.doi.org/10.1186/s12966-017-0588-6
Horton, T., Drougas, H., Brachey, A., Reed, G., Peters, J., & Hill, J. (1995). Fat and
carbohydrate overfeeding in humans: different effects on energy storage. The American Journal
Of Clinical Nutrition, 62(1), 19-29. http://dx.doi.org/10.1093/ajcn/62.1.19
Huang, Y. H., & Chiou, C. J. (1996). Assessment of the health-promoting lifestyle profile
on reliability and validity. The Kaohsiung journal of medical sciences, 12(9), 529-537.
Kam, C., Wilking, J., & Zechmeister, E. (2007). Beyond the “Narrow Data Base”:
Another Convenience Sample for Experimental Research. Political Behavior, 29(4), 415-440.
http://dx.doi.org/10.1007/s11109-007-9037-6
Kant, A. (2004). Dietary patterns and health outcomes. Journal Of The American Dietetic
Association, 104(4), 615-635. http://dx.doi.org/10.1016/j.jada.2004.01.010
144
Keating, X. D., Guan, J., Piñero, J. C., & Bridges, D. M. (2005). A meta-analysis of
college students' physical activity behaviors. Journal of American college health, 54(2), 116-126.
King, Abby C, Sandra J Winter, Benjamin W Chrisinger, Jenna Hua, and Ann W
Banchoff. 2018. 'Maximizing the promise of citizen science to advance health and prevent
disease', Preventive Medicine, 119: 44
King, A. C., Winter, S. J., Sheats, J. L., Rosas, L. G., Buman, M. P., Salvo, D.,
Dommarco, J.R. & Broderick, B. (2016). Leveraging citizen science and information technology
for population physical activity promotion. Translational Journal of the American College of
Sports Medicine, 1(4), 30.
Kohl, H., Craig, C., Lambert, E., Inoue, S., Alkandari, J., Leetongin, G., & Kahlmeier, S.
(2012). The pandemic of physical inactivity: global action for public health. The
Lancet, 380(9838), 294-305. http://dx.doi.org/10.1016/s0140-6736(12)60898-8
LaCaille, L., Dauner, K., Krambeer, R., & Pedersen, J. (2011). Psychosocial and
Environmental Determinants of Eating Behaviors, Physical Activity, and Weight Change Among
College Students: A Qualitative Analysis. Journal Of American College Health, 59(6), 531-538.
http://dx.doi.org/10.1080/07448481.2010.523855
Lee, R., & Loke, A. (2005). Health-Promoting Behaviors and Psychosocial Well-Being of
University Students in Hong Kong. Public Health Nursing, 22(3), 209-220.
http://dx.doi.org/10.1111/j.0737-1209.2005.220304.x
Loef, M., & Walach, H. (2012). The combined effects of healthy lifestyle behaviors on all
cause mortality: A systematic review and meta-analysis. Preventive Medicine, 55(3), 163-170.
http://dx.doi.org/10.1016/j.ypmed.2012.06.017
145
Leung, M., Minkler, M., & Yen, I. (2004). Community based participatory research: a
promising approach for increasing epidemiology's relevance in the 21st century. International
Journal Of Epidemiology, 33(3), 499-506. http://dx.doi.org/10.1093/ije/dyh010
Louzada, M., Baraldi, L., Steele, E., Martins, A., Canella, D., & Moubarac, J. et al.
(2015). Consumption of ultra-processed foods and obesity in Brazilian adolescents and
adults. Preventive Medicine, 81, 9-15. http://dx.doi.org/10.1016/j.ypmed.2015.07.018
Luepker, R. (2003). Case Definitions for Acute Coronary Heart Disease in Epidemiology
and Clinical Research Studies: A Statement From the AHA Council on Epidemiology and
Prevention; AHA Statistics Committee; World Heart Federation Council on Epidemiology and
Prevention; the European Society of Cardiology Working Group on Epidemiology and
Prevention; Centers for Disease Control and Prevention; and the National Heart, Lung, and
Blood Institute. Circulation, 108(20), 2543-2549.
http://dx.doi.org/10.1161/01.cir.0000100560.46946.ea
Luppino, F., de Wit, L., Bouvy, P., Stijnen, T., Cuijpers, P., Penninx, B., & Zitman, F.
(2010). Overweight, Obesity, and Depression. Archives Of General Psychiatry, 67(3), 220.
http://dx.doi.org/10.1001/archgenpsychiatry.2010.2
Mei, Z., Grummer-Strawn, L., Pietrobelli, A., Goulding, A., Goran, M., & Dietz, W.
(2002). Validity of body mass index compared with other body-composition screening indexes
for the assessment of body fatness in children and adolescents. The American Journal Of
Clinical Nutrition, 75(6), 978-985. http://dx.doi.org/10.1093/ajcn/75.6.978
Mente, A., de Koning, L., Shannon, H. S., & Anand, S. S. (2009). A systematic review of
the evidence supporting a causal link between dietary factors and coronary heart
disease. Archives of internal medicine, 169(7), 659-669.
146
Minkler, M. (2000). Assessment/evaluation. Using participatory action research to build
healthy communities. Public Health Reports, 115(2), 191-198.
http://dx.doi.org/10.1093/phr/115.2.191
Mokdad, A., Ford, E., Bowman, B., Dietz, W., Vinicor, F., Bales, V., & Marks, J. (2003).
Prevalence of Obesity, Diabetes, and Obesity-Related Health Risk Factors, 2001. JAMA, 289(1).
http://dx.doi.org/10.1001/jama.289.1.76
MOHNZ. (2019). How much activity is recommended? Retrieved from
https://www.health.govt.nz/your-health/healthy-living/food-activity-and-sleep/physical-
activity/how-much-activity-recommended
Monteiro, C. (2009). Nutrition and health. The issue is not food, nor nutrients, so much as
processing. Public Health Nutrition, 12(05), 729. http://dx.doi.org/10.1017/s1368980009005291
Morgan, D. (2009). Action groups as qualitative research. Thousand Oaks, Calif: Sage
Publ.
Morgan, G., & Smircich, L. (1980). The Case for Qualitative Research. The Academy Of
Management Review, 5(4), 491. http://dx.doi.org/10.2307/257453
Mutrie, N., & Blamey, A. (2000). Encouraging stair walking. British Journal Of Sports
Medicine, 34(2), 144-144. http://dx.doi.org/10.1136/bjsm.34.2.144
Norat, T., Bingham, S., & Riboli, E. (2005). RESPONSE: Re: Meat, Fish, and Colorectal
Cancer Risk: The European Prospective Investigation into Cancer and Nutrition. JNCI: Journal
Of The National Cancer Institute, 97(23), 1788-1789. http://dx.doi.org/10.1093/jnci/dji409
Noy, C. (2008). Sampling Knowledge: The Hermeneutics of Snowball Sampling in
Qualitative Research. International Journal Of Social Research Methodology, 11(4), 327-344.
http://dx.doi.org/10.1080/13645570701401305
147
Obesity and overweight. (2019). Retrieved from https://www.who.int/news-room/fact-
sheets/detail/obesity-and-overweight
Ogawa, R., & Malen, B. (1991). Towards Rigor in Reviews of Multivocal Literatures:
Applying the Exploratory Case Study Method. Review Of Educational Research, 61(3), 265.
http://dx.doi.org/10.2307/1170630
Olson, J. D., McAllister, C., Grinnell, L. D., Gehrke Walters, K., & Appunn, F. (2016).
Applying constant comparative method with multiple investigators and inter-coder
reliability. The Qualitative Report, 21(1), 26-42.
Ottinger, G. (2010). Buckets of resistance: Standards and the effectiveness of citizen
science. Science, Technology, & Human Values, 35(2), 244-270.
Owen, N., Salmon, J., Koohsari, M., Turrell, G., & Giles-Corti, B. (2014). Sedentary
behaviour and health: mapping environmental and social contexts to underpin chronic disease
prevention. British Journal Of Sports Medicine, 48(3), 174-177.
http://dx.doi.org/10.1136/bjsports-2013-093107
Pate, R., O'Neill, J., & Lobelo, F. (2008). The Evolving Definition of
"Sedentary". Exercise And Sport Sciences Reviews, 36(4), 173-178.
http://dx.doi.org/10.1097/jes.0b013e3181877d1a
Peeters, M., Megens, C., van den Hoven, E., Hummels, C., & Brombacher, A. (2013,
April). Social stairs: taking the piano staircase towards long-term behavioral change.
In International Conference on Persuasive Technology (pp. 174-179). Springer, Berlin,
Heidelberg.
Pinar, R., Celik, R., & Bahcecik, N. (2009). Reliability and Construct Validity of the
Health-Promoting Lifestyle Profile II in an Adult Turkish Population. Nursing Research, 58(3),
184-193. http://dx.doi.org/10.1097/nnr.0b013e31819a8248
148
Popkin, B. (2001). The Nutrition Transition and Obesity in the Developing World. The
Journal Of Nutrition, 131(3), 871S-873S. http://dx.doi.org/10.1093/jn/131.3.871s
Popkin, B. (2006). Global nutrition dynamics: the world is shifting rapidly toward a diet
linked with noncommunicable diseases. The American Journal Of Clinical Nutrition, 84(2), 289-
298. http://dx.doi.org/10.1093/ajcn/84.2.289
Physical activity. (2019). Retrieved from https://www.health.govt.nz/our-
work/preventative-health-wellness/physical-activity
Reiner, M., Niermann, C., Jekauc, D., & Woll, A. (2013). Long-term health benefits of
physical activity – a systematic review of longitudinal studies. BMC Public Health, 13(1).
http://dx.doi.org/10.1186/1471-2458-13-813
Rezende, L., Rodrigues Lopes, M., Rey-López, J., Matsudo, V., & Luiz, O. (2014). Sedentary
Behavior and Health Outcomes: An Overview of Systematic Reviews. Plos ONE, 9(8),.
http://doi.org/10.1371/0105620
Richter, E., & Hargreaves, M. (2013). Exercise, GLUT4, and Skeletal Muscle Glucose
Uptake. Physiological Reviews, 93(3), 993-1017. http://dx.doi.org/10.1152/physrev.00038.2012
Robbins, L., Pis, M., Pender, N., & Kazanis, A. (2004). Physical Activity Self-Definition
Among Adolescents. Research And Theory For Nursing Practice, 18(4), 317-330.
http://dx.doi.org/10.1891/088971804780957487
Rolfe, G. (2006). Validity, trustworthiness and rigour: quality and the idea of qualitative
research. Journal Of Advanced Nursing, 53(3), 304-310. http://dx.doi.org/10.1111/j.1365-
2648.2006.03727.x
Rouse, P., & Biddle, S. (2010). An ecological momentary assessment of the physical
activity and sedentary behaviour patterns of university students. Health Education
Journal, 69(1), 116-125. http://dx.doi.org/10.1177/0017896910363145
149
Russell, W. D., Dzewaltowski, D. A., & Ryan, G. J. (1999). The effectiveness of a point-
of-decision prompt in deterring sedentary behavior. American Journal of Health
Promotion, 13(5), 257-259.
Salbe, A., Weyer, C., Harper, I., Lindsay, R., Ravussin, E., & Tataranni, P. (2002).
Assessing Risk Factors for Obesity Between Childhood and Adolescence: II. Energy Metabolism
and Physical Activity. PEDIATRICS, 110(2), 307-314. http://dx.doi.org/10.1542/peds.110.2.307
Salmon, J., Arundell, L., Hume, C., Brown, H., Hesketh, K., Dunstan, D. W., &
Sheppard, L. (2011). A cluster-randomized controlled trial to reduce sedentary behavior and
promote physical activity and health of 8-9 year olds: The Transform-Us! Study. BMC Public
Health, 11(1), 759.
Saunders, T., Chaput, J., & Tremblay, M. (2014). Sedentary Behaviour as an Emerging
Risk Factor for Cardiometabolic Diseases in Children and Youth. Canadian Journal Of
Diabetes, 38(1), 53-61. http://dx.doi.org/10.1016/j.jcjd.2013.08.266
Saxena, S., Van Ommeren, M., Tang, K., & Armstrong, T. (2005). Mental health benefits
of physical activity. Journal Of Mental Health, 14(5), 445-451.
http://dx.doi.org/10.1080/09638230500270776
Scotland, J. (2012). Exploring the Philosophical Underpinnings of Research: Relating
Ontology and Epistemology to the Methodology and Methods of the Scientific, Interpretive, and
Critical Research Paradigms. English Language Teaching, 5(9).
http://dx.doi.org/10.5539/elt.v5n9p9
Seale, C. (2002). Quality Issues in Qualitative Inquiry. Qualitative Social Work: Research
And Practice, 1(1), 97-110. http://dx.doi.org/10.1177/147332500200100107
150
Seawright, J., & Gerring, J. (2008). Case Selection Techniques in Case Study
Research. Political Research Quarterly, 61(2), 294-308.
http://dx.doi.org/10.1177/1065912907313077
Sedentary Behaviour Research Network. (2012). Letter to the Editor: Standardized use of
the terms “sedentary” and “sedentary behaviours”. Applied Physiology, Nutrition, And
Metabolism, 37(3), 540-542. http://dx.doi.org/10.1139/h2012-024
Shepherd, J., Harden, A., Rees, R., Brunton, G., Garcia, J., Oliver, S., & Oakley, A.
(2005). Young people and healthy eating: a systematic review of research on barriers and
facilitators. Health Education Research, 21(2), 239-257. http://dx.doi.org/10.1093/her/cyh060
Silvertown, J. (2009). A new dawn for citizen science. Trends In Ecology &
Evolution, 24(9), 467-471. http://dx.doi.org/10.1016/j.tree.2009.03.017
Sinclair, K. M., Hamlin, M. J., & Steel, G. (2005). Physical activity levels of first-year
New Zealand university students: a pilot study. Youth Studies Australia, 24(1), 38.
Swift, D., Johannsen, N., Lavie, C., Earnest, C., & Church, T. (2014). The Role of
Exercise and Physical Activity in Weight Loss and Maintenance. Progress In Cardiovascular
Diseases, 56(4), 441-447. http://dx.doi.org/10.1016/j.pcad.2013.09.012
Thorp, A., Owen, N., Neuhaus, M., & Dunstan, D. (2011). Sedentary Behaviors and
Subsequent Health Outcomes in Adults. American Journal Of Preventive Medicine, 41(2), 207-
215. http://dx.doi.org/10.1016/j.amepre.2011.05.004
Tremblay, M., Aubert, S., Barnes, J., Saunders, T., Carson, V., & Latimer-Cheung, A. et
al. (2017). Sedentary Behavior Research Network (SBRN) – Terminology Consensus Project
process and outcome. International Journal Of Behavioural Nutrition And Physical
Activity, 14(1). http://dx.doi.org/10.1186/s12966-017-0525-8

151
Veitch, J., Salmon, J., & Ball, K. (2010). Individual, social and physical environmental
correlates of children's active free-play: a cross-sectional study. International Journal of
Behavioral Nutrition and Physical Activity, 7(1), 11.
WANG, C. (1999). Photovoice: A Participatory Action Research Strategy Applied to
Women's Health. Journal Of Women's Health, 8(2), 185-192.
http://dx.doi.org/10.1089/jwh.1999.8.185
Wilmot, E., Edwardson, C., Achana, F., Davies, M., Gorely, T., & Gray, L. et al. (2012).
Sedentary time in adults and the association with diabetes, cardiovascular disease and death:
systematic review and meta-analysis. Diabetologia, 55(11), 2895-2905.
http://dx.doi.org/10.1007/s00125-012-2677
Yin, R. (1981). The Case Study Crisis: Some Answers. Administrative Science
Quarterly, 26(1), 58. http://dx.doi.org/10.2307/2392599

152
Appendices

153
Appendix 1: Ethics Approval

154
Appendix 2: Ethics Amendment Approval
155
Appendix 3: Recruitment Advertisements
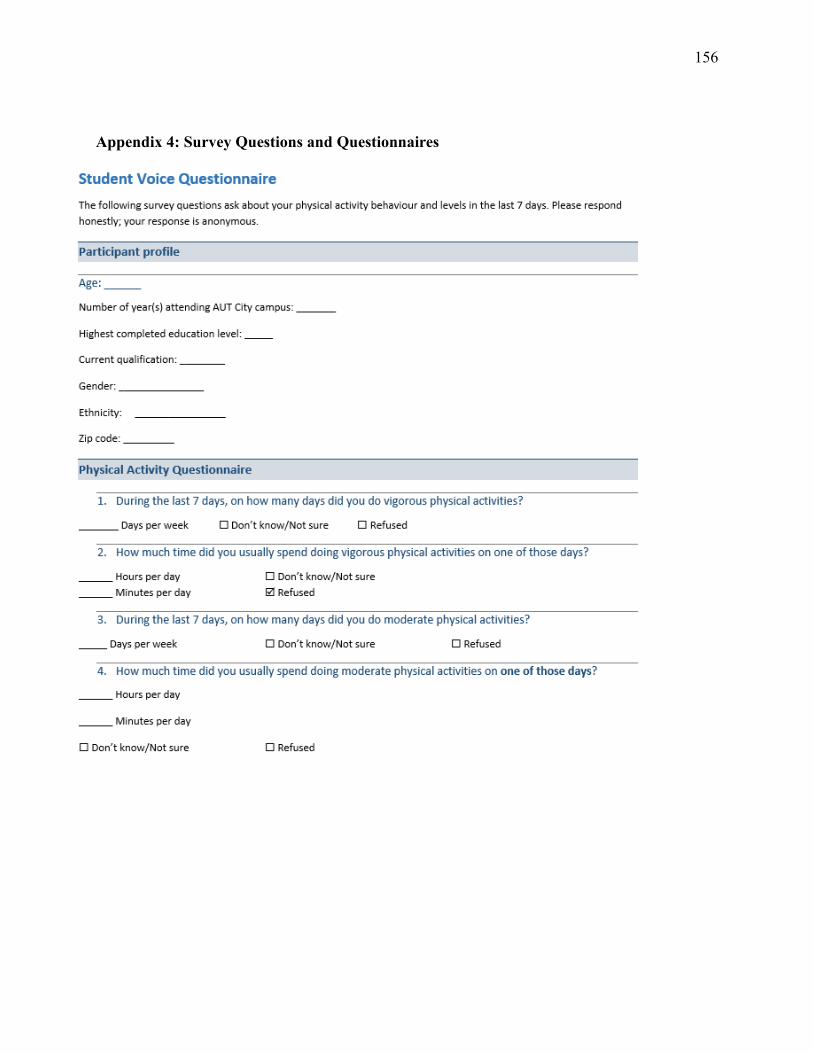
156
Appendix 4: Survey Questions and Questionnaires

157

158

159

160
Appendix 5: Participant Information Sheet
Date Information Sheet Produced:
29-09-2017
Project Title
The influence of the environment on physical activity and healthy eating habits on students at Auckland University of Technology
Dear participant,
My name is Erica Hinckson and I am a professor at AUT. Our research team would like to talk
with students who might like to take part in the project title ‘’The influence of the environment on
physical activity and healthy eating habits on students at Auckland University of Technology’’.
The information sheet provides details about the project so that you make an informed decision
regarding your participation. Your participation is voluntary.
You have received this information sheet after first contact with the researcher. Please read the
information below to make sure you familiarise yourself with the project. If you have any
questions, please talk to a member of the research team. Our details can be found at the bottom of
this document.
What is the purpose of this research?
We would like to find out what the students think of the physical activity and nutrition
environments of the campus. What motivate you or does not to be physically active or eat
healthily. We would like to know your opinion about these aspects on campus so that we can
improve health and wellbeing of students on the 4 campuses.
How was I identified and why am I being invited to participate in this research?
‘’The influence of the environment on physical activity and healthy eating habits on students
at Auckland University of Technology’’ project is looking for students who are enrolled at the
AUT.
How do I agree to participate in this research?
You will need to sign the consent form. The consent form will be provided by the researcher
team after contact. Signing the consent form indicates that you agree to join ‘’The influence of
the environment on physical activity and healthy eating habits on students at Auckland
University of Technology’’ study and that you have not been forced or coerced to join. If you
have any questions talk to a member of the research team, they are there to help.
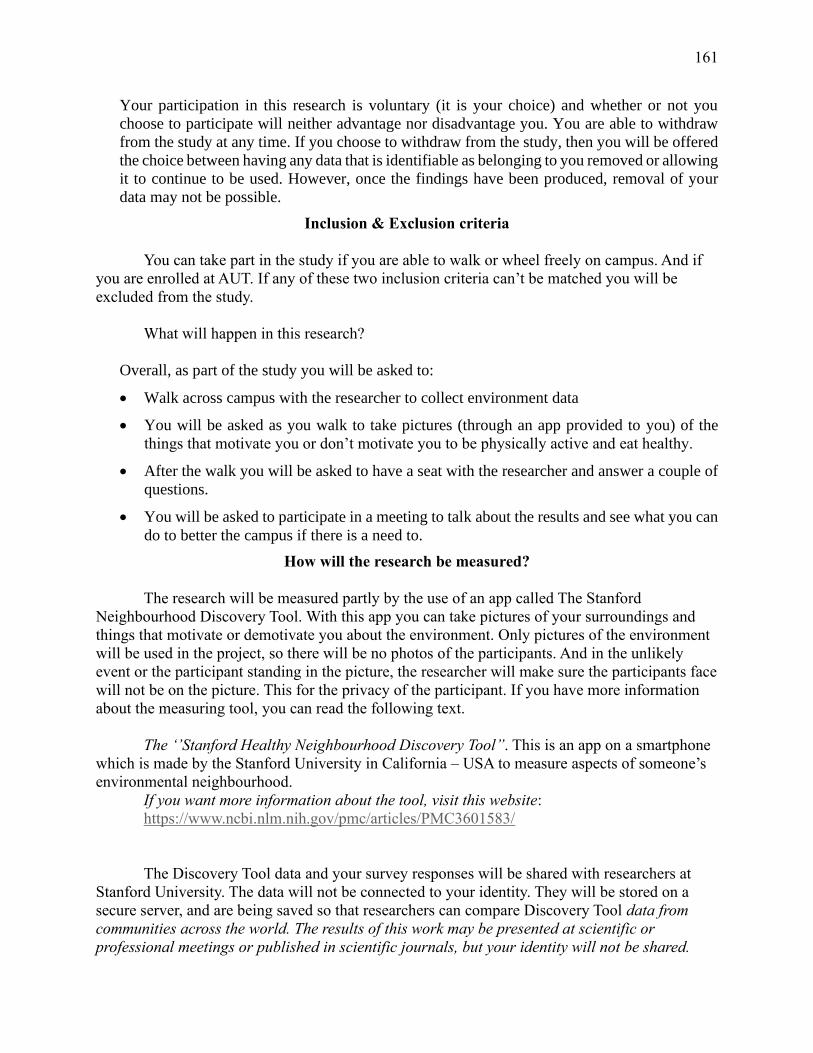
161
Your participation in this research is voluntary (it is your choice) and whether or not you
choose to participate will neither advantage nor disadvantage you. You are able to withdraw
from the study at any time. If you choose to withdraw from the study, then you will be offered
the choice between having any data that is identifiable as belonging to you removed or allowing
it to continue to be used. However, once the findings have been produced, removal of your
data may not be possible.
Inclusion & Exclusion criteria
You can take part in the study if you are able to walk or wheel freely on campus. And if
you are enrolled at AUT. If any of these two inclusion criteria can’t be matched you will be
excluded from the study.
What will happen in this research?
Overall, as part of the study you will be asked to:
• Walk across campus with the researcher to collect environment data
• You will be asked as you walk to take pictures (through an app provided to you) of the
things that motivate you or don’t motivate you to be physically active and eat healthy.
• After the walk you will be asked to have a seat with the researcher and answer a couple of
questions.
• You will be asked to participate in a meeting to talk about the results and see what you can
do to better the campus if there is a need to.
How will the research be measured?
The research will be measured partly by the use of an app called The Stanford
Neighbourhood Discovery Tool. With this app you can take pictures of your surroundings and
things that motivate or demotivate you about the environment. Only pictures of the environment
will be used in the project, so there will be no photos of the participants. And in the unlikely
event or the participant standing in the picture, the researcher will make sure the participants face
will not be on the picture. This for the privacy of the participant. If you have more information
about the measuring tool, you can read the following text.
The ‘’Stanford Healthy Neighbourhood Discovery Tool’’. This is an app on a smartphone
which is made by the Stanford University in California – USA to measure aspects of someone’s
environmental neighbourhood.
If you want more information about the tool, visit this website:
https://www.ncbi.nlm.nih.gov/pmc/articles/PMC3601583/
The Discovery Tool data and your survey responses will be shared with researchers at
Stanford University. The data will not be connected to your identity. They will be stored on a
secure server, and are being saved so that researchers can compare Discovery Tool data from
communities across the world. The results of this work may be presented at scientific or
professional meetings or published in scientific journals, but your identity will not be shared.

162
What are the discomforts and risks?
Everybody is different, but here is a list of the things that could happen. When you are going
on a walk with the researcher it’s possible that you may trip and fall. This is a possibility that
you may encounter anytime you go for a walk, but if you fall during the walk and you hurt
yourself we will provide you with help through the Interprofessional Health Clinic and of
course if minor with a First Aid Kit.
Furthermore, like any conversation with someone you don’t really know you may feel
uncomfortable or embarrassed in talking with the researcher. The researcher involved in this
project will act professionally. The researcher will always try to help you with the research and
will not treat you any differently based on your cultural background or gender. If you don’t
feel comfortable around the researcher, you may notify the project supervisor and they will
provide you with another researcher. Feel free to ask any questions about this, because we want
to be clear before we start the research.
How will these discomforts and risks be alleviated?
In the unlikely event of emotional triggering as a result of participating in this study, you have
access to the counselling service of the university. You can make an appointment there free of
charge. You can find information about the counselling below.
AUT Health Counselling and Wellbeing is able to offer three free sessions of confidential
counselling support for adult participants in an AUT research project. These sessions are only
available for issues that have arisen directly as a result of participation in the research and are
not for other general counselling needs. To access these services, you will need to:
• drop into our centres at WB219 or AS104 or phone 921 9992 City Campus or 921 9998
North Shore campus to make an appointment. Appointments for South Campus can be
made by calling 921 9992
• let the receptionist know that you are a research participant, and provide the title of my
research and my name and contact details as given in this Information Sheet
You can find out more information about AUT counsellors and counselling on
http://www.aut.ac.nz/being-a-student/current-postgraduates/your-health-and-
wellbeing/counselling.
What are the benefits?
You will receive a copy of your results section. The benefit to you is that you have the chance
to really make the campus you study a better place with healthier and happy students! Also

163
after the last meeting, you will receive a gift (e.g. a voucher with a value of 10 – 20 $). Also
there will be food and drinks available for consumption at the last meeting.
What compensation is available for injury or negligence?
In the unlikely event of a physical injury as a result of your participation in this study,
rehabilitation and compensation for injury by accident may be available from the Accident
Compensation Corporation, providing the incident details satisfy the requirements of the law
and the Corporation's regulations.
How will my privacy be protected?
Privacy will be protected due to the changing of the participants names into codes. This will
be done by the researcher, who has no benefit in any way in knowing which information
belongs to which participant. The codes will be shared with the project supervisor, who is a
professor at AUT. But the professor will not know which code which participant is.
What are the costs of participating in this research?
The time it will take the participants is a maximum of 4 hours divided over 3 meetings.
What opportunity do I have to consider this invitation?
You will have until the first meeting. Which is set on March to April.
Will I receive feedback on the results of this research?
If you want, you will receive your own results and a summary of the project results through
email.
What do I do if I have concerns about this research?
If you have concerns or anything you would like the research team to know. Please contact one
of them. They are there to help you.
Any concerns regarding the nature of this project should be notified in the first instance to the
Project Supervisor,
- Professor Erica Hinckson, [email protected], or AUT 921 9999 ext 7224, M 021 960 887
- Assistant Investigator Nehal Natasha, [email protected] 0211383811.
If you wish to withdraw your participation in this study, contact one of the researchers. Your data and contact information will not be used anymore.
Concerns regarding the conduct of the research should be notified to the Executive Secretary of AUTEC, Kate O’Connor, [email protected] , 921 9999 ext 6038.

164
Whom do I contact for further information about this research?
Please keep this Information Sheet and a copy of the Consent Form for your future reference. You are also able to contact the research team as follows:
Researcher Contact Details:
Assistant Investigator contact details:
Nehal Natasha
Assistant Investigator
AUT University, North Shore Campus
90 Akoranga Drive, Northcote 0627
Auckland 1142, NZ
T: 0211383811
Project Supervisor Contact Details:
Dr Erica Hinckson
Professor
Centre for Child Health Research
Human Potential Centre
Faculty of Health Sciences
AUT University, North Shore Campus
90 Akoranga Drive, Northcote 0627
Auckland 1142, NZ
T : 921 9999 ext 7224
M : 021 960 887
Approved by the Auckland University of Technology Ethics Committee on 31/10/17 & 1/10/18,
AUTEC Reference number 17/346
165
Appendix 6: Consent and Release Form
Project title: The influence of the environment on physical activity and healthy eating habits on students at Auckland University of Technology.
Project Supervisor: Erica Hinckson
Researcher: Nehal Natasha
I have read and understood the information provided about this research project in the Information Sheetdated 29-09-2017.
I have had an opportunity to ask questions and to have them answered.
I understand that taking part in this study is voluntary (my choice) and that I may withdraw from the studyat any time without being disadvantaged in any way.
I understand that if I withdraw from the study then I will be offered the choice between having any datathat is identifiable as belonging to me removed or allowing it to continue to be used. However, once thefindings have been produced, removal of my data may not be possible.
I understand that the photographs will not be published in any form outside of this project without mywritten permission.
I understand that any copyright material created by the photographic sessions is deemed to be owned bythe researcher and that I do not own copyright of any of the photographs.
I understand that the information about the project is confidential and will not share sensitive informationwith third parties.
(Optional) I want to be identified in the research results.
I agree to take part in this research.
Participant’s signature : .....................................................…………………………………………………………
Participant’s name: .....................................................…………………………………………………………
Participant’s Contact Details (if appropriate):
………………………………………………………………………………………..
………………………………………………………………………………………..
………………………………………………………………………………………..
………………………………………………………………………………………..
Date:
Approved by the Auckland University of Technology Ethics Committee on 31/10/2017 & 1/10/2018 AUTEC
Reference number 17/346 Student Voices: The influence of the university campus environment on
the physical activity and healthy eating habits.
Note: The Participant should retain a copy of this form.

166
Appendix 7: Examples of data from the campus walk

167
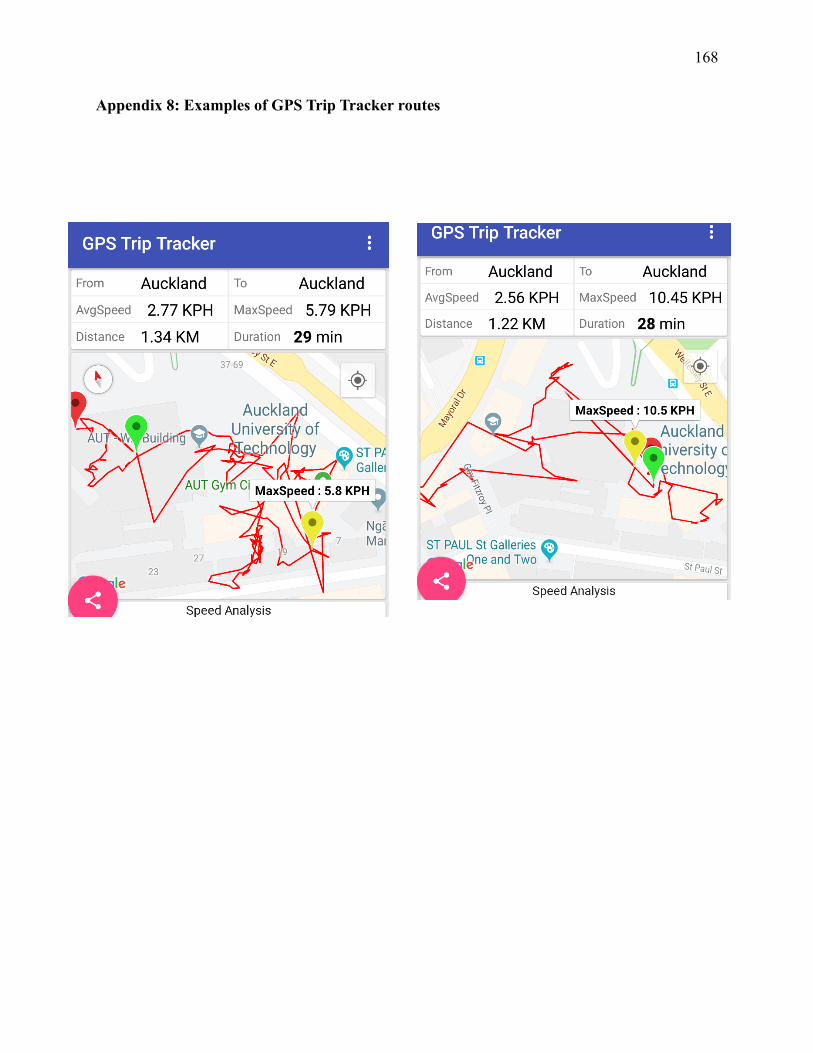
168
Appendix 8: Examples of GPS Trip Tracker routes