students at risk - smart kids with individual learning ...€¦ · kids with individual learning...
TRANSCRIPT

1
S T U D E N T S A T R I S K FOR LEARNING DIFFICULTIES:
A SCREENING IN THE PUBLIC S C H O O L S I N L E B A N O NC Y C L E S 1 A N D 2 ( M AY 2 0 1 4 )

2
2
Layout & Design: Ms. Rana Haddad, A.Maze
Printing Services: Ms. Salam Koborsi, Dar Manhal Al-Hayat
© 2015

A SCREENING IN THE PUBLIC S C H O O L S I N L E B A N O N 3
3
The Center for Smart Kids with Individual Learning Differences (SKILD) is privileged because
it launched results of this study in the presence of key stakeholders. Mrs. Hiba al Jamal,
Director of SKILD Center shared findings with experts in special education, government
officials, ambassadors, cultural attachés, schools principals, educators, media representatives
and advocates of rights and needs of individuals with special needs and learning difficulties in
Lebanon.
The event was held on the occasion of the National Day for Students with Learning Difficulties
that SKILD and its partners, namely the Ministry of Education and Higher Education (MEHE),
the Center for Educational Research and Development (CERD), and the British Council have
been celebrating with other schools in Lebanon on 22 April, since 2013.
Among the participants in this event were: Mr. Fadi Yarak (Director General of the MEHE)
who represented H.E. Minister of Education Mr. Elias Bou Saab; Mrs. Sonia Khoury (Director
of the Orientation Office at MEHE); Dr. Nada Oueijan (President of CERD); Ms. Donna
McGowan (Country Director of British Council in Lebanon); Dr. Nabil Costa (Coordinator of
the national day, Lebanese Society for Educational and Social Development, Lebanon); Ms.
Yolla Hneineh (Director of CERD); Ms. Mirna Sabbagh ( Director of programs and
partnerships, British Council), as well as other dignitaries, principals of public and private
schools, and media representatives.


A SCREENING IN THE PUBLIC S C H O O L S I N L E B A N O N 5
4
A Publication of SKILD center with supervision and coordination by Ms. Hiba Al Jamal,
SKILD Director, and the valuable support and contribution of:
- Dr. Carolyn Bishop, President, Consortium for Global Education (CGE)
- Dr. Tonia Crane, Associate Professor of Education, Missouri Baptist University, USA
- Mr. Fadi Yarak, Director General, Ministry of Education and Higher Education, Lebanon
- Dr. Nada Oueijan, President, Center for Educational Research and Development, Lebanon
- Dr. Souha Fares, Assistant Professor of Biostatistics, Hariri School of Nursing, Faculty of Medicine, American University of Beirut, Lebanon
- Ms. Carla Najem, Clinical Psychologist, SKILD center
- Ms. Maysa Hajj, Research officer, Lebanese Society for Educational and Social Development, Lebanon
SKILD center is very thankful for the graciousness and support of its friends, namely:
- Ms. Mona Tawil Educational Counselling Educator, Ministry of Education and Higher Education, Lebanon
- Ms. Rita Gharib
-Ms. Donna McGowan -Ms. Alia Abboud
Special Needs Coordinator, Ministry of Education and Higher Education, Lebanon
Country Director, British Council in Lebanon
Director of partner relations and development, Lebanese Society for Educational and Social Development, Lebanon
- Ms. Siham Fakhreddine,
- Ms. Aida Haddad,
Head of Special Education Program, Beirut Baptist School, Lebanon
French coordinator, Beirut Baptist School, Lebanon
- Ms. Lena Costa, Volunteer, Lebanese Society for Educational and Social Development, Lebanon
- Ms. Tania Khater, Former Assistant Director, SKILD Center, Lebanon
- Mr. Nazih Khater, Translator and volunteer, Lebanese Society for Educational and Social Development, Lebanon

6
5
At the same time, we can never be thankful enough to SKILD team and BBS (Beirut Baptist School) members and volunteers who helped with this project. We extend our most sincere appreciation to:
Ms. Catherine Haddad, Ms. Eliane Tabet, Ms. Jenny Safi, Ms. Rita Bou Chebel, Ms. Nahi Moussa, Ms. Rana Haddad, Ms. Rouba Sinno, Ms. Samar El Khoury, Ms. Siham Tannoury, Ms. Natalie Biban, Ms. Raja Abu Orom, Ms. Christiane Chiha, Mr. Joseph Chalhoub, Ms. Nadine Abou Asly, Ms. Noura Kalash, Ms. Ruth Salibi, Ms. Zeina Farhat, Mr. George Bou Naim.

A SCREENING IN THE PUBLIC S C H O O L S I N L E B A N O N 7
6
Contents
1. Introduction
2. Sample Design and Methodology
2.1 Selection of participants
2.2 Sample size determination
2.3 Instruments
2.3.1 Academic performance
2.3.2 Behavior
2.4 Data collection
3. Demographic Characteristics of the Study Sample
4. Potential Learning Difficulties
4.1 Potential LD in academic performance
4.2 Potential LD in behavioral characteristics
4.2.1 Prevalence of Potential LD in each area
4.3 Prevalence of potential LD by grade
4.4 Prevalence of potential LD by gender
4.5 Prevalence of potential LD by governorate
4.6 Writing evaluation
5. Discussion
5.1 Significance of the Study
5.2 Limitations and Insights for Future Research


A SCREENING IN THE PUBLIC S C H O O L S I N L E B A N O N 9
7
Foreword
When we look around us to other advanced countries in the world, and we see how
human rights are respected and children are getting a decent education and a decent living, one
feels the responsibility towards own country. It is even harder to know that our children who
cannot achieve academically fight to find respectful jobs or even an opportunity to be part of
the society.
These ideas and others, along with SKILD center’s sincere mission to give an
opportunity for every child to learn, were behind this project. In our attempt and with this study,
we are not aiming at solving all the problems for students struggling at schools in Lebanon, but
we aim to provide decision makers with a document that reflects reality. We come to
underscore the prevalence of students at risk in the elementary level so that we can plan
accordingly.
Hand in hand with the Lebanese authorities to make a difference. SKILD with our
partners and many others believe that children cannot wait until the right timing comes, when
we settle all our political disputes and secure enough funds to get educated. It will be a very
big mistake if we continue to ignore children’s right for education just because they learn
differently. In fact, these children are either going to help the country by becoming productive
citizens, or are going to become unproductive citizens because of lack of education and their
big frustration. The decision is ours!
Hiba Al Jamal
SKILD center
Director


A SCREENING IN THE PUBLIC S C H O O L S I N L E B A N O N 11
8
1. Introduction
This report summarizes the results of the study associated with SKILD center (Smart
Kids with Individual Learning Differences) on students at risk for learning difficulties (LD) in
public schools in Lebanon at the elementary levels. It sheds light on the prevalence of students
with LD in cycles 1 and 2 by gender, grade, and governorate across Lebanon.
The sampling design and methodology are presented in Section 2. A stratified multi-
stage cluster sampling procedure was used for the selection of participants. The strata consisted
of the six Lebanese governorates. First we selected the schools. Once a school agreed to
participate, two classes from each school were randomly chosen and all students within each
class were invited to participate. Two dates were fixed by SKILD team and the school
administrations for data collection. Information was drawn from two sources: the student and
the teacher. The tools used were created to assess both the students’ academic performance and
behavior. The students filled the tools assessing their academic performance while the teacher
rated the student on fifteen items describing the behavioral characteristics of the student.
Description of the study sample is presented in section 3. Information on 1437 children
were obtained by the student him/herself present at the date of data collection and/or by the
teacher who reported behavioral characteristics of students in his/her class. Complete data on
the characteristics measured varied between 1153 and 1435 students.
The prevalence of potential learning difficulties among students are presented in
Section 4.
2. Sample Design and Methodology 2.1 Selection of participants
The study population consisted of all elementary students (grades 1 – 6) attending
public schools in Lebanon. A list of elementary public schools by governorate was provided
by the Ministry of Education and Higher Education (MEHE) and constituted the sampling
frame. The ministry also provided the total number of Lebanese and non-Lebanese students
per school. Schools with more than 20% non-Lebanese students were excluded.
Selection of participants was done using a stratified multi-stage cluster sampling. The
strata were the six Lebanese governorates, and the sampling was done independently within
each stratum. The number of students to be selected in each stratum was calculated using quota
sampling to ensure appropriate representation of students within each governorate.

12
9
School selection:
Within each stratum, schools were selected using a probability proportional to size
(PPS) such that the selection probability of a school is proportional to the number of students
in that school. Using a computer program (the Statistical package STATA, version 11 for
Windows), 26 schools were selected for participation in addition to 10 schools that constituted
the waiting list in case of refusal to participate or an inability to reach that school due to the
political situation during the data collection period, or for any other unforeseen reasons.
Class selection:
From the sampled schools, 2 classes were randomly chosen. All students of the selected
classes and the class teacher, present at the time of data collection, were invited to participate.
Both the student and the teacher were free to accept or decline participation.
2.2 Sample size determination
Sample size was determined based on several factors including the use of cluster
sampling and type of analysis. The sample size required (N) was 1200 participants. To achieve
this N taking into account a 20% non-response or absenteeism rate, we intended to sample 1500
students in the six governorates. Information was obtained on 1437 children. The distribution
of students across governorates is shown in Table 2A. The South and Nabatieh governorates
were grouped together for the analysis.
Table 2A – Distribution of students across governorates
Count (N) Percent %
Beirut 77 5.4
Bekaa 156 10.9
Mount Lebanon 246 17.1
North 642 44.7
South and Nabatieh 316 22.0
Total 1437 100.0

A SCREENING IN THE PUBLIC S C H O O L S I N L E B A N O N 13
2.3 Instruments
The tools used were created to assess both the students’ academic performance and
students’ behavior. For the academic performance, language arts and mathematics were the
main areas administered directly to the student. As for the behavior, the scale was administered
to the main classroom teacher of each grade, who had to rate the behaviors of each student in
the classroom.1
2.3.1 Academic performance
The Peabody Picture Vocabulary Test (PPVT) is a standardized assessment tool that is
used to evaluate the child’s vocabulary stock. The test is scored according to age and grade
level. It is essentially used in a one-to-one format where the assessor says a word and the child
is asked to point to the picture that corresponds to the word. Words from this test were
translated to Arabic (using back to back translation). The test was intended to measure the
vocabulary stock of each student in their native language. Some items were thus used as sample
items when deemed inappropriate for the Lebanese culture. For the purposes of this study, the
modified test was administered by a data collector to a group for students. The data collector
said the word to the class and each student had to circle the corresponding picture on their
booklet. There were different booklets for each grade that contained items that were grade
appropriate.
The Woodcock Johnson Achievement Test (WJ-III) is a standardized assessment tool
that is used to evaluate different aspects of written language skills and math skills according to
age and grade level. The two following subtests were used to assess language skills, spelling
and writing fluency. The spelling subtest was adapted to the culture by a group of language
experts and school teachers. It included a certain number of items according to each level that
were read to the students as in dictation and the students had to spell each word. The words
increased by difficulty and each grade was administered a grade appropriate cluster of words.
In the writing fluency subtest, students were given a picture with corresponding words and they
had to build a sentence using those words in a set timing. These subtests are used to evaluate
language skills thus were translated to French and adapted to the culture by a group of language
experts and school teachers to fit the French curriculum. Two other subtests were used to assess
mathematical skills; the Quantitative Concepts and the Math Calculation subtests. These
1 A copy of all instruments used is included at the end of this report.

14
subtests are usually administered on individual basis but for the purposes of the study the
selected subtests were administered to a group of students.
2.3.2 Behavior
The behavior scale was developed for this study by a group of professors and specialists
in the field. A behavior analyst supervised the work. This scale contained 15 items describing
behaviors that were measured on a scale of 1 to 5 indicating their frequency of occurrence,
where 1 being none existent and 5 being always. The behavior scale was administered to the
main classroom teacher of each grade. The teacher had to rate the behaviors of each student in
the classroom on that scale. The tool contained six negatively worded items that were reversely
coded (items 1 – 4, 11 and 12). The tool revealed excellent internal consistency with a Cronbach
α of 0.91.
All the tools contained scripted instructions in English, Arabic and French for the data
collectors and teachers. These instructions were based on those used in the original tools but
were translated and modified by a team of special education experts for language and cultural
purposes.
2.4 Data collection
The tools were administered to students across Lebanon from randomly selected
schools in the different Lebanese districts. Students selected were from cycle 1 and cycle 2. In
fact, 20 data collectors were randomly assigned to schools and were trained to give all the tests
in the same way. Each data collector administered the booklets to two grades (one from each
cycle) and thus interacted with two corresponding teachers.
A letter of consent was sent by the Ministry of Education and Higher Education to
inform school principals and request their cooperation. Each teacher provided her oral consent
to participation and students provided their oral assent to participation too. A token of
appreciation for participation was given to the school principals and the participating teachers.
The token included a small hand- made decorative item about Lebanon. The data collection
took place during May 2014. The data collectors visited their assigned schools on a Tuesday
and a Thursday at the same time to eliminate variables related to day of the week and time of
the day. Each data collector had three types of booklets, one for the teachers (behavior booklet),
one for the students (the academic test) and one for the data collector that included instructions

A SCREENING IN THE PUBLIC S C H O O L S I N L E B A N O N 15
and verbally administered items. The teachers’ booklets contained the consent form,
instructions, and answers of the tests. The students’ booklets contained the consent form,
instructions, pictures of the PPVT items, space for the spelling from the WJ, the pictures and
words of the writing fluency, equations of the math calculation subtest, and items of the
quantitative concepts subtest.
3. Demographic Characteristics of the Study Sample
Complete data for the 1437 students were not available for all demographic
characteristics. Missing data were encountered due to the fact that information was gathered
from two sources: some students evaluated by their teacher were absent the day of data
collection and thus did not take the test, and other students who were present and took the test
were not evaluated by their teacher, probably due to lack of time. A summary of available data
is presented in Table 3A.
Table 3A – Valid count for demographic characteristics
Characteristic Valid N
Gender 1435
Nationality 1389
Grade 1437
Age 1384
Participating students were 54% males, 85% Lebanese, 13.5% Syrian and 1.5% of other
nationalities.
On average students were 9.5 years old (Standard deviation (SD) = 2.26), with age
varying from 7.00 (SD = 0.89) years old on average in grade 1 to 12.41 (SD = 1.06) years old
on average in grade 6. (Figures 3A – 3D)

16
13
Figure 3A: Gender
Figure 3B: Nationality
13.5%
84.8%
Syrian Lebanese Other
Nationality

A SCREENING IN THE PUBLIC S C H O O L S I N L E B A N O N 17
Figure 3C: Grade
Figure 3D: Mean Age across grades (years)

18
4. Potential Learning Difficulties
The areas of difficulties assessed were: (1) Vocabulary, (2) Spelling, (3) Writing
Fluency, (4) Computational Mathematics, (5) Quantitative Mathematics and (6) Behavior.
Characteristics (1 – 5) were assessed directly by the student filling the appropriate instruments
whereas characteristic (6) was evaluated by the teacher’s report on the student’s behavior.
The score ranges of characteristics (1-5) varied from a grade to another. We also
considered scores to vary from a class to another due to different instruction styles, therefore
students who scored one standard deviation below their class average on one of these
characteristics were considered as having a potential learning difficulty (LD) in this
characteristic. For characteristic 6, negatively worded items (i.e. items, 1, 2, 3, 4, 11 and 12)
were reversely coded. Principal component factor analysis was then carried out with varimax
rotation.
Factor analysis revealed three factors with Eigen values greater than 1, accounting for
71% of the total variance. Factor 1 (Externalizing behavior) included items: 1 (The student
shows signs of aggression), 4 (The student is disruptive in class), 5 (The student is attentive to
instructions), 9 (The student shows respect for authority figures), 10 (The student follows
classroom rules), 11 (The student shows impulsive behaviors) and 12 (The student shows poor
organizational skills). Factor 2 (Social Adjustment) included items: 6 (The student is engaged
in learning), 7 (The student shows leadership qualities), 8 (The student makes and maintains
friendships), 13 (The student appears to have a positive self-image), 14 (The student is well
liked by peers) and 15 (The student takes pride in his/her work). Factor 3 (included two items
only, item 2 (The student appears anxious) and item 3 (The student appears sad/withdrawn).
Standardized regression scores form the factor analysis were then computed and scores
lying one standard deviation below the average factor score (i.e. less than -1) for each factor
were considered indicative of potential behavioral problems (potential behavioral LD for
Factor 1, potential behavioral LD for Factor 2, and potential behavioral LD for Factor 3).
Finally, students who have a potential LD in at least one factor of the three were
considered as having a potential LD in behavior. Like the demographic characteristics, missing
data were encountered in the six characteristics aforementioned; valid counts are presented in
Table 4A.

A SCREENING IN THE PUBLIC S C H O O L S I N L E B A N O N 19
Table 4A - Valid count for different characteristics
Characteristic Valid N
Vocabulary 1395
Spelling
Writing Fluency
1394
1395
Math Computation 1359
Math Quantitative 1358
Behavior Factors 1153
It is worth noting however, that a good number of classes scored between 0 and 1 on
Writing Fluency. We considered this as insufficient information to assess the presence of a
potential LD for students in those classes, as the whole class performed in an identical manner.
Therefore we removed those classes from the analysis involving the Writing Fluency
characteristic only.
4.1 Potential LD in academic performance Table 4B – Grade 1 summaries of Vocabulary, Writing Fluency, Spelling, Computational Math and Quantitative Math
Valid N Mean SD n*(%)
Vocabulary 354 45.01 9.06 56 (15.8)
Spelling 354 12.56 3.89 50 (14.1)
Writing Fluency 66 .21 .65 0 (0)
Math: Computation 318 4.72 2.81 50 (15.7)
Math: Quantitative 317 4.90 3.14 61 (19.2)
*n is the number of students who scored one Standard Deviation below the class average
20
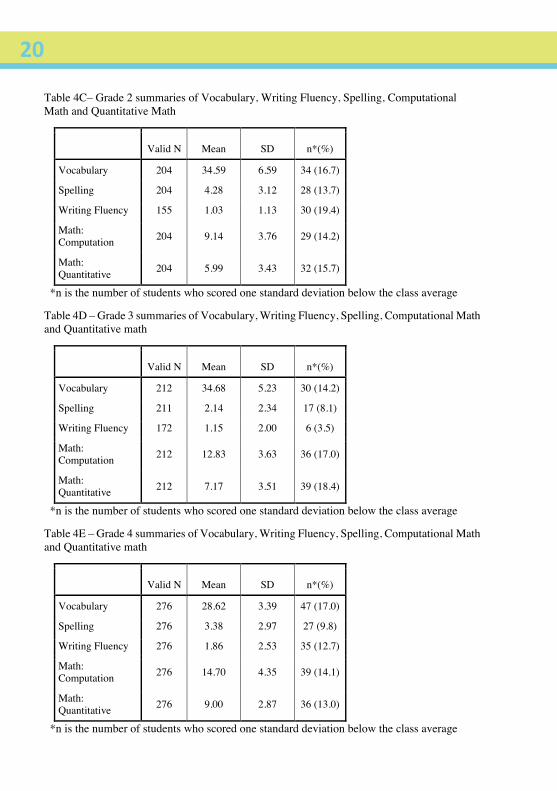
Table 4C– Grade 2 summaries of Vocabulary, Writing Fluency, Spelling, Computational Math and Quantitative Math
Valid N Mean SD n*(%)
Vocabulary 204 34.59 6.59 34 (16.7)
Spelling 204 4.28 3.12 28 (13.7)
Writing Fluency 155 1.03 1.13 30 (19.4)
Math: Computation 204 9.14 3.76 29 (14.2)
Math: Quantitative 204 5.99 3.43 32 (15.7)
*n is the number of students who scored one standard deviation below the class average
Table 4D – Grade 3 summaries of Vocabulary, Writing Fluency, Spelling, Computational Math and Quantitative math
Valid N Mean SD n*(%)
Vocabulary 212 34.68 5.23 30 (14.2)
Spelling 211 2.14 2.34 17 (8.1)
Writing Fluency 172 1.15 2.00 6 (3.5)
Math: Computation 212 12.83 3.63 36 (17.0)
Math: Quantitative 212 7.17 3.51 39 (18.4)
*n is the number of students who scored one standard deviation below the class average
Table 4E – Grade 4 summaries of Vocabulary, Writing Fluency, Spelling, Computational Math and Quantitative math
Valid N Mean SD n*(%)
Vocabulary 276 28.62 3.39 47 (17.0)
Spelling 276 3.38 2.97 27 (9.8)
Writing Fluency 276 1.86 2.53 35 (12.7)
Math: Computation 276 14.70 4.35 39 (14.1)
Math: Quantitative 276 9.00 2.87 36 (13.0)
*n is the number of students who scored one standard deviation below the class average

A SCREENING IN THE PUBLIC S C H O O L S I N L E B A N O N 21
Table 4F– Grade 5 summaries of Vocabulary, Writing Fluency, Spelling, Computational Math and Quantitative math
Valid N Mean SD n*(%)
Vocabulary 161 47.66 5.01 27 (16.8)
Spelling 161 2.64 2.77 13 (8.1)
Writing Fluency 161 3.78 4.29 13 (8.1)
Math: Computation 161 17.63 3.96 22 (13.7)
Math: Quantitative 161 9.94 4.04 23 (14.3)
*n is the number of students who scored one standard deviation below the class average
Table 4G – Grade 6 summaries of Vocabulary, Writing Fluency, Spelling, Computational Math and Quantitative math
Valid N Mean SD n*(%)
Vocabulary 188 40.22 3.16 32 (17.0)
Spelling 188 1.59 2.74 12 (6.4)
Writing Fluency 188 3.37 4.03 21 (11.2)
Math: Computation 188 17.09 3.34 28 (14.9)
Math: Quantitative 188 10.15 3.48 23 (12.2)
*n is the number of students who scored one standard deviation below the class average
4.2 Potential LD in behavioral characteristics
On average, teachers reported positive behaviors of their students on all fifteen items.
More than 50% of the responses were in categories “Always” and “Almost always” for
positively worded items, and in categories “Never” and “Seldom” for negatively worded items.
Ratings on the fifteen behavioral items for the total sample are summarized in Table 4H.
Standardized regression factor scores are summarized in Table 4I.

22
Table 4H- Ratings on behavioral items of the total sample
Behavior Never Seldom Sometimes
Almost always Always
1- The student shows signs of aggression
Count 651 298 187 69 36
% 52.5% 24.0% 15.1% 5.6% 2.9%
2- The student appears anxious
Count 332 359 381 130 39
% 26.8% 28.9% 30.7% 10.5% 3.1%
3- The student appears sad/withdrawn
Count 427 361 324 100 27
% 34.5% 29.1% 26.2% 8.1% 2.2%
4- The student is disruptive in class
Count 431 295 325 109 75
% 34.9% 23.9% 26.3% 8.8% 6.1%
5- The student is attentive to instructions
Count 64 153 336 398 288
% 5.2% 12.3% 27.1% 32.1% 23.2%
6- The student is engaged in learning
Count 99 193 290 336 317
% 8.0% 15.6% 23.5% 27.2% 25.7%

A SCREENING IN THE PUBLIC S C H O O L S I N L E B A N O N 23
Table 4H- Ratings on behavioral items of the total sample
Behavior Never Seldom Sometimes
Almost always Always
1- The student shows signs of aggression
Count 651 298 187 69 36
% 52.5% 24.0% 15.1% 5.6% 2.9%
2- The student appears anxious
Count 332 359 381 130 39
% 26.8% 28.9% 30.7% 10.5% 3.1%
3- The student appears sad/withdrawn
Count 427 361 324 100 27
% 34.5% 29.1% 26.2% 8.1% 2.2%
4- The student is disruptive in class
Count 431 295 325 109 75
% 34.9% 23.9% 26.3% 8.8% 6.1%
5- The student is attentive to instructions
Count 64 153 336 398 288
% 5.2% 12.3% 27.1% 32.1% 23.2%
6- The student is engaged in learning
Count 99 193 290 336 317
% 8.0% 15.6% 23.5% 27.2% 25.7%

24
Table 4I – Behavior factor scores in the sample
Minimum Maximum Valid N n*(%) Regression factor1 score -3.87 1.79 1153 176 (15.3) Regression factor2 score -3.08 2.49 1153 187 (16.2) Regression factor3 score -3.79 2.56 1153 180 (15.6)
*n is the number of students who scored one standard deviation below the factor score average
4.2.1 Prevalence of potential LD in each area
In the Academic performance, 226 (16.2%) students had a potential LD in Vocabulary,
147 (10.6%) in Spelling (10.6%), 105 (10.3%) in Writing Fluency, 204 (15.0%) in
Computational Math and 214 (15.8%) in Quantitative Math. As for behavior, 176 students
(15.3%) were considered as having a potential LD in Factor 1, 187 students (16.2%) in Factor
2 and 180 students (15.6%) in Factor 3. Taking all three factors together, 459 students (39.8%)
had a potential LD in at least one of the three factors and are therefore considered to have a
potential behavioral LD (Figure 4A).
Figure 4A- Overall prevalence of potential LD in each area
*Writing Fluency
226 (16.2)
147 (10.6) 105 (10.3)
204 (15.0) 214 (15.8)
459 (39.8)
0 10
0 20
0 30
0 40
0 50
0 Number (%) of Students with potential LD in Each Area
LD - Vocabulary LD - Spelling LD –Writing F* LD - Math Comp LD - Math Quant LD - Behavior

A SCREENING IN THE PUBLIC S C H O O L S I N L E B A N O N 25
Taking all characteristics together (except for Writing Fluency due to insufficient
information encountered in the Writing Fluency data that were eliminated from the analysis, as
mentioned at the beginning of Section 4, which substantially reduced the sample size), we
computed the number of students having a potential LD in any area, from no difficulty to 5
potential LDs. Complete data for the five remaining characteristics simultaneously were
available for 1037 students. 59.5 % of the students have a potential LD in one area of the five.
The results are presented in Figure 4B.
Figure 4B- Overall prevalence of learning difficulty
Figure 4B- Overall prevalence of potential learning difficulty
4.1.Prevalence of potential LD by grade
4.2.
Number of potential LD
40.5 %
59.5 %
24.1 %
10.3 %
2.8 % 0.4 %
0 20
40
60
Per
cent
age
0 LD 1 LD 2 LD 3 LD 4 LD 5 LD
26
4.3 Prevalence of potential LD in each area by grade
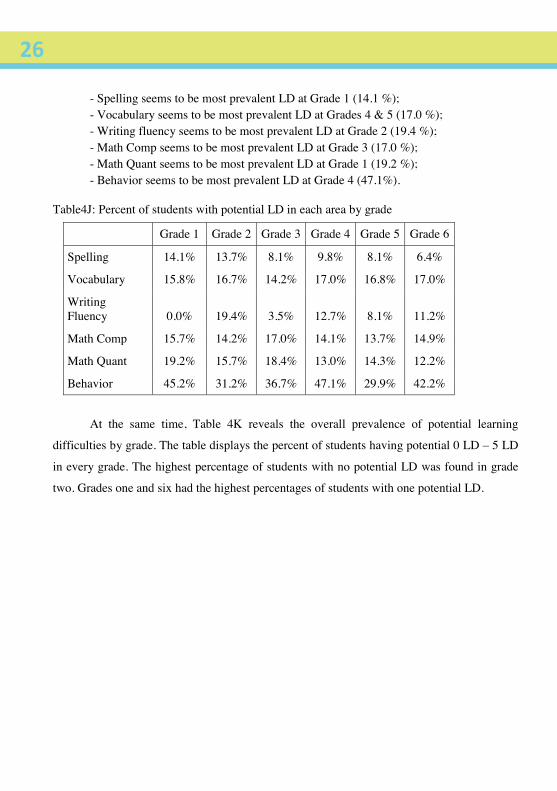
Table 4J shows that in all grades the most prevalent LD is related to behavior. Students had the highest percentage in behavior regardless of their grade.
As for academic skills, the table indicates that the following trends seem to reflect reality of public schools and is based on the highest percentage of students for each area tested:
- Spelling seems to be most prevalent LD at Grade 1 (14.1 %); - Vocabulary seems to be most prevalent LD at Grades 4 & 5 (17.0 %); - Writing fluency seems to be most prevalent LD at Grade 2 (19.4 %); - Math Comp seems to be most prevalent LD at Grade 3 (17.0 %); - Math Quant seems to be most prevalent LD at Grade 1 (19.2 %); - Behavior seems to be most prevalent LD at Grade 4 (47.1%).
Table4J: Percent of students with potential LD in each area by grade
Grade 1 Grade 2 Grade 3 Grade 4 Grade 5 Grade 6
Spelling 14.1% 13.7% 8.1% 9.8% 8.1% 6.4%
Vocabulary 15.8% 16.7% 14.2% 17.0% 16.8% 17.0%
Writing Fluency 0.0% 19.4% 3.5% 12.7% 8.1% 11.2%
Math Comp 15.7% 14.2% 17.0% 14.1% 13.7% 14.9%
Math Quant 19.2% 15.7% 18.4% 13.0% 14.3% 12.2%
Behavior 45.2% 31.2% 36.7% 47.1% 29.9% 42.2%
At the same time, Table 4K reveals the overall prevalence of potential learning
difficulties by grade. The table displays the percent of students having potential 0 LD – 5 LD
in every grade. The highest percentage of students with no potential LD was found in grade
two. Grades one and six had the highest percentages of students with one potential LD.

A SCREENING IN THE PUBLIC S C H O O L S I N L E B A N O N 27
Table 4K: Percent of students with 0 – 5 potential LD by grade
Grade 1 Grade 2 Grade 3 Grade 4 Grade 5 Grade 6
0 LD 35.5% 47.0% 43.8% 39.8% 44.2% 35.9%
1 LD 64.5% 53.0% 56.2% 60.2% 55.8% 64.1%
2 LD 25.0% 26.2% 21.9% 29.4% 19.0% 20.7%
3 LD 12.1% 11.6% 9.4% 12.5% 6.8% 7.6%
4 LD 5.5% 3.7% 1.3% 2.5% 2.0% 0.0%
5 LD 1.6% 0.0% 0.0% 0.0% 0.0% 0.0%
4.4 Prevalence of potential LD by gender As revealed in Table 4L, the highest percentage of students with LD (Behavior) are
males (46.1%). On the other hand, girls’ performance showed that they seem to have the highest
difficulty in vocabulary (18.3%). While in mathematics boys’ and girls’ scores are not very
different.
Table 4L- Percent of students with potential LD in each area by gender
Females Males
Spelling 10.2% 10.8%
Vocabulary 18.3% 14.4%
Writing Fluency 12.8% 8.0%
Math Comp 14.0% 16.0%
Math Quant 14.7% 16.7%
Behavior 31.7% 46.1%
In addition, when it comes to the overall prevalence of potential learning difficulty by
gender, Table 4M shows that most students have a potential LD; though more boys than girls
have a potential LD (56.2% girls as opposed to 62.1 % boys).

28
Table 4M: Percent of students with 0 – 5 potential LD by gender
Females Males
0 LD 43.8% 37.9%
1 LD 56.2% 62.1%
2 LD 22.3% 25.7%
3 LD 10.2% 10.5%
4 LD 2.3% 3.2%
5 LD 0.0% 0.7% 4.5 Prevalence of potential LD by governorate
As the table below indicates, learning difficulties related to behavior seem to be most
prevalent among elementary level students in the capital (Beirut). Other learning difficulties
seem to be more or less equally distributed in the regions.
Table 4N - Percent of students with potential LD in each area by Governorate
Beirut Bekaa Mount
Lebanon North South and Nabatieh
Spelling 6.6% 15.9% 8.1% 9.9% 12.1%
Vocabulary 15.8% 19.2% 17.1% 15.5% 15.7%
Writing Fluency 20.7% 9.6% 15.1% 7.1% 11.5%
Math Comp 21.1% 17.4% 16.2% 13.4% 15.0%
Math Quant 27.6% 12.2% 11.6% 15.8% 17.3%
Behavior 50.7% 41.6% 42.3% 39.0% 35.9%
As for the overall prevalence of potential LD in the governorates, table 4O shows that
the prevalence seems to be highest in the capital.

A SCREENING IN THE PUBLIC S C H O O L S I N L E B A N O N 29
Table 4O- Percent of students with 0 – 5 potential LD by governorate
Beirut Bekaa Mount
Lebanon North South and Nabatieh
0 LD 30.9% 33.3% 37.7% 42.3% 44.7%
1 LD 69.1% 66.7% 62.3% 57.7% 55.3%
2 LD 28.0% 27.7% 23.0% 24.1% 22.3%
3 LD 16.2% 8.3% 9.3% 9.7% 11.3%
4 LD 5.9% 0.9% 2.2% 2.3% 3.9%
5 LD 1.5% 0.0% 0.0% 0.2% 0.7%
4.6 Writing evaluation
In addition to the areas of learning difficulties discussed above, experts in the study
team evaluated the writing of 1015 students with respect to: writing on the line, legibility of
letters, letters well-formed and respect of the space between the words and the letters. The
evaluation consisted of the ratings illegible –fair - Good and Very Good (Table 4P).
Table 4P – Ratings of the students’ writing
illegible Fair Good Very Good
Writing on the line Count 249 38 416 312
% 24.5% 3.7% 41.0% 30.7%
Legibility of the letters Count 252 25 474 264
% 24.8% 2.5% 46.7% 26.0%
Letters well formed Count 431 40 361 183
% 42.5% 3.9% 35.6% 18.0%
Respect of the space between words and letters
Count 361 55 376 223
% 35.6% 5.4% 37% 22%

30
5. Discussion
As indicated early on in the study, the aim behind conducting the screening in public
schools in cycles 1 and 2 (Grades 1 to 6) was to learn about the prevalence of students who are
at risk for learning difficulties. For this purpose, the screening included an assessment of both
academic and behavioral aspects. Three factors of the behavior scale were revealed: factor 1,
externalizing behavior (aggression, impulsivity, authority problems…); factor 2, social
adjustment (maintaining friendships, popularity, leadership…); and factor 3, internalizing
behavior (sadness, shyness, withdrawal…).
The highest prevalence of a behavioral difficulty was on factor 2, social adjustment
(16.2%), followed by factor 3, internalizing behavior (15.6%) and factor 1, externalizing
behavior (15.3%). Thus, the most common difficulty is (factor 2) the lack of leadership skills,
inability to maintain friendships, not being liked by peers, not taking pride in their own work,
and having a negative self-image.
It is noteworthy that findings of the study reveal that the area where students in public
schools at the elementary levels had the most difficulty was behavior. Specifically, behavior
turned out to be the area where the students scored the poorest in 39.8% of the cases.
Furthermore, the study showed that the tendency is as it is commonly believed and
indicated by experts i.e. boys are more likely to exhibit behavioral difficulties than girls.
As far as the academic skills and achievements are concerned, the study revealed important
information about students who are at risk for learning difficulties among the targeted levels.
We learn from this study that:
Potential difficulties in Vocabulary were the most prevalent difficulties.
Overall, 16.2% of the sample have a potential LD in Vocabulary without major
differences in difficulties across grades, ranging between 14.2% and 17% across grades
from grade 1 to grade 6.
The second most prevalent difficulty was in Quantitative Mathematics (15.8%) and
Computational Mathematics (15.0%).
The prevalence of difficulties in Quantitative math ranged from 12.2% in Grade 6 to
19.2% in Grade 1.
The prevalence of difficulties in Computational Math ranged from 13.7% in grade 5 to
17% in grade 3.

A SCREENING IN THE PUBLIC S C H O O L S I N L E B A N O N 31
The overall prevalence of difficulties in Spelling was 10.6%, and it ranged from 14.1%
in grade 1 and 6.4% in grade 6.
The overall prevalence of difficulties in Writing Fluency was 10.3%, ranging from
19.4% in grade 2 and 3.5% in grade 3.
In addition, it is also important to note that on average, 59.5% of the surveyed students
were considered as having a potential learning difficulty in one area; while 40.5 % of the
students screened had no learning difficulties at all. More specifically, in this study:
24.1% of the students screened had learning difficulty in 2 areas;
10.3% of the students screened had learning difficulty in 3 areas;
2.8 % of the students screened had learning difficulty in 4 areas;
0.4 % of the students screened had learning difficulty in 5 areas.
It is plausible to assume that having difficulty in 2 areas or more is an indicator of a
potential learning difficulty. Then we can say that around 10% of the students in the public
schools in Lebanon are at risk for learning difficulties.
This statistics is very reasonable and very close to findings in other countries. For
instance, according to the Annual Disability Statistics Compendium (online version), in the fall
of 2001, among the 67,529,839 students ages 6 to 21 in the United States, 8.4 percent
(5,693,441) received special education services under the Individuals with Disabilities
Education Act (IDEA).2
5.1 Significance of the study
This study is an important contribution to the research on learning difficulties. It makes
available sound data regarding students who are at risk for learning difficulties. Hence, it makes
it possible to move to the long needed step of designing and implementing a purposeful action
plan or road map to help students in public schools at the elementary levels perform better and
hopefully reduce attrition.
Although our research did not lead us to any study that gives an idea about the numbers
and percentages of students who leave school before graduating because of learning
2 http://disabilitycompendium.org/compendium-statistics/special-education

32difficulties, our interaction and exchanges with teachers and educators over the years tell that
beyond doubt. Hundreds of thousands of children over the years are victims of a situation close
to “apathy” in public schools. Teachers simply are not aware how many of the students leave
school because of learning difficulties. The most prevalent tendency is to label students who
fail to get good grades as “lazy” or “good for nothing” or “trouble makers” or worse. In most
of these cases, the parents end up deciding to keep their children at home because they are
themselves illiterate, and/or they are financially destitute. In many cases they prefer to send
their children to learn a vocational skill or marry at a young age.
Hence, this study which now makes available essential information about the most
pressing needs in public schools especially at the lower levels when it comes to learning
difficulties, serves an important role. Now, the chances are higher to be able to do something
to start changing the situation for many students because we have an idea where it is essential
to start and what shortcuts to take for the quickest needed outcomes. We know that a big
number of our students in public schools are not able to learn and succeed academically because
of difficulties at the level of behavior and discipline. We also have a better idea about the
pressing needs at the level of academics too.
There is no doubt that government officials are aware about the dire consequences
suffered at the national level when hundreds and thousands of students are forced to quit school
not because they are not able to learn, but because there is no one to help them cope with
learning difficulties … At the same time though, it is known that because of serious long lasting
and huge socio-political and economic challenges, the government will not be able to make a
difference in the lives of students in public schools through real inclusion in the near future.
Now, equipped with this information, non-governmental organizations and with the
collaboration of professionals in the field of special education, the process can start. This study
is significant because it offers sound proof based on scientific research that students who come
from disadvantaged families in Lebanon need to be rescued without further delay. We know
that in Lebanon, only children from very poor families go to a public school. One may argue
that the low socioeconomic background of students in public schools in Lebanon may
contribute to these difficulties. Living in a non-stimulating environment and sometimes having
uneducated parents may be contributing to findings of the study as well.
We could also claim that the low quality of instructional methods used in public schools
may be hindering the students from receiving optimal education at the right timing (at the right
grade level) and thus the students are delayed in their educational journey and in their
achievement. Findings of the study suggest that more efforts should be paid soon so that

A SCREENING IN THE PUBLIC S C H O O L S I N L E B A N O N 33
teachers in public schools undergo relevant capacity building for students with learning
difficulties, in order to be able to learn as much as they can. It is nothing less than a crime – to
say the least – that generations have missed the chance to learn because their teachers did not
teach them properly or because they did not have the patience to support them.
5.2 Limitations and insights for future research In addition to the information highlighted in the above, this study is valuable because
of the insight it can offer future studies that will hopefully be undertaken to build the body of
knowledge about students with learning difficulties in Lebanon.
The use of standardized assessment tools that are not based on the curriculum taught in
public schools in Lebanon could have exaggerated the students’ academic difficulties.
However using tests that target academic skills in the language of instruction was beneficial in
revealing deficits in academic achievement. Cultural adaptation and translation of these tools
by a team of experts have made its use more appropriate. This was a way to explore the issue
of learning difficulties in public schools in Lebanon despite this limitation. The fact though
remains that it is essential to start soon work on developing standardized assessment tools that
are based on the Lebanese curriculum. This is a huge project but it is highly needed if we are
to make progress when it comes to research on students’ learning difficulties in schools in
Lebanon.
Furthermore, in assessing academic achievement, the study screened for difficulties in
specific language (Vocabulary, Spelling, and Writing Fluency) and mathematics skills
(Computational Math and Quantitative Math). Although these tests are initially designed to be
administered to one student at a time, but for the feasibility of the project and due to the time
frame, they were administered to a group (one class). Unfortunately and because the level of
performance was lower than expected and most students did not perform well on these tests
the scoring procedure was changed to rule out weak instruction. Students scoring one standard
deviation below their class average on any academic skill were considered to be at risk for a
learning difficulty in that area. The use of the class average as a reference criterion was essential
in order to eliminate the effect of extraneous variables such as the quality and method of
instruction. Thus, students unable to perform close to the average of their peers when provided
with the same quality of instruction were considered to be at risk for having a learning difficulty
in that area. Future studies should pay attention that a huge number of students in public schools
(and probably in private schools as well) do not have severe difficulties (or maybe do not have

34
difficulties); they do not perform well and fail their class simply because they had different
learning styles than the ones their teachers were addressing.
In this study, we were very cautious not to make any generalizations in our analysis
because we are aware of the possibility that changes in performance of certain academic skills
and even changes in behavior could be indicative of changes that occur as students move up
the grade ladder. For example, it could be that the higher the grade level the more teachers
concentrate on enhancing spelling skills. Additionally, in higher grades the increase in the
number of taught subjects, exposure to written texts, and required written assignments
increases which may help students acquire and practice spelling skills.
On the behavioral level, students’ behavior was screened by teachers’ reports. The fact
that a team of experts developed a culturally relevant tool for the purpose of this study definitely
enhanced the level of confidence in the findings of the study. It is recommended that future
studies use tools that are culturally relevant to the sources of information.
In addition, when it comes to the findings regarding behavior, this study is important
because it is an eye opener and it definitely sets priorities for future research related to learning
difficulties in schools in Lebanon. Further investigation is needed to find out whether behavior
is most problematic because children do not know how to express themselves. It could be that
children express their frustration when they are not able to understand and they have learning
difficulties through inappropriate behavior. It could also be speculated that there is a social
connection and positive behavioral reinforcement that are not fostered in public schools in
Lebanon which may have contributed to these results. Also it is important to explore whether:
The highest prevalence for behavior problems was recorded in the governorate of Beirut
(50.7%) maybe suggesting that still in the villages and outside the capital, families are
still aiming to raise their kids with good manners.
The fact that more boys have problems at the level of behavior in public schools could
be due to the influence of the different upbringing of boys and girls in families in
Lebanon.
On another front, it seems there is a need to identify the reasons behind the higher
occurrence of learning difficulties at lower levels, which may be due to fact that in lower grades
teacher’s main focus may be mostly disciplinary rather than educational. Plus, we need to learn
more whether there is a relation to the fact that low income family tend to start schooling for

A SCREENING IN THE PUBLIC S C H O O L S I N L E B A N O N 35
their kids at Grade 1 and prefer to skip pre-school because of financial hardship. Plus, preschool
is not mandatory. So when students in public schools start their education they have to deal
with a great deal of knowledge and information at once, and they have to adapt to the sudden
separation from their parents. Classroom management in early grades could be the reason why
optimal instruction is not happening.
Furthermore, there is a need to find out whether learning difficulties in public schools
in Lebanon are related to lack of parental involvement and follow up after school with
homework. The absence of a much needed support and supervision at that age and grade level
can also explain the great difficulty grade 1 students were found to have.
To conclude, we repeat and emphasize that the findings of the study come as an
alarming sign for decision makers in the country and the region to attend to students’
educational needs especially in the long neglected public sector. Thus, we recommend that
public schools in need for intervention are identified to serve as a pilot project for the adoption
of inclusion as an approach to education.
It is also very important that the quality of instruction in public schools is monitored to
provide students with their right of optimal education. Students identified as having a potential
learning difficulty may be suffering the repercussions of poor instruction. Finally, the
governing bodies and policy makers ought to provide teachers with capacity building
opportunities as an approach to better education.
We need always to remember that unless we start soon giving utmost priority to
securing the basic needs of children with special needs and learning difficulties, our country
will keep facing difficulties to progress. For there is ample proof from other countries and
cultures that one important measure of civilization is how well a country treats its most
vulnerable groups. Individuals with learning difficulties are an asset to our country and they
have a right to learn and become integrated in society at all levels. History has proved to us
many times that they are capable of great laborious work and important achievements.


A SCREENING IN THE PUBLIC S C H O O L S I N L E B A N O N 37
33
Appendix A
Teachers’ Booklet
(Sample)


A SCREENING IN THE PUBLIC S C H O O L S I N L E B A N O N 39
34
SCREENING TEACHER’s BOOKLET
GRADE 1 ENGLISH
SAM
PLE
40
35
Screening Packet Order
Letter of appreciation
Letter of Instruction
Instructions specific to the Vocabulary (Peabody Picture Vocabulary Test III)
Instructions specific to the spelling (Woodcock Johnson - Test of
Achievement III)
Instructions specific to the Math Calculation (Woodcock Johnson - Test of
Achievement III)
Instructions specific to the Writing Fluency (Woodcock Johnson - Test of
Achievement III)
Instructions specific to Quantitative Concepts (Woodcock Johnson - Test of
Achievement III)
Behavior Screening
SAM
PLE

A SCREENING IN THE PUBLIC S C H O O L S I N L E B A N O N 41
36
Name of School: ____________________________
Grade Level: _______________________________
Name of Teacher: ___________________________
Date: ______________________________________
Dear Classroom Educator,
Thank you for participating in this survey to assist in identifying students who
may be at risk for learning difficulties.
SKILD team counts on your cooperation to complete the screening packet, the
diagnostic instruments modified to meet cultural contexts in the schools, and the
evaluation form. All of these instruments are intended to explore special learning
needs among the students.
The outcome of the screening will be represented in qualitative and quantitative
data. Along with the teacher’s evaluation, the obtained information will be used
to determine which students are at risk for learning difficulties.
Thank you for your cooperation.
Hiba Al Jamal
SKILD Director
SAM
PLE

42
37
INSTRUCTIONS FOR THE SCREENING PACKET
IT IS VERY IMPORTANT TO START BY READING THE STUDENT
CONSENT FORM TO ALL THE CLASS AND TAKE THE ORAL
APPROVAL OF EACH STUDENT.
NEXT, ASK THE STUDENT TO FILL THE STUDENT
IDENTIFICATION SHEET
DO NOT START THE TEST BEFORE COMPLETING THE
PREVIOUS TWO TASKS.
KINDLY MAKE SURE TO GIVE THE TEST IN THE SAME ORDER
LISTED IN THIS PACKET.
FOLLOW THE GUIDELINES WRITTEN FOR EACH TEST
BECAUSE THE RULES ARE DIFFERENT FOR EACH ONE.
SOME OF THE TESTS ARE TIMED AND SOME ARE NOT.
VERBAL INSTRUCTIONS ARE ALSO PROVIDED ON THE COVER
SHEET OF EACH TEST.
PLEASE PAY CLOSE ATTENTION TO THE VERBAL
INSTRUCTIONS AND SAY ONLY WHAT IS WRITTEN.
IT IS IMPORTANT THAT ONE SUPERVISOR IS ADMINISTERING
THE TEST AND ANOTHER IS WALKING AROUD THE ROOM
KEEPING STUDENTS ON TASK AND ENSURING THAT NO ONE
IS CHEATING.
THANK YOU FOR YOUR COOPERATION!
SAM
PLE

A SCREENING IN THE PUBLIC S C H O O L S I N L E B A N O N 43
38
PEABODY PICTURE VOCABULARY TEST
THIS SECTION SHOULD BE GIVEN IN ARABIC. A PROCTOR SHOULD
WALK AROUND THE ROOM TO MONITOR THAT STUDENTS ARE ON
TASK AND NOT CHEATING.
VERBAL INSTRUCTIONS: STUDENTS TAKE OUT YOUR
VOCABULARY PACKET. YOU WILL FIND A PACKET WITH 4
PICTURES ON EACH PAGE. I WILL SAY A WORD AND YOU SHOULD
CIRCLE THE PICTURE THAT REPRESENTS THAT WORD.
SAM
PLE

44
39
Vocabulary test Grade 1
25 empty فارغ 26 shoulder كتف 27 square مربع 28 measuring مقياس
29 porcupine مكوك الشوك
30 arrow سهم 31 peeling تقشير 32 fountain نافورة 33 accident حادث 34 penguin بطريق 35 decorated مزين 36 nest عش 37 castle قصر 38 sawing نشر 39 cactus صبير 40 farm مزرعة 41 going ذاهب 42 harp قيثارة
43 astraunaut عالم فضاء
44 raccoon حيوان الراكون
this is a sample question. Please circle the picture of the raccoon (number 4)
45 juggling بهلوان 46 envelope مغلف 47 tearing تمزيق 48 claw مخلب 49 parachute منطاد 50 delivering تسليم 51 rectangle مستطيل 52 diving غطس 53 camper مخيم 54 target هدف 55 writing كتابة 56 furry فروي 57 drilling حفر 58 hook معالق
SAM
PLE

A SCREENING IN THE PUBLIC S C H O O L S I N L E B A N O N 45
41
INSTRUCTIONS FOR SPELLING
THIS TEST WILL BE GIVEN IN ENGLISH OR FRENCH. IT SHOULD BE
GIVEN IN THE LANGUAGE USED TO GIVE INSTRUCTION IN THE
CLASSROOM. BE SURE TO GIVE ALL ITEMS OF WORDS ON THE LIST.
VERBAL INSTRUCTIONS: (REFER TO THE INSTRUCTIONS ON THE
NEXT PAGE PROVIDED BESIDE EACH SPELLING WORD).
\
SAM
PLE

46
42
Spelling test
Grade 1
Number Letter/Word Instructions
1 vertical mark Draw a vertical mark (Draw on board) 2 scribble Draw a scribble (Draw on board)
3 line connecting dots Draw a line (Draw on board)
4 Draw Circle Draw a Circle (Draw on board) 5 Copy Z Trace the Z (Draw on board) 6 D Trace the letter D (Draw on board) 7 E Draw the letter E (Draw on board) 8 O, o Write the letter O 9 X, x Write the letter X
10 B, b Write the letter B 11 C, c Write the letter C 12 U, u Write the letter U
13 e Look at the two letters. The first letter is a lower case or small a. The second letter is a lowercase or small h. Write a lowercase e.
14 g Look at the two letters. The first letter is a lower case or small a. The next letter is a lowercase or small i. Write a lowercase g.
15 in Spell the word in. Come in the house. In. 16 he Spell the word he. He is happy. He. 17 six Spell the word six. She had six pennies. Six. 18 green Spell the word green. The grass is green. Green. 19 are Spell the word are. Are you ready? Are. 20 was Spell the word was. He was happy. Was. 21 under Under. Look under the bed. Under. 22 house House. The house is made of bricks. House. 23 rain Rain. We were all disappointed when it began to rain. Rain. 24 table Table. Our family has a very old table. Table. 25 when When. We were all happy when it began to snow. When.
SAM
PLE

A SCREENING IN THE PUBLIC S C H O O L S I N L E B A N O N 47
43
INSTRUCTIONS FOR WRITING FLUENCY
STUDENTS HAVE EXACTLY 7 MINUTES TO COMPLETE THIS TEST.
PLEASE USE A STOPWATCH AND HAVE STUDENTS PUT DOWN THEIR
PENCILS AND TURN OVER THEIR PACKETS AFTER EXACTLY 7
MINUTES.
VERBAL INSTRUCTIONS: YOU HAVE A PICTURE WITH THREE
WORDS BESIDE IT. FORM A SHORT SENTENTCE TELLING ABOUT
THE PICTURE USING THE THREE WORDS PROVIDED. YOU MAY
USE ADDITIONAL WORDS TO COMPLETE YOUR SENTENCE
PUTTING THEM IN ANY ORDER YOU WANT.
*Please start with the following example on the board before the student starts the work:
- Good
- Cake
- is
(Draw a picture of a cake on the board)
SAM
PLE

48
44
INSTRUCTIONS FOR MATH CALCULATION THIS TEST SHOULD BE STOPPED AFTER 15 MINUTES.
VERBAL INSTRUCTIONS: I WANT YOU TO DO SOME MATH
CALCULATION. IF YOU DO NOT KNOW HOW TO SOLVE ONE OF
THE PROBLEMS OR ITEMS, JUST SKIP IT AND PROCEED TO THE
NEXT ONE. WHEN YOU FINISH PLEASE PUT YOUR PENCIL DOWN
AND TURN YOUR PACKET OVER.
* PLEASE START WITH THE FOLLOWING SAMPLE ITEMS BEFORE THE STUDENT STARTS THE WORK: - IN BOX A WRITE NUMBER “ONE” - IN BOX B WRITE NUMBER “THREE”
SAM
PLE

A SCREENING IN THE PUBLIC S C H O O L S I N L E B A N O N 49
45
INSTRUCTIONS FOR QUANTATIVE CONCEPTS (NUMBER SEQUENCING)
THIS TEST SHOULD BE STOPPED AFTER 20 MINUTES.
VERBAL INSTRUCTIONS: I WANT YOU TO DO SOME MATH. IF YOU
DO NOT KNOW HOW TO SOLVE ONE OF THE ITEMS, JUST SKIP IT
AND PROCEED TO THE NEXT ONE. FILL IN THE MISSING NUMBER
FOR EACH ITEM. PLEASE TURN YOUR PACKET OVER WHEN YOU
FINISH AND PUT YOUR PENCIL DOWN.
SAM
PLE

50
46
INSTRUCTIONS FOR BEHAVIOR QUESTIONNAIRE
THIS FORM IS FOR THE CLASSROOM TEACHER TO FILL OUT.
PLEASE TAKE 5 MINUTES TO ANSWER THE 15 QUESTIONS
PROVIDED ABOUT EACH STUDENT IN YOUR CLASSROOM. THE
TWO ADDITIONAL QUESTIONS AT THE BOTTOM ARE FOR YOU TO
FILL OUT IF YOU HAVE NOTICED ANY BEHAVIORS THAT YOU ARE
CONCERNED ABOUT AND WOULD LIKE TO SHARE.
THANK YOU FOR TAKING THE TIME TO ASSIST IN THIS IMPORTANT
STEP IN IDENTIFYING THE NEEDS OF THE STUDENTS.
SAM
PLE

A SCREENING IN THE PUBLIC S C H O O L S I N L E B A N O N 51
Teacher’s Name )إسم المعلم(: _______________ Date )التاريخ(: ______________ Student’s Name )إسم التلميذ( : _______________ Grade )الصف، الفصل( : _______ Please rate the student for each question on the scale of 1 to 5 with 5 being “always” and 1 being “never”. Put an X in the box under the number corresponding to your rating.
Never أبدا
Seldom نادرا
Sometimes فيبعض األحيان
Almost Always تقريبا دائما
Always دائما
OBSERVATION OF STUDENT BEHAVIOR
مراقبة سلوك التلميذ
1 2 3 4 5
1. The student shows signs of aggression.
. عدائية بتصرفات يقوم التلميذ
2. The student appears anxious. . قلق يبدو التلميذ
3. The student appears sad/withdrawn.
منطوعلىنفسه.التلميذيبدوحزين/منزوو
4. The student is disruptive in class. .الصففييشاغبالتلميذ
5. The student is attentive to instruction.
. التعليمات الى ينتبه التلميذ
6. The student is engaged in learning. . بالتعلم إهتماما يبدي التلميذ
7. The student shows leadership qualities.
. القائد بصفات يتمتع أنه يظهر التلميذ
SAM
PLE

52
48
8. The student makes and maintains
friendships. . عليها ويحافظ صداقات يكون التلميذ
9. The student shows respect for authority figures.
. السلطة رموز يحترم أنه يبين التلميذ سلوك
10. The student follows classroom rules.
. الصف قواعد يتبع التلميذ
11. The student shows impulsive behaviors.
التلميذ يظهر سلوكيات متهورة.
12. The student shows poor organizational skills.
التلميذ يظهر عن ضعف على صعيد السلوكيات التنظيمية.
13. The student appears to have a positive self image.
يبدو أن التلميذ لديه صورة إيجابية عن ذاته.
14. The student is well liked by peers. ب من قبل الطالب اآلخرين. التلميذ محبو
15. The student takes pride in his/her work.
التلميذ يبدو فخورا بعمله.
Does the student display any strange or odd behaviors? If yes, please explain.
الشرح. ببعض تزويدنا الرجاء "نعم"، الجواب كان إذا إعتيادية؟ غير أو مألوفة غير أو غريبة يتصرفات التلميذ يقوم هل ____________________________________________________________________________________________________________________________________________________________________________________________________________________________________________________________________________________________________________ ___________________________________________________________________________ Please list any academic or behavioral concerns for this student.
التلميذ. هذا لدى سلوكية أو أكاديمية مخاوف أي ذكر الرجاء____________________________________________________________________________________________________________________________________________________________________________________________________________________________________________________________________________________________________________ __________________________________________________________________________ Thank you for your support! شكرا لدعمكم!
SAM
PLE

A SCREENING IN THE PUBLIC S C H O O L S I N L E B A N O N 53
50
Appendix B
Students’ Booklet
(Sample)

54

A SCREENING IN THE PUBLIC S C H O O L S I N L E B A N O N 55
51
SAM
PLE

56
53
SAM
PLE

A SCREENING IN THE PUBLIC S C H O O L S I N L E B A N O N 57
54
58
56
VOCABULARY TEST
SAM
PLE

A SCREENING IN THE PUBLIC S C H O O L S I N L E B A N O N 59
57
SAM
PLE

60
128
SAM
PLE

A SCREENING IN THE PUBLIC S C H O O L S I N L E B A N O N 61
CALCULATION TEST
SAM
PLE

62
133
WRITING FLUENCY TEST
SAM
PLE

A SCREENING IN THE PUBLIC S C H O O L S I N L E B A N O N 63
138
QUANTITATIVE CONCEPTS TEST
SAM
PLE

64
140
Center for Smart Kids with Individual Learning Differences (SKILD Center) Blata Str. - Mansourieh El Maten Lebanon Email: [email protected] Tel/Fax: +961 (4) 533791 Mobile: +961 (71) 767605 Facebook : Skild Center Twitter : @SKILDCenter