students’ characteristics, self-regulated learning
TRANSCRIPT

Students’ Characteristics, Self-Regulated Learning, Technology Self-Efficacy, and
Course Outcomes in Web-Based Courses
by
Chih-hsuan Wang
A dissertation submitted to the Graduate Faculty of Auburn University
in partial fulfillment of the requirements for the Degree of
Doctor of Philosophy
Auburn, Alabama August 9, 2010
Keywords: students’ characteristics, self-regulated learning, technology self-efficacy course outcomes, online learning, structural equation modeling
Copyright 2010 by Chih-hsuan Wang
Approved by
David M. Shannon, Chair, Humana-Germany-Sherman Distinguished Professor of Educational Foundations, Leadership, and Technology
Margaret E. Ross, Associate Professor of Educational Foundations, Leadership, and Technology
Jill D. Salisbury-Glennon, Associate Professor of Educational Foundations, Leadership, and Technology

ii
Abstract
The purpose of this study was to examine the relationship among students’
characteristics, self-regulated learning, technology self-efficacy, and course outcomes in
online learning settings. Previous research provided conflicting evidence regarding the
relationship among these variables. Further, there is no prior research that has examined
these variables simultaneously. In addition, there has been limited research examining
self-regulated learning as the mediator between students’ characteristics and course
outcomes. Therefore, a hypothesized model was generated based on previous empirical
studies.
Two hundred and fifty-six students participated in this study. All participants
completed an online survey hosted via SuveryMonkey.com. The survey consisted of a
total of 130 items with a demographic questionnaire, the Modified Motivation Strategies
Learning Questionnaire, the Open-ended Learning Strategies Questionnaire, the Online
Technology Self-Efficacy Scale, the Course Satisfaction Questionnaire, and the final
grades. Structural Equation Modeling was served as the major data analysis method.
The results indicated that the initially hypothesized was not an appropriate model
in terms of explaining the relationship among students’ characteristics, self-regulated
learning, technology self-efficacy, and course outcomes. After model re-specification, a
final model with good fit was obtained. Based on the results from the final model, the
number of previous online courses taken directly influenced the effectiveness of students’

iii
learning strategies in taking online courses, and then, directly affected the students’ levels
of motivation. Students’ levels of motivation influenced their levels of technology self-
efficacy and course satisfaction. Finally, their levels of technology self-efficacy and
course satisfaction affected their final grades. In other words, students with previous
online learning experiences tended to have more effective learning strategies when taking
online courses, and hence, had higher levels of motivation in their online courses. When
students had higher levels of motivation in their online courses, their levels of technology
self-efficacy increased, and their levels of course satisfaction also increased. As their
levels of technology self-efficacy and course satisfaction increased, their final grade
tended to be better than the students who did not have experiences in taking online
courses.
In order to understand the specific learning strategies students used in taking
online courses, four open-ended questions which were modified from Self-Regulated
Learning Interview Schedule (Zimmerman & Martinez-Pons, 1986) were used. The
results indicated that students used planners/calendars, and reviewing Blackboard and
syllabus in order to keep up with the assignments. Most of the students took notes in
terms of remembering the learning materials and some reviewed the stream videos. In
addition, in order to review the learning materials, students downloaded the files posted
on the Blackboard and made hard copies to have everything handed. While taking online
courses, students used search engine, Blackboard, and online library a lot in order to
obtain more information. They also reported that the e-mails and discussion board were
very useful in terms of interacting with the instructors and their classmates.
iv
Acknowledgments
To my mentors and friends at Auburn University, this work could not have been
completed without your help. To my advisor, Dr. David Shannon, who always believes in
me and provides unconditional supports, I greatly appreciate your guidance. I would also
like to thank Dr. Margaret Ross, who taught me the teaching of statistics and shared all
her professional experiences with me. I am also grateful Dr. Jill Salisbury-Glennon, who
encouraged me and made learning enjoyable. I also appreciate the help and
encouragement by the outside reader, Dr. Jamie Carney.
To my friends, colleagues at Auburn, and faculty and staffs on the fourth floor,
thank you for your support and help. I especially would like to express my appreciation to
Marte, who assisted me in reading my work when she was busy in preparing her
comprehensive exam.
To my mother, sister, and Miss Lin back in Taiwan, thank you for your support
and encouragement. I cannot have gone this far without you and you are always in my
heart. To my father, I really wish you were still here. I miss you so much. To my dearest
little boy, Benjamin, you are the power which makes me going. Thank you for
accompanying me to complete this journey.
v
Table of Contents
Abstract…………………………………………………………………………….. ii
Acknowledgments………………………………………………………………….. iv
List of Tables……………………………………………………………………….. ix
List of Figures………………………………………………………………………. xi
Chapter 1 Introduction……..……………………………………………………… 1
Introduction…………………………………………………………… 1
Statement of Problem…………………………………………………… 8
Purpose of Study……………………………………………………….. 9
Research Questions and Hypotheses……………………………………. 9
Significance of the Study……………………………………………….. 11
Limitations……………………………………………………………… 12
Assumptions…………………………………………………………….. 13
Definitions………………………………………………………………. 14
Organizational Overview……………………………………………….. 15
Chapter II Literature Review……………………………………………………… 16
Introduction…………………………………………………………….. 16
Course Outcomes……………………………………………………….. 17
vi
Self-Regulated Learning………………………………………………... 18
Self-Regulated Learning Theories……………………………. 21
Zimmerman’s Three-Phase Model…………………………… 22
Pintrich’s Conceptual Framework for Self-Regulated Learning………………………………………………………. 24
Factors in Self-Regulated Learning………………………....... 27
Measurements for Self-Regulated Learning………………….. 29
Self-Regulated Learning in Traditional Learning Settings…… 35
Self-Regulated Learning as the Mediator in Online Learning Settings……………………………………………………….. 37
Technology Self-Efficacy………………………………………………. 40
Course Outcomes and Students’ Characteristics……………………….. 43
Mediator and Moderator……………………………………………….. 46
Summary…...…………………………………………………………… 48
Chapter III Method….…………………………………………………………….. 49
Purpose of Study……………………………………………………….. 49
Research Design………………………………………………………… 50
Participants……………………………………………………………… 51
Procedures………………………………………………………………. 56
Instrumentation…………………………………………………………. 60
Variables……………………………………………………… 60
Instruments……………………………………………………. 61
Course Satisfaction Questionnaire (CSQ)…………………………………………………. 61
Modified Motivation Strategies for Learning Questionnaire (Modified MSLQ)……………………....
66
vii
Modified Self-Regulated Learning Interview Schedule.. 77
Online Technologies Self-Efficacy Scale (OTSES)…… 77
Statistical Method………………………………………………………. 83
Components of a Structural Equation Modeling……………… 86
Model Identification………………………………………….. 87
Assumptions for SEM………………………………………… 87
Conducting a Covariance-based SEM………………………... 87
Assessment of Model Fit……………………………………… 88
Advantage in Using SEM…………………………………….. 91
Limitations to SEM…………………………………………… 91
Summary………………………………………………………………... 94
Chapter IV Results…..…………………………………………………………….. 96
Quantitative Research Results………………………………………….. 97
Descriptive Statistics and Assumptions………………………. 98
Hypothesized Model…………………………………………. 101
Re-specified Model 1…………………………………………. 103
Re-specified Model 2…………………………………………. 106
Final Model…………………………………………………… 109
Qualitative Research Results…………………………………………… 117
Summary………………………………………………………………... 132
Chapter V Conclusions and Discussions...………..………………………………. 134
Summary of Study……………………………………………………… 134
Conclusions…………………………………………………………….. 136
viii
Discussion………………………………………………………………. 138
Course Outcomes……………………………………………... 138
Self-Regulated Learning……………………………………… 139
Technology Self-Efficacy…………………………………….. 144
Students’ Characteristics……………………………………… 145
Limitations……………………………………………………………… 146
Recommendations………………………………………………………. 146
For Researchers……………………………………………….. 147
For Institutions, Instructors, and Students……………………. 148
Summary………………………………………………………………... 149
REFERENCES……………………………………………………………………… 150
APPENDICES……………………………………………………………………… 162
Appendix A Institutional Review Board………………………………... 163
Appendix B Participant Information Letter…………………………….. 167
Appendix C Survey Instrument…………………………………………. 170
Appendix D Survey Invitation E-mails…………………………………. 179
Appendix E Survey Reminders…………………………………………. 182
Appendix F Thank You Page…………………………………………… 185
Appendix G Raffle Page………………………………………………... 187
ix
List of Tables
Table 1 The Difference between the Traditional Classroom Learning Settings and Online Learning Settings………………………………………………….. 1
Table 2 Dimensions of Self-Regulation……………………………………………. 22
Table 3 Phases and Areas for Self-Regulated Learning……………………………. 26
Table 4 Self-Regulated Learning Strategies Categories…………………………… 30
Table 5 Subscales and Internal Reliability Coefficients for Motivation Strategies for Learning Questionnaires……………………………………………… 34
Table 6 Comparing the Frequency and Percentage of Gender and Educational Level between the Sample Pool and the Returned Responses…………….. 52
Table 7 Frequency Table of the Participants’ Ethnicity……………………………. 53
Table 8 Frequency Table of the Participants’ Age…………………………………. 54
Table 9 Frequency Table of the Participants’ Highest Level of Education……….. 54
Table 10 Frequency Table of the Participants’ College……………………………... 55
Table 11 The Most Recent Online Course Completed……………………………… 55
Table 12 The Order of Different Forms of Questionnaire Generated by the Latin Square……………………………………………………………………… 57
Table 13 The Distribution of Each Survey Format for the Current Study…………... 58
x
Table 14 The Factor Analysis Results for the Course Satisfaction Questionnaire….. 64
Table 15 The Factor Analysis Results for the Motivation Subscale of the Modified MSLQ……………………………………………………………………… 70
Table 16 The Factor Analysis Results for the Learning Strategies Subscale of the Modified MSLQ…………………………………………………………… 74
Table 17 The Factor Analysis Results for Online Technologies Self-Efficacy Scale……………………………………………………………………….. 80
Table 18 Characteristics of Different Fit Indices Demonstrating Goodness-of-Fit across Different Model Situations…………………………………………. 90
Table 19 Descriptive Statistics for All Variables……………………………………. 99
Table 20 Correlation Matrix of Indicators and Latent Variables……………………. 100
Table 21 The Estimation for Regression Weights of Hypothesized Model…………. 103
Table 22 The Estimation for Regression Weights of Re-specified Model 1………... 104
Table 23 The Estimation for Regression Weights of Re-specified Model 2………... 108
Table 24 The Estimation for Regression Weights of Final Model………………….. 110
Table 25 Self-Regulated Learning Strategies Categories…………………………… 119
Table 26 Frequency Table for Self-Regulated Learning Strategies categories for Open-ended Question 1, Question 2, and Question 3……………………... 123
Table 27 Frequency Table of Online Learning Tools Categories for Open-ended Question 4…………………………………………………………………. 130
xi
List of Figures
Figure 1 Hypothesized model…...…………………………………………………. 7
Figure 2 Self-Regulation cycle……………………………………………………... 24
Figure 3 A mediator model………………………………………………………… 47
Figure 4 A moderator model……………………………………………………….. 47
Figure 5 Scree plot for the Course Satisfaction Questionnaire…………………….. 63
Figure 6 Scree plot for the Motivation Subscale of the Modified MSLQ…………. 69
Figure 7 Scree plot for the Learning Strategies Subscale of the Modified MSLQ… 73
Figure 8 Scree plot for the Online Technologies Self-Efficacy Scale…………….. 79
Figure 9 Diagram of conventional approach to structural equation modeling……... 85
Figure 10 Hypothesized model with path number…………………………………... 95
Figure 11 Results for Hypothesized Model………………………………………….. 102
Figure 12 Results for Re-specified Model 1………………………………………… 105
Figure 13 Results for Re-specified Model 2………………………………………… 107
Figure 14 Results for Final Model…………………………………………………... 111
Figure 15 Self-regulatory processes enhanced through the integration of learning activities, learning supports, and learning resources in an online learning environment………………………………………………………………. 143
1
I. INTRODUCTION
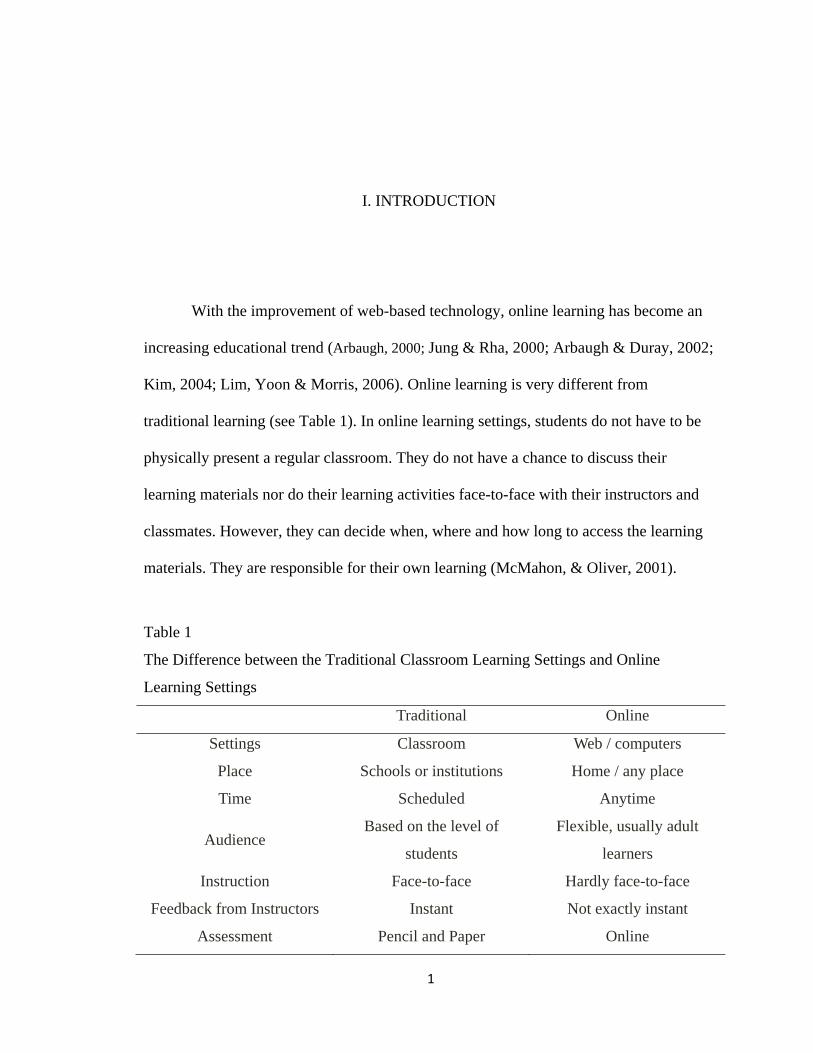
With the improvement of web-based technology, online learning has become an
increasing educational trend (Arbaugh, 2000; Jung & Rha, 2000; Arbaugh & Duray, 2002;
Kim, 2004; Lim, Yoon & Morris, 2006). Online learning is very different from
traditional learning (see Table 1). In online learning settings, students do not have to be
physically present a regular classroom. They do not have a chance to discuss their
learning materials nor do their learning activities face-to-face with their instructors and
classmates. However, they can decide when, where and how long to access the learning
materials. They are responsible for their own learning (McMahon, & Oliver, 2001).
Table 1
The Difference between the Traditional Classroom Learning Settings and Online
Learning Settings
Traditional Online
Settings Classroom Web / computers
Place Schools or institutions Home / any place
Time Scheduled Anytime
Audience Based on the level of
students
Flexible, usually adult
learners
Instruction Face-to-face Hardly face-to-face
Feedback from Instructors Instant Not exactly instant
Assessment Pencil and Paper Online
2
Based on the National Center for Education Statistics, during 2000-2001
academic year, 55 percent of 2-year and 4-year institutions provided distance education
courses at college, graduate, and professional levels. Ninety percent of distance courses
were offered online. There were 2,876,000 students enrolled in the distance courses
(Waits, Lewis & Greene, 2003). In the 2006-2007 academic year, 66 percent of 2-year
and 4-year institutions offered distance education courses, and 92.4 percent of the
distance courses were offered online. There were 12.2 million students enrolled in the
distance courses (Parsad, Lewis & Tice, 2008). The growing number of online courses
makes the course and learning quality an important concern.
Lim et al. (2006) asserted that course outcomes can be an index for evaluating the
overall quality of distance learning programs. Course outcomes include both cognitive
and affective variables (Paechter, Maier & Macher, 2010). Among the cognitive variables,
learning achievement is the most important one, whereas course satisfaction is the
important affective variable (Lim et a. 2006; Paechter et al., 2010). A course is successful
when students feel satisfied with their learning experience (Marks, Sibley & Arbaugh,
2005). Students’ satisfaction with the online courses is also correlated with the
probability of persistence and dropouts in online learning (Arbaugh, 2000; Billings, 2000;
Levy, 2007; Thurmond, Wambach, Connor& Frey, 2002). Furthermore, course
satisfaction is the key component which leads students to success in learning (Biner,
Dean & Mellinger, 1994; American Psychological Association, 1997; Chang & Smith,
2008; Mark et al., 2005). When students are more satisfied in their online course, they
tend to earn higher grades (Puzziferro, 2008).
3
Motivation is correlated with the course satisfaction and achievement (Lim et al.,
2006). In addition, it is also a significant factor in predicting the performance in online
learning settings (Sankaran & Bui, 2001; Lim et at., 2006). Self-regulated learning is very
important in taking online courses because of the special characteristics of online learning
settings (Wijekumar, Ferguson & Wagoner, 2006). Whipp and Chiarelli (2004), and
Yukselturk and Bulut (2007) found that students used self-regulated learning strategies in
their web-based courses based on the interview results. Researchers also have found that
self-regulated learning has a positive correlation with students’ performance and
satisfaction with online courses (Artino & McCoach, 2008; Paechter et al., 2010;
Puzziferro, 2008). Pintrich and Zusho (2002) have defined self-regulated learning as an
active and constructive process. It involves the students’ active, goal-directed, self-
control of behaviors, motivation, and cognition for academic tasks (Pintrich, 1995).
Students set goals for their learning, and use many cognitive and metacognitive strategies
to monitor, control, regulate and adjust their learning to reach these goals (Pintrich, 1995;
Pintrich, 1999; Pinch & Zusho, 2002). Pintrich (2004) also pointed that self-regulatory
activities are mediators between personal and contextual characteristics and actual
achievement or performance.
Based on Zimmerman’s model of self-regulation, self-efficacy is a key
competence belief in self-regulatory control processes, such as goal setting and strategy
selection (Pintrich & Schunk, 1996; Schunk & Zimmerman, 2006). The concept of self-
efficacy was introduced by Bandura (1977a). He defined perceived self-efficacy as
personal judgments of one’s capabilities to organize and execute courses of action to
attain designated goals. In other words, self-efficacy indicated the beliefs of the

4
capabilities of what one can do in a specific domain. Self-efficacy has an effect on task
choice, effort, persistence and achievement. It also influences academic motivations,
learning, and achievement (Schunk, & Pajares, 2002). From this point of view, students
with positive self-efficacy about the online courses in which they enroll usually have
more motivation and better performance in these courses.
In addition to the self-efficacy in the specific online course, the skills of using
online learning technologies are also important for students who enroll in online courses.
These skills, including the use of E-mails, Internet search engines, chat rooms, and
databases are the major computer skills required in online courses. Students who fear
computer technologies may experience confusion, anxiety, a loss of personal control,
frustration, and withdrawal (Bates, & Khasawneh, 2004). However, previous researchers
have found conflicting results regarding the relationship between technology self-efficacy
and students’ performance and satisfaction with online courses.
DeTure (2004) and Puzziferro (2008) indicated that the technology self-efficacy
was a poor predictor of the course final grade and satisfaction in online courses. On the
other hand, some researchers reported that technology self-efficacy is positively
correlated with online learning performance (Joo, Bong & Choi, 2000; Wang & Newlin,
2002). In addition, Bates and Khasawneh (2004) found that both the training provided by
instructors and the previous success experience with online learning technologies can
reduce the anxiety of online learning technologies, as well as increase online learning
technologies self-efficacy. Furthermore, online learning technologies self-efficacy will
influence the motivation to use online learning technologies.
5
Some researchers have tried to establish the relationship between students’
characteristics and previous online learning experience, and their satisfaction and
performance in online learning settings (Marks et al., 2005; Sanders & Morrison-Shetlar,
2001; Thurmond et al., 2002). However, they found these variables cannot consistently
predict students’ performance and satisfaction toward their online learning experiences.
While Thurmond et al. (2002) found that the number of online courses the students have
taken is positively correlated with their course satisfaction, the study failed to reach
statistical significance as a predictor. Sanders and Morrison-Shetlar (2002) found that the
females have more positive attitudes toward web-based courses than males. They also
found that younger students (<20 years old) have more positive attitudes in online
courses than older students (> 23 years old) do. On the other hand, Marks et al. (2005),
Yukselturk and Bulut (2007), and Yukselturk (2009) reported that age, gender,
educational level, and previous number of online courses taken are not significant
predictors in predicting the current online course satisfaction or students’ achievement.
The results in investigating the relationship between students’ characteristics and
motivation, and technology self-efficacy are not consistent. Busch (1995) and Imhof,
Vollmeyer, and Beierlein (2007) found that there are no gender differences in college
students in terms of their perceived self-efficacy in using computers. Yukselturk and
Bulut (2009) reported that there is no gender difference in self-efficacy, self-regulated
learning, nor achievement. On the other hand, Brown, Boyer, Mayall, Johnson, Meng,
Butler, Weir, Florea, Hernandez, and Reis (2003) found that males have more technology
self-efficacy than females. They also found that the females have more academic self-
efficacy than males. As for the previous online learning experience, Lim et al. (2006)
6
reported that there is a significant difference in learning motivation and self-efficacy
between students with previous distance learning experience and those without previous
distance learning experience, while Bates and Khasawneh (2004) indicated that previous
success online learning experiences increase technology self-efficacy.
In summary, researchers have provided conflicting evidence regarding the
relationship among students’ characteristics and previous experience in online learning,
self-regulated learning and technology self-efficacy, and course satisfaction and
performance. In addition, there is no prior research that has examined these variables
simultaneously. Moreover, the data analysis techniques in previous researches were relied
on ordinary least squares solution, such as ANOVA and regression, in which the results
obtained were not stable because of large variance (Goldberger, 1971, Tibshirani, 1996).
Therefore, the current study generated a hypothesized model (Figure 1) based on
previous empirical studies, and determined the relationship among these variables via
structural equation modeling (SEM) to eliminate the problems associated with ordinary
least squares analysis.
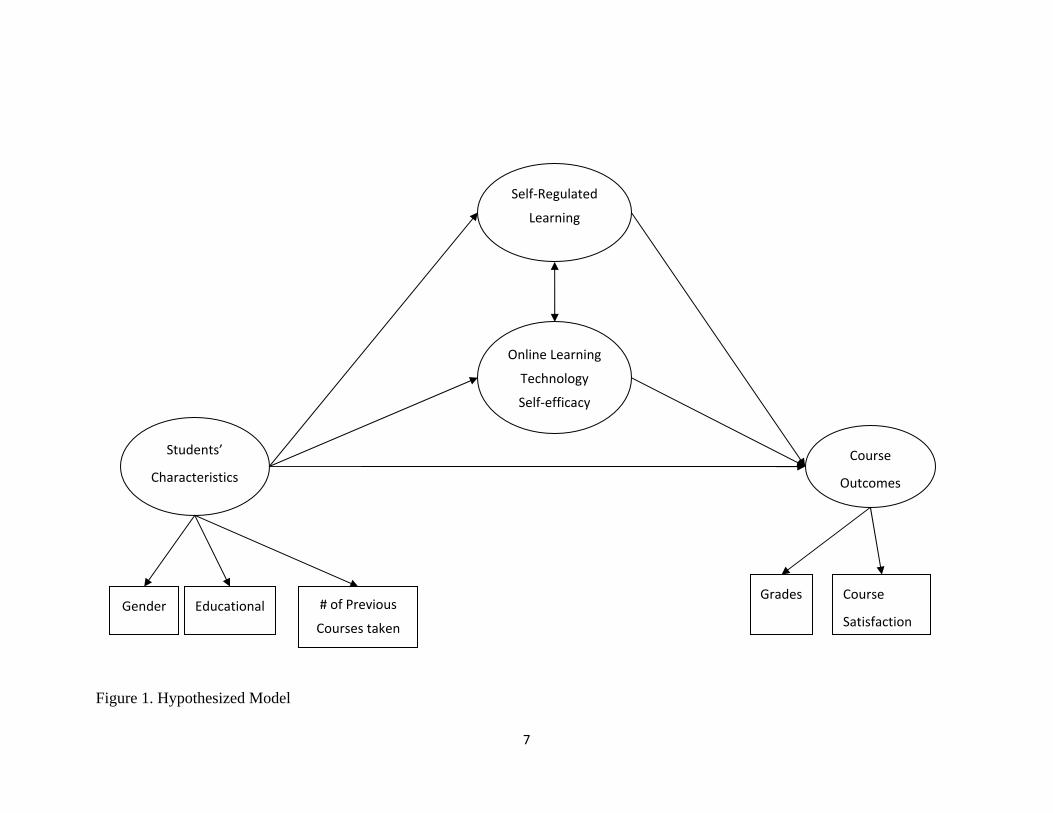
In Figure 1, students’ characteristics include gender, educational level, and the
numbers of previous online courses the students have taken, while course outcomes
include final grade and course satisfaction. Students’ characteristics influence the level of
self-regulated learning and the level of technology self-efficacy, and these two factors
then affect the level of course outcomes. In addition, self-regulated learning and
technology self-efficacy interact to each other, and they are both mediators between
students’ characteristics and course outcomes.
7
Figure 1. Hypothesized Model
Students’
Characteristics
Online Learning
Technology
Self‐efficacy
Gender
Self‐Regulated
Learning
Course
Outcomes
Grades Course
SatisfactionEducational # of Previous
Courses taken
8
Statement of Problem
The current study focused on the relationship among students’ characteristics,
previous online learning experiences, self-regulated learning, technology self-efficacy,
and course outcomes (achievement and satisfaction).
Researchers have found positive relationships between self-regulated learning and
course outcomes (Artino & McCoach, 2008; Puzziferro, 2008), while results pertaining to
the relationship between technology self-efficacy and course outcomes has been mixed.
Some researchers have revealed a positive relationship between self-efficacy and course
outcomes (Joo, Bong & Choi, 2000; Wang & Newlin, 2002), while others have found
that technology self-efficacy was not statistically significant in relation to course
outcomes (DeTure, 2004; Puzziferro, 2008). In addition, students’ characteristics and
previous online learning experience have been linked with self-regulated learning and
technology self-efficacy with mixed results (Bates & Khasawneh, 2004; Brown et al.,
2003; Busch, 1995; Imhof et al., 2007; Lim et al., 2006; Yukselturk & Bulut, 2009). All
these variables, however, have been investigated separately with very little research
examining these variables together. Furthermore, the data analysis methods used in
previous research consisted of correlation, ANOVA, and regression, which are limited in
their examination of these variables and are subject to estimation bias.
Therefore, in order to examine the extent to which students’ characteristics and
previous online learning experiences, self-regulated learning, and technology self-
efficacy work together and their influence on online learning achievement and
satisfaction, the current study investigated the relationship among these variables using
SEM data analysis technique.
9
Purpose of Study
The purpose of current study is to determine the relationship among students’
characteristics and previous experience in online learning, self-regulated learning
(motivation and learning strategies), technology self-efficacy, and the course outcomes
(course performance and course satisfaction). Based on previous studies, a hypothesis
model was generated in Figure 1. Overall, the current study seeks to determine if the
hypothesis model can explain the relationship among student characteristics, self-
regulated learning, technology self-efficacy, and distance course outcomes.
Research Questions and Hypotheses
The research questions of current study are:
(1) Overall, can the hypothesized model explain the relationship among students’
characteristics and previous experience in online learning, self-regulated
learning (motivation and learning strategies), technology self-efficacy, and
course outcome (achievement and course satisfaction) in online learning
settings?
(2) Do students’ characteristics and previous experience in online learning
influence self-regulated learning, technology self-efficacy, and course
outcomes (achievement, and satisfaction) in online learning settings?
(3) A. Does students’ self-regulated learning influence the course outcome in
online learning settings?
B. Does students’ technology self-efficacy influence the course outcome in
online learning settings?
10
C. Does students’ technology self-efficacy influence their self-regulated
learning?
(4) Are self-regulated learning and technology self-efficacy mediators between
students’ characteristics and previous experience in online learning, and the
course outcome?
The following null hypotheses were tested in current study:
(1) Overall, the hypothesis model cannot explain the relationship among students’
characteristics and previous experience in online learning, self-regulated
learning (motivation and learning strategies), technology self-efficacy, and
course outcome (achievement and course satisfaction) in online learning
settings.
(2) Students’ characteristics and previous experience in online learning do not
influence their self-regulated learning, technology self-efficacy, course
outcome in online learning settings.
(3) A. Students’ self-regulated learning does not influence their course outcome
in online learning settings.
B. Students’ technology self-efficacy does not influence their self-regulated
learning and the course outcome in online learning settings.
C. Students’ technology self-efficacy does not influence their self-regulated
learning.
(4) Self-regulated learning and technology self-efficacy are not mediators
between students’ characteristics and previous experience in online learning,
and the course outcome.
11
Significance of the Study
An understanding of the roles that student characteristics, self-regulated learning,
and technology self-efficacy play in students satisfaction with and performance in online
courses has implications for course designs, instructors, and researchers. The course
designers and instructors can gain some insight to improve students’ online learning
achievement and satisfaction, which can improve of the quality of the online learning
courses. Also, future researchers can use a basic model to explain the relationship among
these variables, and furthermore, extend the model to help courses designers and
instructors improve the quality of online courses.
If self-regulated learning enhances the students’ online learning achievement and
satisfaction, then online courses should be designed and taught to encourage students’
self-regulated learning, including cognitive and metacognitive strategies to monitor,
control, regulate, and adjust their learning and thus reach their learning goals. In addition,
if technology self-efficacy affects the students’ online learning achievement and
satisfaction, then instructors should help students to develop their confidence in using
technology so they can succeed in the course.
Likewise, if students’ characteristics and previous online learning experience
influence self-regulated learning and technology self-efficacy, and further influence
students’ online learning achievement and satisfaction, then course designers and
instructors can understand the importance of helping students who do not have previous
experience in online learning or those whose characteristics do not fit the online learning
to success in their online courses.
12
Limitations
1. A non-experimental quantitative research designed with self-report survey
measures will be used in this study. The reason is that the participants cannot be
randomly assigned to different levels of motivation, self-efficacy, and different
types of learning strategies. Therefore, the results should be interpreted with
caution when generalizing them to other populations.
2. In current study, participants are going to be selected by cluster sampling method
from the students at Auburn University who enrolled in online courses during Fall,
2008 to Fall, 2009. Therefore, they are not randomly chosen and may be different
from other students in other colleges and universities. Hence, generalization of
results may be limited.
3. All instruments used in this study are self-report measures. Self-report measures
relied on participants’ ability and willingness to report accurately. In addition, the
participants may respond the questions based on social desirability or response
acquiescence.
4. Each participant was asked to complete an over 100-item questionnaire with
seven measurement subscales. To control for potential order effects, a Latin
Square design was used in presenting these tools in different orders. The
assumption of the Latin Square design is that the treatment effect, row effect, and
column effect are independent to each other (Freund & Wilson, 2003). In other
words, there are no interactions among the order of the instrument, the type of
forms, and the contents of the instruments. Since every part of instrument appears
in each position once, the position effect is controlled (Kirt, 1995; Maxwell &
13
Delaney, 2004). The final forms of the questionnaire with their orders and the
SAS code used to generate the Latin Square are shown in Chapter 3.
5. The research questionnaires were delivered via university E-mail system. There
are possibilities that the potential participants ignore or do not check their E-mails,
the survey is identified as junk, or E-mail address is incorrect. Therefore, a
friendly notice was sent to the participants by E-mail a week before the formal
survey, and two friendly reminders were sent to them a week and two weeks after
the participants received the formal survey. In order to recruit a large enough
sample, all students who enrolled in online courses during Fall, 2008 to Fall, 2009
were included as potential participants.
Assumptions
1. Course satisfaction, performance, self-regulated learning, technology self-efficacy,
students’ characteristics and previous experience in online learning variables in
this study are constructs. Constructs cannot be observed directly and difficult to
measure. Therefore, an assumption was made that, these constructs do exist, and
the measures used to measure these constructs are appropriate.
2. An assumption was made that, all participants in this study are able to read and
comprehend all the survey questions accurately.
3. An assumption was made that, all participants in this study respond to all the
survey questions as honestly and accurately as possible.
14
Definitions
Terms as they are used in this study are defined as follows:
1. “Web-based courses”, also called online courses, is defined as an educational
method which the students are physically separated from the instructors and the
institutions, and the course delivery option is using online platforms, such as
Blackboard and WebCT (Scholesser & Anderson, 1994; Bourne, 1998).
2. The term “Course Outcomes” in this study includes course satisfaction and
achievement in two dimensions.
(1) “Course satisfaction” refers to students’ overall perceptions with online
courses experiences and the value perceived from the courses (Frey, Yankelov
& Faul, 2003; Bolliger & Martindale, 2004).
(2) “Performance” refers to the final grade students earned in the most current
online courses.
3. The antecedent variables in the current study include demographic information
(gender and educational level: undergraduate or graduate student) and the number
of courses the participants have taken in the past.
4. “Self-regulated learning” involves the active, goal-directed, self-control of
behaviors, motivation, and cognition for academic tasks by students (Pintrich,
1995). Students set goals for their learning, and use many cognitive and
metacognitive strategies to monitor, control, regulate and adjust their learning to
reach these goals (Pintrich, 1995; Pintrich, 1999; Pinch & Zusho, 2002). In
addition, cognitive, metacognitive, resource management, and affective activities
15
are the strategies that are usually used in self-regulated learning (Pintrich, 1999;
Cho, 2004).
5. “Self-efficacy” was defined as the personal judgments of one’s capabilities to
organize and execute courses of action to attain designated goals. In other words,
self-efficacy indicated the beliefs of the capabilities of what one can do in a
specific domain. Self-efficacy has an effect on task choice, effort, persistence and
achievement (Schunk, & Pajares, 2002).
6. “Technology self-efficacy” refers to students’ self-efficacy beliefs with online
technologies (Miltiadou & Yu, 2000).
Organizational Overview
Following this chapter, this study is organized as follows: Chapter Two introduces
a review of related literature. Chapter Three discusses the methodology employed in the
study including the research’s purpose, design, instrumentation, and subjects. Chapter
Four is comprised of a summary and description of the results from data analysis, and
Chapter Five consists of the summary, discussion of findings, conclusions, and
recommendations.
16
II. LITERATURE REVIEW
Chapter I provided an overview of current study. The purpose of the study, statement
of the problem, research questions, significance of the study, limitations, and the
definition of the terms were also presented. This chapter is going to provide the reviews
of the previous research. A brief introduction to online learning, course outcome as the
dependent variable, self-regulated learning theories, the measures of self-regulated
learning, relationship between self-regulated learning and course outcomes, technology
self-efficacy and its relationship with course outcomes are going to be presented. Also,
the relationship between course outcomes and students’ characteristics will be discussed.
Finally, the differences between moderator and mediator will be discussed.
Introduction
Distance education is defined as an educational method which the students are
physically separated from the instructors and the institutions (Scholesser & Anderson,
1994). Because of the separation, there are many course delivery options. As early as the
1800’s, correspondence courses were used as the course delivery method in distance
education. In the 1920’s, distance courses were delivered via radio, and starting from the
early1930’s, they were delivered as television programs. In 1993, Graziadie first
17
introduced an online computer-delivered lecture and provided computer programs which
allowed students and the instructors to use computers as virtual classroom settings. This
was considered to be the beginning of online learning and web-based courses were
starting to be considered as one of course delivery options in distance education.
Technology, such as web browsing, discussion boards, e-mails, video streams…etc, is a
key component in online learning settings. Online courses can be categorized as
asynchronous and synchronous. In an asynchronous online learning sitting, students do
not have to be in front of the computer at a particular time. They use e-mails, thread
conferencing systems, online discussion boards, and/or video streams as online
interaction methods. In synchronous online learning settings, some or all students have to
be online at the same time, and they all participate in online chat sessions, virtual
classroom meetings, or video conferences. Online course management systems, such as
Blackboard and WebCT, provide platforms for instructors to design and organize online
courses as well as for students to manage their online learning (Bourne, 1998).
Course Outcomes
With the improvement of web-based technology, online learning has become an
increasing educational trend (Arbaugh, 2000; Jung & Rha, 2000; Arbaugh & Duray, 2002;
Kim, 2004; Lim et al., 2006). Frick, Chadha, Watson, Wang, and Green (2009) pointed at
that a course is an instructional product. Therefore, with the increasing number of
web-based courses offered in the market, how to choose effective and satisfactory online
courses has become an important issue (Mark et al., 2005). Kirkpatrick and Kirkpatrick
(1994) stated that four levels of evaluation can be applied to a training program: (1)
18
learner’s satisfaction, (2) learning, (3) transfer the learning to the learner’s job, and (4)
overall impact on the learner’s organization. These criteria have been widely used in
non-formal educational settings (Frick et al., 2009). Frick et al. used the first two criteria,
satisfaction and performance, as the indices for evaluating the overall teaching and
learning quality in college courses. They found that students’ satisfaction and perceived
learning were strongly correlated with the global course ratings.
Similarly, Lim et al. (2006) also recommended that course outcomes can be an index
for evaluating the overall quality of distance learning programs. Course outcomes include
both cognitive and affective variables (Paechter et al., 2010). Among the cognitive
variables, learning achievement is the most important one, whereas course satisfaction is
the important affective variable (Lim et a. 2006; Paechter et al., 2010).
Previous research suggested that students’ satisfaction toward the online courses was
correlated with the probability of persistence and dropouts in online learning (Arbaugh,
2000; Billings, 2000; Levy, 2007; Thurmond et al., 2002). It is also a key component
which leads students to success in learning (Biner, Dean & Mellinger, 1994; American
Psychological Association, 1997; Chang & Smith, 2008; Mark et al., 2005). When
students are more satisfied in their online course, they tend to earn higher grades
(Puzziferro, 2008).
Self-Regulated Learning
Motivation is correlated with the course satisfaction and achievement (Lim et al.,
2006). It is also considered as one of the best determining factors of academic success
( Yukselturk & Bulut, 2007). In addition, it is also a significant factor in predicting the
19
performance in online learning settings (Sankaran & Bui, 2001; Lim et at., 2006).
Sankaran and Bui (2001) compared the relationship between students’ motivation,
learning strategy and performance in Web-based and lecture courses. They developed a
Learning Strategy and Motivation Survey as their measure. One hundred and sixteen
undergraduate students who enrolled in a business computer course participated in this
study. Forty-six students were enrolled in the Web format, and 70 of them took the course
via traditional format. A series of t-test were used to compare the test scores by
motivation levels (deep learning, surface learning, and undirected learning), and by
motivation levels (low, moderate, and high motivation). Their results indicated that there
were no performance differences in different learning strategies between the students who
took web course and those who took traditional course. However, the relationship
between students’ motivation levels and performance was stronger in web-based courses
than in lecture courses, with statistically significant positive results. In addition, they also
found that the higher motivation led to greater learning gains. Lim et al. (2006) examined
the relationships between course outcomes and students’ learning motivation in an online
learning setting. The stepwise regression results indicated that learning motivation was a
statistically significant factor in predicting course satisfaction and perceived learning.
While students’ learning motivation increased, the level of satisfaction and perceived
learning also increased.
Wijekumar, Ferguson, and Wagoner (2006) compared the differences between
traditional classroom and web-based learning environments. They suggested that
self-regulatory skills for working in a distance learning environment are very important
for students because of the special characteristics of online learning environment, such as
20
students being isolated from other students, delayed feedback from instructors…etc.
Yukselturk and Bulut (2007) analyzed different factors and their relationship with
success in online learning settings. These factors included demographic variables (gender,
age, and educational level), learning style, locus of control, motivational beliefs (such as
intrinsic/extrinsic goal orientations, control beliefs, task value, self-efficacy, and test
anxiety), and self-regulated learning components (such as cognitive strategy use,
self-regulation). They examined 80 volunteer students in two online courses, and found
that only self-regulation can statistically significantly predict students’ success in online
learning settings. They also interviewed the instructors in order to understand the
instructors’ view regarding students’ success in online learning settings. The instructors
reported that students who took responsibility and those who were more self-disciplined
and active in their learning are more likely to be successful in their online courses.
Whipp and Chiarelli (2004) interviewed six graduate students to determine if they
adopted any self-regulated learning strategies when they took online courses. They
analyzed the interview transcripts, students’ reflective journals, course documents, and
student Web pages. By applying Zimmerman’s three-phase cyclical model of
self-regulated learning, they found that these students used many self-regulated learning
strategies when taking online courses. They also modified the self-regulated learning
strategies that were used in traditional classes into a method in which they can be applied
in the web-based courses.
Winters, Greene and Costich (2008) analyzed 33 empirical and peer-reviewed
articles which were focused on examining the relationship between self-regulated
learning and academic learning in computer-based learning environments. They
21
concluded that students adapted self-regulated learning strategies in taking online courses.
In addition, students demonstrating high achievement or more learning gain tended to use
more self-regulated learning strategies than those who exhibited lower achievement and
less learning gain.
Self-Regulated Learning Theories
Zimmerman (1990) pointed out three features of self-regulated learning: (a)
self-regulation processes and the strategies are applied to optimize these processes; (b) it
is a “self-oriented feedback” loop; and (c) learning and motivation are interdependent
motivational processes. Based on these features, Pintrich in 2000 defined “self-regulated
learning is an active, constructive process whereby learners set goals for their learning
and then attempt to monitor, regulate, and control their cognition, motivation, and
behavior in the service of those goals, guided and constrained by both personal
characteristics and the contextual features in the environment” (Printrich & Zusho, 2002,
pp. 250). In other words, self-regulated students are metacognitively, motivationally, and
behaviorally active participants in their own learning process to reach their learning goals
(Zimmerman, 2001).
Self-regulated learning theories assume that students can personally improve their
ability to learn through selective use of metacognitive and motivational strategies. They
also can proactively select, structure, and even create advantageous learning
environments. In addition, self-regulated learners can play a significant role in choosing
the form and amount of instruction they need (Zimmerman, 2001). Zimmerman
developed a conceptual framework for the dimensions of self-regulation (Table 2). He
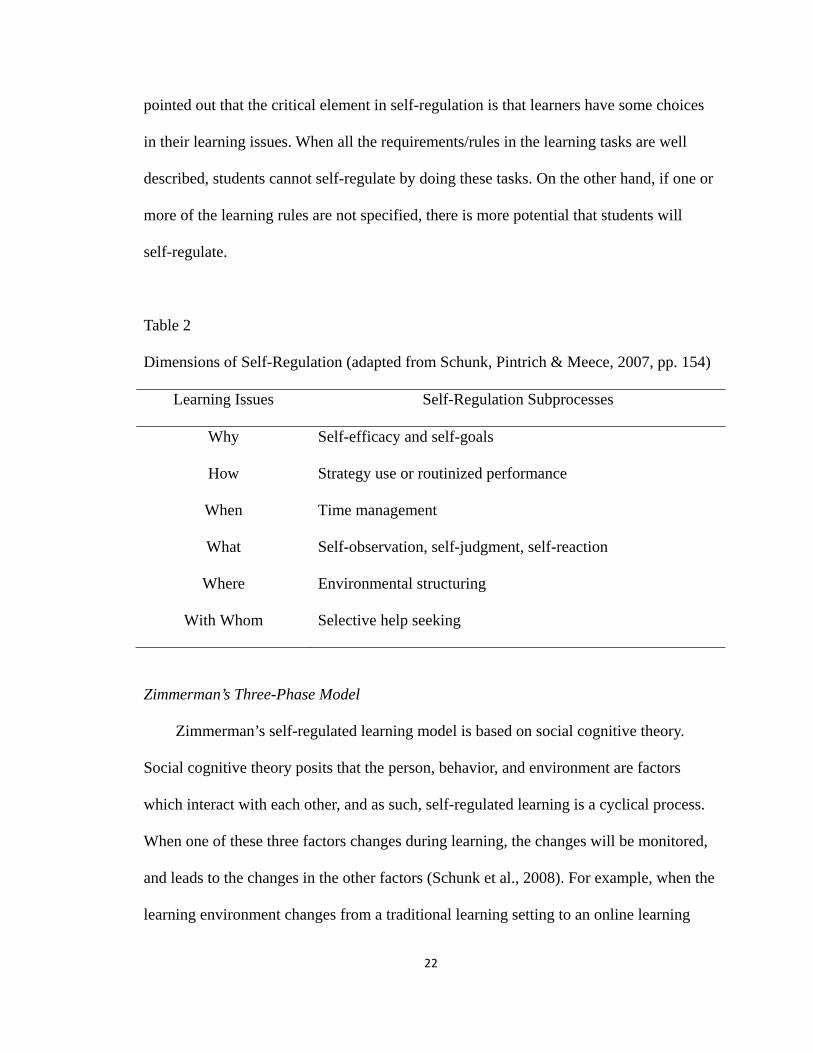
22
pointed out that the critical element in self-regulation is that learners have some choices
in their learning issues. When all the requirements/rules in the learning tasks are well
described, students cannot self-regulate by doing these tasks. On the other hand, if one or
more of the learning rules are not specified, there is more potential that students will
self-regulate.
Table 2
Dimensions of Self-Regulation (adapted from Schunk, Pintrich & Meece, 2007, pp. 154)
Learning Issues Self-Regulation Subprocesses
Why Self-efficacy and self-goals
How Strategy use or routinized performance
When Time management
What Self-observation, self-judgment, self-reaction
Where Environmental structuring
With Whom Selective help seeking
Zimmerman’s Three-Phase Model
Zimmerman’s self-regulated learning model is based on social cognitive theory.
Social cognitive theory posits that the person, behavior, and environment are factors
which interact with each other, and as such, self-regulated learning is a cyclical process.
When one of these three factors changes during learning, the changes will be monitored,
and leads to the changes in the other factors (Schunk et al., 2008). For example, when the
learning environment changes from a traditional learning setting to an online learning
23
setting, students’ learning strategies, cognitions, affects, and behaviors will be changed in
order to adjust the change in the environment.
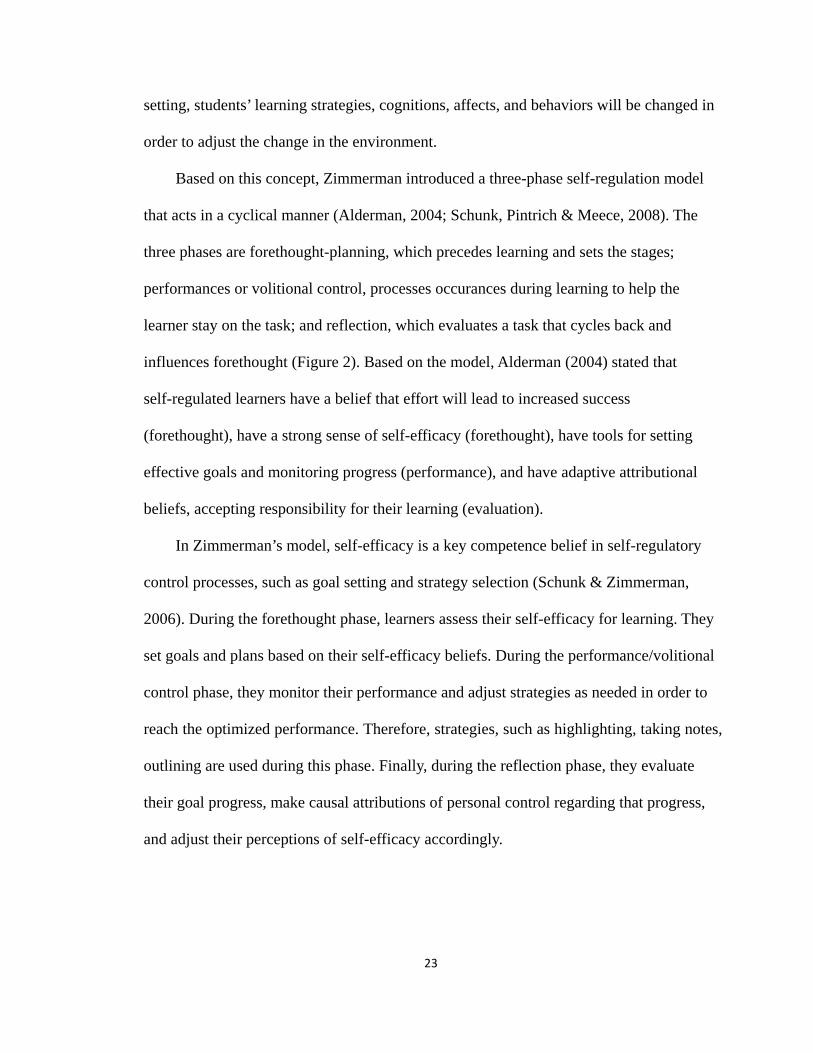
Based on this concept, Zimmerman introduced a three-phase self-regulation model
that acts in a cyclical manner (Alderman, 2004; Schunk, Pintrich & Meece, 2008). The
three phases are forethought-planning, which precedes learning and sets the stages;
performances or volitional control, processes occurances during learning to help the
learner stay on the task; and reflection, which evaluates a task that cycles back and
influences forethought (Figure 2). Based on the model, Alderman (2004) stated that
self-regulated learners have a belief that effort will lead to increased success
(forethought), have a strong sense of self-efficacy (forethought), have tools for setting
effective goals and monitoring progress (performance), and have adaptive attributional
beliefs, accepting responsibility for their learning (evaluation).
In Zimmerman’s model, self-efficacy is a key competence belief in self-regulatory
control processes, such as goal setting and strategy selection (Schunk & Zimmerman,
2006). During the forethought phase, learners assess their self-efficacy for learning. They
set goals and plans based on their self-efficacy beliefs. During the performance/volitional
control phase, they monitor their performance and adjust strategies as needed in order to
reach the optimized performance. Therefore, strategies, such as highlighting, taking notes,
outlining are used during this phase. Finally, during the reflection phase, they evaluate
their goal progress, make causal attributions of personal control regarding that progress,
and adjust their perceptions of self-efficacy accordingly.
24
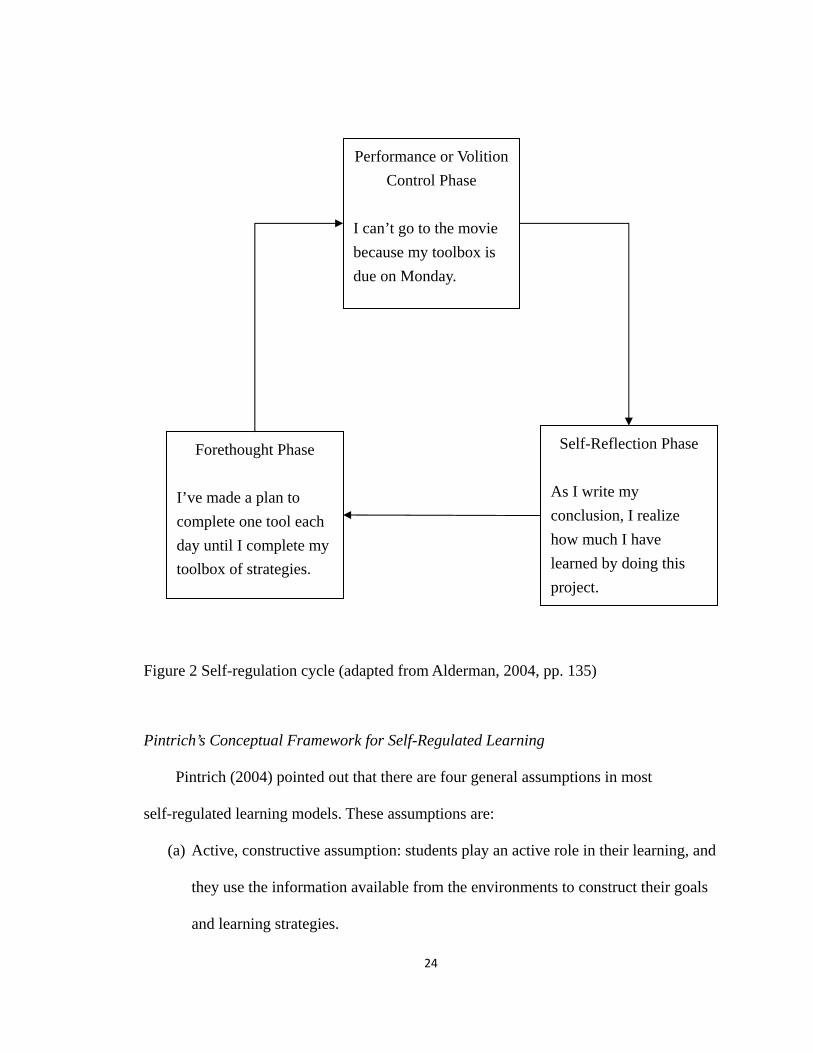
Figure 2 Self-regulation cycle (adapted from Alderman, 2004, pp. 135)
Pintrich’s Conceptual Framework for Self-Regulated Learning
Pintrich (2004) pointed out that there are four general assumptions in most
self-regulated learning models. These assumptions are:
(a) Active, constructive assumption: students play an active role in their learning, and
they use the information available from the environments to construct their goals
and learning strategies.
Performance or Volition Control Phase
I can’t go to the movie because my toolbox is due on Monday.
Forethought Phase I’ve made a plan to complete one tool each day until I complete my toolbox of strategies.
Self-Reflection Phase As I write my conclusion, I realize how much I have learned by doing this project.
25
(b) Potential for control assumption: students can monitor, control, and regulate their
cognition, motivation, and behaviors.
(c) Goal, criterion, or standard assumption: students have some type of goals, criteria,
or standards with which they can assess their learning progress.
(d) Self-regulatory activities are mediators between personal and contextual
characteristics and actual achievement or performance.
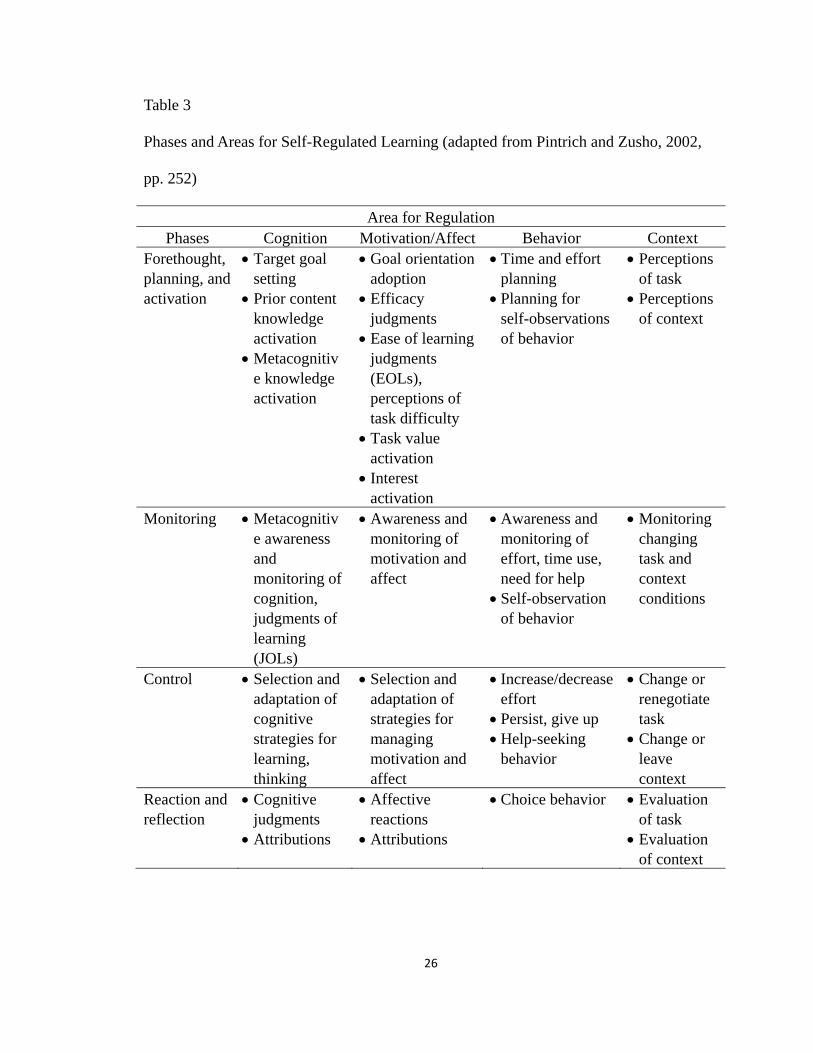
Based on these assumptions, Pintrich and Zusho (2002) represented a four-phase
self-regulated learning model. These phases include: (a) forethought, planning, and
activation; (b) monitoring; (c) control; and (d) reaction and reflection. They claimed that
these phases represented a general time-ordered sequence in which an individual
processes his/her task. However, there was no strong assumption that these phases are
hierarchically or linearly structured. The first phase involves planning and goal setting as
well as activation of perceptions and knowledge of the task and context and the self in
relation to the task. The second phase focused on different monitoring processes that
represent metacognitive awareness of different aspects of the self and task or context. In
phase three, the efforts to control and regulate different aspects of the self or task and
context were emphasized. At the final phase, various kinds of reactions and reflections on
the self and the task or context were represented (see Table 3).
26
Table 3
Phases and Areas for Self-Regulated Learning (adapted from Pintrich and Zusho, 2002,
pp. 252)
Area for Regulation Phases Cognition Motivation/Affect Behavior Context
Forethought, planning, and activation
• Target goal setting
• Prior content knowledge activation
• Metacognitive knowledge activation
• Goal orientation adoption
• Efficacy judgments
• Ease of learning judgments (EOLs), perceptions of task difficulty
• Task value activation
• Interest activation
• Time and effort planning
• Planning for self-observations of behavior
• Perceptions of task
• Perceptions of context
Monitoring • Metacognitive awareness and monitoring of cognition, judgments of learning (JOLs)
• Awareness and monitoring of motivation and affect
• Awareness and monitoring of effort, time use, need for help
• Self-observation of behavior
• Monitoring changing task and context conditions
Control • Selection and adaptation of cognitive strategies for learning, thinking
• Selection and adaptation of strategies for managing motivation and affect
• Increase/decrease effort
• Persist, give up • Help-seeking
behavior
• Change or renegotiate task
• Change or leave context
Reaction and reflection
• Cognitive judgments
• Attributions
• Affective reactions
• Attributions
• Choice behavior • Evaluation of task
• Evaluation of context
27
Factors in Self-Regulated Learning
Both cognitive and motivation/affect factors are involved in self-regulated learning.
The cognitive factors include maturational/age-related and expertise/experience-related
factors (Pintrich & Zusho, 2002). For example, young children are less able to use their
cognitive resources as effectively or efficiently as older students because of the
developmental differences. Also, prior knowledge of a domain or a topic area is
positively associated with memory, learning, thinking, and problem solving (Pintrich &
Zusho, 2002). Students who are experts in a domain perform better on memory and
learning tasks than novices, whereas they are also more self-regulated. In addition,
metacognitive knowledge, including declarative knowledge about a person, a task, and
strategy variables that affect cognitive performance, also contributes to self-regulation.
Older students have much more metacognitive knowledge than younger children, thus,
are more self-regulated.
Efficacy-competence judgments, interest and value beliefs, and goal orientations are
motivational factors which could facilitate or constrain self-regulated learning.
Self-monitoring is an important component in self-regulation. By self-monitoring,
students will be able to judge their progress, their understanding, or their performance
(labeled judgments of learning, JOLs), and then, use this information to control and
regulate their learning behaviors to reduce the discrepancy between the goals and their
current states. These judgments of learning are similar to judgments of competence or
self-efficacy. Previous research has indicated that judgments of competence are positively
correlated with self-regulation and actual performance (Pintrich & Zusho, 2002).
Students who believe that they have the capabilities to perform or learn the task use
28
self-regulatory strategies much more frequently as well as do better on the task itself.
However, there are developmental and individual differences in the correlation of
self-efficacy and self-regulation. Young children who are usually more positive about
their capabilities are also unrealistic, and thus are less likely to see the need to regulate or
change their behaviors (Pintrich & Zusho, 2002). On the other hand, although older
students are more negative about their competence, they are more realistic about their
capabilities and willing to change their behaviors. In addition, students who
underestimate their actual competence are less self-regulated because of not having
adequate self-efficacy, whereas those who overestimate their capabilities are also less
self-regulated because they do not see the need to do so. Furthermore, students who hold
the entity theory of intelligence (intelligence is fixed and stable) may think self-regulation
is time consuming and the cost of adopting self-regulatory strategies are too high. In
contrast, students who hold the incremental theory of intelligence (intelligence is
changeable and malleable through effort and learning) can see the advantages of using
self-regulatory strategies in order to improve their skills, even if there are costs in terms
of time and effort.
Self-regulation is an effortful and time-consuming activity, and requires much of an
individual’s mental effort and commitment (Pintrich & Zusho, 2002). Therefore, students
who are personally interested in a task, or those who place high values on a task are more
likely to be self-regulated. In other words, high interest and high value beliefs lead
students to use more self-regulation learning strategies. Moreover, if students set their
learning goals as learning and improving (mastery-approach goals), then they are more
likely to use self-regulatory strategies, such as monitoring their performance and
29
attempting to control and regulate their learning. Also, if students set their learning goals
such as to outperform others (performance-approach goals), they are more likely to use
self-regulatory strategies because they need to involve themselves in the tasks of besting
others. On the other hand, if students set their learning goals as avoiding looking
incompetence (performance-avoidance goals), they are less engaged in tasks and
demostrate less self-regulation.
To conclude, students who can regulate their own cognition, motivation, behavior
and their environment are more likely to be successful in academic setting. Further, older
students are more able to self-regulate than younger students, and self-regulatory
capabilities also increase as a student gains experience and expertise in doing a task. Both
cognitive and motivational factors can facilitate and constrain the development of
self-regulation in school contexts. In general, prior content knowledge, metacognitive
knowledge, high self-efficacy, high interests and value beliefs, and mastery-approach
goals lead individuals toward self-regulation.
Measurements for Self-Regulated Learning
Two tools in terms of measuring self-regulated learning have been used in previous
studies, Self-Regulated Learning Interview Schedule (SRLIS; Zimmerman &
Martinez-Pons, 1986) and Motivation Strategies for Learning Questionnaire (MLSQ;
Pintrich, Smith, Garcia & McKeachie, 1993).
(1) Self-Regulated Learning Interview Schedule (SRLIS)
Zimmerman and Martinez-Pons (1986) developed Self-Regulated Learning
Interview Schedule (SRLIS) in order to compare the degrees of using
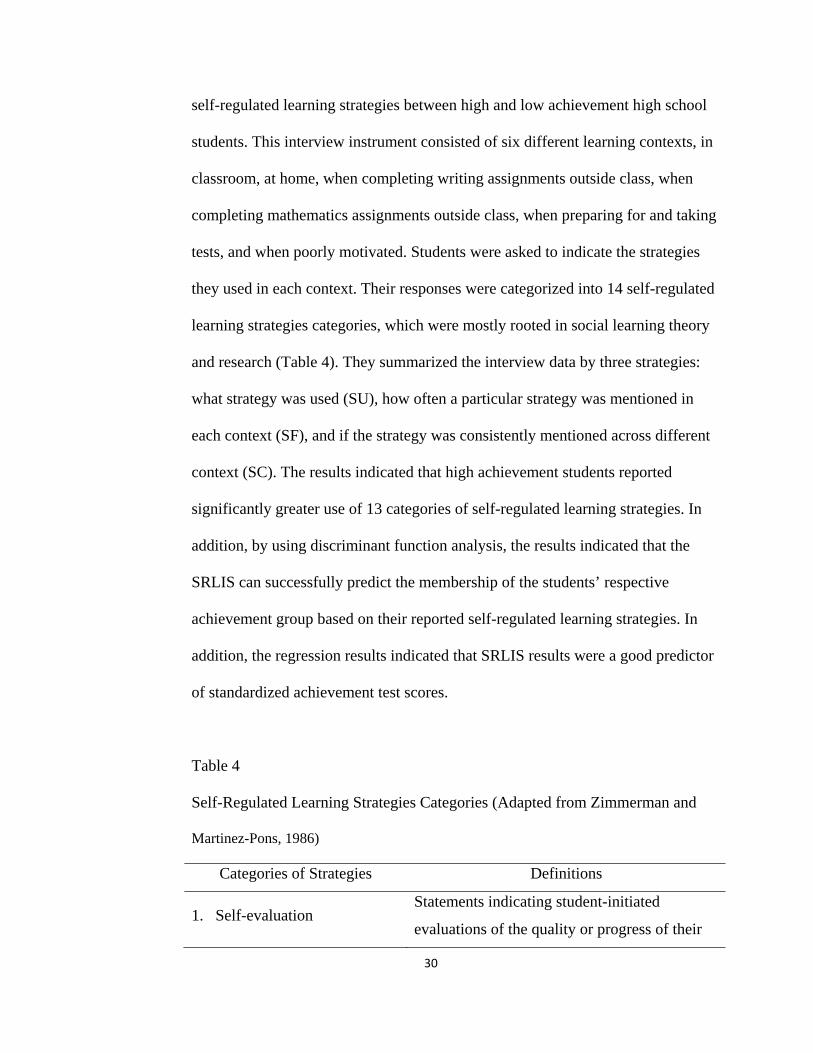
30
self-regulated learning strategies between high and low achievement high school
students. This interview instrument consisted of six different learning contexts, in
classroom, at home, when completing writing assignments outside class, when
completing mathematics assignments outside class, when preparing for and taking
tests, and when poorly motivated. Students were asked to indicate the strategies
they used in each context. Their responses were categorized into 14 self-regulated
learning strategies categories, which were mostly rooted in social learning theory
and research (Table 4). They summarized the interview data by three strategies:
what strategy was used (SU), how often a particular strategy was mentioned in
each context (SF), and if the strategy was consistently mentioned across different
context (SC). The results indicated that high achievement students reported
significantly greater use of 13 categories of self-regulated learning strategies. In
addition, by using discriminant function analysis, the results indicated that the
SRLIS can successfully predict the membership of the students’ respective
achievement group based on their reported self-regulated learning strategies. In
addition, the regression results indicated that SRLIS results were a good predictor
of standardized achievement test scores.
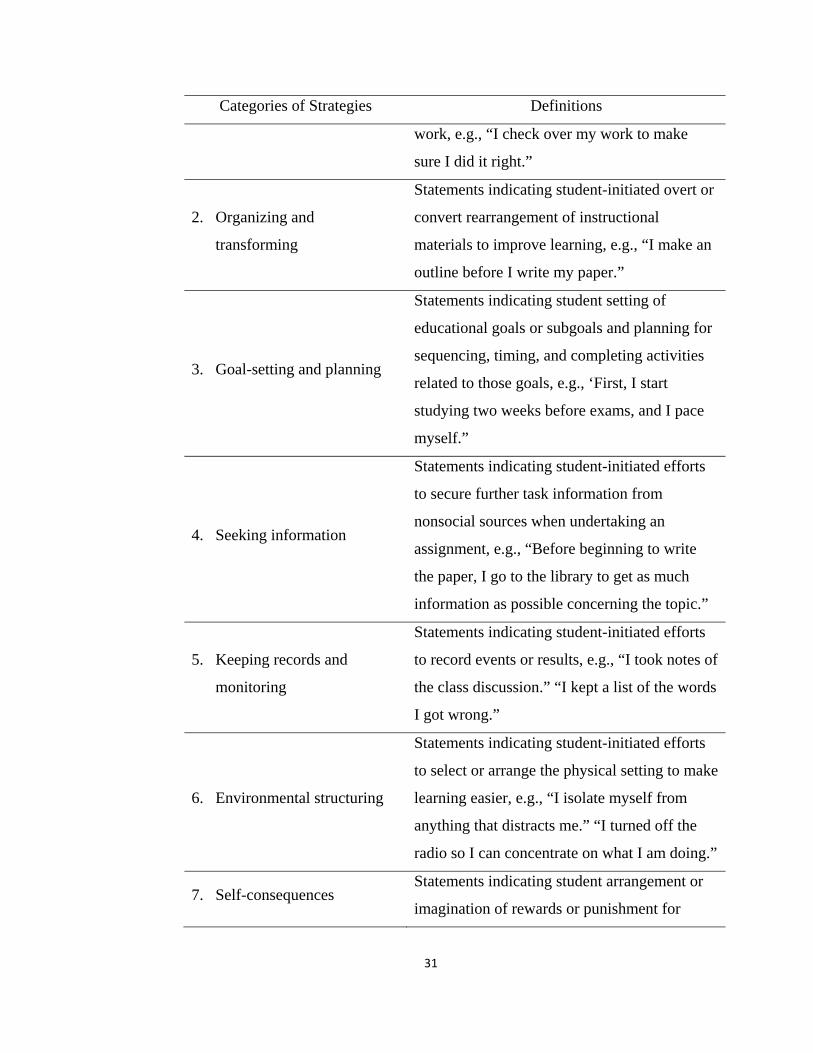
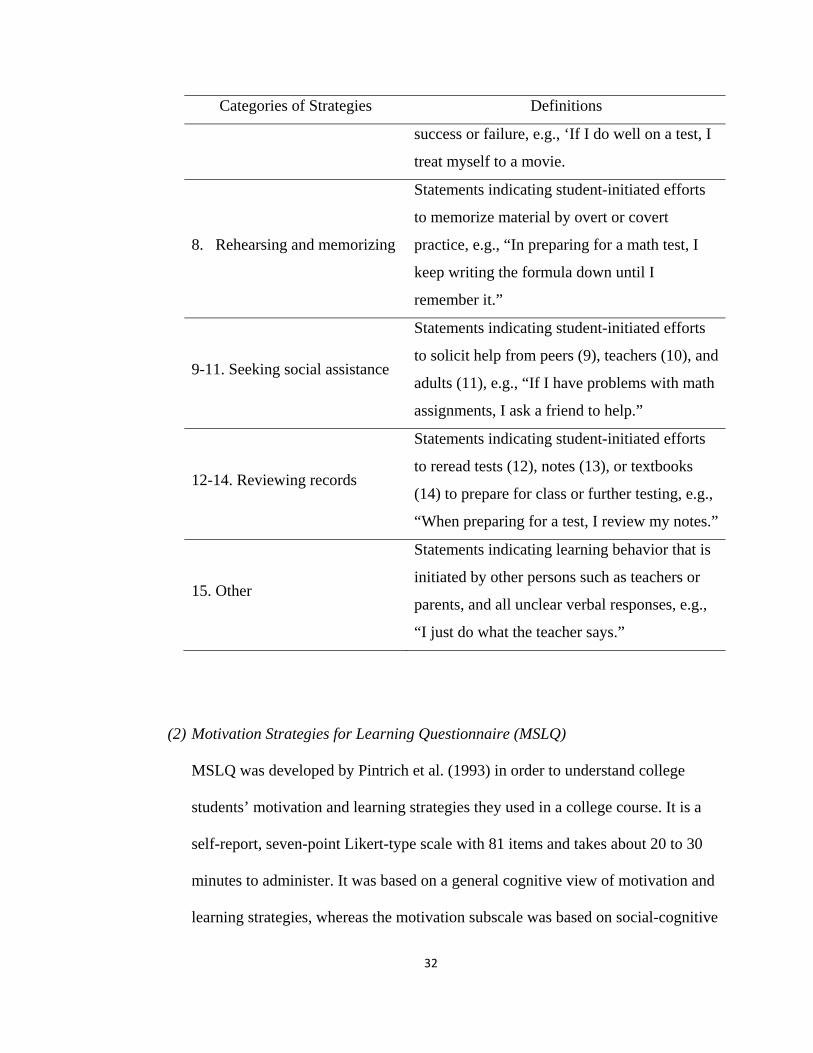
Table 4
Self-Regulated Learning Strategies Categories (Adapted from Zimmerman and
Martinez-Pons, 1986)
Categories of Strategies Definitions
1. Self-evaluation Statements indicating student-initiated
evaluations of the quality or progress of their
31
Categories of Strategies Definitions
work, e.g., “I check over my work to make
sure I did it right.”
2. Organizing and
transforming
Statements indicating student-initiated overt or
convert rearrangement of instructional
materials to improve learning, e.g., “I make an
outline before I write my paper.”
3. Goal-setting and planning
Statements indicating student setting of
educational goals or subgoals and planning for
sequencing, timing, and completing activities
related to those goals, e.g., ‘First, I start
studying two weeks before exams, and I pace
myself.”
4. Seeking information
Statements indicating student-initiated efforts
to secure further task information from
nonsocial sources when undertaking an
assignment, e.g., “Before beginning to write
the paper, I go to the library to get as much
information as possible concerning the topic.”
5. Keeping records and
monitoring
Statements indicating student-initiated efforts
to record events or results, e.g., “I took notes of
the class discussion.” “I kept a list of the words
I got wrong.”
6. Environmental structuring
Statements indicating student-initiated efforts
to select or arrange the physical setting to make
learning easier, e.g., “I isolate myself from
anything that distracts me.” “I turned off the
radio so I can concentrate on what I am doing.”
7. Self-consequences Statements indicating student arrangement or
imagination of rewards or punishment for
32
Categories of Strategies Definitions
success or failure, e.g., ‘If I do well on a test, I
treat myself to a movie.
8. Rehearsing and memorizing
Statements indicating student-initiated efforts
to memorize material by overt or covert
practice, e.g., “In preparing for a math test, I
keep writing the formula down until I
remember it.”
9-11. Seeking social assistance
Statements indicating student-initiated efforts
to solicit help from peers (9), teachers (10), and
adults (11), e.g., “If I have problems with math
assignments, I ask a friend to help.”
12-14. Reviewing records
Statements indicating student-initiated efforts
to reread tests (12), notes (13), or textbooks
(14) to prepare for class or further testing, e.g.,
“When preparing for a test, I review my notes.”
15. Other
Statements indicating learning behavior that is
initiated by other persons such as teachers or
parents, and all unclear verbal responses, e.g.,
“I just do what the teacher says.”
(2) Motivation Strategies for Learning Questionnaire (MSLQ)
MSLQ was developed by Pintrich et al. (1993) in order to understand college
students’ motivation and learning strategies they used in a college course. It is a
self-report, seven-point Likert-type scale with 81 items and takes about 20 to 30
minutes to administer. It was based on a general cognitive view of motivation and
learning strategies, whereas the motivation subscale was based on social-cognitive
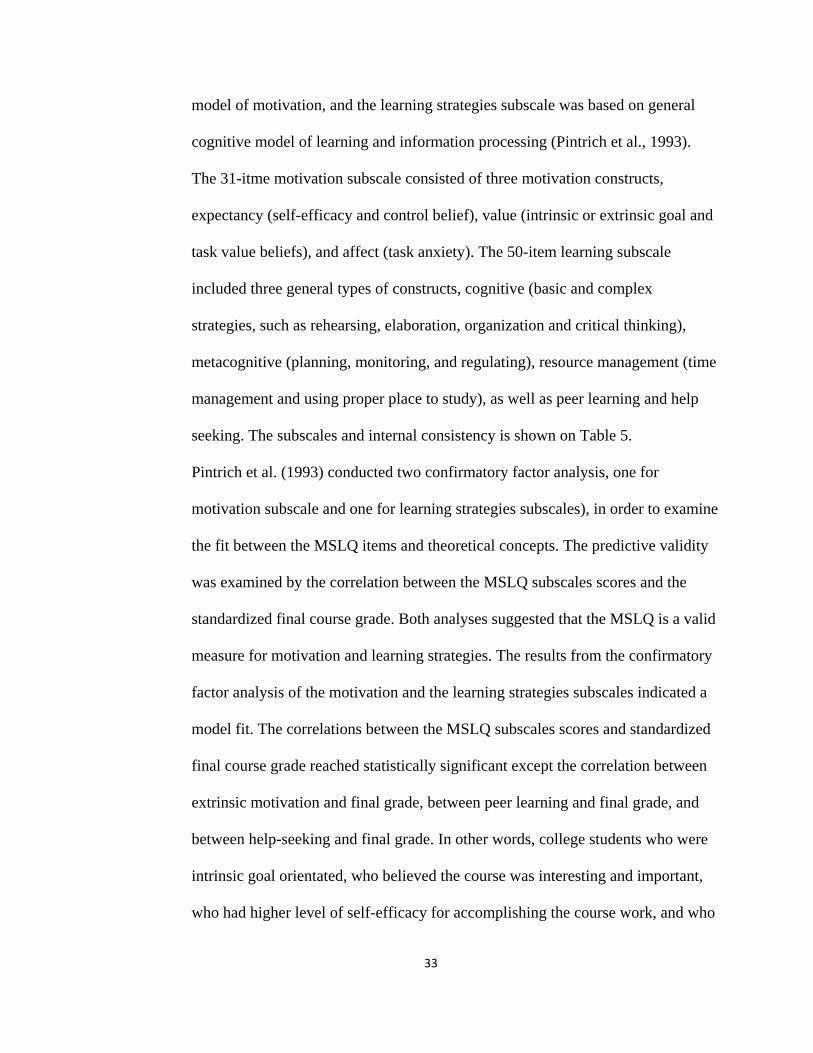
33
model of motivation, and the learning strategies subscale was based on general
cognitive model of learning and information processing (Pintrich et al., 1993).
The 31-itme motivation subscale consisted of three motivation constructs,
expectancy (self-efficacy and control belief), value (intrinsic or extrinsic goal and
task value beliefs), and affect (task anxiety). The 50-item learning subscale
included three general types of constructs, cognitive (basic and complex
strategies, such as rehearsing, elaboration, organization and critical thinking),
metacognitive (planning, monitoring, and regulating), resource management (time
management and using proper place to study), as well as peer learning and help
seeking. The subscales and internal consistency is shown on Table 5.
Pintrich et al. (1993) conducted two confirmatory factor analysis, one for
motivation subscale and one for learning strategies subscales), in order to examine
the fit between the MSLQ items and theoretical concepts. The predictive validity
was examined by the correlation between the MSLQ subscales scores and the
standardized final course grade. Both analyses suggested that the MSLQ is a valid
measure for motivation and learning strategies. The results from the confirmatory
factor analysis of the motivation and the learning strategies subscales indicated a
model fit. The correlations between the MSLQ subscales scores and standardized
final course grade reached statistically significant except the correlation between
extrinsic motivation and final grade, between peer learning and final grade, and
between help-seeking and final grade. In other words, college students who were
intrinsic goal orientated, who believed the course was interesting and important,
who had higher level of self-efficacy for accomplishing the course work, and who
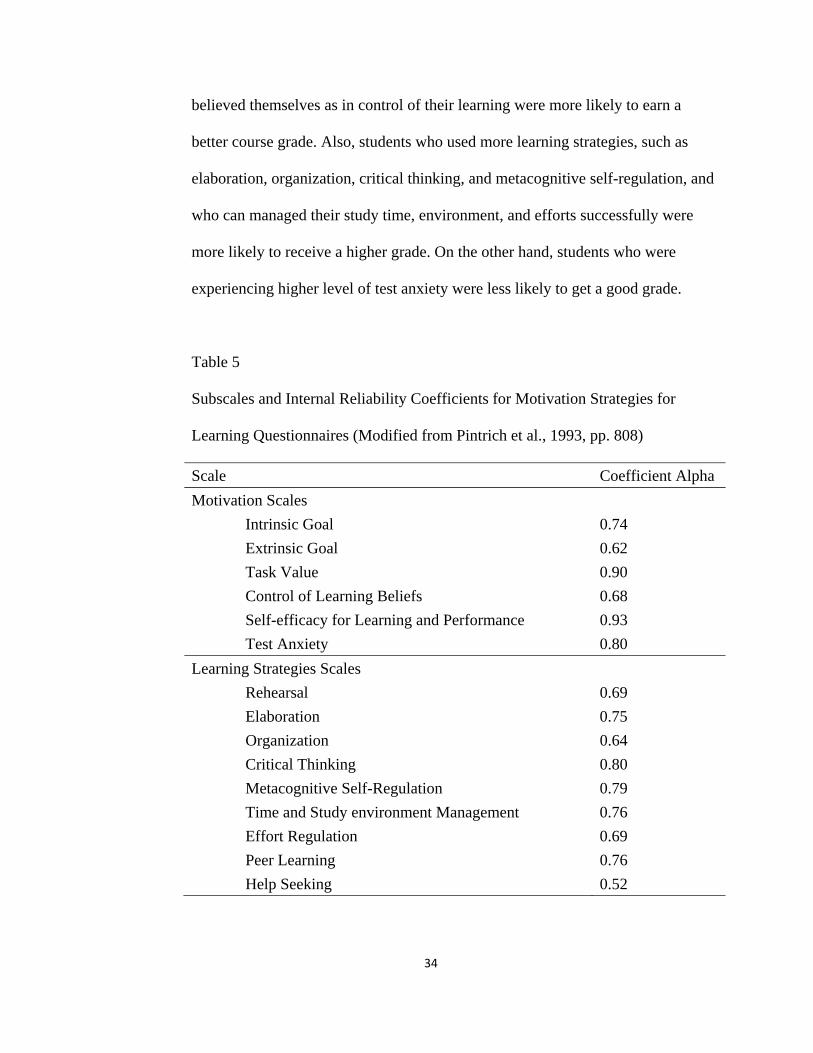
34
believed themselves as in control of their learning were more likely to earn a
better course grade. Also, students who used more learning strategies, such as
elaboration, organization, critical thinking, and metacognitive self-regulation, and
who can managed their study time, environment, and efforts successfully were
more likely to receive a higher grade. On the other hand, students who were
experiencing higher level of test anxiety were less likely to get a good grade.
Table 5
Subscales and Internal Reliability Coefficients for Motivation Strategies for
Learning Questionnaires (Modified from Pintrich et al., 1993, pp. 808)
Scale Coefficient Alpha Motivation Scales
Intrinsic Goal 0.74 Extrinsic Goal 0.62 Task Value 0.90 Control of Learning Beliefs 0.68 Self-efficacy for Learning and Performance 0.93 Test Anxiety 0.80
Learning Strategies Scales Rehearsal 0.69 Elaboration 0.75 Organization 0.64 Critical Thinking 0.80 Metacognitive Self-Regulation 0.79 Time and Study environment Management 0.76 Effort Regulation 0.69 Peer Learning 0.76 Help Seeking 0.52
35
Self-Regulated Learning in Traditional Learning Settings
Early research in self-regulated learning focused on traditional learning settings.
Previous researchers have studied the connection and the relationship between personal
characteristics, self-regulated learning and academic achievement (Pintrich & DeGroot,
1990; Zimmerman, Martinez-Pons, 1990).
Zimmerman and Martinez-Pons (1986) found that high achieving students
demonstrated a higher level of use of self-regulated learning strategies than low achieving
students did. Further, they also found that self-regulated learning was the positively factor
in predicting the standardized test performance. In addition to the evidence provided by
this research, Zimmerman and Martinez-Pons (1988) conducted a similar research in
order to construct validation of their self-regulated learning strategy model. A total of
eighty high school students, 44 males and 36 females, were interviewed regarding their
self-regulated learning strategies used under six different learning contexts, remembering
learning materials, writing papers, completing math assignments, preparing in class tests,
completing homework, and improving study at home. They also developed a teacher
scale to rate the students’ self-regulated learning outcomes. The results indicated that
students’ performance on a standardized achievement test was correlated with some
self-regulated learning strategies.
In 1990, they compared gender and grade difference in mathematics and verbal
academic self-efficacy, and self-regulated learning between gifted and regular students by
using an adapted version of the Self-Regulated Learning Interview Schedule. Ninety
students, including 45 boys and 45 girls, and 30 5th grade, 30 8th grade, and 30 11th grade
students participated in this study. The Self-Regulated Learning Interview Schedule
36
included eight different learning contexts, in classroom situations, when completing
writing assignments, when completing mathematics assignments, when checking science
or English homework, when preparing for a test, when taking a test, when poorly
motivated to complete homework, and when studying at home. Fourteen categories of
self-regulated learning strategies were assessed. They found that gifted students had
higher levels of self-efficacy in verbal and math. In addition, they had higher levels of
self-regulation and more effectiveness learning strategies. Furthermore, they also found
that students’ perception of self-efficacy was related to self-regulated learning strategies.
Zimmerman, Bandura, and Martinez-Pons (1992) generated a causal model of
student self-motivation, and used path analysis to examine the casual relationship among
self-efficacy, goal setting and academic achievement. One hundred and sixteen ninth and
tenth graders participated in this study. Self-efficacy for self-regulated learning and
self-efficacy for academic achievement, participants’ grade goals and their parents’ grade
goal were measured. The results indicated that there were positive correlations between
the self-efficacy for self-regulated learning and self-efficacy for academic achievement,
between self-efficacy for academic achievement and students’ grade goals, between
parents’ grade goals and students’ grade goals, and students’ grade goals and their final
grades. The result from path analysis indicated that students’ higher level of self-efficacy
in self-regulated learning led to a higher level of self-efficacy in academic achievement,
which then resulted in a better grade.
Pintrich and DeGroot (1990) examined the relationship between motivation
orientation, self-regulated learning, and classroom performance (seatwork, exams/quizzes,
and essays/report). One hundred and seventy-three seventh grade students participated in

37
this study. They created an early version of self-report Motivated Strategies for Learning
Questionnaire (MSLQ). The motivation components included intrinsic value,
self-efficacy, and test anxiety, while the self-regulated learning components consisted of
strategy use and self-regulation. Based on the results, they found that motivation was
statistically significant correlated with self-regulated learning. In addition, self-efficacy
and self-regulation had stronger correlation with the classroom performance than the
other variables did. Finally, the regression analysis results indicated that self-regulated
learning, self-efficacy, and test anxiety were predictors of performance.
Garcia and Pintrich (1991) tried to develop a structural model to explain the
relationship among intrinsic motivation, self-efficacy, and self-regulated learning. The
sample was 367 college students. They used the Motivation Strategies for Learning
Questionnaire (MSLQ) as their measures. Participants’ levels of intrinsic motivation,
levels of self-efficacy, and self-regulated learning were measured at the beginning of the
semester and at the end of the semester. Based on the structural equation modeling results,
they found that intrinsic motivation had strong effect on self-regulated learning and on
self-efficacy. In addition, self-efficacy had strong effects on self-regulated learning.
Rao, Moely and Sachs (2000) investigated the relationship between cognitive and
motivational variables and the math performance in low-, average-, and high-achieving
students in Hong Kong. There students were measured by a Chinese version of MSLQ
and a mathematics motivation questionnaire when they were 10 years old and 11 years
old. They found that the levels of intrinsic motivation of low-achieving students
decreased over time, and they also reported a greater level of test anxiety. However, there
was no difference in self-regulated learning strategies used between low-achieving and
38
high-achieving students. In other words, they could not link the relationship between
self-regulated learning strategies with math performance. Their research results did not
support previous or later researches.
Clarke (2007) used MSLQ to examine the relationship among motivation, learning
strategies, and undergraduate students’ math performance. Three hundred and forty-seven
undergraduate students participated in this study. The MSLQ was used to investigate the
difference between students in foundational math classes and those in advanced math
classes. She found that students in advanced level math class (Calculus) had higher levels
of motivation and task values than those in basic level math class. Also, female students
reported a higher level of effort and test anxiety while they also reported a lower level of
self-efficacy by comparing than male students.
Self-Regulated Learning as the Mediator in Online Learning Settings
Pintrich (2004) pointed that one of the general assumptions for self-regulated
learning is that self-regulated learning is the mediator between personal or contextual
characteristics and academic performance. Previous research have tried to link the
relationship between personal characteristics and self-regulated learning, and the
relationship between self-regulated learning and course outcomes. However, there is no
research that examine these variables simultaneously. Although research results indicated
that there were statistically significant relationships between self-regulated learning and
course outcomes (Artino, 2009; Artino & McCoach, 2008; Paechter et al., 2010;
Puzziferro, 2008; Yukselturk & Bulut, 2007), research results addressing the relationship
between personal characteristics and self-regulated learning were not consistent. Some
39
research results indicated there was no statistically significant relationship between
personal characteristics and self-regulated learning (Yukselturk & Bulut, 2009), while
other research indicated that there were statistically significant relationships (Lim et al.,
2006).
For example, Artino (2009) tried to link the relationship between personal factors
and academic success in an online course. He had 481 undergraduate students in the
military academy complete a survey that included the measures of self-efficacy, task
value, self-regulated learning strategies (elaboration and metacognition), course
satisfaction, and continuing motivation to enroll in future online courses. The regression
data analysis results indicated that task value was the strongest positive predictor of
self-regulated learning strategies and the motivation in continuing online courses, while
self-efficacy was the moderately strong positive predictor of satisfaction.
Puzziferro (2008) examined the relationship among online technologies
self-efficacy, self-regulated learning, and final grade and course satisfaction in college
level online courses. Eight hundred and fifteen college students participated in this study.
A series of one-way ANOVAs were used to answer the research questions. After
analyzing responses, the results indicated that technology self-efficacy is not a
statistically significant factor in terms of predicting students’ final grades. On the other
hand, self-regulated learning was positively correlated with final grades. Also, students’
learning strategies were statistically significantly positively correlated with satisfaction.
Similarly, Paechter et al. (2010) conducted a nationwide research examining the
relationship between factors that contributed to learning achievement and course
satisfaction. Two thousand one hundred and ninety-six students from 29 universities in
40
Austria participated in this study. Based on the regression results, they found that
self-regulation was a positive predictor of learning achievement.
Yukselturk and Bulut (2009) conducted research to determine if there were gender
differences in self-regulated learning in online learning settings. The sample consisted of
145 participants. MLSQ was used as their measure to determine the self-regulated
learning components, the levels of motivation beliefs, and achievement. Based on the
regression results, they found that only test anxiety can statistically significantly predict
female students’ achievement, while self-efficacy for learning and performance, and task
value were the statistically significant predictors for male students’ achievement.
However, they were unable to find any gender differences in terms of the level of
self-regulated learning based on the MANOVA results.
Technology Self-Efficacy
According to Zimmerman’s model, self-efficacy is a key competence belief in
self-regulatory control processes, such as goal setting and strategy selection (Pintrich &
Schunk, 1996; Schunk & Zimmerman, 2006). The concept of self-efficacy was
introduced by Bandura (1977a). He defined perceived self-efficacy as personal judgments
of one’s capabilities to organize and execute courses of action to attain designated goals.
In other words, self-efficacy indicated the beliefs of the capabilities of what one can do in
a specific domain. Self-efficacy has an effect on task choice, effort, persistence and
achievement. It also influences academic motivation, learning, and achievement (Schunk,
& Pajares, 2002). From this point of view, students with positive self-efficacy regarding
the online courses they take usually have more motivation and better performance on
41
these courses.
In addition to the self-efficacy in the specific online course, the skills of using
online learning technologies are also important for students who enroll in online courses.
The major computer skills used include the use of E-mails, Internet search engines, chat
rooms, and databases. Students who fear computer technologies may experience
confusion, anxiety, a loss of personal control, frustration, and withdrawal (Bates, &
Khasawneh, 2004). However, previous researchers have found conflicting results
regarding the relationship between technology self-efficacy and students’ performance
and satisfaction with online courses.
Bates and Khasawneh (2004) generated a hypothesized model to examine the
relationship among previous success experiences with online learning technology, online
learning technology anxiety, online learning technology self-efficacy, instructor-provided
training, and motivation to use online learning technology. Two hundred and eighty-eight
college students participated in this study. The path analysis results indicated that both the
training provided by instructors and previous success experience with online learning
technologies can reduce the anxiety of online learning technologies, as well as increase
the online learning technology self-efficacy. Furthermore, online learning technology
self-efficacy will influence the motivation to use online learning technologies. In their
another study (2007), they considered online learning self-efficacy as a mediator variable
between antecedent variables, such as online learning anxiety, instructor feedback, and
training, and outcome variables, such as outcome expectations, mastery perceptions, and
hours per week spend on the online courses. They used the same sample, 288 college
students, and the hierarchical multiple regression results indicated that online learning

42
self-efficacy was a significant factor in predicting the outcome variables. Also, it was the
mediator between the antecedent variables and the outcome variables.
Joo et al. (2000) used 152 high school students as their sample and examined the
relationship among gender, self-efficacy for self-regulated learning, academic
self-efficacy, computer experiences, internet self-efficacy, and academic achievement in
web-based courses. One hundred and fifty-two Korean junior high school students
participated in this study. A path analysis revealed that students’ self-efficacy for
self-regulated learning was positively correlated with academic self-efficacy. However,
students’ academic achievement and internet self-efficacy were not the significant factors
in terms of predicting the performance. Also, Liu (2007) examined the relationship
among psychological readiness, technology self-efficacy, social readiness, and
performance in community college online courses. However, regression analysis results
indicated that technology self-efficacy was not a significant factor in predicting final
grades.
DeTure (2004) examined the students’ attributes to predict the academic success
in Web-based courses by using the Online Technology Self-Efficacy Scale (OTSES;
Miltiadou & Yu 2000). She analyzed the responses from 73 participants, and found that
technology self-efficacy was not a significant factor in terms of predicting students’ final
grade. Further, Wang and Newlin (2002) investigated the relationship between
technology self-efficacy and students’ performance in online courses. They found that
students with a higher level of technology self-efficacy tend to have higher final exam
grades. However, even though a higher level of technology self-efficacy was related to
the exam grades, it failed to predict the final grade at the end of the semester. Their
43
findings were also supported by Puzziferro (2008).
Course Outcomes and Students’ Characteristics
Some researchers have tried to establish relationship between students’
characteristics and previous online learning experience, and their satisfaction and
performance in online learning settings (Marks et al., 2005; Sanders & Morrison-Shetlar,
2001; Thurmond et al., 2002). However, they found that these variables cannot
consistently predict students’ performance and satisfaction with their online learning
experiences.
Paechter et al. (2010) tried to link the relationship among student’s expectations of
online courses, experience in taking online courses, perceived learning achievement, and
course satisfaction. Two thousand one hundred and ninety-six students with 62% females
and 37.4 % males participated in this research. Multivariate multiple regression analysis
results indicated that gender, age, or number of online courses taken could not
statistically significantly predict students’ performance in online courses. Also, students’
expectations can positively predict students’ achievement, while students’ motivation and
previous online learning experiences can positively predict both students’ achievement
and course satisfaction.
Arbaugh (2001) examined the relationship among the instructor immediacy behavior,
students’ satisfaction, and learning. He defined immediacy behavior as a nonverbal or
verbal communication behavior which can reduce social and psychological distance
between the instructor and the students, such as providing and inviting feedback, using
humor, eye contact…etc. In a web-based course, he pointed that the instructor can still
44
use humor, provide feedback, and encourage discussion to demonstrate the immediacy
behavior. He found that both the instructors’ immediacy variables and students’ attitudes
toward the course software were positively associated with course satisfaction. In
addition, numbers of previous internet courses have taken also a significant predictor in
predicting course satisfaction.
Marks et al. (2005) examined the relationship among gender, prior student
experience with online courses, student perceived learning and satisfaction. They
proposed a model in which students’ gender, and prior experience with online courses
were the antecedent variables, whereas perceived learning was the mediator, and
satisfaction was the outcome variable. Based on the structural equation modeling data
analysis results by LISREL, gender and prior experiences did not influence students’
perceived learning. Furthermore, they also found that students could not distinguish the
difference between perceived learning and satisfaction.
Lim et al. (2006) examined the relationships between course outcomes and learner
characteristics in an online learning setting. They used course satisfaction, learning gains,
and learning application as the operational variables for course outcomes, while gender,
age, distance learning experience, online learning preference over classroom, and work
status were used as the operational variables for learner characteristics. One hundred and
twenty-five students, including 39 males and 86 females, from a program evaluation
online course participated in this study. Based on the ANOVA analysis, there was no
gender difference in terms of students’ performance or course satisfaction. However,
students aged between 20 to 29 years had significantly higher scores in learning gains.
Students with more experience in taking online courses had higher levels of motivation

45
and higher course satisfaction than those students who had less experience in taking
online courses. As for the correlation analysis, they found that learning motivation was
moderately correlated with course satisfaction, and the regression analysis results
indicated that learning motivation can predict students’ learning gain.
Thurmond et al. (2002) examined the relationship between students’ satisfaction and
the online learning environment by controlling students’ gender and the number of prior
online courses have taken. They collected responses from 120 students and analyzed the
data through correlations and hierarchical regression analysis. The results indicated that
students’ satisfaction was affected by the online learning environmental factors. However,
gender and the number of prior online courses taken failed to predict students’
satisfaction.
Arbaugh (2000) tried to examine the effects of technological, pedagogical, and
students’ characteristics in internet-based online courses. Ninety-seven MBA students
participated in this study. He found that older and female students reported higher level
of perceived learning than younger or male students in online learning settings based on
the multiple regression analysis. In his another research in 2004, he found that the
degrees of students’ perceived learning was not changed by their prior experience in
taking online courses.
Yukselturk and Bulut (2007) also investigated gender differences in students’
success on Web-based courses. The regression results indicating that there were no
gender, age, educational level differences in predicting the achievement. In their another
study, Yukselturk and Bulut (2009) found that for female students, task value was a
negative factor in predicting students’ achievement, while for male students, self-efficacy
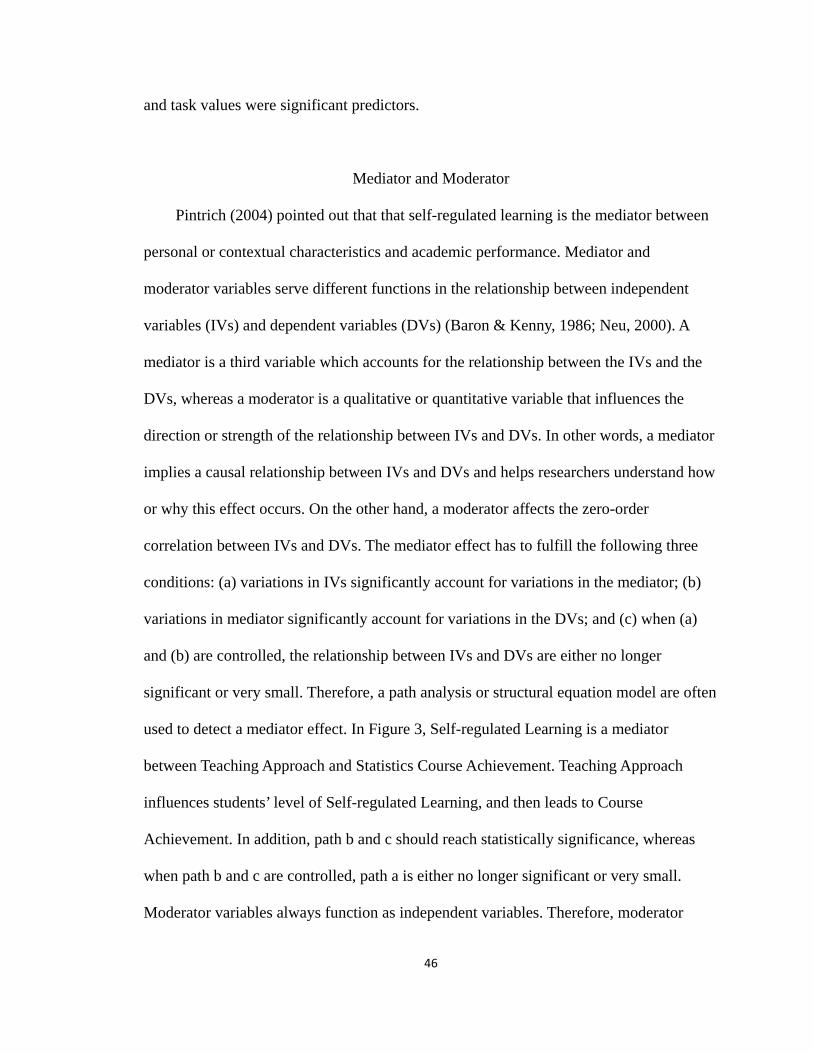
46
and task values were significant predictors.
Mediator and Moderator
Pintrich (2004) pointed out that that self-regulated learning is the mediator between
personal or contextual characteristics and academic performance. Mediator and
moderator variables serve different functions in the relationship between independent
variables (IVs) and dependent variables (DVs) (Baron & Kenny, 1986; Neu, 2000). A
mediator is a third variable which accounts for the relationship between the IVs and the
DVs, whereas a moderator is a qualitative or quantitative variable that influences the
direction or strength of the relationship between IVs and DVs. In other words, a mediator
implies a causal relationship between IVs and DVs and helps researchers understand how
or why this effect occurs. On the other hand, a moderator affects the zero-order
correlation between IVs and DVs. The mediator effect has to fulfill the following three
conditions: (a) variations in IVs significantly account for variations in the mediator; (b)
variations in mediator significantly account for variations in the DVs; and (c) when (a)
and (b) are controlled, the relationship between IVs and DVs are either no longer
significant or very small. Therefore, a path analysis or structural equation model are often
used to detect a mediator effect. In Figure 3, Self-regulated Learning is a mediator
between Teaching Approach and Statistics Course Achievement. Teaching Approach
influences students’ level of Self-regulated Learning, and then leads to Course
Achievement. In addition, path b and c should reach statistically significance, whereas
when path b and c are controlled, path a is either no longer significant or very small.
Moderator variables always function as independent variables. Therefore, moderator
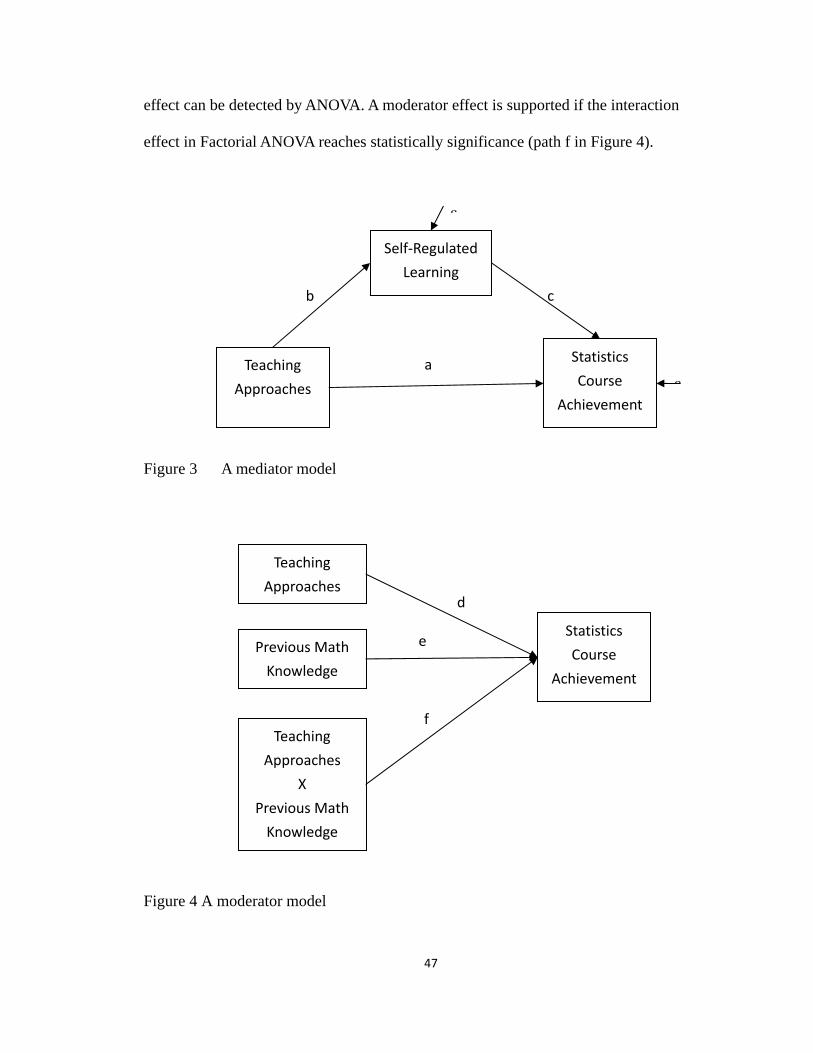
47
effect can be detected by ANOVA. A moderator effect is supported if the interaction
effect in Factorial ANOVA reaches statistically significance (path f in Figure 4).
Figure 3 A mediator model
Figure 4 A moderator model
Statistics
Course
Achievement
Teaching
Approaches
Previous Math
Knowledge
Teaching
Approaches
X
Previous Math
Knowledge
f
e
d
ε
ε
cb
Self‐Regulated
Learning
Statistics
Course
Achievement
Teaching
Approaches
a
48
Summary
In conclusion, with the increasing number of online courses offered in the market,
the quality of the online course and learning becomes an important concern. Previous
researchers suggested that course outcomes, including students’ performance and course
satisfaction, can be used as an evaluation criterion to examine the quality of online
courses. In addition, an online learning setting is different from a traditional classroom
setting. Students take more responsibility in their learning. Therefore, self-regulated
learning is an important factor related to students’ success in online learning settings.
Pintrich (2004) asserted that self-regulated learning is the mediator between personal or
contextual characteristics and academic performance. Previous research had linked the
relationship between students’ characteristics and self-regulated learning, and between
self-regulated learning with course outcomes in online learning settings. Furthermore,
students who take online courses need to feel comfortable in using online technology.
Therefore, in addition to students’ self-efficacy in accomplishing the online courses,
students should have higher level of technology self-efficacy in order to success in online
courses. However, previous research reported conflicting results in terms of the
relationship between students’ characteristics and technology self-efficacy, and between
the technology self-efficacy and course outcomes. However, no research examined these
factors simultaneously. In other words, no research really examined the mediator effect of
self-regulated learning and technology self-efficacy. Hence, the current research
generated a hypothesized model and intended to examine if this hypothesized model can
explain the relationship among students’ characteristics, self-regulated learning,
technology self-efficacy, and course outcomes.
49
III. METHOD
This chapter focused on the methods used in the current study. The purpose of
study is first stated, followed by participants, instrumentation, and data analysis technique.
Purpose of Study
The research problem addressed the needs to have an overall view of the
relationship among students’ characteristics and previous online learning experiences,
self-regulated learning, technology self-efficacy, and course outcomes to improve the
quality of online courses. Therefore, the purpose of current study is to determine the
relationship among students’ characteristics and previous experience in online learning,
self-regulated learning (motivation and learning strategies), technology self-efficacy, and
the course outcomes (course performance and course satisfaction). A hypothesized model
was generated based on previous studies (Figure 1 in Chapter I). More specific, the
current study is focused on the following research questions:
(1) Overall, can the hypothesized model explain the relationship among students’
characteristics and previous online learning experiences, self-regulated
learning (motivation and learning strategies), technology self-efficacy, and
course outcomes (achievement and course satisfaction) in online learning
settings?
50
(2) Do students’ characteristics and previous online learning experiences
influence self-regulated learning, technology self-efficacy, and course
outcomes (achievement, and satisfaction) in online learning settings?
(3) A. Does students’ self-regulated learning influence the course outcomes in
online learning settings?
B. Does students’ technology self-efficacy influence the course outcomes in
online learning settings?
C. Do students’ self-regulated learning and technology self-efficacy interact
with each other?
(4) Are self-regulated learning and technology self-efficacy mediators between
students’ characteristics, and the course outcomes?
Research Design
A non-experimental quantitative research designed with self-report survey
measures was used in this study. The reason was that the participants could not be
randomly assigned to different levels of motivation, self-efficacy, and different types of
learning strategies. All data were collected anonymously. The strength of this type of
research design is that the participants can truly present their experiences in online
learning settings without being concerned with social expectations. However, this
research design still has its weakness. Because of the self-report responses, the data are
vulnerable to reactivity, response bias, and response sets.
51
Participants
In examining the relationship among students’ characteristics and previous online
learning experiences, self-regulated learning, technology self-efficacy, and course
outcomes, the generalized population consists of students who enroll in online courses at
major universities or colleges in the United States. Based on the distance education
statistics (Parsad, Lewis & Tice, 2008), 9,803,000 undergraduates and 2,349,900
graduates enrolled in distance courses in 2007-2008 academic year. Assessable
population will be the undergraduate or graduate students who enrolled in online courses
in the state of Alabama. According to postsecondary education statistics, a total of
258,408 students enrolled in degree-granting institutions at Alabama State (NCES, 2008).
In the current study, participants were selected by cluster sampling method from
the students at Auburn University who enrolled in online courses during Fall, 2008,
Spring, 2009, Summer, 2009, and Fall, 2009. One hundred and thirty-nine online courses
were offered in Fall, 2008 with 1570 student enrollments, whereas 85 courses were
provided in Spring, 2009 with 879 enrollments. In Summer, 2009, the university offered
93 online courses with 1069 enrollments, while 171 online courses were offered in Fall,
2009, with 1909 student enrollments.
A total of 488 courses were included in current study with 2139 students enrolled
at least one online course. These students were invited to participate in the current
research, including 1164 graduate students (497 females and 667 males), and 975
undergraduate students (553 females and 422 males) who enrolled in at least one online
course.
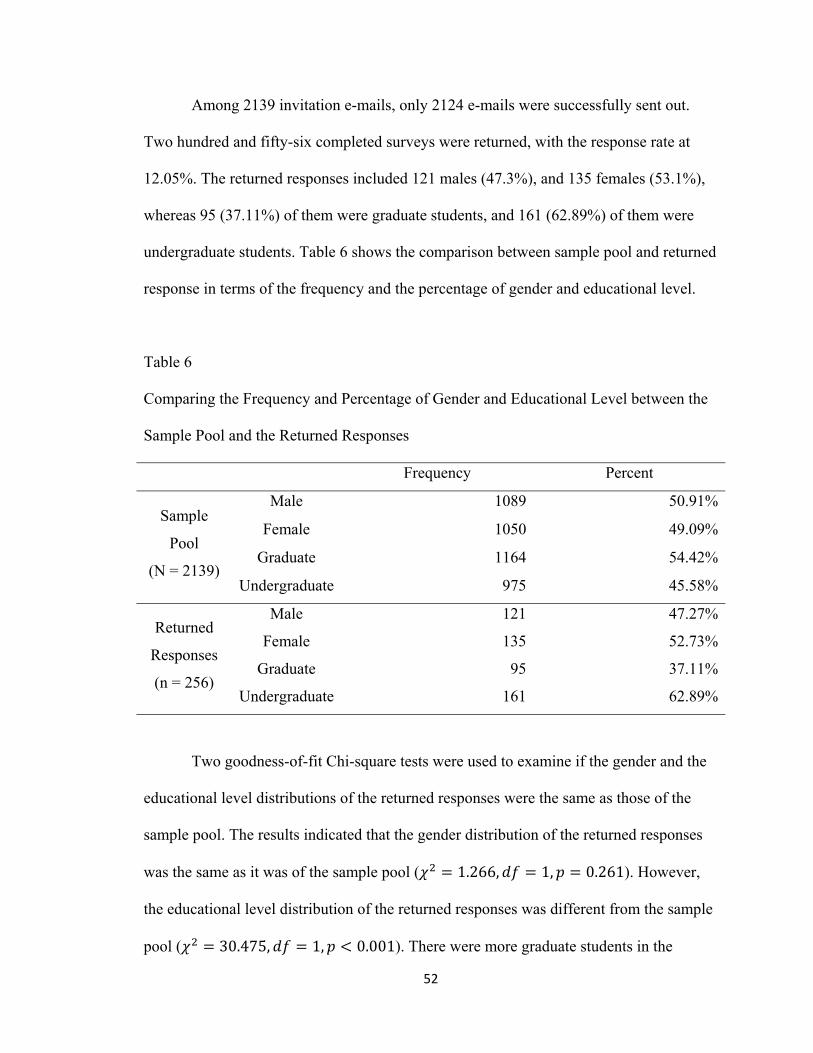
52
Among 2139 invitation e-mails, only 2124 e-mails were successfully sent out.
Two hundred and fifty-six completed surveys were returned, with the response rate at
12.05%. The returned responses included 121 males (47.3%), and 135 females (53.1%),
whereas 95 (37.11%) of them were graduate students, and 161 (62.89%) of them were
undergraduate students. Table 6 shows the comparison between sample pool and returned
response in terms of the frequency and the percentage of gender and educational level.
Table 6
Comparing the Frequency and Percentage of Gender and Educational Level between the
Sample Pool and the Returned Responses
Frequency Percent
Sample
Pool
(N = 2139)
Male 1089 50.91%
Female 1050 49.09%
Graduate 1164 54.42%
Undergraduate 975 45.58%
Returned
Responses
(n = 256)
Male 121 47.27%
Female 135 52.73%
Graduate 95 37.11%
Undergraduate 161 62.89%
Two goodness-of-fit Chi-square tests were used to examine if the gender and the
educational level distributions of the returned responses were the same as those of the
sample pool. The results indicated that the gender distribution of the returned responses
was the same as it was of the sample pool ( 1.266, 1, 0.261). However,
the educational level distribution of the returned responses was different from the sample
pool ( 30.475, 1, 0.001). There were more graduate students in the
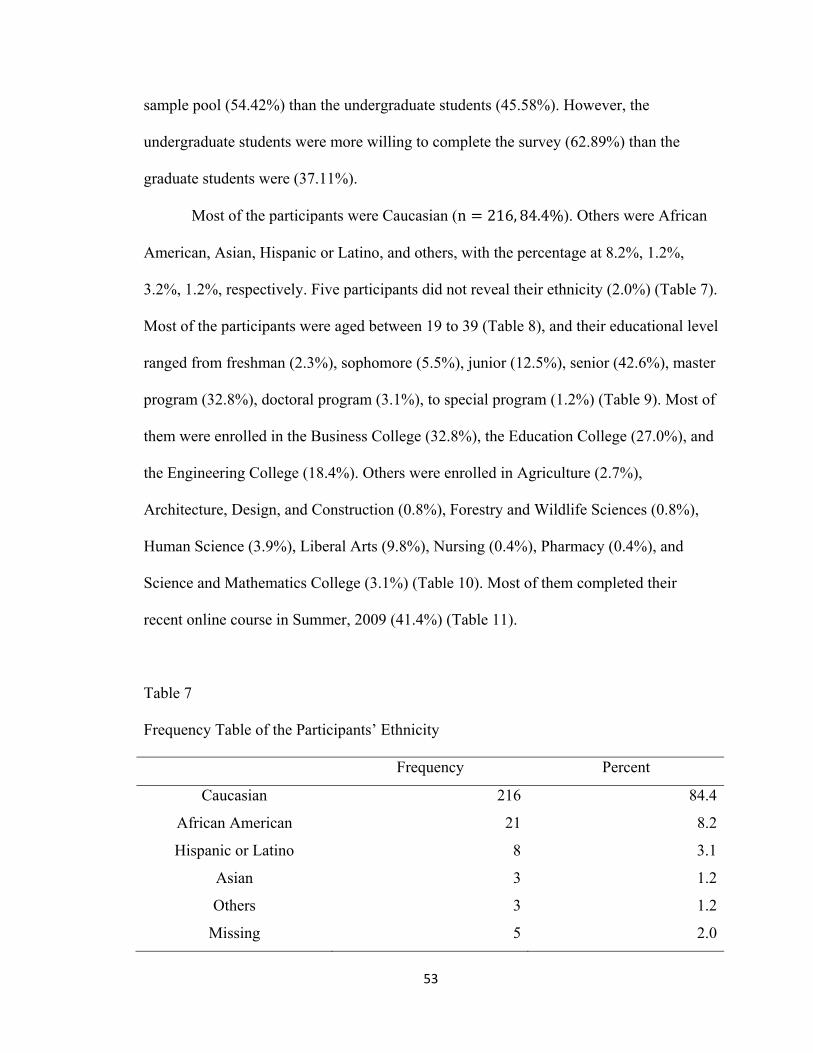
53
sample pool (54.42%) than the undergraduate students (45.58%). However, the
undergraduate students were more willing to complete the survey (62.89%) than the
graduate students were (37.11%).
Most of the participants were Caucasian (n 216, 84.4%). Others were African
American, Asian, Hispanic or Latino, and others, with the percentage at 8.2%, 1.2%,
3.2%, 1.2%, respectively. Five participants did not reveal their ethnicity (2.0%) (Table 7).
Most of the participants were aged between 19 to 39 (Table 8), and their educational level
ranged from freshman (2.3%), sophomore (5.5%), junior (12.5%), senior (42.6%), master
program (32.8%), doctoral program (3.1%), to special program (1.2%) (Table 9). Most of
them were enrolled in the Business College (32.8%), the Education College (27.0%), and
the Engineering College (18.4%). Others were enrolled in Agriculture (2.7%),
Architecture, Design, and Construction (0.8%), Forestry and Wildlife Sciences (0.8%),
Human Science (3.9%), Liberal Arts (9.8%), Nursing (0.4%), Pharmacy (0.4%), and
Science and Mathematics College (3.1%) (Table 10). Most of them completed their
recent online course in Summer, 2009 (41.4%) (Table 11).
Table 7
Frequency Table of the Participants’ Ethnicity
Frequency Percent
Caucasian 216 84.4
African American 21 8.2
Hispanic or Latino 8 3.1
Asian 3 1.2
Others 3 1.2
Missing 5 2.0
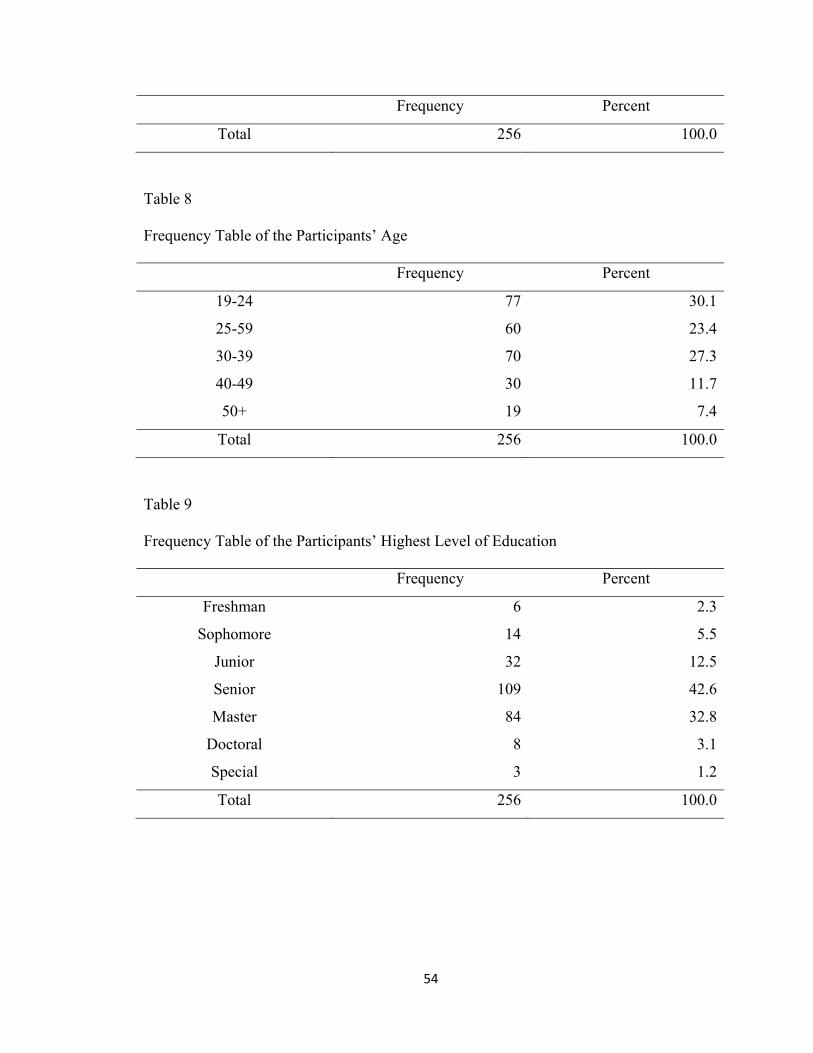
54
Frequency Percent
Total 256 100.0
Table 8
Frequency Table of the Participants’ Age
Frequency Percent
19-24 77 30.1
25-59 60 23.4
30-39 70 27.3
40-49 30 11.7
50+ 19 7.4
Total 256 100.0
Table 9
Frequency Table of the Participants’ Highest Level of Education
Frequency Percent
Freshman 6 2.3
Sophomore 14 5.5
Junior 32 12.5
Senior 109 42.6
Master 84 32.8
Doctoral 8 3.1
Special 3 1.2
Total 256 100.0
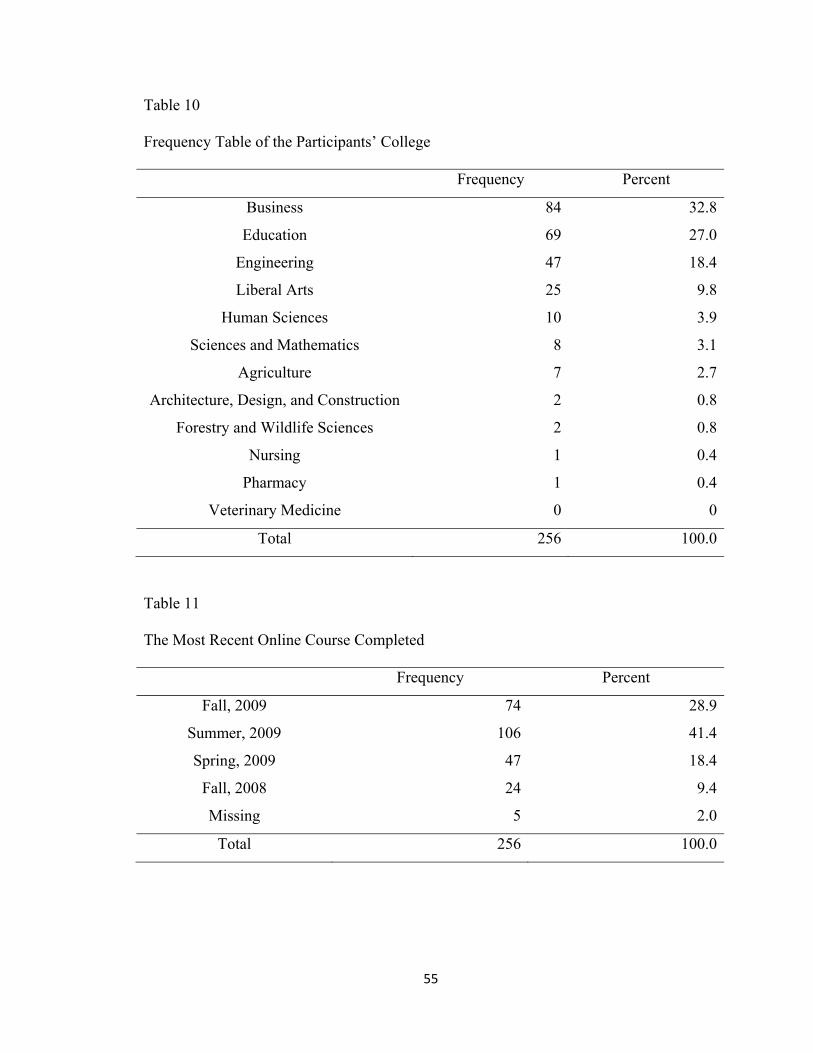
55
Table 10
Frequency Table of the Participants’ College
Frequency Percent
Business 84 32.8
Education 69 27.0
Engineering 47 18.4
Liberal Arts 25 9.8
Human Sciences 10 3.9
Sciences and Mathematics 8 3.1
Agriculture 7 2.7
Architecture, Design, and Construction 2 0.8
Forestry and Wildlife Sciences 2 0.8
Nursing 1 0.4
Pharmacy 1 0.4
Veterinary Medicine 0 0
Total 256 100.0
Table 11
The Most Recent Online Course Completed
Frequency Percent
Fall, 2009 74 28.9
Summer, 2009 106 41.4
Spring, 2009 47 18.4
Fall, 2008 24 9.4
Missing 5 2.0
Total 256 100.0
56
Procedures
The Demographic Questionnaire, Course Satisfaction Questionnaire (CSQ),
Modified Motivation Strategies for Learning Questionnaire (Modified MSLQ), Modified
Self-Regulated Learning Interview Schedule (Modified SRLIS), Online Technology Self-
Efficacy Scale (OTSES), and students’ characteristics questionnaire were used as the
instruments (Appendix A). Because the instruments consisted of a total of 130 items, the
researcher separates these items into 7 parts: Demography Questionnaire, CSQ, Modified
MSLQ Motivation Scale, Modified MSLQ Learning Strategies Scale, Modified SRLIS,
OTSES, and students’ characteristics questionnaire. In order to avoid response sets and
eliminate system error, a Latin Square Design was used to generate different forms of
instrument. Since the instrument was divided into seven parts, a 7X7 Latin Square was
generated so that each part of the instrument appears once in each row and once in each
column. Since every part of instrument appears in each position once, the position effect
is controlled (Kirk, 1995; Maxwell & Delaney, 2004).The assumption of the Latin Square
is that the treatment effect, row effect, and column effect are independent of each other
(Freund & Wilson, 2003). In other words, there are no interactions among the order of the
instrument, the type of forms, and the contents of the instruments. The final seven forms
of the questionnaire with their orders and SAS code used to generate the Latin Square are
shown in Table 12. All 2139 potential participants were randomly assigned to seven
groups. Each group received one type of survey form. All groups had the same
combination of graduate and undergraduate students, and gender (Table 13).
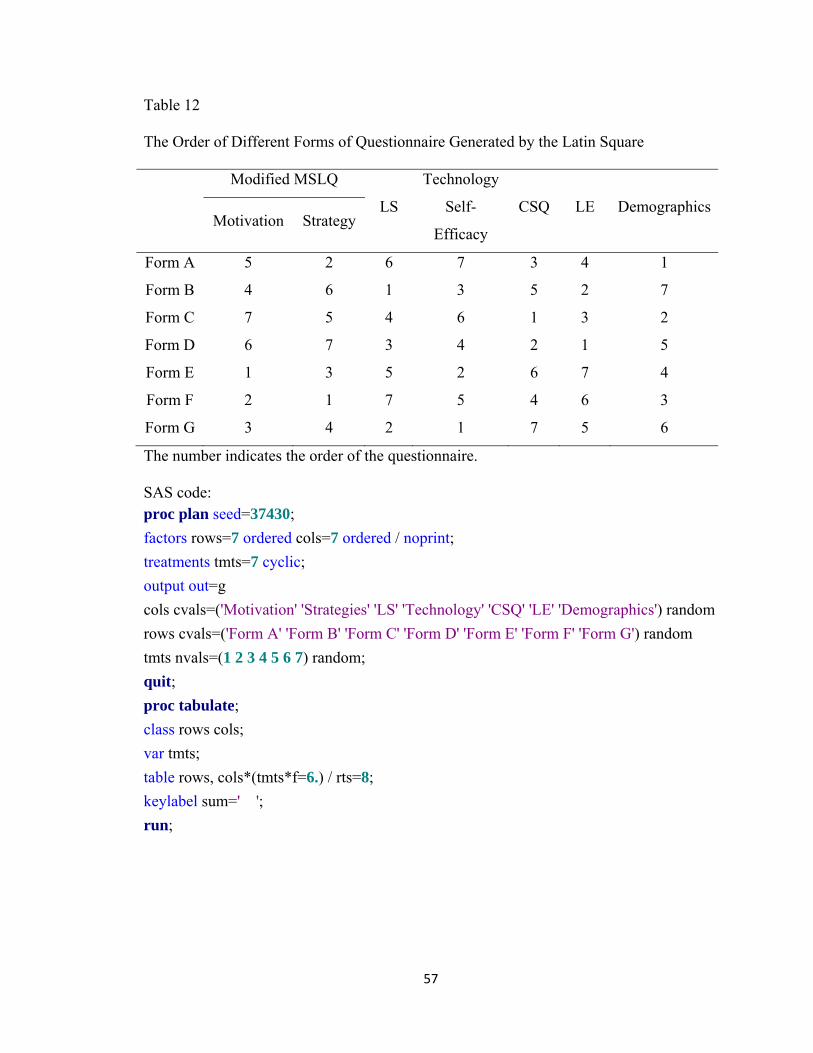
57
Table 12
The Order of Different Forms of Questionnaire Generated by the Latin Square
Modified MSLQ
LS
Technology
Self-
Efficacy
CSQ LE DemographicsMotivation Strategy
Form A 5 2 6 7 3 4 1
Form B 4 6 1 3 5 2 7
Form C 7 5 4 6 1 3 2
Form D 6 7 3 4 2 1 5
Form E 1 3 5 2 6 7 4
Form F 2 1 7 5 4 6 3
Form G 3 4 2 1 7 5 6
The number indicates the order of the questionnaire.
SAS code: proc plan seed=37430; factors rows=7 ordered cols=7 ordered / noprint; treatments tmts=7 cyclic; output out=g cols cvals=('Motivation' 'Strategies' 'LS' 'Technology' 'CSQ' 'LE' 'Demographics') random rows cvals=('Form A' 'Form B' 'Form C' 'Form D' 'Form E' 'Form F' 'Form G') random tmts nvals=(1 2 3 4 5 6 7) random; quit; proc tabulate; class rows cols; var tmts; table rows, cols*(tmts*f=6.) / rts=8; keylabel sum=' '; run;

58
Table 13
The Distribution of Each Survey Format for the Current Study
Form Graduate Undergraduate
Total Male Female Total Male Female Total
A 96 70 166 60 80 140 306
B 96 70 166 61 79 140 306
C 97 70 167 60 79 139 306
D 96 71 167 60 79 139 306
E 94 72 166 60 79 139 305
F 94 72 166 60 79 139 305
G 94 72 166 61 78 139 305
Total 667 497 1164 422 553 975 2139
The participants’ e-mail addresses were obtained from the listings of online
courses taught at Fall, 2008, Spring, 2009, Summer, 2009, and Fall, 2009. Using the
course bulletin, and with the permission of the Director of the Office of Institutional
Assessment, the rosters of these courses were obtained from the online listing. E-mail
addresses were captured for e-mailing purpose only. Neither names nor other information
was captured. The e-mail addresses were used to compile the mailing list. No other
information was necessary and precautions were taken to ensure that an e-mail address
can NOT be associated with any survey responses. The survey host was
SurveyMonkey.com. The participants’ IP addresses, e-mail addresses, or ID were not
collected or saved in this website. The first question of the survey was: “Are you 19 years
59
old or older?” If the participants were not 19 years old or older, they were directed to the
end of the survey and the thank you page.
Research invitations were sent to participants through University e-mail system.
In the invitation e-mail, a link to access online survey website was included. It took about
30 minutes to finish the survey. A friendly notice was sent to participants via E-mail a
week before the formal survey (Appendix B), and two friendly reminders were sent via
E-mail to them a week and two weeks after the participant receive the formal survey
(Appendix E and Appendix F). All data was collected anonymously.
The formal invitation e-mail allowed participants to access the survey (appendix
C). By clicking the web link to survey provided by the e-mail, participants were
considered to agree to participate in the study. However, they could withdraw from the
study anytime when they closed the website without finished the survey. After they finish
the items and click the “DONE” button, a thank you note (Appendix D) appeared on the
screen, and the responses were registered.
The researcher also provided 20 five-dollar Amazon.com gift certificates and 10%
off coupon codes for Auburn University Bookstore as the incentives for the participants
who completed the survey. The participants were redirected to the raffle webpage which
was hosted by Auburn University OIT
(https://oitappstest.auburn.edu/Eric/Drawing/default.aspx) after they completed the
survey. The 20 winners were randomly picked up from the first 500 participants who
complete the survey and participate in the raffle. All participants received the 10% off
coupon codes for Auburn University Bookstores once they finished the survey.
60
Instrumentation
Variables
1. Course Outcomes
Course outcomes included two observed variables: course achievement and
course satisfaction. Course achievement is measured by collecting data on
students’ self-reported final grade in their most recent online course. The grades
included A, B, C, D, F, and W six categories. Course satisfaction was measured
by a 21-item Course Satisfaction Questionnaire (CSQ) created by Frey, Yankelov,
and Faul (2003). The contents include interaction between students and faculty,
interaction among students, the relevancy of course content, and the teaching
methods for delivering the content.
2. Self-Regulated Learning
Self-regulated learning was measured by the Modified Motivation Strategies for
Learning Questionnaire (Modified MSLQ) which was developed by Artino and
McCoach (2008). Task value, self-efficacy for learning and performance, and test
anxiety are three subscales in the motivation scale with a total of 19 items, while
elaboration, critical thinking, metacognitive self-regulation, and time/study
environmental management are four factors in the learning strategies scale with a
total of 31 items. In addition, four open ended items which were modified from
the Self-Regulated Learning Interview Schedule (Zimmerman & Martinez-Pons,
1986, 1988) were added to identify the learning strategies students used in online
learning courses.

61
3. Technology Self-Efficacy
Technology self-efficacy was measured by the Online Technologies Self-Efficacy
Scale (OTSES) which was developed by Miltiadou and Yu (2000). One factor,
online self-efficacy, with 29 items was comprised in this instrument.
4. Students’ Characteristics
These characteristics included gender, education level, and the number of online
courses that had been taken.
Instruments
In the current study, standard procedures, such as Cronbach’s alpha, factor
analysis, were used to estimate reliability and validity.
Course Satisfaction Questionnaire (CSQ)
CSQ is a 7-point Likert type self-report questionnaire which was developed by
Frey et al. (2003) to measure students’ overall satisfaction with the online courses. It
includes 21 items. Students were instructed to respond to the item from “completely
dissatisfied” (1) to “completely satisfied” (7) with a possible range from 21 to 147. For
example, item 13: “The time it took for your instructor to provide feedback on graded
assignments.” The higher scores represent more satisfaction with the online courses. Frey
et al. (2003) reported an internal consistency Cronbach’ alpha equals to 0.97, indicating
an excellent reliability. They also found that the CSQ scores moderately to strongly
positively correlated with web-assisted strategies, such as communication, course
information, learning resources, assignment, and grading.
62
An exploratory factor analysis using a principal component extraction method and
an oblimin rotation of a 21-item self-report course satisfaction questionnaire was
administered to the participants at Auburn University (N=256). The Kaiser-Meyer-Olkin
measure of sampling adequacy was 0.965, indicating that the present data were suitable
for principal components analysis. Similarly, Bartlett’s test of sphericity was significant
( 0.001), indicating sufficient correlation between the variables to proceed with the
analysis.
Using the Kaiser-Guttman retention criterion of eigenvalues greater than 1.0, a
two-factor solution provided the clearest extraction accounting for 68.520% of the total
variance. However, the scree plot indicated a dominant factor with eigenvalues at 13.334
(Figure 5), whereas the previous researchers only provided one structure for the Course
Satisfaction Questionnaire. Therefore, one factor, Course Satisfaction, with 21-item was
obtained. The corrected item-total correlation ranged from 0.587 to 0.866, and the
Cronbach’s coefficient alpha was 0.970, which was corresponded to the original structure
(Table 14).
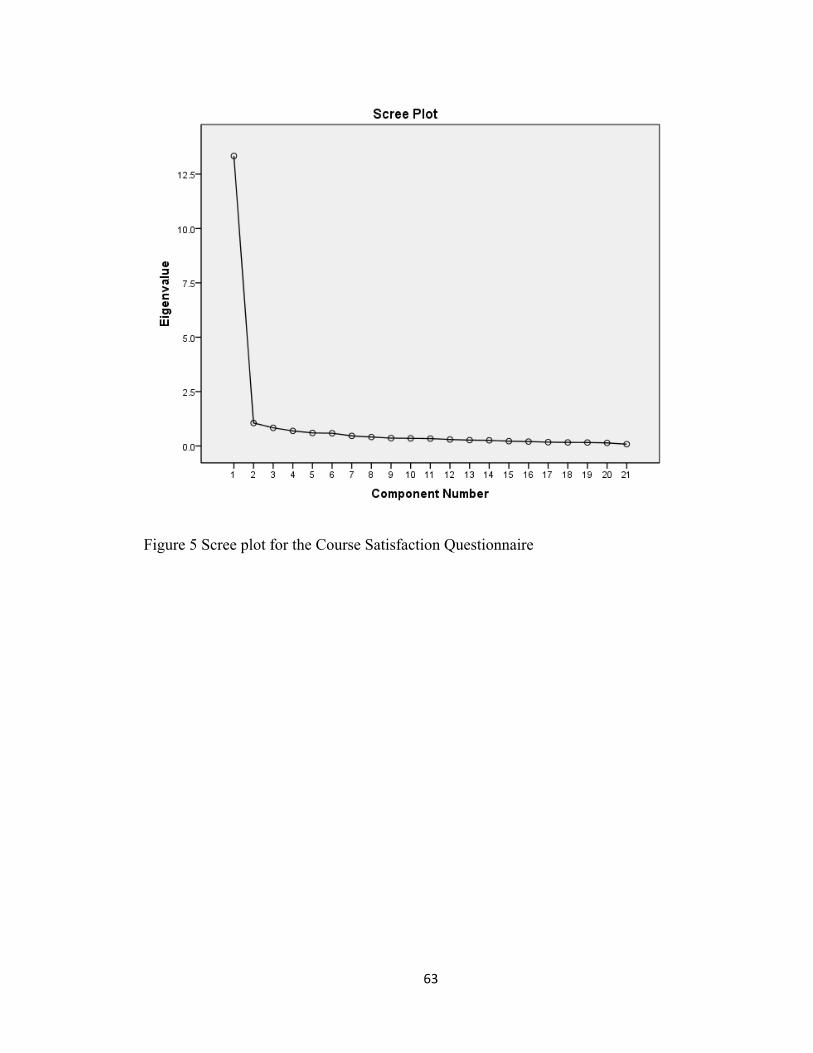
63
Figure 5 Scree plot for the Course Satisfaction Questionnaire
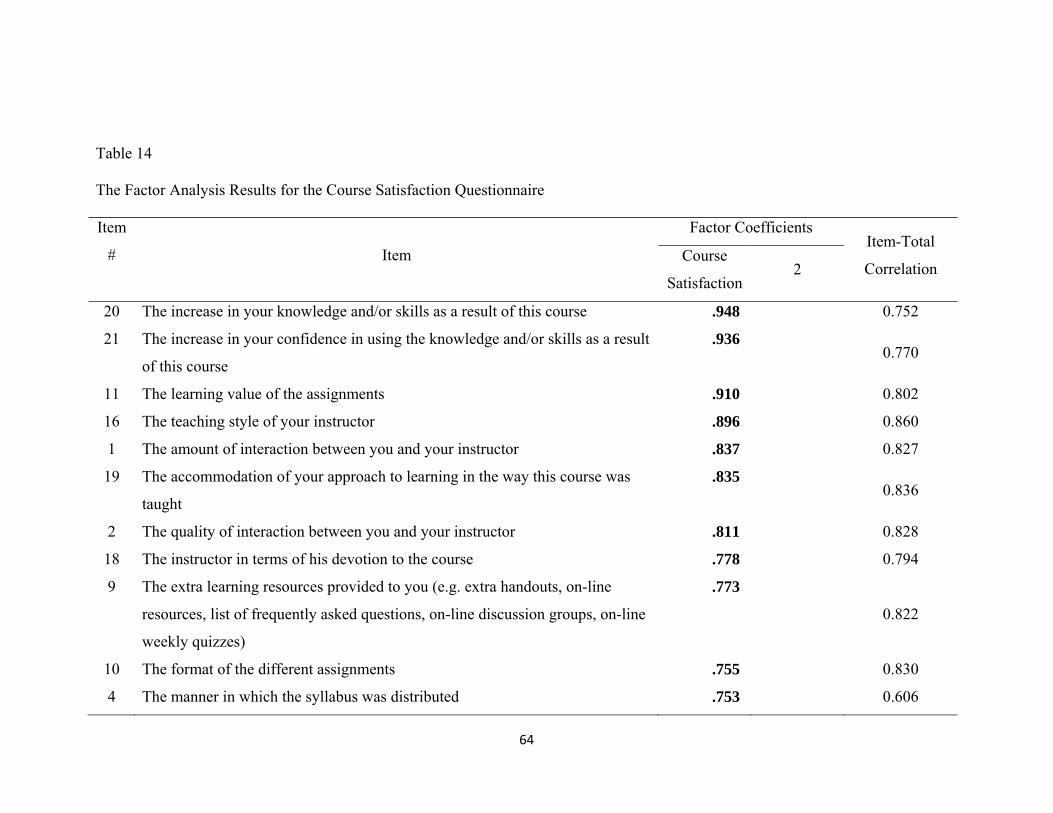
64
Table 14
The Factor Analysis Results for the Course Satisfaction Questionnaire
Item
# Item
Factor Coefficients Item-Total
Correlation Course
Satisfaction 2
20 The increase in your knowledge and/or skills as a result of this course .948 0.752
21 The increase in your confidence in using the knowledge and/or skills as a result
of this course
.936 0.770
11 The learning value of the assignments .910 0.802
16 The teaching style of your instructor .896 0.860
1 The amount of interaction between you and your instructor .837 0.827
19 The accommodation of your approach to learning in the way this course was
taught
.835 0.836
2 The quality of interaction between you and your instructor .811 0.828
18 The instructor in terms of his devotion to the course .778 0.794
9 The extra learning resources provided to you (e.g. extra handouts, on-line
resources, list of frequently asked questions, on-line discussion groups, on-line
weekly quizzes)
.773
0.822
10 The format of the different assignments .755 0.830
4 The manner in which the syllabus was distributed .753 0.606
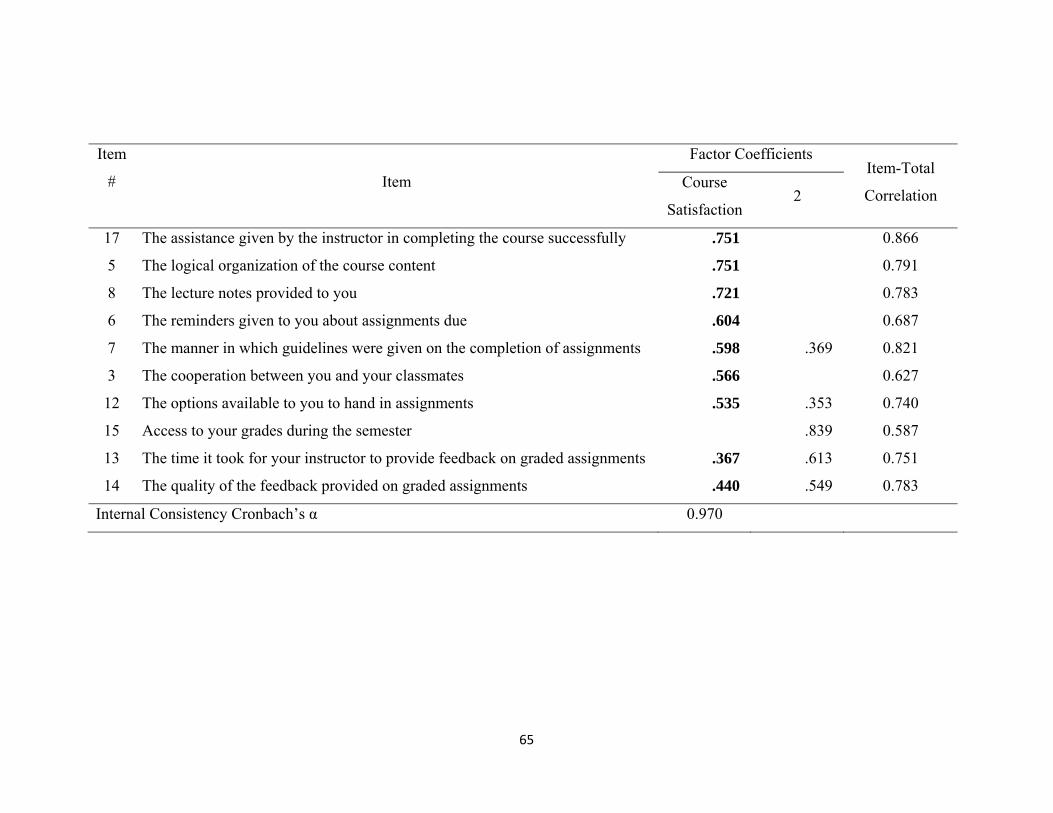
65
Item
# Item
Factor Coefficients Item-Total
Correlation Course
Satisfaction 2
17 The assistance given by the instructor in completing the course successfully .751 0.866
5 The logical organization of the course content .751 0.791
8 The lecture notes provided to you .721 0.783
6 The reminders given to you about assignments due .604 0.687
7 The manner in which guidelines were given on the completion of assignments .598 .369 0.821
3 The cooperation between you and your classmates .566 0.627
12 The options available to you to hand in assignments .535 .353 0.740
15 Access to your grades during the semester .839 0.587
13 The time it took for your instructor to provide feedback on graded assignments .367 .613 0.751
14 The quality of the feedback provided on graded assignments .440 .549 0.783
Internal Consistency Cronbach’s α 0.970
66
Modified Motivation Strategies for Learning Questionnaire (Modified MSLQ)
The Motivation Strategies for Learning Questionnaire (MSLQ) was developed by
Pintrich, Smith, Garcia, and McKeachie in 1993 as the measures of self-regulated
learning. However, the MSLQ was designed for the traditional classroom settings, and it
may not be appropriate to apply in online learning settings.
Artino and McCoach modified the original MSLQ to measure self-regulated
learning in online learning settings. The modified MSLQ includes two major subscales:
motivation (task value, self-efficacy, and test anxiety), and learning strategies
(Elaboration, critical thinking, metacognitive self-regulation, and time/study
environmental management). The motivation section consists of 19 items and the
learning strategies section includes 31 items. Participants respond to each item using a 7-
point scale, ranging from “not at all true of me” (1) to “very true of me” (7). Five out of
total 50 items are reverse coded. Higher scores indicate higher level of motivation and
learning strategies. Sample questions are: item 9: “I am confident I can understand the
most complex material presented by the instructor in this course”, and item 21: “I usually
study in a place where I can concentrate on my course work.”
The internal consistency using Cronbach’s alpha for task value, self-efficacy, and
test anxiety subscales were 0.90, 0.93, and 0.80, respectively. For elaboration, critical
thinking, metacognitive self-regulation, and time/study environmental management, the
reliability estimates were 0.75, 0.80, 0.79, and 0.76, respectively. No factor analysis of
other support for validity was provided.
Artino and McCoach (2008) combined the task value and self-efficacy subscales
together as a new scale, called Online Learning Value and Self-Efficacy Scale (OLVSES).
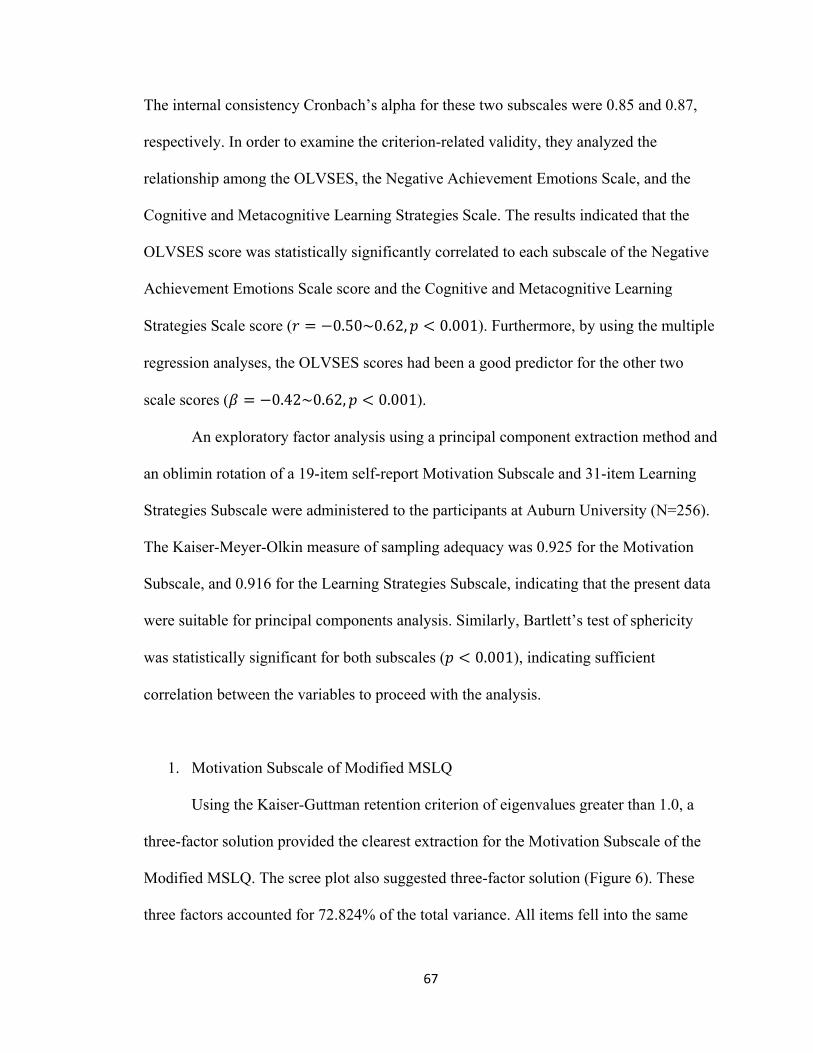
67
The internal consistency Cronbach’s alpha for these two subscales were 0.85 and 0.87,
respectively. In order to examine the criterion-related validity, they analyzed the
relationship among the OLVSES, the Negative Achievement Emotions Scale, and the
Cognitive and Metacognitive Learning Strategies Scale. The results indicated that the
OLVSES score was statistically significantly correlated to each subscale of the Negative
Achievement Emotions Scale score and the Cognitive and Metacognitive Learning
Strategies Scale score ( 0.50~0.62, 0.001). Furthermore, by using the multiple
regression analyses, the OLVSES scores had been a good predictor for the other two
scale scores ( 0.42~0.62, 0.001).
An exploratory factor analysis using a principal component extraction method and
an oblimin rotation of a 19-item self-report Motivation Subscale and 31-item Learning
Strategies Subscale were administered to the participants at Auburn University (N=256).
The Kaiser-Meyer-Olkin measure of sampling adequacy was 0.925 for the Motivation
Subscale, and 0.916 for the Learning Strategies Subscale, indicating that the present data
were suitable for principal components analysis. Similarly, Bartlett’s test of sphericity
was statistically significant for both subscales ( 0.001), indicating sufficient
correlation between the variables to proceed with the analysis.
1. Motivation Subscale of Modified MSLQ
Using the Kaiser-Guttman retention criterion of eigenvalues greater than 1.0, a
three-factor solution provided the clearest extraction for the Motivation Subscale of the
Modified MSLQ. The scree plot also suggested three-factor solution (Figure 6). These
three factors accounted for 72.824% of the total variance. All items fell into the same

68
structure as the original research. Communities were fairly high for each of the 19 items,
with a range of 0.518 to 0.850. The first factor, Self-Efficacy (eigenvalue=9.214),
accounted for 48.493% of the variance and had 8 items. The second factor, Test Anxiety
(eigenvalue=3.193), accounted for 16.808% of the variance and had 5 items. The final
factor, Task Value (eigenvalue=1.430), accounted for 7.524% of the variance and had six
items. The corrected item-total correlation ranged from 0.752 to 0.881 for the Self-
Efficacy, and Cronbach’s coefficient alpha was 0.947. The corrected item-total
correlation ranged from 0.576 to 0.736 for the Test Anxiety, and Cronbach’s coefficient
alpha was 0.846, whereas the corrected item-total correlation ranged from 0.787 to 0.879
for the Task Value, and Cronbach’s coefficient alpha was 0.945. Table 15 presents the 19
items, the factors they came from, their factor loadings, their item-total correlation, and
their internal consistency Cronbach’s alpha values.
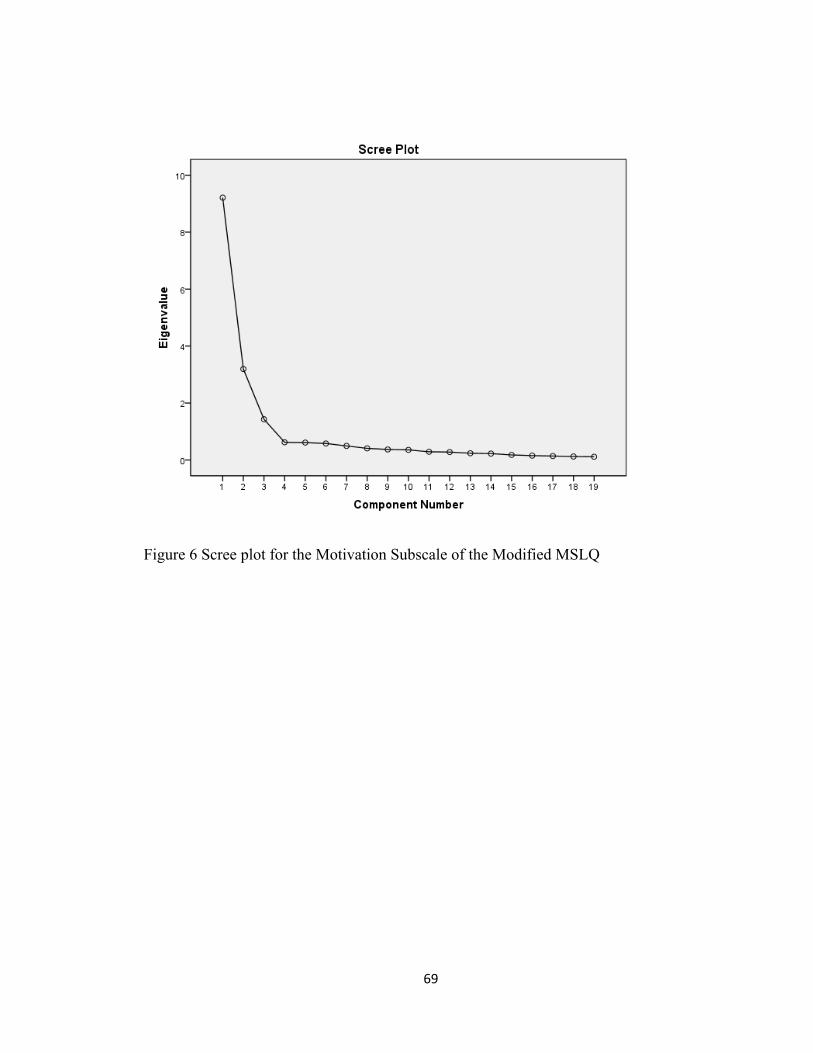
69
Figure 6 Scree plot for the Motivation Subscale of the Modified MSLQ
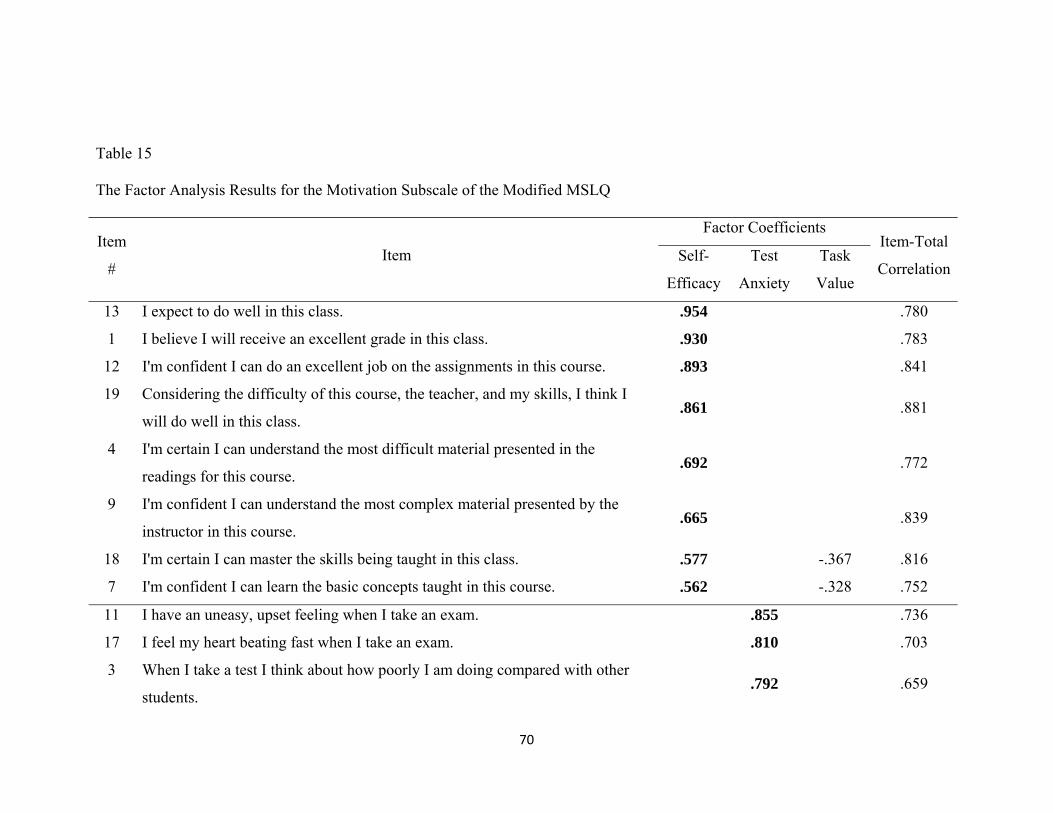
70
Table 15
The Factor Analysis Results for the Motivation Subscale of the Modified MSLQ
Item
# Item
Factor Coefficients Item-Total
CorrelationSelf-
Efficacy
Test
Anxiety
Task
Value
13 I expect to do well in this class. .954 .780
1 I believe I will receive an excellent grade in this class. .930 .783
12 I'm confident I can do an excellent job on the assignments in this course. .893 .841
19 Considering the difficulty of this course, the teacher, and my skills, I think I
will do well in this class. .861 .881
4 I'm certain I can understand the most difficult material presented in the
readings for this course. .692 .772
9 I'm confident I can understand the most complex material presented by the
instructor in this course. .665 .839
18 I'm certain I can master the skills being taught in this class. .577 -.367 .816
7 I'm confident I can learn the basic concepts taught in this course. .562 -.328 .752
11 I have an uneasy, upset feeling when I take an exam. .855 .736
17 I feel my heart beating fast when I take an exam. .810 .703
3 When I take a test I think about how poorly I am doing compared with other
students. .792 .659
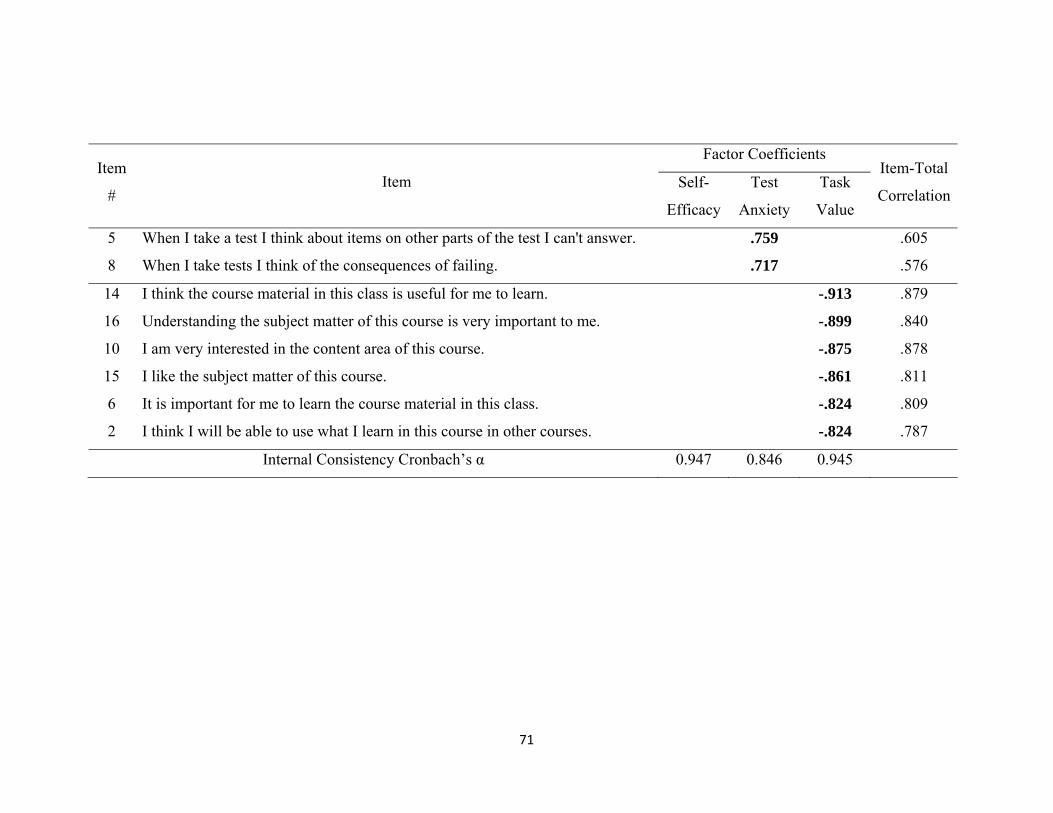
71
Item
# Item
Factor Coefficients Item-Total
CorrelationSelf-
Efficacy
Test
Anxiety
Task
Value
5 When I take a test I think about items on other parts of the test I can't answer. .759 .605
8 When I take tests I think of the consequences of failing. .717 .576
14 I think the course material in this class is useful for me to learn. -.913 .879
16 Understanding the subject matter of this course is very important to me. -.899 .840
10 I am very interested in the content area of this course. -.875 .878
15 I like the subject matter of this course. -.861 .811
6 It is important for me to learn the course material in this class. -.824 .809
2 I think I will be able to use what I learn in this course in other courses. -.824 .787
Internal Consistency Cronbach’s α 0.947 0.846 0.945
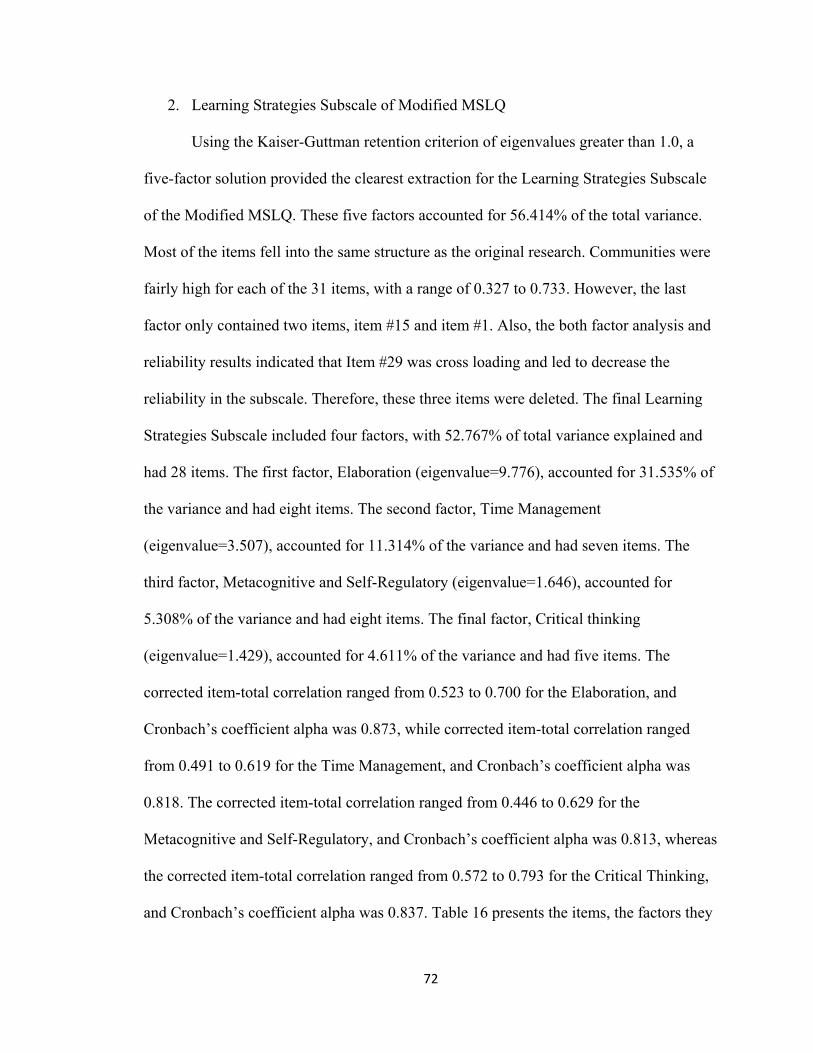
72
2. Learning Strategies Subscale of Modified MSLQ
Using the Kaiser-Guttman retention criterion of eigenvalues greater than 1.0, a
five-factor solution provided the clearest extraction for the Learning Strategies Subscale
of the Modified MSLQ. These five factors accounted for 56.414% of the total variance.
Most of the items fell into the same structure as the original research. Communities were
fairly high for each of the 31 items, with a range of 0.327 to 0.733. However, the last
factor only contained two items, item #15 and item #1. Also, the both factor analysis and
reliability results indicated that Item #29 was cross loading and led to decrease the
reliability in the subscale. Therefore, these three items were deleted. The final Learning
Strategies Subscale included four factors, with 52.767% of total variance explained and
had 28 items. The first factor, Elaboration (eigenvalue=9.776), accounted for 31.535% of
the variance and had eight items. The second factor, Time Management
(eigenvalue=3.507), accounted for 11.314% of the variance and had seven items. The
third factor, Metacognitive and Self-Regulatory (eigenvalue=1.646), accounted for
5.308% of the variance and had eight items. The final factor, Critical thinking
(eigenvalue=1.429), accounted for 4.611% of the variance and had five items. The
corrected item-total correlation ranged from 0.523 to 0.700 for the Elaboration, and
Cronbach’s coefficient alpha was 0.873, while corrected item-total correlation ranged
from 0.491 to 0.619 for the Time Management, and Cronbach’s coefficient alpha was
0.818. The corrected item-total correlation ranged from 0.446 to 0.629 for the
Metacognitive and Self-Regulatory, and Cronbach’s coefficient alpha was 0.813, whereas
the corrected item-total correlation ranged from 0.572 to 0.793 for the Critical Thinking,
and Cronbach’s coefficient alpha was 0.837. Table 16 presents the items, the factors they

73
came from, their factor loadings, their item-total correlation, and their internal
consistency Cronbach’s alpha values.
Figure 7 Scree plot for the Learning Strategies Subscale of the Modified MSLQ
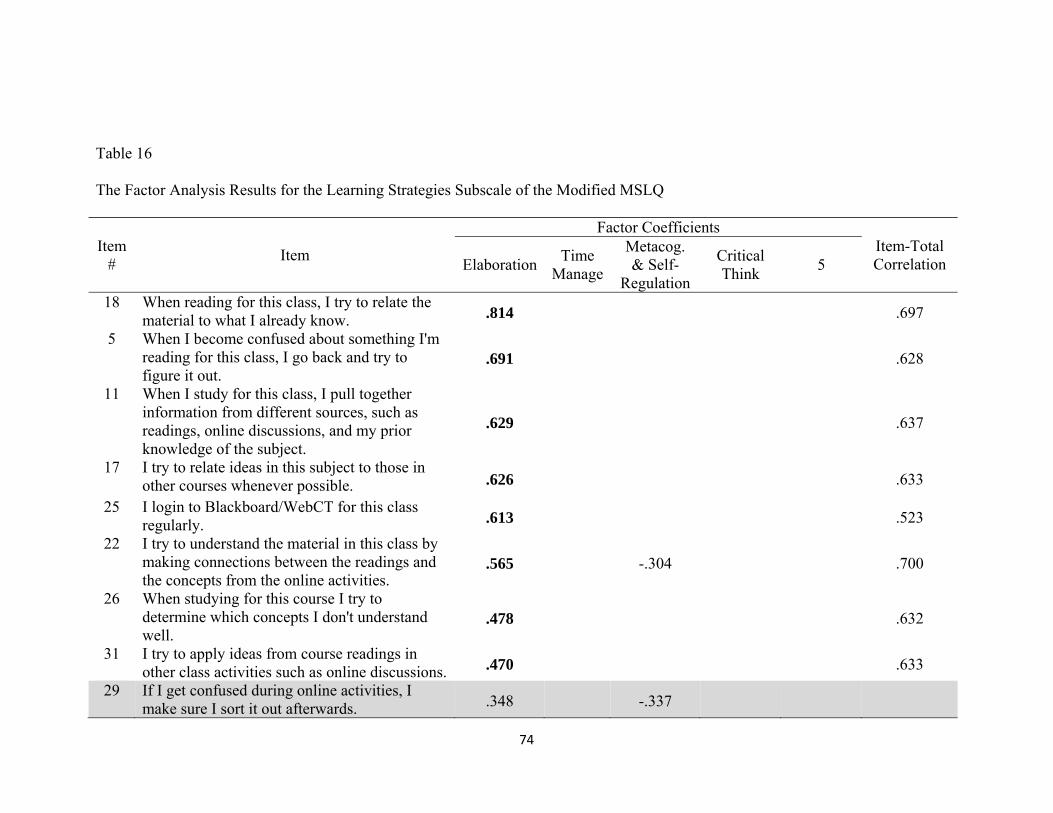
74
Table 16
The Factor Analysis Results for the Learning Strategies Subscale of the Modified MSLQ
Item # Item
Factor Coefficients Item-Total Correlation Elaboration Time
Manage
Metacog. & Self-
Regulation
Critical Think 5
18 When reading for this class, I try to relate the material to what I already know. .814 .697
5 When I become confused about something I'm reading for this class, I go back and try to figure it out.
.691 .628
11 When I study for this class, I pull together information from different sources, such as readings, online discussions, and my prior knowledge of the subject.
.629 .637
17 I try to relate ideas in this subject to those in other courses whenever possible. .626
.633
25 I login to Blackboard/WebCT for this class regularly. .613 .523
22 I try to understand the material in this class by making connections between the readings and the concepts from the online activities.
.565 -.304 .700
26 When studying for this course I try to determine which concepts I don't understand well.
.478 .632
31 I try to apply ideas from course readings in other class activities such as online discussions. .470 .633
29 If I get confused during online activities, I make sure I sort it out afterwards. .348 -.337
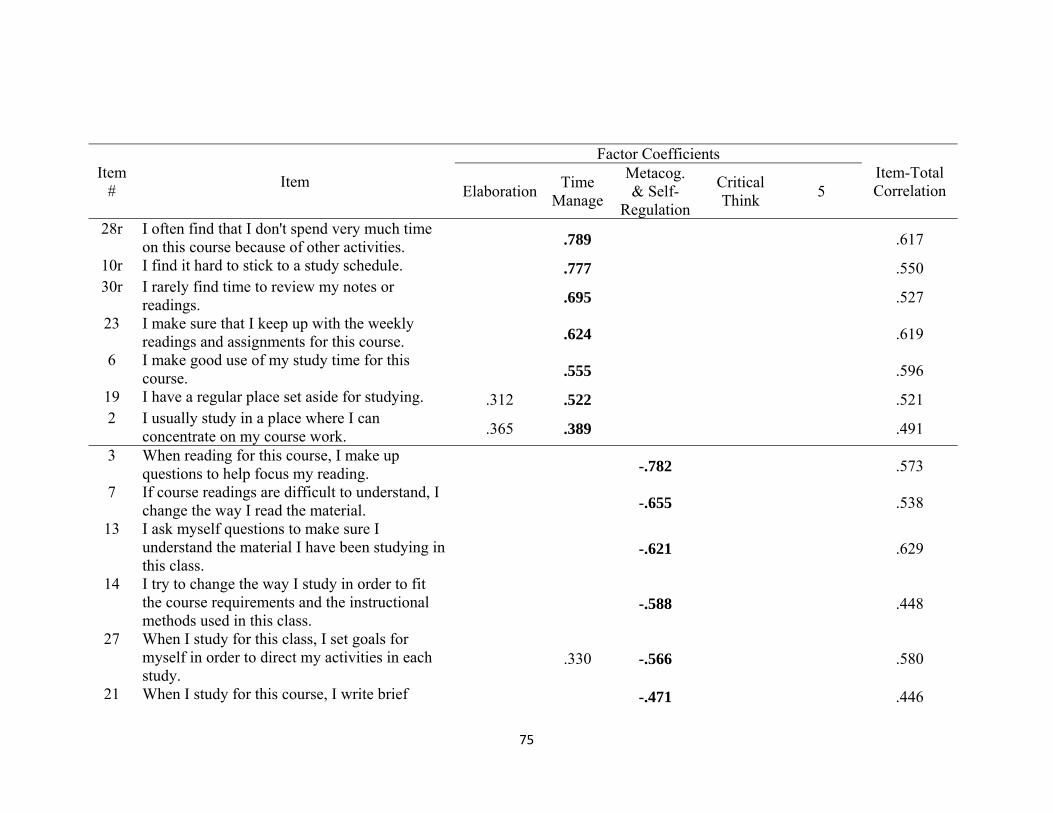
75
Item # Item
Factor Coefficients Item-Total Correlation Elaboration Time
Manage
Metacog. & Self-
Regulation
Critical Think 5
28r I often find that I don't spend very much time on this course because of other activities. .789 .617
10r I find it hard to stick to a study schedule. .777 .550 30r I rarely find time to review my notes or
readings. .695 .527 23 I make sure that I keep up with the weekly
readings and assignments for this course. .624 .619 6 I make good use of my study time for this
course. .555 .596 19 I have a regular place set aside for studying. .312 .522 .521 2 I usually study in a place where I can
concentrate on my course work. .365 .389 .491
3 When reading for this course, I make up questions to help focus my reading. -.782 .573
7 If course readings are difficult to understand, I change the way I read the material. -.655 .538
13 I ask myself questions to make sure I understand the material I have been studying in this class.
-.621 .629
14 I try to change the way I study in order to fit the course requirements and the instructional methods used in this class.
-.588 .448
27 When I study for this class, I set goals for myself in order to direct my activities in each study.
.330 -.566 .580
21 When I study for this course, I write brief -.471 .446
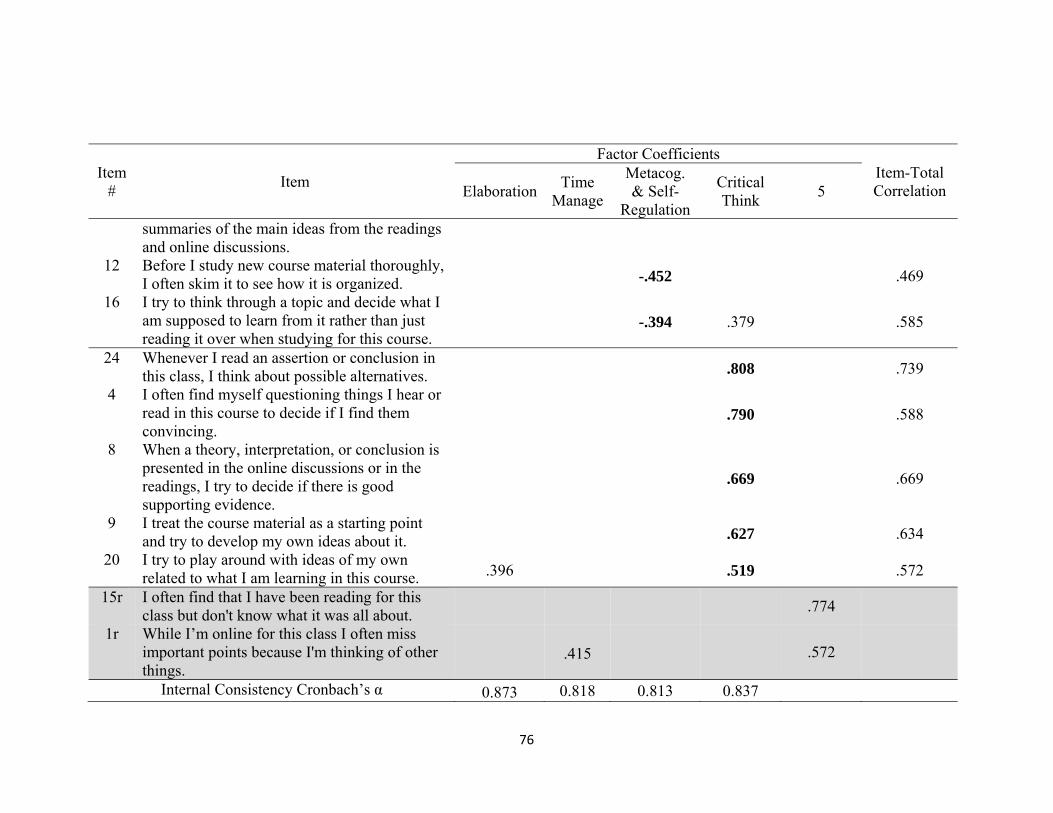
76
Item # Item
Factor Coefficients Item-Total Correlation Elaboration Time
Manage
Metacog. & Self-
Regulation
Critical Think 5
summaries of the main ideas from the readings and online discussions.
12 Before I study new course material thoroughly, I often skim it to see how it is organized. -.452 .469
16 I try to think through a topic and decide what I am supposed to learn from it rather than just reading it over when studying for this course.
-.394 .379 .585
24 Whenever I read an assertion or conclusion in this class, I think about possible alternatives. .808 .739
4 I often find myself questioning things I hear or read in this course to decide if I find them convincing.
.790 .588
8 When a theory, interpretation, or conclusion is presented in the online discussions or in the readings, I try to decide if there is good supporting evidence.
.669 .669
9 I treat the course material as a starting point and try to develop my own ideas about it. .627 .634
20 I try to play around with ideas of my own related to what I am learning in this course. .396 .519 .572
15r I often find that I have been reading for this class but don't know what it was all about. .774
1r While I’m online for this class I often miss important points because I'm thinking of other things.
.415 .572
Internal Consistency Cronbach’s α 0.873 0.818 0.813 0.837
77
Modified Self-Regulated Learning Interview Schedule
This 4-item questionnaire was selected and modified from Zimmerman and
Martinez-Pons’ (1986) Self-Regulated Learning Interview Schedule (SRLIS). The
original six Self-Regulated Learning Contexts questions were developed as a part of a
structural interview questionnaire, Self-Regulated Learning Interview Schedule, to
investigate students’ self-regulated learning strategies in learning contexts (Zimmerman
& Martinez-Pons, 1986). High school participants were given six learning contexts and
decided among 14 self-regulated learning strategies, which strategies they used under
each context. The 4 items in this questionnaire in the current study were used to recruit
more information about students’ learning strategies when they took online courses. The
questions included:
1. What strategies do you use to keep up to date with assignments in this class?
2. What strategies do you use when trying to remember information from
class/videos?
3. What strategies do you use when reviewing the materials available through
the distance education site?
4. What online tools do you use most often and how are these helpful?”
Online Technologies Self-Efficacy Scale (OTSES)
The OTSES was designed by Miltiadou and Yu (2000) to measure technology
self-efficacy of students who enrolled in online courses. The authors first constructed 40
items which included four content areas: internet competencies (e.g. opening a web
browser), synchronous interaction (e.g. providing a nickname within a synchronous chat
78
system), asynchronous interaction I (e.g. logging on and off an e-mail system), and
asynchronous interaction II (e.g. reading a message posted on an asynchronous
conferencing system). The final instrument consisted of 29 4-point Likert type items.
Participants were instructed to respond each item from “Not Confident At All” (1), “Not
Very Confident” (2), “Somewhat Confident” (3), to “Very Confident” (4) based their
level of confidence. The higher score represents the higher level of self-efficacy. The
factor analysis results indicated that the instrument consisted of one factor, technology
self-efficacy, and the internal consistency Cronbach’s alpha equaled 0.95 for the entire
instrument (Miltiadou & Yu, 2000).
An exploratory factor analysis using a principal component extraction method and
an oblimin rotation of a 29-item self-report OTSES was administered to the participants
at Auburn University (N=256). The Kaiser-Meyer-Olkin measure of sampling adequacy
was 0.918, indicating that the present data were suitable for principal components
analysis. Similarly, Bartlett’s test of sphericity was significant ( 0.001), indicating
sufficient correlation between the variables to proceed with the analysis.
Using the Kaiser-Guttman retention criterion of eigenvalues greater than 1.0, a
three-factor solution provided the clearest extraction accounting for 68.140% of the total
variance. Communities were fairly high for each of the 31 items, with a range of 0.526 to
0.875. However, the last factor only consisted with two items, and these two items were
cross loading in the second factor. In addition, the scree plot also suggested that there
were two dominant factors (Figure 8). Therefore, two factors, the General Technology
Self-Efficacy with 17 items, and the Online Learning Platform Technology Self-Efficacy
with 12 items were obtained. For the General Technology Self-Efficacy, the corrected
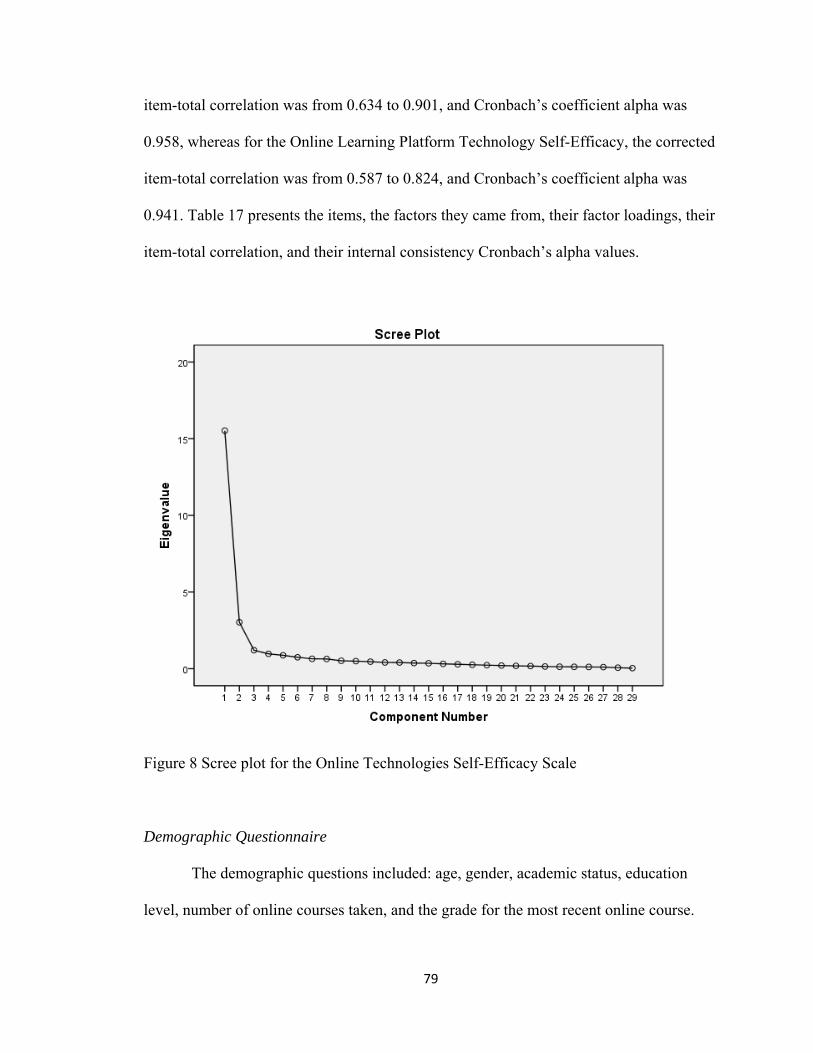
79
item-total correlation was from 0.634 to 0.901, and Cronbach’s coefficient alpha was
0.958, whereas for the Online Learning Platform Technology Self-Efficacy, the corrected
item-total correlation was from 0.587 to 0.824, and Cronbach’s coefficient alpha was
0.941. Table 17 presents the items, the factors they came from, their factor loadings, their
item-total correlation, and their internal consistency Cronbach’s alpha values.
Figure 8 Scree plot for the Online Technologies Self-Efficacy Scale
Demographic Questionnaire
The demographic questions included: age, gender, academic status, education
level, number of online courses taken, and the grade for the most recent online course.
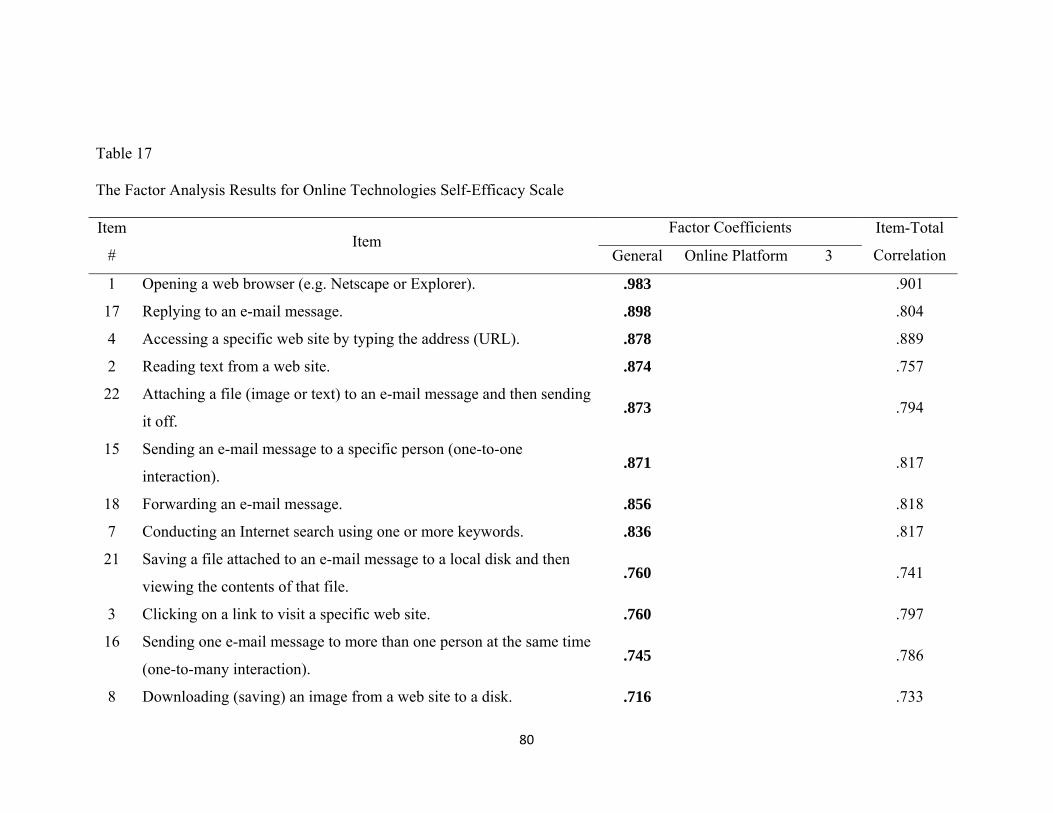
80
Table 17
The Factor Analysis Results for Online Technologies Self-Efficacy Scale
Item
# Item
Factor Coefficients Item-Total
Correlation General Online Platform 3
1 Opening a web browser (e.g. Netscape or Explorer). .983 .901
17 Replying to an e-mail message. .898 .804
4 Accessing a specific web site by typing the address (URL). .878 .889
2 Reading text from a web site. .874 .757
22 Attaching a file (image or text) to an e-mail message and then sending
it off. .873 .794
15 Sending an e-mail message to a specific person (one-to-one
interaction). .871 .817
18 Forwarding an e-mail message. .856 .818
7 Conducting an Internet search using one or more keywords. .836 .817
21 Saving a file attached to an e-mail message to a local disk and then
viewing the contents of that file. .760 .741
3 Clicking on a link to visit a specific web site. .760 .797
16 Sending one e-mail message to more than one person at the same time
(one-to-many interaction). .745 .786
8 Downloading (saving) an image from a web site to a disk. .716 .733
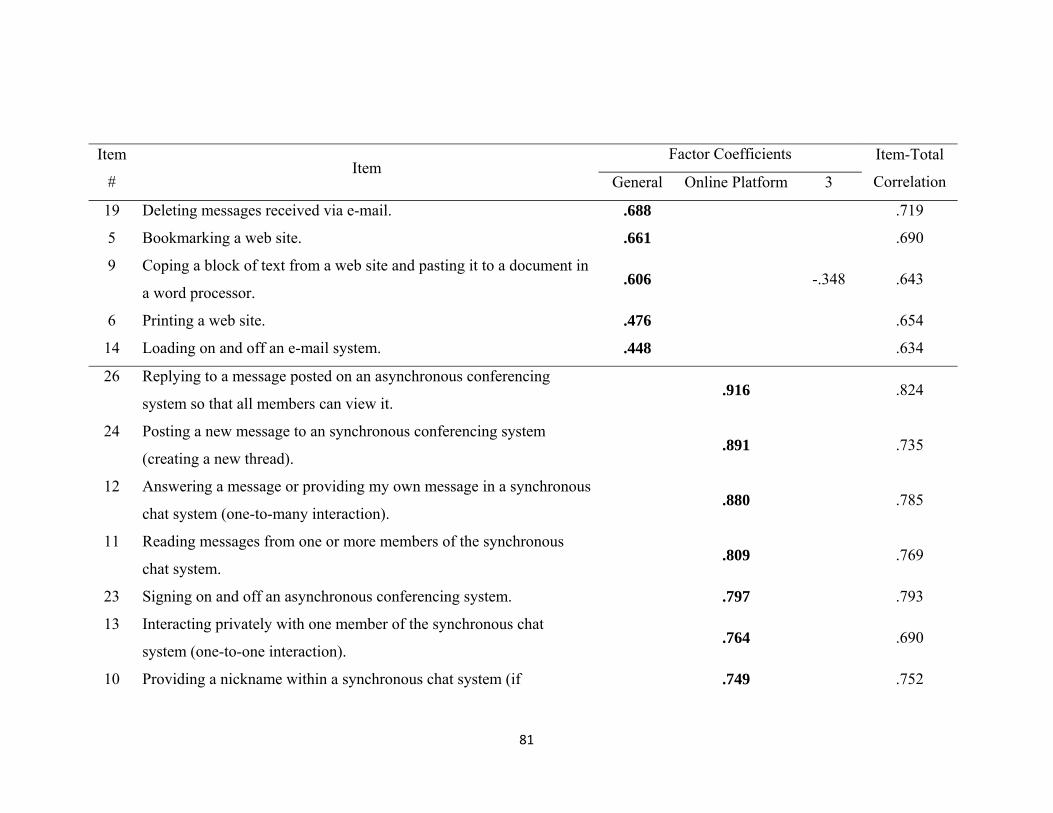
81
Item
# Item
Factor Coefficients Item-Total
Correlation General Online Platform 3
19 Deleting messages received via e-mail. .688 .719
5 Bookmarking a web site. .661 .690
9 Coping a block of text from a web site and pasting it to a document in
a word processor. .606 -.348 .643
6 Printing a web site. .476 .654
14 Loading on and off an e-mail system. .448 .634
26 Replying to a message posted on an asynchronous conferencing
system so that all members can view it. .916 .824
24 Posting a new message to an synchronous conferencing system
(creating a new thread). .891 .735
12 Answering a message or providing my own message in a synchronous
chat system (one-to-many interaction). .880 .785
11 Reading messages from one or more members of the synchronous
chat system. .809 .769
23 Signing on and off an asynchronous conferencing system. .797 .793
13 Interacting privately with one member of the synchronous chat
system (one-to-one interaction). .764 .690
10 Providing a nickname within a synchronous chat system (if .749 .752
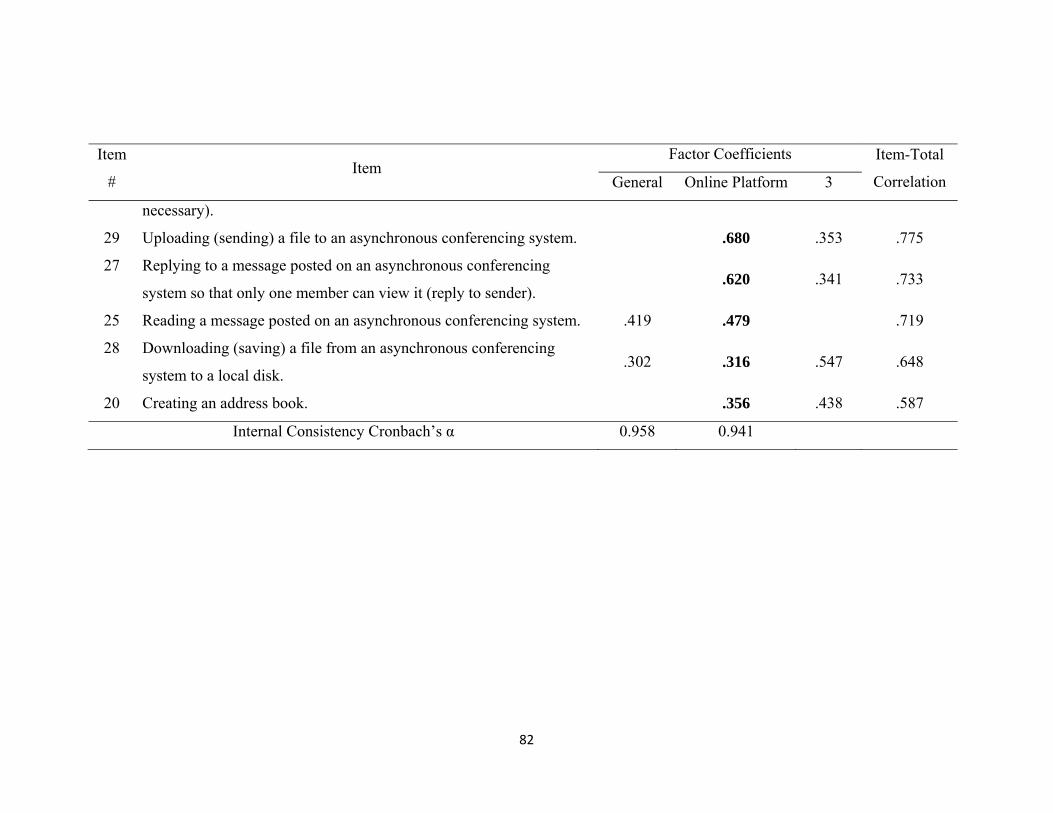
82
Item
# Item
Factor Coefficients Item-Total
Correlation General Online Platform 3
necessary).
29 Uploading (sending) a file to an asynchronous conferencing system. .680 .353 .775
27 Replying to a message posted on an asynchronous conferencing
system so that only one member can view it (reply to sender). .620 .341 .733
25 Reading a message posted on an asynchronous conferencing system. .419 .479 .719
28 Downloading (saving) a file from an asynchronous conferencing
system to a local disk. .302 .316 .547 .648
20 Creating an address book. .356 .438 .587
Internal Consistency Cronbach’s α 0.958 0.941
83
Statistical Method
The Statistical Package for Social Science (SPSS) 18.0 and AMOS 18.0 were
used as the statistical software to analyze the data, while covariance-based structural
equation modeling (SEM) was used to examine the hypothesized model and answer the
research questions.
Structural Equation Modeling (SEM), also known as causal modeling, is a
multivariate technique which was first introduced by Karl Joreskog in 1970 (Klem, 2000).
It is an extension of General Linear Model (Garson, 2009). It represents two statistical
traditions, psychometric and econometrics. For the psychometric origins, it focuses on the
relationship between factors and a construct. For econometrics origins, it emphasizes on
understanding the interdependence among economic variables based on path analysis
(Kaplan, 2000). Therefore, it can be considered as a combination of factor analysis and
path analysis (Garson, 2009; Tabachnick & Fidell, 2007), and consists of two parts: the
measurement part and the structural part. The measurement part tries to link the
relationship between observed variables and latent variables by a confirmatory factor
analysis, whereas the structural part links the relationship among latent variables
simultaneously (Kaplan, 2000). It is usually used for hypothesized model testing.
Therefore, an effort to generate a hypothesized model based on strong theoretical
background is recommended.
Conducting a structural equation modeling is based on a “conventional” practice
(Kaplan, 2000). A theory is presented at the beginning, and based on the theory, a model
is specified. Next, measurement is done based on the selected sample. Next, based on the
84
data collected, parameter is estimated. Followed by estimation, the researcher should
assess the model fit. If it does not fit well, a model modification is needed, and parameter
is estimated again, until obtaining an appropriate model to explain the sample
phenomenon (Kaplan, 2000; see Figure 9).
Structural Equation Modeling is very similar to path analysis, except path analysis
focuses on the relationship among observed variables while the SEM focuses on the
relationship among latent variables. Path analysis can be used to examine the mediator
effect and provides causality inference (Meyers, Gamst & Guarino, 2006). In addition to
the strength of path analysis and examine the relationship among latent variables, SEM
can also construct the relationship between latent variables and observed variables at the
same time. It can also provide a more powerful test of causal relationships of the
hypothesis model, and its measures are more valid and reliable (Rigdon, 1998; Gall, Gall
& Borg, 2003; Hair, Black, Babin, Anderson & Tatham, 2006; Hsu, Chen & Hsieh, 2006).
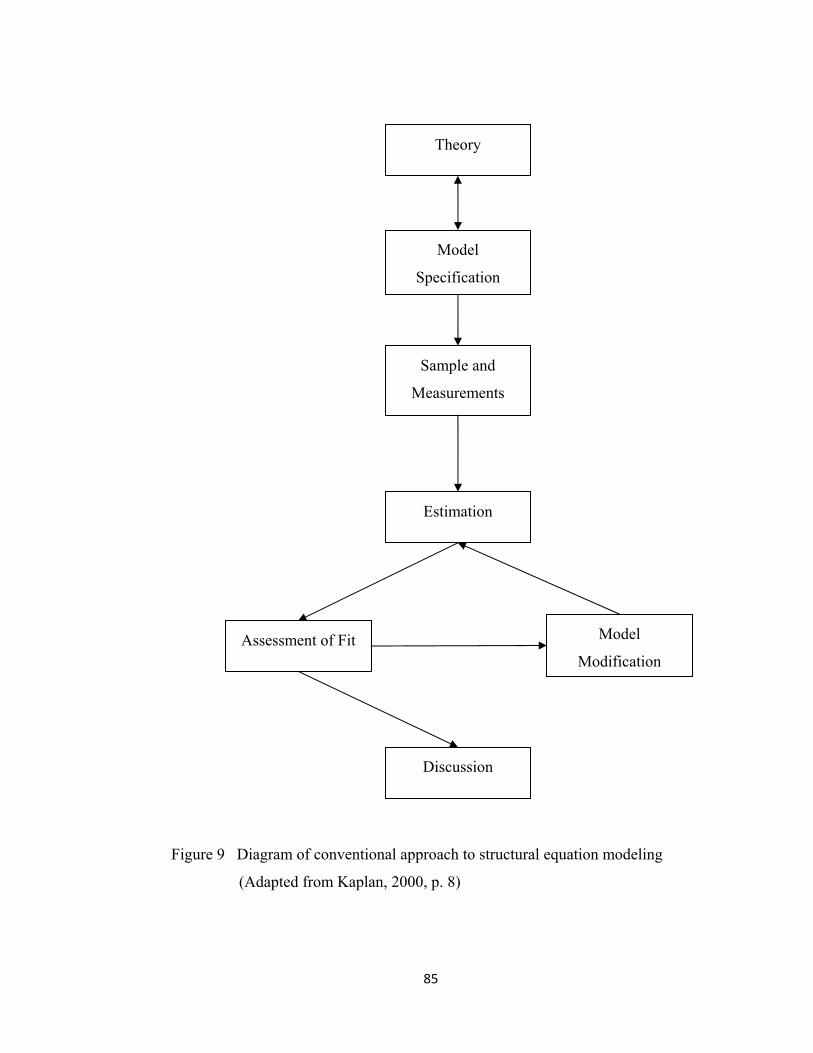
85
Theory
Model
Specification
Sample and
Measurements
Estimation
Assessment of Fit Model
Modification
Discussion
Figure 9 Diagram of conventional approach to structural equation modeling
(Adapted from Kaplan, 2000, p. 8)
86
Components of a Structural Equation Modeling
A structural equation modeling includes three major components: observed
variables (or called indicators, manifest variables), latent variables (or called constructs,
concepts), and path relationships (include one-way, two-way, and correlational paths).
Latent variables are usually represented in a circle. A latent variable is a construct
variable that cannot be observed or measured directly, such as self-regulated learning,
and self-efficacy. An exogenous variable (Students’ Characteristics in Figure 1) is a
construct variable which can explain other latent variables, while an endogenous variable
(Self-regulated Learning and Course Outcomes in Figure 1) is a construct which can be
explained by others. The endogenous variables can be considered to be equivalent to
dependent variables, whereas the exogenous variables are equivalent of independent
variables (Hair et al., 2006; Meyers et al., 2006). In the hypothesized model of the current
study, Students’ Characteristics was the exogenous variable, while Self-Regulated
Learning, Technology Self-Efficacy, and the Course Oucomes were endogenous
variables.
Observed variables (or indicators, manifest variables) are represented by a square
shape. They are measured to represent constructs, such as Gender, Educational Level,
Previous Online Courses Have Taken, Motivation, Learning Strategies, Course
Satisfaction, and Achievement. The path relationship includes the relationship between
the latent variable and the observed variable it explained, the relationship between the
exogenous latent variable and endogenous latent, and the relationship among endogenous
latent variables.
87
Model Identification
In structural equation modeling, identification problems need to be resolved prior
to the estimation of parameters (Schumacker & Lomax, 2004). Identification problem
refers to when the parameter cannot be estimated uniquely by the sample data (Kaplan,
2000). This problem occurs when there are not enough constraints on the model and the
data to obtain unique estimates of parameter. In other words, there are not enough
degrees of freedom to estimate the parameters. Therefore, the way to solve this problem
is to impose some constraints. Usually, researcher fixes the factor loading of one
observed variable of each latent variable to be 1, or sets the variance of each latent
variable to be 1.
Assumptions for SEM
Covariance-based SEM requires the following assumptions (Tabachnick & Fidell,
2007):
(1) The data must be multivariate normality because of the parameter estimation
methods.
(2) There are linear relationships between observed variables and their corresponding
latent variables. Also, there are linear relationships among latent variables.
(3) Absence of multicollinearity and singularity.
Conducting a Covariance-based SEM
A covariance-based SEM focuses on understanding the relationship among the
latent variables, and the relationship between latent variable and its observed variables.
88
Therefore, it is parameter oriented, and the model is heavily dependent on theoretical
foundations. A covariance-based SEM uses Maximum Likelihood Estimation (MLE) or
Generalized Least Squares (GLS) procedure to estimate the parameters. These procedures
estimate the parameters by minimizing the difference between observed and predicted
covariance matrices of the observed variables. Therefore, the multivariate normality,
linearity, and non-singularity in the dataset assumptions have to be met in order to obtain
reliable and consistent estimators. Based on this procedure, the values of latent variables
are indeterminate. A large sample size is usually required for a covariance-based SEM.
However, as the sample size increases, the goodness-of-fit test becomes very sensitive
and indicates poor fit (Marsh, Balla & McDonald, 1988; Tanaka, 1987). Therefore, other
fit indices are required during evaluating the model fit. As for the sample size, ten times
the total number of observed variables is recommended, but 200 is proposed as the
“critical sample size” (Hoelter, 1983).
Assessment of Model Fit
After obtaining the parameter estimations, the next step is evaluating the fitting
criteria. Three types of fit measures are used in covariance-based SEM, absolute, relative
and parsimonious (Meyers et al., 2006).
The absolute fit measures indicate how well the covariance matrix of
hypothesized model fits the covariance matrix of the actual data. The absolute fit
measures include Goodness-of-fit test (Chi-square statistic, ), goodness-of-fit index
(GFI), and root mean square error of approximation (RMSEA). Among these indices,
is the only statistical testing index in SEM. The researcher is expecting a good model fit,
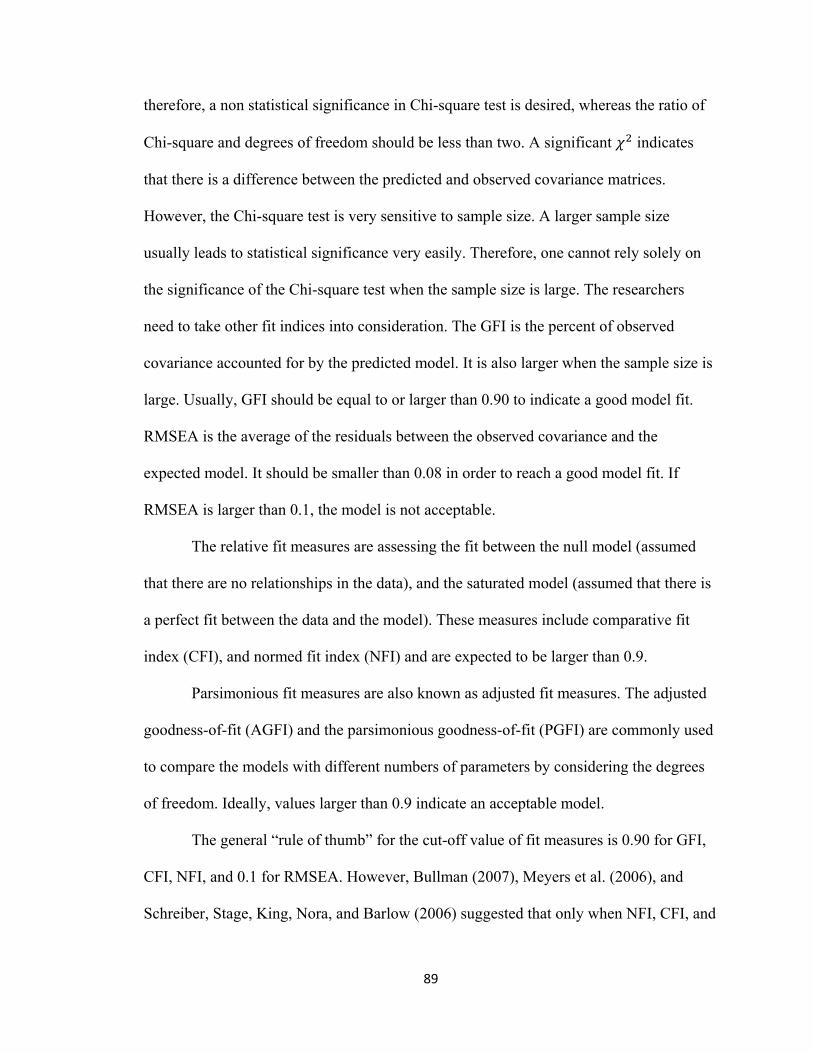
89
therefore, a non statistical significance in Chi-square test is desired, whereas the ratio of
Chi-square and degrees of freedom should be less than two. A significant indicates
that there is a difference between the predicted and observed covariance matrices.
However, the Chi-square test is very sensitive to sample size. A larger sample size
usually leads to statistical significance very easily. Therefore, one cannot rely solely on
the significance of the Chi-square test when the sample size is large. The researchers
need to take other fit indices into consideration. The GFI is the percent of observed
covariance accounted for by the predicted model. It is also larger when the sample size is
large. Usually, GFI should be equal to or larger than 0.90 to indicate a good model fit.
RMSEA is the average of the residuals between the observed covariance and the
expected model. It should be smaller than 0.08 in order to reach a good model fit. If
RMSEA is larger than 0.1, the model is not acceptable.
The relative fit measures are assessing the fit between the null model (assumed
that there are no relationships in the data), and the saturated model (assumed that there is
a perfect fit between the data and the model). These measures include comparative fit
index (CFI), and normed fit index (NFI) and are expected to be larger than 0.9.
Parsimonious fit measures are also known as adjusted fit measures. The adjusted
goodness-of-fit (AGFI) and the parsimonious goodness-of-fit (PGFI) are commonly used
to compare the models with different numbers of parameters by considering the degrees
of freedom. Ideally, values larger than 0.9 indicate an acceptable model.
The general “rule of thumb” for the cut-off value of fit measures is 0.90 for GFI,
CFI, NFI, and 0.1 for RMSEA. However, Bullman (2007), Meyers et al. (2006), and
Schreiber, Stage, King, Nora, and Barlow (2006) suggested that only when NFI, CFI, and
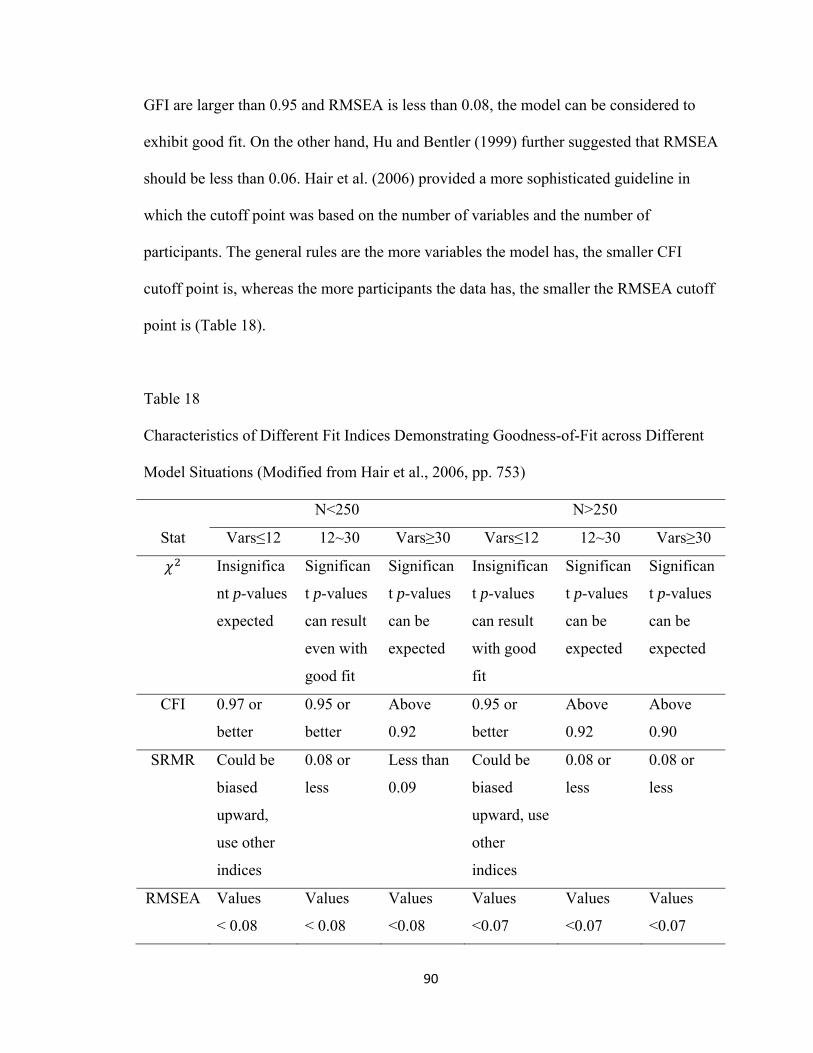
90
GFI are larger than 0.95 and RMSEA is less than 0.08, the model can be considered to
exhibit good fit. On the other hand, Hu and Bentler (1999) further suggested that RMSEA
should be less than 0.06. Hair et al. (2006) provided a more sophisticated guideline in
which the cutoff point was based on the number of variables and the number of
participants. The general rules are the more variables the model has, the smaller CFI
cutoff point is, whereas the more participants the data has, the smaller the RMSEA cutoff
point is (Table 18).
Table 18
Characteristics of Different Fit Indices Demonstrating Goodness-of-Fit across Different
Model Situations (Modified from Hair et al., 2006, pp. 753)
Stat
N<250 N>250
Vars≤12 12~30 Vars≥30 Vars≤12 12~30 Vars≥30
Insignifica
nt p-values
expected
Significan
t p-values
can result
even with
good fit
Significan
t p-values
can be
expected
Insignifican
t p-values
can result
with good
fit
Significan
t p-values
can be
expected
Significan
t p-values
can be
expected
CFI 0.97 or
better
0.95 or
better
Above
0.92
0.95 or
better
Above
0.92
Above
0.90
SRMR Could be
biased
upward,
use other
indices
0.08 or
less
Less than
0.09
Could be
biased
upward, use
other
indices
0.08 or
less
0.08 or
less
RMSEA Values
< 0.08
Values
< 0.08
Values
<0.08
Values
<0.07
Values
<0.07
Values
<0.07
91
Advantage in Using SEM
There are some advantages in using SEM. Theoretically, it allows researchers
draw causality inference even though it is a quasi-experimental research design (Meyers
et al., 2006). However, SEM is not only used in analyzing quasi-experimental data, it also
can be used in analyzing experimental data (Tabachnick & Fidell, 2007). Statistically,
when the relationships among factors are examined, the measurement error is also
estimated and minimized. In addition, by estimating and removing the measurement error,
the measurement can be considered as reliable. Further, SEM can be used to examine the
mediator processes, and the contribution of mediators is explicitly included in the
analysis results. Finally, SEM can be used to analyze complex models, and examine the
relationships among factors simultaneously. In fact, if the hypothesized models are
complex and multidimensional, SEM is the only analysis that is appropriate (Tabachnick
& Fidell, 2007).
Limitations to SEM
SEM is a confirmatory technique (Tabachnick & Fidell, 2007). Therefore, it is
important to have a theory-based hypothesized model to examine the relationship among
the factors in the model. Therefore, when we conduct a SEM, researchers should have
prior knowledge about research-related theories and plan ahead.
A researcher can modify his/her model in order to obtain a better fit. However,
too many modifications lead to risk the Type I error. Therefore, the results should be

92
viewed cautiously, and if it is possible, perform cross-validation with another sample
(Tabachnick & Fidell, 2007).
Although some researchers claimed that SEM can be used for causality inference,
some researchers have a different opinion. They argue that causality should be a research
issue, not a statistical issue (Tabachnick & Fidell, 2007). Therefore, based on the results
from SEM, causality inferences cannot be drawn unless the research design provides
necessary and sufficient information for researcher to make the conclusion.
This research sought to answer the following questions by using SEM:
Research Question 1: Overall, can the hypothesized model explain the relationship
among students’ characteristics, self-regulated learning (motivation and learning
strategies), technology self-efficacy, and course outcomes (achievement and course
satisfaction) in online learning settings?
In order to answer research question 1, the χ2 and model fit indices were used to
determine if the data fit the hypothesis model. The cutoff points are 0.90 for GFI, CFI,
NFI, and 0.08 for RMSEA.
Research Question 2: Do students’ characteristics influence self-regulated learning,
technology self-efficacy, and course outcomes (achievement, and satisfaction) in online
learning settings?
The significance of path coefficients between students’ characteristics and self-
regulated learning (Path 1, Figure 10), students’ characteristics and technology self-

93
efficacy (Path 2), and students’ characteristics and course outcomes (Path 6) were used to
determine their relationships. Students’ characteristics represent the exogenous variables,
while self-regulated learning, technology self-efficacy, and course outcomes are
endogenous variables in current study. Since these variables are latent variables and
cannot be observed, factor analysis was performed for the each scale to obtain the
observed variables for each latent variable. In addition, to determine internal consistency
Cronbach’s alpha was also performed to determine the reliability of each factor.
Research Question 3: A. Does students’ self-regulated learning influence the course
outcomes in online learning settings? B. Does students’ technology self-efficacy influence
the course outcomes in online learning settings? C. Do students’ self-regulated learning
and technology self-efficacy interact with each other?
Similar to Research Question 1, the significance of path coefficients are used to
determine the relations between self-regulated learning and course outcomes (Path 4),
technology self-efficacy and course outcomes (Path 5), and self-regulated learning and
technology self-efficacy (Path 3).
Research Question 4: Are self-regulated learning and technology self-efficacy mediators
between students’ characteristics, and the course outcomes?
A variable can be considered as a mediator when: (1) it is influenced by the
independent variable (exogenous), (2) it influences the dependent variable (endogenous),
and (3) there is no statistically significant or only a small relationship between
independent and dependent variables (Neu, 2000). Therefore, if the path coefficient
94
between students’ characteristics and course outcomes (Path 6) does not reach statistical
significance, and other path coefficients are statistically significant, or the path
coefficients between students’ characteristics and course outcomes reach statistical
significant but are smaller than other path coefficients, then, the research hypothesis is
supported.
Summary
In order to determine the relationship among students’ characteristics, self-
regulated learning, technology self-efficacy, and course outcomes in online learning
settings, students at Auburn University enrolled in online courses during 2008-2009
academic year were invited to participate in the current study. The Students’
demographic information, the characteristics questionnaire, the Modified Motivation
Strategies for Learning Questionnaire, the Open-ended Learning Strategies Questionnaire,
the Online Technology Self-Efficacy Scale, the Course Satisfaction Questionnaire, and
the final grades were the instruments used to collect data.
The survey was distributed via Auburn University e-Mail system. The final data
consisted of 256 participants. Factor analysis results suggested one factor for the Course
Satisfaction Questionnaire, three factors for the Motivation Subscale of the Modified
MSLQ, four factors for the Learning Strategies Subscale of the Modified MSLQ, and two
factors for the Online Technology Self-Efficacy Scale. The results were similar to the
previous research. Internal consistency Cronbach’s alpha suggested that these instruments
yield highly reliable scores. Structural Equation Modeling was the major statistical
technique used to analyze the data and answer the research questions.
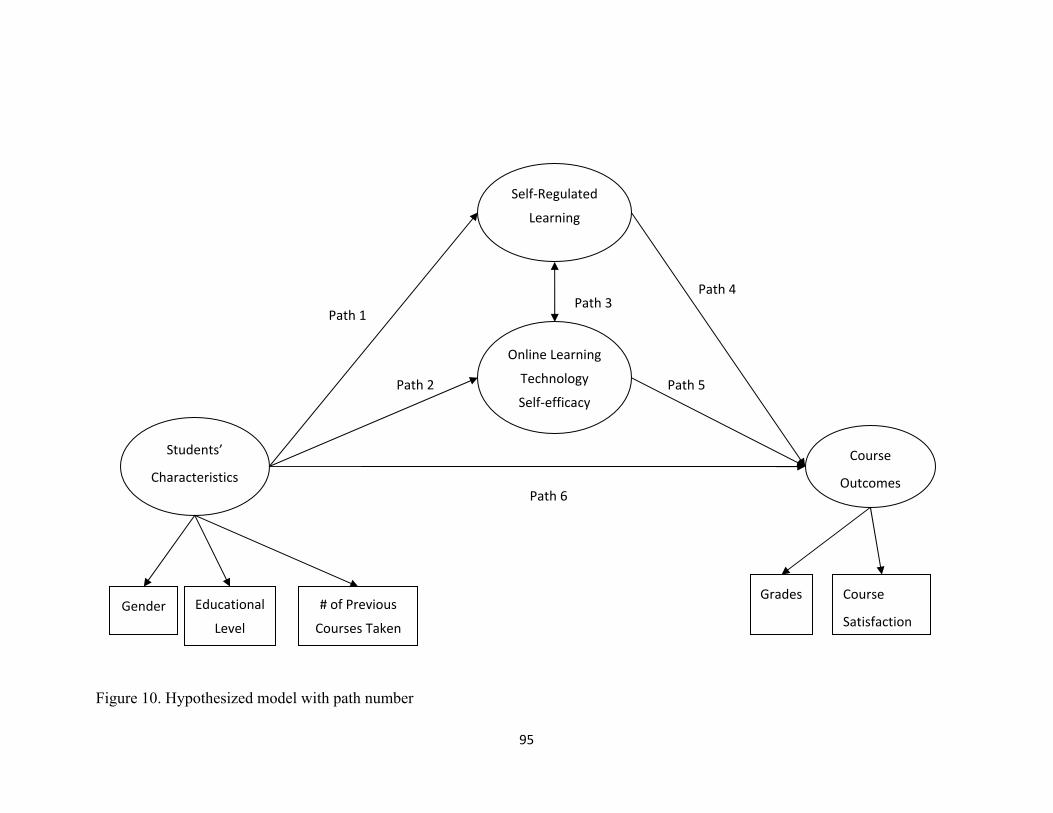
95
Figure 10. Hypothesized model with path number
Path 3 Path 1
Path 4
Path 5 Path 2
Students’
Characteristics
Online Learning
Technology
Self‐efficacy
Gender
Self‐Regulated
Learning
Course
Outcomes
Grades Course
Satisfaction
Path 6
Educational
Level
# of Previous
Courses Taken
96
IV. RESULTS
The purpose of this study was to examine the relationships among student’s
characteristics, self-regulated learning, technology self-efficacy, and course outcomes
simultaneously in order to provide an overall view. A hypothesized model was generated
based on previous studies. The research questions for current study were:
(1) Overall, can the hypothesized model explain the relationship among students’
characteristics and previous online learning experiences, self-regulated
learning (motivation and learning strategies), technology self-efficacy, and
course outcomes (achievement and course satisfaction) in online learning
settings?
(2) Do students’ characteristics and previous online learning experiences
influence self-regulated learning, technology self-efficacy, and course
outcomes (achievement, and satisfaction) in online learning settings?
(3) A. Does students’ self-regulated learning influence the course outcomes in
online learning settings?
B. Does students’ technology self-efficacy influence the course outcomes in
online learning settings?
C. Do students’ self-regulated learning and technology self-efficacy interact
with each other?
97
(4) Are self-regulated learning and technology self-efficacy mediators between
students’ characteristics, and the course outcomes?
In order to answer these research questions, a Demographic Questionnaire, a
Course Satisfaction Questionnaire (CSQ), a Modified Motivation Strategies for Learning
Questionnaire (Modified MSLQ), and an Online Technology Self-Efficacy Scale
(OTSES) were used as the instruments in current study. The instruments were
administered by SurveyMonkey.com. All data were collected anonymously. Because the
survey in the current study consisted of a total of 130 items, a Latin Square Design was
used to generate seven different forms of the instrument with the same items in a
different order to avoid response sets and eliminate system error. All 2139 potential
participants were randomly assigned to seven groups. Each group received one type of
survey form. All groups had a similar combination of graduate and undergraduate
students, as well as males and females. Two hundred and fifty-sixty participants
completed the survey with a response rate at 12.05%. The returned responses consisted of
121 males and 135 females, whereas 95 participants were graduate students and 161 of
them were undergraduate students.
Quantitative Research Results
The Statistical Package for Social Science (SPSS) 17.0 and AMOS 17.0 were
used as the statistical software to analyze the data, while covariance-based structural
equation modeling (SEM) with maximum likelihood estimation was used to examine the
hypothesized model and answer the research questions. The AMOS program provided
indices in terms of determining the model fit of SEM. These indices included the
98
Goodness-of-fit test (Chi-square statistic, ), the goodness-of-fit index (GFI), the
comparative fit index (CFI), the normed fit index (NFI), and the root mean square error
of approximation (RMSEA). Usually, the Chi-square is expected to be non-significant to
indicate a better model fit. However, Chi-square is very sensitive to sample size.
Therefore, other fit indices were used for further model evaluation. The general “rule of
thumb” for cut-off values of fit measures is 0.90 for GFI, CFI, NFI, and 0.08 for
RMSEA.
Descriptive Statistics and Assumptions
Descriptive statistics for all variables are shown on Table 19. The mean for the
Motivation Subscale of the Modified MSLQ for the sample was 100.137 with a standard
deviation of 16.733. For the Learning Strategies Subscale of the Modified MSLQ, the
mean was 138.770 with a standard deviation of 24.558. The Online Technology Self-
Efficacy Scale yielded a mean of 111.461 with a standard deviation of 9.427, whereas the
Course Satisfaction Questionnaire yielded a mean of 116.004 with a standard deviation of
24.817. The average of final scores for the most recent online course was 3.7 with a
standard deviation of 0.63.
The Bivariate correlation Pearson correlation coefficients were computed to
investigate the linearity between the indicator variables and their latent variables, and
among the latent variables (Table 20). The correlation coefficients between each indicator
and its latent variable ranged from 0.397 to 0.926, indicating that the linearity assumption
between indicator and latent variables was not violated. In addition, the correlation
coefficients among latent variables ranged from 0.288 to 0.659, indicating that there was

99
a linear relationship among latent variables. Further, the correlation coefficients among
indicators are ranged from 0.034 to 0.736, indicating a small possibility of
multicollinearity and singularity of the covariance matrix. However, based on the results
of normality assessment in AMOS, the multivariate normality assumption is violated
(kurtosis=89.720, critical ratio=33.911). Therefore, Bollen-Stine bootstrap method is
suggested to be used for inference of exact structural model (Garson, 2009).
Table 19
Descriptive Statistics for All Variables (N=256)
Measure M Std Motivation 100.137 16.733
Self-Efficacy 46.828 8.590 Test Anxiety 18.387 7.660 Task Value 34.922 7.191
Learning Strategies 138.770 24.558 Elaboration 44.606 8.222 Time Management 35.090 7.921 Self-Regulated Learning and Metacognition 35.813 8.957 Critical Thinking 23.262 6.125
Technology Self-efficacy 111.461 9.427 General 66.344 4.961 Online 45.117 5.278
Course Satisfaction 116.004 24.817 Performance 3.668 .677
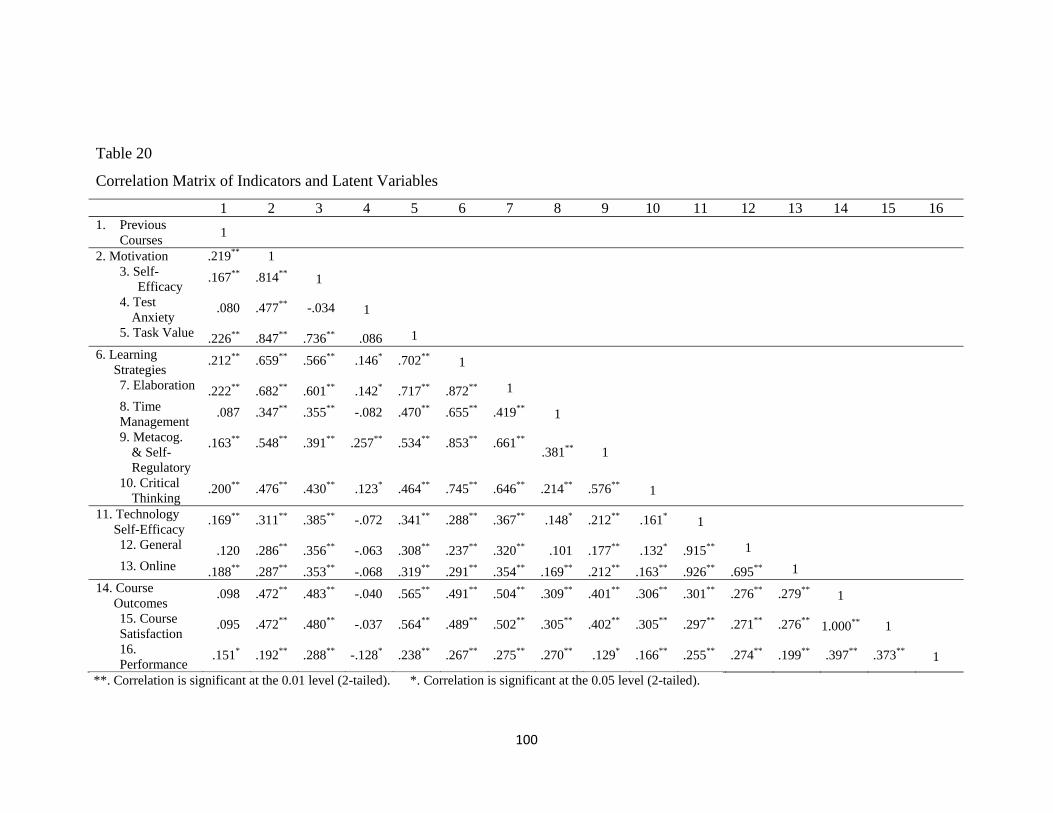
100
Table 20
Correlation Matrix of Indicators and Latent Variables
1 2 3 4 5 6 7 8 9 10 11 12 13 14 15 16 1. Previous
Courses 1
2. Motivation .219** 1 3. Self-
Efficacy .167** .814** 1
4. Test Anxiety
.080 .477** -.034 1
5. Task Value .226** .847** .736** .086 1 6. Learning
Strategies .212** .659** .566** .146* .702** 1
7. Elaboration .222** .682** .601** .142* .717** .872** 1 8. Time Management
.087 .347** .355** -.082 .470** .655** .419** 1
9. Metacog. & Self-Regulatory
.163** .548** .391** .257** .534** .853** .661** .381** 1
10. Critical Thinking
.200** .476** .430** .123* .464** .745** .646** .214** .576** 1
11. Technology Self-Efficacy
.169** .311** .385** -.072 .341** .288** .367** .148* .212** .161* 1
12. General .120 .286** .356** -.063 .308** .237** .320** .101 .177** .132* .915** 1 13. Online .188** .287** .353** -.068 .319** .291** .354** .169** .212** .163** .926** .695** 1
14. Course Outcomes
.098 .472** .483** -.040 .565** .491** .504** .309** .401** .306** .301** .276** .279** 1
15. Course Satisfaction
.095 .472** .480** -.037 .564** .489** .502** .305** .402** .305** .297** .271** .276** 1.000** 1
16. Performance
.151* .192** .288** -.128* .238** .267** .275** .270** .129* .166** .255** .274** .199** .397** .373** 1
**. Correlation is significant at the 0.01 level (2-tailed). *. Correlation is significant at the 0.05 level (2-tailed).

101
Hypothesized Model
Analysis of the hypothesized model indicated an unacceptable fit between the
hypothesis model and the observed data (Figure 11). The Chi-square test was statistically
significant ( 232.936, 71, 0.001), and the GFI, the CFI, and the NFI
values were 0.880, 0.868, and 0.823, respectively, indicating a relatively poor fit. The
RMSEA yielded a value of 0.095, indicating a moderate fit of the model. Overall, the
model was not acceptable. Not all the path coefficient demonstrated statistical
significance ( 0.05) and practical significance ( 0.3) (Table 21).
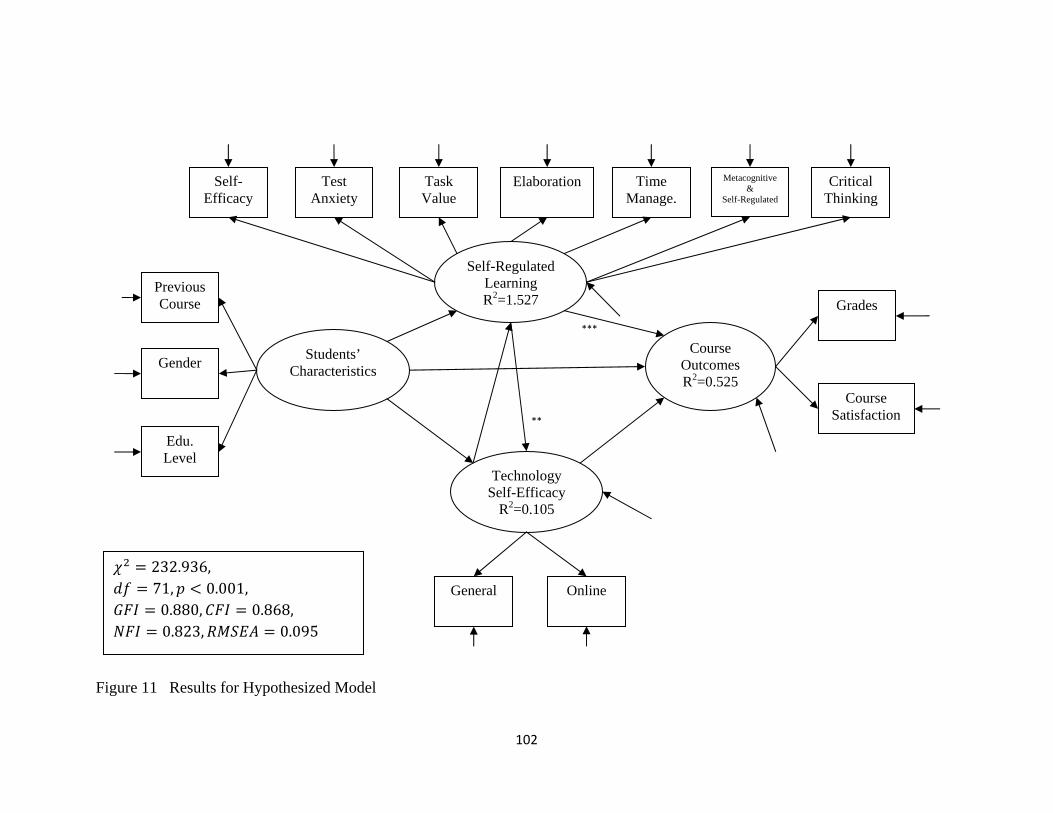
102
Figure 11 Results for Hypothesized Model
***
Self-Regulated Learning R2=1.527
Students’ Characteristics
Course Outcomes R2=0.525
Technology Self-Efficacy
R2=0.105
Previous Course
Gender
Edu. Level
Task Value
Test Anxiety
Self-Efficacy
Elaboration Time Manage.
Metacognitive &
Self-Regulated
Critical Thinking
Grades
Course Satisfaction
General Online
**
232.936, 71, 0.001,
0.880, 0.868, 0.823, 0.095
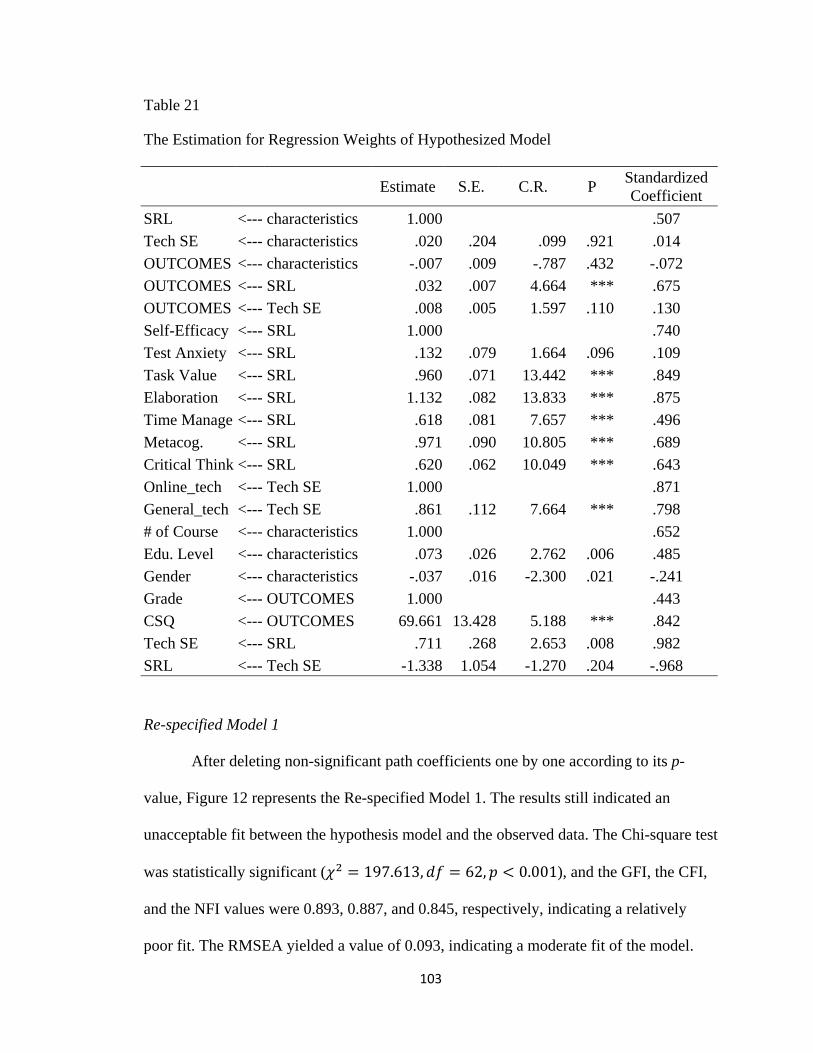
103
Table 21
The Estimation for Regression Weights of Hypothesized Model
Estimate S.E. C.R. P Standardized Coefficient
SRL <--- characteristics 1.000 .507 Tech SE <--- characteristics .020 .204 .099 .921 .014 OUTCOMES <--- characteristics -.007 .009 -.787 .432 -.072 OUTCOMES <--- SRL .032 .007 4.664 *** .675 OUTCOMES <--- Tech SE .008 .005 1.597 .110 .130 Self-Efficacy <--- SRL 1.000 .740 Test Anxiety <--- SRL .132 .079 1.664 .096 .109 Task Value <--- SRL .960 .071 13.442 *** .849 Elaboration <--- SRL 1.132 .082 13.833 *** .875 Time Manage <--- SRL .618 .081 7.657 *** .496 Metacog. <--- SRL .971 .090 10.805 *** .689 Critical Think <--- SRL .620 .062 10.049 *** .643 Online_tech <--- Tech SE 1.000 .871 General_tech <--- Tech SE .861 .112 7.664 *** .798 # of Course <--- characteristics 1.000 .652 Edu. Level <--- characteristics .073 .026 2.762 .006 .485 Gender <--- characteristics -.037 .016 -2.300 .021 -.241 Grade <--- OUTCOMES 1.000 .443 CSQ <--- OUTCOMES 69.661 13.428 5.188 *** .842 Tech SE <--- SRL .711 .268 2.653 .008 .982 SRL <--- Tech SE -1.338 1.054 -1.270 .204 -.968
Re-specified Model 1
After deleting non-significant path coefficients one by one according to its p-
value, Figure 12 represents the Re-specified Model 1. The results still indicated an
unacceptable fit between the hypothesis model and the observed data. The Chi-square test
was statistically significant ( 197.613, 62, 0.001), and the GFI, the CFI,
and the NFI values were 0.893, 0.887, and 0.845, respectively, indicating a relatively
poor fit. The RMSEA yielded a value of 0.093, indicating a moderate fit of the model.
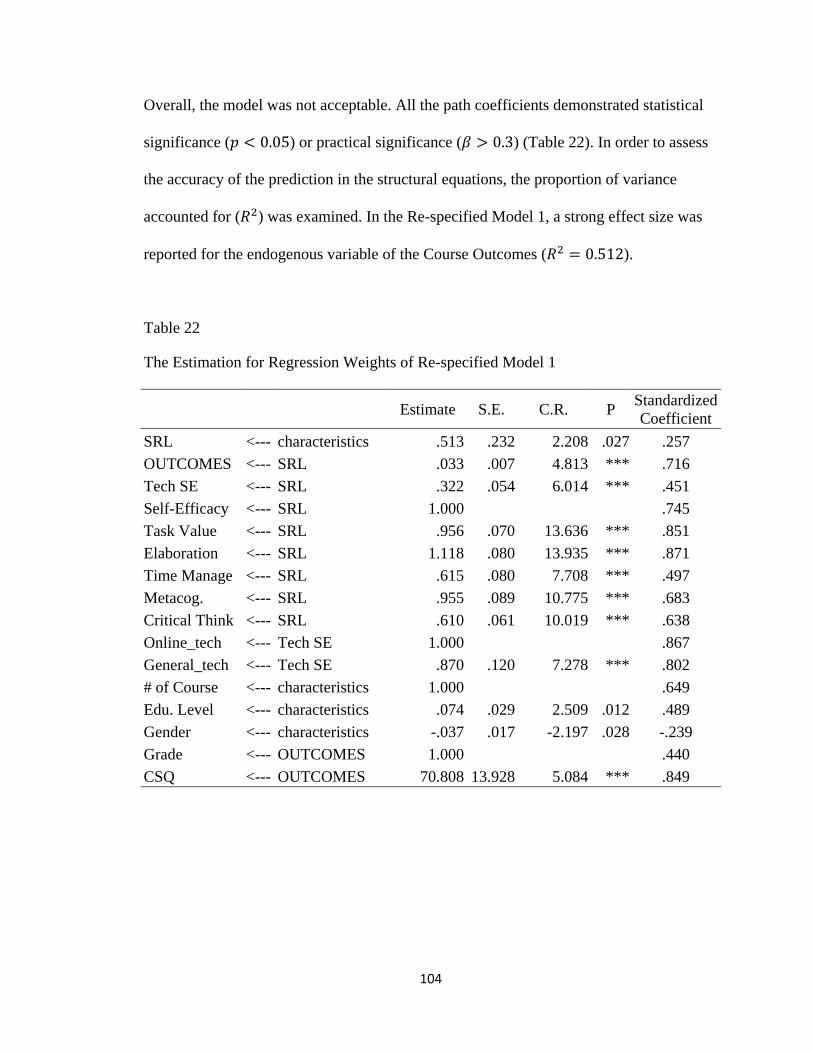
104
Overall, the model was not acceptable. All the path coefficients demonstrated statistical
significance ( 0.05) or practical significance ( 0.3) (Table 22). In order to assess
the accuracy of the prediction in the structural equations, the proportion of variance
accounted for ( ) was examined. In the Re-specified Model 1, a strong effect size was
reported for the endogenous variable of the Course Outcomes ( 0.512).
Table 22
The Estimation for Regression Weights of Re-specified Model 1
Estimate S.E. C.R. P Standardized Coefficient
SRL <--- characteristics .513 .232 2.208 .027 .257 OUTCOMES <--- SRL .033 .007 4.813 *** .716 Tech SE <--- SRL .322 .054 6.014 *** .451 Self-Efficacy <--- SRL 1.000 .745 Task Value <--- SRL .956 .070 13.636 *** .851 Elaboration <--- SRL 1.118 .080 13.935 *** .871 Time Manage <--- SRL .615 .080 7.708 *** .497 Metacog. <--- SRL .955 .089 10.775 *** .683 Critical Think <--- SRL .610 .061 10.019 *** .638 Online_tech <--- Tech SE 1.000 .867 General_tech <--- Tech SE .870 .120 7.278 *** .802 # of Course <--- characteristics 1.000 .649 Edu. Level <--- characteristics .074 .029 2.509 .012 .489 Gender <--- characteristics -.037 .017 -2.197 .028 -.239 Grade <--- OUTCOMES 1.000 .440 CSQ <--- OUTCOMES 70.808 13.928 5.084 *** .849

105
Figure 12 Results for Re-specified Model 1
0.716*** 0.257*
Self-Regulated Learning R2=0.066
Students’ Characteristics
Course Outcomes R2=0.512
Technology Self-Efficacy
R2=0.203
Previous Course
Gender
Edu. Level
Task Value
Self-Efficacy
Elaboration Time Manage.
Metacognitive &
Self-Regulated
Critical Thinking
Grades
Course Satisfaction
General Online
0.451***
197.613, 62, 0.001,
0.893, 0.887, 0.845, 0.093
106
Re-specified Model 2
According to Pintrich, Smith, Garcia and Mckeachie (1993), the development of
MSLQ was based on general cognitive views of motivation and learning strategies. The
motivation subscale was based on a general social-cognitive model of motivation,
whereas the learning strategies subscale was based on a general cognitive model of
learning and information processing. Therefore, the Modified MSLQ used in the current
study can be considered as measuring two different constructs: motivation and learning
strategies. In addition, Paechter et al. (2010) pointed out that learning achievement is the
cognitive dimension of a course outcome, while the course satisfaction is the emotional
dimension of a course outcome. Therefore, these two variables can also be considered as
two independent observed variables in the SEM model. Furthermore, the previous
research provided conflicting results in the relationship among students’ characteristics,
self-regulated learning, technology self-efficacy, and course outcomes. Therefore,
gender, the number of previous online courses taken, and the educational level can also
be considered as three different observed variables in the model instead of the indicators
of an antecedent latent variable in order to obtain a better understanding in their
relationships with other variables. Hence, the Hypothesized Model is modified into Re-
specified Model 2, and its results are shown on Figure 13 and Table 23.
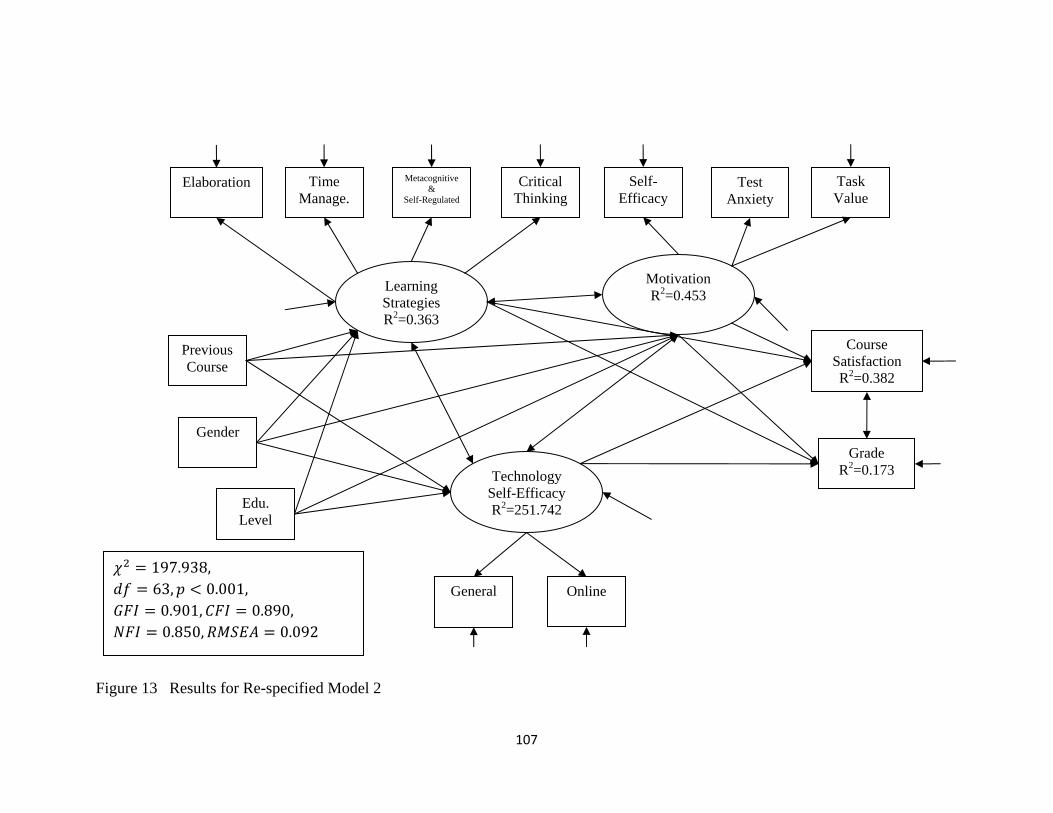
107
Figure 13 Results for Re-specified Model 2
Learning Strategies R2=0.363
Technology Self-Efficacy R2=251.742
Previous Course
Gender
Edu. Level
Task Value
Self-Efficacy
Elaboration Time Manage.
Metacognitive &
Self-Regulated
Critical Thinking
Course Satisfaction R2=0.382
Grade R2=0.173
General Online 197.938, 63, 0.001,
0.901, 0.890, 0.850, 0.092
Motivation R2=0.453
Test Anxiety
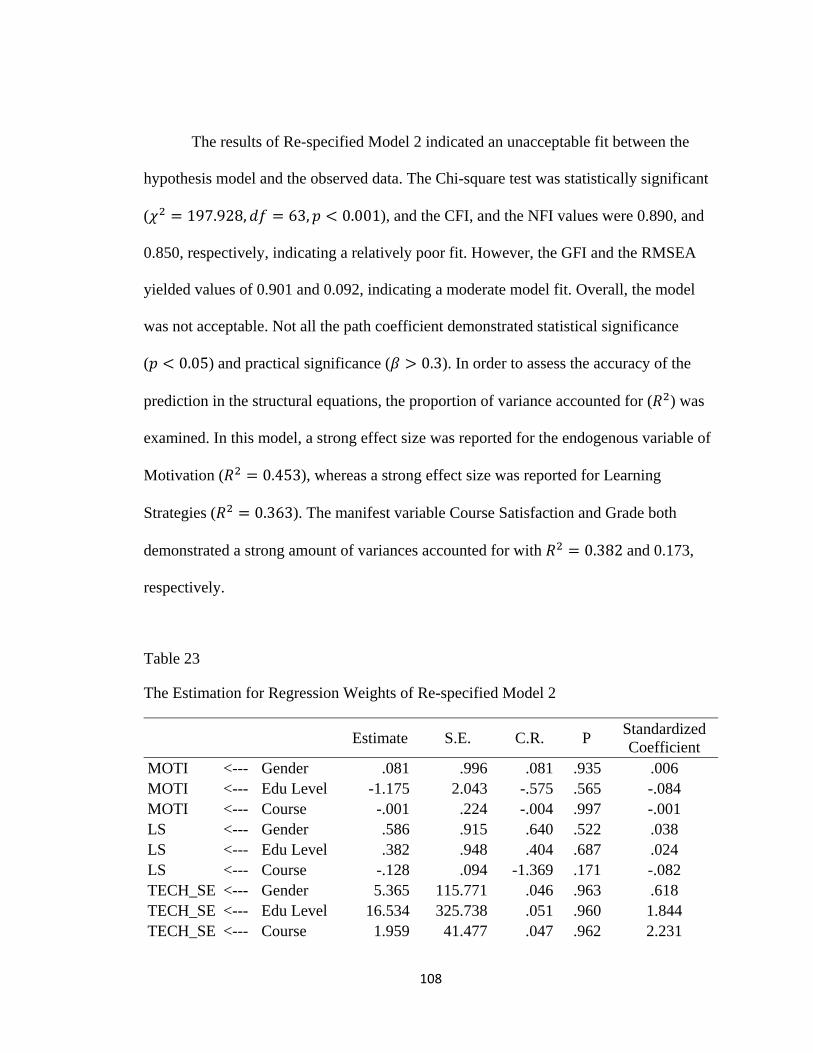
108
The results of Re-specified Model 2 indicated an unacceptable fit between the
hypothesis model and the observed data. The Chi-square test was statistically significant
( 197.928, 63, 0.001), and the CFI, and the NFI values were 0.890, and
0.850, respectively, indicating a relatively poor fit. However, the GFI and the RMSEA
yielded values of 0.901 and 0.092, indicating a moderate model fit. Overall, the model
was not acceptable. Not all the path coefficient demonstrated statistical significance
( 0.05) and practical significance ( 0.3). In order to assess the accuracy of the
prediction in the structural equations, the proportion of variance accounted for ( ) was
examined. In this model, a strong effect size was reported for the endogenous variable of
Motivation ( 0.453), whereas a strong effect size was reported for Learning
Strategies ( 0.363). The manifest variable Course Satisfaction and Grade both
demonstrated a strong amount of variances accounted for with 0.382 and 0.173,
respectively.
Table 23
The Estimation for Regression Weights of Re-specified Model 2
Estimate S.E. C.R. P Standardized Coefficient
MOTI <--- Gender .081 .996 .081 .935 .006 MOTI <--- Edu Level -1.175 2.043 -.575 .565 -.084 MOTI <--- Course -.001 .224 -.004 .997 -.001 LS <--- Gender .586 .915 .640 .522 .038 LS <--- Edu Level .382 .948 .404 .687 .024 LS <--- Course -.128 .094 -1.369 .171 -.082 TECH_SE <--- Gender 5.365 115.771 .046 .963 .618 TECH_SE <--- Edu Level 16.534 325.738 .051 .960 1.844 TECH_SE <--- Course 1.959 41.477 .047 .962 2.231
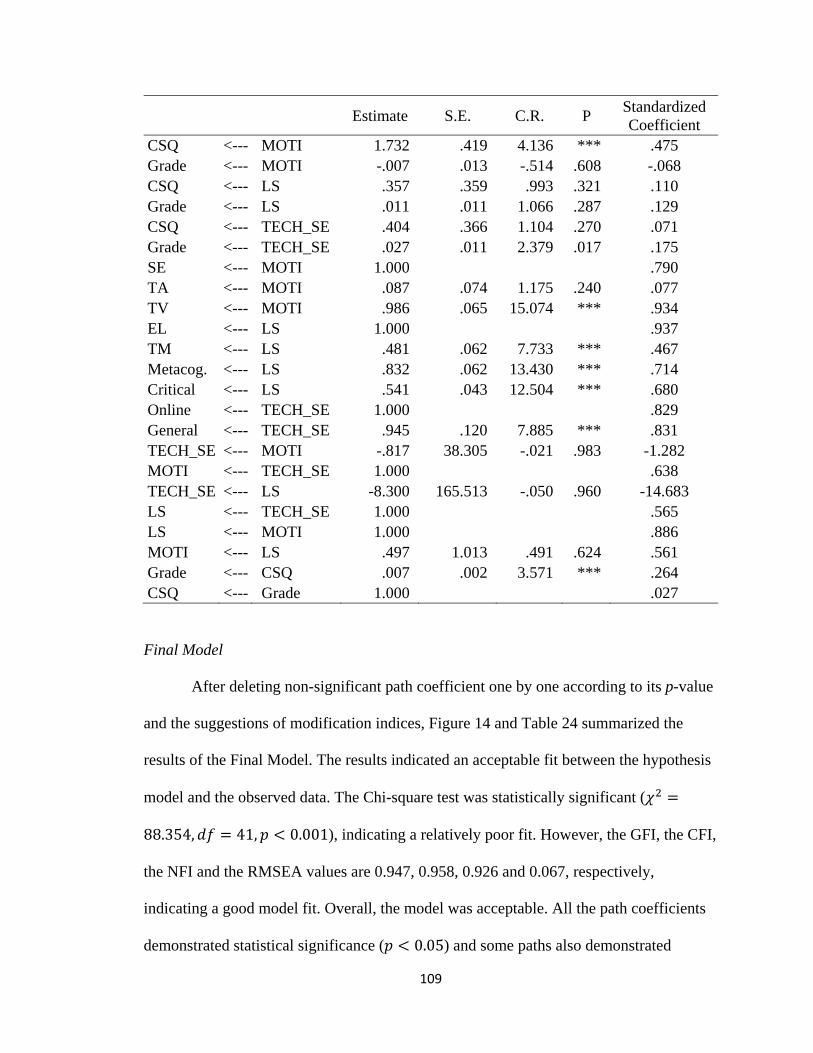
109
Estimate S.E. C.R. P Standardized Coefficient
CSQ <--- MOTI 1.732 .419 4.136 *** .475 Grade <--- MOTI -.007 .013 -.514 .608 -.068 CSQ <--- LS .357 .359 .993 .321 .110 Grade <--- LS .011 .011 1.066 .287 .129 CSQ <--- TECH_SE .404 .366 1.104 .270 .071 Grade <--- TECH_SE .027 .011 2.379 .017 .175 SE <--- MOTI 1.000 .790 TA <--- MOTI .087 .074 1.175 .240 .077 TV <--- MOTI .986 .065 15.074 *** .934 EL <--- LS 1.000 .937 TM <--- LS .481 .062 7.733 *** .467 Metacog. <--- LS .832 .062 13.430 *** .714 Critical <--- LS .541 .043 12.504 *** .680 Online <--- TECH_SE 1.000 .829 General <--- TECH_SE .945 .120 7.885 *** .831 TECH_SE <--- MOTI -.817 38.305 -.021 .983 -1.282 MOTI <--- TECH_SE 1.000 .638 TECH_SE <--- LS -8.300 165.513 -.050 .960 -14.683 LS <--- TECH_SE 1.000 .565 LS <--- MOTI 1.000 .886 MOTI <--- LS .497 1.013 .491 .624 .561 Grade <--- CSQ .007 .002 3.571 *** .264 CSQ <--- Grade 1.000 .027
Final Model
After deleting non-significant path coefficient one by one according to its p-value
and the suggestions of modification indices, Figure 14 and Table 24 summarized the
results of the Final Model. The results indicated an acceptable fit between the hypothesis
model and the observed data. The Chi-square test was statistically significant (
88.354, 41, 0.001), indicating a relatively poor fit. However, the GFI, the CFI,
the NFI and the RMSEA values are 0.947, 0.958, 0.926 and 0.067, respectively,
indicating a good model fit. Overall, the model was acceptable. All the path coefficients
demonstrated statistical significance ( 0.05) and some paths also demonstrated

110
practical significance ( 0.3). The endogenous variable of Learning Strategies
demonstrated a small to moderate amount of variance accounted for with 0.028,
whereas Motivation demonstrates a strong amount of variances accounted for with
0.690. The endogenous variable of Technology Self-Efficacy demonstrated a
strong amount of variances accounted for with 0.206. The manifest variable Course
Satisfaction demonstrated strong amounts of variances accounted for with 0.386,
while Grade demonstrates small to moderate amounts of variances accounted for with
0.167.
Table 24
The Estimation for Regression Weights of Final Model
Estimate S.E. C.R. P Standardized Coefficient
LS <--- Course .258 .100 2.570 .010 .167 MOTI <--- LS .743 .061 12.265 *** .831 CSQ <--- MOTI 2.253 .221 10.172 *** .621 TECH_SE <--- MOTI .286 .049 5.847 *** .454 Self-Efficacy <--- MOTI 1.000 .796 Task Value <--- MOTI .963 .062 15.502 *** .916 Elaboration <--- LS 1.000 .930 Time Manage. <--- LS .485 .063 7.735 *** .468 Metocog. <--- LS .844 .062 13.518 *** .720 Critical Think <--- LS .550 .044 12.618 *** .687 Online <--- TECH_SE 1.000 .817 General <--- TECH_SE .979 .125 7.843 *** .851 Grade <--- CSQ .009 .002 5.217 *** .315 Grade <--- TECH_SE .029 .011 2.778 .005 .187

111
Figure 14 Results for Final Model
0.851***
0.930***
0.817
0.831***
0.621***
0.315***
0.796*** 0.687***
0.720*** 0.468***
0.167**
Learning Strategies R2=0.028
Technology Self-Efficacy
R2=0.206
Previous Course
Task Value
Self-Efficacy
Elaboration Time Manage.
Metacognitive &
Self-Regulated
Critical Thinking
Course Satisfaction R2=0.386
Grade R2=0.167
General Online
0.187**
0.454***
88.354, 41, 0.001,
0.947, 0.958, 0.926, 0.067
Motivation R2=0.690
0.916***

112
Based on the Final Model, the number of previous online courses taken affected
the learning strategies of online learning. Students with more experiences in taking online
courses resulted using more effective learning strategies toward their online courses. For
every standard deviation of the number of online courses have taken increased, the
learning strategies effectiveness increased by a 0.167 standard deviation. In addition, the
effectiveness of learning strategies influenced the levels of motivation. Students who
reported more effective learning strategies also reported higher levels of motivation
toward their online courses. For every standard deviation of the learning strategies
effectiveness increased, the levels of motivation increased by a 0.831 standard deviation.
In addition, the levels of motivation influenced students’ levels of course
satisfaction as well as their technology self-efficacy. Students with a higher level of
motivation indicated higher level of satisfaction toward their online courses. Also, they
had a higher level of technology self-efficacy when taking online courses. For every
standard deviation of the levels of Motivation increased, the levels of Course Satisfaction
increased by a 0.621 standard deviation, and the levels of Technology Self-Efficacy
increased by a 0.454 standard deviation.
Furthermore, the levels of course satisfaction and the levels of technology self-
efficacy affect the final grade. Students with higher levels of course satisfaction and
higher levels of technology self-efficacy toward their online courses tended to achieve a
higher final grade. For every standard deviation of the levels of Course Satisfaction
increased, the Grade increased by a 0.315 standard deviation, while for every standard
deviation of the levels of Technology Self-Efficacy increased, the Grade increased by a
0.187 standard deviation.
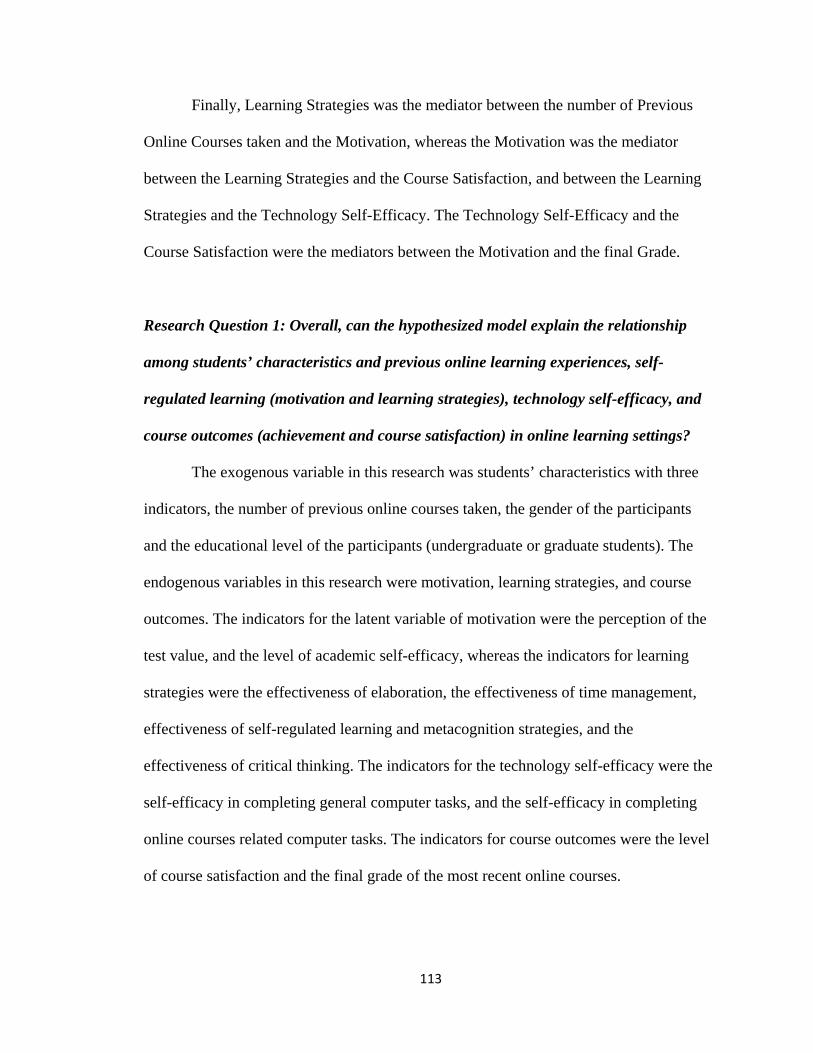
113
Finally, Learning Strategies was the mediator between the number of Previous
Online Courses taken and the Motivation, whereas the Motivation was the mediator
between the Learning Strategies and the Course Satisfaction, and between the Learning
Strategies and the Technology Self-Efficacy. The Technology Self-Efficacy and the
Course Satisfaction were the mediators between the Motivation and the final Grade.
Research Question 1: Overall, can the hypothesized model explain the relationship
among students’ characteristics and previous online learning experiences, self-
regulated learning (motivation and learning strategies), technology self-efficacy, and
course outcomes (achievement and course satisfaction) in online learning settings?
The exogenous variable in this research was students’ characteristics with three
indicators, the number of previous online courses taken, the gender of the participants
and the educational level of the participants (undergraduate or graduate students). The
endogenous variables in this research were motivation, learning strategies, and course
outcomes. The indicators for the latent variable of motivation were the perception of the
test value, and the level of academic self-efficacy, whereas the indicators for learning
strategies were the effectiveness of elaboration, the effectiveness of time management,
effectiveness of self-regulated learning and metacognition strategies, and the
effectiveness of critical thinking. The indicators for the technology self-efficacy were the
self-efficacy in completing general computer tasks, and the self-efficacy in completing
online courses related computer tasks. The indicators for course outcomes were the level
of course satisfaction and the final grade of the most recent online courses.
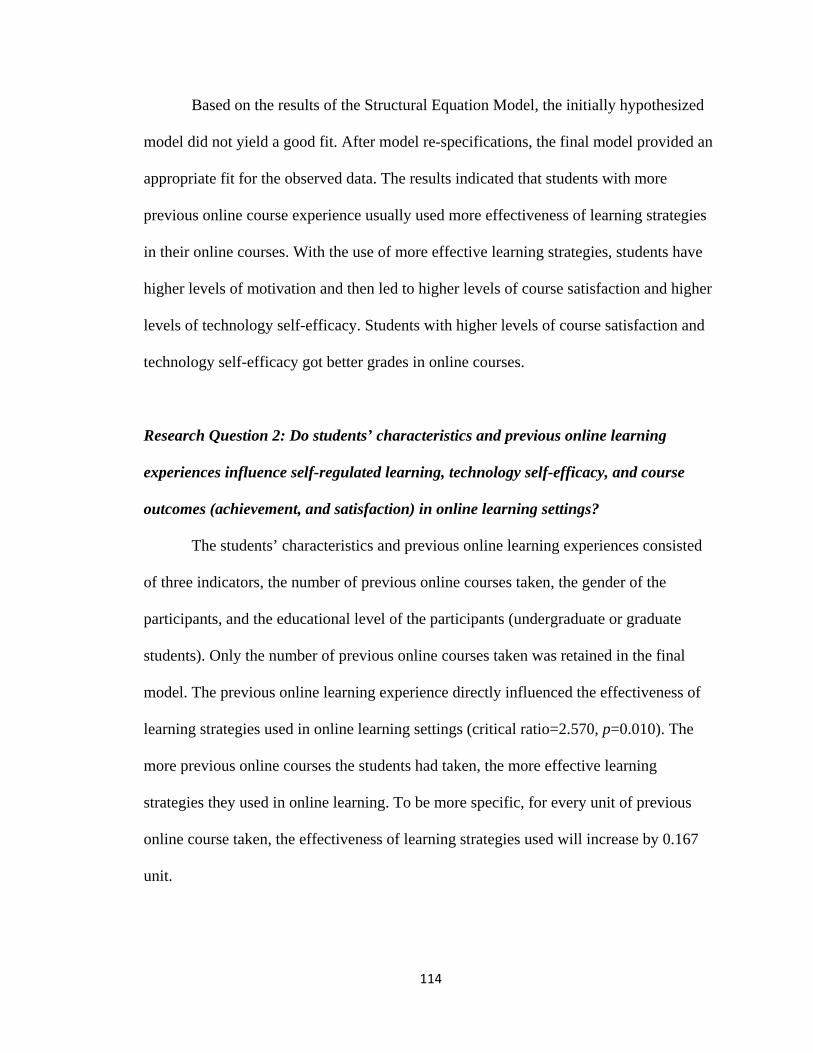
114
Based on the results of the Structural Equation Model, the initially hypothesized
model did not yield a good fit. After model re-specifications, the final model provided an
appropriate fit for the observed data. The results indicated that students with more
previous online course experience usually used more effectiveness of learning strategies
in their online courses. With the use of more effective learning strategies, students have
higher levels of motivation and then led to higher levels of course satisfaction and higher
levels of technology self-efficacy. Students with higher levels of course satisfaction and
technology self-efficacy got better grades in online courses.
Research Question 2: Do students’ characteristics and previous online learning
experiences influence self-regulated learning, technology self-efficacy, and course
outcomes (achievement, and satisfaction) in online learning settings?
The students’ characteristics and previous online learning experiences consisted
of three indicators, the number of previous online courses taken, the gender of the
participants, and the educational level of the participants (undergraduate or graduate
students). Only the number of previous online courses taken was retained in the final
model. The previous online learning experience directly influenced the effectiveness of
learning strategies used in online learning settings (critical ratio=2.570, p=0.010). The
more previous online courses the students had taken, the more effective learning
strategies they used in online learning. To be more specific, for every unit of previous
online course taken, the effectiveness of learning strategies used will increase by 0.167
unit.
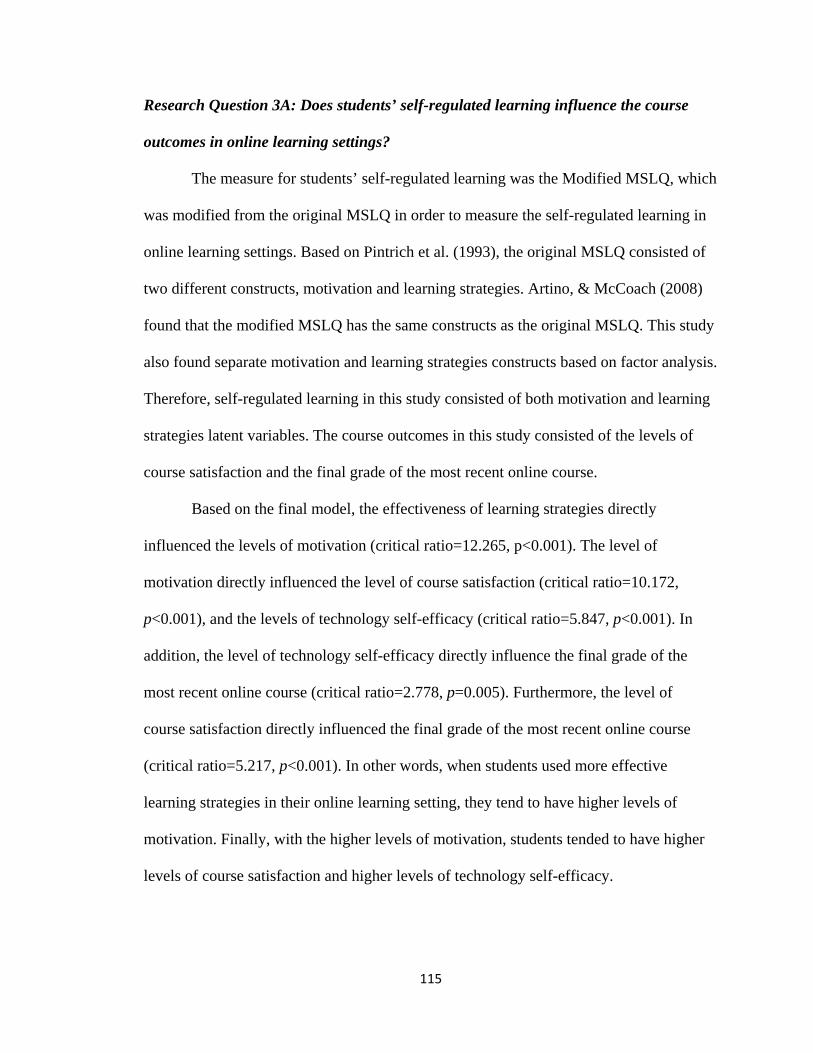
115
Research Question 3A: Does students’ self-regulated learning influence the course
outcomes in online learning settings?
The measure for students’ self-regulated learning was the Modified MSLQ, which
was modified from the original MSLQ in order to measure the self-regulated learning in
online learning settings. Based on Pintrich et al. (1993), the original MSLQ consisted of
two different constructs, motivation and learning strategies. Artino, & McCoach (2008)
found that the modified MSLQ has the same constructs as the original MSLQ. This study
also found separate motivation and learning strategies constructs based on factor analysis.
Therefore, self-regulated learning in this study consisted of both motivation and learning
strategies latent variables. The course outcomes in this study consisted of the levels of
course satisfaction and the final grade of the most recent online course.
Based on the final model, the effectiveness of learning strategies directly
influenced the levels of motivation (critical ratio=12.265, p<0.001). The level of
motivation directly influenced the level of course satisfaction (critical ratio=10.172,
p<0.001), and the levels of technology self-efficacy (critical ratio=5.847, p<0.001). In
addition, the level of technology self-efficacy directly influence the final grade of the
most recent online course (critical ratio=2.778, p=0.005). Furthermore, the level of
course satisfaction directly influenced the final grade of the most recent online course
(critical ratio=5.217, p<0.001). In other words, when students used more effective
learning strategies in their online learning setting, they tend to have higher levels of
motivation. Finally, with the higher levels of motivation, students tended to have higher
levels of course satisfaction and higher levels of technology self-efficacy.
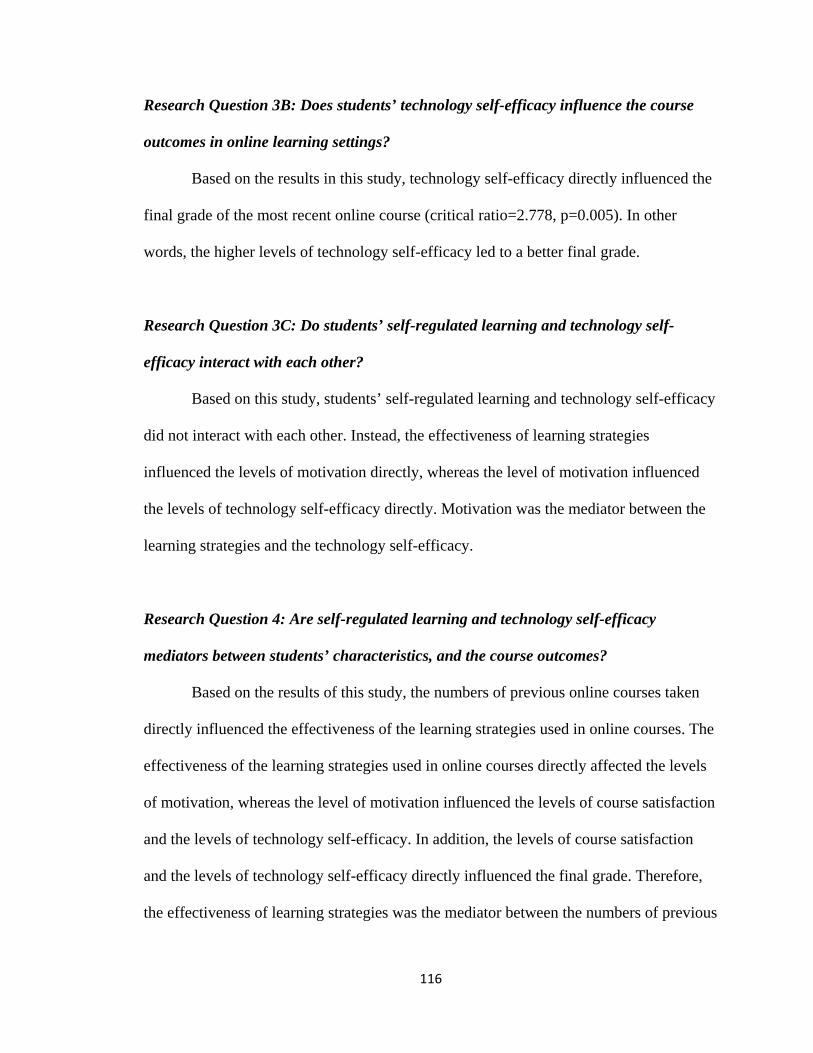
116
Research Question 3B: Does students’ technology self-efficacy influence the course
outcomes in online learning settings?
Based on the results in this study, technology self-efficacy directly influenced the
final grade of the most recent online course (critical ratio=2.778, p=0.005). In other
words, the higher levels of technology self-efficacy led to a better final grade.
Research Question 3C: Do students’ self-regulated learning and technology self-
efficacy interact with each other?
Based on this study, students’ self-regulated learning and technology self-efficacy
did not interact with each other. Instead, the effectiveness of learning strategies
influenced the levels of motivation directly, whereas the level of motivation influenced
the levels of technology self-efficacy directly. Motivation was the mediator between the
learning strategies and the technology self-efficacy.
Research Question 4: Are self-regulated learning and technology self-efficacy
mediators between students’ characteristics, and the course outcomes?
Based on the results of this study, the numbers of previous online courses taken
directly influenced the effectiveness of the learning strategies used in online courses. The
effectiveness of the learning strategies used in online courses directly affected the levels
of motivation, whereas the level of motivation influenced the levels of course satisfaction
and the levels of technology self-efficacy. In addition, the levels of course satisfaction
and the levels of technology self-efficacy directly influenced the final grade. Therefore,
the effectiveness of learning strategies was the mediator between the numbers of previous

117
online courses taken and the motivation. In addition, the mediator between the
effectiveness of the learning strategies and the levels of course satisfaction, and between
the effectiveness of the learning strategies and the levels of technology self-efficacy was
the levels of motivation. Furthermore, the levels of the course satisfaction was a mediator
between motivation and the final grade of the most recent online course. Therefore,
students’ self-regulated learning and their technology self-efficacy were the mediators
between the previous online learning experience and the course outcomes.
Qualitative Research Results
The qualitative data was collected based on the Modified Self-Regulated Learning
Interview Schedule. It was modified from Self-Regulated Learning Interview Schedule
(SRLIS, Zimmerman & Martinez-Pons, 1986). Based on their research, they categorize
self-regulated learning strategies into 15 categories, self-evaluation, organizing and
transforming, goal-setting and planning, seeking information, keeping records and
monitoring, environmental structuring, self-consequences, rehearsing and memorizing,
seeking social assistance from peers, teachers, and adults, reviewing tests, notes, or text
books, and other. There were three open-ended questions in this research regarding the
strategies used in keeping up with assignments (Question 1), remembering information
from the class (Question 2), and reviewing the learning materials (Question 3). In order to
categorize the information from participants’ responses of Question 1, Question 2, and
Question 3, the researcher modified Zimmerman and Martinez-Pons’ (1986) categories
and their definitions so the responses from the participants can be organized based on the
118
online learning settings. Also, students’ who took online courses usually used learning
strategies related to computer technology and online learning platform system. Therefore,
strategies, such as checking e-mails, download files, reviewing Blackboard, reviewing
lecture/video, using electronic planners…etc., were added into the categories. In addition,
three strategies from Zimmerman and Martinez-Pons’s categories were not used by the
participants in this study. Therefore, these three categories, self-evaluation, self-
consequences, and seeking professional assistance, were deleted. The final learning
strategies categories included 28 categories (Table 25). The data was analyzed by Atlas.ti
5.0, which was designed to analyze qualitative data, and the frequency for these three
questions is shown in Table 26.
Further, the last open-ended question was designed to collect the information
about online tools students used (Question 4). The data was also analyzed by Atlas.ti 5.0.
The final online tools categories included 18 categories and the frequency is shown in
Table 27.
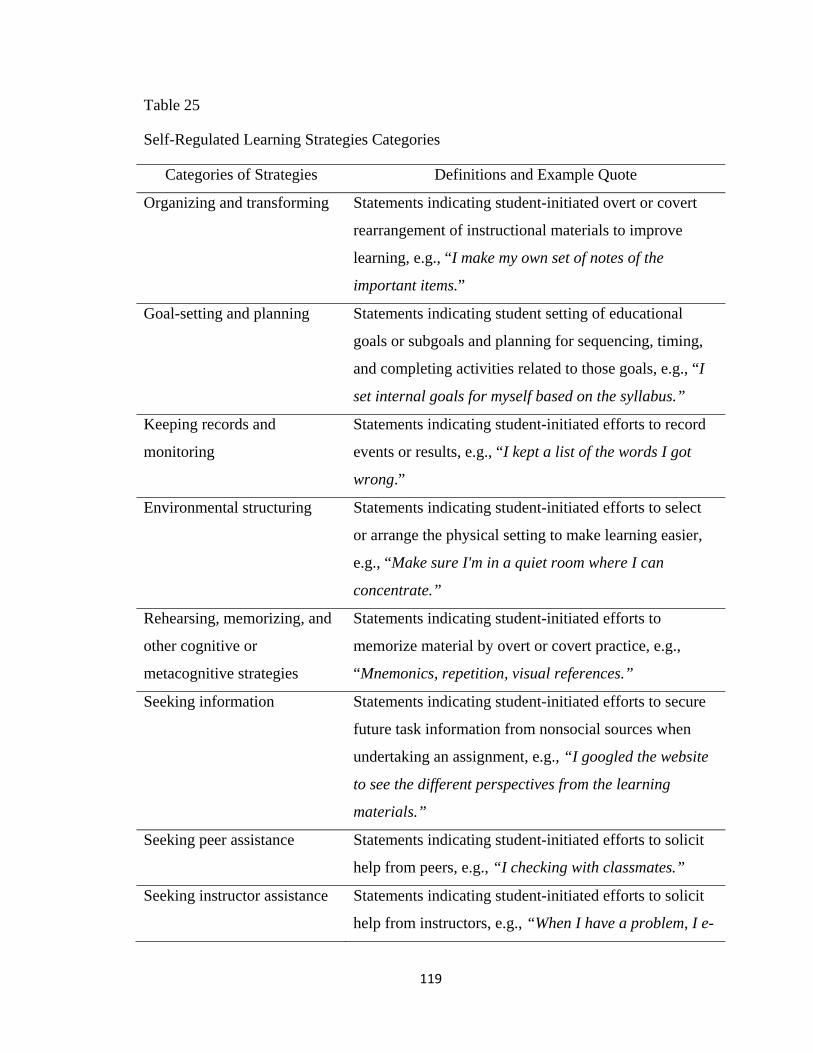
119
Table 25
Self-Regulated Learning Strategies Categories
Categories of Strategies Definitions and Example Quote
Organizing and transforming Statements indicating student-initiated overt or covert
rearrangement of instructional materials to improve
learning, e.g., “I make my own set of notes of the
important items.”
Goal-setting and planning Statements indicating student setting of educational
goals or subgoals and planning for sequencing, timing,
and completing activities related to those goals, e.g., “I
set internal goals for myself based on the syllabus.”
Keeping records and
monitoring
Statements indicating student-initiated efforts to record
events or results, e.g., “I kept a list of the words I got
wrong.”
Environmental structuring Statements indicating student-initiated efforts to select
or arrange the physical setting to make learning easier,
e.g., “Make sure I'm in a quiet room where I can
concentrate.”
Rehearsing, memorizing, and
other cognitive or
metacognitive strategies
Statements indicating student-initiated efforts to
memorize material by overt or covert practice, e.g.,
“Mnemonics, repetition, visual references.”
Seeking information Statements indicating student-initiated efforts to secure
future task information from nonsocial sources when
undertaking an assignment, e.g., “I googled the website
to see the different perspectives from the learning
materials.”
Seeking peer assistance Statements indicating student-initiated efforts to solicit
help from peers, e.g., “I checking with classmates.”
Seeking instructor assistance Statements indicating student-initiated efforts to solicit
help from instructors, e.g., “When I have a problem, I e-
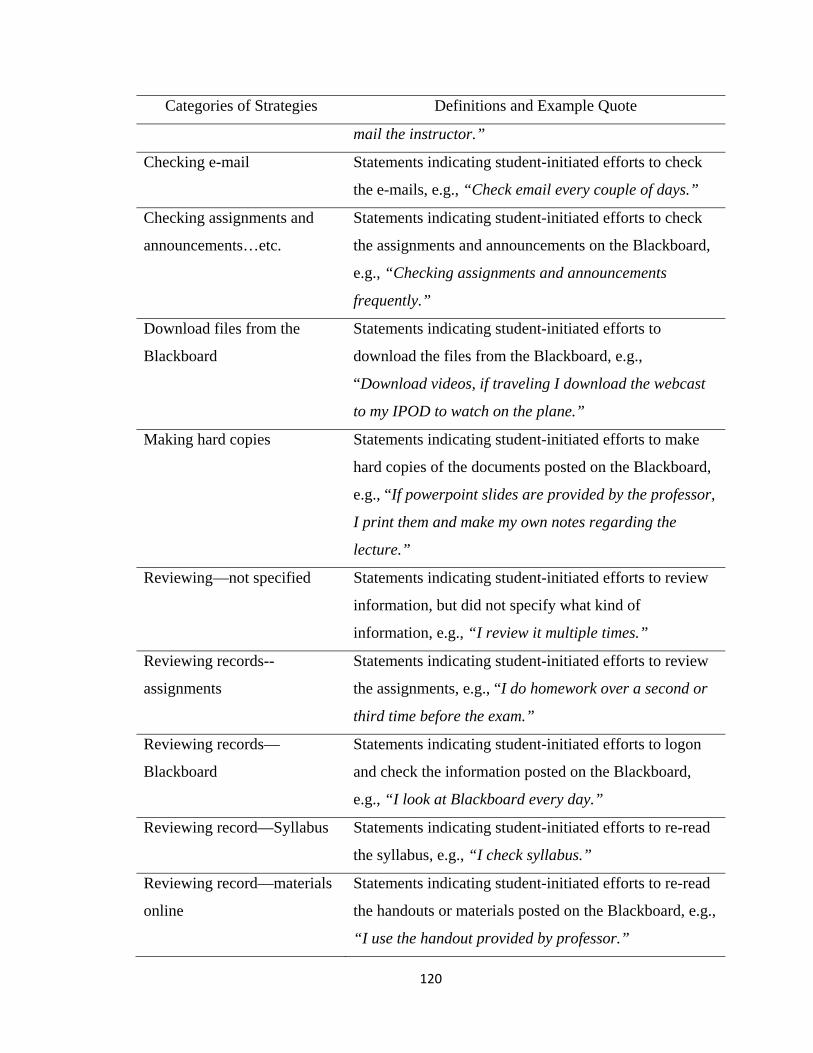
120
Categories of Strategies Definitions and Example Quote
mail the instructor.”
Checking e-mail Statements indicating student-initiated efforts to check
the e-mails, e.g., “Check email every couple of days.”
Checking assignments and
announcements…etc.
Statements indicating student-initiated efforts to check
the assignments and announcements on the Blackboard,
e.g., “Checking assignments and announcements
frequently.”
Download files from the
Blackboard
Statements indicating student-initiated efforts to
download the files from the Blackboard, e.g.,
“Download videos, if traveling I download the webcast
to my IPOD to watch on the plane.”
Making hard copies Statements indicating student-initiated efforts to make
hard copies of the documents posted on the Blackboard,
e.g., “If powerpoint slides are provided by the professor,
I print them and make my own notes regarding the
lecture.”
Reviewing—not specified Statements indicating student-initiated efforts to review
information, but did not specify what kind of
information, e.g., “I review it multiple times.”
Reviewing records--
assignments
Statements indicating student-initiated efforts to review
the assignments, e.g., “I do homework over a second or
third time before the exam.”
Reviewing records—
Blackboard
Statements indicating student-initiated efforts to logon
and check the information posted on the Blackboard,
e.g., “I look at Blackboard every day.”
Reviewing record—Syllabus Statements indicating student-initiated efforts to re-read
the syllabus, e.g., “I check syllabus.”
Reviewing record—materials
online
Statements indicating student-initiated efforts to re-read
the handouts or materials posted on the Blackboard, e.g.,
“I use the handout provided by professor.”

121
Categories of Strategies Definitions and Example Quote
Reviewing lecture/video Statements indicating student-initiated efforts to re-
watch the video lecture posted on the Blackboard, e.g.,
“I watch and re-watch a particular part of a video-taped
class if it does not make sense.”
Reviewing records—test Statements indicating student-initiated efforts to re-read
tests, e.g., “I would go over all the quizzes and made
sure I knew every question.”
Reviewing records—notes Statements indicating student-initiated efforts to re-read
notes, e.g., “I review my notebooks mostly.”
Reviewing records—
textbooks
Statements indicating student-initiated efforts to re-read
textbooks, e.g., “I go through the book chapters.”
Time management—before
due
Statements indicating student-initiated efforts to manage
their time by doing their assignments or tasks before it is
due, e.g., “I tried to have them complete before they
were due.”
Time management—start
early
Statements indicating student-initiated efforts to manage
their time by staring their assignments or tasks as soon
as possible, e.g., “I start as soon as assignment is
posted.”
Time management—general Statements indicating student-initiated efforts to manage
their time in general, e.g., “I set my own schedule to
watch lectures and adhere to it just as I would if I were
attending in person.”
Using
planner/calendar/reminders—
Not specified
Statements indicating student-initiated efforts to use a
planner/calendar/reminders to manage their learning in
general way, e.g., “I keep an agenda.”
Using
planner/calendar/reminders—
Technology
Statements indicating student-initiated efforts to use a
planner/calendar/reminders to manage their learning by
using technology device, e.g., “I use Google Calendar.”
Using Statements indicating student-initiated efforts to use a
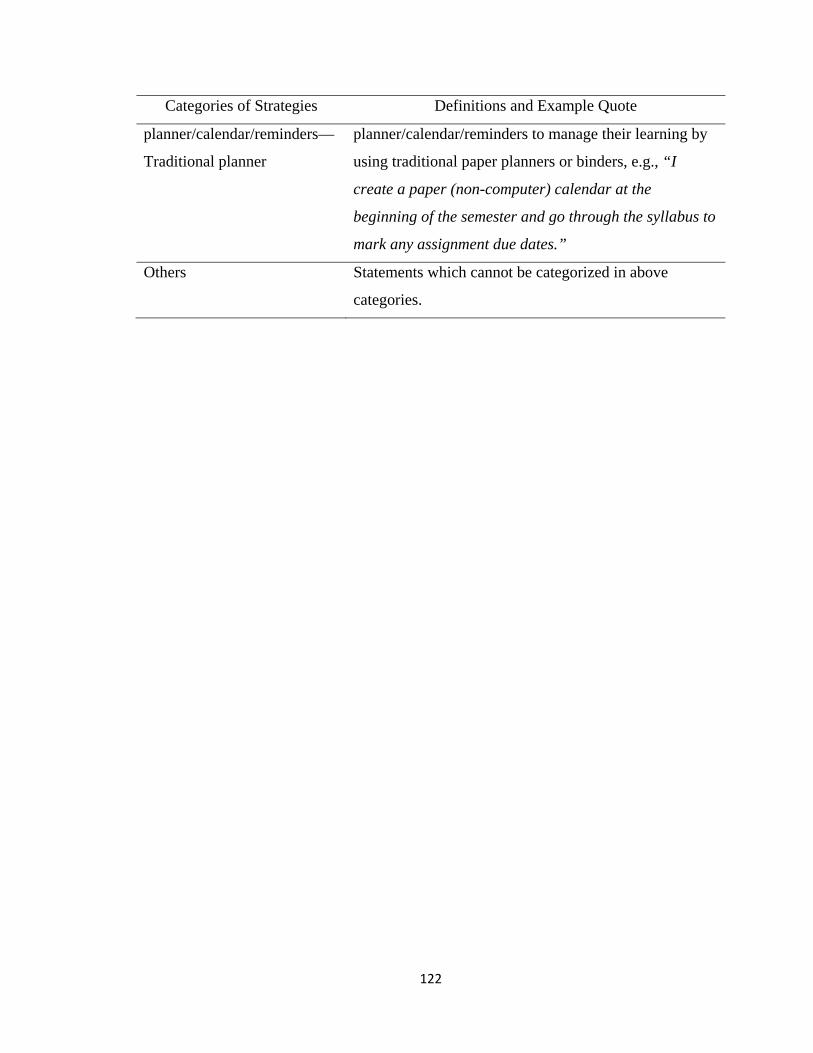
122
Categories of Strategies Definitions and Example Quote
planner/calendar/reminders—
Traditional planner
planner/calendar/reminders to manage their learning by
using traditional paper planners or binders, e.g., “I
create a paper (non-computer) calendar at the
beginning of the semester and go through the syllabus to
mark any assignment due dates.”
Others Statements which cannot be categorized in above
categories.
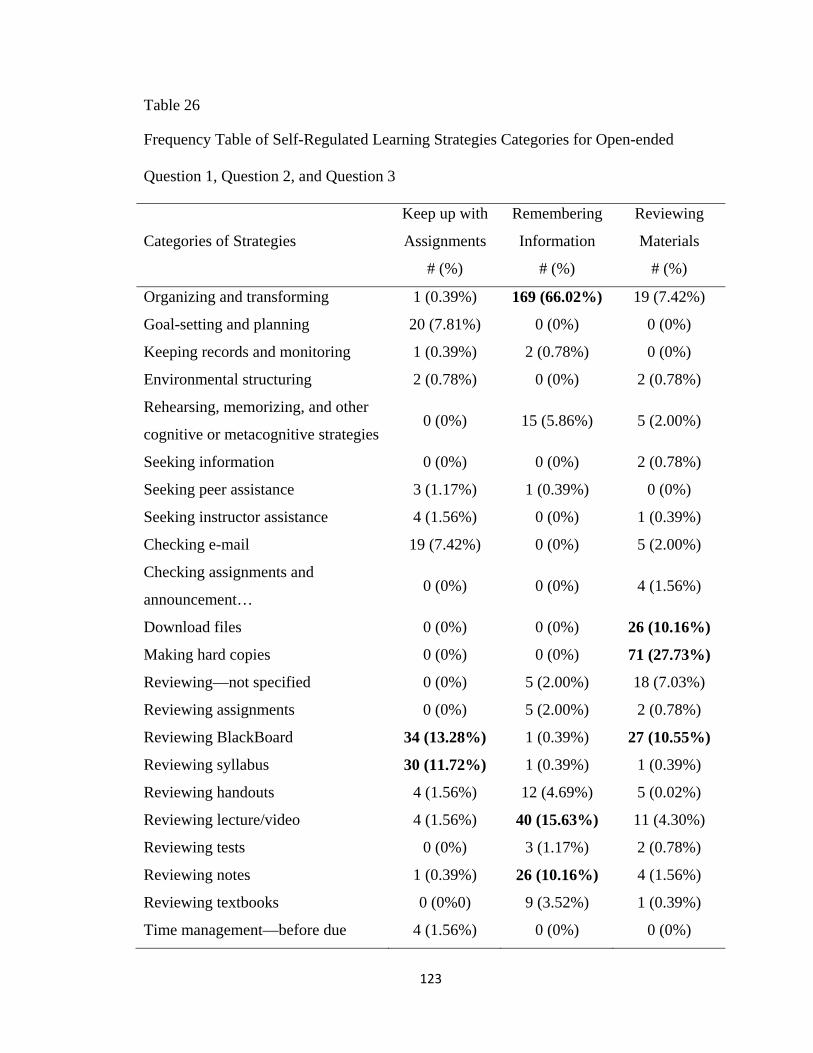
123
Table 26
Frequency Table of Self-Regulated Learning Strategies Categories for Open-ended
Question 1, Question 2, and Question 3
Categories of Strategies
Keep up with
Assignments
# (%)
Remembering
Information
# (%)
Reviewing
Materials
# (%)
Organizing and transforming 1 (0.39%) 169 (66.02%) 19 (7.42%)
Goal-setting and planning 20 (7.81%) 0 (0%) 0 (0%)
Keeping records and monitoring 1 (0.39%) 2 (0.78%) 0 (0%)
Environmental structuring 2 (0.78%) 0 (0%) 2 (0.78%)
Rehearsing, memorizing, and other
cognitive or metacognitive strategies 0 (0%) 15 (5.86%) 5 (2.00%)
Seeking information 0 (0%) 0 (0%) 2 (0.78%)
Seeking peer assistance 3 (1.17%) 1 (0.39%) 0 (0%)
Seeking instructor assistance 4 (1.56%) 0 (0%) 1 (0.39%)
Checking e-mail 19 (7.42%) 0 (0%) 5 (2.00%)
Checking assignments and
announcement… 0 (0%) 0 (0%) 4 (1.56%)
Download files 0 (0%) 0 (0%) 26 (10.16%)
Making hard copies 0 (0%) 0 (0%) 71 (27.73%)
Reviewing—not specified 0 (0%) 5 (2.00%) 18 (7.03%)
Reviewing assignments 0 (0%) 5 (2.00%) 2 (0.78%)
Reviewing BlackBoard 34 (13.28%) 1 (0.39%) 27 (10.55%)
Reviewing syllabus 30 (11.72%) 1 (0.39%) 1 (0.39%)
Reviewing handouts 4 (1.56%) 12 (4.69%) 5 (0.02%)
Reviewing lecture/video 4 (1.56%) 40 (15.63%) 11 (4.30%)
Reviewing tests 0 (0%) 3 (1.17%) 2 (0.78%)
Reviewing notes 1 (0.39%) 26 (10.16%) 4 (1.56%)
Reviewing textbooks 0 (0%0) 9 (3.52%) 1 (0.39%)
Time management—before due 4 (1.56%) 0 (0%) 0 (0%)

124
Categories of Strategies
Keep up with
Assignments
# (%)
Remembering
Information
# (%)
Reviewing
Materials
# (%)
Time management—start early 14 (5.47%) 0 (0%) 0 (0%)
Time management—general 45 (17.58%) 2 (0.78%) 6 (2.34%)
Using planner/calendar/reminders
Not specified 73 (28.52%) 4 (1.56%) 3 (1.17%)
Using planner/calendar/reminders
Technology 34 (13.28%) 1 (0.39%) 0 (0%)
Using planner/calendar/reminders
Traditional planner 15 (5.86%) 0 (0%) 0 (0%)
Others 20 (7.81%) 13 (5.08%) 25 (9.77%)
Question 1: What strategies do you use to keep up to date with assignments in this
class?
Most students reported that they used a planner or calendar to keep up with the
assignments, while some students said that they reviewed Blackboard and the syllabus.
Generally, students reported more than one strategy used to keep up to date with
assignments in the class. For example, students said:
“I create a paper (non-computer) calendar at the beginning of the semester and go
through the syllabus to mark any assignment due dates. I usually check my e-mail
multiple times a week (not necessarily every day) and I pay attention to due dates.”
“In order to keep track of due dates for assignments I refer to the syllabus and
Blackboard calendar frequently and write due dates in my personal planner. At the
125
beginning of each week I make a "study plan" for myself that outlines what I will do
each day.”
Based on the data analysis results, most students used planners/calendars to keep
up with assignments in the class. Most of them did not specify what kind of planners they
were using (28.52%). However, some students indicated that they used a technology
device (13.28%), such as cellphone, Blackboard calendar, Outlook calendar, whereas
some students stated they used traditional paper planners or binders (5.86%) from which
they can track the due dates or their progress anytime. For example:
“A planner which I use multiple times each day. Also, constant "To-do" lists.”
“I have a very organized planner, and I put reminders in my phone.”
“Post assignment due dates on my email calendar.”
In addition, students reported that they used time management skills in keeping up
with the assignments in the class. Most of them reported they used general time
management skills or did not specify their strategies (17.58%), whereas some students
stated that they either started their work early (5.47%) or before the due date (1.56%).
Some students reported that they set goals by the beginning of the semester or at the
beginning of the week to make sure they can keep up in the class (7.81%). For example,
students reported that:
126
“Dedicating consistent time and sufficient workspace at home to stay on top of
things.”
“Start as soon as assignment is posted, even if it's just to download some sample
code or write a single function. 2.) as much as possible work on it a little EVERY
day, even if it's just writing a single line of code.”
“I set internal goals for myself based on the syllabus.”
Finally, students logon to the Blackboard regularly (13.28%), reviewed the
syllabus (11.72%), and checked the e-mails (7.42%) to update themselves and track their
progress. Also, few students indicated that they would e-mail their classmates or
instructors to make sure they did not miss anything (peer: 1.17%; instructor: 1.56%). For
example:
“I look at Blackboard every day, including mail, assignments, and discussion
boards.”
“Emailing professor, reviewing syllabus, checking with classmates.”
“I highlight the due dates in the syllabus and then I put them in my personal
planner. I review my syllabus and planner frequently.”
Question 2: What strategies do you use when trying to remember information from
class/videos?
Unlike the first question, students’ responses in this question demonstrated similar
strategies. Generally, students used more than one strategy in trying to remember
127
information from class/videos. Sixty-four percent of students reported that they used the
organizing and transforming strategy, especially note taking, to help them remember the
class materials. For example, some students reported that:
“Take notes, much like in class. I note the specific time mark on a video if there is
material that is particularly important (studying for test) or confusing (watch it
more than once).”
“I treat the online class like a typical class. I take notes and when needed pause
the class to better understand the concepts. I feel that I have made better notes
trough my distance ed courses when compared to my in class experience.”
“I make my own set of notes of the important items. I cross reference this with
review material and focus on the information / concepts that do not easily come to
mind.”
Students also reported that they reviewed the video (15.63%) or the notes
(10.16%) or the handouts/PowerPoint slides (4.69%) in order to remember the learning
materials. Students also applied rehearsing, memorizing strategies (5.86%) in learning the
materials. Interestingly, some students reported they tried to treat the online courses no
different than the traditional classes in campus.
“The thing that helps the most is to work practice problems - and practice exams
that I make up. I do homework over a second or third time before the exam. I

128
watch and re-watch a particular part of a video-taped class if it does not make
sense.”
“Take notes. Re-read notes. Occasionally I'll re-watch a section of video to
review something I'm not sure of (it's a very nice option to have).”
“take notes, flash cards, review, read aloud, mnemonics, repetition, visual
references.”
Question 3: What strategies do you use when reviewing the materials available through
the distance education site (WebCT, Blackboard, etc…)
Students usually used more than one strategy in reviewing the materials. The most
frequently reported strategy was making hard copies of the learning materials (27.73%)
so they can highlight, and read the materials whenever needed. They also reviewed and
checked the Blackboard (10.55%), downloaded learning materials and saved them in the
computer (10.16%), and took notes (6.64%). For example:
“I print any online handouts, study guides, lecture notes from the teacher, etc.,
read them, make notes, and keep them handy when I am reading out of the text of
working on assignments.”
“I check blackboard periodically to make sure I have the most current documents
for the courses.”
129
“Download videos, if traveling I download the webcast to my IPOD to watch on
the plane.”
To sum up, students used planners and reviewed Blackboard and syllabus in order
to keep up with the assignments. In addition, they usually used organizing and
transforming strategies, especially note taking, in order to remember the learning
materials. Furthermore, they made hard copies of learning materials and reviewed the
Blackboard to review these learning materials.
Among 30 strategy categories, “Reviewing Blackboard” was the most used
strategy in keeping up with assignments and in reviewing learning materials. Some other
strategies were used based on the tasks. For example, using a planner was only applied
when students kept up with assignments, while organizing and transforming strategies
was only used when they remembered the learning materials. Further, making hard copies
was only used when students reviewed the learning materials. Finally, some strategies
were rarely used, such as keeping records and monitoring, environmental structuring,
seeking information, seeking peer assistance, seeking instructor assistance, checking
assignments and announcement, and time management—before the due date.
Question 4: What online tools (e.g. e-mails, discussion board, gradebook, etc…) do you
use most often and how are these helpful?
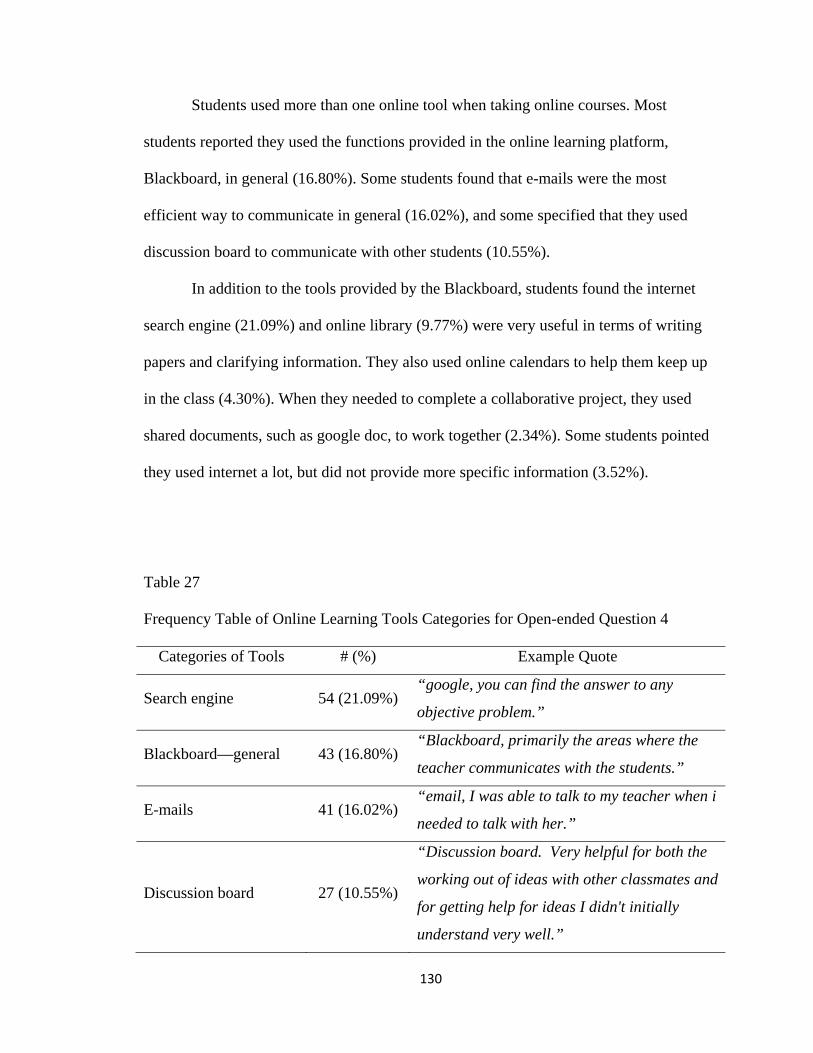
130
Students used more than one online tool when taking online courses. Most
students reported they used the functions provided in the online learning platform,
Blackboard, in general (16.80%). Some students found that e-mails were the most
efficient way to communicate in general (16.02%), and some specified that they used
discussion board to communicate with other students (10.55%).
In addition to the tools provided by the Blackboard, students found the internet
search engine (21.09%) and online library (9.77%) were very useful in terms of writing
papers and clarifying information. They also used online calendars to help them keep up
in the class (4.30%). When they needed to complete a collaborative project, they used
shared documents, such as google doc, to work together (2.34%). Some students pointed
they used internet a lot, but did not provide more specific information (3.52%).
Table 27
Frequency Table of Online Learning Tools Categories for Open-ended Question 4
Categories of Tools # (%) Example Quote
Search engine 54 (21.09%) “google, you can find the answer to any
objective problem.”
Blackboard—general 43 (16.80%) “Blackboard, primarily the areas where the
teacher communicates with the students.”
E-mails 41 (16.02%) “email, I was able to talk to my teacher when i
needed to talk with her.”
Discussion board 27 (10.55%)
“Discussion board. Very helpful for both the
working out of ideas with other classmates and
for getting help for ideas I didn't initially
understand very well.”
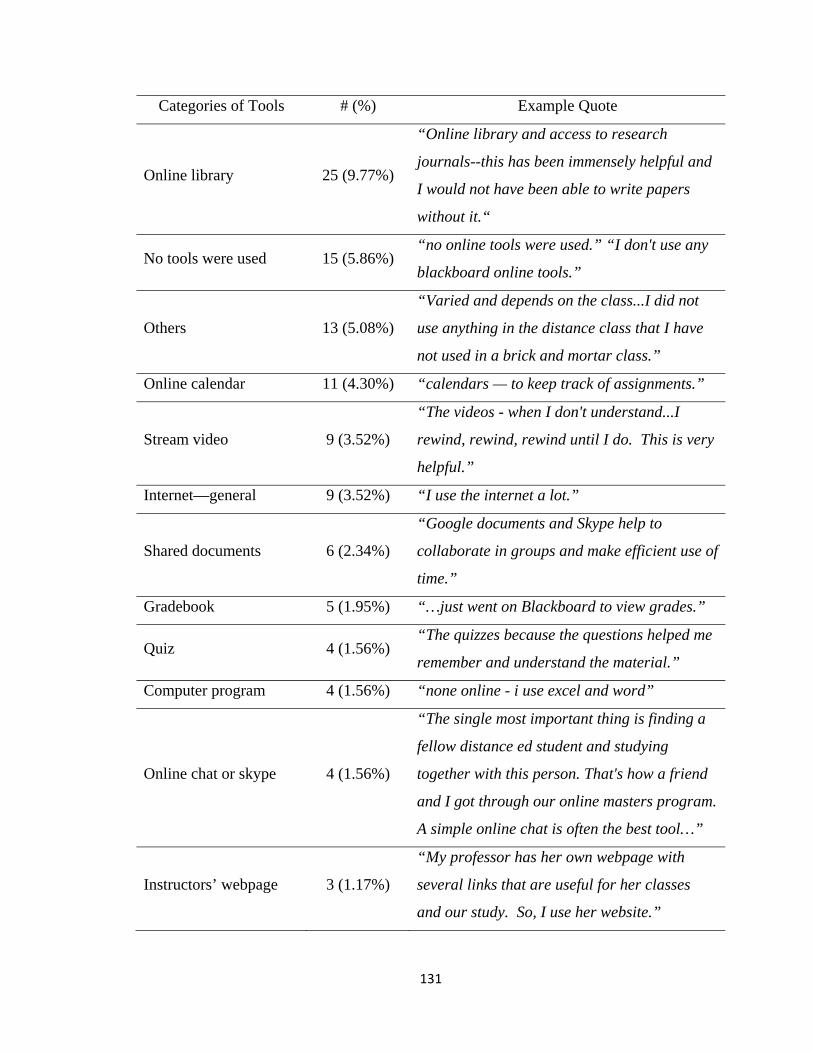
131
Categories of Tools # (%) Example Quote
Online library 25 (9.77%)
“Online library and access to research
journals--this has been immensely helpful and
I would not have been able to write papers
without it.“
No tools were used 15 (5.86%) “no online tools were used.” “I don't use any
blackboard online tools.”
Others 13 (5.08%)
“Varied and depends on the class...I did not
use anything in the distance class that I have
not used in a brick and mortar class.”
Online calendar 11 (4.30%) “calendars — to keep track of assignments.”
Stream video 9 (3.52%)
“The videos - when I don't understand...I
rewind, rewind, rewind until I do. This is very
helpful.”
Internet—general 9 (3.52%) “I use the internet a lot.”
Shared documents 6 (2.34%)
“Google documents and Skype help to
collaborate in groups and make efficient use of
time.”
Gradebook 5 (1.95%) “…just went on Blackboard to view grades.”
Quiz 4 (1.56%) “The quizzes because the questions helped me
remember and understand the material.”
Computer program 4 (1.56%) “none online - i use excel and word”
Online chat or skype 4 (1.56%)
“The single most important thing is finding a
fellow distance ed student and studying
together with this person. That's how a friend
and I got through our online masters program.
A simple online chat is often the best tool…”
Instructors’ webpage 3 (1.17%)
“My professor has her own webpage with
several links that are useful for her classes
and our study. So, I use her website.”
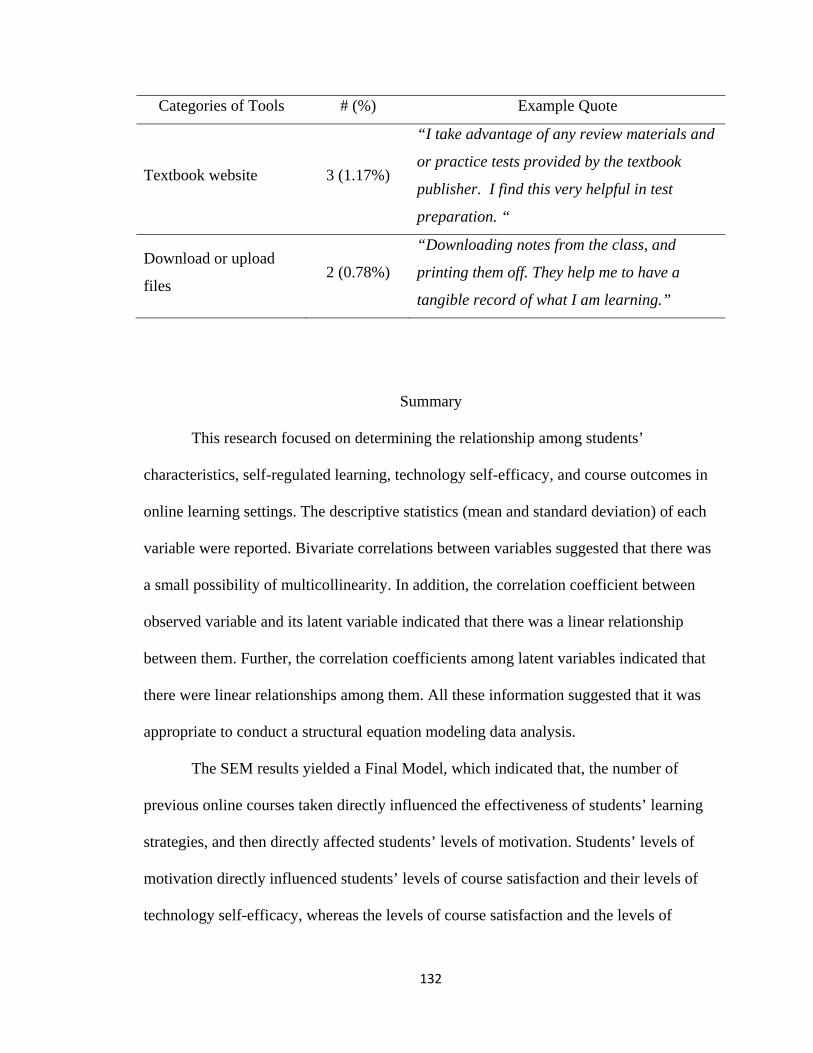
132
Categories of Tools # (%) Example Quote
Textbook website 3 (1.17%)
“I take advantage of any review materials and
or practice tests provided by the textbook
publisher. I find this very helpful in test
preparation. “
Download or upload
files 2 (0.78%)
“Downloading notes from the class, and
printing them off. They help me to have a
tangible record of what I am learning.”
Summary
This research focused on determining the relationship among students’
characteristics, self-regulated learning, technology self-efficacy, and course outcomes in
online learning settings. The descriptive statistics (mean and standard deviation) of each
variable were reported. Bivariate correlations between variables suggested that there was
a small possibility of multicollinearity. In addition, the correlation coefficient between
observed variable and its latent variable indicated that there was a linear relationship
between them. Further, the correlation coefficients among latent variables indicated that
there were linear relationships among them. All these information suggested that it was
appropriate to conduct a structural equation modeling data analysis.
The SEM results yielded a Final Model, which indicated that, the number of
previous online courses taken directly influenced the effectiveness of students’ learning
strategies, and then directly affected students’ levels of motivation. Students’ levels of
motivation directly influenced students’ levels of course satisfaction and their levels of
technology self-efficacy, whereas the levels of course satisfaction and the levels of
133
technology self-efficacy directly affected students’ final grade. In addition, the
effectiveness of learning strategies was the mediator between the number of previous
online course taken and students’ level of motivation. Students’ levels of motivation was
the mediator between their effectiveness of learning strategies and course satisfaction,
and between their effectiveness of learning strategies and technology self-efficacy.
Finally, students’ levels of course satisfaction and their levels of technology self-efficacy
were mediators between their levels of motivation and their final grade.
The results from open-ended questions indicated that students used more than one
learning strategy in terms of keeping up with assignments, remembering learning
materials, and reviewing the learning materials. They also used more than one online tool
when taking the online courses. Most of the participants reported that they used planners
and referred to the Blackboard and syllabus for keeping up with assignments. They took
notes and reviewed the stream videos if needed when trying to remember the information
provided in the class. In addition, they downloaded the files and made hard copies for
reviewed the learning materials through the online courses. Further, they used
Blackboard functions and internet search engines most when they took online courses.
134
V. CONCLUSIONS AND DISCUSSIONS
This chapter presents a summary and conclusions of this study. A discussion of
conclusions, limitations of this study, and recommendations for further research is also
presented.
Summary of Study
The purpose of this study was to examine the relationship among students’
characteristics, self-regulated learning, technology self-efficacy, and course outcomes in
online learning settings. A hypothesized model was generated based on previous research.
Two hundred and fifty-six students participated in this study. All participants completed
an online survey hosted via SurveyMonkey.com. The survey consisted of a total of 130
items with a demographic questionnaire, the Modified Motivation Strategies Learning
Questionnaire, the Open-ended Learning Strategies Questionnaire, the Online
Technology Self-Efficacy Scale, the Course Satisfaction Questionnaire, and the final
grades. Structural Equation Modeling was served as the major data analysis method.
Descriptive statistics related to the responses from the demographic questions
were presented in Chapter III. According to the previous research and factor analysis
results, observed variables, the gender, the educational level, the number of online
courses taken, self-efficacy, test anxiety, task value, elaboration, time management, self-
135
regulation and metacognition, critical thinking, general technology self-efficacy, online
learning platform technology self-efficacy, final grade, and course satisfaction were
identified as the observed variables. The students’ characteristics, self-regulated learning
(motivation and learning strategies), technology self-efficacy, and course outcomes were
latent variables. The descriptive statistics of the variables were presented in Chapter III.
In addition, the correlation procedures were performed between observed variables and
their latent variable, as well as among latent variables. The results indicated that there
were linear relationships between observed variables and their latent variable. Also, there
was a linear relationship among latent variables.
The results indicated that the initially hypothesized modelwas not an appropriate
one in terms of explaining the relationship among students’ characteristics, self-regulated
learning, technology self-efficacy, and course outcomes. After model re-specification, a
final model with good fit was obtained. Based on the results from the final model, the
number of previous online courses taken directly influenced the effectiveness of students’
learning strategies in taking online courses, and then, directly affected the students’ levels
of motivation. Students’ levels of motivation influenced their levels of technology self-
efficacy and course satisfaction. Finally, their levels of technology self-efficacy and
course satisfaction affected their final grades. In other words, students with previous
online learning experiences tended to have more effective learning strategies when taking
online courses, and hence, had higher levels of motivation in their online courses. When
students had higher levels of motivation in their online courses, their levels of technology
self-efficacy increased, and their levels of course satisfaction also increased. As their
levels of technology self-efficacy and course satisfaction increased, their final grade
136
tended to be better than those of the students who did not have experiences in taking
online courses.
In order to understand the specific learning strategies students used in taking
online courses, four open-ended questions which were modified from Self-Regulated
Learning Interview Schedule (Zimmerman & Martinez-Pons, 1986) were used. The
results indicated that students used planners/calendars, and reviewing Blackboard and
syllabus in order to keep up with the assignments. Most of the students took notes in
terms of remembering the learning materials and some reviewed the stream videos. In
addition, in order to review the learning materials, students downloaded the files posted
on the Blackboard and made hard copies to have everything handed. While taking online
courses, students used search engine, Blackboard, and online library a lot in order to
obtain more information. They also reported that the e-mails and discussion board were
very useful in terms of interacting with the instructors and their classmates.
Conclusions
The following conclusions are supported by data from this study.
1. The number of previous online courses taken influences the levels of self-
regulated, and then affects the technology self-efficacy and course outcomes. To
be more specific, the more online courses students have taken, the more effective
learning strategies they use in the current online courses. With using more
effective learning strategies, students have higher levels of motivation in their
online courses. The higher levels of motivation then leads to higher levels of
technology self-efficacy and higher levels of course satisfaction. The higher levels
137
of technology self-efficacy and course satisfaction result in a better grade in their
web-based courses.
2. In general, self-regulated learning is the mediator between the numbers of
previous online courses taken and course outcomes in web-based courses. To be
more specific, learning strategies is the mediator between the numbers of previous
online courses taken and motivation in web-based courses. In addition, motivation
is the mediator between learning strategies and course satisfaction.
3. Self-regulated learning is also the mediator between the numbers of previous
online courses taken and technology self-efficacy.
4. Technology self-efficacy is the mediator between self-regulated learning and final
grade in web-based courses.
5. There is no interaction effect between self-regulated learning and technology self-
efficacy.
6. Course satisfaction is the mediator between the self-regulated learning and final
grade.
7. Students who take online courses tend to use planner/calendar, reviewing
Blackboard and syllabus to keep up with the assignments.
8. Students who take online courses tend to take notes, reviewing lecture videos, and
reviewing notes to remember the learning materials.
9. Students who take online courses download the learning materials, review the
materials on the Blackboard, and make hard copies in order to review the learning
materials.
138
10. Students use search engine, Blackboard, e-mails, discussion board, and online
library as the online tools when taking online courses.
Discussion
Course Outcomes
The present research suggested that students’ course satisfaction influences their
final grade in web-based course. According to Bean and Bradley (1986), course
satisfaction had a significant effect on the performance but the performance did not have
a strong positive effect on course satisfaction. Results from this research supported their
conclusion. Further, Astin (1993) suggested that satisfaction was an important
intermediate outcome between students’ level of motivation and their performance.
Results from this research also supported his point of view that the course outcome was
the mediator between students’ levels of motivation and their performance. However
Bean and Bradley (1986) also suggested that the relationship between course satisfaction
and performance cannot be assumed as a one-way causal relationship. They believed that
other factors also influence whether high level of satisfaction leads to strong performance
or strong performance leads to high level of satisfaction. For example, the effects of
performance on satisfaction may be different from students who emphasize on
intellectual to those who emphasize on social life in campus. For students with
intellectual emphasis, the higher grades usually leads to higher level of course
satisfaction. On the other hand, for students with social life emphasis, higher course
satisfaction usually leads to higher performance. Therefore, further investigation on the
relationship between course satisfaction and achievement is needed.
139
Self-Regulated Learning
1. Results Based on Quantitative Data
Previous research results suggested that self-regulated learning affected course
satisfaction and performance (Artino & McCoach, 2008; Paechter et al., 2010; Puzziferro,
2008). The results of this study supported previous findings. More specifically, results in
this study indicated that the effectiveness of learning strategies affects the level of
motivation, whereas the levels of motivation influences students’ perception of course
satisfaction, and the levels of course satisfaction affects the performance. In other words,
by applying more effective learning strategies, one increases their level of motivation,
and increases the levels of motivation toward online courses lead to higher levels of
course satisfaction and better performance. According to Zimmerman’s model of self-
regulation (2000), motivational beliefs should underlie each phase of the self-regulatory
process. In other words, motivational beliefs, such as self-efficacy and goal orientation,
influences forethought, goal setting and strategic planning stage, which means that
motivation affectes learning strategies. The results of this study did not support
Zimmerman’s model. The possible explanation is that students with more experiences in
taking online courses were familiar with the online learning settings. Therefore, they had
more effective learning strategies in taking online courses, which then led to the higher
levels of motivation toward their online courses.
Pintrich (2004) pointed out that self-regulatory activities are mediators between
personal and contextual characteristics and actual achievement or performance. However,
there was limited research focusing on this characteristic of self-regulated learning. This
140
research results supported his point by suggesting that self-regulated learning was the
mediator between the numbers of previous online courses taken and the course outcomes.
There was an interesting result shown in this research. Although test anxiety was
identified as an observed variable of self-regulated learning based on the factor analysis,
and it also was statistically significant in relation to motivation, the structural equation
modeling results suggested it to be removed as an indicator. Pintrich and Schunk (1996)
stated that test anxiety is a combination of cognitive and emotional components that
accompany anxiety, such as thinking about the consequences of failing the test, worrying
about being unable to finish the test, worrying about making bad grades, and
experiencing emotional arousal when taking a test. Based on Pintrich and DeGroot
(1990), test anxiety was not correlated with learning strategies used for seventh graders
from traditional learning settings. However, it was negatively correlated with self-
regulation and performance. They suggested that the results indicated the poor
performance of high anxious students resulted from the interference of the test anxiety
during the exam, not because they did not have adequate cognitive skills (Pintrich &
DeGroot, 1990; Howey, 1999). Yukselturk and Bulbut (2009) also found that female
students with higher levels of test anxiety received lower grades in online courses. The
result from present study was different from the previous research. However, Yukselturk
and Bulbut (2007) also found that test anxiety was not a statistically significant predictor
of students’ performance in web-based courses. Therefore, follow up research is needed
in terms of understanding the role of test anxiety in online learning settings and if there is
a gender difference.
141
Self-regulated learning strategies can be promoted by the instructor or instruction
(McMahon & Oliver, 2001; McLoughlin, 2002; Yang, 2006). McMahon and Oliver
(2001) suggested that a well designed online environment should take both affective and
cognitive processes into account in order to enhance students’ self-regulated learning.
They also provided suggestions regarding the integration of learner activities, learner
supports and learning resources in online learning environment (Figure 14).
2. Results Based on Qualitative Data
The results from open-ended questions in this study suggested that students used
planners/calendars, and reviewing Blackboard and syllabus in order to keep up with the
assignments. Most of the students took notes in terms of remembering the learning
materials and some reviewed the stream videos. In addition, in order to review the
learning materials, students downloaded the files posted on the Blackboard and made
hard copies to have everything handed. While taking online courses, students used a
search engine, the Blackboard, and the online library a lot in order to obtain more
information. They also reported that the e-mails and discussion board were very useful in
terms of interacting with the instructors and their classmates.
Whipp and Chiarelli (2004) interviewed six adult learners in order to understand
the self-regulated learning strategies they used in online learning settings. The results
indicated that these online learners adapted similar self-regulated learning strategies
which were also used in traditional learning settings, but they also used some strategies
which were unique to the online learning settings. The results of present study supported
his findings that students modified their learning strategies in order to adapt to online
learning settings. For example, students reported that they logon to the Blackboard
142
regularly in order to keep up with assignments, they had to manage their work and study
time, they had to set up a specific time to complete their online course work as if they
were in the traditional learning settings, they had to print out the learning materials in
order to review them anytime, and they had to interact with the instructors and classmates
through discussion board, e-mails, or skype.
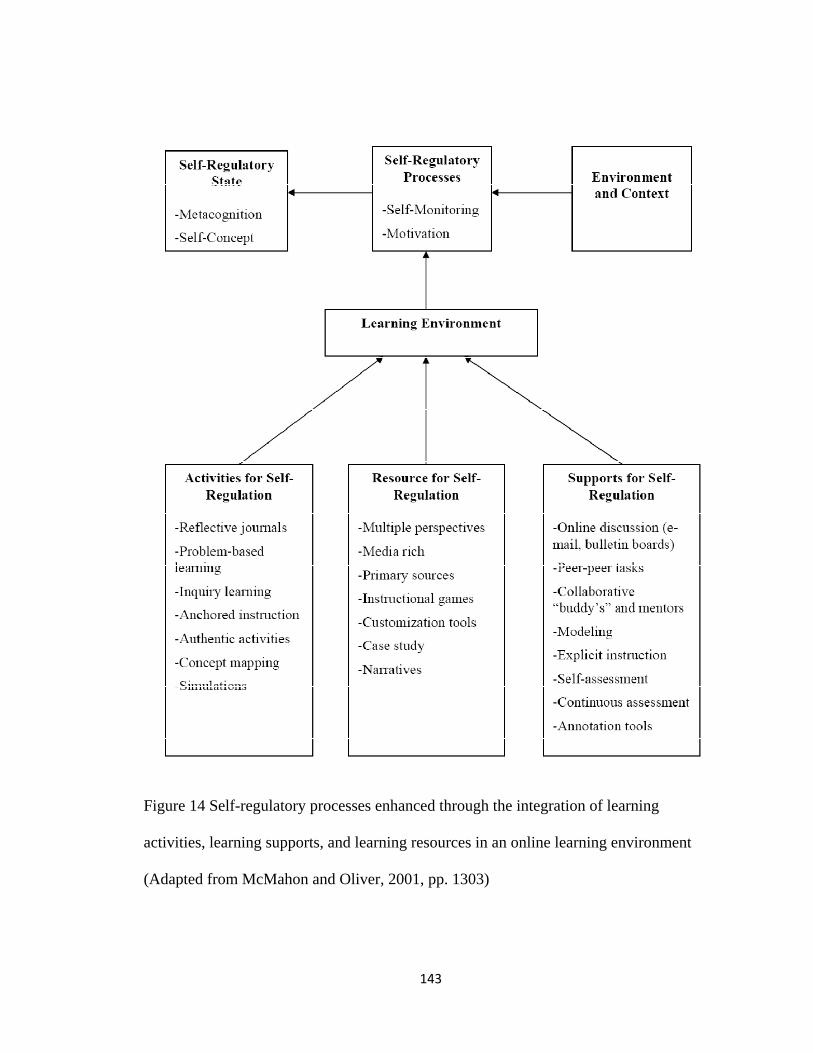
143
Figure 14 Self-regulatory processes enhanced through the integration of learning
activities, learning supports, and learning resources in an online learning environment
(Adapted from McMahon and Oliver, 2001, pp. 1303)
144
Technology Self-Efficacy
The results of this study did not support DeTure (2004) and Puzziferro’s (2008)
perspective that technology self-efficacy does not affect the course outcomes. In contrast,
the results imply that technology self-efficacy was directly influenced by motivation and
then affected the final grade. In other words, students with higher levels of technology
self-efficacy tended to received better grades. Based on this study, the technology self-
efficacy included two different dimensions, general computer self-efficacy and online
learning platform related self-efficacy. This implied that students who want to succeed in
online learning should have confidence in general computer skills as well as in using
online learning platforms.
In addition, the numbers of previous online courses taken was the antecedent
variable which influenced the levels of technology self-efficacy through self-regulated
learning. It was also implied that students with more previous experiences in taking
online courses had higher levels of technology self-efficacy. Arbaugh (2004) found that
students’ perception of online courses, such as delivery medium satisfaction,
flexibility…etc., statistically significantly changed between their first and second online
courses. He suggested that students need to take at least two online courses before they
can come to a conclusion about it. He also suggested that the instructor should pay more
attention to those students who first take the online courses in terms of encouraging
students to participate and persist in their online courses. Furthermore, he pointed out that
the perceived usefulness and perceived ease of use of a technology influenced students’
attitudes toward the technology and their willingness to adopt the technology. Therefore,
145
these suggestions also implied that technology self-efficacy can be promoted by the
instructiors. By providing an introduction to use online learning platform, such as using
the discussion board, checking grades online, how to download/upload documents, as
well as sending/receiving e-mails, students will be more comfortable in using the online
learning platform. In addition, an introduction to conduct an internet search through a
search engine, and using online library database also evoke students’ ability in finding
useful resources in taking online courses. Finally, the online courses should be conducted
under a user-friendly platform to encourage students’ persistent in online courses.
Students’ Characteristics
The results of this research support the previous research that there was no
gender difference nor educational level difference in self-regulated learning and
technology self-efficacy (Bates, & Khasawneh, 2004; Busch, 1995; Imhof et al., 2007;
Lim et al., 2006; Yukselturk, & Bulut, 2007). However, previous online learning
experiences influence the self-regulated learning directly. To be more specific, the
numbers of previous online courses taken influenced effectiveness of learning strategies
directly, and affected the levels of motivation through the effectiveness of learning
strategies.
Pintrich and Zusho (2002) discussed the moderating role of gender and ethnicity.
They stated that girls had lower academic competence than boys, whereas Asian-
American students exhibited lower self-efficacy than African-American students. Even
though girls reported a lower level of self-efficacy, they tended to use more self-
regulatory strategies than boys. In addition, they stated that different ethnicities may
146
apply different self-regulatory learning strategies. However, they also pointed out that
researchers have not systematically investigate the role of gender and ethnicity in self-
regulatory processes. Therefore, further studies in understanding the role of gender and
ethnicity related to self-regulated learning in online learning setting are needed.
Limitations
The first limitation of this study is that it was a non-experimental quantitative
research designed with self-report survey measures. Therefore, the interpretation and
generalization of the results to other populations should be donewith caution.
The response rate in this study was 12.05%, which was low. The research
materials are delivered via university E-mail system. There were possibilities that the
potential participants ignored or did not check their E-mails, the survey was identified as
junk or bad E-mail address, which can also explain the low response rate in this research.
Finally, the grades were self-reported, which might not be the actual grades the
participants received. Further, the grades were also recorded in letter grades (A, B, C, D
or F), which led to small variance and influences the accuracy of estimation. Further
research should use numerical grades, 100-point scale, in representing grade instead of A,
B, C, D etc. categories if possible.
Recommendations
The following recommendations are based on the findings, conclusions, and
discussion of this study:
147
For Researchers
1. Since there has been limited research examining self-regulated learning as the
mediator between students’ characteristics and course outcomes, future research
should consider investigating the mediator effect of self-regulated learning, and
comparing its role in traditional and online learning settings.
2. Researchers should also continue to examine the self-regulated process. Does the
motivation underlie the learning strategies or do the learning strategies underlie
the motivation? Is the process in a traditional learning environment different than
it is in online learning settings? Or perhaps a more complex process underlies
these two variables?
3. The present study did not include ethnicity as an observed variable in students’
characteristics latent variable. Previous research regarding the moderating role of
ethnicity in self-regulated learning was limited in online learning settings.
Therefore, further research focusing on the role of ethnicity in traditional learning
environment and in online learning settings is needed.
4. The results of previous research and this research regarding the role of test
anxiety are not consistent and is unclear. Therefore, further research in
understanding and comparing the role of test anxiety in self-regulated learning in
traditional learning environment and online learning settings is needed.
5. The specific self-regulated learning strategies students used in traditional learning
environment and online learning settings should continue to be a focus of
researcher in the future to understand which strategies are most effective and how
they can be encouraged or promoted.
148
For Institutions, Instructors, and Students
1. The institutions have to provide a friendly and easy use online learning platform
to increase students’ willingness in taking online course and their levels of online
learning technology self-efficacy.
2. The institutions have to provide workshops to both instructors and students to
help them familiar with the online learning platform.
3. The instructors have to pay attention to the students who are taking their first
online course by encouraging them to participate and persist in their online
courses.
4. The instructors have to be familiar with the online learning environment and
platform so they can help students to participate in the online courses. In order to
do so, they can provide introductory sessions which include the information
students need to take the online courses at the beginning of the class, and provide
prompt feedbacks when students have problems.
5. The instructors can design the course activities in a way that can also help
students improve their self-regulated learning strategies and their levels of
technology self-efficacy. For example, the instructors can ask students to keep a
learning journal, to participate in the discussion on the discussion board at least
certain times a week, or assign the projects which are required collaborative work.
6. In order to success in the online courses, students have to take the online courses
as if they were taking traditional courses. In other words, students have to set up a
specific time or even a specific place so they can concentrate on the learning
materials and the assignments of the online courses.
149
Summary
The findings in this study provide a model in terms of understanding the
relationships among students’ characteristics, technology self-efficacy, self-regulated
learning, and course outcomes. By using structural equation modeling, the current study
also provided more reliable estimations and a holistic understanding than least square
solution results. The results indicated that the number of previous online courses students
had taken influenced the effectiveness of learning strategies used. When students used
more effective learning strategies, their levels of motivation were also increased. As their
levels of motivation increased, their levels of satisfaction toward the online course and
the levels of technology self-efficacy were also increased, and they also got better final
grades in their online courses.
Students usually used planners and reviewed the Blackboard to keep up with
assignments. They used organization and transforming strategies, especially note taking,
to remember the learning materials. In addition, they made copies and reviewed the
Blackboard in order to review the learning materials. Finally, they used the Blackboard
functions, internet search engines, and the online library when they took online courses.
The results of this study imply that the course designer and instructor can help
students develop their self-regulated learning strategies and their self-efficacy in using
technology so they can experience success in their online course, especially those who
have no or negative experiences in their previous online learning courses.
150
REFERENCES
Alderman, M. K. (2004). Motivation for Achievement. Mahwah, New Jersey: Lawrence
Erlbaum Associates, Inc.
American Psychology Association (1997). Learner-centered psychological principles: A
framework for school redesign and reform. Wachington, DC: APA. Retrieved May
29, 2009, from http://www.apa.org/ed/lco.html
Arbaugh, J. B. (2000). Virtual classroom versus physical classroom: An exploratory
study of class discussion patterns and student learning in an asynchronous internet-
based MBA course. Journal of Management Education, 24(2), 213-233.
Arbaugh, J. B. (2001). How instructor immediacy behaviors affect student satisfaction
and learning in web-based courses. Business Communication Quarterly, 64(4), 42-
54.
Arbaugh, J. B. (2004). Learning to learn online: A study of perceptual changes between
multiple online course experiences. Internet & Higher Education, 7(3), 169-183.
Arbaugh, J. B. (2005). Review of “learner-centered theory and practice in distance
education: Cases from higher education”. Academy of Management Learning &
Education, 4 (2), 256-258.
Arbaugh, J. B., & Duray, R. (2002). Technological and structural characteristics, student
learning and satisfaction with web-based courses—an exploratory study of two on-
line MBA programs. Management Learning, 33(3), 331-347.
151
Artino, A. R. (2009). Think, feel, act: Motivational and emotional influences on military
students’ online academic success. Journal of Computing in Higher Education,
21(2), 146-166.
Artino, A. R., & McCoach, D. B. (2008). Development and initial validation of the online
learning value and self-efficacy scale. Journal of Educational Computing Research,
38(3), 279-303.
Astin, A. W. (1993). What Matters in College? Four Critical Years Revisited. San
Francisco, CA: Jossey-Bass.
Baron, R. M., & Kenny, D. A. (1986). The moderator-mediator variable distinction in
social psychological research: Conceptual, strategic, and statistical considerations.
Journal of Personality and Social Psychology, 51(6), 1173-1182.
Bates, R., & Khasawneh, S. (2004) A path analytic study of the determinants of college
students’ motivation to use online learning technologies. Association for
Educational Communications and Technology, 27th, Chicago, IL, October 19-23,
2004.
Bean, J. P., & Bradley, R. K. (1986). Untangling of Satisfaction-Performance
Relationship for College Students. Journal of Higher Education, 57(4), 393-412.
Billings, D. M. (2000). A framework for assessing outcomes and practices in web-based
courses in nursing. Journal of Nursing Education, 39(2), 60-67.
Biner, P. M., Dean, R. S., & Mellinger, A. E. (1994). Factors underlying distance learner
satisfaction with televised college-level courses. The American Journal of Distance
Education, 8(1), 60-71.
152
Bolliger, D. U., & Martindale, T. (2004). Key factors for determining student satisfaction
in online courses. International Journal on E-Learning, 3(1), 61-67.
Bourne, J. R., (1998). Net-learning: Strategies for on-campus and off-campus network-
enabled learning. Journal of Asynchronous Learning Networks, 2(2), 70-88.
Brown, S. W., Boyer, M. A., Mayall, H. J., Johnson, P. R., Meng, L., Butler, M. J., Weir,
K., Florea, N., Hernandez, M., & Reis, S. (2003). The Global Ed Project: Gender
differences in a problem-based learning environment of international negotiations.
Instructional Science, 31, 255-276.
Bullman, J. B. (2007). Structural equation modeling. In Tebachnick, B. G., & Fidell, L. S.
(Eds.). Using Multivariate Statistics (5th ed.)(pp. 676-780). Boston, MA: Allyn and
Bacon.
Busch, T. (1995). Gender differences in self-efficacy and attitudes toward computers.
Journal of Educational Computing Research, 12, 147-158.
Chang, S. H., & Smith, R. A. (2008). Effectiveness of personal interaction in a learner-
centered paradigm distance education class based on student satisfaction. Journal of
Research on Technology in Education, 40(4), 407-426.
Cho, M. L. (2004). The effects of design strategies for promoting students’ self-regulated
learning skills on students’ self-regulation and achievements in online learning
environments. Association for Educational Communications and Technology, 27th,
Chicago, IL, October 19-23, 2004.
Clarke, R. B. (2007). Undergraduate mathematic students: How do differences in
motivation and learning strategy use affect performance? Dissertation Abstracts
International Section A: Humanities and Social Sciences.
153
DeTure, M. (2004). Cognitive style and self-efficacy: Predicting student success in online
distance education. The American Journal of Distance Education, 18(1), 21-38.
Freund, R. J., & Wilson, W. J. (2003). Statistical Methods (2nd ed.). San Diego, CA:
Academic Press.
Frey, A., Yankelov, P., & Faul, A.C. (2003). Student perceptions of web-assisted
teaching strategies. Journal of Social Work Education, 39(3), 443-457.
Frick, T. W., Chadha, R., Watson, C., Wang, Y., & Green, P. (2009). College student
perceptions of teaching and learning quality. Education Technology Research
Development, 57, 705-720.
Gall, M. D., Gall, J. P., & Borg, W. R. (2003). Educational Research: An Introduction
(7th ed.). Boston, MA: Allyn and Bacon.
Garcia, T., & Pintrich, P. R. (1991). Student motivation and self-regulated learning: A
LISREL model. Paper presented at the Annual Meeting of the American
Educational Research Association, Chicago, IL, April 3-7, 1991.
Garson, G. D. (2009). Structural equation modeling. Retrieved July 16, 2009, from
http://faculty.chass.ncsu.edu/garson/PA765/structur.htm
Goldberger, A. S. (1971). Econometrics and psychometrics: A survey of communalities.
Psychometrika, 36(2), 83-107.
Hair, J. F., Black, W. C., Babin, B. J., Anderson, R. E., & Tatham, R. L. (2006).
Multivariate Data Analysis (6th ed.). Upper Saddle River, NJ: Person Education.
Hoe, S. L. (2008). Issues and procedures in adopting structural equation modeling
technique. Journal of Applied Quantitative Methods, 3(1), 76-83.
154
Hoelter, J. W. (1983). The analysis of covariance structures: Goodness-of-fit indices.
Sociological Methods & Research, 11, 325
Howey, S. C. (1999). The relationship between motivation and academic success of
community college freshmen orientation students (Ph. D. Dissertation), Retrieved
from ERIC.
Hsu, S., Chen, W., & Hsieh, M. (2006). Robustness testing of PLS, LISREL, EQS and
ANN-based SEM for measuring customer satisfaction. Total Quality Management
& Business Excellence, 17(3), 355-371.
Hu, L., & Bentler, P. M. (1999). Cutoff criteria for fit indexes in covariance structure
analysis: Conventional criteria versus new alternatives. Structural Equation
Modeling, 6(1), 1-55.
Imhof, M., R. Vollmeyer, et al. (2007). Computer use and the gender gap: The issue of
access, use, motivation, and performance. Computers in Human Behavior, 23,
2823-2837.
Joo, Y., Bong, M., & Choi, H. (2000). Self-efficacy for self-regulated learning, academic
self-efficacy, an internet self-efficacy in web-based instruction. Educational
Technology Research and Development, 48(2), 5-17.
Jung, I., & Rha, I. (2000). Effectiveness and self-effectiveness of online education: A
review of the literature. Educational Technology, 40(4). 57-60.
Kim, K. J. (2004). Motivational influence in self-directed online learning environments:
A qualitative case study. Association for Educational Communications and
Technology, 27th, Chicago, IL, October 19-23, 2004.
155
Kirk, R. E. (1995). Experimental Design: Procedures for the Behavioral Sciences. Pacific
Grove, CA: Brooks/Cole Publishing.
Kirkpatrick, D. L., & Kirkpatrick, J. D. (1994). Evaluation Training Programs: The Four
Levels (3rd ed.). San Francisco, CA: Berrett-Koehler.
Klem, L. (2000). Structural equation modeling. In Grimm, L. G., & Yarnold, P. R. (2000).
Reading and Understanding More Multivariate Statistics. Washington, DC:
American Psychological Association.
Levy, Y. (2007). Comparing dropouts and persistence in e-learning courses. Computers
& Education, 48, 185-204.
Lim, D. H., Yoon, W., & Morris, M. L. (2006). Instructional and learner factors
influencing learning outcomes with online learning environment. The Academy of
Human Resource Development International Conference (AHRD), Columbus, OH,
February 22-26, 2006.
Liu, S. Y. (2007). Community college online course retention and grade predictors.
Dissertation Abstracts International Section A: Humanities and Social Sciences.
Marks, R. B., Sibley, S. D., & Arbaugh, J. B. (2005). A structural equation model of
predictors for effective online learning. Journal of Management Education, 29(4),
531-563.
Marsh, H. W., Balla, J. R., & McDonald, R. P. (1988). Goodness-of-fit indices in
confirmatory factor analysis: The effect of sample size. Psychological Bulletin, 103,
391-410.
Maxwell S. E., & Delaney, H. D. (2004). Designing Experiments and Analyzing Data: A
Model Comparison Perspective. Mahwah, NJ: Lawrence Erlbaum Associates.

156
McLoughlin, C. (2002). Learner support in distance and networked learning
environments: Ten dimensions for successful design. Distance Education, 23(2),
149-162.
McMahon, M., & Oliver, R. (2001). Promoting self-regulated learning in an online
environment. Ed-Media 2001 World Conference on Educational Multimedia,
Hypermedia & Telecommunications, 13th, Tampere, Finland, June 25-30, 2001.
Meyers, L. S., Gamst, G., & Guarino, A. J. (2006). Applied Multivariate Research:
Design and Interpretation. Thousand Oaks, CA: Sage Publications, Inc.
Miltiadou, M., Yu, C. H. (2000). Validation of the online technologies self-efficacy scale
(OTSES). ED445672.
National Center for Education Statistics (2008). The Condition of Education 2008.
Washington, DC: U. S. Department of Education. Retrieved July 15, 2009, from
http://nces.ed.gov/pubs2008/2008031.pdf
Neu, T. W. (2000). A review of analytic methods for detecting mediating and moderator
effects. Annual Meeting of the Southwest Educational Research Association, Dallas,
TX, January 27-29, 2000.
Paechter, M., Maier, M., & Macher, D. (2010). Students’ expectations of, and
experiences in e-learning: Their relation to learning achievements and course
satisfaction. Computers & Education, 54, 222-229.
Parsad, B., Lewis, L., & Tice, P. (2008). Distance Education at Degree-granting
Postsecondary Institutions: 2006-07. Retrieved June 21, 2009, from
http://nces.ed.gov/pubs2009/2009044.pdf
157
Phipps, R. J., & Merisotis, J. (1999). What’s the difference? A review of contemporary
research on the effectiveness of distance learning in higher education. Washington,
DC: National Education Association.
Pintrich, P. R. (1995). Understanding self-regulated learning. New Directions for
Teaching and Learning, 63, 3-12.
Pintrich, P. R. (1999). The role of motivation in promoting and sustaining self-regulated
learning. International Journal of Educational Research, 31, 459-470.
Pintrich, P. R. (2004). A conceptual framework for assessing motivation and self-
regulated learning in college students. Educational Psychology Review, 16(4), 385-
407.
Pintrich, P. R., & DeGroot, E. V. (1990). Motivational and self-regulated learning
components of classroom academic performance. Journal of Educational
Psycholopgy, 82(1), 33-40.
Pintrich, P. R. & Schunk, D. H. (1996). Motivation in education: Theory, research, and
applications. Englewood Cliffs, NJ: Prentice Hall.
Pintrich, P. R., Smith, D. A. F., Garcia, T., & McKeachie, W. J. (1993). Reliability and
predictive validity of the Motivation Strategies for Learning Quesitonnaire (MSLQ).
Educational and Psychological Measurement, 53, 801-813.
Pintrich, P. R., & Zusho, A. (2002). Chapter10. The development of academic self-
regulation: The role of cognitive and motivational factors. In Wigfield, A., & Eccle,
J. S. (2002). Development of Achievement Motivation (pp. 249-284). San Diego, CA:
Academic Press.
158
Puzziferro, M. (2008). Online technologies self-efficacy and self-regulated learning as
predictors of final grade and satisfaction in college-level online courses. The
American Journal of Distance Education, 22, 72-89.
Rao, N., Moely, B. E., & Sachs, J. (2000). Motivational beliefs, study strategies, and
mathematics attainment in high- and low-achievement Chinese secondary school
students. Contemporary Educational Psychology, 25, 289-316.
Rigdon, E. E. (1998). Structural Equation Modeling. In Marcoulides, G. A. (1998).
Modern Methods for Business Research (pp. 251-294). Mahwah, NJ, Lawrence
Erlbaum Associates.
Sanders, D. W., & Morrison-Shetlar, A. I. (2001). Student attitudes toward web-enhanced
instruction in an Introductory biology course." Journal of Research on Computing
in Education, 33(3), 251-262.
Sankaran, S. R., & Bui, T. (2001). Impact of learning strategies and motivation on
performance: A study in web-based instruction. Journal of Instructional Psychology,
28(3), 191-198.
Schlosser, C. A., & Anderson, M. L. (1994). Distance education: Review of the literature.
Washington, DC: Association for Educational Communications and Technology.
Schreiber, J. B., Stage, F. K., King, J., Nora, A., Barlow, E. A. (2006). Reporting
structural equation modeling and confirmatory factor analysis results: A review.
The Journal of Educational Research, 99(6), 323-337.
Schumacker, R. E., & Lomax, R. G. (2004). A Beginner’s Guide to Structural Equation
Modeling. New York, NY: Psychology Press.
159
Schunk, D. H. & Pajares, F. (2002). Chapter1. The development of academic self-
efficacy. In Wigfield, A., & Eccle, J. S. (2002). Development of Achievement
Motivation (pp. 15-31). San Diego, CA: Academic Press.
Schunk, D. H., Printrich, P. R., & Meece, J. L. (2008). Motivation in Education: Theory,
Research, and Applications (3rd ed.). Upper Saddle River, NJ: Pearson
Merrill/Prentice Hall.
Schunk, D. H., & Zimmerman, B. J. (2006). Competence and control beliefs:
Distinguishing the means and ends. In Alexander, P. A. & Winne, P. H. (eds.),
Handbook of Educational Psychology (2nd ed.)(pp. 349-367). Washington, DC:
American Psychology Association.
Tabachnick, B. G., & Fidell, L. S. (2007). Using Multivariate Statistics (5th ed.). Boston,
MA: Pearson Education.
Tanaka, J. (1987). How big is enough? Sample size and goodness-of-fit in structural
equation models with latent variables. Child Development, 58, 134-146.
Tibshirani, R. (1996). Regression shrinkage and selection via the Lasso. Journal of the
Royal Statistical Society B, 58(1), 267-288.
Thurmond, V. A., Wambach, K., Connors, H. R., & Frey, B. B. (2002). Evaluation of
student satisfaction : Determining the impact of a Web-based environment by
controlling for student characteristics. The American Journal of Distance Education,
16(3), 169-189.
Wang, A. Y., & Newlin, M. H. (2002). Predictors of web-student performance: The role
of self-efficacy and reasons for taking an on-line class. Computers in Human
Behavior, 18(2), 151-163.
160
Waits, T., Lewis, L., & Greene, B. (2003). Distance Education at Degree-granting
Postsecondary Institutions: 2000-2001. Retrieved June 21, 2009, from
http://nces.ed.gov/pubs2003/2003017.pdf
Whipp, J. L., & Chiarelli, S. (2004). Self-Regulation in a Web-Based Course: A Case
Study. Educational Technology Research & Development, 52, 5-22.
Wijekumar, K., Ferguson, L., & Wagoner, D. (2006). Problem with assessment validity
and reliability in web-based distance learning environments and solutions. Journal
of Educational Multimedia & Hypermedia, 15(2), 199-215.
Winter, F. I., Greene, J. A., & Costich, C. M. (2008). Self-regulation of learning within
computer-based learning environments: A critical analysis. Educational Psychology
Review, 20, 429-444.
Yang, Y. (2006). Effects of embedded strategies on promoting the use of self-regulation
learning strategies in an online learning environment. Journal of Educational
Technology Systems, 34(3), 257-269.
Yukselturk, E. (2009). Do Entry Characteristics of Online Learners Affect Their
Satisfaction? International Journal on E-Learning, 8, 263-281.
Yukselturk, E., & Bulbut, S. (2007). Predictors for student success in an online course.
Educational Technology & Society, 10(2), 71-83.
Yukselturk, E., & Bulbut, S. (2009). Gender Differences in Self-Regulated Online
Learning Environment. Educational Technology & Society, 12 (3), 12–22.
Zimmerman, B. J. (2000). Attaining self-regulation: A social cognitive perspective. In M.
Boekaerts, P. R. Pintrich, & Moshe Zeidner (Eds.), Handbook of selfregulation (pp.
13–39). New York: Academic Press.
161
Zimmerman, B. J. (2001). Theories of self-regulated learning and academic achievement:
An overview and analysis. In Zimmer, B. J., & Schunk, D. H. (eds.). Self-Regulated
Learning and Academic Achievement: Theoretical Perspectives. Mahwah, NJ:
Lawrence Erlbaum Associates.
Zimmerman, B. J., Bandura, A., & Martinez-Pons, M. (1992). Self-motivation for
academic attainment: The role of self-efficacy beliefs and personal goal setting.
American Educational Research Journal, 29(3), 663-676.
Zimmerman, B. J., & Martinez-Pons, M. (1986). Development of a Structured Interview
for Assessing Student Use of Self-Regulated Learning Strategies. American
Educational Research Journal, 23(4), 614-628.

162
APPENDICES
163
Appendix A
Institutional Review Board
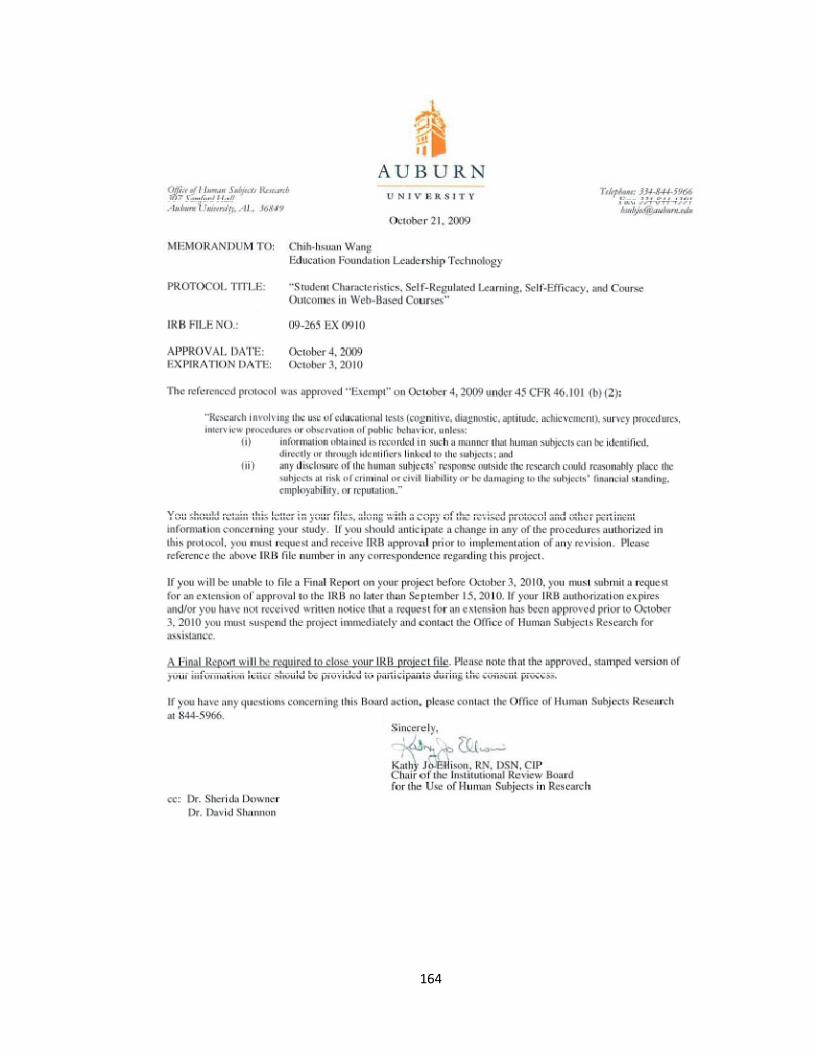
164
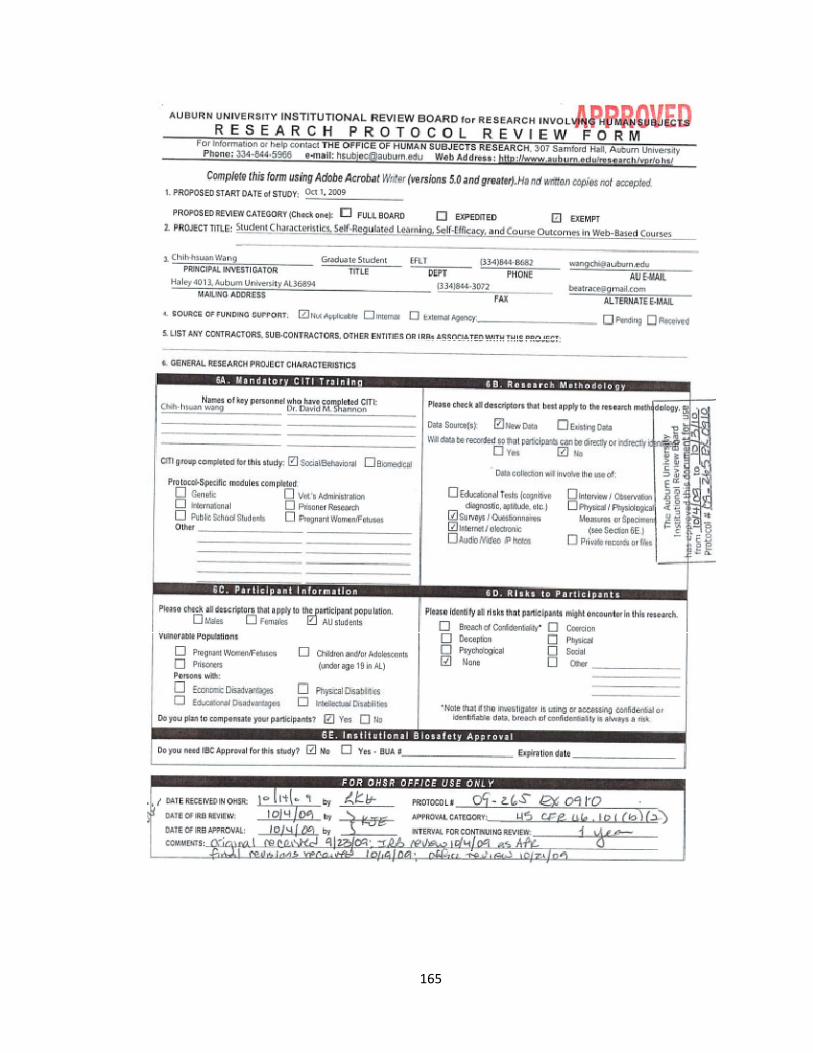
165
166

167
Appendix B
Participant Information Letter
168
169

170
Appendix C
Survey Instrument
171
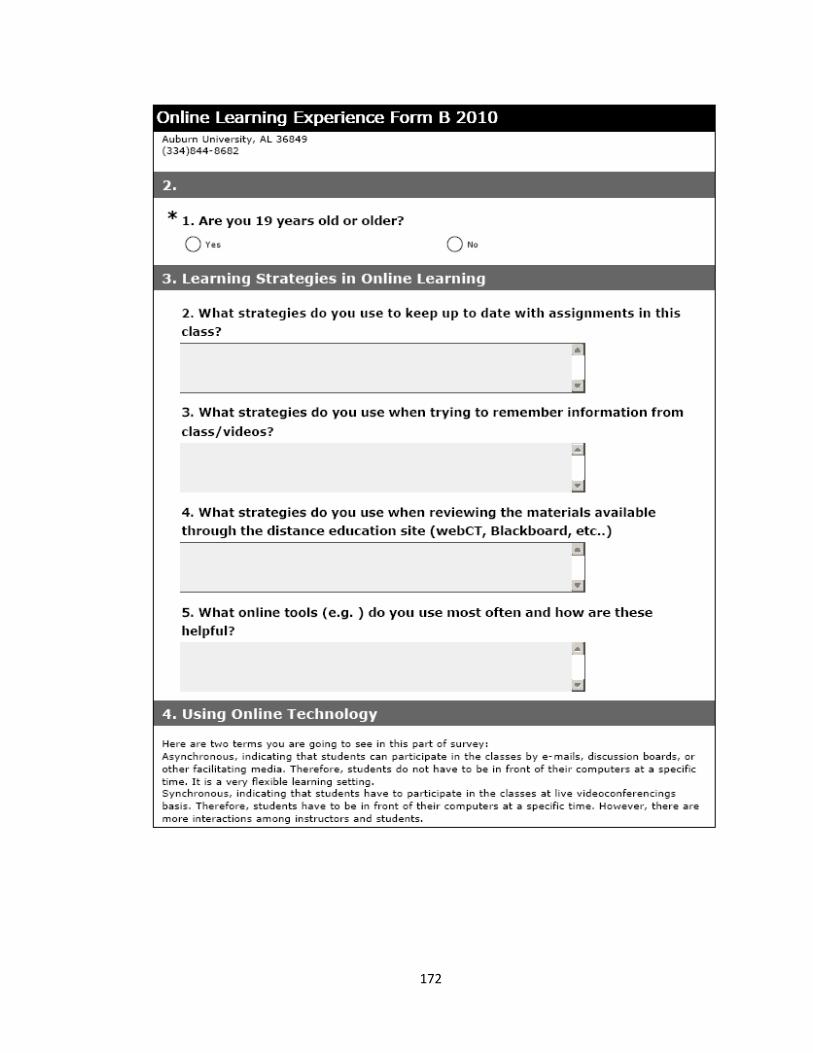
172
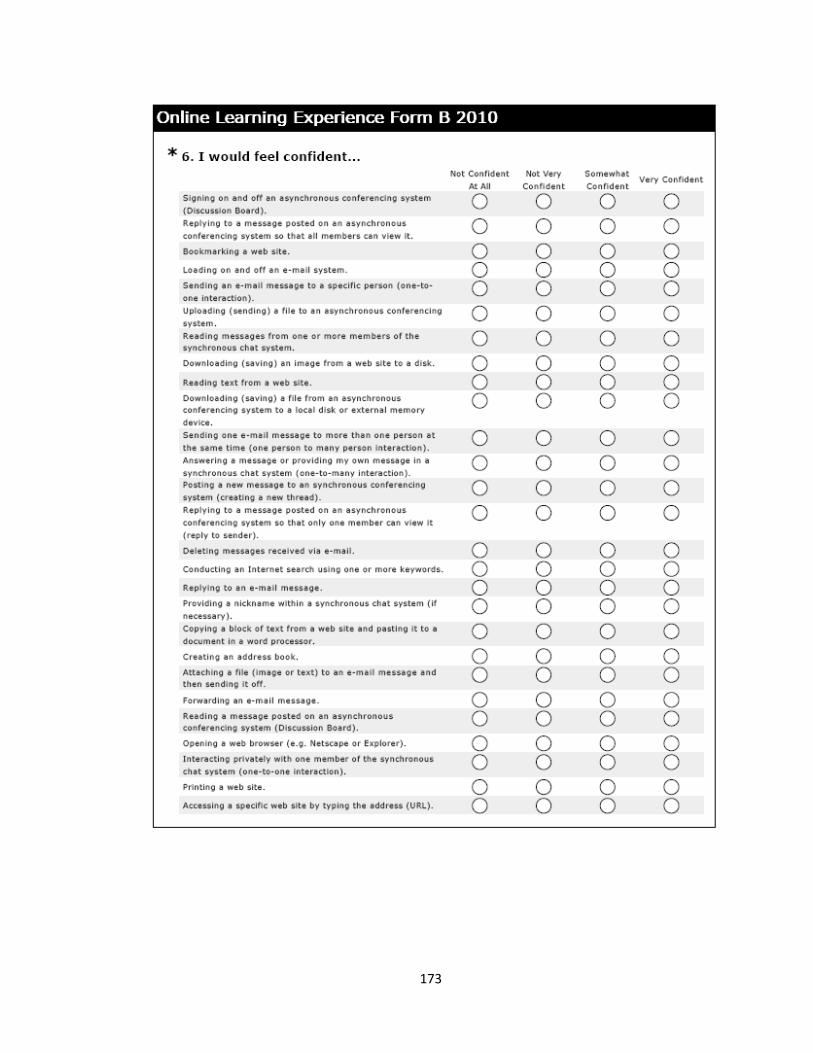
173
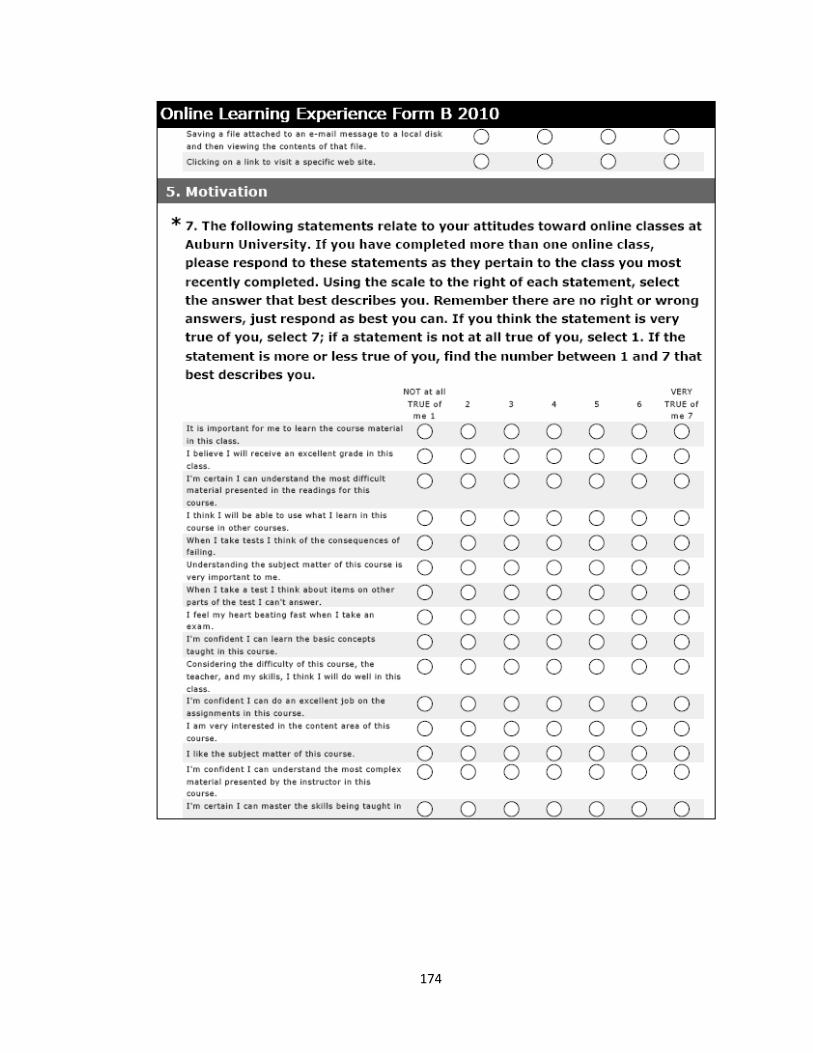
174
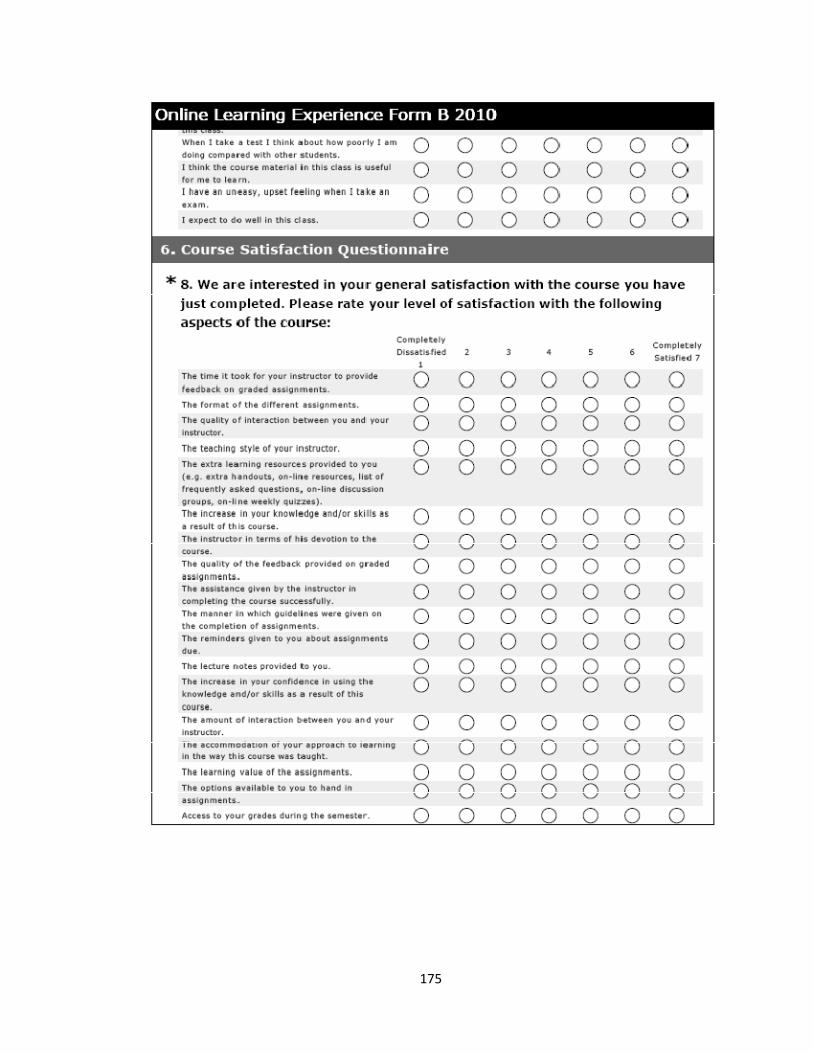
175
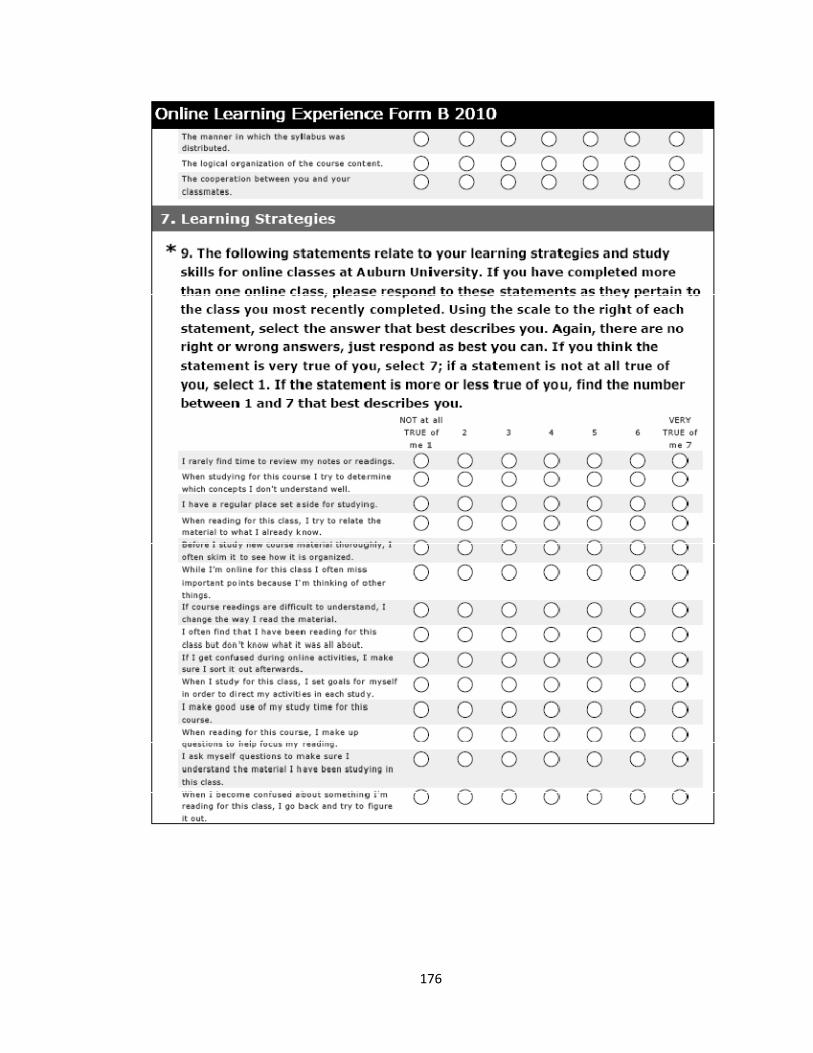
176
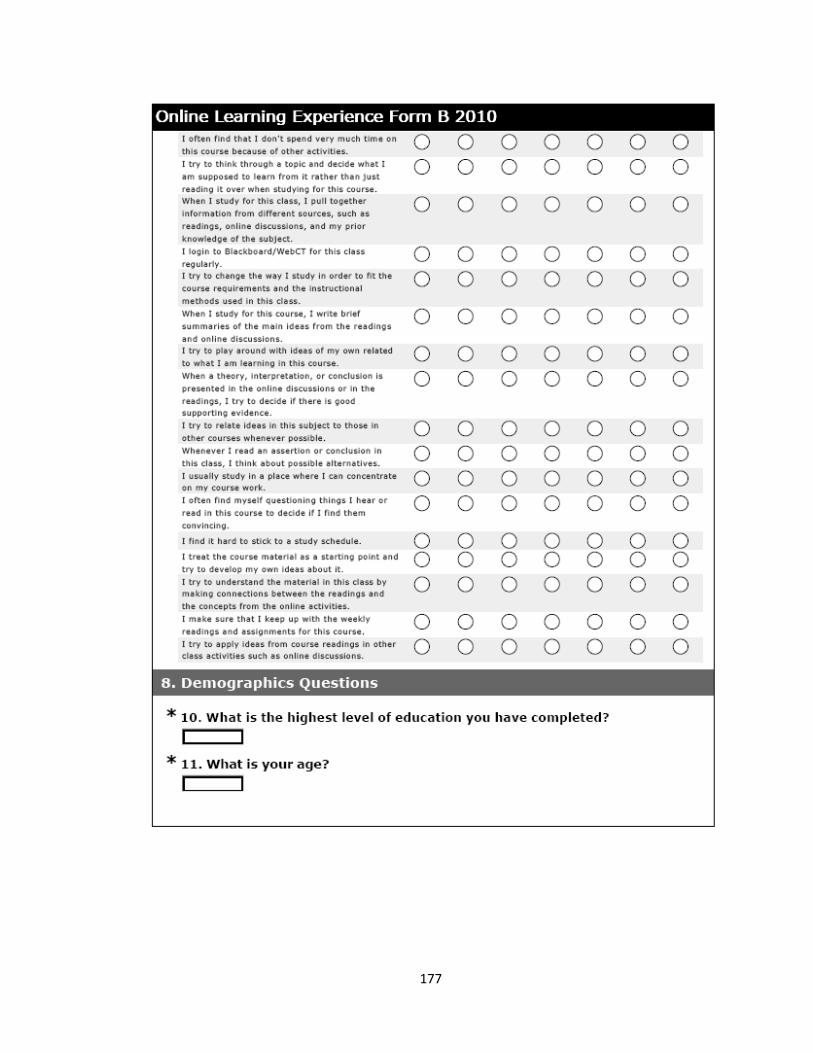
177
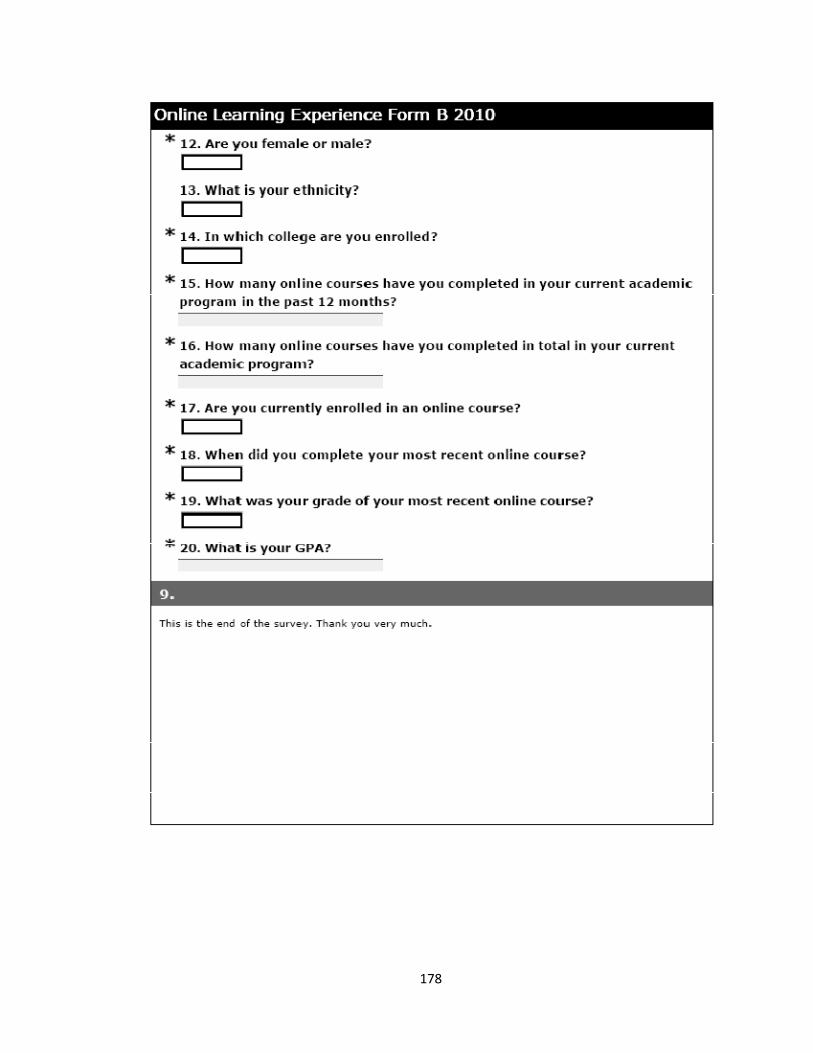
178
179
Appendix D
Survey Invitation E-mails

180
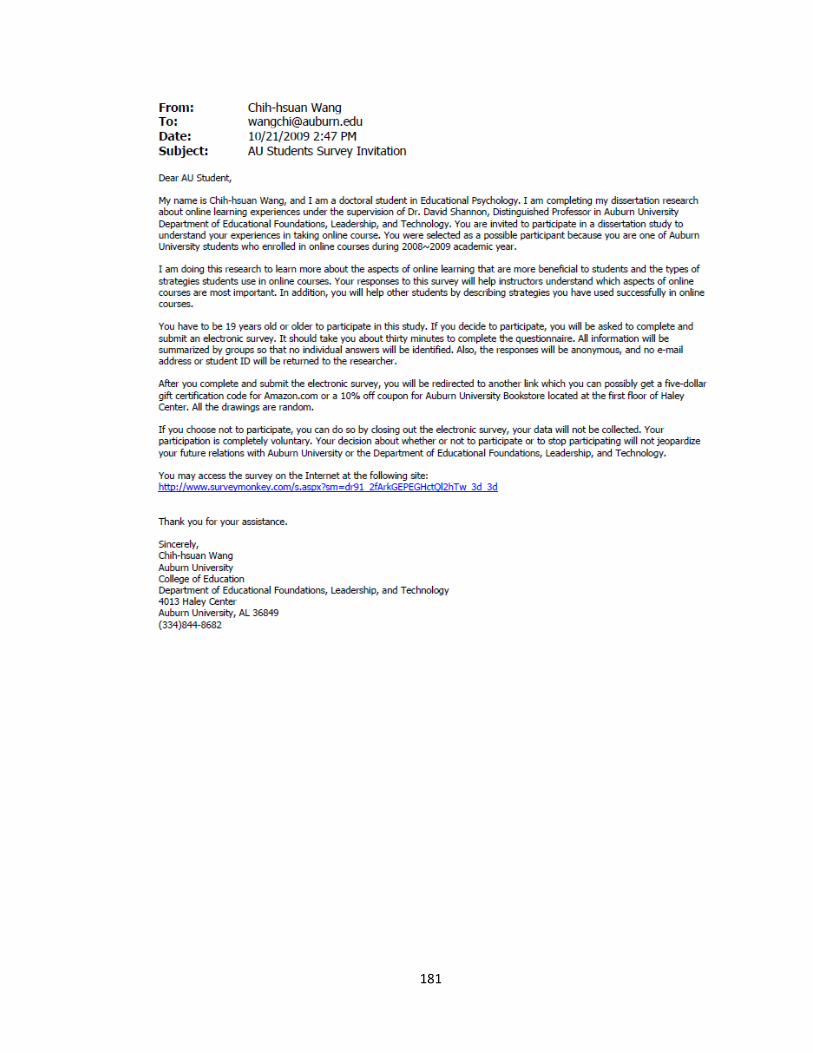
181
182
Appendix E
Survey Reminders

183
184

185
Appendix F
Thank You Page
186

187
Appendix G
Raffle Page
188