students dropping out of puerto rico public schools ...economia.uprrp.edu/ensayo 125.pdf ·...
TRANSCRIPT
Students Dropping Out of Puerto Rico Public Schools
Measuring the Problem and Examining the Implications
Neil Allison and Arthur MacEwan*
1. Introduction
In Puerto Rico, as in the United States, a very large number of students drop out
of school. For the states, recent studies suggest that the dropout problem is much greater
than usually acknowledged, with perhaps as many as one-third of all students failing to
complete high school in the normal four years. The data for Puerto Rico tell a similar
story, but in Puerto Rico the problem appears greater because the data indicate that a
large number of students leave the public schools system before even entering high
school.
This report examines the school dropout issue in Puerto Rico, provides new
estimates of dropout rates, and discusses the economic context and the implications of
those estimates. The examination of the Puerto Rican school data and the estimates of
dropout rates lead to the following observations:
• Puerto Rico has a serious public school dropout problem. Even though officially
reported public school dropout rates are extremely low, enrollment figures
indicate that actual dropout rates are very high.
• Although dropout rates are high in Puerto Rico, they appear to have fallen
significantly during the 1990s and into the new century. Moreover, given that
Puerto Rico’s level of income is substantially below that of the states, we might
have expected much higher dropout rates.
• The Puerto Rican dropout problem appears to be especially severe for young
students, those at the 7th and 8th grade levels. Whereas high school dropout rates
appear to be no higher for Puerto Rico than for the average of the 50 states (and
thus significantly better than for many individual states), the dropout rate in
Puerto Rico for pre-high school students appears to be higher than in almost all
states. Overall, then, from the 6th
grade to high school graduation, Puerto Rico is
below all or virtually all of the states in its ability to engage and retain students.
• Extremely high dropout rates before the mid-1990s have left a legacy of adults
without high school degrees. Forty percent of adults over 24 lack a high school
degree, significantly higher than in any state.
*Neil Allison, [email protected], is an economics and education consultant and vice president for
K-12 services, SMARTHINKING, Inc., a leading provider of online academic support services. Arthur
MacEwan, [email protected], is Professor of Economics at the University of Massachusetts
Boston.
Neil Allison & Arthur MacEwan
2
• There appear to be substantial problems with the data that are available on the
Puerto Rican public schools. These problems mean both that this analysis of
dropout rates should be taken with an appropriate degree of caution and that a
thorough audit of school data in Puerto Rico would be desirable.
The school dropout problem is important for many well-known reasons. Kids
who drop out of school tend to have lower incomes compared to those who stay in
school, and poorer life-outcomes by a number of other measures as well. Furthermore, a
high dropout rate appears to have many negative impacts for society as a whole – for
example, lowering economic performance, reducing social integration and political
participation, and raising the crime rate.1
In addition, the dropout phenomenon is important for what it tells us about the
schools and about the larger society. Quite simply it tells us that something is wrong.
When students drop out of schools, we know that the schools are not working; they are
not meeting the needs of the students and of their families. The schools may not be
working because of things that are wrong in the schools – a failure to engage the students
or a failure to provide a safe environment, for example. Or schools may not be working
because they fail to prepare students for the actual economic opportunities that they will
face when they leave school. Also, circumstances in society outside of the schools may
be the origin of the difficulties – a lack of job opportunities for schooled workers, for
example. Whatever the bases of the problem, a high dropout rate is a signal that things
are not working.2
Puerto Rico’s dropout problem, and general problems in the schools, may not be
fully recognized because by some measures Puerto Rico seems to have a highly educated
work force. In 2000, 18.3% of the Puerto Rican population 25 or older had attained a
college degree (or more), while in the Untied States the comparable figure was 24.4%;
moreover, the Puerto Rican 2000 figure was almost as high as the 1990 figure of 20.3%
for the states. Certainly, for its level of income, by this measure Puerto Rico has a highly
educated work force. However, Puerto Rico appears to have a “bi-modal” distribution of
education: 40% of the 25 and over population in 2000 had not attained a high school
diploma and 25.4% had less than 9 grades of schooling, while the comparable figures for
the United States were 19.6% and 7.5%.3 In part, the situation represented by these
figures reflects the rapid change that has taken place in recent decades, with the younger
population in Puerto Rico having much more schooling than the older population.4 Yet
1 The association between dropping out and various individual and social problems does not necessarily
mean causation. It is possible that both dropping out and the various problems are caused by other factors
– indeed, this is certainly the case to some degree. 2 Part of the measured dropout rate from the public schools may be due to movement from public to private
schools, rather than departures from school entirely, an issue we note below. However, the implications for
the public schools are the same – the high and increasing enrollment in Puerto Rico’s private schools
suggest that many parents and students value the benefits of schooling but are not satisfied with the public
schools. 3 See Table 3 below and Statistical Abstract of the United States 2003.
4 See Table 2 below.
Students Dropping Out of Puerto Rico Public Schools
3
the figures also suggest the existence of the limits and problems in Puerto Rico’s school
system.
The first step in addressing the dropout issues is an accurate assessment of the
degree of the problem. This report offers the beginnings of such an assessment by
providing estimates of dropout rates from the Puerto Rican public schools at the
aggregate level. We use a set of “cohort methods” to measure dropouts. With data on
enrollments by year and class, we are able to follow each cohort through school to see
what percentage of the students in a particular class (e.g., the ninth grade in 1996/97)
graduates from high school at the time that students from that class would normally
graduate (2000 for the ninth grade class of 1996/97).
In Section 2, after commenting on the official dropout data, we will describe the
different procedures that are used to estimate dropout rates. We will then explain the
various “cohort methods” that we employ to measure dropouts in Puerto Rico and
comment on the limitations of those methods.
In Section 3 we will present the results of our estimates of dropout rates from the
Puerto Rican public schools. We will present the results for high school, middle school,
and overall combined dropout rates for students through middle and high school.
In the final section, Section 4, we will discuss the economic context of the dropout
issue and then proceed to examine some of the implications for Puerto Rican schools –
especially in light of the No Child Left Behind legislation. We will consider some of the
broad policy issues, building on research that focuses primarily on the United States but
that has relevance for the Puerto Rican situation. We will conclude by suggesting ways
to address data problems and by identifying areas for future research.
Tables in the Appendix provide dropout data for Puerto Rico and the 50 states and
the District of Columbia.
2. ESTIMATING STUDENT DROPOUT RATES
The Digest of Educational Statistics (DES), published each year by the U.S.
Department of Education, presents for each state and territory of the United States “the
figure reported to the federal authorities as the percentage of 9th
to 12th
graders who drop
out each year.” (See Appendix Table A-2.) The figure for Puerto Rico for 1999-2000 is
0.9%, which is less than half of the figure reported for any state. It is not believable that
Puerto Rico’s public schools actually have a dropout rate this low compared to the states.
(The 1999-2000 figure is not an anomaly, as the figure is similarly low in other years.)
Moreover, the reported figure is dramatically at odds with what many observers believe
to be the case on the basis of anecdotal evidence. Indeed, the estimates we will present
below suggest that the dropout rate for Puerto Rico’s public schools may be ten times as
high as this reported rate.
Neil Allison & Arthur MacEwan
4
Given the importance of knowing whether students actually make it through
school to graduate, it is surprising to find that data collection systems do not exist to
measure the phenomenon accurately anywhere in the United States. Puerto Rico is no
different; good data are hard to find. Even the No Child Left Behind (NCLB) legislation
does not mandate the use of a consistent definition of the dropout rate that would enable
comparisons across districts and states. Existing dropout figures from the public schools
or as measured through surveys are widely acknowledged to underestimate the severity of
the problem. This report uses the alternative of cohort methods that employ publicly
available enrollment figures to estimate dropout rates. While preferable to survey results
or school figures, these different cohort alternatives also have their limitations.
Unfortunately, schools do not track individual students using a unique identifier,
which would enable a more direct measurement of student completion of high school and
the extent to which students drop out before graduation. Although the cost of
implementing such a system would be significant, it would help provide a more direct
measure of the dropout problem. In the absence of such a direct measure, various
estimation techniques are employed.
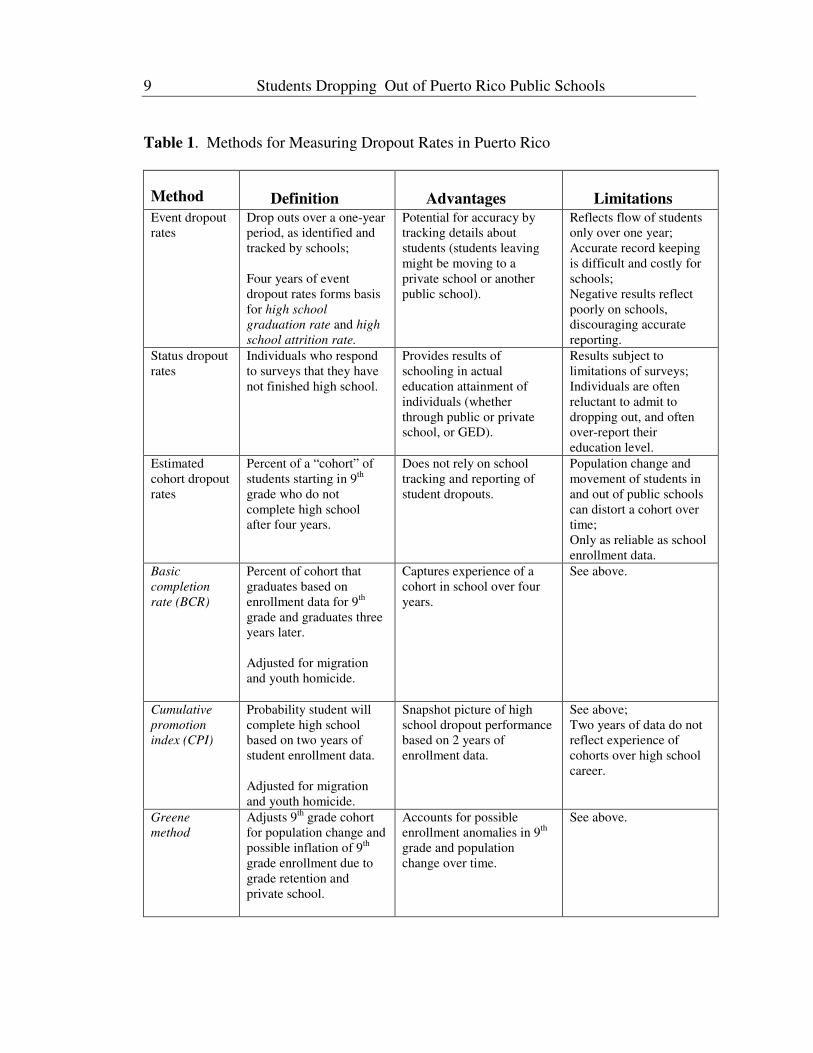
It is first instructive to review the figures and methods that are commonly
used to estimate the extent of the dropout problem, and their limitations.
The primary estimates are so-called “event dropout rates” reported by
public schools and “status dropout rates” from surveys of young people
about their schooling. Then there are the alternative “cohort methods”
that we focus on in this report. Table 1 on reviews the characteristics of the
different ways of looking at the dropout rate, along with some advantages
and limitations of using each; although the information in Table 1 is
presented in terms of high school dropout rates, the same information
applies when the estimates are for earlier years or for the earlier years plus
high school.
2.1. Event Dropout Rates
Event dropout rates measure the number and percent of students who drop out
during a one-year period. Event dropout rates capture the dropout flow over a year, but
tell little about the extent of the dropout phenomenon: how many students drop out over
time. Further, event dropout rates as reported by schools are notoriously inaccurate and
are widely considered to underestimate the extent of the school dropout problem – and, as
noted above, this seems to be especially so in Puerto Rico.5
5 Underestimating dropout rates does not necessarily result from incentives for schools to do so; tracking
dropouts is difficult and costly. It requires that schools track students as they enter and exit school, which
is difficult with students who are often a mobile populations. In the rest of the United States, the Current
Population Survey also reports on the event dropout rate, which it defines as 15 – 24 year olds who were
enrolled in high school in October of one year but had not completed high school and were not enrolled in
school a year later.
Students Dropping Out of Puerto Rico Public Schools
5
2.2. Status Dropout Rates
Surveys estimate the percentage of young people who have completed high
school and, conversely, the percentage that have dropped out, based on the reports of
respondents. Usually measured through surveys of 16 to 24 year olds, the “status dropout
rate” refers to the percentage of people who are not currently enrolled in school and have
not received a high school diploma or general education development (GED) degree.
Similar to the status dropout rates, the “high school completion rate” measures the
percentage of 18 to 24 year olds surveyed who have completed high school with either a
GED or diploma.
Surveys often provide unreliable estimates of the dropout rate. They tend to
under-represent lower income, jailed, and other populations. Respondents also tend to
over-state their educational attainment and avoid admitting to dropping out of school.
The Current Population Survey, commonly used to estimate the extent of
dropouts, does not cover Puerto Rico (and does not survey enough
households nationwide to enable state-level reports for most U.S. states).
The decennial Census, however, does survey Puerto Rico and includes
similar questions about educational attainment and enrollment.
2.3 Alternative Cohort Rates
As an alternative to event dropout rates and status dropout rates, this report
presents estimates of the dropout rate in Puerto Rico using common, so-called cohort
methods to track the progress of classes through public schools and to graduation on the
basis of reported enrollment figures by grade. Each cohort method brings strengths and
limitations, but all share common advantages over other methods of estimating dropouts.
Cohort methods rely on enrollment figures, which schools have less difficulty tracking
than event dropout rates and which, in themselves, do not reflect poorly on the schools.
2.3.1. Basic Completion Ratio (BCR)
Perhaps the most simple and intuitive of the cohort estimates, the basic completion
ratio (BCR) method estimates the high school completion rate by tracking a presumed
“cohort” of 9th
grade students through high school using reported annual school
enrollment figures.6 For example, if school enrollment figures report that 100 9
th graders
started the 1994-1995 school year, and 75 graduated in 1998, the BCR method would
conclude that the graduation rate was 75% and the drop out rate was 25%. The BCR also
captures the experience of students over an extended time period as the cohort in question
passes through school (four years if high school is the focus, three for middle school).
6 The reverse of the BCR is often known as the Estimated Attrition Rate, which reflects the percentage of
students who do not graduate.
Neil Allison & Arthur MacEwan
6
For example, the BCR for 6th
graders finishing high school this year would cover
schooling over the past seven years.
The accuracy of the BCR method is influenced by changes in student population over
the window of time covered; the longer the window, the greater the susceptibility to error.
Migration, other population changes, and movement to and from private schools can all
skew BCR results. As Puerto Rico has a high rate of enrollment in private school –
higher than in any state – such movements are even more likely to affect results.7
For Puerto Rico, it is desirable to adjust BCR estimates to take account of net
migration to the United States; some of the decline in a cohort as it passes through the
grades is accounted for by this net migration and not by dropping out as usually
conceived. Based on Census data reported in Christenson (2001), which provides Puerto
Rico-to-U.S. net migration by age groups, we have estimated that on net during the 1990s
about 250 high school aged students in each cohort emigrated each year. For middle
school students, the data allow an estimate of 170 per year from each cohort.8 Thus net
out migration accounts for the attrition of about two-thirds of one percent of each high
school class and about one-third of one percent of each middle school class.
Further, it is unfortunately also necessary to take account of the unusually high
murder rate of juveniles in Puerto Rico. The overall murder rate in Puerto Rico is higher
than for any state and almost four times higher than the U.S. average, 20.1 per 100,000
for Puerto Rico in 2002 compared with 5.6 per 100,000 for the United States as a whole.
Youth under 18 represent a disproportionately high percentage of these deaths. A rough
estimation suggests that about 20 students, an almost full class of students, from each
public high school cohort is lost to murder each year in Puerto Rico.9
2.3.2. Cumulative Promotion Index (CPI)
Developed by researchers at the Urban Institute (Swanson, 2004), the cumulative
promotion index (CPI) estimates the probability that a student entering 9th
grade will
graduate based on a cohort analysis of two years of enrollment data. The CPI assumes
that the likelihood of graduation is equal to the cumulative likelihood of each high school
grade cohort moving successfully to the next year (or graduation) using two years of
enrollment data.
By using a shorter, two-year window of analysis, the CPI method requires less
data and is less susceptible to errors caused by changes in student population over time.
For areas with little volatility in student population, however, the BCR method would
7 According to the 2000 Census, 17.6% of total elementary and secondary enrollments are in private
schools in Puerto Rico, compared with 10.4% for the United States as a whole. The state with the next
highest private school enrollment rate is Louisiana, with 16.6% of students in private schools. 8 We have assumed that 80% of the net migration is students from public schools, as roughly 20% of Puerto
Rican students are enrolled in private schools. 9 This tragic juvenile murder rate is about 10 times higher than in the United States as a whole.
Students Dropping Out of Puerto Rico Public Schools
7
provide a more accurate picture of student experience throughout the high school or
middle school experience of the cohort than the CPI. Also, by drawing on only two years
of data, the CPI may be more distorted by short-term data anomalies than the BCR (as
may be the case in Puerto Rico in 2000 – see below).
According to the method discussed in the previous section, we have attempted to
adjust for the out migration of students for the CPI method as well by reducing each
cohort by the estimated annual attrition of middle or high school students. The high
school CPI also accounts for the percentage of students who do not receive a diploma
after being accounted for in the first month of their senior year. This cohort is reduced by
only 187 (i.e., 75% of 250) students, reflecting the estimate of the 9 months of the year
these students are in school. Similarly, the CPI figures should also be adjusted for the loss
of students in each cohort to violence.
2.3.3. Greene’s method
The procedure for estimating dropout rates developed by Jay Greene (Greene and
Forster, 2003) of the Manhattan Institute also uses a modified version of the cohort
method to estimate the high school graduation rate. Greene’s method controls for two
potential sources of error in the BCR method by altering the size of cohorts. First,
Greene notes that the 9th
grade cohort might be inflated due to transfers from private
schools into public schools and an unusual number of students held back in 9th
grade. To
control for anticipated inflated 9th
grade enrollments, Greene recommends that 9th
grade
enrollments be “smoothed” by using an average of 8th
, 9th
and 10th
grade enrollments.
Second, Greene proposes to control for student population movements during the time
the cohort is moving through the school by adjusting the size of the “smoothed” 9th
grade
enrollment by the change in population of the high school during the four years that the
cohort moves through it.
2.4. Limitations of Cohort Methods
It is important to acknowledge the limitations of the methods used in estimating
the dropout rate for Puerto Rico. While widely considered more accurate than even
dropout rates reported by schools and status dropout rates from surveys, cohort methods
estimate the graduation rate based on annual enrollment figures and not from the tracking
of individual students.10
Changes in population (for which we have made some rough
corrections) and, especially, movements to and from private schools can skew results
based solely on enrollment figures.
Because cohort dropout estimates are derived from public school enrollment
figures, they do not allow us to distinguish between students who left the schools
10
Schools derive cohort estimates based on the even dropout rate for each successive class of students.
Neil Allison & Arthur MacEwan
8
entirely11
and those who moved from public to private schools. The difference is
important, as the ultimate outcomes for the individuals in the two groups – and
consequently for society at large – are very different. As Puerto Rico has a large and
growing share of its students in private schools, some of the dropout from the public
schools is accounted for by a net movement of students to private schools. However, the
dropout rates provided by the cohort estimates are still a useful indication of the situation
in the public schools. If students are leaving to go to private schools, this is a different
phenomenon than students leaving school entirely, but it still is an indicator of
shortcomings in the public schools that deserve attention. Furthermore, the rising
enrollments in private schools show that many people in Puerto Rico are willing to pay
for schooling, which in turn suggests that schooling does pay if the quality is good.
While not a problem of the cohort method per se, dropout estimates based on the
cohort method are only as good as the basic enrollment data on which they are based.
Recent aggregate enrollment data for Puerto Rico’s schools, public and private, show a
very large increase in total enrollments; private school enrollments move upward sharply
from 2000 to 2002 without any corresponding decrease in public school enrollments.
The large increase defies explanation, and hence these data call into question the overall
reliability of Puerto Rico enrollment data.
Finally, as with any aggregate estimates, the cohort method results obtained here
do not provide information about individual schools or regions of the school district. (In
Puerto Rico, there is only one district.) There is every reason to think that Puerto Rican
schools, like schools elsewhere, vary considerably in terms of their experience with the
dropout problem, as well as in terms of their experience with other problems.
Because of these various limitations, the estimates presented here should be viewed
with appropriate caution and should be interpreted as approximations, not precise
measures. They are, nonetheless, an improvement on other estimates.
11
Without the intention of returning to school.
Students Dropping Out of Puerto Rico Public Schools
9
Table 1. Methods for Measuring Dropout Rates in Puerto Rico
Method
Definition
Advantages
Limitations
Event dropout
rates
Drop outs over a one-year
period, as identified and
tracked by schools;
Four years of event
dropout rates forms basis
for high school
graduation rate and high
school attrition rate.
Potential for accuracy by
tracking details about
students (students leaving
might be moving to a
private school or another
public school).
Reflects flow of students
only over one year;
Accurate record keeping
is difficult and costly for
schools;
Negative results reflect
poorly on schools,
discouraging accurate
reporting.
Status dropout
rates
Individuals who respond
to surveys that they have
not finished high school.
Provides results of
schooling in actual
education attainment of
individuals (whether
through public or private
school, or GED).
Results subject to
limitations of surveys;
Individuals are often
reluctant to admit to
dropping out, and often
over-report their
education level.
Estimated
cohort dropout
rates
Percent of a “cohort” of
students starting in 9th
grade who do not
complete high school
after four years.
Does not rely on school
tracking and reporting of
student dropouts.
Population change and
movement of students in
and out of public schools
can distort a cohort over
time;
Only as reliable as school
enrollment data.
Basic
completion
rate (BCR)
Percent of cohort that
graduates based on
enrollment data for 9th
grade and graduates three
years later.
Adjusted for migration
and youth homicide.
Captures experience of a
cohort in school over four
years.
See above.
Cumulative
promotion
index (CPI)
Probability student will
complete high school
based on two years of
student enrollment data.
Adjusted for migration
and youth homicide.
Snapshot picture of high
school dropout performance
based on 2 years of
enrollment data.
See above;
Two years of data do not
reflect experience of
cohorts over high school
career.
Greene
method
Adjusts 9th
grade cohort
for population change and
possible inflation of 9th
grade enrollment due to
grade retention and
private school.
Accounts for possible
enrollment anomalies in 9th
grade and population
change over time.
See above.
Neil Allison & Arthur MacEwan
10
3. EVIDENCE ON THE DROPOUT RATE IN PUERTO RICO
3.1. Event Dropout Rates
In Puerto Rico, official annual “event dropout rates” report that only 0.9% of high
school students dropped out during 2000, a figure lower than that for any reporting state
or the District of Columbia (NCES, 2001). Similar figures are not available for middle
school students. Due to the limitations of the underlying data, estimates of graduation
rates using reported event dropout rates also underestimate the extent of the phenomenon.
In Puerto Rico, the calculation of graduation rates using this method suggest that 94.6%
of 9th
graders subsequently complete high school, a higher graduation rate than in any
reporting state or the District of Columbia. The average state reported an 80.5%
graduation rate (NCES, 2004). (See Appendix Tables A-1 and A-2 for a listing of
available state event dropout rates and completion rates.)
3.2. Status Dropout Rates
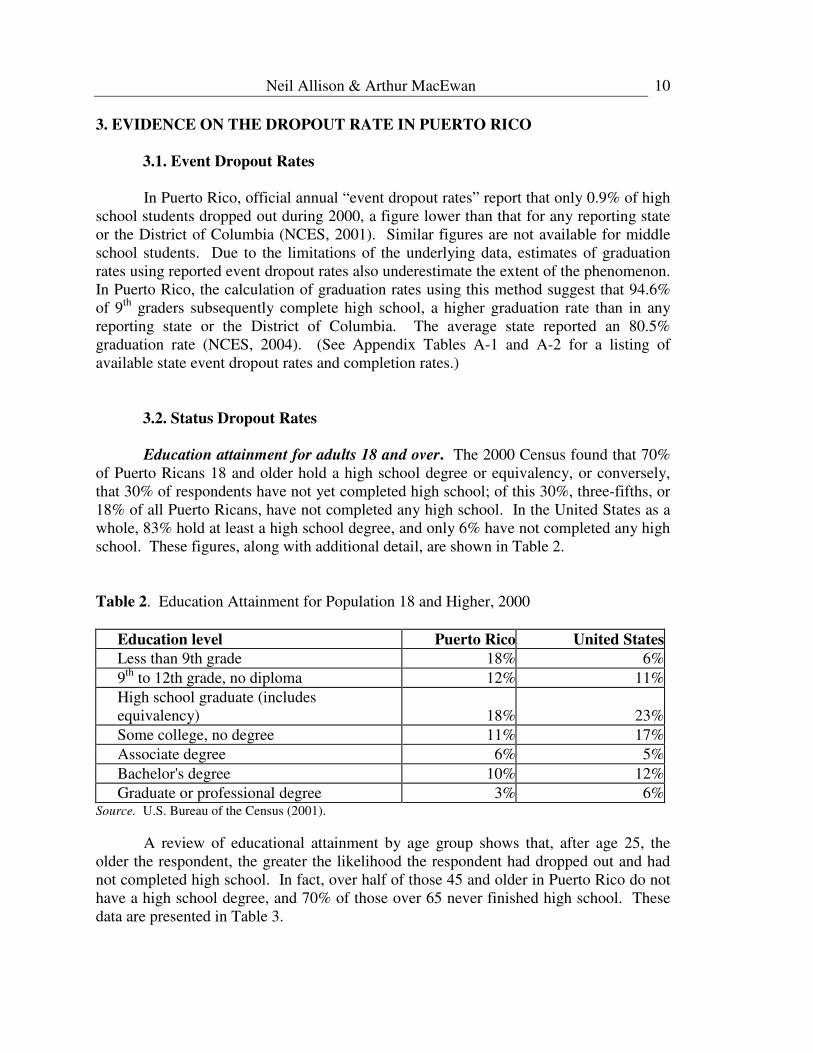
Education attainment for adults 18 and over. The 2000 Census found that 70%
of Puerto Ricans 18 and older hold a high school degree or equivalency, or conversely,
that 30% of respondents have not yet completed high school; of this 30%, three-fifths, or
18% of all Puerto Ricans, have not completed any high school. In the United States as a
whole, 83% hold at least a high school degree, and only 6% have not completed any high
school. These figures, along with additional detail, are shown in Table 2.
Table 2. Education Attainment for Population 18 and Higher, 2000
Education level Puerto Rico United States
Less than 9th grade 18% 6%
9th
to 12th grade, no diploma 12% 11%
High school graduate (includes
equivalency) 18% 23%
Some college, no degree 11% 17%
Associate degree 6% 5%
Bachelor's degree 10% 12%
Graduate or professional degree 3% 6%Source. U.S. Bureau of the Census (2001).
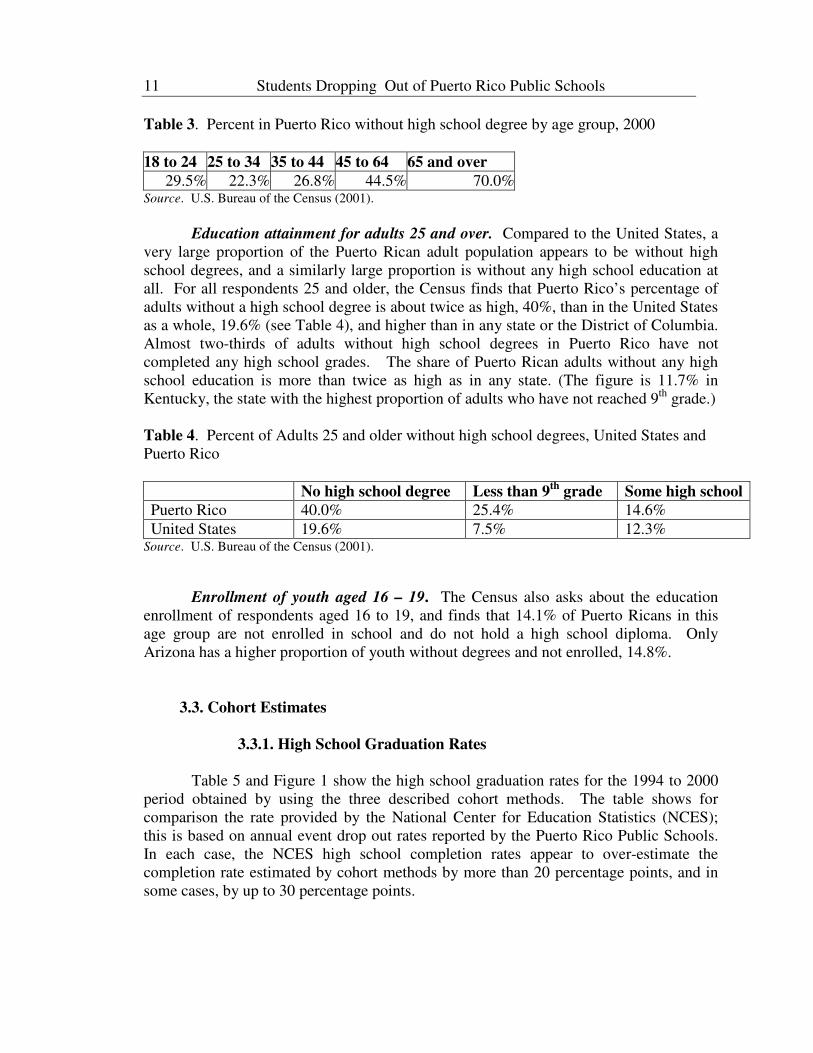
A review of educational attainment by age group shows that, after age 25, the
older the respondent, the greater the likelihood the respondent had dropped out and had
not completed high school. In fact, over half of those 45 and older in Puerto Rico do not
have a high school degree, and 70% of those over 65 never finished high school. These
data are presented in Table 3.
Students Dropping Out of Puerto Rico Public Schools
11
Table 3. Percent in Puerto Rico without high school degree by age group, 2000
18 to 24 25 to 34 35 to 44 45 to 64 65 and over
29.5% 22.3% 26.8% 44.5% 70.0%Source. U.S. Bureau of the Census (2001).
Education attainment for adults 25 and over. Compared to the United States, a
very large proportion of the Puerto Rican adult population appears to be without high
school degrees, and a similarly large proportion is without any high school education at
all. For all respondents 25 and older, the Census finds that Puerto Rico’s percentage of
adults without a high school degree is about twice as high, 40%, than in the United States
as a whole, 19.6% (see Table 4), and higher than in any state or the District of Columbia.
Almost two-thirds of adults without high school degrees in Puerto Rico have not
completed any high school grades. The share of Puerto Rican adults without any high
school education is more than twice as high as in any state. (The figure is 11.7% in
Kentucky, the state with the highest proportion of adults who have not reached 9th
grade.)
Table 4. Percent of Adults 25 and older without high school degrees, United States and
Puerto Rico
No high school degree Less than 9th
grade Some high school
Puerto Rico 40.0% 25.4% 14.6%
United States 19.6% 7.5% 12.3% Source. U.S. Bureau of the Census (2001).
Enrollment of youth aged 16 – 19. The Census also asks about the education
enrollment of respondents aged 16 to 19, and finds that 14.1% of Puerto Ricans in this
age group are not enrolled in school and do not hold a high school diploma. Only
Arizona has a higher proportion of youth without degrees and not enrolled, 14.8%.
3.3. Cohort Estimates
3.3.1. High School Graduation Rates
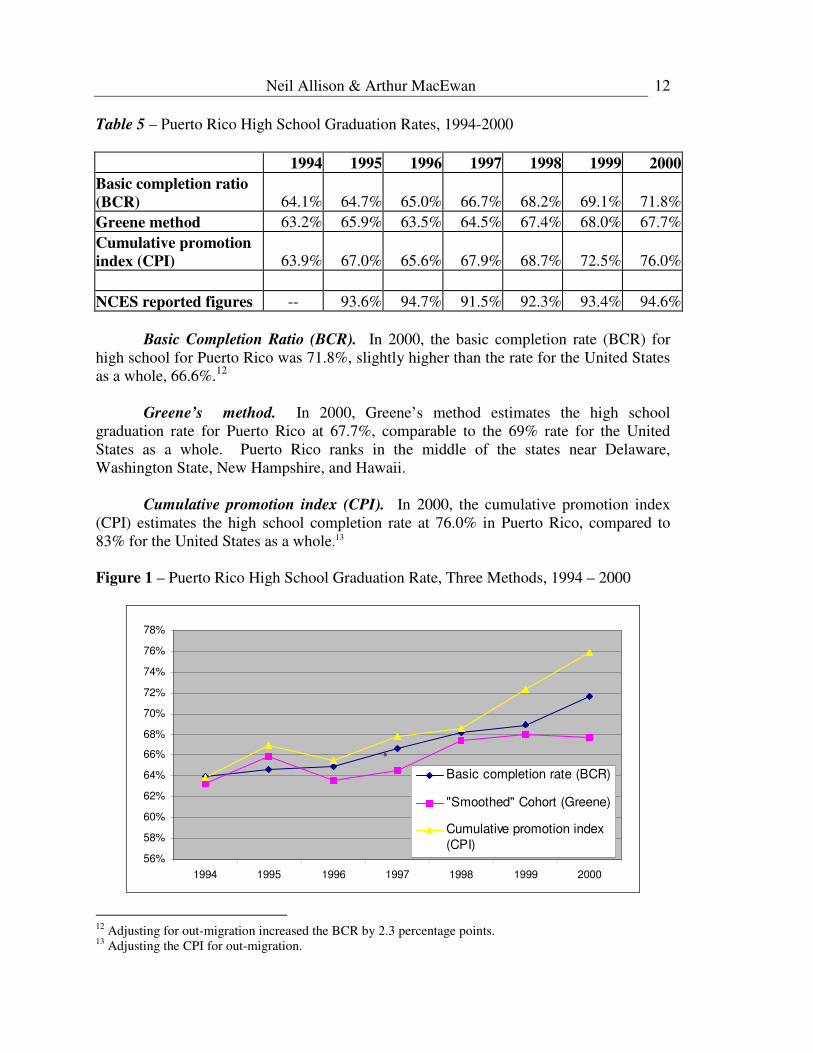
Table 5 and Figure 1 show the high school graduation rates for the 1994 to 2000
period obtained by using the three described cohort methods. The table shows for
comparison the rate provided by the National Center for Education Statistics (NCES);
this is based on annual event drop out rates reported by the Puerto Rico Public Schools.
In each case, the NCES high school completion rates appear to over-estimate the
completion rate estimated by cohort methods by more than 20 percentage points, and in
some cases, by up to 30 percentage points.
Neil Allison & Arthur MacEwan
12
Table 5 – Puerto Rico High School Graduation Rates, 1994-2000
1994 1995 1996 1997 1998 1999 2000
Basic completion ratio
(BCR) 64.1% 64.7% 65.0% 66.7% 68.2% 69.1% 71.8%
Greene method 63.2% 65.9% 63.5% 64.5% 67.4% 68.0% 67.7%
Cumulative promotion
index (CPI) 63.9% 67.0% 65.6% 67.9% 68.7% 72.5% 76.0%
NCES reported figures -- 93.6% 94.7% 91.5% 92.3% 93.4% 94.6%
Basic Completion Ratio (BCR). In 2000, the basic completion rate (BCR) for
high school for Puerto Rico was 71.8%, slightly higher than the rate for the United States
as a whole, 66.6%.12
Greene’s method. In 2000, Greene’s method estimates the high school
graduation rate for Puerto Rico at 67.7%, comparable to the 69% rate for the United
States as a whole. Puerto Rico ranks in the middle of the states near Delaware,
Washington State, New Hampshire, and Hawaii.
Cumulative promotion index (CPI). In 2000, the cumulative promotion index
(CPI) estimates the high school completion rate at 76.0% in Puerto Rico, compared to
83% for the United States as a whole.13
Figure 1 – Puerto Rico High School Graduation Rate, Three Methods, 1994 – 2000
56%
58%
60%
62%
64%
66%
68%
70%
72%
74%
76%
78%
1994 1995 1996 1997 1998 1999 2000
Basic completion rate (BCR)
"Smoothed" Cohort (Greene)
Cumulative promotion index
(CPI)
a
12
Adjusting for out-migration increased the BCR by 2.3 percentage points. 13
Adjusting the CPI for out-migration.
Students Dropping Out of Puerto Rico Public Schools
13
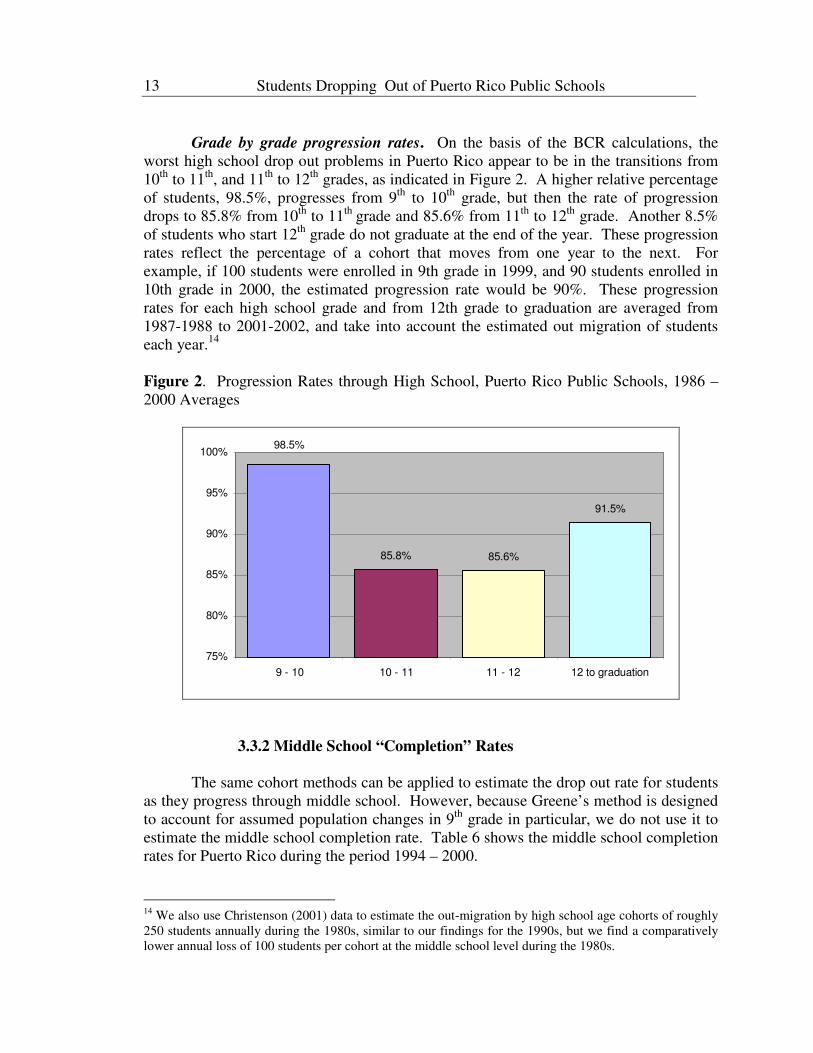
Grade by grade progression rates. On the basis of the BCR calculations, the
worst high school drop out problems in Puerto Rico appear to be in the transitions from
10th
to 11th
, and 11th
to 12th
grades, as indicated in Figure 2. A higher relative percentage
of students, 98.5%, progresses from 9th
to 10th
grade, but then the rate of progression
drops to 85.8% from 10th
to 11th
grade and 85.6% from 11th
to 12th
grade. Another 8.5%
of students who start 12th
grade do not graduate at the end of the year. These progression
rates reflect the percentage of a cohort that moves from one year to the next. For
example, if 100 students were enrolled in 9th grade in 1999, and 90 students enrolled in
10th grade in 2000, the estimated progression rate would be 90%. These progression
rates for each high school grade and from 12th grade to graduation are averaged from
1987-1988 to 2001-2002, and take into account the estimated out migration of students
each year.14
Figure 2. Progression Rates through High School, Puerto Rico Public Schools, 1986 –
2000 Averages
85.8% 85.6%
91.5%
98.5%
75%
80%
85%
90%
95%
100%
9 - 10 10 - 11 11 - 12 12 to graduation
3.3.2 Middle School “Completion” Rates
The same cohort methods can be applied to estimate the drop out rate for students
as they progress through middle school. However, because Greene’s method is designed
to account for assumed population changes in 9th
grade in particular, we do not use it to
estimate the middle school completion rate. Table 6 shows the middle school completion
rates for Puerto Rico during the period 1994 – 2000.
14
We also use Christenson (2001) data to estimate the out-migration by high school age cohorts of roughly
250 students annually during the 1980s, similar to our findings for the 1990s, but we find a comparatively
lower annual loss of 100 students per cohort at the middle school level during the 1980s.
Neil Allison & Arthur MacEwan
14
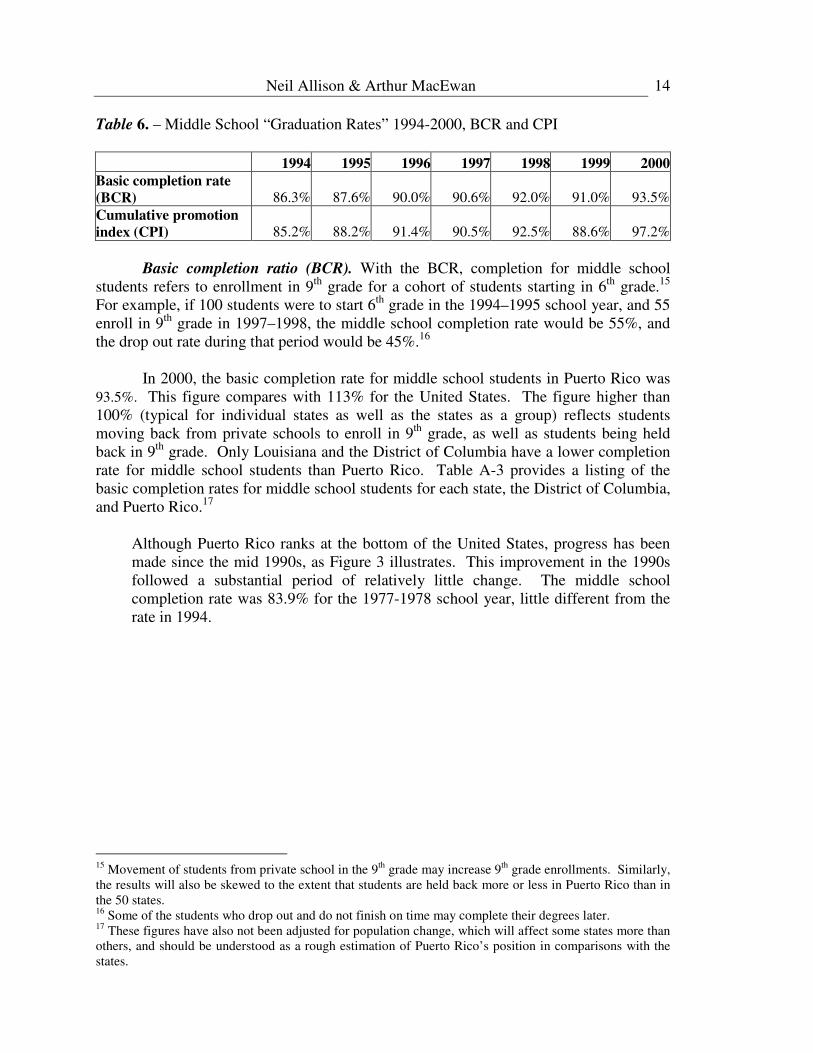
Table 6. – Middle School “Graduation Rates” 1994-2000, BCR and CPI
1994 1995 1996 1997 1998 1999 2000
Basic completion rate
(BCR) 86.3% 87.6% 90.0% 90.6% 92.0% 91.0% 93.5%
Cumulative promotion
index (CPI) 85.2% 88.2% 91.4% 90.5% 92.5% 88.6% 97.2%
Basic completion ratio (BCR). With the BCR, completion for middle school
students refers to enrollment in 9th
grade for a cohort of students starting in 6th
grade.15
For example, if 100 students were to start 6th
grade in the 1994–1995 school year, and 55
enroll in 9th
grade in 1997–1998, the middle school completion rate would be 55%, and
the drop out rate during that period would be 45%.16
In 2000, the basic completion rate for middle school students in Puerto Rico was
93.5%. This figure compares with 113% for the United States. The figure higher than
100% (typical for individual states as well as the states as a group) reflects students
moving back from private schools to enroll in 9th
grade, as well as students being held
back in 9th
grade. Only Louisiana and the District of Columbia have a lower completion
rate for middle school students than Puerto Rico. Table A-3 provides a listing of the
basic completion rates for middle school students for each state, the District of Columbia,
and Puerto Rico.17
Although Puerto Rico ranks at the bottom of the United States, progress has been
made since the mid 1990s, as Figure 3 illustrates. This improvement in the 1990s
followed a substantial period of relatively little change. The middle school
completion rate was 83.9% for the 1977-1978 school year, little different from the
rate in 1994.
15
Movement of students from private school in the 9th
grade may increase 9th
grade enrollments. Similarly,
the results will also be skewed to the extent that students are held back more or less in Puerto Rico than in
the 50 states. 16
Some of the students who drop out and do not finish on time may complete their degrees later. 17
These figures have also not been adjusted for population change, which will affect some states more than
others, and should be understood as a rough estimation of Puerto Rico’s position in comparisons with the
states.
Students Dropping Out of Puerto Rico Public Schools
15
Figure 3 – Puerto Rico Middle School “Graduation” Rate, Basic Completion Rate and
Cumulative Promotion Index, 1994 – 2000
78%
80%
82%
84%
86%
88%
90%
92%
94%
96%
98%
100%
1994 1995 1996 1997 1998 1999 2000Year
Percen
t
Basic completion rate
(BCR)
Cumulative promotion
index (CPI)
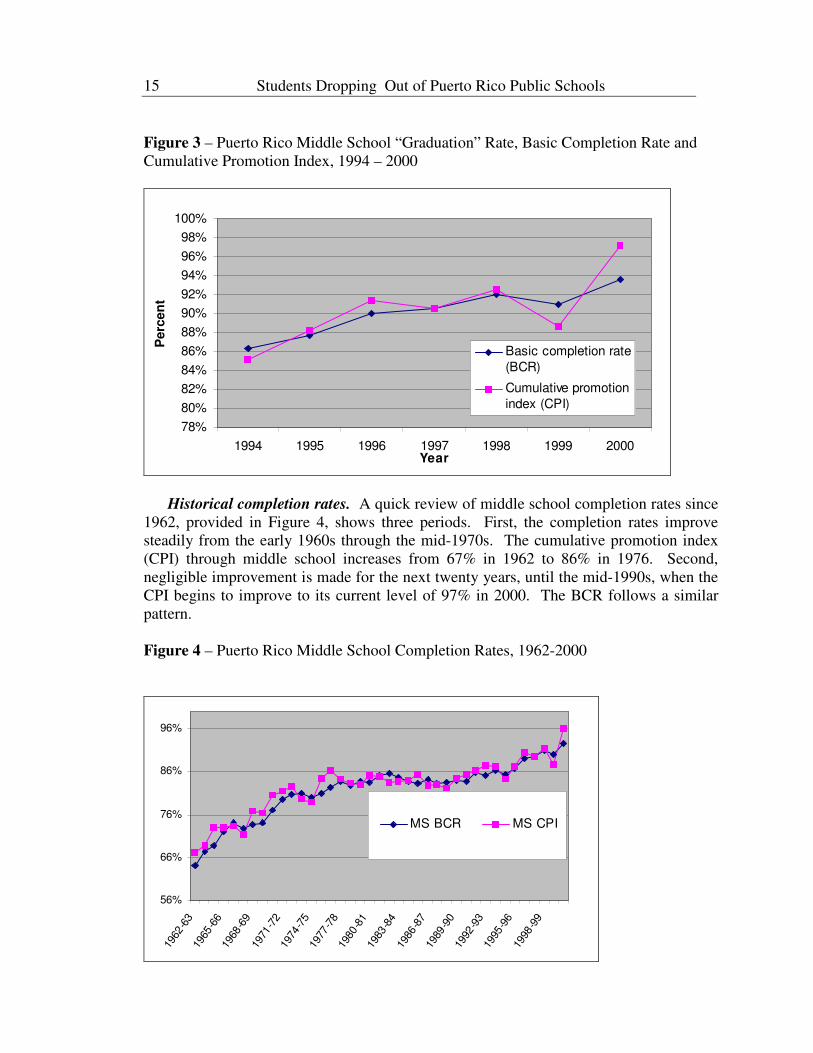
Historical completion rates. A quick review of middle school completion rates since
1962, provided in Figure 4, shows three periods. First, the completion rates improve
steadily from the early 1960s through the mid-1970s. The cumulative promotion index
(CPI) through middle school increases from 67% in 1962 to 86% in 1976. Second,
negligible improvement is made for the next twenty years, until the mid-1990s, when the
CPI begins to improve to its current level of 97% in 2000. The BCR follows a similar
pattern.
Figure 4 – Puerto Rico Middle School Completion Rates, 1962-2000
56%
66%
76%
86%
96%
1962
-63
1965
-66
1968
-69
1971
-72
1974
-75
1977
-78
1980
-81
1983
-84
1986
-87
1989
-90
1992
-93
1995
-96
1998
-99
MS BCR MS CPI
Neil Allison & Arthur MacEwan
16
Cumulative promotion index (CPI). The cumulative promotion index (CPI) provides
a 97.2% middle school completion rate for 2000. Almost 9 percentage points higher than
in 1999, the 2000 figure might reflect unusual enrollment changes from 1999 to 2000. In
comparison, the CPI middle school rate for the United States as a whole was 115% in
2000.
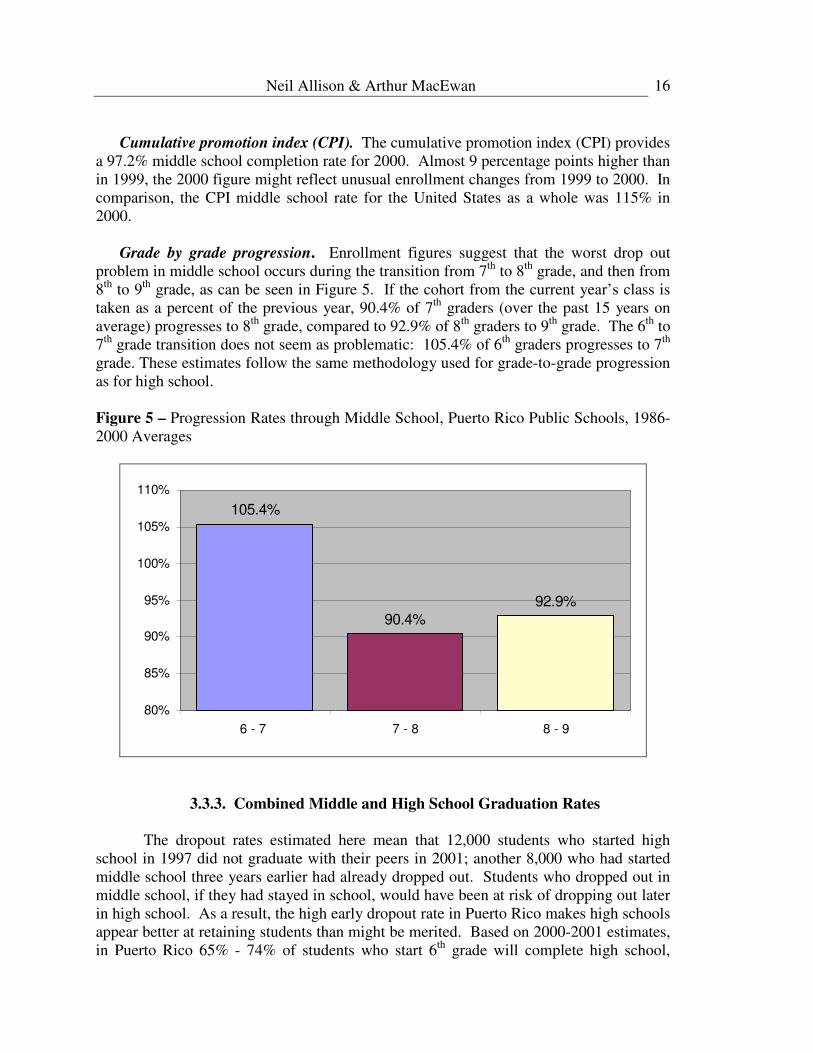
Grade by grade progression. Enrollment figures suggest that the worst drop out
problem in middle school occurs during the transition from 7th
to 8th
grade, and then from
8th
to 9th
grade, as can be seen in Figure 5. If the cohort from the current year’s class is
taken as a percent of the previous year, 90.4% of 7th
graders (over the past 15 years on
average) progresses to 8th
grade, compared to 92.9% of 8th
graders to 9th
grade. The 6th
to
7th
grade transition does not seem as problematic: 105.4% of 6th
graders progresses to 7th
grade. These estimates follow the same methodology used for grade-to-grade progression
as for high school.
Figure 5 – Progression Rates through Middle School, Puerto Rico Public Schools, 1986-
2000 Averages
105.4%
90.4%
92.9%
80%
85%
90%
95%
100%
105%
110%
6 - 7 7 - 8 8 - 9
3.3.3. Combined Middle and High School Graduation Rates
The dropout rates estimated here mean that 12,000 students who started high
school in 1997 did not graduate with their peers in 2001; another 8,000 who had started
middle school three years earlier had already dropped out. Students who dropped out in
middle school, if they had stayed in school, would have been at risk of dropping out later
in high school. As a result, the high early dropout rate in Puerto Rico makes high schools
appear better at retaining students than might be merited. Based on 2000-2001 estimates,
in Puerto Rico 65% - 74% of students who start 6th
grade will complete high school,
Students Dropping Out of Puerto Rico Public Schools
17
using both basic completion rate and cumulative promotion index methods.18
In the
United States as a whole, the comparable estimate is in the range of 76 to 78%.
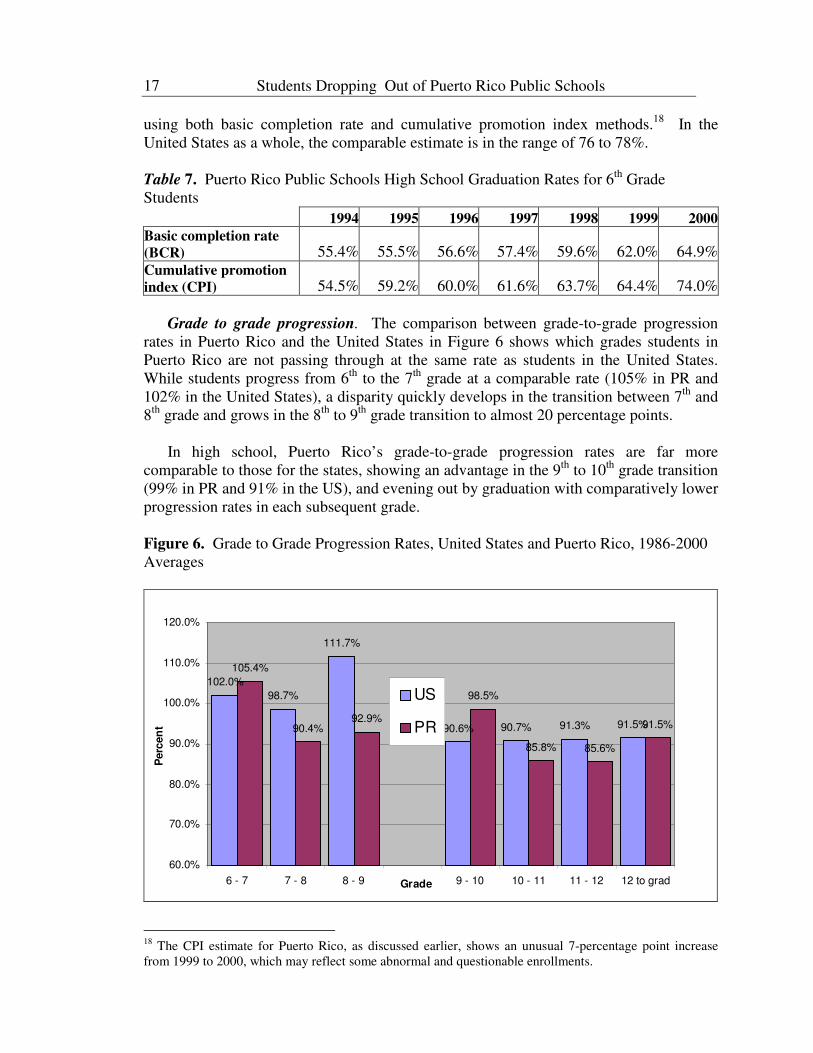
Table 7. Puerto Rico Public Schools High School Graduation Rates for 6th
Grade
Students
1994 1995 1996 1997 1998 1999 2000
Basic completion rate
(BCR) 55.4% 55.5% 56.6% 57.4% 59.6% 62.0% 64.9%
Cumulative promotion
index (CPI) 54.5% 59.2% 60.0% 61.6% 63.7% 64.4% 74.0%
Grade to grade progression. The comparison between grade-to-grade progression
rates in Puerto Rico and the United States in Figure 6 shows which grades students in
Puerto Rico are not passing through at the same rate as students in the United States.
While students progress from 6th
to the 7th
grade at a comparable rate (105% in PR and
102% in the United States), a disparity quickly develops in the transition between 7th
and
8th
grade and grows in the 8th
to 9th
grade transition to almost 20 percentage points.
In high school, Puerto Rico’s grade-to-grade progression rates are far more
comparable to those for the states, showing an advantage in the 9th
to 10th
grade transition
(99% in PR and 91% in the US), and evening out by graduation with comparatively lower
progression rates in each subsequent grade.
Figure 6. Grade to Grade Progression Rates, United States and Puerto Rico, 1986-2000
Averages
102.0%
98.7%
111.7%
90.6% 90.7% 91.3% 91.5%
105.4%
90.4%92.9%
98.5%
85.8% 85.6%
91.5%
60.0%
70.0%
80.0%
90.0%
100.0%
110.0%
120.0%
6 - 7 7 - 8 8 - 9 9 - 10 10 - 11 11 - 12 12 to gradGrade
Perc
en
t
US
PR
18
The CPI estimate for Puerto Rico, as discussed earlier, shows an unusual 7-percentage point increase
from 1999 to 2000, which may reflect some abnormal and questionable enrollments.
Neil Allison & Arthur MacEwan
18
3.4. Summary of the Evidence
By way of summary, the findings presented here indicate that Puerto Rico has a
serious public school dropout problem. Even though officially reported public school
dropout rates are extremely low, enrollment figures indicate that actual dropout rates are
very high. However, although dropout rates are high in Puerto Rico, they appear to have
fallen significantly during the 1990s and into the new century. Moreover, given that
Puerto Rico’s level of income is substantially below that of the states, we might have
expected much higher dropout rates.
The Puerto Rican dropout problem appears to be especially severe for young
students, those at the 7th and 8th grade levels. Whereas high school dropout rates appear
to be no higher for Puerto Rico than for the average of the 50 states (and thus
significantly better than for many individual states), the dropout rate in Puerto Rico for
pre-high school students appears to be higher than in almost all states. Overall, then,
from the 6th
grade to high school graduation, Puerto Rico is below all or virtually all of
the states in its ability to engage and retain students.
It should also be noted that extremely high dropout rates before the mid-1990s
have left a legacy of adults without high school degrees. Forty percent of adults over 24
lack a high school degree, significantly higher than in any state.
Finally, there appear to be substantial problems with the data that are available on
the Puerto Rican public schools. These problems mean both that this analysis of dropout
rates should be taken with an appropriate degree of caution and that a thorough audit of
school data in Puerto Rico would be desirable.
4. CONTEXT AND IMPLICATIONS
As stated earlier, a high dropout rate from Puerto Rico’s public schools indicates
that something is wrong. By comparative standards with the states, Puerto Rico’s
dropout rate is not as high as one might expect, given the lower level of income in Puerto
Rico as compared to the states (and given the general correlation between the level of
income and the extent of schooling in various societies). Furthermore, significant
improvements occurred in the 1990s. Nonetheless, Puerto Rico’s dropout rate does
indicate that something is wrong, and, especially because of the strong association
between successful schooling and economic-social-political progress, it is important to
figure out what is wrong and to attempt remedial action.
4.1. The Economic Context
Although most discussions of the dropout problem focus on the schools and
programs of remediation that might be implemented in the schools, it is important to
Students Dropping Out of Puerto Rico Public Schools
19
recognize that the problem is not necessarily confined to the schools. Students who view
themselves as unlikely to go to college may perceive that there is little pay-off to staying
in school if the labor market opportunities for high school graduates are relatively poor.
Available data, though limited, suggest that this may not be an unreasonable perception.
Sample data from the 2000 Census indicate that the people with a high school diploma in
Puerto Rico have incomes that average no more than 30% above the incomes of people
who drop out. For the states taken as a whole, the comparable figure is 36%. The pay-
off to a college degree in Puerto Rico is similar to – or perhaps greater than – that in the
states, but, if students from low-income families believe they have very little (if any)
likelihood of going to college, they may see limited value in completing high school.19
Furthermore, insofar as there is a large “informal economy” in Puerto Rico, it is likely to
provide unreported sources of income for dropouts; therefore the figures noted here from
the census may overstate the pecuniary gains from completing high school.
It is also possible that Puerto Rico’s special relation to the United States may
weaken the economic incentives for staying in school. The relatively high (compared to
Puerto Rican average income) federal transfer payments may reduce labor market
incentive for people at the lower income levels. Also, the option of temporary migration
to the states to earn income that is high by Puerto Rican standards – for example, in non-
union construction activity – may appear preferable to the jobs that can be obtained in
Puerto Rico with a high school degree.
A considerable body of literature suggests the overall connection between the
dropout rate and the return to a high school degree in the labor market. (For example:
Bickel and Papagiannis, 1988; Clark, 1992; Rumberger, 1983). In general, when good
jobs are relatively available, there is a stronger incentive for kids to stay in school (as
“good jobs” generally require a high school degree). But poor times economically, when
families especially need additional income, may reduce this incentive, and there may be a
tendency for the dropout rate to rise. In Puerto Rico, it is probably no coincidence that
the failure of the middle school dropout rate to continue improving after the mid-1970s –
see Figure 6 – was associated with the slow-down of the economy that began roughly at
that time.
To the extent that these labor market factors are significant in affecting Puerto
Rico’s dropout rate, solutions to the problem are especially more difficult. While it is
possible to imagine programs that would improve labor market opportunities for high
school graduates and thereby reduce dropout rates, implementation of those programs
would take a long time. Recognizing the economic factors that affect dropout rates
should, however, prevent either placing extensive blame on the schools for the problem
19
The overall U.S. figures on returns to schooling are from Day and Newburger (2002). The Puerto Rico
figures are based on calculations carried out by Ricardo Godoy, Mariana Caram, and their colleagues at
Brandeis University who have been engaged in an examination of information on Puerto Rico from the
Census Bureau’s Public Use Microdata Series summary files. While these figures based on recent census
data suggest similar pay-offs to a college degree in Puerto Rico and the United States, other estimates
suggest the pay-off is greater in Puerto Rico. In either case, however, if students see little likelihood that
they will continue on to college, the advantage of completing high school may be minimal.
Neil Allison & Arthur MacEwan
20
or having unrealistic expectations about the possibilities for solving the problem through
reform of the schools. Nonetheless, reforms in the schools can be an important part of
the solution to the dropout problem.
Equally important, there is a two-way relationship between improving labor
market opportunities for high school graduates and improving the schools themselves.
Part of the explanation for a lack of job opportunities for high school graduates may be
that high school graduation in itself is not be a meaningful qualification for many jobs. If
schools are doing a poor job of preparing students for the labor market – if, for example,
a high school diploma does not mean that a person has the requisite skills for many jobs –
then there will be little difference between the opportunities available to a person who has
graduated and those available to a person who has dropped out.20
4.2. Implications For The Schools
4.2.1. No Child Left Behind Issues
The No Child Left Behind (NCLB) legislation, which applies to Puerto Rico as it
does to the 50 states and the District of Columbia, has some immediate implications for
Puerto Rico’s approach to the dropout problem in its public schools. In particular, the
law will press Puerto Rican authorities to address the problem. NCLB focuses on the
graduation rate – and implicitly the dropout rate – as an indicator of a school’s successes
and failures, and prescribes improvement in the rate over time. The law has particular
provisions regarding calculating and publicizing dropout and completion rates and for the
consequences of failing to achieve “adequate yearly progress” in graduation rates.21
NCLB specifically adopts the cohort method of estimating the “on-time”
graduation rate, meaning those students who finish high school when expected.22
The
law, however, does not require any particular kind of data collection system, and it gives
states and territories leeway to use an “alternative” method of measuring the graduation
rate.23
In effect, Puerto Rico, like any state, has leeway to use versions of the methods
20
We do not mean that high schools should be expected to endow students with job-specific skills. The
skills learned in school that prepare people for employment include a broad range of cognitive and
behavioral qualities. Schools are successful if, by developing this broad range of skills, they have endowed
the students with the most important skill of knowing how to learn. If employers know that a high school
diploma means that a person is capable of learning the skills for a particular job, then the diploma has
meaning. Of course, schools have a wider purpose than simply preparing people for the job market, and,
while preparing people for the job market is central to the discussion here, that broader purpose should not
be forgotten. 21
Such requirements of NCLB have the problem of seeing the actions of students as affected only by the
schools, without consideration of factors emanating from economic conditions, of the sort just noted, or
other larger societal factors. 22
The graduation rate is defined as “the percentage of students who graduate from secondary school with a
regular diploma in the standard number of years” No Child Left Behind Act, Section 1111(b)(2)(C)(vi). 23
Title I Final Regulations, Sec. 200.19 (a)(1)(i)(B).
Students Dropping Out of Puerto Rico Public Schools
21
described above, including completion ratios, promotion ratios, current NCES figures on
annual dropout rates, and others.
NCLB requires that high schools publish graduation rates (however defined) in
their annual report cards, but schools may select not to publish dropout rates (however
defined). Given that Puerto Rico’s dropout problem appears relatively more severe in
middle school than in high school, this NCLB requirement to report high school
graduation rates will not draw attention where it is most needed in Puerto Rico.
In the provisions of NCLB, the graduation rate is ostensibly to serve as a
secondary indicator for measuring adequate yearly progress (AYP) for schools and
districts. Schools that fail to make AYP face escalating “sanctions,” including the
provision of supplemental education services and school choice and leading to possible
school take-over by the state or territorial government. The graduation rate is specifically
selected as an indicator to prevent schools from pushing low-performing students out of
the school system to improve their test scores for AYP. However, to date there is no
clear specification of the extent to which graduation rates will factor into the calculation
of AYP. (See Swanson 2003a and 2003b for more complete discussions of NCLB and
calculating dropout rates.)
4.2.2. Policy Directions
The information presented in the previous sections of this report as well as the
requirements of NCLB demonstrate the need to address the dropout problem in the
schools. On the basis of what is widely recognized about the dropout problem, there are
certain policy steps that should be considered. We would call attention to the following:
Quality Improvement. Because students dropping out of school are responding at
least in part to labor market conditions, school policies will have limited impact on the
dropout rate if employers do not place a higher value on public school completion. By
improving the quality of the basic and general skills that they impart to students, schools
would raise the value of the diploma and create an incentive for students to stay in
school. Quality improvement, in addition to its impact on incentives related to the labor
market, can make school a more positive experience in itself.24
Quality improvement is hardly an innovative or controversial policy proposal, and
the problem remains how to achieve this improvement. By 2003, as part of a quest for
quality improvement, nineteen states had established the requirement that students
achieve a level of proficiency on assessments in math, science, language arts and other
24
In a sense, dealing with the dropout problem by improving the quality of schools can be viewed as a
“market solution” to the problem. With improved quality of the schools, the value of a degree is raised,
and thus students are likely to respond to market incentives and stay in school. Policy, in this situation,
affects the endowments that people have when they enter the market and thus alters the structure of the
markets.
Neil Allison & Arthur MacEwan
22
subjects, as measured by “exit exams,” in order to earn a diploma.25
Such assessments
are sometimes required for all diplomas, as they are in Massachusetts and Florida, or only
for students interested in receiving a type of diplomas noting the student’s achievement,
as New York State used to issue through the Regents degrees. When dropout rates are
used as a measure of schools’ success, there can be a temptation to improve success by
diluting standards, either directly by making it easier for students to complete school or
indirectly by “teaching to the test.” A dilution of academic standards would, of course,
be highly undesirable and, while it might (but only “might”) result in short run
improvements in dropout rates, would undermine the value of a diploma and thereby
contribute to higher dropout rates over the longer run. Exit exams and other forms of
assessment might forestall this option.
In itself, however, the exit exam approach to quality improvement is as likely to
exacerbate as to reduce the dropout problem. “High stakes” exams can have the impact
of pushing poorly performing students out of the schools, even if they succeed in raising
the general quality of the schools.26
Perhaps the greatest value of exit exams is that they
introduce a higher degree of assessment into the schools. A higher degree of assessment
can contribute to quality improvement because it can provide a direct impetus to
improvement and because it establishes the possibility of holding schools accountable for
the results they achieve. Assessment, however, can be accomplished by various means,
including exams but also including alternative measurements of students’
accomplishments.
Furthermore, while exams and alternative assessment mechanisms can be tools of
quality improvement, they are unlikely to bring about substantial change unless their
introduction is accompanied by the provision of greater resources to the schools. While
few would argue that money per se provides a solution to schools’ shortcomings in
Puerto Rico (or anywhere else), there is substantial reason to believe that more funds for
the Puerto Rican schools is an important element of reform. For example, teachers’ and
administrators’ salaries in Puerto Rico appear low as compared to general salary levels
(using the relation between school salaries and general salary levels in the states as a
basis for comparison). New regulations from Washington are already increasing the
availability of federal funds for the Puerto Rican schools, so providing more resources for
the schools in coming years may not place excessive burdens on the Puerto Rican
government’s budget.
25
Gayler et al (2003). An additional five states have plans to implement an exit exam before 2008. The
value and effect of exit exams is the subject of intense debate. 26
Quality improvement initiatives have increasingly included requiring students to pass annual assessments
to be promoted to the next grade, often at 3rd
or 8th
grade. Research clearly demonstrates that student
retention dramatically increases the likelihood that students will drop out. Rumberger (1995) found that
students retained in elementary or middle school were four times more likely to drop out, after controlling
for relevant predictive factors like academic performance and socioeconomic status. School improvement
strategies might have a less detrimental effect on student dropout rates if student academic needs were
addressed in regular supplemental after-school and summer school programs, rather than through grade
retention.
Students Dropping Out of Puerto Rico Public Schools
23
Quality and Connections. A large part of what matters in the schools is not
simply what is done but how it is done, how the schools and classrooms are organized.
While there are many different effective ways to teach, there is substantial evidenced that
a common element of success is firm connections between teachers and students and
between schools and communities.
A central element in establishing firm connections between teachers and students
is class size. While there is considerable controversy over the impact of class size on
student outcomes as measured by achievement tests, the evidence indicates that smaller
schools and smaller classes reduce dropout rates. According to the Committee on
Educational Excellence and Testing Equity (CEETE, 2003; p. 20): “Providing individual-
level counseling to students emerged as a key factor for changing students’ thinking
about their education. Another tool was creating smaller school settings, even within a
large school, if necessary. Students are more likely to become alienated and disengaged
from school [and therefore more likely to drop out] in larger settings, and are likely to
receive less individualized attention from teachers and staff.”
Furthermore, while there is controversy over the impact of class size on student
outcomes, existing studies do indicate that the positive impacts of small classes appear to
be greatest among low-income groups – precisely the groups where the dropout problem
is concentrated. (Rumberger, 1995; Mosteller, 1995) To the extent that there is a
correlation between test-measured accomplishments and a lower likelihood of dropping
out, smaller classes can likely make a positive contribution in this manner as well as
through reducing alienation and disengagement.27
Small school settings have part of their positive impact (on student achievement
and on dropout rates) because they can create a greater sense of “ownership” of the
schools on the part of the students.28
In fact, compared with schools in the states, Puerto
Rico has on average relatively small schools and relatively low student-teacher ratios
(indicating small classes). For example, of the 100 largest school districts in the United
States, only one has a median student-teacher ratio less than that of Puerto Rico; of these
27
As is pointed out by the CEETE (p. 20), smaller classes and smaller schools raise costs and can be a very
expensive method of reducing the dropout rate. However, as suggested here, the reduction of dropout rates
is only one benefit from small class size, and the costs should not be evaluated against this benefit alone. 28
Cotton (1996) point out several factors that might be accountable for the benefits of smaller school size:
“Everyone’s participation is needed to populate the school’s offices, teams, clubs, etc., so a far small
percentage of students is overlooked or alienated. Adults and students in the school know and care about
one another to a greater degree than is possible in larger schools. Small schools have a higher rate of parent
involvement. Students and staff generally have a stronger sense of personal efficacy in small schools.
Students in small schools take more of the responsibility for their own learning; their learning activities are
more often individualized, experimental, and relevant to the world outside of school; classes are generally
smaller; and scheduling is much more flexible. Grouping and instructional strategies associated with
higher student performance are more often implemented ins small schools – team teaching, integrated
curriculum, multiage grouping (especially for elementary children), cooperative learning, and performance
assessments.” Also, on the ability of small schools to engage and connect with students and reduce the
dropout rate, see Fetler (1989), Gregory (1992), Jewell (1989), Pittman and Haughwout (1987), Rogers
(1987), Smith and DeYoung (1988), Stockard and Mayberry (1992), Toenjes (1989), and Walberg (1992).
Neil Allison & Arthur MacEwan
24
100 largest school districts, none has an average school size as small as in Puerto Rico.
While smallness in itself does not solve dropout problems – or, for that matter, other
problems of the schools – it does provide a basis on which to build.29
Schools can also facilitate the positive sense of “ownership” that often exists in
small schools by building stronger ties to the community, especially to parents. Parent
involvement has been associated with reduced dropout rates and improved student
achievement (Peterson, 1989). Students encounter new academic and social challenges
in middle school for which they need support, though this comes at a time when
adolescents typically seek independence. Yet, parent involvement usually declines in
middle school when students need it the most (Henderson and Marburger, 1990).30
Little research has evaluated the effect of a school’s grade span on student
retention and performance. There is, however, anecdotal evidence that the separate
middle school or junior high school is less effective in building connections with students
than schools spanning grades K through 8. K-8 schools require fewer disruptive
transitions for students and provide consistent personalized attention over a longer period.
About 80% of Puerto Rico’s middle school aged students are enrolled in separate middle
schools spanning from the 6th
or 7th
grade through 8th
or 9th
grade, not in so-called K-8
“combined schools,” (NCES, 2004). Given the dropout rate for Puerto Rico’s middle
school aged students, a review of the effect of school’s grade span on retention and
student performance might be valuable. Districts like Philadelphia have found a strong
correlation between combined schools and performance, which may also translate into
improved retention (Offenberg, 2001).
The Puerto Rican schools have made formal efforts to create community councils
for the schools that would build this connection to communities. (Garcia Blanco and
Colon Morera, 1993). As an effective means to implement community connections,
these councils seem to have had limited impact. One of the factors that may negatively
affect the degree of parent participation in Puerto Rican schools is that, as noted earlier in
this report, a high percentage of Puerto Ricans older than 25 themselves lack a high
school education. Thus many parents may lack academic skills needed to help their
children with their schoolwork, and many may feel intimidated by the school
environment. Rebuilding community councils for the schools in Puerto Rico could have
significant positive impacts, not the least of which could be a reduction of dropout rates.
But such rebuilding would require an effective strategy that addresses the barriers to
29
On school size, see http://nces.ed.gov/pubs2001/100_largest/table04.asp. On the student-teacher ratio,
see http://nces.ed.gov/pubs2001/100_largest/table07.asp. Ironically, the one district with a lower student-
teacher ratio is the District of Columbia, supporting the point that this ratio per se does not solve school
problems. See Mitchell et al (1989) concerning the issue that smaller class size will not automatically
generate benefits of increased student engagement and improved performance. For more on the benefits of
small class size in positively affecting the dropout problem, see Pate-Bain et al (1999). 30
Schools can engage in a variety of strategies to engage parents, either encouraging home-based activities
to support learning (like limiting TV watching or insisting on finishing homework before play) or fostering
school-based activities to engage parents in the education of their children. In comparison to elementary
schools, the larger size of middle and high schools and the lack of a single point of teacher contact for
parents may make parent communication more difficult.
Students Dropping Out of Puerto Rico Public Schools
25
parent engagement. In addition, it should be recognized that creating and maintaining
strong connections to communities and parents requires staff input, which is to say that it
requires resources.
Another strategy that might affect the quality of the schools in a way that would
reduce dropouts in Puerto Rico would be an emphasis on an early exposure of students to
vocational education. Some evidence suggests that high quality, career-oriented
vocational education programs can help engage and keep students in school. For
example, Mertens, Seitz, and Cox (1982) found that increased enrollment in vocational
classes in high school was associated with a somewhat reduced likelihood of dropping
out. Most vocational programs do not begin until high school, after many students in
Puerto Rico have already dropped out, and after many risk factors predicting future
dropouts have already developed. It may be worth evaluating the integration of
vocational education into education at the elementary and middle school levels to help
further engage students in their learning.
Finally, more flexible class scheduling seems to be effective in helping students to
successfully manage work and school obligations. More research on the extent to which
students’ work obligations increase dropping out will help identify how successful more
flexible approaches might be. Flexible scheduling has been identified as effective in
retaining high school students and “recovering” older students with work and personal
obligations (Rossi, 1996).
Early Intervention. As the data presented previously in this report make clear,
many of Puerto Rico’s students drop out from the public schools earlier than their
counterparts in the mainland United States, many in the 7th
and 8th
grades. Even in the
states, however, early intervention is an important component in programs to reduce
dropouts.31
CEETE concludes the first chapter of its report on Understanding Dropouts
with the following statement:
“The committee concludes that identifying students with risk factors [for dropping
out] early in their careers (preschool through elementary school) and providing
them with ongoing support, remediation, and counseling are likely to be the most
promising means of encouraging them to stay in school. Using individual risk
factors to identify likely dropouts with whom to intervene, particularly among
students at the ninth-grade level and beyond, is difficult. Evidence about
interventions done at this stage suggests that their effectiveness is limited.”
31
Dropping out is not a “one-time event” but a slow disengagement from school, manifested in reduced
attendance and lower academic performance; see Audas and Willms (2001, for a review of the literature.
Academic achievement and engagement as measured by attendance and social problems in early
elementary school grades predict future dropping out (Rumberger, 2001). For example, Barrington and
Hendricks (1989) found that future dropouts had significantly lower attendance as early as first grade and
lower achievement in third grade.

Neil Allison & Arthur MacEwan
26
What is true of the dropout problem generally in the states is likely to be even more true
in Puerto Rico.
In Puerto Rico, whatever strategies are adopted should be implemented even
earlier than in traditional intervention programs. For example, the Gear Up program has
provided academic support and college advice to students starting in 7th
grade and
followed cohorts of students through middle and high school. Such an intervention may
start too late to affect the dropout rate among many Puerto Rico students. Identification
of problems and intervention should begin virtually as soon as students enter the schools.
School Mobility. Strategies to address the dropout problem should address the
high rates of student mobility, which have implications for the students who move as well
as those in their classrooms. Mobility is correlated with higher dropout rates (Rumberger
and Larson, 1998), as well as lower academic achievement, particularly for students for
low-income backgrounds (Sewell, 1982). Because of the different languages of
instruction, mobility to and from mainland United States schools may be more disruptive
than movement within the Puerto Rico schools.32
The school mobility issues, especially in relation to mobility to and from the
states, raises the importance of tracking students’ movement when the leave the Puerto
Rican schools (see below). For Puerto Rico, tracking students’ movement would be most
effective if coordinated with destination states. Better information sharing would enable
teachers to more quickly establish student progress and target instruction accordingly.
Puerto Rico schools could also adopt some targeted programs used in other districts,
which have: created buddy systems between incoming students and existing students;
conducted outreach with parents to create awareness of the negative consequences of
frequent movements (a process enhanced to the extent that strong community
connections exist); and provided professional development to help teachers meet the
needs of mobile students.
Dropout recovery. This paper has focused on strategies for engaging students and
reducing the dropout out in the public schools. Policies are also needed to reach out to
those former students who have already dropped out and now languish without the skills
to attain well-paying jobs. As discussed earlier, the legacy of high historical dropout
rates in Puerto Rico is older age groups with up to 50% lacking a high school degree.
Creating opportunities for these older dropouts to get relevant education and training
must be a policy priority for Puerto Rico.
4.3. Data and Further Research
While the dropout problem in the states has been extensively – though by no
means exhaustively or sufficiently – studied, Puerto Rican schools and the Puerto Rican
32
English speaking students moving from the mainland United States to Spanish language Puerto Rican
schools will be “Spanish language learners” facing similar transitional challenges as do Spanish speakers in
English speaking mainland schools, although the extent of such a phenomenon is unclear.
Students Dropping Out of Puerto Rico Public Schools
27
context have their own particularities that demand their own examination. Such
examination requires, first of all, a more reliable and more extensive database.
As we have noted above, there appear to be problems with the data that are
available on the Puerto Rican public schools. We have emphasized, in particular, that the
officially reported dropout rates are so low as to lack credibility. Also, we have noted
questionable aspects of recent aggregate enrollment figures. These problems raise the
possibility that a thorough audit of school data is needed in Puerto Rico. At the very
least, official data and the means by which they are gathered must be made readily
available to independent investigators.
As to data collection focused on the Puerto Rican dropout issue itself, there is an
especially strong reason that the process be conducted or evaluated by outside
investigators. Particularly under No Child Left Behind regulations, Puerto Rico schools
may face sanctions based on their graduation rate success or failure. Sanctions create
powerful incentives to provide pleasing and inaccurate data, as the dropout “miracle” in
the Houston public schools illustrates.
Also, while aggregate data are useful, school-specific data can be highly valuable
in identifying the nature of problems, highlighting specific difficulties, and bringing
attention to “best practice” schools. Further, while costly, a system of tracking individual
students would help create more accurate figures. Just as important, such a system would
enable more effective targeting and support of students. The tracking of individual
students can help in identifying at an early point in their schooling those most at-risk.
Such information would not only aid in analyses of the dropout phenomenon, but, most
important, would enable schools to target instruction and interventions to individual
students. Such targeted data systems could draw on or expand existing student
information systems, and could include information on common risk factors for future
dropouts: student grades, performance on assessments, retention, behavioral issues,
attendance, and parents’ education and involvement.33
The regular circular migration between Puerto Rico and the mainland United
States does not make the task of tracking individual students any easier. However,
cooperation and data sharing between Puerto Rico and typical state destinations for
school children – such as New York, New Jersey, Illinois, and Florida – could help track
student enrollments across school systems and improve coordination of student learning
across districts.
33
However, the power of dropout prediction models based on such data is still quite weak (Gleason and
Dynarski, 1998). Gleason and Dynarski suggest that collecting additional data on students might help
improve models to predict dropout likelihood, namely: “(1) ecological characteristics, such as
neighborhood conditions or peer group effects; (2) unobserved psychological factors; (3) measures of the
persistence of specific characteristics over time; and (4) transitory events that occur closer to the time that
students decide to drop out.” Students drop out for a complex interplay of reasons, and students in Puerto
Rico, while similar to students in the rest of the US, may well be driven by a unique set of interrelated
factors different from the mainland US. Any model to predict future dropouts must be homegrown and
specific to Puerto Rico, based on data collected in elementary school, and altered as more data is collected.
Neil Allison & Arthur MacEwan
28
As to directions for further research, there are both issues of measurement and
analysis that need attention. The measurements we have presented in this report, as we
have noted, have their limitations. A more thorough, on-going examination of the
situation could reduce those limitations, especially if it is based on data that would allow
distinctions between students who switch from the public to private schools and students
who leave school entirely. Longitudinal studies like the National Education Longitudinal
Study of 1988 (NELS) and the Philadelphia Education Longitudinal Study (PELS) track
and survey students over time. While costly and long-term, a similar longitudinal study
might shed light on the unique economic and social factors in Puerto Rico that are
correlated with dropping out.
There is, finally, a special need for analysis of the relation between dropout rates
and labor market conditions. We have offered some speculations above regarding this
relation, but speculations are no substitute for analysis. Research in New York State, for
example, found that students respond to labor market changes in different ways, based on
their economic and family situation. Deterioration in the general labor market might be
predicted to drive students out of school to help to support their families. Conversely,
students could respond to a decline in demand by staying in school because there are so
few alternatives in the job market. There is also the question of the “informal economy”
and temporary migration to the states, and the extent to which these options provide
employment for people who have dropped out of the Puerto Rican schools.
Understanding the dropout-labor market relationship is important as a basis for
formulating policies that might deal with the dropout problem most effectively.
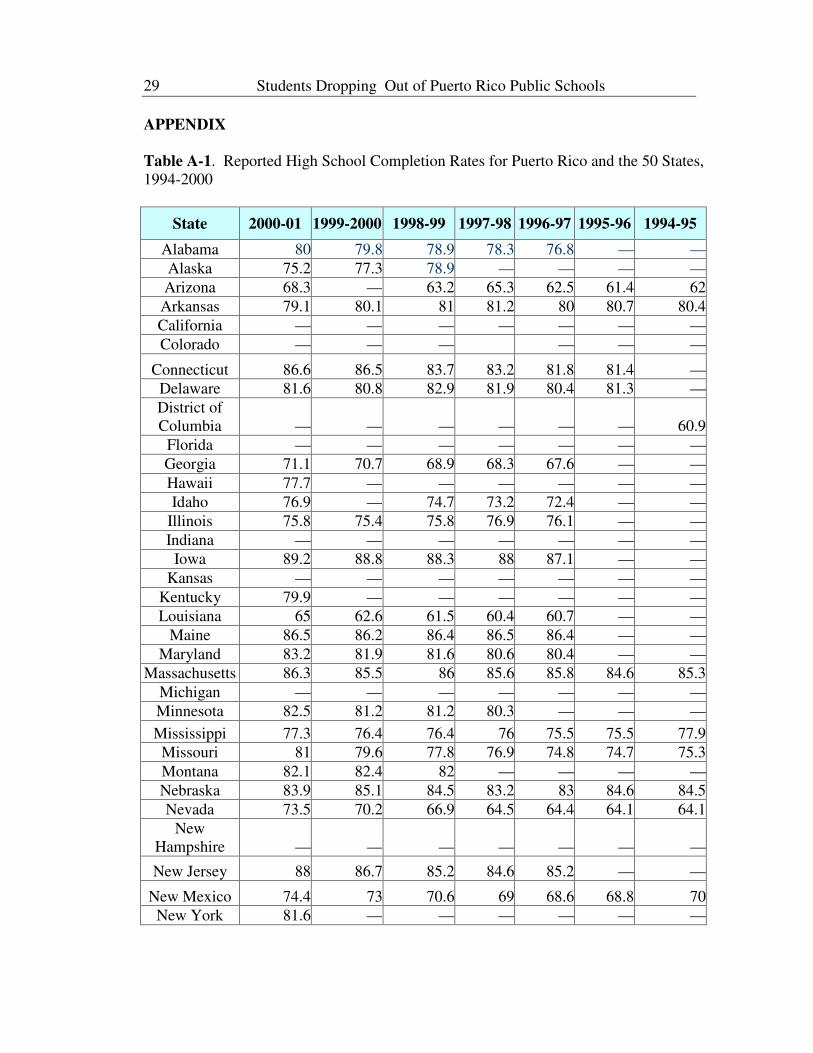
Students Dropping Out of Puerto Rico Public Schools
29
APPENDIX
Table A-1. Reported High School Completion Rates for Puerto Rico and the 50 States,
1994-2000
State 2000-01 1999-2000 1998-99 1997-98 1996-97 1995-96 1994-95
Alabama 80 79.8 78.9 78.3 76.8 — —
Alaska 75.2 77.3 78.9 — — — —
Arizona 68.3 — 63.2 65.3 62.5 61.4 62
Arkansas 79.1 80.1 81 81.2 80 80.7 80.4
California — — — — — — —
Colorado — — — — — —
Connecticut 86.6 86.5 83.7 83.2 81.8 81.4 —
Delaware 81.6 80.8 82.9 81.9 80.4 81.3 —
District of
Columbia — — — — — — 60.9
Florida — — — — — — —
Georgia 71.1 70.7 68.9 68.3 67.6 — —
Hawaii 77.7 — — — — — —
Idaho 76.9 — 74.7 73.2 72.4 — —
Illinois 75.8 75.4 75.8 76.9 76.1 — —
Indiana — — — — — — —
Iowa 89.2 88.8 88.3 88 87.1 — —
Kansas — — — — — — —
Kentucky 79.9 — — — — — —
Louisiana 65 62.6 61.5 60.4 60.7 — —
Maine 86.5 86.2 86.4 86.5 86.4 — —
Maryland 83.2 81.9 81.6 80.6 80.4 — —
Massachusetts 86.3 85.5 86 85.6 85.8 84.6 85.3
Michigan — — — — — — —
Minnesota 82.5 81.2 81.2 80.3 — — —
Mississippi 77.3 76.4 76.4 76 75.5 75.5 77.9
Missouri 81 79.6 77.8 76.9 74.8 74.7 75.3
Montana 82.1 82.4 82 — — — —
Nebraska 83.9 85.1 84.5 83.2 83 84.6 84.5
Nevada 73.5 70.2 66.9 64.5 64.4 64.1 64.1
New
Hampshire — — — — — — —
New Jersey 88 86.7 85.2 84.6 85.2 — —
New Mexico 74.4 73 70.6 69 68.6 68.8 70
New York 81.6 — — — — — —
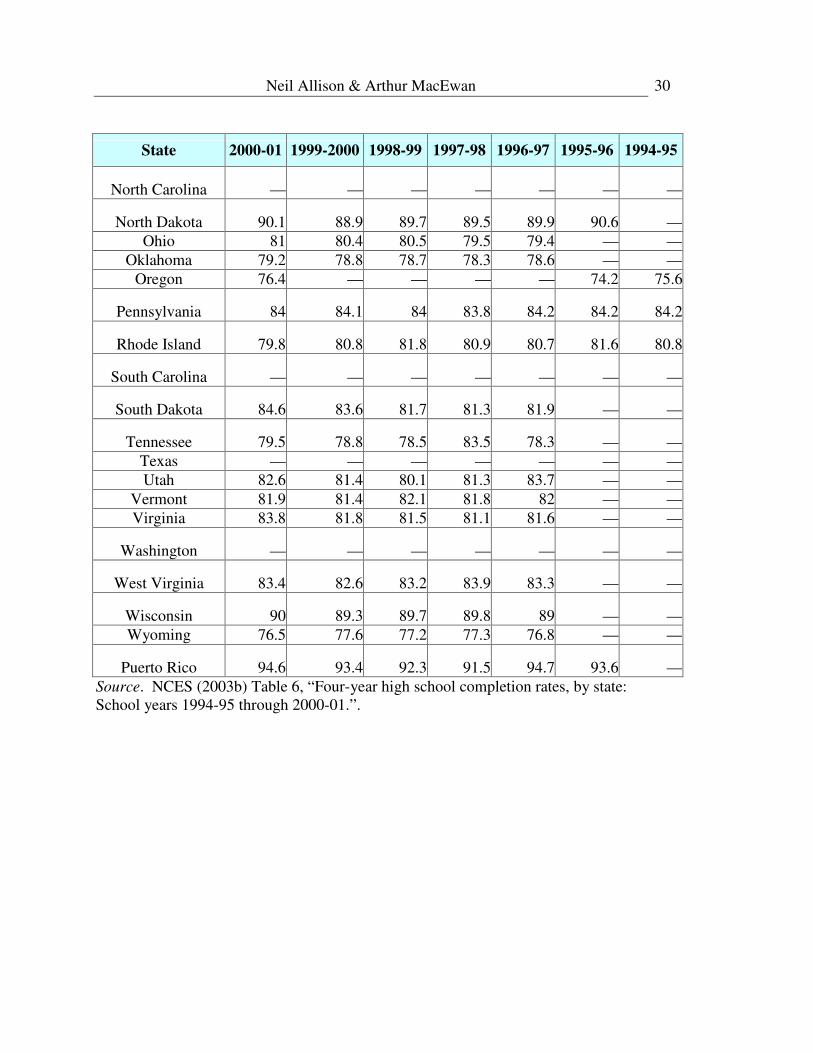
Neil Allison & Arthur MacEwan
30
State 2000-01 1999-2000 1998-99 1997-98 1996-97 1995-96 1994-95
North Carolina — — — — — — —
North Dakota 90.1 88.9 89.7 89.5 89.9 90.6 —
Ohio 81 80.4 80.5 79.5 79.4 — —
Oklahoma 79.2 78.8 78.7 78.3 78.6 — —
Oregon 76.4 — — — — 74.2 75.6
Pennsylvania 84 84.1 84 83.8 84.2 84.2 84.2
Rhode Island 79.8 80.8 81.8 80.9 80.7 81.6 80.8
South Carolina — — — — — — —
South Dakota 84.6 83.6 81.7 81.3 81.9 — —
Tennessee 79.5 78.8 78.5 83.5 78.3 — —
Texas — — — — — — —
Utah 82.6 81.4 80.1 81.3 83.7 — —
Vermont 81.9 81.4 82.1 81.8 82 — —
Virginia 83.8 81.8 81.5 81.1 81.6 — —
Washington — — — — — — —
West Virginia 83.4 82.6 83.2 83.9 83.3 — —
Wisconsin 90 89.3 89.7 89.8 89 — —
Wyoming 76.5 77.6 77.2 77.3 76.8 — —
Puerto Rico 94.6 93.4 92.3 91.5 94.7 93.6 —
Source. NCES (2003b) Table 6, “Four-year high school completion rates, by state:
School years 1994-95 through 2000-01.”.
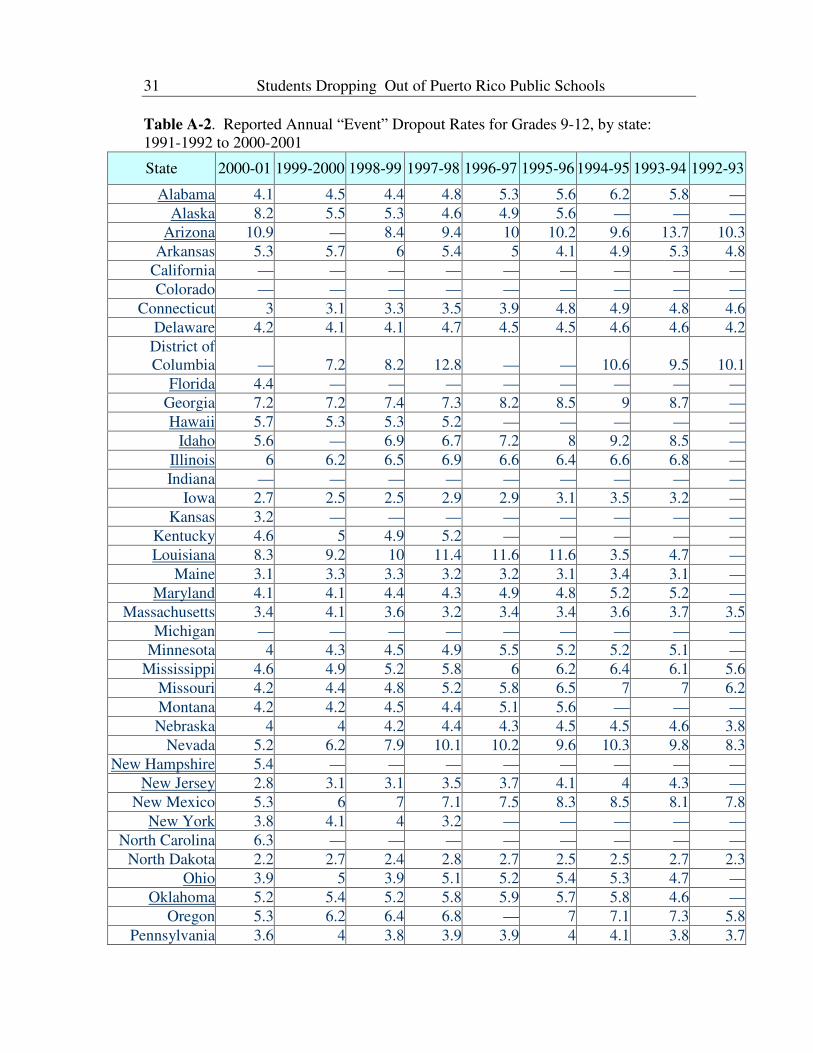
Students Dropping Out of Puerto Rico Public Schools
31
Table A-2. Reported Annual “Event” Dropout Rates for Grades 9-12, by state:
1991-1992 to 2000-2001
State 2000-01 1999-2000 1998-99 1997-98 1996-97 1995-96 1994-95 1993-94 1992-93
Alabama 4.1 4.5 4.4 4.8 5.3 5.6 6.2 5.8 —
Alaska 8.2 5.5 5.3 4.6 4.9 5.6 — — —
Arizona 10.9 — 8.4 9.4 10 10.2 9.6 13.7 10.3
Arkansas 5.3 5.7 6 5.4 5 4.1 4.9 5.3 4.8
California — — — — — — — — —
Colorado — — — — — — — — —
Connecticut 3 3.1 3.3 3.5 3.9 4.8 4.9 4.8 4.6
Delaware 4.2 4.1 4.1 4.7 4.5 4.5 4.6 4.6 4.2
District of
Columbia — 7.2 8.2 12.8 — — 10.6 9.5 10.1
Florida 4.4 — — — — — — — —
Georgia 7.2 7.2 7.4 7.3 8.2 8.5 9 8.7 —
Hawaii 5.7 5.3 5.3 5.2 — — — — —
Idaho 5.6 — 6.9 6.7 7.2 8 9.2 8.5 —
Illinois 6 6.2 6.5 6.9 6.6 6.4 6.6 6.8 —
Indiana — — — — — — — — —
Iowa 2.7 2.5 2.5 2.9 2.9 3.1 3.5 3.2 —
Kansas 3.2 — — — — — — — —
Kentucky 4.6 5 4.9 5.2 — — — — —
Louisiana 8.3 9.2 10 11.4 11.6 11.6 3.5 4.7 —
Maine 3.1 3.3 3.3 3.2 3.2 3.1 3.4 3.1 —
Maryland 4.1 4.1 4.4 4.3 4.9 4.8 5.2 5.2 —
Massachusetts 3.4 4.1 3.6 3.2 3.4 3.4 3.6 3.7 3.5
Michigan — — — — — — — — —
Minnesota 4 4.3 4.5 4.9 5.5 5.2 5.2 5.1 —
Mississippi 4.6 4.9 5.2 5.8 6 6.2 6.4 6.1 5.6
Missouri 4.2 4.4 4.8 5.2 5.8 6.5 7 7 6.2
Montana 4.2 4.2 4.5 4.4 5.1 5.6 — — —
Nebraska 4 4 4.2 4.4 4.3 4.5 4.5 4.6 3.8
Nevada 5.2 6.2 7.9 10.1 10.2 9.6 10.3 9.8 8.3
New Hampshire 5.4 — — — — — — — —
New Jersey 2.8 3.1 3.1 3.5 3.7 4.1 4 4.3 —
New Mexico 5.3 6 7 7.1 7.5 8.3 8.5 8.1 7.8
New York 3.8 4.1 4 3.2 — — — — —
North Carolina 6.3 — — — — — — — —
North Dakota 2.2 2.7 2.4 2.8 2.7 2.5 2.5 2.7 2.3
Ohio 3.9 5 3.9 5.1 5.2 5.4 5.3 4.7 —
Oklahoma 5.2 5.4 5.2 5.8 5.9 5.7 5.8 4.6 —
Oregon 5.3 6.2 6.4 6.8 — 7 7.1 7.3 5.8
Pennsylvania 3.6 4 3.8 3.9 3.9 4 4.1 3.8 3.7
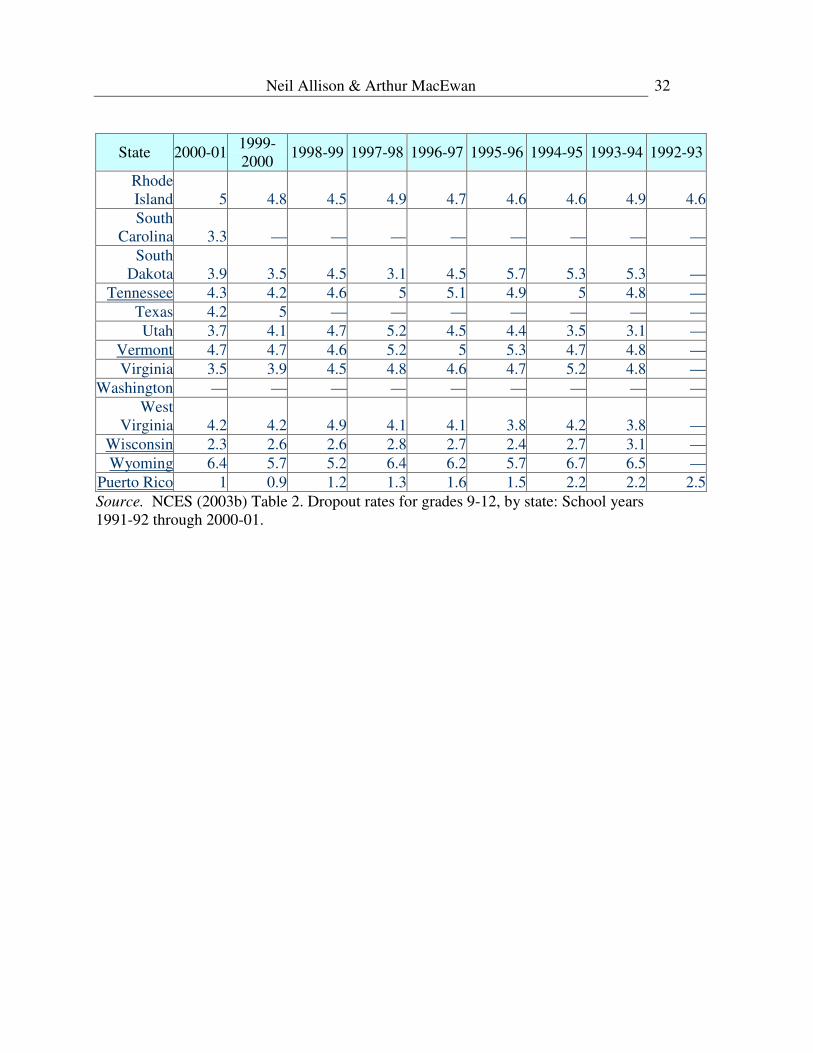
Neil Allison & Arthur MacEwan
32
State 2000-011999-
2000 1998-99 1997-98 1996-97 1995-96 1994-95 1993-94 1992-93
Rhode
Island 5 4.8 4.5 4.9 4.7 4.6 4.6 4.9 4.6
South
Carolina 3.3 — — — — — — — —
South
Dakota 3.9 3.5 4.5 3.1 4.5 5.7 5.3 5.3 —
Tennessee 4.3 4.2 4.6 5 5.1 4.9 5 4.8 —
Texas 4.2 5 — — — — — — —
Utah 3.7 4.1 4.7 5.2 4.5 4.4 3.5 3.1 —
Vermont 4.7 4.7 4.6 5.2 5 5.3 4.7 4.8 —
Virginia 3.5 3.9 4.5 4.8 4.6 4.7 5.2 4.8 —
Washington — — — — — — — — —
West
Virginia 4.2 4.2 4.9 4.1 4.1 3.8 4.2 3.8 —
Wisconsin 2.3 2.6 2.6 2.8 2.7 2.4 2.7 3.1 —
Wyoming 6.4 5.7 5.2 6.4 6.2 5.7 6.7 6.5 —
Puerto Rico 1 0.9 1.2 1.3 1.6 1.5 2.2 2.2 2.5
Source. NCES (2003b) Table 2. Dropout rates for grades 9-12, by state: School years
1991-92 through 2000-01.
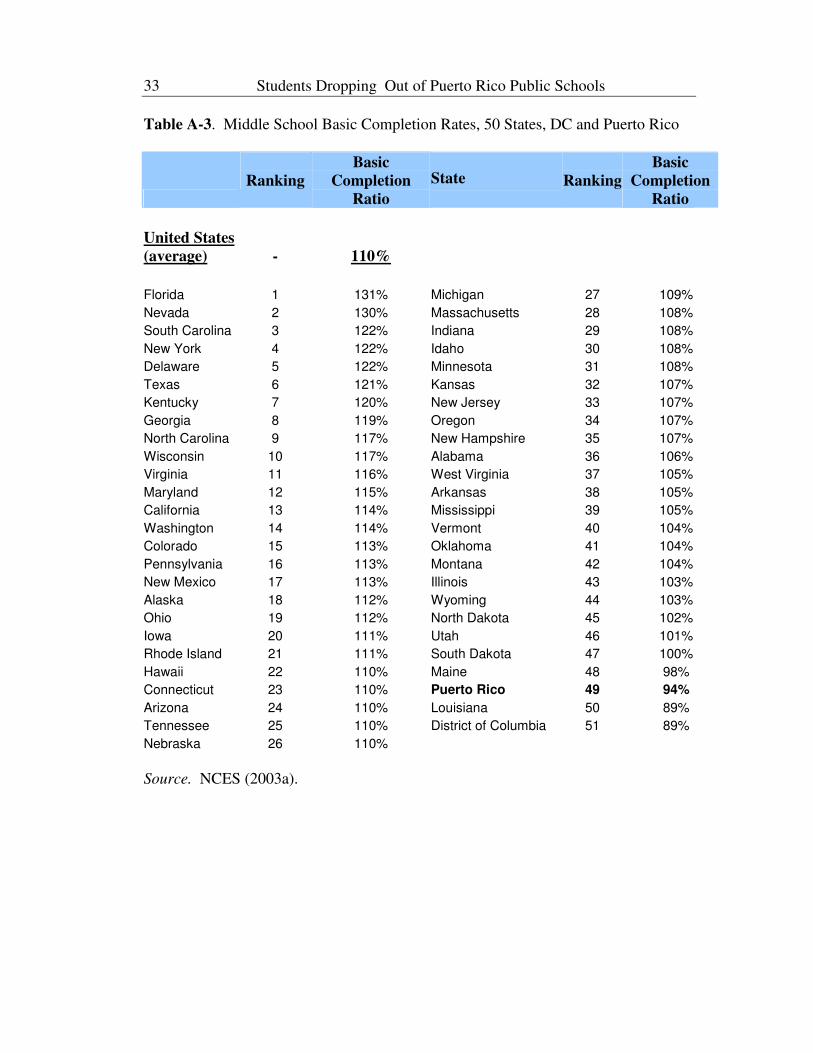
Students Dropping Out of Puerto Rico Public Schools
33
Table A-3. Middle School Basic Completion Rates, 50 States, DC and Puerto Rico
Ranking
Basic
Completion
Ratio
State
Ranking
Basic
Completion
Ratio
United States
(average) - 110%
Florida 1 131% Michigan 27 109%
Nevada 2 130% Massachusetts 28 108%
South Carolina 3 122% Indiana 29 108%
New York 4 122% Idaho 30 108%
Delaware 5 122% Minnesota 31 108%
Texas 6 121% Kansas 32 107%
Kentucky 7 120% New Jersey 33 107%
Georgia 8 119% Oregon 34 107%
North Carolina 9 117% New Hampshire 35 107%
Wisconsin 10 117% Alabama 36 106%
Virginia 11 116% West Virginia 37 105%
Maryland 12 115% Arkansas 38 105%
California 13 114% Mississippi 39 105%
Washington 14 114% Vermont 40 104%
Colorado 15 113% Oklahoma 41 104%
Pennsylvania 16 113% Montana 42 104%
New Mexico 17 113% Illinois 43 103%
Alaska 18 112% Wyoming 44 103%
Ohio 19 112% North Dakota 45 102%
Iowa 20 111% Utah 46 101%
Rhode Island 21 111% South Dakota 47 100%
Hawaii 22 110% Maine 48 98%
Connecticut 23 110% Puerto Rico 49 94%
Arizona 24 110% Louisiana 50 89%
Tennessee 25 110% District of Columbia 51 89%
Nebraska 26 110%
Source. NCES (2003a).
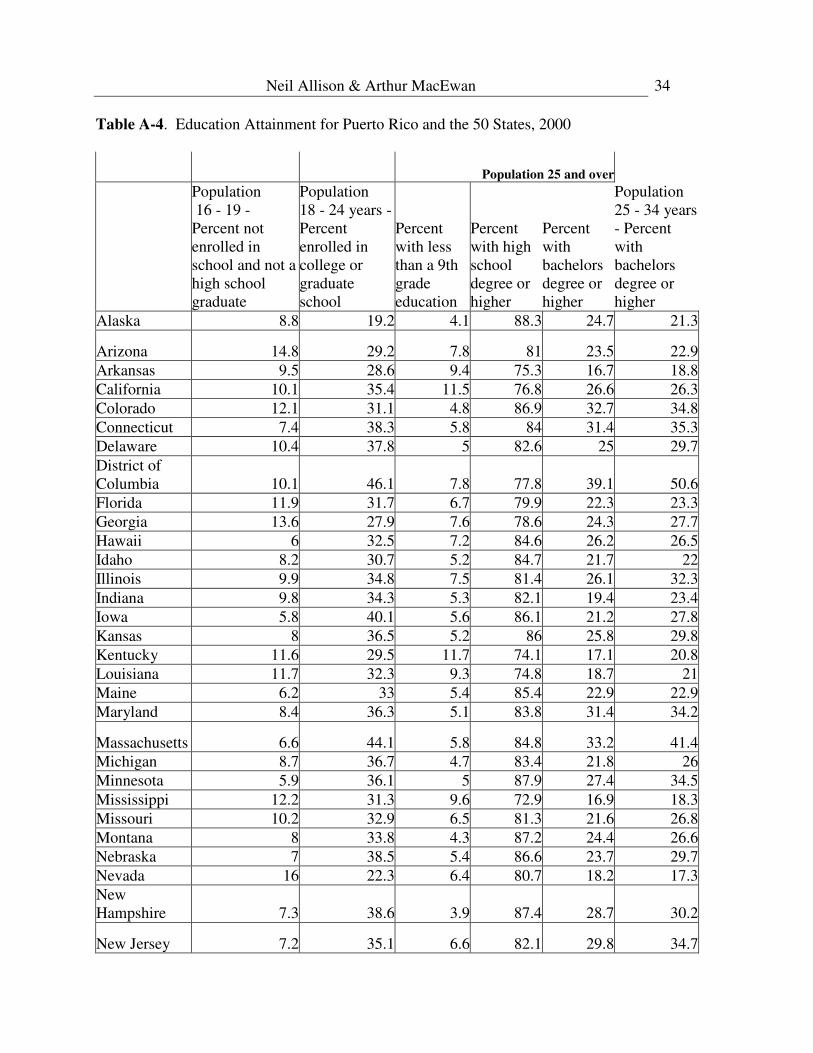
Neil Allison & Arthur MacEwan
34
Table A-4. Education Attainment for Puerto Rico and the 50 States, 2000
Population 25 and over
Population
16 - 19 -
Percent not
enrolled in
school and not a
high school
graduate
Population
18 - 24 years -
Percent
enrolled in
college or
graduate
school
Percent
with less
than a 9th
grade
education
Percent
with high
school
degree or
higher
Percent
with
bachelors
degree or
higher
Population
25 - 34 years
- Percent
with
bachelors
degree or
higher
Alaska 8.8 19.2 4.1 88.3 24.7 21.3
Arizona 14.8 29.2 7.8 81 23.5 22.9
Arkansas 9.5 28.6 9.4 75.3 16.7 18.8
California 10.1 35.4 11.5 76.8 26.6 26.3
Colorado 12.1 31.1 4.8 86.9 32.7 34.8
Connecticut 7.4 38.3 5.8 84 31.4 35.3
Delaware 10.4 37.8 5 82.6 25 29.7
District of
Columbia 10.1 46.1 7.8 77.8 39.1 50.6
Florida 11.9 31.7 6.7 79.9 22.3 23.3
Georgia 13.6 27.9 7.6 78.6 24.3 27.7
Hawaii 6 32.5 7.2 84.6 26.2 26.5
Idaho 8.2 30.7 5.2 84.7 21.7 22
Illinois 9.9 34.8 7.5 81.4 26.1 32.3
Indiana 9.8 34.3 5.3 82.1 19.4 23.4
Iowa 5.8 40.1 5.6 86.1 21.2 27.8
Kansas 8 36.5 5.2 86 25.8 29.8
Kentucky 11.6 29.5 11.7 74.1 17.1 20.8
Louisiana 11.7 32.3 9.3 74.8 18.7 21
Maine 6.2 33 5.4 85.4 22.9 22.9
Maryland 8.4 36.3 5.1 83.8 31.4 34.2
Massachusetts 6.6 44.1 5.8 84.8 33.2 41.4
Michigan 8.7 36.7 4.7 83.4 21.8 26
Minnesota 5.9 36.1 5 87.9 27.4 34.5
Mississippi 12.2 31.3 9.6 72.9 16.9 18.3
Missouri 10.2 32.9 6.5 81.3 21.6 26.8
Montana 8 33.8 4.3 87.2 24.4 26.6
Nebraska 7 38.5 5.4 86.6 23.7 29.7
Nevada 16 22.3 6.4 80.7 18.2 17.3
New
Hampshire 7.3 38.6 3.9 87.4 28.7 30.2
New Jersey 7.2 35.1 6.6 82.1 29.8 34.7
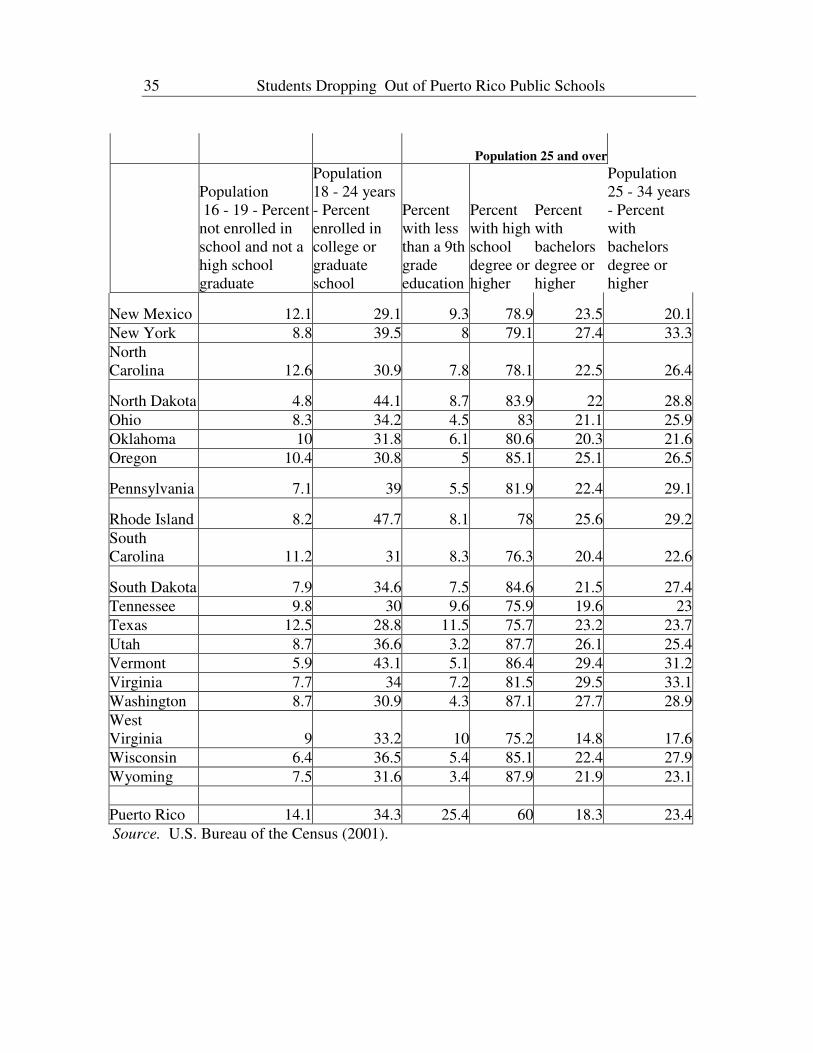
Students Dropping Out of Puerto Rico Public Schools
35
Population 25 and over
Population
16 - 19 - Percent
not enrolled in
school and not a
high school
graduate
Population
18 - 24 years
- Percent
enrolled in
college or
graduate
school
Percent
with less
than a 9th
grade
education
Percent
with high
school
degree or
higher
Percent
with
bachelors
degree or
higher
Population
25 - 34 years
- Percent
with
bachelors
degree or
higher
New Mexico 12.1 29.1 9.3 78.9 23.5 20.1
New York 8.8 39.5 8 79.1 27.4 33.3
North
Carolina 12.6 30.9 7.8 78.1 22.5 26.4
North Dakota 4.8 44.1 8.7 83.9 22 28.8
Ohio 8.3 34.2 4.5 83 21.1 25.9
Oklahoma 10 31.8 6.1 80.6 20.3 21.6
Oregon 10.4 30.8 5 85.1 25.1 26.5
Pennsylvania 7.1 39 5.5 81.9 22.4 29.1
Rhode Island 8.2 47.7 8.1 78 25.6 29.2
South
Carolina 11.2 31 8.3 76.3 20.4 22.6
South Dakota 7.9 34.6 7.5 84.6 21.5 27.4
Tennessee 9.8 30 9.6 75.9 19.6 23
Texas 12.5 28.8 11.5 75.7 23.2 23.7
Utah 8.7 36.6 3.2 87.7 26.1 25.4
Vermont 5.9 43.1 5.1 86.4 29.4 31.2
Virginia 7.7 34 7.2 81.5 29.5 33.1
Washington 8.7 30.9 4.3 87.1 27.7 28.9
West
Virginia 9 33.2 10 75.2 14.8 17.6
Wisconsin 6.4 36.5 5.4 85.1 22.4 27.9
Wyoming 7.5 31.6 3.4 87.9 21.9 23.1
Puerto Rico 14.1 34.3 25.4 60 18.3 23.4
Source. U.S. Bureau of the Census (2001).
Neil Allison & Arthur MacEwan
36
References
Audas, R., and Willms, J. D. (2001). Engagement and dropping out of school: A life-
course perspective (Working Paper W-01-1-10E). Hull, PQ: Human Resources
Development Canada. Retrieved July 27, 2004 from the World Wide Web
www11.sdc.gc.ca/en/cs/sp/arb/publications/research/2001-000175/page00.shtml.
Barrington, B.L. and Hendricks, B. (1989). Differentiating characteristics of high school
graduates, dropouts and nongraduates. Journal of Educational Research, 82, 309-
19.
Bickel, R. and Papagiannis, G. (1988). Post-high school prospects and district-level
dropout rates. Youth and Society, 20,123-147.
Christenson, M. (2001). Evaluating Components of International Migration: Migration
Between Puerto Rico and the United States, Population Division, U.S. Bureau of
the Census, Working Paper Series No. 64, Washington, DC. Retrieved October
15, 2004 from the World Wide Web
www.census.gov/population/www/documentation/twps0064.html.
Clark, R. L. (1992). Neighborhood effects on dropping out of school among teenage
boys. Discussion paper. Washington, D.C.: The Urban Institute.
Committee on Educational Excellence and Testing Equity CEETE. (2003).
Understanding Dropouts: Statistics, Strategies, and High-Stakes Testing,
Washington: National Academy Press.
Cotton, Kathleen. (1996). School Size, School Climate, and Student Performance,
School Improvement Research Series, Retrieved July 27, 2004 from the World
Wide Web http://www.nwrel.org/scpd/sirs/10/c020.html.
Day, Jennifer Cheeseman, and Newburger, Eric C. (2002). The Big Payoff: Educational
Attainment and Synthetic Estimates of Work-Life Earnings, U.S. Census Bureau,
Current Population Reports, July 2002. Retrieved October 15, 2004 from the
World Wide Web http://www.census.gov/prod/2002pubs/p23-210.pdf.
Fetler, M. (1989). School Dropout Rates, Academic Performance, Size, and Poverty:
Correlates of Educational Reform. Educational Evaluation and Policy Analysis
11/2 (Summer 1989): 109-116.
Garcia Blanco, Ana Maria and Colón Morera, José Javier (1993). A community-based
approach to educational reform in Puerto Rico. Colonial Dilemma: Critical
Perspectives on Contemporary Puerto Rico, edited by Edwin Melendez and
Edgardo Melendez, Boston: South End Press.
Students Dropping Out of Puerto Rico Public Schools
37
Gayler, K. et al. (2003). State High School Exit Exams: Put to the Test. Washington,
DC: Center for Education Policy. Retrieved October 15, 2004 from the World
Wide Web www.ctredpol.org/highschoolexit/1/exitexam4.htm.
Gleason, P. and Dynarski, M. (1998). “Do We Know Whom to Serve? Issues in Using
Risk Factors to Identify Dropouts,” Journal of Education for Students Placed at
Risk, 2002, Vol. 7, No. 1, Pages 25-41. Demonstration Assistance Program
Evaluation, Princeton, NJ: Mathematica. Retrieved July 27, 2004 from the World
Wide Web www.mathematica-mpr.com/publications/pdfs/dod-risk.pdf.
Greene, J. P. and Forster, G. (2003). Public High School Graduation and College
Readiness Rates in the United States. Education Working Paper 3. Washington,
D.C.: The Manhattan Institute. Retrieved July 27, 2004 from the World Wide
Web www.manhattan-institute.org/html/ewp_03.htm.
Gregory, T. (1992). Small Is Too Big: Achieving a Critical Anti-Mass in the High
School. Source Book on School and District Size, Cost, and Quality. Minneapolis,
MN: Minnesota University, Hubert H. Humphrey Institute of Public Affairs; Oak
Brook, IL: North Central Regional Educational Laboratory.
Henderson, A.T. and Marburger, C.L. (1990). A workbook on parent involvement for
district leaders. Columbia, MD: The National Committee for Citizens in
Education.
Jewell, R. S. (1989) School and School District Size Relationships: Costs, Results,
Minorities, and Private School Enrollments. Education and Urban Society. 21/2,
February: 140-153.
Mosteller, Frederick. (1995). The Tennessee Study of Class Size in the Early School
Grades. Critical Issues for Children and Youths, Vol. 5, No. 2, Summer/Fall 1995.
Retrieved October 15, 2004 from the World Wide Web
www.futureofchildren.org/usr_doc/vol5no2ART8.pdf.
National Center for Educational Statistics. (2001). Dropout Rates in the United States:
2000. P. Kaufman, M. N. Alt and C. D. Chapman. Washington, DC: U.S.
Department of Education. NCES 2002-114.
National Center for Education Statistics. (2002). Digest of Education Statistics 2001.
Washington, D.C.: U.S. Department of Education. Retrieved October 15, 2004
from the World Wide Web http://nces.ed.gov/programs/digest/d01/.
National Center for Education Statistics. (2003). Digest of Education Statistics 2002.
Washington, D.C.: U.S. Department of Education. Retrieved October 15, 2004
from the World Wide Web nces.ed.gov/programs/digest/d02/.
Neil Allison & Arthur MacEwan
38
National Center for Education Statistics. (2004). Public High School Dropouts and
Completers from the Common Core of Data School Year 2000-2001.
Washington, D.C.: U.S. Department of Education. Retrieved October 15, 2004
from the World Wide Web nces.ed.gov/pubs2004/dropout00-01/#3.
Offenberg, Robert M.. (2001). The Efficacy of Philadelphia's K-to-8 Schools Compared
to Middle Grades Schools. Middle School Journal, March 2001.
Pate-Bain, H., Fulton, B. D., and Boyd-Zaharias, J. (1999). Effects of class-size reduction
in the early grades (K-3) on high school performance: Preliminary results from
Project STAR, Tennessee's longitudinal class-size study. Summary presented at
STAR press conference, Washington, DC.
Peterson, D. (1989). Parent involvement in the educational process. Urbana, IL: ERIC
Clearinghouse on Educational Management.
Pittman, R. B., and Haughwout, P. (1987). Influence of High School Size on Dropout
Rate. Educational Evaluation and Policy Analysis, 9/4 (Winter 1987): 337-343.
Rogers, R. G. (1987). Is Bigger Better? Fact or Fad Concerning School District
Organization. ERS Spectrum, 5/4 (Fall 1987): 36-39.
Rossi, R.J. (1996). Evaluation of Projects Funded by the School Dropout Prevention
Program, American Institutes for Research, Palo Alto, CA.
Rumberger, R.W. (1983). Dropping out of high school: The influence of race, sex, and
family background. American Educational Research Journal, 20, 199-220.
Rumberger, R. W. (1995). Dropping out of middle school: A multilevel analysis of
students and schools. American Educational Research Journal, 32(3), 583-625.
Rumberger, R.W. (2001). Why Students Drop Out of School and What Can be Done.
Paper prepared for “Dropouts in America: How Severe is the Problem? What Do
We Know about Intervention and Prevention?” Harvard University, January 13,
2001.
Rumberger, R.W. and Larson, K.A. (1998). Student mobility and the increased risk of
high school drop out. American Journal of Education, 107, 1-35.
Sewell, C. (1982). The impact of pupil mobility on assessment of achievement and its
implications for program planning. Brooklyn, NY: Community School District 17.
(ED 228 322).
Smith, D. T., and DeYoung, A. J. (1988). Big School vs. Small School: Conceptual,
Empirical, and Political Perspectives on the Re-emerging Debate. Journal of Rural
and Small Schools (Winter 1988): 2-11.
Students Dropping Out of Puerto Rico Public Schools
39
Stockard, J., and Mayberry, M. (1992). Resources and School and Classroom Size.
Effective Educational Environments. Newbury Park, CA: Corwin Press, Inc.,
1992, 40-58.
Swanson, C.B. (2003a). Keeping Count and Losing Count: Calculating Graduation Rates
for All Students under NCLB Accountability. Washington, D.C.: The Urban
Institute.
Swanson, C.B. (2003b). NCLB Implementation Report: State Approaches for
Calculating High School Graduation Rates. Washington, D.C.: The Urban
Institute.
Swanson, C.B. (2004). Who Graduates? Who Doesn’t? A Statistical Portrait of Public
High School Graduation, Class of 2001. Washington, D.C.: The Urban Institute.
Retrieved October 15, 2004 from the World Wide Web
www.urban.org/UploadedPDF/410934_WhoGraduates.pdf
Toenjes, L. A. (1989). Dropout Rates in Texas School Districts: Influences of School
Size and Ethnic Group. Austin, TX: Texas Center for Educational Research,
August 1989.
United States Bureau of the Census. (2001). Census 2000 Summary File 3 (SF 3) -
Sample Data, Washington, DC: Census Department, Retrieved October 15, 2004
from the World Wide Web
http://factfinder.census.gov/servlet/DatasetMainPageServlet?_lang=en.
Walberg, H. J. (1992). On Local Control: Is Bigger Better? Source Book on School and
District Size, Cost, and Quality. Minneapolis, MN: Minnesota University, Hubert
H. Humphrey Institute of Public Affairs; Oak Brook, IL: North Central Regional
Educational Laboratory, 118-134.