students graduation academically prepared confident to...
TRANSCRIPT

ENDS 2: Academics and Foundations Page 1
ENDS 2: Academics and Foundations PART 1 (December 13, 2017)
November 9, 2016
Upon graduation, students will be academically prepared and confident to pursue higher education or specialized career training. Interpretation • We interpret students to mean each student in the previous graduating class. • We interpret graduation to mean meeting the District’s established graduation
requirements and earning a diploma. • We interpret academically prepared to mean meeting the state’s high school proficiency
exams and meeting Washington state public universities’ or community/technical colleges’ minimum entrance requirements.
• We interpret confident to mean a feeling of self-assurance about one’s ability to accomplish his/her personal plan for post-secondary pursuits.
• We interpret to pursue higher education to mean post-secondary education institutions including two- and four-year colleges and universities.
• We interpret specialized career training to mean programs that prepare students for a particular career, including apprenticeships, technical schools, military service, and specialized training programs.
Reasonable progress We have confidence that students are meeting the targets of E-2 when they navigate our educational system and earn a diploma and affirm their high school experiences have prepared them for a wide range of post-graduate opportunities of their choosing. For graduation, the Issaquah School District requires that a student pass the state’s proficiency exams, earn credits in courses that satisfy community/technical college entrance, and establish and implement a post-graduation plan of action. Additionally, students have the opportunity to earn credits in courses that meet four year college and university entrance requirements. Under this definition, monitoring will focus on three major areas: (1) ensuring the graduation requirements meet the requirements of E-2, (2) ensuring students have ample opportunities to take classes that help better prepare them for post-secondary education, and/or specialized career training (3) tracking our students’ enrollment and need for remediation in post-secondary education and other programs that prepare our students for a career. Overall Evidence As students navigate the ISD K-12 system they are exposed to rigorous content and learning opportunities. Our graduation requirements mandate that students take a broad range of core academic and elective courses and pass all state required examinations. Therefore, graduating from the ISD is evidence that students have met the standards and requirements of E-2 Academics and Foundations. District K-12 curriculum aligns with state standards. ISD selects curriculum that requires the same or higher level of cognitive demand (critical thinking) as is defined in the State standards.

ENDS 2: Academics and Foundations Page 2
Graduation Rate Source: OSPI Report Card
Graduation Rate by School Source: OSPI Report Card
2016 Non-Grad Report Source: Skyward The Non-graduated Report is unduplicated count of students for the Grad Year of 2016
School Down Credits Testing Non-Grads-unspecified
Total
Issaquah High
4 15 19 *Class of 2016 N=512; 3.7% non-grads
Liberty High 1 6 6
*Class of 2016 N=291; 2.1% non-grads
Skyline High 2 2
*Class of 2016 N=481; 0.4% non-grads
Tiger Mountain 1 1
*Class of 2016 N=7; 14.3% non-grads *N is the total of Grads and Non Grads for the Class of 2016 (Base Grad Year)
Count of Students Enrolled in College the Fall Immediately After High School Source: Education Research and Data Center 2014 P-20 Reports Comparing Districts (Cohort) Graduating
Class of 2014
Washington Out of State Total
Public Private Public Private Public Private Public Private HS Grads
% Going to College
Total 4yr 4yr 2yr 2yr Total 4yr 4yr 2yr 2yr Issaquah 72% 40% 6% 25% 0-1% 28% 15% 12% 0-1% 0-1% 1206 84%
Statewide 82% 31% 5% 45% 0-1% 18% 8% 8% 2% 0-1% 65881 61%
% On-time Adjusted 4 year
cohort
% Extended Adjusted 5 year
cohort Class of 2012 91.8 94.7 Class of 2013 92.9 94.3 Class of 2014 92 93.4 Class of 2015 92
Class of 2015/Baseline % On-time
Adjusted 4 year cohort
% Extended Adjusted 5 year
cohort IHS 92.8 93.9 LHS 89.8 92.9 SHS 96.1 97.1

ENDS 2: Academics and Foundations Page 3
Students will: 2.1 2.1 think and solve problems using both creative and critical thinking skills; We interpret 2.1 to mean students will have the ability to synthesize, analyze and evaluate information, in order to draw conclusions and/or solve real life problems. Evidence • Senior Exit Survey • Grads Immediately After Graduation (Decision Research and ERDC) • Post-secondary Participation Characteristics (ERDC) • Confidence measure: Question 20 of Decision Research Survey 3- Numerical problems and finances 5- Using research and study methods 10- Informed consumerism
• Smarter Balanced Assessments meeting standard in, English Language Arts (ELA), math, and science
• Middle School Common Reading Assessment (MSCRA) Grade 8 Confidence/Preparedness to Pursue Question 11 Source: Senior Exit Survey
Grads immediately after graduation of the students who took the survey Source: Decision Research Survey (administered bi-annually)
* Of the students who responded to the 2011 survey, 81% reported they are in school full or part time. ** Of the students who responded to the 2013 survey, 82% reported they are in school full or part time. ***Of the students who responded to the 2015 survey, 83% reported they are in school full or part time.
I feel prepared for and am hopeful and optimistic about my future (Senior Exit Survey) Strongly
Agree/Agree Issaquah High Liberty Skyline Tiger Mountain
2012 Baseline 94% 89% 95% 80% 2013 96% 97% 96% 100% of 11 2014 95% 93% 95% No data 2015 90% 91% 94% 93% of 14 2016 90.3% 89.4% 93.1% N/A
Graduation Year
% School Full Time
% Schoo
l FT
Work FT
% Schoo
l FT Work
PT
% Schoo
l PT Only
% Schoo
l PT Work
PT
% Work FT Only
% Work PT Only
% Militar
y
% Unem-ploye
d
% Othe
r
2007 N=324
58 4 19 1 3 8 2 1 2
2009 N=332
63 1 18 1 4 4 2 1 2 4
2011* N=333
59 1 13 3 5 4 4 2 4 5
2013** N=343
59 1 15 1 6 7 2 1 1 5
2015*** N=332
54 1 22 1 5 4 2 2 2 8

ENDS 2: Academics and Foundations Page 4
This chart applies to 2.1, 2.2, 2.3, 2.4, 2.5, 2.9 Postsecondary Participation Characteristics for Students Enrolled in Washington Public Institutions Source: Education Research and Data Center
Post secondary enrollment of the students who took the survey Source: Decision Research Survey
*Of the 81% of the students who reported being in school full or part time, this chart represents a percentage of the type of school attended. ** Of the 82% of the students who reported being in school full or part time, this chart represents a percentage of the type of school attended. ***Of the 83% of the students who reported being in school full or part time, this chart represents a percentage of the type of school attended.
Graduating Class of 2013 2 year enrolled
2 year enrolled
4 year enrolled
4 year enrolled
Issaquah State Issaquah State % enrolled % enrolled % enrolled % enrolled
Enrollment in Pre-College Course Work in English
10% 24% 0-1% 3%
Enrollment in Pre-College Course Work in English and Math
8% 17% 0-1% 0-1%
Enrollment in any Pre-College Course Work
31% 54% 3% 7%
Graduating Class of 2014 2 year enrolled
2 year enrolled
4 year enrolled
4 year enrolled
Issaquah State Issaquah State % enrolled % enrolled % enrolled % enrolled
Enrollment in Pre-College Course Work in English
12 23 0-1 2
Enrollment in Pre-College Course Work in English and Math
9 16 0-1 0-1
Enrollment in any Pre-College Course Work
29 42 3 9
Graduation Year % 4-Yr College/Univ.
% Community College
% Trade/Tech School
% Other/ Don’t Know
2007 N=324
69 27 3 1
2009 N=332
68 27 4 1
2011* N=333
68 28 3 1
2013** N=343
69 27 2 2
2015 N=332***
71 23 3 3

ENDS 2: Academics and Foundations Page 5
Confidence measure: Question 20 Source: Decision Research Survey of the students who took the survey (in 2015 N = 332)
Smarter Balanced ELA for High School grade 11 percent meeting standard which includes previously passed Source: OSPI Report Card
**2015-16 Students who previously passed the test in 2014-15 and that number is added to the 2015-16 numbers.
Upon graduation, how prepared did you feel in each of the following areas, regardless of where you acquired the knowledge and skills?
% Prepared % Not Sure % Not Prepared Graduation Year 2009 2011 2013 2015 2009 2011 2013 2015 2009 2011 2013 2015
Numerical Problems and Finances
72 68 67 67 10 14 19 15 16 17 14 19
Using Research and Study Methods
82 86 80 78 7 8 11 11 10 7 9 10
Informed Consumerism 77 72 69 64 12 16 21 22 10 12 9 15
School Year Number of Students who Met Standard
ELA % Meeting Standard
Math Science
2015-2016** 1270 93.7 See EOC Results See EOC Results

ENDS 2: Academics and Foundations Page 6
Smarter Balanced ELA Claim Data Source: OSPI EDS Score File All High School Students who took the Smarter Balanced ELA and generated a score. (This number does not include NNEP (new non-English proficient), No Booklet, Absent Excused and Unexcused, etc.)
School Year 2015-16 Reading %
Listening and
Speaking % Writing % Research
Inquiry %
Standard Number of Students Number of
Students Number of
Students
Number of
Students
Above Standard
1005 67 569 38 1069 72 1005 67
At/Near Standard
411 28 865 58 363 24 428 29
Below Standard
74 5 56 4 58 4 57 4
Total Students
1490 1490 1490 1490
Smarter Balanced Math Grade 11 – percent meeting standard Source: OSPI
2015-2016 EOC Algebra Chart 2015-2016 EOC Geometry Chart End of Course Exams – percent meeting standard Source: OSPI Report Card
These percentages represent all ISD students in all grades who took the test as reported in the year indicated. *In the 2013-14 school year students were no longer required to pass two Math EOC exams, therefore those who passed an EOC 1 did not take the EOC 2. 2015-16 Middle School Common Reading Assessments, 8th Grade
School Year Number of Students
Math
2014-15 Suppressed Suppressed 2015-16 Suppressed Suppressed
School Year Math EOC 1 Math EOC 2 Biology 2012-2013 78.3 93.7 90.2 2013-2014 83.9 *60 91.1 2014-2015 See above See above 94.6 2015-2016 See above See above 90.8

ENDS 2: Academics and Foundations Page 7
2.2 2.2 read, write and speak the English language effectively for a wide range of purposes, including the interpretation and analysis of both literary and informational texts; We interpret 2.2 to mean each student will be able to read closely and analytically to comprehend, and respond to, both verbally and in written form, a wide range of increasingly complex literary and informational texts for multiple purposes such as investigating topics, integrating, presenting information and reading for pleasure. Evidence • MSP/SBA District Comparisons • Graduation requirements: Students are required to take 4 credits of English to graduate. • SB ELA, Critical Reading and Writing PSAT, English ACT, Critical Reading and Writing
SAT, enrollment AP/IB English and numbers enrolled/taking test/number passing exam, enrollment in Honors courses.
• SAT/ACT Ethnicity/Race Charts • AP Gender Charts • Smarter Balanced ELA Chart • Confidence measure: Question 20 of Decision Research Survey 1- Reading for information and pleasure 2- Writing reports, letters, and notes 4- Speaking proper English
• Elementary Common Reading Assessments, 3rd Grade • Middle School Common Reading Assessments, 8th Grade • High School Common Language Arts Assessments, 11th Grade • Balanced Literacy and Readers Workshop Source: OSPI Report Card 2015-2016 SB/MSP District Comparison Chart Smarter Balanced ELA for High School Grade 11 Percent Meeting Standard (includes previously passed) Source: OSPI Report Card
School Year Number of Students
ELA
2015-2016 1270 93.7

ENDS 2: Academics and Foundations Page 8
SAT Reading and Writing Mean Scores Source: College Board/Skyward
*Total of Graduate and Non-Graduates for the Class of 2016 (Base Grad Year) = 1291 SAT College Bound Seniors – Reading and Writing Breakdown by Race/Ethnicity Source: College Board/Skyward College-Bound Seniors represents data on high school graduates in the year 2016 who participated in the SAT Program. Students are counted only once and only their latest scores.
*Suppressed **Total of Graduate and Non-Graduates for the Class of 2016 (Base Grad Year) ***Self-reported by test takers
Number of Students Taking the Test
% of Class*
Critical Reading Writing
Graduation Year
Nat’l State ISD Nat’l State ISD Nat’l State ISD
Class of 2014 1,672,395 41,277 940 497 510 573 487 491 560 Class of 2015 1,698,521 44,423 913 77.2% 495 502 578 484 484 563 Class of 2016 1,637,589 43,783 890 68.9%* 494 501 582 482 481 568
Race/Ethnicity Number of Students
Taking the Test
Critical Reading
Mean Score
Writing
Mean Score
Class of 2016 Nat'l State ISD***
Number in
Class** % of Class Nat'l State ISD Nat'l State ISD
American Indian or Alaska Native 7,778 545 4 4 100% 468 470 * 447 442 *
Asian 196,735 5,656 249 290 85.9% 529 503 594 534 495 597
Black or African American 199,306 2,277 10 16 62.5% 430 426 514 415 413 515
Native Hawaiian or Pacific Islander 2,371 168 1 2 50% 432 419 * 423 409 *
Hispanic or Latino 355,829 5,837 41 91 45.1% 448 441 529 436 425 511
White 742 23,964 520 832 62.5% 528 533 583 511 507 562
Two or More Races, Non-Hispanic 28,460 1,235 20 56 35.7% 511 517 577 488 487 554
Other 20,604 832 16 N/A 496 484 589 491 466 537
No Response 840,070 3,269 29
N/A 451 436 577 452 419 546
Total 1291

ENDS 2: Academics and Foundations Page 9
ACT English Mean Scores Source: College Readiness/Skyward
*Total of Graduate and Non-Graduates for the Class of 2016 (Base Grad Year) = 1291 ACT English Mean Scores – Breakdown by Race/Ethnicity Source: College Readiness
Race/Ethnicity Number of Students
Taking the Test
English
Class of 2016
State N
% of total # of WA
students who
tested ISD N
% of total # of ISD
students who
tested State ISD
Black/African American 583 4 7 1 16.6 20.1
American Indian/Alaskan Native 120 1 1 0 16.4 *
White 9,060 54 384 64 23.9 25.9
Hispanic/Latino 2,325 14 26 4 17.1 24.7
Asian 2,053 12 101 17 22.8 27.5
Native Hawaiian/Other Pac. Isl. 147 1 1 0 16.3 *
Two or More Races 1,154 7 36 6 22.6 26.5
Prefer not/No Response 1,210 7 42 7 23.4 27.5
Total All Students 16,652 100 598 100 22.3 26.2 *Suppressed
Count % of Class English Graduation Year Nat’l State ISD Nat’l State ISD
Class of 2013 1,799,243 14,316 467 20.2 22.1 25.3 Class of 2014 1,845,787 14,667 476 20.3 22.3 26.3 Class of 2015 1,924,436 16,944 508 42.9% 20.4 21.5 26.2 Class of 2016 2,090,342 16,652 598 46.3%* 20.1 22.3 26.2

ENDS 2: Academics and Foundations Page 10
PSAT Chart: Source: College Board
ISD - 10th Grade 2014-2015
IHS -10 LHS -10 SHS -10 ISD Avg State Nat'l 2013-2014 ISD Avg
Critical Reading
49.3 47.3 49.7 49.1 43.4 41.6 49
Math 51.6 49.1 53.2 51.7 45.1 42.8 50
Writing 46.8 44.1 47.2 46.4 40.4 39.5 47.1
Total Test Takers
456 261 516
ISD - 11th Grade 2014-2015
IHS-11 LHS- 11 SHS -11 ISD Avg State Nat'l 2013-2014 ISD Avg
Critical Reading
53.1 51.7 54.3 53.1 46.8 46.2 52.9
Math 55.5 53.3 57.4 55.6 48.7 47.9 54.8
Writing 50.8 50.3 53.2 51.5 44 44.7 50.8
Total Test Takers
458 256 423
PSAT 10th Grade: Source: College Board
** No data for 2013-2014 ***Beginning in 2015-2016, the redesigned PSAT is scored on a scale between 320 and 1520. Scores range from 160 to 760 for math and 160 to 760 for reading and writing.
Test Issaquah 10th
Liberty 10th
Skyline 10th
District Mean Score
State Mean National Mean
2014 2015
2015 2016
2014 2015
2015 2016
2014 2015
2015 2016
2014 2015
2015 2016
2014 2015
2015 2016
2014 2015
2015 2016
Total Test Takers
456 510 261 293 516 536
Critical Reading
49.3 N/A 47.3 N/A 49.7
N/A 49.1 N/A 43.4 41.6
Math 51.6 536 49.1 524 53.2 561 51.7 543 45.1 470 42.8 462
Writing
46.8 N/A 44.1 N/A 47.2 N/A 46.4 N/A 40.4 39.5
Evidence Based Reading and Writing
530 - 523 -
547 - 535 470 459

ENDS 2: Academics and Foundations Page 11
PSAT 11th Grade:
Source: College Board **No data for 2013-2014 ***Beginning in 2015-2016, the redesigned PSAT is scored on a scale between 320 and 1520. Scores range from 160 to 760 for math and 160 to 760 for reading and writing.
Sources: Districtwide student demographic data - 2015-2016 OSPI Wa State Report Card
Test Issaquah 11th
Liberty 11th
Skyline 11th
District Mean Score
State Mean National Mean
2014 2015
2015 2016
2014 2015
2015 2016
2014 2015
2015 2016
2014 2015
2015 2016
2014 2015
2015 2016
2014 2015
2015 2016
Total Test Takers
458 394 256 206 423 413
Critical Reading
53.1 N/A 51.7 N/A
54.3
N/A 53.1 N/A 46.8 46.2
Math 55.5 582 53.3 547 57.4 584 55.6 575 48.7 449 47.9 500
Writing
50.8 N/A 50.3 M/A 53.2 N/A 51.5 N/A 44 44.7
Evidence Based Reading and Writing
569 542 577 567 497 496
AP Test Passing Rates by Ethnicity, Gender and Fee Reduction - 2016
Percent of students in ISD
Number of Students taking test
Percent of Students taking the test
Number of tests taken
% of Total tests taken
Mean Score District Mean = 3.69 *
% Passing test
District- wide Pass rate
American Indian 0.20% 0 0.00% 0 N/A N/A N/A 84% Asian 25.90% 292 26.64% 543 29.60% 3.79 84.50% 84% African American 1.70% 14 1.28% 23 1.25% 3.17 74% 84% Hispanic 7.80% 56 5.11% 80 4.36% 3.44 74% 84% Native Hawaiian 0.30% 1 0.09% 1 0.05% ** 100% 84% White 57.30% 631 57.57% 1036 56.43% 3.68 85.30% 84% 2 or more (non Hisp) 6.80% 85 7.75% 133 7.20% 3.72 85.70% 84% No response N/A 17 1.55% 20 1.11% 2.95 65% 84% Male 51% 512 47% 890 48.50% 3.74 84.40% 84% Female 49% 584 53% 946 51.50% 3.64 84% 84% Fee Reduction 7.90% 25 2.30% 45 2.40% 3.4 82% 84% Percentages of students taking/passing tests - 2015-2016 College Board Score Report NOTE: 1096 students took the test. A total of 1836 tests were taken. A score of 3 on an AP exam is passing.
* State Mean = 2.92 **Suppressed

ENDS 2: Academics and Foundations Page 12
* Source - 2015-2016 College Bd AP Report
AP Tests taken by Gender - 2016 Name of Exam Male % Male Female % Female
Studio Art 2D 0 0% 5 100% Studio Art Drawing 0 0% 6 100% Eng Lang and Comp 11 62 33% 127 67% Eng Lit and Comp 12 41 33.30% 82 66.60% Comparative Govt and Politics 1 100% 0 0% European History 35 41% 51 59% Human Geography 101 53% 89 47% Psychology 42 38% 68 62% US Govt and Politics 60 58% 43 42% US History 57 56% 44 44% World History 33 38% 53 62% Calc AB 133 56% 104 44% Calc BC 44 58% 32 42% Comp Science A 69 73% 26 27% Statistics 58 52% 53 48% Biology 30 35% 56 65% Chemistry 35 55% 29 45% Environmental Science 19 38% 31 62% Physics 1 6 86% 1 14% Physics C: Electricity 1 100% 0 0% Physics C: Mechanics 36 80% 9 20% Chinese Language 8 47% 9 53% French Language 7 35% 13 65% German Language 2 100% 0 0% Japanese Language 0 0% 1 100% Spanish Language 10 42% 14 58%
Total 890 946

ENDS 2: Academics and Foundations Page 13
AP/IB English Course Enrollment and Exams Source: College Board and International Baccalaureate Organization
* % overall of enrollment by grade level A 3 on an AP exam is considered passing and may give the student college credit OR advanced placement at a higher education institution. A 3 on an IB exam is considered passing for purposes of an IB Diploma. A score of 4 is the lowest level accepted by higher education institutions (WSU accepts 4’s, UW, Eastern and Western require 5 and above).
Course Enrollment
# of Tests Taken # who passed AP 3+ /IB 4+
Pass Rate
20132014
20142015
20152016
20132014
20142015
2015 2016
20132014
20142015
20152016
20132014
2014 2015
2015 2016
AP Lang. and Comp (11th Grade)
293 37.5*
314 200 279 303 189 (2 SHS) (1TMHS)
222 261 168 (2 SHS)
79.6% 86.1% 89%
IHS 172
196 120 162 186 114 136 168 105 83.9% 90.3% 92%
LHS 121
118 80 117 117 72 86 93 61 73.5% 79.5% 85%
AP Lit. and Comp. (12th grade)
188 27.0*
176 157 152 (2 SHS)
129 (3 SHS) (1 TM)
123 133 116 112 87.5% 89.9% 91%
IHS 139
132 121 103 84 93 91 76 83 88.3% 90.5% 89%
LHS 49
44 36 47 41 30 40 37 29 85.1% 90.2% 97%
SHS IB Eng. 12
138 31*
113 131 118 102 122 118 102 122 100% 100% 100%
ENDS 2: Academics and Foundations Page 14
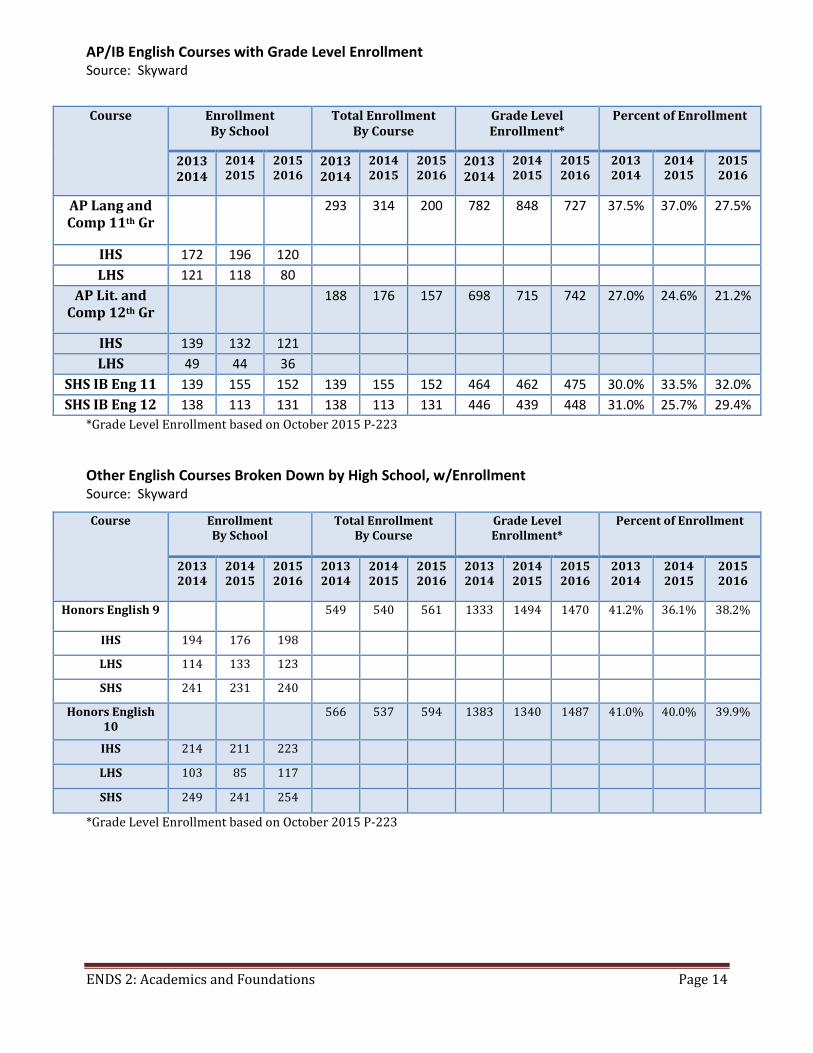
AP/IB English Courses with Grade Level Enrollment Source: Skyward
*Grade Level Enrollment based on October 2015 P-223
Other English Courses Broken Down by High School, w/Enrollment Source: Skyward
*Grade Level Enrollment based on October 2015 P-223
Course Enrollment By School
Total Enrollment By Course
Grade Level Enrollment*
Percent of Enrollment
2013 2014
2014 2015
2015 2016
2013 2014
2014 2015
2015 2016
2013 2014
2014 2015
2015 2016
2013 2014
2014 2015
2015 2016
AP Lang and Comp 11th Gr
293 314 200 782 848 727 37.5% 37.0% 27.5%
IHS 172 196 120 LHS 121 118 80
AP Lit. and Comp 12th Gr
188 176 157 698 715 742 27.0% 24.6% 21.2%
IHS 139 132 121 LHS 49 44 36
SHS IB Eng 11 139 155 152 139 155 152 464 462 475 30.0% 33.5% 32.0% SHS IB Eng 12 138 113 131 138 113 131 446 439 448 31.0% 25.7% 29.4%
Course Enrollment By School
Total Enrollment By Course
Grade Level Enrollment*
Percent of Enrollment
2013 2014
2014 2015
2015 2016
2013 2014
2014 2015
2015 2016
2013 2014
2014 2015
2015 2016
2013 2014
2014 2015
2015 2016
Honors English 9 549 540 561 1333 1494 1470 41.2% 36.1% 38.2%
IHS 194 176 198
LHS 114 133 123
SHS 241 231 240
Honors English 10
566 537 594 1383 1340 1487 41.0% 40.0% 39.9%
IHS 214 211 223
LHS 103 85 117
SHS 249 241 254
ENDS 2: Academics and Foundations Page 15
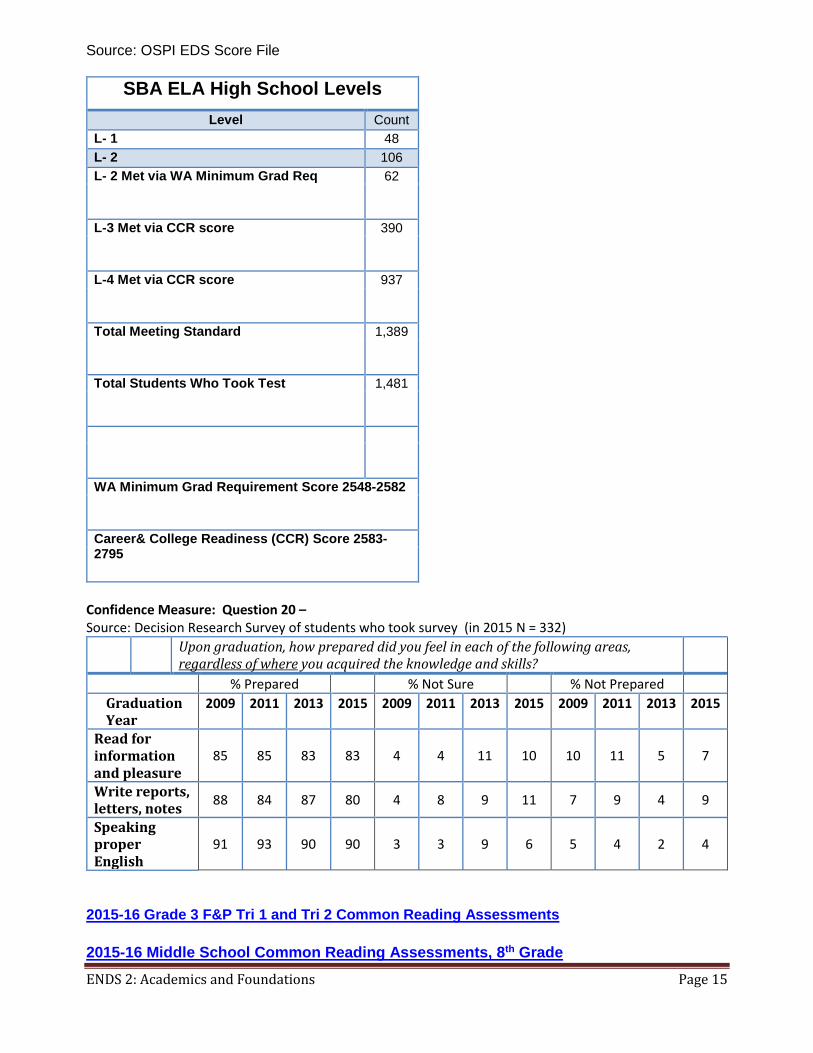
Source: OSPI EDS Score File
SBA ELA High School Levels Level Count
L- 1 48 L- 2 106 L- 2 Met via WA Minimum Grad Req 62
L-3 Met via CCR score 390
L-4 Met via CCR score 937
Total Meeting Standard 1,389
Total Students Who Took Test 1,481
WA Minimum Grad Requirement Score 2548-2582
Career& College Readiness (CCR) Score 2583-2795
Confidence Measure: Question 20 – Source: Decision Research Survey of students who took survey (in 2015 N = 332)
2015-16 Grade 3 F&P Tri 1 and Tri 2 Common Reading Assessments 2015-16 Middle School Common Reading Assessments, 8th Grade
Upon graduation, how prepared did you feel in each of the following areas, regardless of where you acquired the knowledge and skills?
% Prepared % Not Sure % Not Prepared Graduation Year
2009 2011 2013 2015 2009 2011 2013 2015 2009 2011 2013 2015
Read for information and pleasure
85 85 83 83 4 4 11 10 10 11 5 7
Write reports, letters, notes 88 84 87 80 4 8 9 11 7 9 4 9
Speaking proper English
91 93 90 90 3 3 9 6 5 4 2 4

ENDS 2: Academics and Foundations Page 16
2015-16 High School Common Language Arts Assessments, 11th Grade
Balanced Literacy Reader’s Workshop grades 3-8
WAS 2.5 CHANGED TO 2.6 POST 10-11-17 BOARD MEETING 2.3 2.6 understand geography, natural resources, and their shaping effect on government, economics and social patterns; We interpret 2.3 to mean each student will understand the five themes of geography (location, place, human environmental interactions, movement, and regions) and their impact on systems, cycles, relationships, and interdependence. Evidence • Proficiency: Graduation rate, enrollment in AP/IB Social Studies and numbers passing
AP/IB exams. • Social Studies District Common Assessment, Grade 6 • Social Studies Year at a Glance, Grade 6 Social Studies Curriculum on ISD Webpage
AP/IB Social Studies Course Enrollment and Exams Source: College Board and International Baccalaureate Organization
A 3 on an AP exam is considered passing and may give the student college credit OR advanced placement at a higher education institution. A 3 on an IB exam is considered passing for purposes of an IB Diploma. A score of 4 is the lowest level accepted by higher education institutions (WSU accepts 4’s, UW, Eastern and Western require 5 and above). Social Studies Year at a Glance, Grade 6 2015-2016 Social Studies District Common Assessment, Grade 6
Course Enrollment # of Tests Taken # who passed AP 3+ /IB 4+
Pass Rate
2013 2014
2014 2015
2015 2016
2013 2014
2014 2015
2015 2016
2013 2014
2014 2015
2015 2016
2013 2014
2014 2015
2015 2016
AP US Government
74 134 118 69 125 (2
TMHS, 1 SHS)
103 63 108
95 91.3% 86.4% 92%
IHS 40 77 72 35 68 62 34 63 56 97.1% 92.3% 90%
LHS 34 57 46 34 54 41 29 43 39 85.3% 79.6% 95%
IB History of 20th Century
52 51 35 45 40 32 42 40 32 93.3% 100% 100%

ENDS 2: Academics and Foundations Page 17
WAS 2.6 CHANGED TO 2.7 POST 10-11-17 BOARD MEETING 2.4 2.7 understand the concept of community within the context of national and world history, comparative forms and influences of governments and major world religions; We interpret 2.4 to mean each student is able to identify and understand why people organize to meet human needs at the local, national and international levels. Evidence • Graduation requirements: Students are required to take 3 credits of Social Studies to
graduate. Percentage of students NOT graduating because of this requirement. • Proficiency: Graduation rate, enrollment in AP/IB Social Studies and numbers passing
AP/IB exams • AP European Studies enrollment and pass rate • US History District Common Assessment • World History Common Assessment AP/IB Social Studies Course Enrollment and Exams
Source: College Board and International Baccalaureate Organization
A 3 on an AP exam is considered passing and may give the student college credit OR advanced placement at a higher education institution. A 3 on an IB exam is considered passing for purposes of an IB Diploma. A score of 4 is the lowest level accepted by higher education institutions (WSU accepts 4’s, UW, Eastern and Western require 5 and above).
Course Enrollment # of Tests Taken # who passed AP 3+ /IB 4+
Pass Rate
20132014
20142015
20152016
20132014
20142015
20152016
20132014
20142015
20152016
2013 2014
2014 2015
2015 2016
AP US History
114 90 103 101 88 (1 SHS and 1 TMHS)
101 (3 SHS)
93 80
91 (3 SHS)
92.1% 90.9% 90%
IHS 58 51 85 56 50 83 51 48 73 91.1% 96% 88%
LHS 56 39 18 45 36 15 43 30 15 95.6% 83.3% 100%
SHS IB American
Studies
129 155 152 - No tests taken
- - - - - - -

ENDS 2: Academics and Foundations Page 18
Other Social Studies Courses w/Enrollment Source: Skyward
*Total Grade Level Enrollment reflects only those schools offering the class **Grade Level Enrollment based on October 2015 P-223 AP Euro Studies Source: College Board
A 3 on an AP exam is considered passing and may give the student college credit OR advanced placement at a higher education institution. A 3 on an IB exam is considered passing for purposes of an IB Diploma. A score of 4 is the lowest level accepted by higher education institutions (WSU accepts 4’s, UW, Eastern and Western require 5 and above).
Course Enrollment By School
Total Enrollment In Course
Grade Level Enrollment**
Percent of Enrollment
2013 2014
2014 2015
2015 2016
2013 2014
2014 2015
2015 2016
2013 2014
2014 2015
2015 2016
2013 2014
2014 2015
2015 2016
Honors World (9th)
620 421 477 1333 1156 1470 46.5% 36.4% 32.4%
IHS 234 190 207 LHS 152 N/A 32 SHS 234 231 238
Honors European (10th)
421 240 N/A 835 598 N/A 48.3% 40.1% N/A
LHS 160 N/A N/A SHS 243 240 N/A
LHS AP Human Geography (9th)
133 20 133 20 338 329 39.3% 6.1%
IHS AP Human Geography (10th)
125 181 125 181 508 572 24.6% 31.6%
IHS AP European Studies (10th)
127 94 127 94 508 572 25.0% 16.4%
LHS AP World History (10th)
92 85 92 85 291 340 31.6% 25.0%
Course Enrollment # of Tests Taken # who passed AP 3+ /IB 4+
Pass Rate
20132014
20142015
20152016
20132014
20142015
20152016
20132014
20142015
20152016
2013 2014
2014 2015
2015 2016
AP Euro Studies
140 129 94 132
119 86 114 109 70 86.4% 91.6% 81%
IHS 140 129 94 131 118 86 114 108 70 87.0% 90.8% 81%
LHS - - - - 1 - - 1 - - 100% -
SHS - - - 1 - - 0 - - 0% - -
AP Human Geography
- 258 208 - 239 (1 SHS)
190 - 197 154 - 82.4% 81%
IHS - 125 188 - 115 172 - 92 138 - 80% 80%
LHS - 133 20 - 123 18 - 104 16 - 84.5% 89%
LHS AP World History
- 92 85 - 79 86 - 51 67 - 64.5% 78%

ENDS 2: Academics and Foundations Page 19
2015-2016 U.S. History Common Assessment 2015-2016 World History Common Assessment
WAS 2.7 CHANGED TO 2.8 POST 10-11-17 BOARD MEETING 2.5 2.8 understand and appreciate the basic concepts of fine, visual and performing arts; Interpretation: We interpret 2.5 to mean each student is able to demonstrate comprehension of the fundamental elements of fine, visual and performing arts. Evidence: Art Lessons K-5 Elementary Art Docent Program Secondary Visual Arts Common Assessment Rubric Grad Requirement 2 Credits of either Visual or Performing Arts
Art Lessons K-5 (1st Grade as an example) Issaquah PTSA Council Art Docent Lesson Plans
Secondary Visual Arts Common Assessment Rubric
High School Visual Arts Source: Skyward
*Total Enrollment from Oct 2015 P223 Note: Class offering vary from year to year
School
Number of Courses Total Enrollment By School (duplicated)
*Grade Level Enrollment
Percent of Enrollment
2014 2015
2015 2016
2014 2015
2015 2016
2014 2015
2015 2016
2014 2015
2015 2016
Total 49 43 3121 2815 5298 5349 58.9% 54.2%
IHS 17 16 1114 1005 2042 2123 54.5% 48.0% LHS 14 11 834 765 1216 1181 68.6% 70.6% SHS 18 16 1173 1045 2040 2045 57.5% 51.1%

ENDS 2: Academics and Foundations Page 20
High School Performing Arts Source: Skyward
*Total Enrollment from Oct 2015 P223 Note: Class offering vary from year to year Middle School Visual Arts Source: Skyward
*Total Enrollment from Oct 2015 P223 Class offering vary from year to year
Middle School Performing Arts Source: Skyward
*Total Enrollment from Oct 2015 P223, Class offering vary from year to year
School
Number of Courses Total Enrollment By School (duplicated)
*Grade Level Enrollment
Percent of Enrollment
2014 2015
2015 2016
2014 2015
2015 2016
2014 2015
2015 2016
2014 2015
2015 2016
Total 49 49 1779 1796 5298 5349 33.6% 33.6%
IHS 14 14 537 620 2042 2123 26.3% 29.2% LHS 13 14 586 562 1216 1181 48.2% 47.6% SHS 22 21 656 614 2040 2045 32.2% 30.0%
School
Number of Courses Total Enrollment By School (duplicated)
*Grade Level Enrollment
Percent of Enrollment
2014 2015
2015 2016
2014 2015
2015 2016
2014 2015
2015 2016
2014 2015
2015 2016
Total 20 29 1424 1712 4438 4678 32.1% 36.6%
IMS 3 5 177 305 776 767 22.8% 39.8% MMS 3 5 353 418 1017 1084 34.7% 38.6% BLMS 2 7 209 411 848 867 24.6% 47.4% PLMS 5 2 364 127 873 911 41.7% 13.9% PCMS 7 10 321 451 924 1049 34.7% 43.0%
School
Number of Courses Total Enrollment By School (duplicated)
*Grade Level Enrollment
Percent of Enrollment
2014 2015
2015 2016
2014 2015
2015 2016
2014 2015
2015 2016
2014 2015
2015 2016
Total 46 43 2233 2260 4438 4678 50.3% 48.3%
IMS 7 7 305 301 776 767 39.3% 39.2% MMS 8 8 454 425 1017 1084 44.6% 39.2% BLMS 8 9 489 487 848 867 57.7% 56.2% PLMS 9 8 471 530 873 911 54.0% 58.2% PCMS 14 11 514 517 924 1049 55.6% 49.3%
ENDS 2: Academics and Foundations Page 21
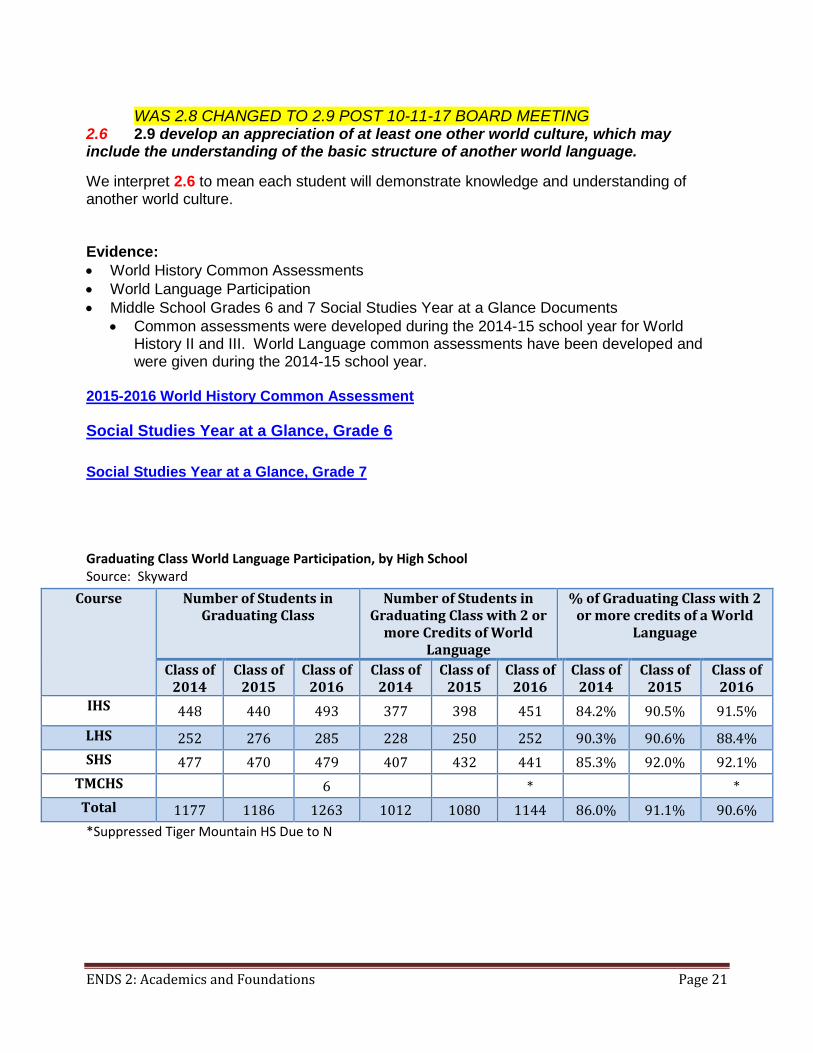
WAS 2.8 CHANGED TO 2.9 POST 10-11-17 BOARD MEETING 2.6 2.9 develop an appreciation of at least one other world culture, which may include the understanding of the basic structure of another world language. We interpret 2.6 to mean each student will demonstrate knowledge and understanding of another world culture. Evidence: • World History Common Assessments • World Language Participation • Middle School Grades 6 and 7 Social Studies Year at a Glance Documents
• Common assessments were developed during the 2014-15 school year for World History II and III. World Language common assessments have been developed and were given during the 2014-15 school year.
2015-2016 World History Common Assessment Social Studies Year at a Glance, Grade 6 Social Studies Year at a Glance, Grade 7 Graduating Class World Language Participation, by High School Source: Skyward
*Suppressed Tiger Mountain HS Due to N
Course Number of Students in Graduating Class
Number of Students in Graduating Class with 2 or
more Credits of World Language
% of Graduating Class with 2 or more credits of a World
Language
Class of 2014
Class of 2015
Class of 2016
Class of 2014
Class of 2015
Class of 2016
Class of 2014
Class of 2015
Class of 2016
IHS 448 440 493 377 398 451 84.2% 90.5% 91.5% LHS 252 276 285 228 250 252 90.3% 90.6% 88.4% SHS 477 470 479 407 432 441 85.3% 92.0% 92.1%
TMCHS 6 * * Total 1177 1186 1263 1012 1080 1144 86.0% 91.1% 90.6%

ENDS 2: Academics and Foundations Page 22
AP/IB World Language Course Enrollment and Exams Source: College Board and International Baccalaureate Organization
A 3 on an AP exam is considered passing and may give the student college credit OR advanced placement at a higher education institution. A 3 on an IB exam is considered passing for purposes of an IB Diploma. A score of 4 is the lowest level accepted by higher education institutions (WSU accepts 4’s, UW, Eastern and Western require 5 and above). *No SHS enrollment number available for 2015-2016 **These students were never enrolled in an AP Spanish class, however they sat for an AP test prior to 2015-2016
Board approval: November 9, 2016
Course Enrollment # of Tests Taken # who passed AP 3+ /IB 4+
Pass Rate
20132014
20142015
20152016
20132014
20142015
2015 2016
20132014
20142015
2015 2016
2013 2014
2014 2015
2015 2016
French AP/IB total
108 110 94 - 28 (1 SHS)
20 (1 SHS)
- 25 20 (1 SHS)
- 89.3% 100%
IHS 2 26 20 3 23 18 3 23 18 100% 100% 100% LHS 75 66 53 0 4 1 0 2 1 0 50% 100% SHS –IB HL 5 - 1 4 - 1 3 - 1 75% - 100% SHS – IB SL 26 18 20 16 11 19 15 11 19 93.7% 100% 100% Japanese total
6 13 9 - 1 1 - 1 1 - 100% 100%
IHS - - - 2 1 1 2 1 1 100% 100% 100% SHS - IB SL 6 13 9 6 10 7 6 10 7 100% 100% 100% Spanish AP/IB total
119 123 112 - 40 24 (2 SHS)
- 39 24 (2 SHS)
- 97.5% 100%
IHS 29 41 21 26 39 22 26 38 22 100% 97.4% 100%
LHS - - - 0 1 - 0 1 - 0 100% 100% SHS – IB HL 15 16 15 14 16 14 14 16 14 100% 100% 100% SHS– IB SL 75 66 76 48 47 55 48 47 55 100% 100% 100% Mandarin Chinese AP/IB total
16 6 5 6 - 17 6 - 17 100% - 100%
IHS - AP - - N/A - - 8 - - 8 - - 100% SHS (AP scores of IB kiddos before IB test offered)
**16 6 * 6 2 6 2 100% 100% 100%
SHS IB Chinese HL
- - 2 - - 1 - - 1 - - 100%
SHS IB Chinese SL
- - 5 - - 5 - - 5 - - 100%