students success network - eastern michigan university
TRANSCRIPT
Student Success Network
Five Year Strategic Plan
2010-2015
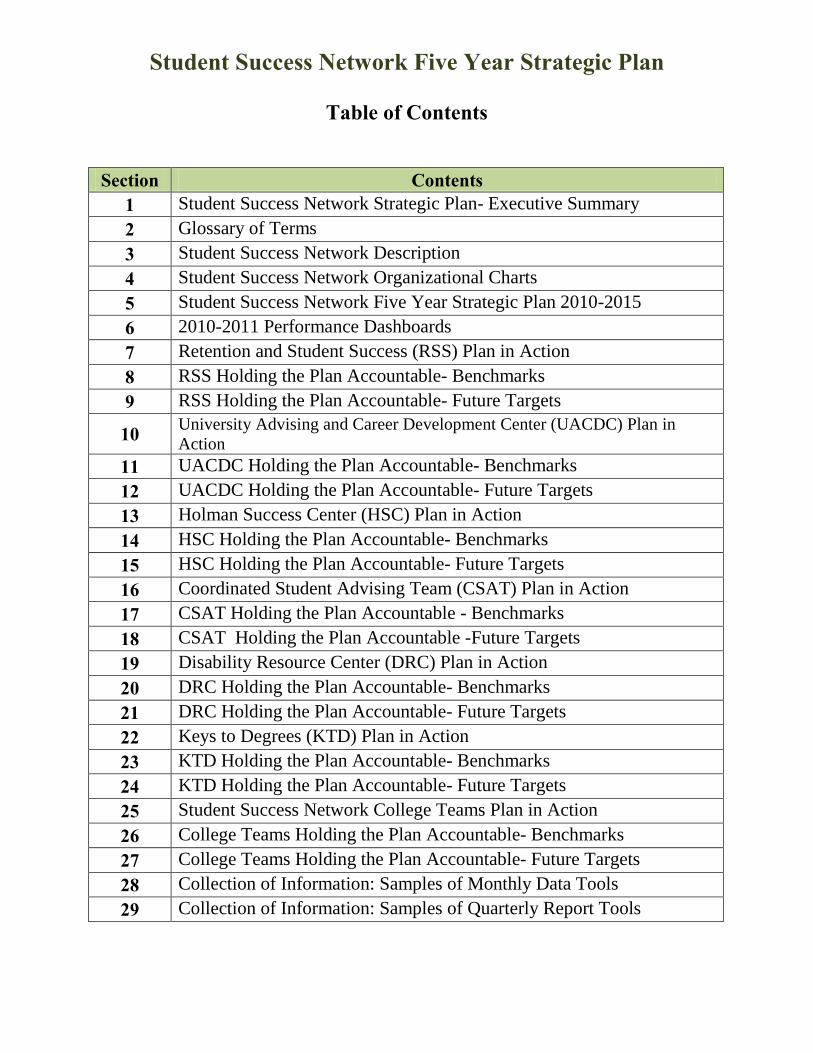
Student Success Network Five Year Strategic Plan
Table of Contents
Section Contents 1 Student Success Network Strategic Plan- Executive Summary 2 Glossary of Terms 3 Student Success Network Description 4 Student Success Network Organizational Charts 5 Student Success Network Five Year Strategic Plan 2010-2015 6 2010-2011 Performance Dashboards 7 Retention and Student Success (RSS) Plan in Action 8 RSS Holding the Plan Accountable- Benchmarks 9 RSS Holding the Plan Accountable- Future Targets
10 University Advising and Career Development Center (UACDC) Plan in Action
11 UACDC Holding the Plan Accountable- Benchmarks 12 UACDC Holding the Plan Accountable- Future Targets 13 Holman Success Center (HSC) Plan in Action 14 HSC Holding the Plan Accountable- Benchmarks 15 HSC Holding the Plan Accountable- Future Targets 16 Coordinated Student Advising Team (CSAT) Plan in Action 17 CSAT Holding the Plan Accountable - Benchmarks 18 CSAT Holding the Plan Accountable -Future Targets 19 Disability Resource Center (DRC) Plan in Action 20 DRC Holding the Plan Accountable- Benchmarks 21 DRC Holding the Plan Accountable- Future Targets 22 Keys to Degrees (KTD) Plan in Action 23 KTD Holding the Plan Accountable- Benchmarks 24 KTD Holding the Plan Accountable- Future Targets 25 Student Success Network College Teams Plan in Action 26 College Teams Holding the Plan Accountable- Benchmarks 27 College Teams Holding the Plan Accountable- Future Targets 28 Collection of Information: Samples of Monthly Data Tools 29 Collection of Information: Samples of Quarterly Report Tools

Student Success Network Strategic Plan Executive Summary
1
1
Eastern Michigan University
Student Success Network
Five-Year Strategic Plan 2010-2015
Executive Summary
Overview of the Student Success Network Strategic Plan
The Student Success Network is proud to present to you our Five-Year Strategic Plan 2010-
2015. The Student Success Network (SSN) evolved in July 2010 following the transition of
Career Services to the area of Retention and Student Success within the Division of Academic
Affairs. Career Services subsequently merged with the Academic Advising Center to form the
current University Advising and Career Development Center (UACDC). The UACDC joined the
Holman Success Center, the Disability Resource Center and the Coordinated Student Advising
Team as areas within Retention and Student Success. All of these areas play essential roles in the
academic success and retention of students. The creation of the Student Success Network
presented the opportunity for these departments to intentionally work collaboratively with one
another in order to provide the best resources possible within the Division of Academic Affairs
and across the entire Eastern Michigan University campus. During the remainder of 2010, the
Keys to Degrees Program, the Study Fixx and a more coordinated effort to obtain student
persistence data emerged as additional components of the network.
The Student Success Network spent the 2010 – 2011 academic year developing a strategic plan
beginning with an all Student Success Network staff retreat in August led by Human Resources.
The information collected during this retreat shaped the general structure of the strategic plan’s
goals, objectives, action strategies and action steps. Throughout the 2010 – 2011 year, each
Student Success Network area developed mechanisms to collect and report data pertaining to the
core resources and programs within the respective centers. This information was used to
establish baseline data on which future predictions and assessments will be made over the next
four years. The strategic plan is a dynamic document, one that is being constantly reviewed and
occasionally reformed as necessary. Data will be assessed annually and adjustments to targets
and predictions will be made as necessary reflective of a continuously changing internal and
external environment.
The SSN Five-Year Strategic Plan (2010-2015) not only provides a strategic plan, it is followed
up by each unit’s strategic plan in action and holding the plan accountable by setting internal
benchmarks, targets and quarterly reports. This allows us to submit annual dashboards providing
an account of our performance. Thus it is a strategic plan that cannot be shelved based on its
continuous accountability measures throughout the five years of the plan.
2
The complete strategic plan consists of the following information:
Executive Summary
Glossary of Terms
Student Success Network Description (of each unit)
Student Success Network departmental organization charts
Student Success Network Five Year Strategic Plan (goals, objectives and action
strategies)
2010-2011 Performance Dashboards ( to be completed annually)
Strategic Plan in Action (action steps for each of the Student Success Network areas)
Holding the Strategic Plan Accountable (internal benchmarks, performance metrics and
quarterly reports.
The Student Success Network strongly is encouraged by the depth of this strategic plan. We
believe if we are able to keep this document alive and working, it will be the impetus for
increasing our first year retention rates and our six-year graduation rates outlined in Section 9-
Holding the Plan Accountable- Future Targets within this five-year period. It is our goal that by
2015, our first-year retention rate will be 81%, and our six year graduation rate will be 45%.
Glossary of Terms
2

1
Student Success Network Glossary of Terms
Abbreviation/Term Definition/Explanation
CART Computer Assisted Real-Time Translation – service for
students with hearing impairments
CAS College of Arts & Sciences
CHHS College of Health & Human Services
COB College of Business
COE College of Education
COT College of Technology
CRM Corporate Relations Managers
CSAT Coordinated Student Advising Team
DRC Disability Resource Center
4-S Program Select Student Support Services
FTIAC Student First Time in Any College Student
FUSION First year orientation program
FYC First Year Center
GEAR UP Program Gaining Early Awareness and Readiness for Undergraduate
Programs
GF GradesFirst early alert and reporting system
HSC Holman Success Center
KTD Keys to Degrees
LIFE Exploration Floor
Leadership (and Service) International (and Multicultural)
Fitness (and Wellness) Exploration residential themed floor
for first year students led by SSN staff and graduate
assistant
PASS Promote Academic Survival and Success
P1, P2, P3 Probation – Level 1, Level 2, Level 3
RSS Retention and Student Success
SAP Satisfactory Academic Performance – tied to financial aid
SI Supplemental Instruction
SIP Summer Incentive Program
SSN Student Success Network
TBD To be determined
UACDC University Advising & Career Development Center
U-Crew UACDC advising and career resource campus outreach
group that offers brief clinics on relevant topics
UNIV Courses University introduction courses for FTIACs
YASTYT You Are Smarter Than You Think! – learning strategies
program
^ Indicates in the metrics when measures were not tabulated
for the entire 2010 – 2011 year for various reasons
□ Data for these measures will be available after the fall 2011
OFFICIAL_RECORD warehousing on January 13, 2012
Student Success Network Description
3
1
Eastern Michigan University
Student Success Network
Five-Year Strategic Plan 2010-2015
Description of Student Success Network (SSN)
The Student Success Network is comprised of five core units, support areas and the Student
Success Council that provide collaborative academic and career support for students as well as
student persistence data.
University Advising and Career Development Center (UACDC) - The UACDC offers many
tools to assist students and alumni in developing academic and career goals and/or deciding on a
major or minor. The core areas of the UACDC include General Education Academic Advising,
Career Coaching, Student Employment and Corporate Relations Management. Due to the
critical importance of each of these areas in a student's academic experience, every
undergraduate student at EMU will engage with at least one of these resources, which are
explained in further detail below:
Academic Advising:
Guide students in selecting general education courses that support the general education
program and a student's major/minor requirements
Offer support for students who are not meeting program and/or personal academic goals
Collaborate with Admissions, college academic advising units and other resources on
campus in an effort to provide comprehensive academic advising resources for students
Career Coaching:
Assist students in determining their interests, values, personality types and motivators so
they can confidently choose a major, minor and/or career
Serve as a resource to students who are interested in pursuing co-ops and internships
Aid students with developing a job search plan including development of a professional
resume, interviewing skills, networking strategies and knowledge of how to work a job
fair or networking event
Student Employment:
Provide online access to on-campus and off-campus part-time jobs
Process student employment hiring paperwork including I-9s as well as all pay rate,
org/fund and job status changes
2
Assist students with learning to use the online job posting system and offer additional tips
for finding on- or off-campus employment
Corporate Relations Management(CRM):
Work with deans, department heads, school directors and faculty to determine placement
needs of graduates
Make appropriate connections with business community in order to bring job and
internship openings to campus based on needs of our students/graduates
Coordinate events which provide opportunities for students (and alumni) to interact with
recruiters (job fairs, networking events, on-campus recruiting, information sessions, etc.)
Assist students with developing job search strategies which are realistic for their
particular field
Provide resume referrals to employers through student and faculty connections
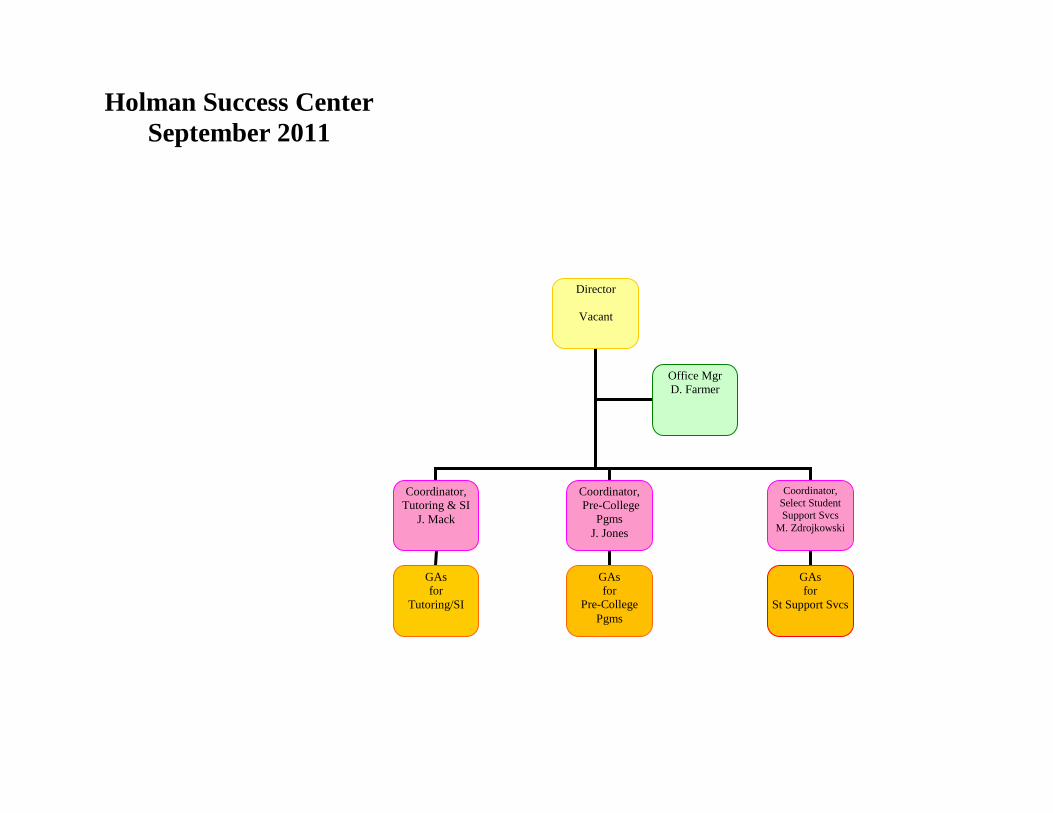
Holman Success Center (HSC) – The Holman Success Center (HSC) provides academic
support services that can facilitate academic success for EMU students. The core services, all
free to students, include:
Tutoring and Supplemental Instruction:
Provide individual appointments with trained peer tutors for many EMU classes (based
on student requests).
Offer group study sessions for several courses through the Supplemental Instruction
program (SI). SI Leaders are peer tutors who have excelled in specific courses and are
recommended by faculty and hired to sit in on lectures/classes and facilitate study
sessions several times each week.
Select Student Support Services (4-S Program):
Provide services to freshman cohorts of high risk students, who are of low academic and
economic status, arriving at EMU through support from a state-funded grant. The 4-S
program focuses on students who enter the University through the PASS (Promote
Academic Survival and Success) and SIP (Summer Incentive) Programs as well as on
students who are on academic probation.
Success Coaches (graduate assistants/students) assist students with strategies and skills to
manage their “academic life”. In addition, they provide mentoring and guidance with
time management, study strategies, test anxiety and much more.
Three Pre-college Programs:
Summer Incentive Program (SIP): provides at-risk, high-school graduates an opportunity
for academic success. Following a highly selective screening process, up to 60
candidates are chosen each year to participate in an intensive 7½ week summer boot
3
camp program designed to aid them in their transition to the challenges of the university
educational environment.
GEAR UP (Federal) and College Day (State): funded through grants and are designed to
increase the number of students from disadvantaged backgrounds who are prepared for
post-secondary education. “GEAR UP” is an acronym for “Gaining Early Awareness
and Readiness for Undergraduate Programs.” HSC’s program works in partnership
exclusively with Detroit Cody and River Rouge High Schools and their feeder middle
schools by providing in-class workshops on college preparation, campus visits, teacher
training and seminars for parents including financial aid. Eligible participants who enroll
at EMU may apply for exclusive GEAR UP/College Day Scholarships upon graduation
from high school.
Wade H. McCree, Jr. Incentive Scholarship Program: allows EMU to award four-year
tuition-based scholarships to select students in the Detroit Public School System who
show academic promise during their eighth grade year. The program encourages students
to pursue their educational goals, graduate from high school with honors, and attend a
four-year Michigan higher education institution. Recipients who graduate high school
with a minimum cumulative grade point average of 3.0 (on a 4.0 scale) and have obtained
a minimum ACT score of 21 will receive the Wade McCree Scholarship, based on the
terms of the agreement.
Coordinated Student Advising Team (CSAT) – The CSAT provides support to undergraduate
students on academic probation in developing academic skills that will help them return to good
standing. CSAT also assists undeclared students, students who are intents and those struggling
with completion of a degree program. A team of faculty and graduate assistants representing all
five colleges as well as undecided students carry out this charge. Special priority is given to
FTIACs in support of their academic development and acclimation to the culture of university
life and expectations. Advisors meet frequently with students to monitor progress, promote
habits of success, assist in communication with instructors, advocate as needed, refer to other
university services, and recommend selection of courses.
Student Success Network College Teams – The SSN College Teams are a critical,
comprehensive wrap-around service team initiative for students and departments within the
respective colleges. The goal of these teams is to collaborate with the colleges to create programs
and resources that address specific college needs. In addition, the college teams will create
personalized communication outreach systems to support the academic needs of freshmen and
sophomores and the career needs of juniors and seniors.
Each team consists of representatives from the Student Success Network, including UACDC
Academic Advisors, UACDC Career Coaches, UACDC Corporate Relations Managers,
Coordinated Student Advising Team (CSAT) members, and Success Coaches from the Holman
Success Center. The teams will also include respective college advising office staff members.
4
The goal of assigning Student Success Network members to specific colleges is for all students
and college departments to know who they can contact as a go-to resource person within these
areas.
Disability Resource Center (DRC) – The DRC assists students with disabilities in their
transition to and continuation at EMU by providing necessary resources and methods to be good
self-advocates and independent managers of life’s details. The primary function of the DRC is to
coordinate and facilitate the implementation of academic accommodations in the classroom for
students. In addition, the DRC has a responsibility to educate the EMU community about
disability trends, including ways to best engage with students with disabilities and to provide
ideas on how changes in classroom and program/event design can enhance all experiences for all
students - while possibly removing the environmental barriers that necessitate accommodations.
Keys to Degrees (KTD) - Single Parent Program – KTD provides single parent students with
essential resources and services designed to enhance academic success and support life balance.
Students are introduced to college life and receive extensive assistance with understanding
personal roles and responsibilities as a student, and as a parent. This residential program
provides support for participants through personal counseling, workshops, academic coaching,
mentoring, and monitoring of academic and personal successes from admission through
graduation.
Study Fixx – Beginning in fall 2010, the Student Success Network opened the Study Fixx (a
Student Success Network annex) in the lower level of the Eateries in the First Year Center
Residence Hall Complex. In the Study Fixx, students can find a quiet place to study within the
residence halls, meet with Success Coaches, attend SI sessions, meet with an academic advisor
and/or career coach, receive individual tutoring and attend workshops and presentations designed
to enhance their success at EMU.
Student Success Council - Previously known as the Retention Council, this group has been in
existence since 2007. The Student Success Council works with the overarching goal of
identifying the needs, expectations and responsibilities of the three primary groups within the
university: the students, the faculty and the staff. The primary focus is to determine gaps between
members of these three audiences as the Council plans retention initiatives through three
subcommittees: Getting IN, Staying IN and Getting OUT. These subcommittees provide a
blueprint for work by focusing on the critical stages in EMU students’ educational path.
Student Persistence Data – The Student Success Network provides student persistence data to
use in the generation of cohort retention and graduation reports as well as data analyses to assist
in developing informed student success metrics.
Student Success Network Organizational Charts 4
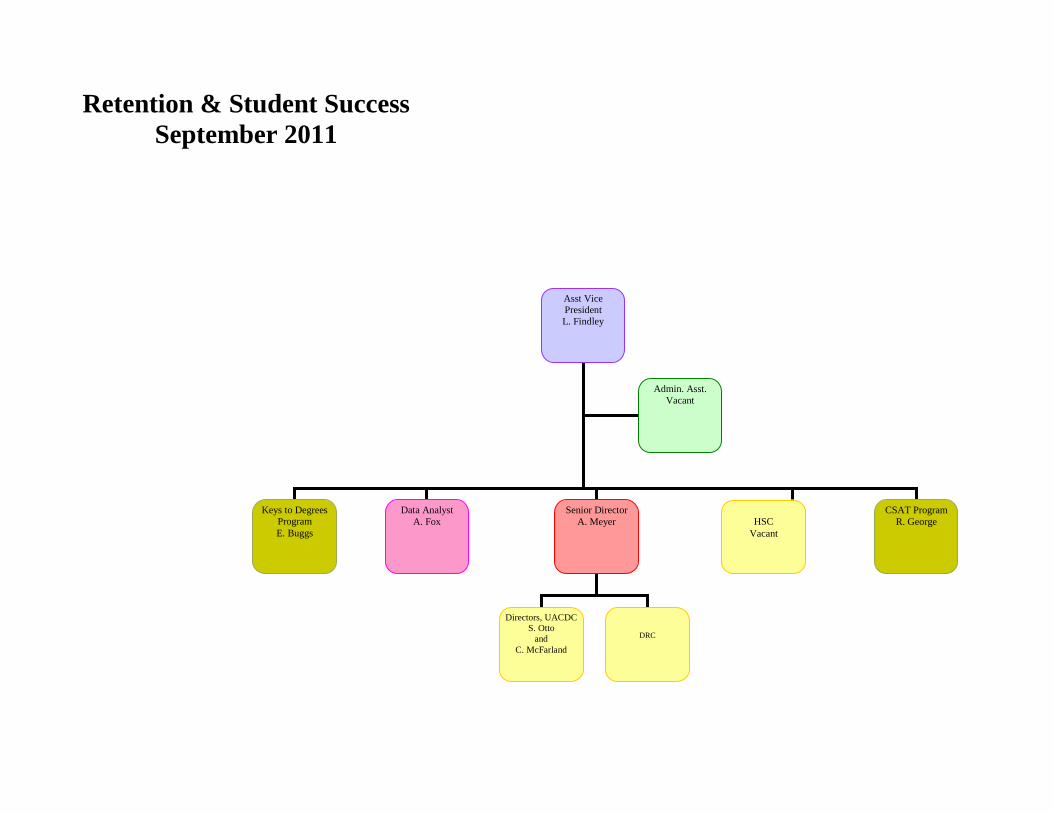
Asst Vice President
L. Findley
Retention & Student Success
September 2011
Senior Director
A. Meyer
Data Analyst
A. Fox
HSC
Vacant
Admin. Asst.
Vacant
Directors, UACDC
S. Otto
and
C. McFarland
Keys to Degrees Program
E. Buggs
CSAT Program
R. George
DRC

Senior Director,
Student Success
Network
A. Meyer
Director, Career
Dev. & Outreach
S. K. Otto
Director, Acad. &
Career Plng
C. McFarland
Employer
Outreach & Dev.
Communications
& Outreach
Asst Dir.
Mktg/Media/
Web & SE C. Walrath
Corp. Rel. Mgr
CHHS/CAS E. Jones
Corp. Rel. Mgr
COT/CAS L. Robinette
Corp. Rel. Mgr.
COE B. Jones
Employer
Outreach & Co-
op Support B. Wethington
Data Specialist
M. Chambers
Student Emp.
Rep
M .Jones
Student Emp.
Rep
J. Lagana
Academic
Advisors
Acad. Adv.
CAS/CLEP
E. Punches
Acad. Adv.
CAS/Int’l
S. Spencer
Acad. Adv.
CAS A. Apperson
Acad. Adv.
COB/2nd
Bach. C. Reese-Oxford
Acad. Adv.
CHHS/PASS
C. Merritt
Acad. Adv.
COT
M. Thornbladh
Associate Director Transfer Student
Initiatives M. Weir
Career Coaches
Career Coach
CHHS & COT
L. McKnight
Career Coach
CAS K. Meyer
Career Coach
COE
A. Johnson
Acad. Adv.
Undeclared
G. Heinrichs
Customer
Service Rep. II
Y. Woods
Corp. Rel. Mgr.
OCR/COB
J. Bundridge
Sr. Secretary
T. Taylor
GA
Publications/ Joint initiatives
GAs
for Acad. Adv.
GA
for
Career
Advising
University Advising &
Career Development
Center
September 2011
July 2011
Acad. Adv.
Off-site/EPEO
M. Fallot
Adv. Specialist/
Support
A. Marshall
Career
Coach/Corp
Relations Hybrid
COB
B. Gehring
Acad. Adv. COE
C. Lesko KEY
Graduate Assistant CS Position
PT Position AP Assoc/Asst Director
AP Dept Director AP Senior Director
Director
Vacant
Holman Success Center
September 2011
Coordinator,
Pre-College
Pgms
J. Jones
Coordinator,
Tutoring & SI
J. Mack
Coordinator,
Select Student
Support Svcs
M. Zdrojkowski
Office Mgr
D. Farmer
GAs
for
Tutoring/SI
GAs
for
Pre-College
Pgms
GAs
for
St Support Svcs
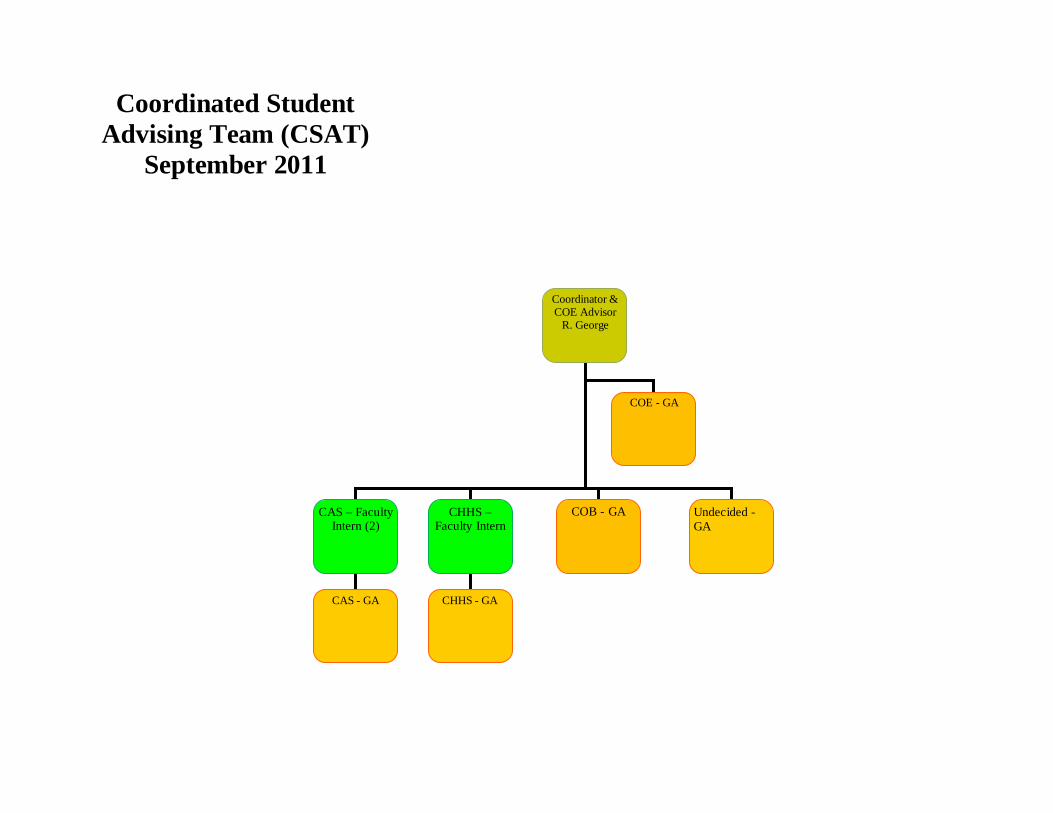
Coordinator & COE Advisor
R. George
Coordinated Student
Advising Team (CSAT)
September 2011
COB - GA CHHS – Faculty Intern
CHHS - GA
COE - GA
CAS – Faculty Intern (2)
Undecided -
GA
CAS - GA
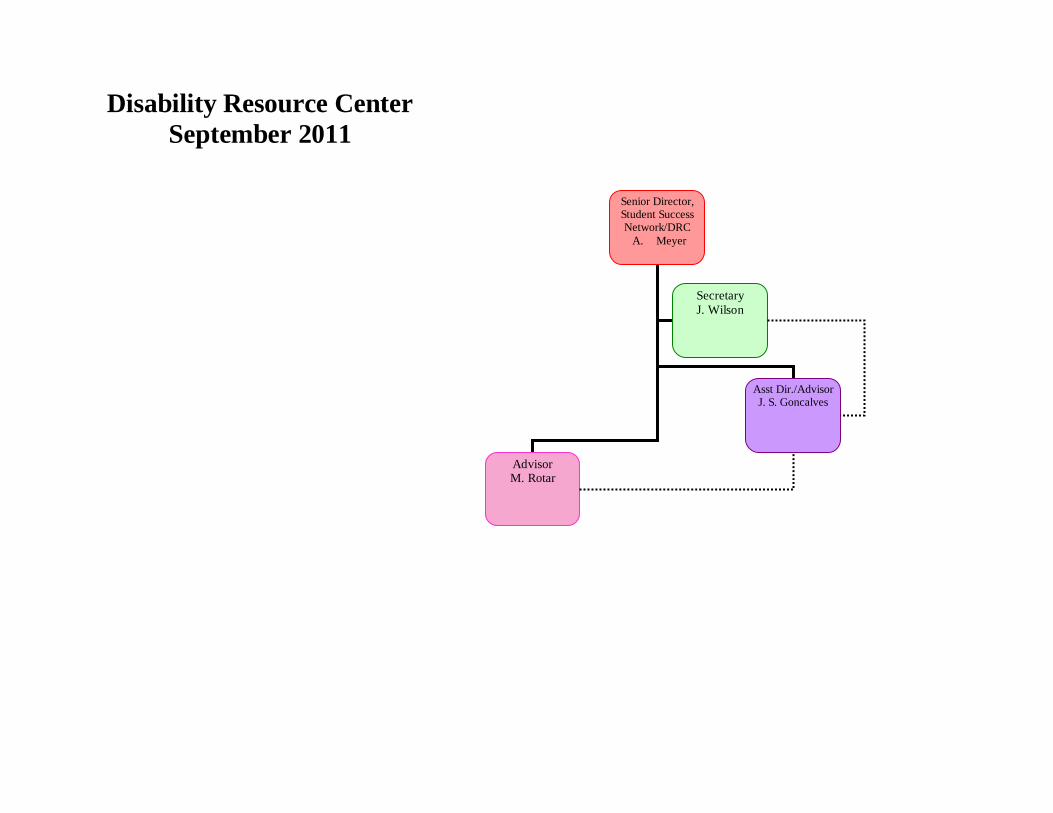
Senior Director, Student Success Network/DRC
A. Meyer
Advisor M. Rotar
Asst Dir./Advisor J. S. Goncalves
Secretary
J. Wilson
Disability Resource Center
September 2011
Student Success Network Five Year Strategic Plan 2010-2015 5
1
Eastern Michigan University
Student Success Network
Five-Year Strategic Plan 2010-2015
Vision, Mission and Values
Vision
To support students’ educational experiences and to prepare them to be globally competitive by
providing a nationally recognized best practice network of academic support services that guides
students in discovering and attaining their educational, career and life goals.
Mission
The Student Success Network seeks to ensure students uphold the roles and responsibilities
expected of them as members of the Eastern Michigan University learning community by
providing academic and career support services and resources. Students can experience a desired
level of academic achievement and personal accomplishment that assists them in the present and
prepares them for life in the future as contributing members of society.
Values
Collaborate with other Eastern Michigan University (EMU) divisions, colleges and academic
departments, community businesses/corporations and school districts to provide quality support
services to enhance student success.
1. Treat each student as an individual while providing quality services and focusing on their
strengths
2. Work collaboratively as a Student Success Network (SSN) while keeping the needs of
students first
3. Demonstrate respect, ethical behavior, caring and commitment while serving as
advocates for student success
4. Exhibit inclusiveness in all areas of diversity
5. Provide quality and innovative programs that enhance student success through holistic
student services while concentrating on continuous improvement
6. Value employees while providing opportunities for professional growth, advancement
and continuous employee recognition
2
Goal, Objectives and Action Strategies
Goal #1: To increase the 6-Year graduation rate for First Time in Any College
(FTIAC) students
Objective A: Improve 6-Year graduation rate of FTIAC students by 1 percentage point per
year for five years
Action Strategies
1. Develop a five-year retention plan with goals for improvement
2. Develop longitudinal retention tracking to generate data reports on student cohort
populations
3. Develop retention targets and goals by college and for targeted student populations, with
plans for regular improvement
4. Re-evaluate strategies, policies, and processes to optimize leverage on enrollment and
credit hours
5. Create quantitative goals for Student Success Network areas with metrics for
improvement
Goal #2: To enhance student success
Objective A: Improve student persistence, retention and graduation rates
Action Strategies
1. Collectively develop and deliver a university-wide retention program
2. Enhance the undergraduate student advising experience
3. Strengthen “Freshmen Year” experience programs
4. Research and evaluate implementation of “sophomore year” and “senior year” experience
programs
5. Increase number of FTIAC students who complete general education in the first two
years
6. Decrease the number of Intent students within the respective colleges
7. Enhance services and support provided to transfer students
8. Improve collaboration/service delivery among the five colleges
9. Assess and improve student satisfaction through Student Success Network (SSN) surveys
10. Utilize assessment information through data-driven decision-making in the budget and
program planning process
Objective B: Enhance student engagement
Action Strategies
1. Develop collaborative partnerships to engage student learning outside of the classroom
2. Broaden the role of SSN programs to encompass the mission of teaching and learning
across the University
3. Create SSN specific continuous improvement projects
4. Provide academic support to students as they progress through their freshman and
sophomore years
5. Create sustainable career programs to support students as they progress through their
junior and senior years
6. Establish advisory committees for different SSN areas and in collaboration with other
university efforts
3
Objective C: Enhance comprehensive support services to targeted populations
Action Strategies
1. Assess and evaluate the expansion of early intervention programs designed to improve
success rates of underprepared and “at-risk” students
2. Improve and consolidate University Advising and Career Development Center (UACDC)
processes
3. Identify, promote, and implement programs that increase learning opportunities and
experiences within housing in order to enhance the student residence hall experience
Goal #3: To develop and implement programs which have a positive impact
on the number of students on academic probation
Objective A: Annually decrease the number of students on academic probation
Action Strategies
1. Require all students on academic probation to meet with Coordinated Student Advising
Team (CSAT) in order to create an academic student success plan
2. Place a hold on registration accounts for students who do not meet with CSAT
3. Work with students who need assistance with major and career decision-making
(UACDC)
Goal #4: To be recognized for service and public engagement
Objective A: Create community partnerships that enhance job placements
Action Strategies
1. Expand opportunities for students to engage in coop/intern, student/alumni job
shadowing experiences
2. Host business leaders and alumni at sporting and other University events
3. Improve information flow to alumni and stakeholders
4. Improve tracking of alumni regarding professional experiences, career satisfaction, and
the role EMU played in their career path
5. Provide better information on graduate success in the workplace
Objective B: Develop community relationships with employers, community colleges, high
schools and middle schools
Action Strategies
1. Create relationships with regional employers to expand opportunities for students
2. Create programs to enhance the transfer student academic experience
3. Pilot programs in middle schools and high schools to increase the student understanding
of the collegiate experience
4. Design support systems to foster teens and orphaned or abandoned teens to transition to
and succeed in college
5. Increase staff and student community service and civic engagement
6. Have appropriate SSN presence at different campus events and department programs
Goal #5: To seek outside funding sources to support student success initiatives
Objective A: Increase the number of grant proposals submitted, including federal, state and
foundations
4
Action Strategies
1. Seek funding to create and develop initiatives which support the Student Success
Network’s vision of providing programs to serve as models for best practices
Objective B: Market SSN initiatives at local, state and federal level
Action Strategies
1. Identify, publicize, and validate SSN programs to external audiences through
comprehensive communication
2. Determine programs and services that could become known as “best practices” in service
areas and apply for and secure awards and recognition
3. Be more intentional in sharing programs at the state and national levels through journal
articles, conference presentations, poster sessions, etc.
Goal #6: To enhance facilities, technology, infrastructure, and plan effective
space utilization
Objective A: Improve and consolidate in-person and electronic processes and services in all
areas related to the Student Success Network
Action Strategies
1. Increase the use of technology to enhance delivery of student services and learning
experiences
Goal #7: To enhance faculty support and staff success
Objective A: Provide faculty with information, resources and channels of communication to
enhance student success
Action Strategies
1. Develop Student Success Summits and other programming that will promote and increase
understanding of student success
2. Create and develop print and electronic resources to support faculty
Objective 2: Attract, develop, retain, and reward a diverse workforce through professional
development programs and other opportunities
Action Strategies
1. Post the EMU Code of Ethics in all SSN departments and establish the expectation that
all staff will abide by the code
2. Develop SSN policy and procedural manuals
3. Identify ways to keep SSN staff energized
4. Monitor the return on investment from university involvement in the external community
5. Create a continuous improvement team for SSN
6. Create professional development programs utilizing professional expertise within the
University
7. Create an internal reward system to acknowledge SSN staff performance
8. Encourage staff educational pursuits and career aspirations
2010-2011 Performance Dashboards
6

Opening Term Data. Official 2010-11 results will be available January 13, 2012.
Student Success Network Dashboard 2010-11 Results Retention & Student Success
●Exceed ●Meet ●Below Target Prior-Fall 2010 Target-Fall 2011 Current-Fall 2011 Overall Retention & Graduation Rates (FTIACs unless otherwise designated)
Prior Target Current Progress
Increase 1st year retention rate (2010 cohort) 76.46
77.5 (state
average 81.0)
76.3* ●
Increase 2nd year retention rate (2009 cohort) 58.98 60.0 63.5* ● Increase 3rd year retention rate (2008 cohort) 54.61 56.0 54.1* ● Increase 4-year grad rate (2007 cohort) 12.15 13.0 12.4 ●
Increase 5-year grad rate* (2006 cohort) 30.07 28.0 28.7 ●
Increase 6-year grad rate (2005 cohort) 37.70
39.0 (state
average 59.0)
39.4 ●
Increase 8-year grad rate 42.75 44.0 45.6 ●
Increase 6-year transfer grad rate 56.46 57.0
Fall to Winter FTIAC Retention Rates Prior Target Current Progress Increase 1st year winter retention rate (2011 cohort) 92.79 93
Increase 2nd year winter retention rate (2010) 71.99 73
Increase 3rd year winter retention rate (2009) 56.44 57.5
Increase 4th year winter retention rate (2008) 51.78 53 Academic Good Standing and Probation Rates Prior Target Current Progress Increase % of FTIAC students with academic good standing at end of 1st term (2011 cohort)
79.0 80.0
Decrease % of FTIAC students on probation at end of 1st term (2011 cohort)
21.0 20.0
Increase % of FTIAC students with academic good standing at end of 2nd term (2011 cohort)
80.0 81.0
Decrease % of FTIAC students on probation at end of 2nd term (2011 cohort)
19.0 19.0
Increase % of undergraduate students in good standing in fall term (all F11 UGs)
91.0 91.5
Decrease % of undergraduate students on probation in fall term (all F11 UGs)
9.0 8.5
Opening Term Data. Official 2010-11 results will be available January 13, 2012.
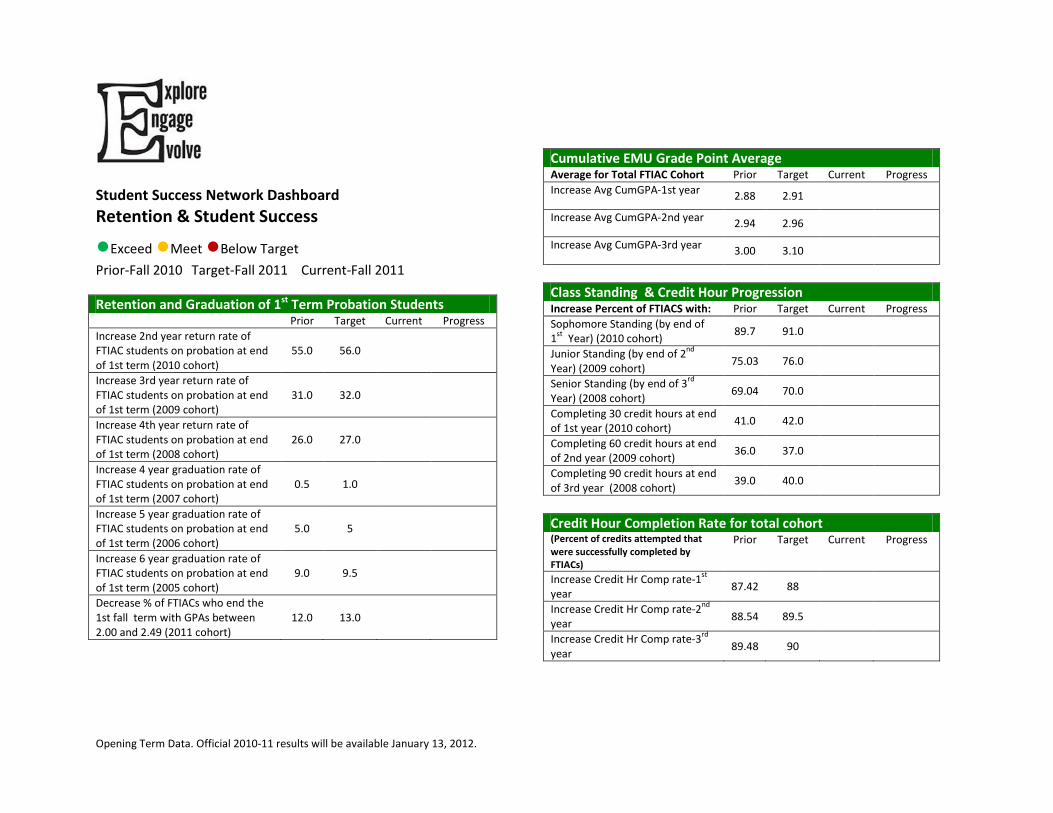
Student Success Network Dashboard Retention & Student Success
●Exceed ●Meet ●Below Target Prior-Fall 2010 Target-Fall 2011 Current-Fall 2011
Retention and Graduation of 1st Term Probation Students Prior Target Current Progress Increase 2nd year return rate of FTIAC students on probation at end of 1st term (2010 cohort)
55.0 56.0
Increase 3rd year return rate of FTIAC students on probation at end of 1st term (2009 cohort)
31.0 32.0
Increase 4th year return rate of FTIAC students on probation at end of 1st term (2008 cohort)
26.0 27.0
Increase 4 year graduation rate of FTIAC students on probation at end of 1st term (2007 cohort)
0.5 1.0
Increase 5 year graduation rate of FTIAC students on probation at end of 1st term (2006 cohort)
5.0 5
Increase 6 year graduation rate of FTIAC students on probation at end of 1st term (2005 cohort)
9.0 9.5
Decrease % of FTIACs who end the 1st fall term with GPAs between 2.00 and 2.49 (2011 cohort)
12.0 13.0
Cumulative EMU Grade Point Average Average for Total FTIAC Cohort Prior Target Current Progress Increase Avg CumGPA-1st year 2.88 2.91 Increase Avg CumGPA-2nd year 2.94 2.96 Increase Avg CumGPA-3rd year 3.00 3.10 Class Standing & Credit Hour Progression Increase Percent of FTIACS with: Prior Target Current Progress Sophomore Standing (by end of 1st Year) (2010 cohort) 89.7 91.0 Junior Standing (by end of 2nd Year) (2009 cohort) 75.03 76.0 Senior Standing (by end of 3rd Year) (2008 cohort) 69.04 70.0 Completing 30 credit hours at end of 1st year (2010 cohort) 41.0 42.0 Completing 60 credit hours at end of 2nd year (2009 cohort) 36.0 37.0 Completing 90 credit hours at end of 3rd year (2008 cohort) 39.0 40.0
Credit Hour Completion Rate for total cohort (Percent of credits attempted that were successfully completed by FTIACs)
Prior Target Current Progress
Increase Credit Hr Comp rate-1st year 87.42 88 Increase Credit Hr Comp rate-2nd year 88.54 89.5 Increase Credit Hr Comp rate-3rd year 89.48 90

Opening Term Data. Official 2010-11 results will be available January 13, 2012.
Student Success Network Dashboard Retention & Student Success
●Exceed ●Meet ●Below Target Prior-Fall 2010 Target-Fall 2011 Current-Fall 2011 At Risk Students-Less than 3.0 High School GPA Prior Target Current Progress
Increase 1st year retention rate 72.32 73.0
Increase 2nd year retention rate 47.89 49.0
Increase 3rd year retention rate 41.57 43.0
Increase 4-year grad rate 3.52 4.5
Increase 5-year grad rate 16.67 17.0
Increase 6-year grad rate 23.21 24.0 At Risk Students- Less than 20 Composite ACT Score Prior Target Current Progress
Increase 1st year retention rate 73.89 75.0
Increase 2nd year retention rate 52.52 54.0
Increase 3rd year retention rate 48.26 49.0
Increase 4-year grad rate 4.98 6.0
Increase 5-year grad rate 18.35 18.0
Increase 6-year grad rate 24.17 25.0
Target FTIAC Cohort Key Prior Current First Year 2009 Cohort 2010 Cohort Second Year 2008 Cohort 2009 Cohort Third Year 2007 Cohort 2008 Cohort Fourth Year 2006 Cohort 2007 Cohort Fifth Year 2005 Cohort 2006 Cohort Sixth Year 2004 Cohort 2005 Cohort
At Risk Students-African Americans Prior Target Current Progress
Increase 1st year retention rate 76.92 78.0 74.6* ●
Increase 2nd year retention rate 52.77 54.0 58.7* ●
Increase 3rd year retention rate 45.28 46.0 47.1* ●
Increase 4-year grad rate 2.68 3.5 3.9 ●
Increase 5-year grad rate 16.24 15.0 12.7 ●
Increase 6-year grad rate 21.56 23.0 26.4 ●
At Risk Students-PASS Prior Target Current Progress
Increase 1st year retention rate 71.51 73.0 73.7* ●
Increase 2nd year retention rate 43.70 45.0 57* ●
Increase 3rd year retention rate 36.04 37.0 34.8* ●
Increase 4-year grad rate 1.56 3 .9 ●
Increase 5-year grad rate 9.24 9.0 7.0 ●
Increase 6-year grad rate 22.16 23.0 18.5 ●
Opening Term Data. Official 2010-11 results will be available January 13, 2012.
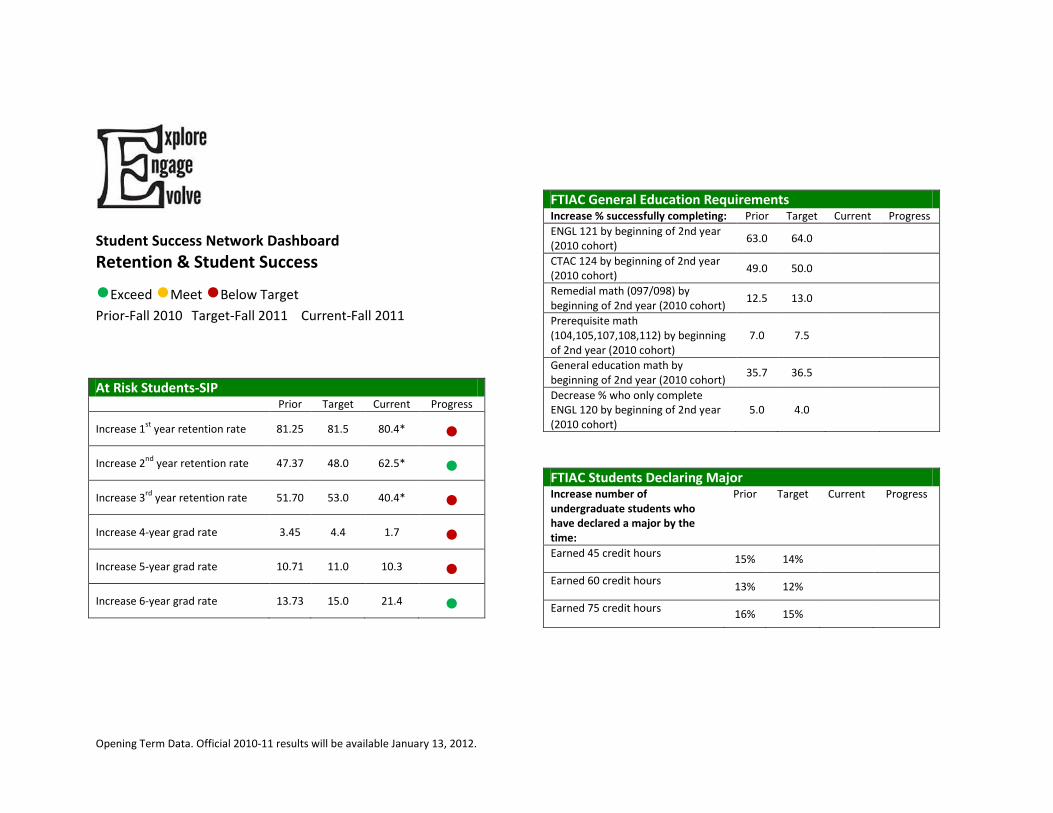
Student Success Network Dashboard Retention & Student Success
●Exceed ●Meet ●Below Target Prior-Fall 2010 Target-Fall 2011 Current-Fall 2011 At Risk Students-SIP Prior Target Current Progress
Increase 1st year retention rate 81.25 81.5 80.4* ●
Increase 2nd year retention rate 47.37 48.0 62.5* ●
Increase 3rd year retention rate 51.70 53.0 40.4* ●
Increase 4-year grad rate 3.45 4.4 1.7 ●
Increase 5-year grad rate 10.71 11.0 10.3 ●
Increase 6-year grad rate 13.73 15.0 21.4 ●
FTIAC General Education Requirements Increase % successfully completing: Prior Target Current Progress ENGL 121 by beginning of 2nd year (2010 cohort) 63.0 64.0 CTAC 124 by beginning of 2nd year (2010 cohort) 49.0 50.0 Remedial math (097/098) by beginning of 2nd year (2010 cohort) 12.5 13.0 Prerequisite math (104,105,107,108,112) by beginning of 2nd year (2010 cohort)
7.0 7.5
General education math by beginning of 2nd year (2010 cohort) 35.7 36.5 Decrease % who only complete ENGL 120 by beginning of 2nd year (2010 cohort)
5.0 4.0
FTIAC Students Declaring Major Increase number of undergraduate students who have declared a major by the time:
Prior Target Current Progress
Earned 45 credit hours 15% 14% Earned 60 credit hours 13% 12% Earned 75 credit hours 16% 15%
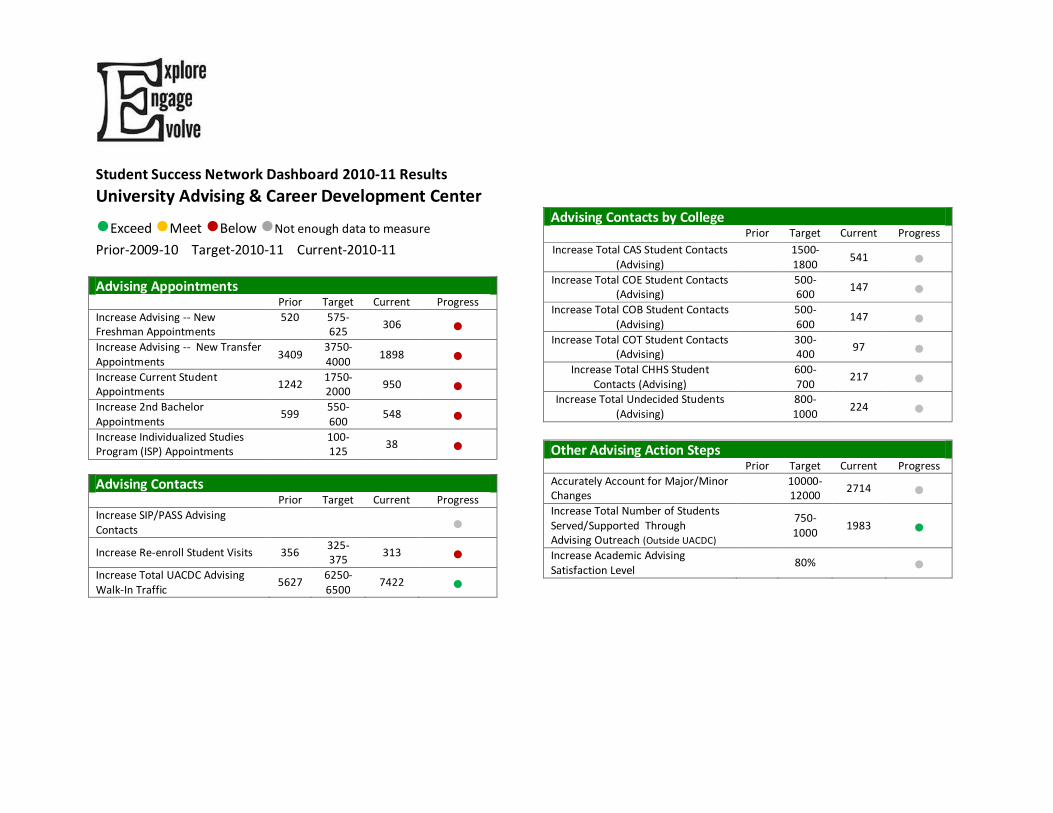
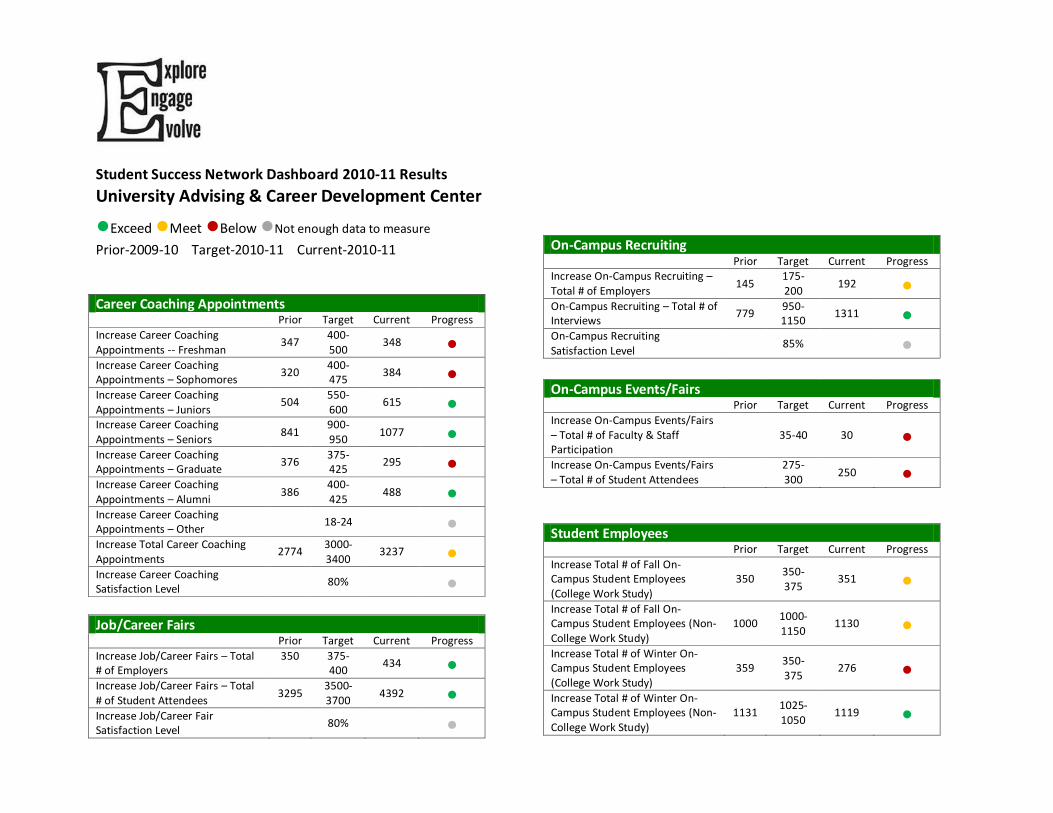
Student Success Network Dashboard 2010-11 Results
University Advising & Career Development Center
●Exceed ●Meet ●Below ●Not enough data to measure
Prior-2009-10 Target-2010-11 Current-2010-11
Advising Appointments Prior Target Current Progress
Increase Advising -- New Freshman Appointments
520
575-625
306 ● Increase Advising -- New Transfer Appointments
3409 3750-4000
1898 ● Increase Current Student Appointments
1242 1750-2000
950 ● Increase 2nd Bachelor Appointments
599 550-600
548 ● Increase Individualized Studies Program (ISP) Appointments
100-125
38 ●
Advising Contacts Prior Target Current Progress
Increase SIP/PASS Advising Contacts
●
Increase Re-enroll Student Visits 356 325-375
313 ● Increase Total UACDC Advising Walk-In Traffic
5627 6250-6500
7422 ●
Advising Contacts by College Prior Target Current Progress
Increase Total CAS Student Contacts (Advising)
1500-1800
541 ● Increase Total COE Student Contacts
(Advising)
500-600
147 ● Increase Total COB Student Contacts
(Advising)
500-600
147 ● Increase Total COT Student Contacts
(Advising)
300-400
97 ● Increase Total CHHS Student
Contacts (Advising)
600-700
217 ● Increase Total Undecided Students
(Advising)
800-1000
224 ●
Other Advising Action Steps Prior Target Current Progress
Accurately Account for Major/Minor Changes
10000-12000
2714 ● Increase Total Number of Students Served/Supported Through Advising Outreach (Outside UACDC)
750-1000
1983 ●
Increase Academic Advising Satisfaction Level
80% ●
Student Success Network Dashboard 2010-11 Results
University Advising & Career Development Center
●Exceed ●Meet ●Below ●Not enough data to measure
Prior-2009-10 Target-2010-11 Current-2010-11
Career Coaching Appointments Prior Target Current Progress
Increase Career Coaching Appointments -- Freshman
347 400-500
348 ● Increase Career Coaching Appointments – Sophomores
320 400-475
384 ● Increase Career Coaching Appointments – Juniors
504 550-600
615 ● Increase Career Coaching Appointments – Seniors
841 900-950
1077 ●
Increase Career Coaching Appointments – Graduate
376 375-425
295 ●
Increase Career Coaching Appointments – Alumni
386 400-425
488 ● Increase Career Coaching Appointments – Other
18-24 ● Increase Total Career Coaching Appointments
2774 3000-3400
3237 ●
Increase Career Coaching Satisfaction Level
80% ●
Job/Career Fairs Prior Target Current Progress
Increase Job/Career Fairs – Total # of Employers
350
375-400
434 ● Increase Job/Career Fairs – Total # of Student Attendees
3295 3500-3700
4392 ● Increase Job/Career Fair Satisfaction Level
80% ●
On-Campus Recruiting Prior Target Current Progress Increase On-Campus Recruiting – Total # of Employers
145 175-200
192 ● On-Campus Recruiting – Total # of Interviews
779 950-1150
1311 ● On-Campus Recruiting Satisfaction Level
85% ●
On-Campus Events/Fairs Prior Target Current Progress
Increase On-Campus Events/Fairs – Total # of Faculty & Staff Participation
35-40 30 ●
Increase On-Campus Events/Fairs – Total # of Student Attendees
275-300
250 ●
Student Employees Prior Target Current Progress
Increase Total # of Fall On-Campus Student Employees (College Work Study)
350 350-375
351 ●
Increase Total # of Fall On-Campus Student Employees (Non-College Work Study)
1000 1000-1150
1130 ●
Increase Total # of Winter On-Campus Student Employees (College Work Study)
359 350-375
276 ●
Increase Total # of Winter On-Campus Student Employees (Non-College Work Study)
1131 1025-1050
1119 ●
*Michigan State Mandated Target
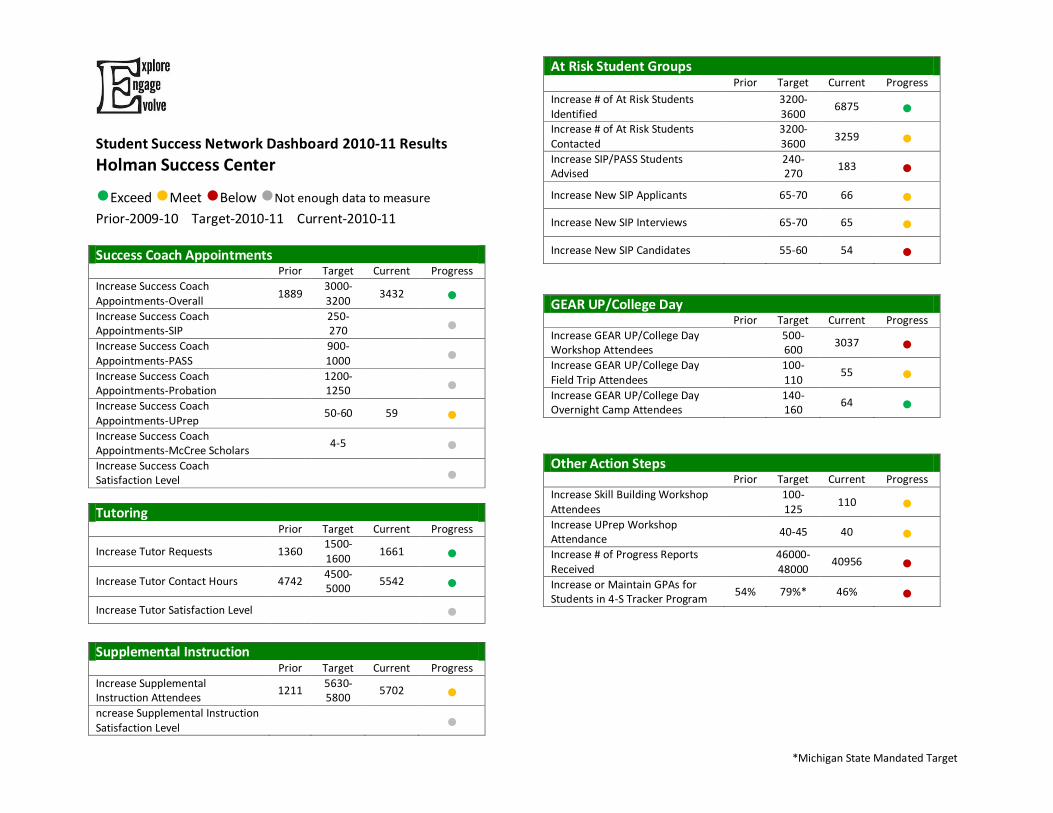
Student Success Network Dashboard 2010-11 Results
Holman Success Center
●Exceed ●Meet ●Below ●Not enough data to measure
Prior-2009-10 Target-2010-11 Current-2010-11 Success Coach Appointments Prior Target Current Progress
Increase Success Coach Appointments-Overall
1889 3000-3200
3432 ● Increase Success Coach Appointments-SIP
250-270
● Increase Success Coach Appointments-PASS
900-1000
● Increase Success Coach Appointments-Probation
1200-1250
● Increase Success Coach Appointments-UPrep
50-60 59 ● Increase Success Coach Appointments-McCree Scholars
4-5 ● Increase Success Coach Satisfaction Level
●
Tutoring Prior Target Current Progress
Increase Tutor Requests 1360 1500-1600
1661 ●
Increase Tutor Contact Hours 4742 4500-5000
5542 ●
Increase Tutor Satisfaction Level
● Supplemental Instruction Prior Target Current Progress
Increase Supplemental Instruction Attendees
1211 5630-5800
5702 ● ncrease Supplemental Instruction Satisfaction Level
●
At Risk Student Groups Prior Target Current Progress
Increase # of At Risk Students Identified
3200-3600
6875 ● Increase # of At Risk Students Contacted
3200-3600
3259 ● Increase SIP/PASS Students Advised
240-270
183 ●
Increase New SIP Applicants 65-70 66 ●
Increase New SIP Interviews 65-70 65 ●
Increase New SIP Candidates 55-60 54 ●
GEAR UP/College Day Prior Target Current Progress
Increase GEAR UP/College Day Workshop Attendees
500-600
3037 ● Increase GEAR UP/College Day Field Trip Attendees
100-110
55 ● Increase GEAR UP/College Day Overnight Camp Attendees
140-160
64 ●
Other Action Steps Prior Target Current Progress
Increase Skill Building Workshop Attendees
100-125
110 ● Increase UPrep Workshop Attendance
40-45 40 ● Increase # of Progress Reports Received
46000-48000
40956 ● Increase or Maintain GPAs for Students in 4-S Tracker Program
54% 79%* 46% ●

Student Success Network Dashboard
Coordinated Student Advising Team
●Exceed ●Meet ●Below ●Not enough data to measure
Prior-2009-10 Target-2010-11 Current-2010-11
Overall CSAT Prior Target Current
* Progress
Increase Total Number of All Appointments
1312 2000-2200
1549 ● Increase Total Number of All Students Advised
896 760-800
935 ●
Overall FTIAC and NonFTIAC Prior Target Current
* Progress
Increase Total Number of FTIACs Advised
173 ● Increase Total Number of NonFTIACs Advised
762 ● Increase Total Number of NonFTIAC P1 Appointments
332 ● Increase Total Number of NonFTIAC P2 Appointments
163 ● Increase Total Number of NonFTIAC P3 Appointments
153 ● Increase Total Number of NonProbation Appointments
144 ●
FTIACs by College Increase total number of students advised from each college
Prior Target Current
* Progress
Total Number Students-CAS (FTIAC)
53 ● Total Number Students- CHHS (FTIAC)
34 ● Total Number Students-COB (FTIAC)
15 ● Total Number Students - COE (FTIAC)
26 ● Total Number Students-COT (FTIAC)
15 ● Total Number Students-Undeclared (FTIAC)
25 ● Total Number Students-CAS (NonFTIAC)
210 ● Total Number Students- CHHS (NonFTIAC)
124 ● Total Number Students-COB (NonFTIAC)
84 ● Total Number Students - COE (NonFTIAC)
96 ● Total Number Students-COT (NonFTIAC)
95 ● Total Number Students-Undeclared (NonFTIAC)
101 ●
*Data reflects half year. Appointments-plus brought on-line in January
2011.
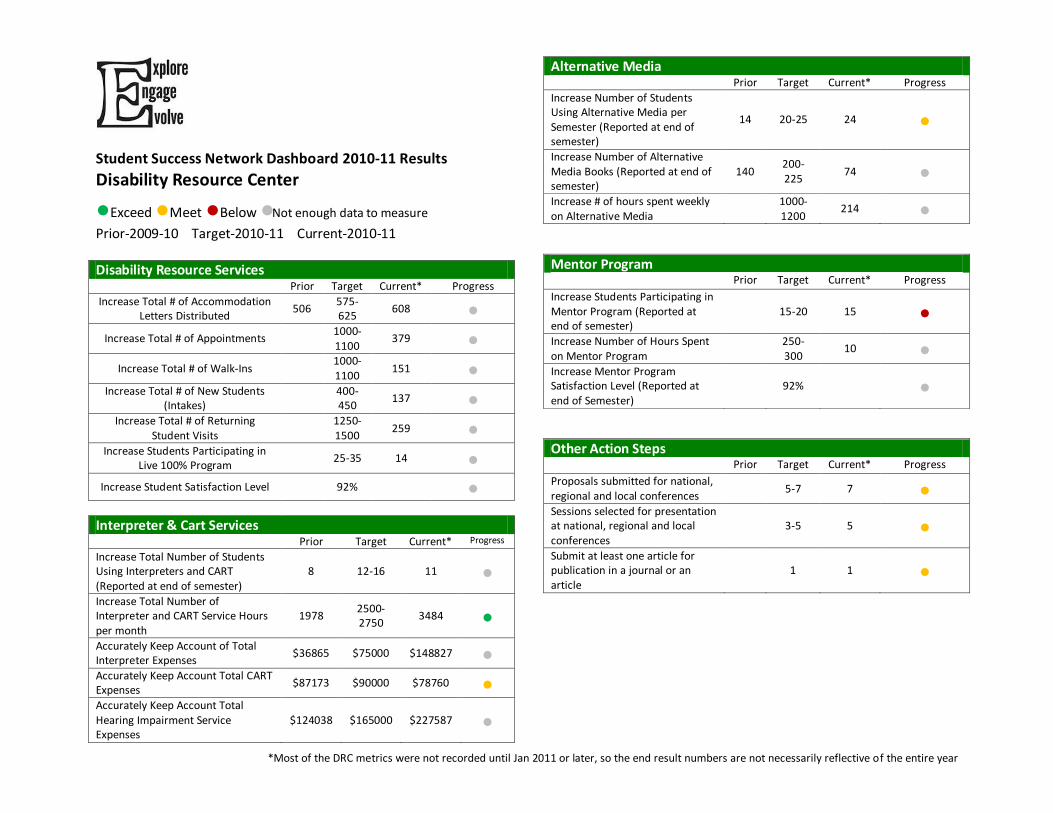
*Most of the DRC metrics were not recorded until Jan 2011 or later, so the end result numbers are not necessarily reflective of the entire year
Student Success Network Dashboard 2010-11 Results
Disability Resource Center
●Exceed ●Meet ●Below ●Not enough data to measure
Prior-2009-10 Target-2010-11 Current-2010-11 Disability Resource Services Prior Target Current* Progress
Increase Total # of Accommodation Letters Distributed
506 575-625
608 ●
Increase Total # of Appointments 1000-1100
379 ●
Increase Total # of Walk-Ins 1000-1100
151 ● Increase Total # of New Students
(Intakes)
400-450
137 ● Increase Total # of Returning
Student Visits
1250-1500
259 ● Increase Students Participating in
Live 100% Program 25-35 14 ●
Increase Student Satisfaction Level 92%
●
Interpreter & Cart Services Prior Target Current* Progress
Increase Total Number of Students Using Interpreters and CART (Reported at end of semester)
8 12-16 11 ●
Increase Total Number of Interpreter and CART Service Hours per month
1978 2500-2750
3484 ●
Accurately Keep Account of Total Interpreter Expenses
$36865 $75000 $148827 ● Accurately Keep Account Total CART Expenses
$87173 $90000 $78760 ●
Accurately Keep Account Total Hearing Impairment Service Expenses
$124038 $165000 $227587 ●
Alternative Media Prior Target Current* Progress
Increase Number of Students Using Alternative Media per Semester (Reported at end of semester)
14 20-25 24 ●
Increase Number of Alternative Media Books (Reported at end of semester)
140 200-225
74 ●
Increase # of hours spent weekly on Alternative Media
1000-1200
214 ●
Mentor Program Prior Target Current* Progress
Increase Students Participating in Mentor Program (Reported at end of semester)
15-20 15 ●
Increase Number of Hours Spent on Mentor Program
250-300
10 ● Increase Mentor Program Satisfaction Level (Reported at end of Semester)
92% ●
Other Action Steps Prior Target Current* Progress
Proposals submitted for national, regional and local conferences
5-7 7 ● Sessions selected for presentation at national, regional and local conferences
3-5 5 ●
Submit at least one article for publication in a journal or an article
1 1 ●
Retention and Student Success (RSS)
Plan in Action
7
1
Student Success Network Strategic Plans in Action
Retention & Student Success Strategic Plan in Action…!
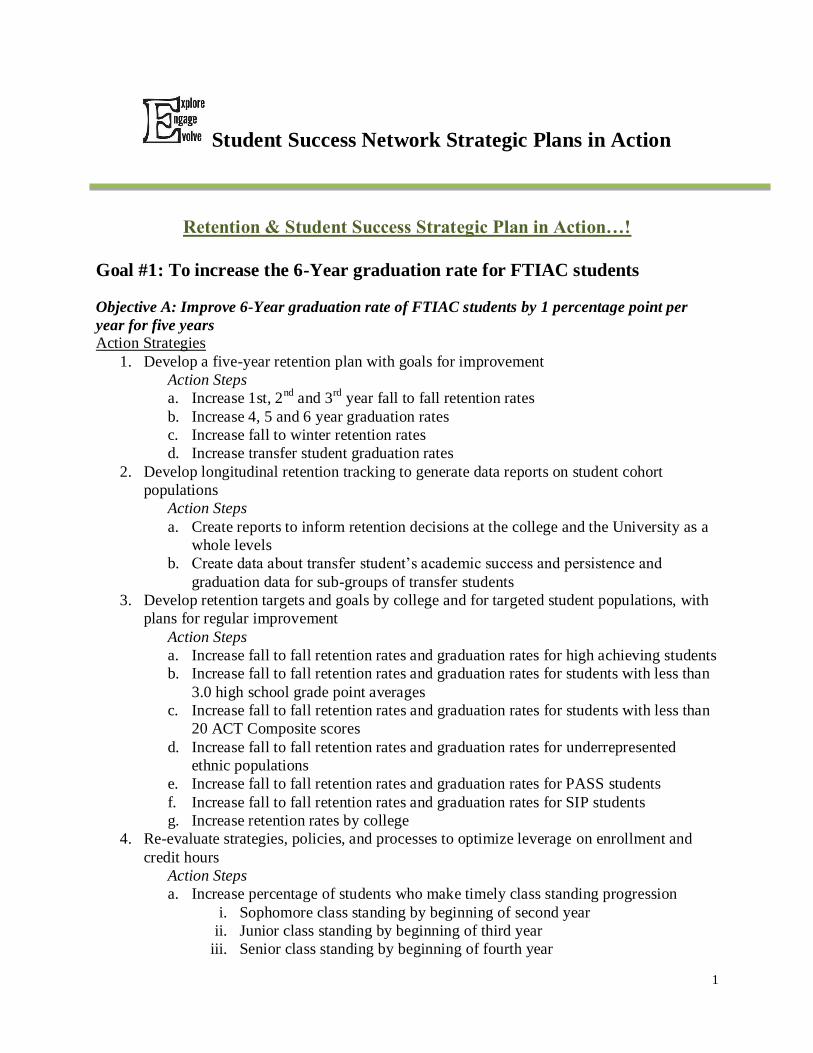
Goal #1: To increase the 6-Year graduation rate for FTIAC students
Objective A: Improve 6-Year graduation rate of FTIAC students by 1 percentage point per
year for five years
Action Strategies
1. Develop a five-year retention plan with goals for improvement
Action Steps
a. Increase 1st, 2nd
and 3rd
year fall to fall retention rates
b. Increase 4, 5 and 6 year graduation rates
c. Increase fall to winter retention rates
d. Increase transfer student graduation rates
2. Develop longitudinal retention tracking to generate data reports on student cohort
populations
Action Steps
a. Create reports to inform retention decisions at the college and the University as a
whole levels
b. Create data about transfer student‟s academic success and persistence and
graduation data for sub-groups of transfer students
3. Develop retention targets and goals by college and for targeted student populations, with
plans for regular improvement
Action Steps
a. Increase fall to fall retention rates and graduation rates for high achieving students
b. Increase fall to fall retention rates and graduation rates for students with less than
3.0 high school grade point averages
c. Increase fall to fall retention rates and graduation rates for students with less than
20 ACT Composite scores
d. Increase fall to fall retention rates and graduation rates for underrepresented
ethnic populations
e. Increase fall to fall retention rates and graduation rates for PASS students
f. Increase fall to fall retention rates and graduation rates for SIP students
g. Increase retention rates by college
4. Re-evaluate strategies, policies, and processes to optimize leverage on enrollment and
credit hours
Action Steps
a. Increase percentage of students who make timely class standing progression
i. Sophomore class standing by beginning of second year
ii. Junior class standing by beginning of third year
iii. Senior class standing by beginning of fourth year
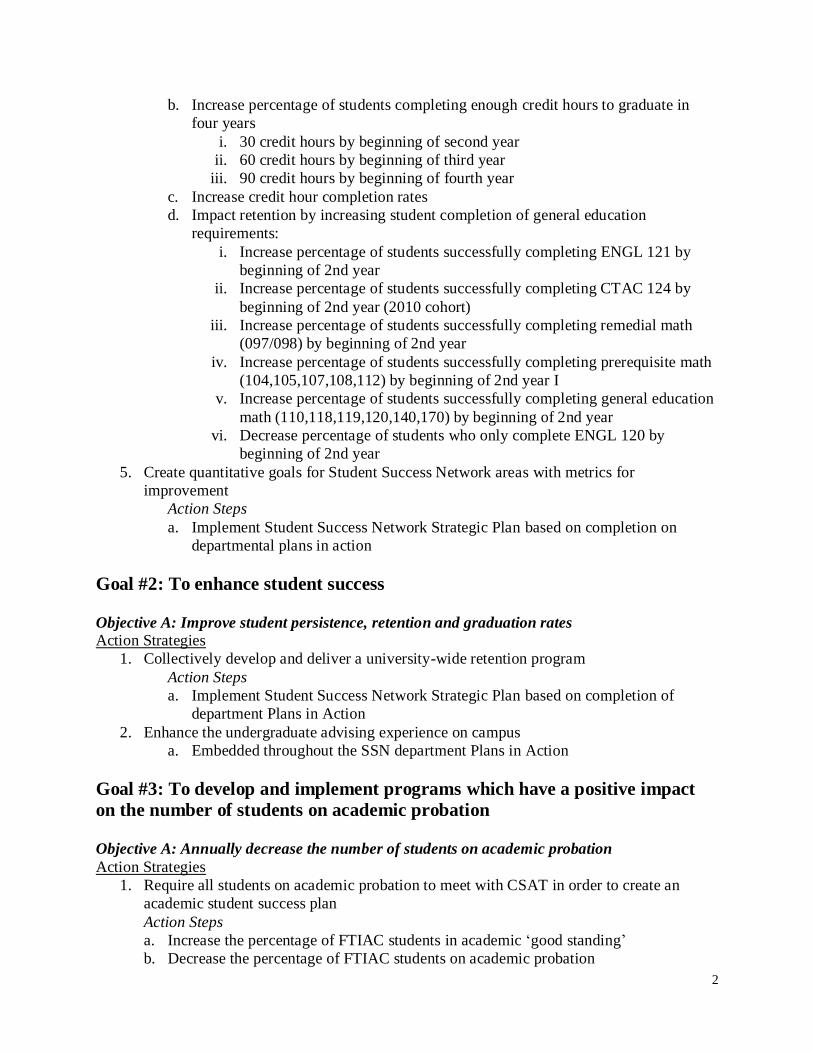
2
b. Increase percentage of students completing enough credit hours to graduate in
four years
i. 30 credit hours by beginning of second year
ii. 60 credit hours by beginning of third year
iii. 90 credit hours by beginning of fourth year
c. Increase credit hour completion rates
d. Impact retention by increasing student completion of general education
requirements:
i. Increase percentage of students successfully completing ENGL 121 by
beginning of 2nd year
ii. Increase percentage of students successfully completing CTAC 124 by
beginning of 2nd year (2010 cohort)
iii. Increase percentage of students successfully completing remedial math
(097/098) by beginning of 2nd year
iv. Increase percentage of students successfully completing prerequisite math
(104,105,107,108,112) by beginning of 2nd year I
v. Increase percentage of students successfully completing general education
math (110,118,119,120,140,170) by beginning of 2nd year
vi. Decrease percentage of students who only complete ENGL 120 by
beginning of 2nd year
5. Create quantitative goals for Student Success Network areas with metrics for
improvement
Action Steps
a. Implement Student Success Network Strategic Plan based on completion on
departmental plans in action
Goal #2: To enhance student success
Objective A: Improve student persistence, retention and graduation rates
Action Strategies
1. Collectively develop and deliver a university-wide retention program
Action Steps
a. Implement Student Success Network Strategic Plan based on completion of
department Plans in Action
2. Enhance the undergraduate advising experience on campus
a. Embedded throughout the SSN department Plans in Action
Goal #3: To develop and implement programs which have a positive impact
on the number of students on academic probation
Objective A: Annually decrease the number of students on academic probation
Action Strategies
1. Require all students on academic probation to meet with CSAT in order to create an
academic student success plan
Action Steps
a. Increase the percentage of FTIAC students in academic „good standing‟
b. Decrease the percentage of FTIAC students on academic probation
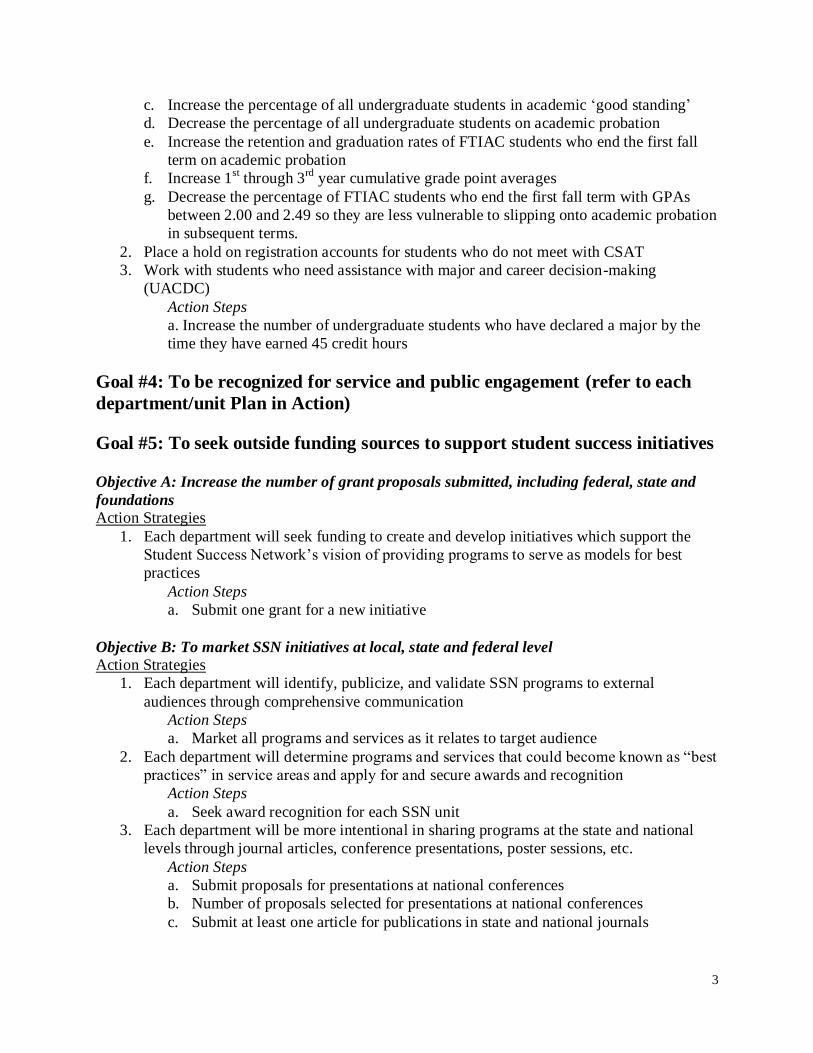
3
c. Increase the percentage of all undergraduate students in academic „good standing‟
d. Decrease the percentage of all undergraduate students on academic probation
e. Increase the retention and graduation rates of FTIAC students who end the first fall
term on academic probation
f. Increase 1st through 3
rd year cumulative grade point averages
g. Decrease the percentage of FTIAC students who end the first fall term with GPAs
between 2.00 and 2.49 so they are less vulnerable to slipping onto academic probation
in subsequent terms.
2. Place a hold on registration accounts for students who do not meet with CSAT
3. Work with students who need assistance with major and career decision-making
(UACDC)
Action Steps
a. Increase the number of undergraduate students who have declared a major by the
time they have earned 45 credit hours
Goal #4: To be recognized for service and public engagement (refer to each
department/unit Plan in Action)
Goal #5: To seek outside funding sources to support student success initiatives
Objective A: Increase the number of grant proposals submitted, including federal, state and
foundations
Action Strategies
1. Each department will seek funding to create and develop initiatives which support the
Student Success Network‟s vision of providing programs to serve as models for best
practices
Action Steps
a. Submit one grant for a new initiative
Objective B: To market SSN initiatives at local, state and federal level
Action Strategies
1. Each department will identify, publicize, and validate SSN programs to external
audiences through comprehensive communication
Action Steps
a. Market all programs and services as it relates to target audience
2. Each department will determine programs and services that could become known as “best
practices” in service areas and apply for and secure awards and recognition
Action Steps
a. Seek award recognition for each SSN unit
3. Each department will be more intentional in sharing programs at the state and national
levels through journal articles, conference presentations, poster sessions, etc.
Action Steps
a. Submit proposals for presentations at national conferences
b. Number of proposals selected for presentations at national conferences
c. Submit at least one article for publications in state and national journals
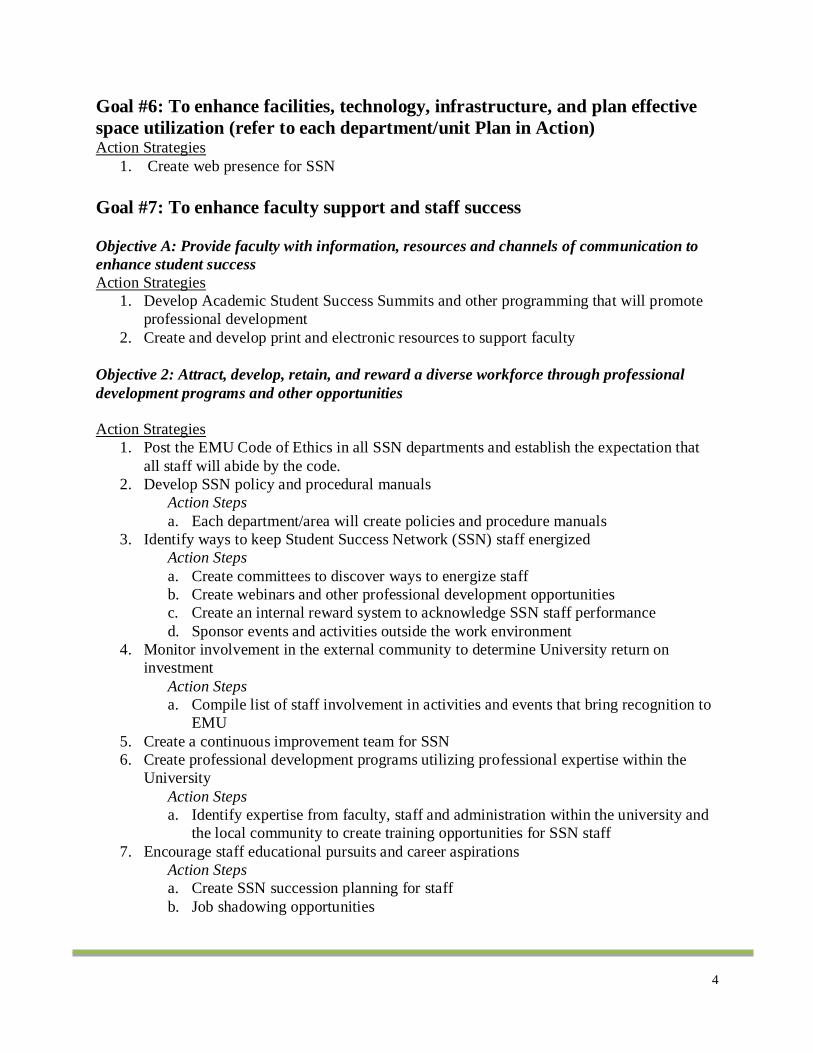
4
Goal #6: To enhance facilities, technology, infrastructure, and plan effective
space utilization (refer to each department/unit Plan in Action) Action Strategies
1. Create web presence for SSN
Goal #7: To enhance faculty support and staff success
Objective A: Provide faculty with information, resources and channels of communication to
enhance student success
Action Strategies
1. Develop Academic Student Success Summits and other programming that will promote
professional development
2. Create and develop print and electronic resources to support faculty
Objective 2: Attract, develop, retain, and reward a diverse workforce through professional
development programs and other opportunities
Action Strategies
1. Post the EMU Code of Ethics in all SSN departments and establish the expectation that
all staff will abide by the code.
2. Develop SSN policy and procedural manuals
Action Steps
a. Each department/area will create policies and procedure manuals
3. Identify ways to keep Student Success Network (SSN) staff energized
Action Steps
a. Create committees to discover ways to energize staff
b. Create webinars and other professional development opportunities
c. Create an internal reward system to acknowledge SSN staff performance
d. Sponsor events and activities outside the work environment
4. Monitor involvement in the external community to determine University return on
investment
Action Steps
a. Compile list of staff involvement in activities and events that bring recognition to
EMU
5. Create a continuous improvement team for SSN
6. Create professional development programs utilizing professional expertise within the
University
Action Steps
a. Identify expertise from faculty, staff and administration within the university and
the local community to create training opportunities for SSN staff
7. Encourage staff educational pursuits and career aspirations
Action Steps
a. Create SSN succession planning for staff
b. Job shadowing opportunities

RSS Holding the Plan Accountable Benchmarks 8
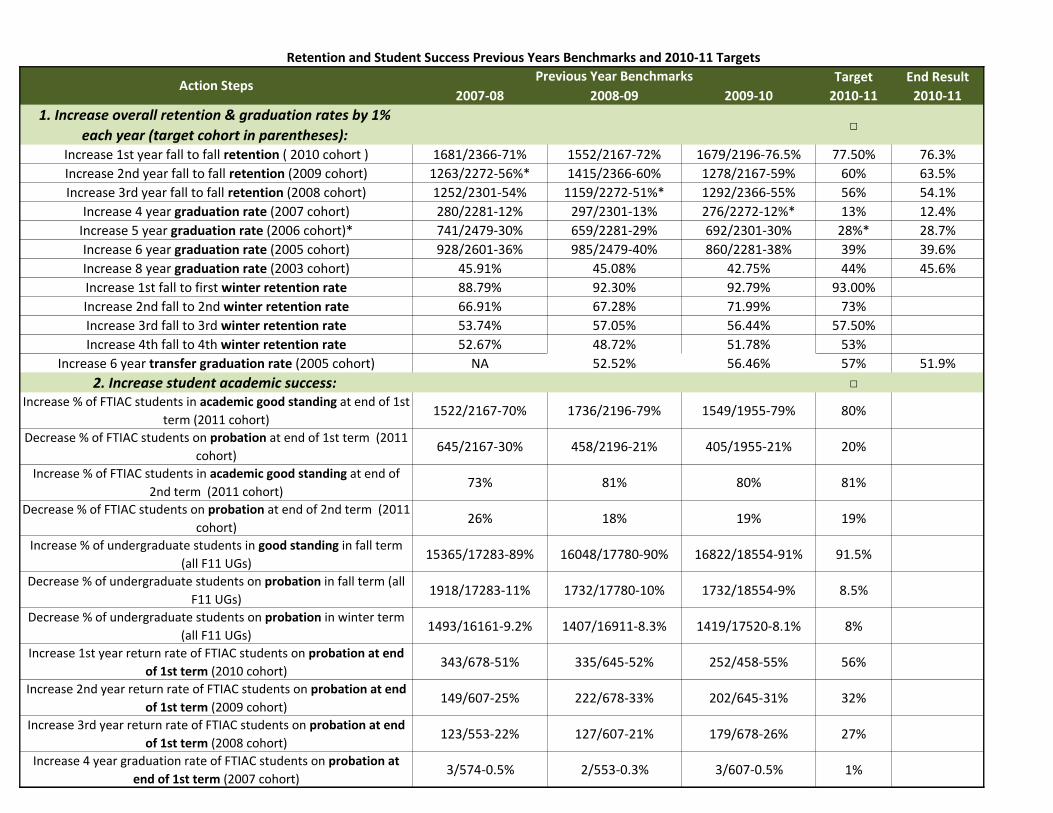
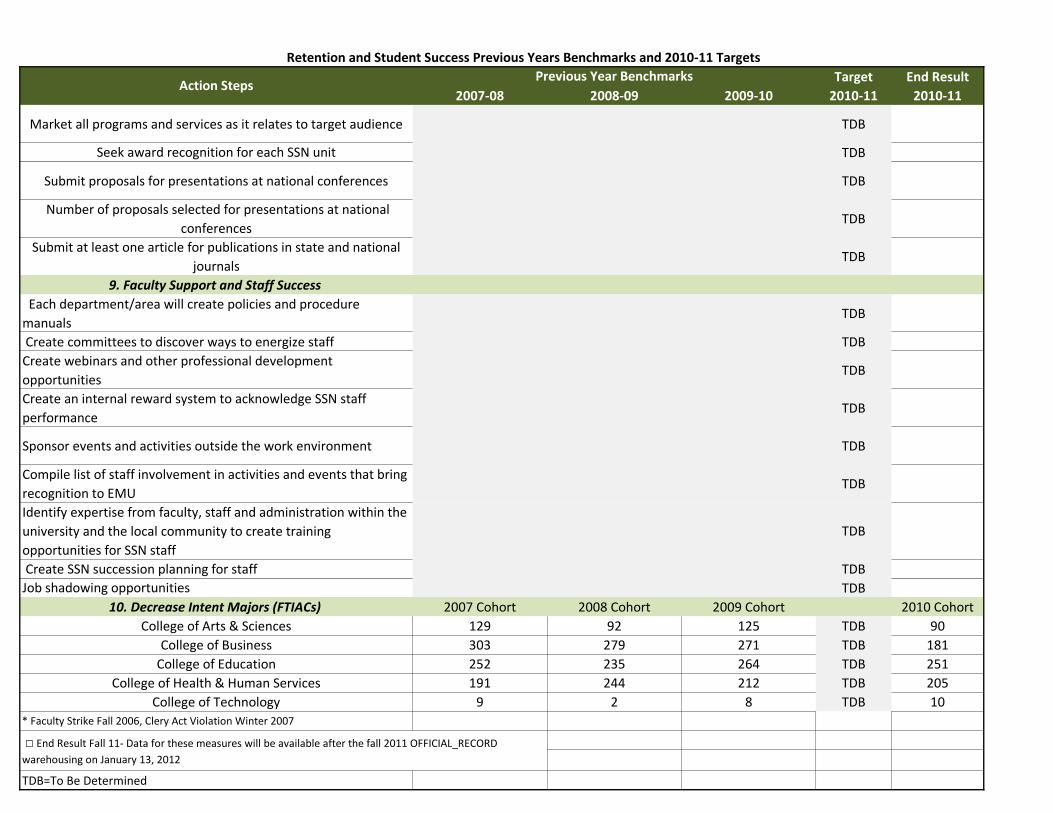
Retention and Student Success Previous Years Benchmarks and 2010-11 Targets
Target End Result
2007-08 2008-09 2009-10 2010-11 2010-11
1. Increase overall retention & graduation rates by 1%
each year (target cohort in parentheses):□
Increase 1st year fall to fall retention ( 2010 cohort ) 1681/2366-71% 1552/2167-72% 1679/2196-76.5% 77.50% 76.3%
Increase 2nd year fall to fall retention (2009 cohort) 1263/2272-56%* 1415/2366-60% 1278/2167-59% 60% 63.5%
Increase 3rd year fall to fall retention (2008 cohort) 1252/2301-54% 1159/2272-51%* 1292/2366-55% 56% 54.1%
Increase 4 year graduation rate (2007 cohort) 280/2281-12% 297/2301-13% 276/2272-12%* 13% 12.4%
Increase 5 year graduation rate (2006 cohort)* 741/2479-30% 659/2281-29% 692/2301-30% 28%* 28.7%
Increase 6 year graduation rate (2005 cohort) 928/2601-36% 985/2479-40% 860/2281-38% 39% 39.6%
Increase 8 year graduation rate (2003 cohort) 45.91% 45.08% 42.75% 44% 45.6%
Increase 1st fall to first winter retention rate 88.79% 92.30% 92.79% 93.00%
Increase 2nd fall to 2nd winter retention rate 66.91% 67.28% 71.99% 73%
Increase 3rd fall to 3rd winter retention rate 53.74% 57.05% 56.44% 57.50%
Increase 4th fall to 4th winter retention rate 52.67% 48.72% 51.78% 53%
Increase 6 year transfer graduation rate (2005 cohort) NA 52.52% 56.46% 57% 51.9%
2. Increase student academic success: □
Increase % of FTIAC students in academic good standing at end of 1st
term (2011 cohort)1522/2167-70% 1736/2196-79% 1549/1955-79% 80%
Decrease % of FTIAC students on probation at end of 1st term (2011
cohort)645/2167-30% 458/2196-21% 405/1955-21% 20%
Increase % of FTIAC students in academic good standing at end of
2nd term (2011 cohort)73% 81% 80% 81%
Decrease % of FTIAC students on probation at end of 2nd term (2011
cohort)26% 18% 19% 19%
Increase % of undergraduate students in good standing in fall term
(all F11 UGs)15365/17283-89% 16048/17780-90% 16822/18554-91% 91.5%
Decrease % of undergraduate students on probation in fall term (all
F11 UGs)1918/17283-11% 1732/17780-10% 1732/18554-9% 8.5%
Decrease % of undergraduate students on probation in winter term
(all F11 UGs)1493/16161-9.2% 1407/16911-8.3% 1419/17520-8.1% 8%
Increase 1st year return rate of FTIAC students on probation at end
of 1st term (2010 cohort)343/678-51% 335/645-52% 252/458-55% 56%
Increase 2nd year return rate of FTIAC students on probation at end
of 1st term (2009 cohort)149/607-25% 222/678-33% 202/645-31% 32%
Increase 3rd year return rate of FTIAC students on probation at end
of 1st term (2008 cohort)123/553-22% 127/607-21% 179/678-26% 27%
Increase 4 year graduation rate of FTIAC students on probation at
end of 1st term (2007 cohort)3/574-0.5% 2/553-0.3% 3/607-0.5% 1%
Action StepsPrevious Year Benchmarks
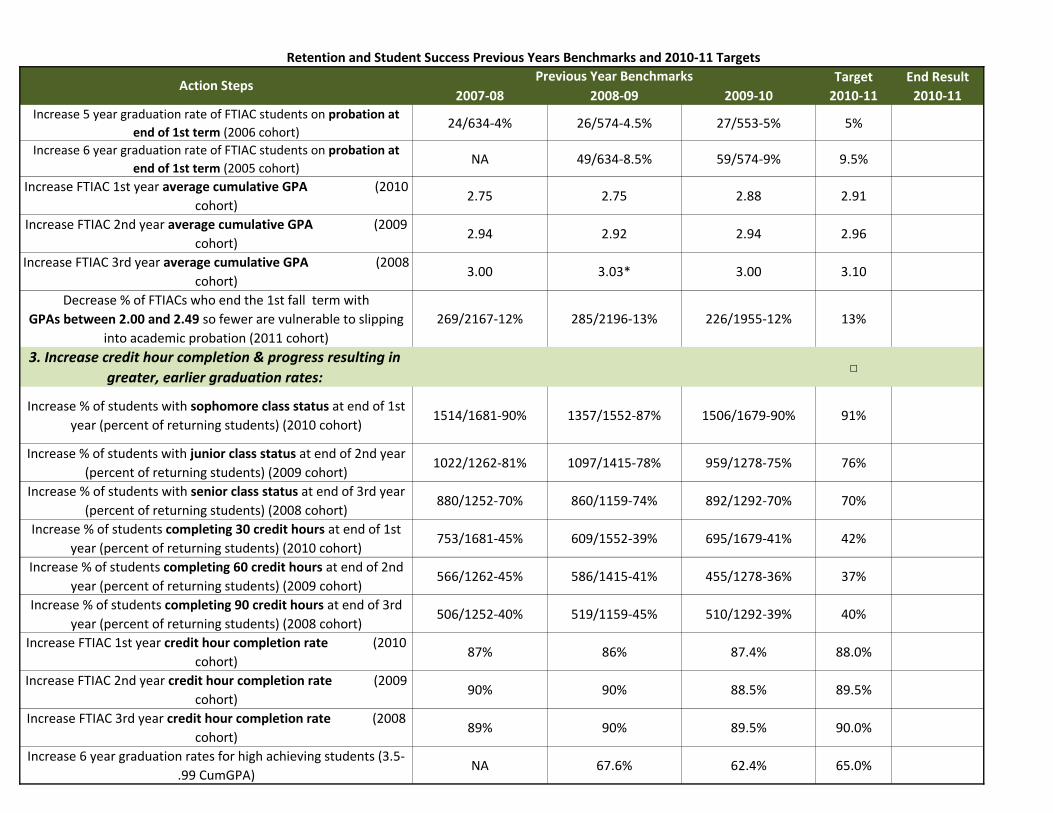
Retention and Student Success Previous Years Benchmarks and 2010-11 Targets
Target End Result
2007-08 2008-09 2009-10 2010-11 2010-11Action Steps
Previous Year Benchmarks
Increase 5 year graduation rate of FTIAC students on probation at
end of 1st term (2006 cohort)24/634-4% 26/574-4.5% 27/553-5% 5%
Increase 6 year graduation rate of FTIAC students on probation at
end of 1st term (2005 cohort)NA 49/634-8.5% 59/574-9% 9.5%
Increase FTIAC 1st year average cumulative GPA (2010
cohort)2.75 2.75 2.88 2.91
Increase FTIAC 2nd year average cumulative GPA (2009
cohort)2.94 2.92 2.94 2.96
Increase FTIAC 3rd year average cumulative GPA (2008
cohort)3.00 3.03* 3.00 3.10
Decrease % of FTIACs who end the 1st fall term with
GPAs between 2.00 and 2.49 so fewer are vulnerable to slipping
into academic probation (2011 cohort)
269/2167-12% 285/2196-13% 226/1955-12% 13%
3. Increase credit hour completion & progress resulting in
greater, earlier graduation rates:□
Increase % of students with sophomore class status at end of 1st
year (percent of returning students) (2010 cohort)1514/1681-90% 1357/1552-87% 1506/1679-90% 91%
Increase % of students with junior class status at end of 2nd year
(percent of returning students) (2009 cohort)1022/1262-81% 1097/1415-78% 959/1278-75% 76%
Increase % of students with senior class status at end of 3rd year
(percent of returning students) (2008 cohort)880/1252-70% 860/1159-74% 892/1292-70% 70%
Increase % of students completing 30 credit hours at end of 1st
year (percent of returning students) (2010 cohort)753/1681-45% 609/1552-39% 695/1679-41% 42%
Increase % of students completing 60 credit hours at end of 2nd
year (percent of returning students) (2009 cohort)566/1262-45% 586/1415-41% 455/1278-36% 37%
Increase % of students completing 90 credit hours at end of 3rd
year (percent of returning students) (2008 cohort)506/1252-40% 519/1159-45% 510/1292-39% 40%
Increase FTIAC 1st year credit hour completion rate (2010
cohort)87% 86% 87.4% 88.0%
Increase FTIAC 2nd year credit hour completion rate (2009
cohort)90% 90% 88.5% 89.5%
Increase FTIAC 3rd year credit hour completion rate (2008
cohort)89% 90% 89.5% 90.0%
Increase 6 year graduation rates for high achieving students (3.5-
.99 CumGPA)NA 67.6% 62.4% 65.0%
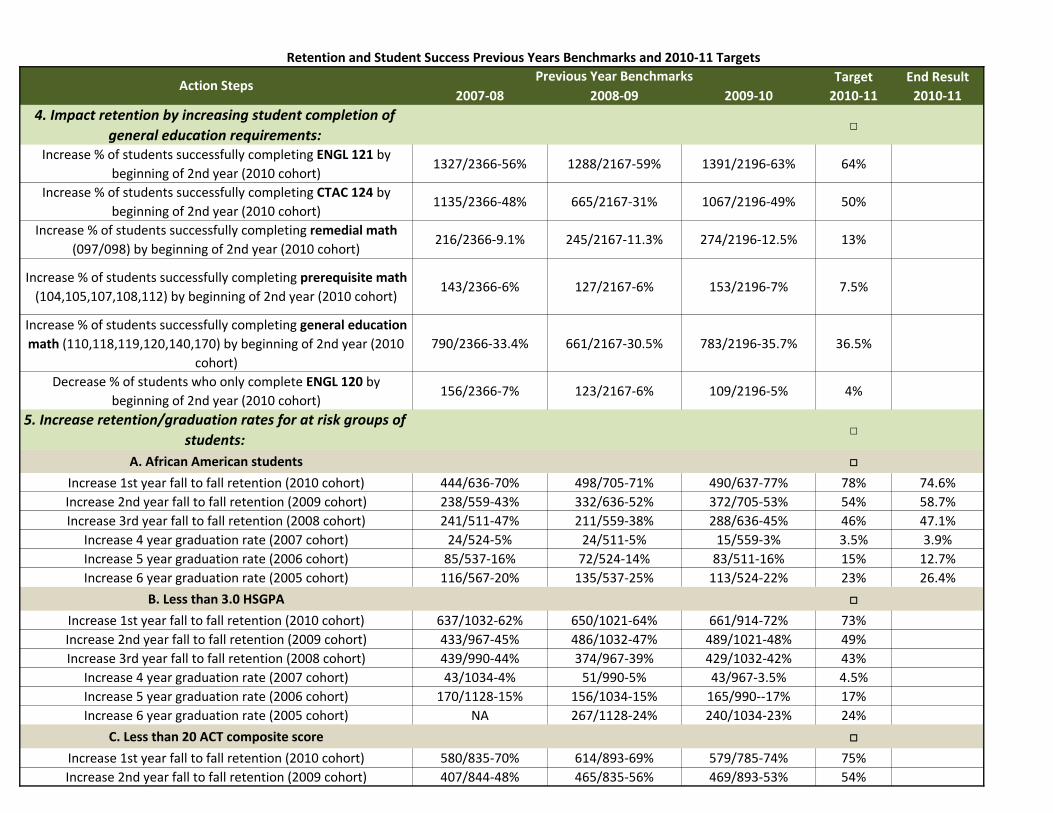
Retention and Student Success Previous Years Benchmarks and 2010-11 Targets
Target End Result
2007-08 2008-09 2009-10 2010-11 2010-11Action Steps
Previous Year Benchmarks
4. Impact retention by increasing student completion of
general education requirements:□
Increase % of students successfully completing ENGL 121 by
beginning of 2nd year (2010 cohort)1327/2366-56% 1288/2167-59% 1391/2196-63% 64%
Increase % of students successfully completing CTAC 124 by
beginning of 2nd year (2010 cohort)1135/2366-48% 665/2167-31% 1067/2196-49% 50%
Increase % of students successfully completing remedial math
(097/098) by beginning of 2nd year (2010 cohort)216/2366-9.1% 245/2167-11.3% 274/2196-12.5% 13%
Increase % of students successfully completing prerequisite math
(104,105,107,108,112) by beginning of 2nd year (2010 cohort)143/2366-6% 127/2167-6% 153/2196-7% 7.5%
Increase % of students successfully completing general education
math (110,118,119,120,140,170) by beginning of 2nd year (2010
cohort)
790/2366-33.4% 661/2167-30.5% 783/2196-35.7% 36.5%
Decrease % of students who only complete ENGL 120 by
beginning of 2nd year (2010 cohort)156/2366-7% 123/2167-6% 109/2196-5% 4%
5. Increase retention/graduation rates for at risk groups of
students:□
A. African American students □
Increase 1st year fall to fall retention (2010 cohort) 444/636-70% 498/705-71% 490/637-77% 78% 74.6%
Increase 2nd year fall to fall retention (2009 cohort) 238/559-43% 332/636-52% 372/705-53% 54% 58.7%
Increase 3rd year fall to fall retention (2008 cohort) 241/511-47% 211/559-38% 288/636-45% 46% 47.1%
Increase 4 year graduation rate (2007 cohort) 24/524-5% 24/511-5% 15/559-3% 3.5% 3.9%
Increase 5 year graduation rate (2006 cohort) 85/537-16% 72/524-14% 83/511-16% 15% 12.7%
Increase 6 year graduation rate (2005 cohort) 116/567-20% 135/537-25% 113/524-22% 23% 26.4%
B. Less than 3.0 HSGPA □
Increase 1st year fall to fall retention (2010 cohort) 637/1032-62% 650/1021-64% 661/914-72% 73%
Increase 2nd year fall to fall retention (2009 cohort) 433/967-45% 486/1032-47% 489/1021-48% 49%
Increase 3rd year fall to fall retention (2008 cohort) 439/990-44% 374/967-39% 429/1032-42% 43%
Increase 4 year graduation rate (2007 cohort) 43/1034-4% 51/990-5% 43/967-3.5% 4.5%
Increase 5 year graduation rate (2006 cohort) 170/1128-15% 156/1034-15% 165/990--17% 17%
Increase 6 year graduation rate (2005 cohort) NA 267/1128-24% 240/1034-23% 24%
C. Less than 20 ACT composite score □
Increase 1st year fall to fall retention (2010 cohort) 580/835-70% 614/893-69% 579/785-74% 75%
Increase 2nd year fall to fall retention (2009 cohort) 407/844-48% 465/835-56% 469/893-53% 54%
Retention and Student Success Previous Years Benchmarks and 2010-11 Targets
Target End Result
2007-08 2008-09 2009-10 2010-11 2010-11Action Steps
Previous Year Benchmarks
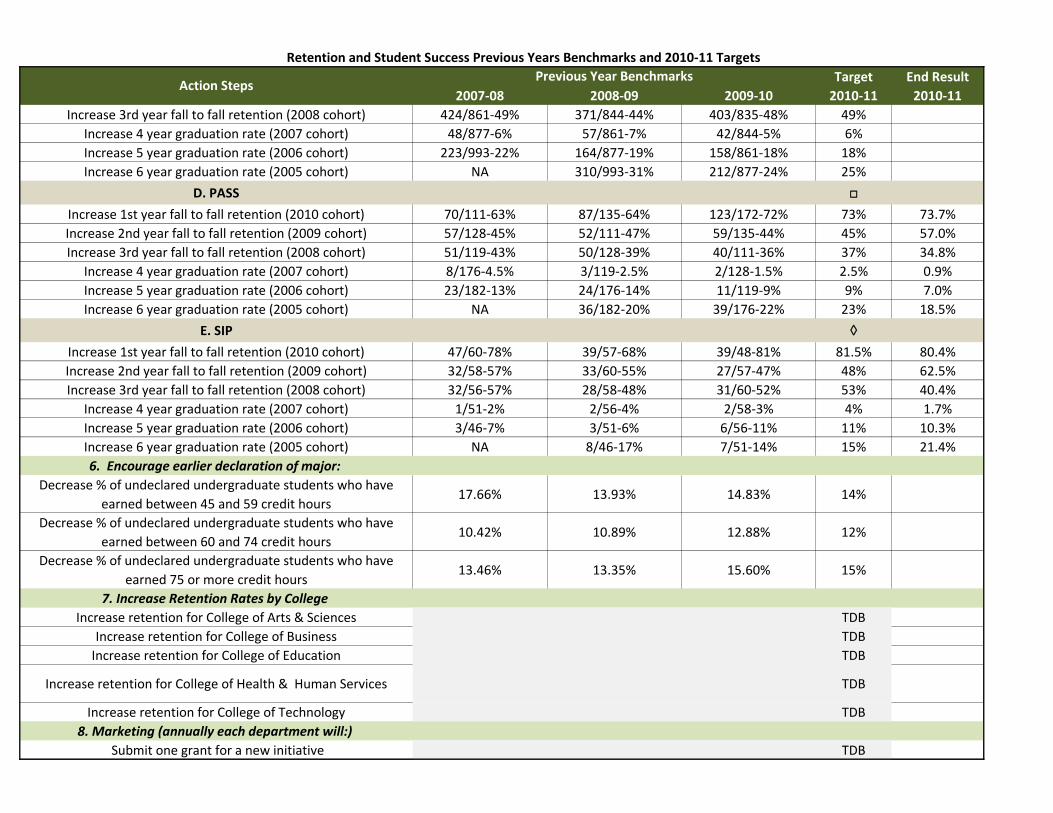
Increase 3rd year fall to fall retention (2008 cohort) 424/861-49% 371/844-44% 403/835-48% 49%
Increase 4 year graduation rate (2007 cohort) 48/877-6% 57/861-7% 42/844-5% 6%
Increase 5 year graduation rate (2006 cohort) 223/993-22% 164/877-19% 158/861-18% 18%
Increase 6 year graduation rate (2005 cohort) NA 310/993-31% 212/877-24% 25%
D. PASS □
Increase 1st year fall to fall retention (2010 cohort) 70/111-63% 87/135-64% 123/172-72% 73% 73.7%
Increase 2nd year fall to fall retention (2009 cohort) 57/128-45% 52/111-47% 59/135-44% 45% 57.0%
Increase 3rd year fall to fall retention (2008 cohort) 51/119-43% 50/128-39% 40/111-36% 37% 34.8%
Increase 4 year graduation rate (2007 cohort) 8/176-4.5% 3/119-2.5% 2/128-1.5% 2.5% 0.9%
Increase 5 year graduation rate (2006 cohort) 23/182-13% 24/176-14% 11/119-9% 9% 7.0%
Increase 6 year graduation rate (2005 cohort) NA 36/182-20% 39/176-22% 23% 18.5%
E. SIP ◊
Increase 1st year fall to fall retention (2010 cohort) 47/60-78% 39/57-68% 39/48-81% 81.5% 80.4%
Increase 2nd year fall to fall retention (2009 cohort) 32/58-57% 33/60-55% 27/57-47% 48% 62.5%
Increase 3rd year fall to fall retention (2008 cohort) 32/56-57% 28/58-48% 31/60-52% 53% 40.4%
Increase 4 year graduation rate (2007 cohort) 1/51-2% 2/56-4% 2/58-3% 4% 1.7%
Increase 5 year graduation rate (2006 cohort) 3/46-7% 3/51-6% 6/56-11% 11% 10.3%
Increase 6 year graduation rate (2005 cohort) NA 8/46-17% 7/51-14% 15% 21.4%
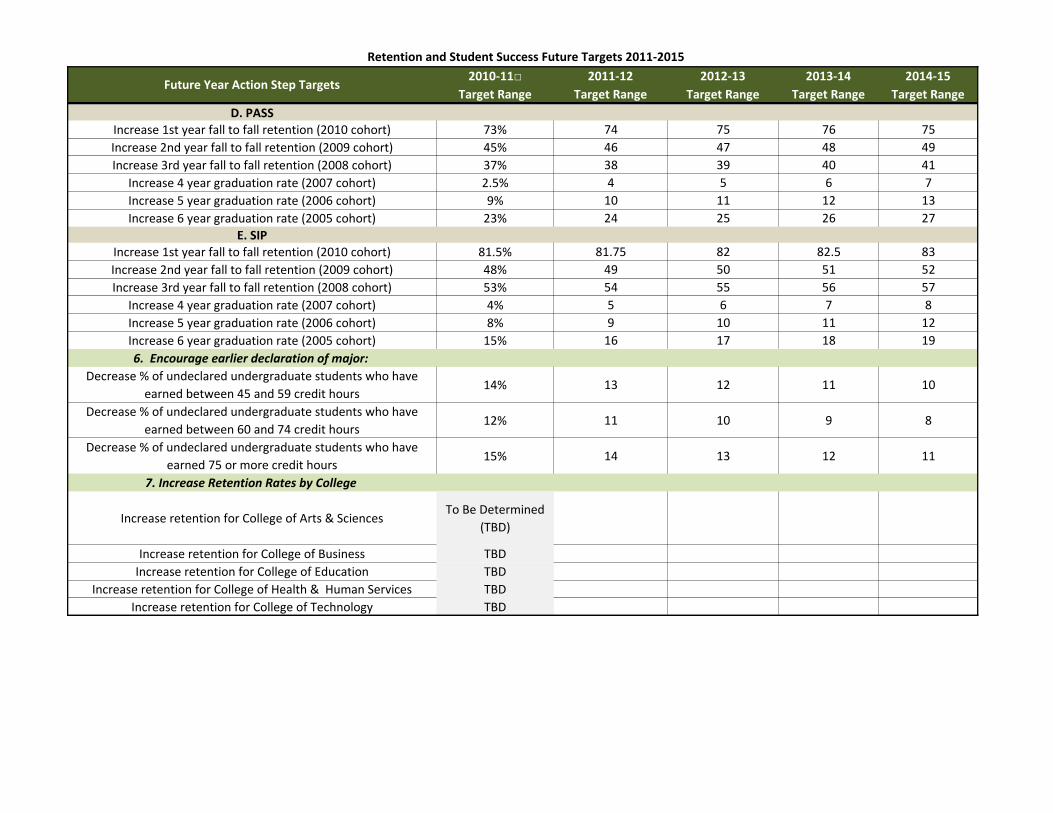
6. Encourage earlier declaration of major:
Decrease % of undeclared undergraduate students who have
earned between 45 and 59 credit hours17.66% 13.93% 14.83% 14%
Decrease % of undeclared undergraduate students who have
earned between 60 and 74 credit hours10.42% 10.89% 12.88% 12%
Decrease % of undeclared undergraduate students who have
earned 75 or more credit hours13.46% 13.35% 15.60% 15%
7. Increase Retention Rates by College
Increase retention for College of Arts & Sciences TDB
Increase retention for College of Business TDB
Increase retention for College of Education TDB
Increase retention for College of Health & Human Services TDB
Increase retention for College of Technology TDB
8. Marketing (annually each department will:)
Submit one grant for a new initiative TDB
Retention and Student Success Previous Years Benchmarks and 2010-11 Targets
Target End Result
2007-08 2008-09 2009-10 2010-11 2010-11Action Steps
Previous Year Benchmarks
Market all programs and services as it relates to target audience TDB
Seek award recognition for each SSN unit TDB
Submit proposals for presentations at national conferences TDB
Number of proposals selected for presentations at national
conferencesTDB
Submit at least one article for publications in state and national
journalsTDB
9. Faculty Support and Staff Success
Each department/area will create policies and procedure
manualsTDB
Create committees to discover ways to energize staff TDB
Create webinars and other professional development
opportunitiesTDB
Create an internal reward system to acknowledge SSN staff
performanceTDB
Sponsor events and activities outside the work environment TDB
Compile list of staff involvement in activities and events that bring
recognition to EMUTDB
Identify expertise from faculty, staff and administration within the
university and the local community to create training
opportunities for SSN staff
TDB
Create SSN succession planning for staff TDB
Job shadowing opportunities TDB
10. Decrease Intent Majors (FTIACs) 2007 Cohort 2008 Cohort 2009 Cohort 2010 Cohort
College of Arts & Sciences 129 92 125 TDB 90
College of Business 303 279 271 TDB 181
College of Education 252 235 264 TDB 251
College of Health & Human Services 191 244 212 TDB 205
College of Technology 9 2 8 TDB 10
* Faculty Strike Fall 2006, Clery Act Violation Winter 2007
TDB=To Be Determined
□ End Result Fall 11- Data for these measures will be available after the fall 2011 OFFICIAL_RECORD
warehousing on January 13, 2012

RSS Holding the Plan Accountable Future Targets 9
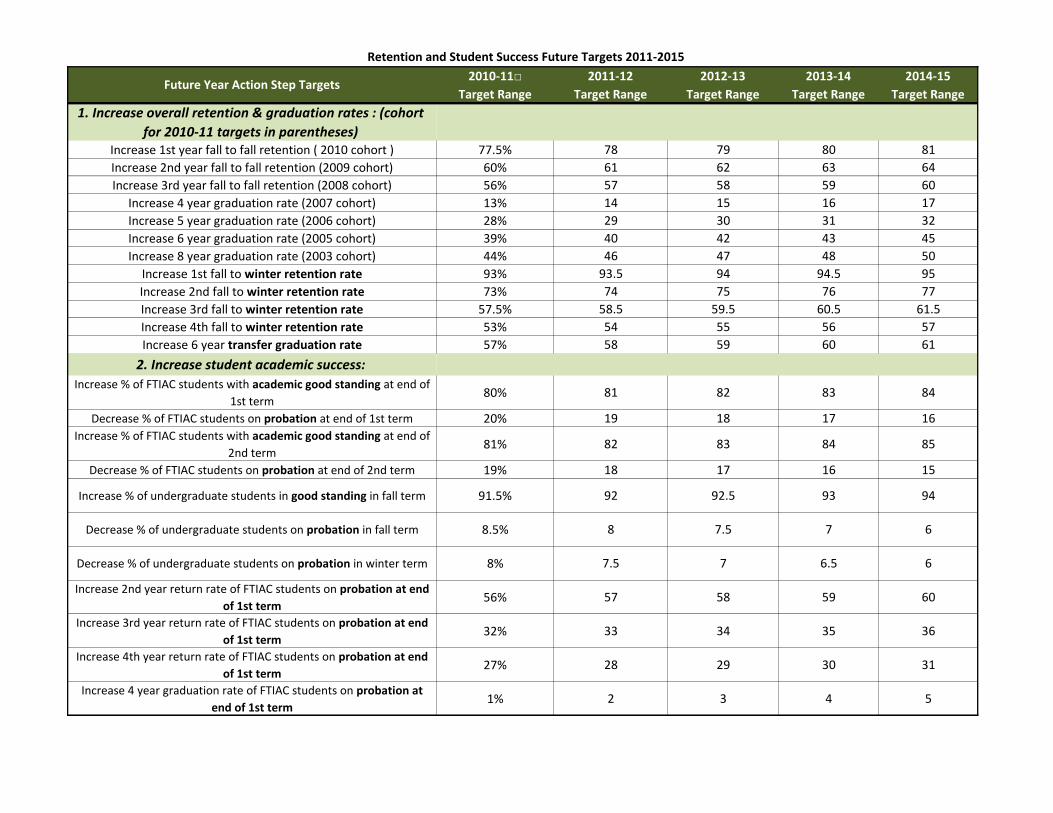
Retention and Student Success Future Targets 2011-2015
2010-11□ 2011-12 2012-13 2013-14 2014-15
Target Range Target Range Target Range Target Range Target Range
1. Increase overall retention & graduation rates : (cohort
for 2010-11 targets in parentheses)Increase 1st year fall to fall retention ( 2010 cohort ) 77.5% 78 79 80 81
Increase 2nd year fall to fall retention (2009 cohort) 60% 61 62 63 64
Increase 3rd year fall to fall retention (2008 cohort) 56% 57 58 59 60
Increase 4 year graduation rate (2007 cohort) 13% 14 15 16 17
Increase 5 year graduation rate (2006 cohort) 28% 29 30 31 32
Increase 6 year graduation rate (2005 cohort) 39% 40 42 43 45
Increase 8 year graduation rate (2003 cohort) 44% 46 47 48 50
Increase 1st fall to winter retention rate 93% 93.5 94 94.5 95
Increase 2nd fall to winter retention rate 73% 74 75 76 77
Increase 3rd fall to winter retention rate 57.5% 58.5 59.5 60.5 61.5
Increase 4th fall to winter retention rate 53% 54 55 56 57
Increase 6 year transfer graduation rate 57% 58 59 60 61
2. Increase student academic success:
Increase % of FTIAC students with academic good standing at end of
1st term 80% 81 82 83 84
Decrease % of FTIAC students on probation at end of 1st term 20% 19 18 17 16
Increase % of FTIAC students with academic good standing at end of
2nd term 81% 82 83 84 85
Decrease % of FTIAC students on probation at end of 2nd term 19% 18 17 16 15
Increase % of undergraduate students in good standing in fall term 91.5% 92 92.5 93 94
Decrease % of undergraduate students on probation in fall term 8.5% 8 7.5 7 6
Decrease % of undergraduate students on probation in winter term 8% 7.5 7 6.5 6
Increase 2nd year return rate of FTIAC students on probation at end
of 1st term 56% 57 58 59 60
Increase 3rd year return rate of FTIAC students on probation at end
of 1st term 32% 33 34 35 36
Increase 4th year return rate of FTIAC students on probation at end
of 1st term 27% 28 29 30 31
Increase 4 year graduation rate of FTIAC students on probation at
end of 1st term 1% 2 3 4 5
Future Year Action Step Targets
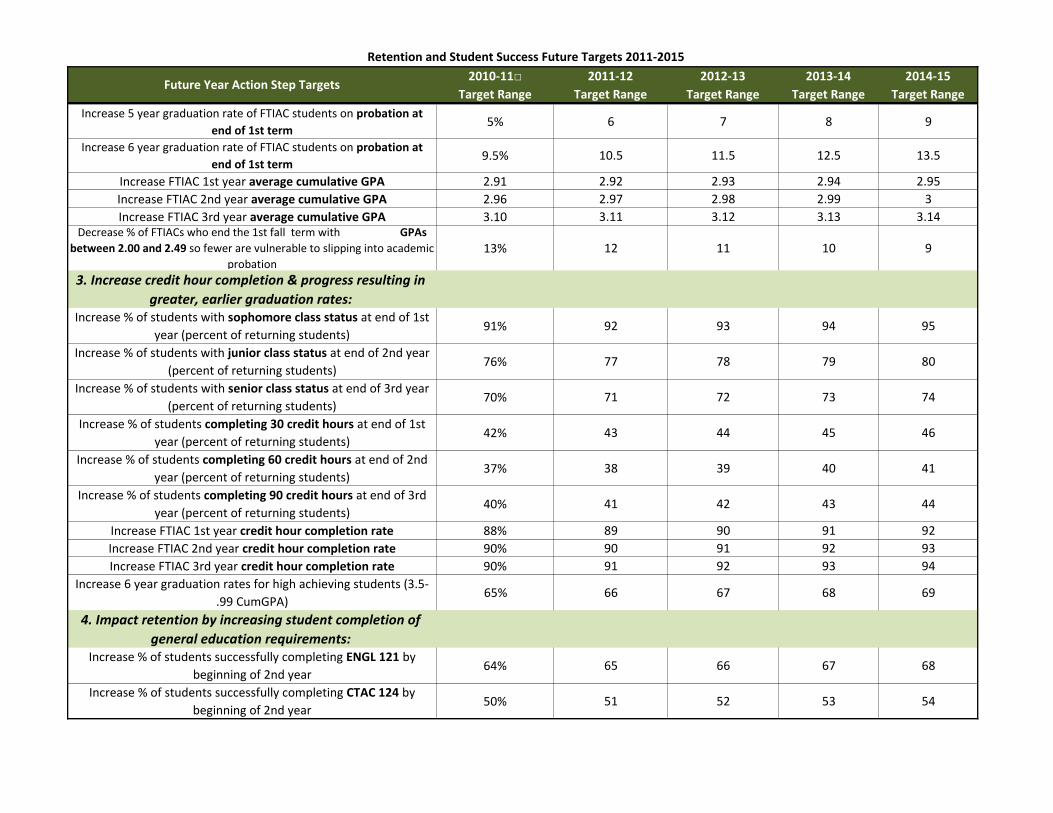
Retention and Student Success Future Targets 2011-2015
2010-11□ 2011-12 2012-13 2013-14 2014-15
Target Range Target Range Target Range Target Range Target RangeFuture Year Action Step Targets
Increase 5 year graduation rate of FTIAC students on probation at
end of 1st term 5% 6 7 8 9
Increase 6 year graduation rate of FTIAC students on probation at
end of 1st term 9.5% 10.5 11.5 12.5 13.5
Increase FTIAC 1st year average cumulative GPA 2.91 2.92 2.93 2.94 2.95
Increase FTIAC 2nd year average cumulative GPA 2.96 2.97 2.98 2.99 3
Increase FTIAC 3rd year average cumulative GPA 3.10 3.11 3.12 3.13 3.14Decrease % of FTIACs who end the 1st fall term with GPAs
between 2.00 and 2.49 so fewer are vulnerable to slipping into academic
probation
13% 12 11 10 9
3. Increase credit hour completion & progress resulting in
greater, earlier graduation rates:Increase % of students with sophomore class status at end of 1st
year (percent of returning students) 91% 92 93 94 95
Increase % of students with junior class status at end of 2nd year
(percent of returning students) 76% 77 78 79 80
Increase % of students with senior class status at end of 3rd year
(percent of returning students) 70% 71 72 73 74
Increase % of students completing 30 credit hours at end of 1st
year (percent of returning students) 42% 43 44 45 46
Increase % of students completing 60 credit hours at end of 2nd
year (percent of returning students)37% 38 39 40 41
Increase % of students completing 90 credit hours at end of 3rd
year (percent of returning students) 40% 41 42 43 44
Increase FTIAC 1st year credit hour completion rate 88% 89 90 91 92
Increase FTIAC 2nd year credit hour completion rate 90% 90 91 92 93
Increase FTIAC 3rd year credit hour completion rate 90% 91 92 93 94
Increase 6 year graduation rates for high achieving students (3.5-
.99 CumGPA)65% 66 67 68 69
4. Impact retention by increasing student completion of
general education requirements:Increase % of students successfully completing ENGL 121 by
beginning of 2nd year 64% 65 66 67 68
Increase % of students successfully completing CTAC 124 by
beginning of 2nd year 50% 51 52 53 54
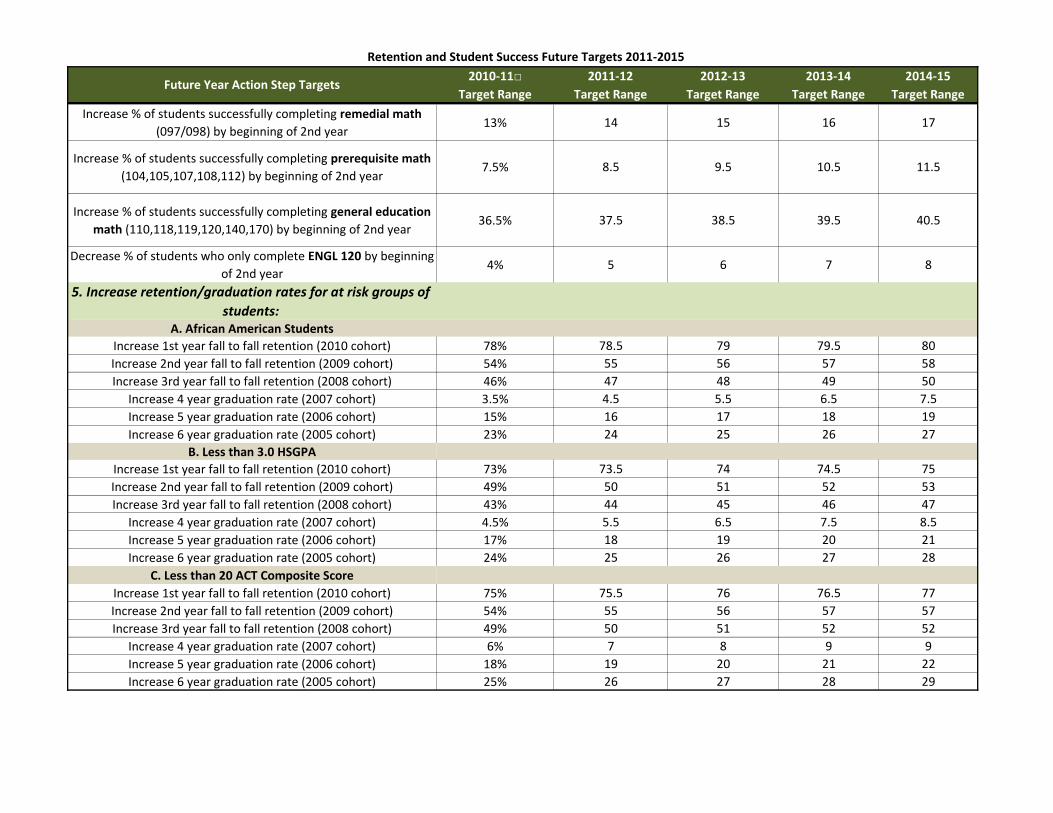
Retention and Student Success Future Targets 2011-2015
2010-11□ 2011-12 2012-13 2013-14 2014-15
Target Range Target Range Target Range Target Range Target RangeFuture Year Action Step Targets
Increase % of students successfully completing remedial math
(097/098) by beginning of 2nd year 13% 14 15 16 17
Increase % of students successfully completing prerequisite math
(104,105,107,108,112) by beginning of 2nd year 7.5% 8.5 9.5 10.5 11.5
Increase % of students successfully completing general education
math (110,118,119,120,140,170) by beginning of 2nd year 36.5% 37.5 38.5 39.5 40.5
Decrease % of students who only complete ENGL 120 by beginning
of 2nd year 4% 5 6 7 8
5. Increase retention/graduation rates for at risk groups of
students:A. African American Students
Increase 1st year fall to fall retention (2010 cohort) 78% 78.5 79 79.5 80
Increase 2nd year fall to fall retention (2009 cohort) 54% 55 56 57 58
Increase 3rd year fall to fall retention (2008 cohort) 46% 47 48 49 50
Increase 4 year graduation rate (2007 cohort) 3.5% 4.5 5.5 6.5 7.5
Increase 5 year graduation rate (2006 cohort) 15% 16 17 18 19
Increase 6 year graduation rate (2005 cohort) 23% 24 25 26 27
B. Less than 3.0 HSGPA
Increase 1st year fall to fall retention (2010 cohort) 73% 73.5 74 74.5 75
Increase 2nd year fall to fall retention (2009 cohort) 49% 50 51 52 53
Increase 3rd year fall to fall retention (2008 cohort) 43% 44 45 46 47
Increase 4 year graduation rate (2007 cohort) 4.5% 5.5 6.5 7.5 8.5
Increase 5 year graduation rate (2006 cohort) 17% 18 19 20 21
Increase 6 year graduation rate (2005 cohort) 24% 25 26 27 28
C. Less than 20 ACT Composite Score
Increase 1st year fall to fall retention (2010 cohort) 75% 75.5 76 76.5 77
Increase 2nd year fall to fall retention (2009 cohort) 54% 55 56 57 57
Increase 3rd year fall to fall retention (2008 cohort) 49% 50 51 52 52
Increase 4 year graduation rate (2007 cohort) 6% 7 8 9 9
Increase 5 year graduation rate (2006 cohort) 18% 19 20 21 22
Increase 6 year graduation rate (2005 cohort) 25% 26 27 28 29
Retention and Student Success Future Targets 2011-2015
2010-11□ 2011-12 2012-13 2013-14 2014-15
Target Range Target Range Target Range Target Range Target RangeFuture Year Action Step Targets
D. PASS
Increase 1st year fall to fall retention (2010 cohort) 73% 74 75 76 75
Increase 2nd year fall to fall retention (2009 cohort) 45% 46 47 48 49
Increase 3rd year fall to fall retention (2008 cohort) 37% 38 39 40 41
Increase 4 year graduation rate (2007 cohort) 2.5% 4 5 6 7
Increase 5 year graduation rate (2006 cohort) 9% 10 11 12 13
Increase 6 year graduation rate (2005 cohort) 23% 24 25 26 27
E. SIP
Increase 1st year fall to fall retention (2010 cohort) 81.5% 81.75 82 82.5 83
Increase 2nd year fall to fall retention (2009 cohort) 48% 49 50 51 52
Increase 3rd year fall to fall retention (2008 cohort) 53% 54 55 56 57
Increase 4 year graduation rate (2007 cohort) 4% 5 6 7 8
Increase 5 year graduation rate (2006 cohort) 8% 9 10 11 12
Increase 6 year graduation rate (2005 cohort) 15% 16 17 18 19
6. Encourage earlier declaration of major:
Decrease % of undeclared undergraduate students who have
earned between 45 and 59 credit hours14% 13 12 11 10
Decrease % of undeclared undergraduate students who have
earned between 60 and 74 credit hours12% 11 10 9 8
Decrease % of undeclared undergraduate students who have
earned 75 or more credit hours15% 14 13 12 11
7. Increase Retention Rates by College
Increase retention for College of Arts & SciencesTo Be Determined
(TBD)
Increase retention for College of Business TBD
Increase retention for College of Education TBD
Increase retention for College of Health & Human Services TBD
Increase retention for College of Technology TBD
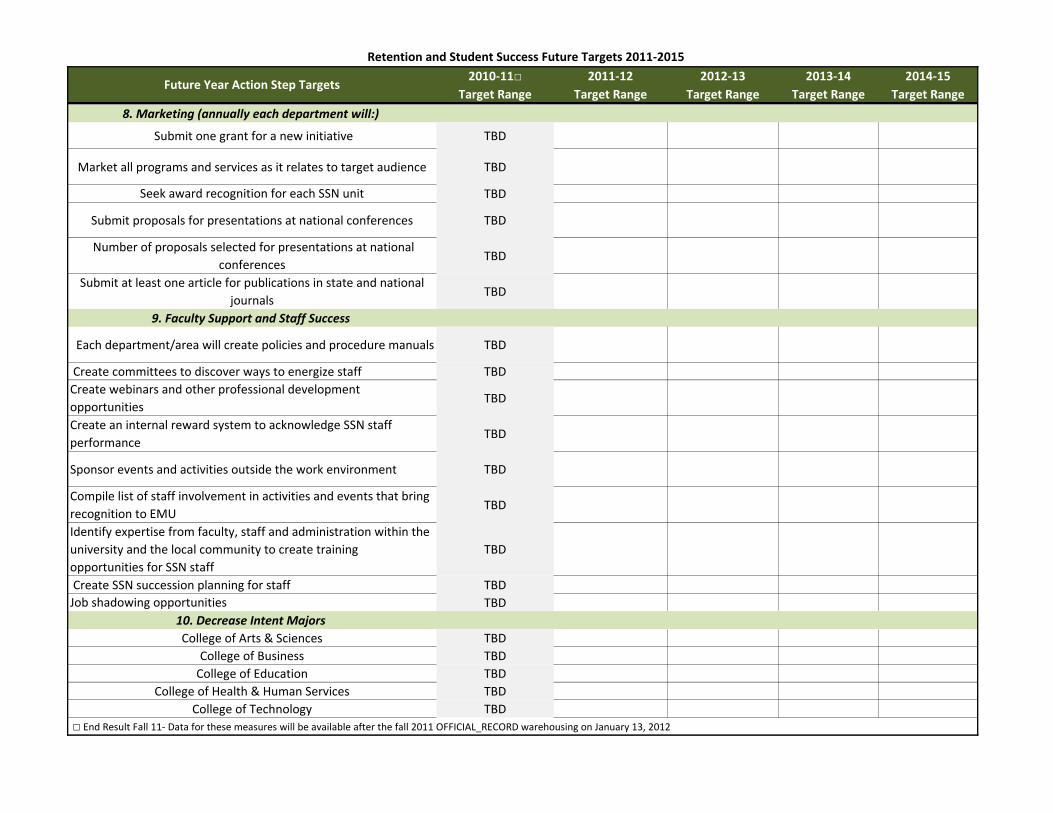
Retention and Student Success Future Targets 2011-2015
2010-11□ 2011-12 2012-13 2013-14 2014-15
Target Range Target Range Target Range Target Range Target RangeFuture Year Action Step Targets
8. Marketing (annually each department will:)
Submit one grant for a new initiative TBD
Market all programs and services as it relates to target audience TBD
Seek award recognition for each SSN unit TBD
Submit proposals for presentations at national conferences TBD
Number of proposals selected for presentations at national
conferencesTBD
Submit at least one article for publications in state and national
journalsTBD
9. Faculty Support and Staff Success
Each department/area will create policies and procedure manuals TBD
Create committees to discover ways to energize staff TBD
Create webinars and other professional development
opportunitiesTBD
Create an internal reward system to acknowledge SSN staff
performanceTBD
Sponsor events and activities outside the work environment TBD
Compile list of staff involvement in activities and events that bring
recognition to EMUTBD
Identify expertise from faculty, staff and administration within the
university and the local community to create training
opportunities for SSN staff
TBD
Create SSN succession planning for staff TBD
Job shadowing opportunities TBD
10. Decrease Intent Majors
College of Arts & Sciences TBD
College of Business TBD
College of Education TBD
College of Health & Human Services TBD
College of Technology TBD
□ End Result Fall 11- Data for these measures will be available after the fall 2011 OFFICIAL_RECORD warehousing on January 13, 2012

University Advising and Career Development Center (UACDC)
Plan in Action
10
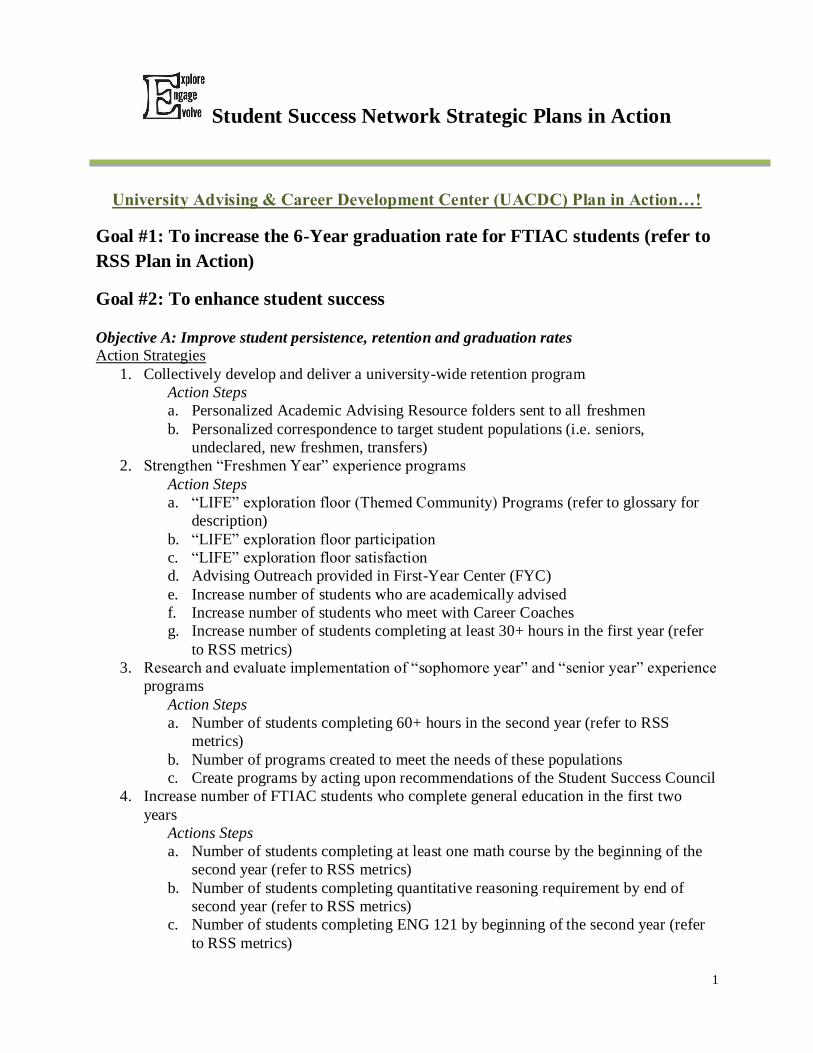
1
Student Success Network Strategic Plans in Action
University Advising & Career Development Center (UACDC) Plan in Action…!
Goal #1: To increase the 6-Year graduation rate for FTIAC students (refer to
RSS Plan in Action)
Goal #2: To enhance student success
Objective A: Improve student persistence, retention and graduation rates
Action Strategies
1. Collectively develop and deliver a university-wide retention program
Action Steps
a. Personalized Academic Advising Resource folders sent to all freshmen
b. Personalized correspondence to target student populations (i.e. seniors,
undeclared, new freshmen, transfers)
2. Strengthen “Freshmen Year” experience programs
Action Steps
a. “LIFE” exploration floor (Themed Community) Programs (refer to glossary for
description)
b. “LIFE” exploration floor participation
c. “LIFE” exploration floor satisfaction
d. Advising Outreach provided in First-Year Center (FYC)
e. Increase number of students who are academically advised
f. Increase number of students who meet with Career Coaches
g. Increase number of students completing at least 30+ hours in the first year (refer
to RSS metrics)
3. Research and evaluate implementation of “sophomore year” and “senior year” experience
programs
Action Steps
a. Number of students completing 60+ hours in the second year (refer to RSS
metrics)
b. Number of programs created to meet the needs of these populations
c. Create programs by acting upon recommendations of the Student Success Council
4. Increase number of FTIAC students who complete general education in the first two
years
Actions Steps
a. Number of students completing at least one math course by the beginning of the
second year (refer to RSS metrics)
b. Number of students completing quantitative reasoning requirement by end of
second year (refer to RSS metrics)
c. Number of students completing ENG 121 by beginning of the second year (refer
to RSS metrics)
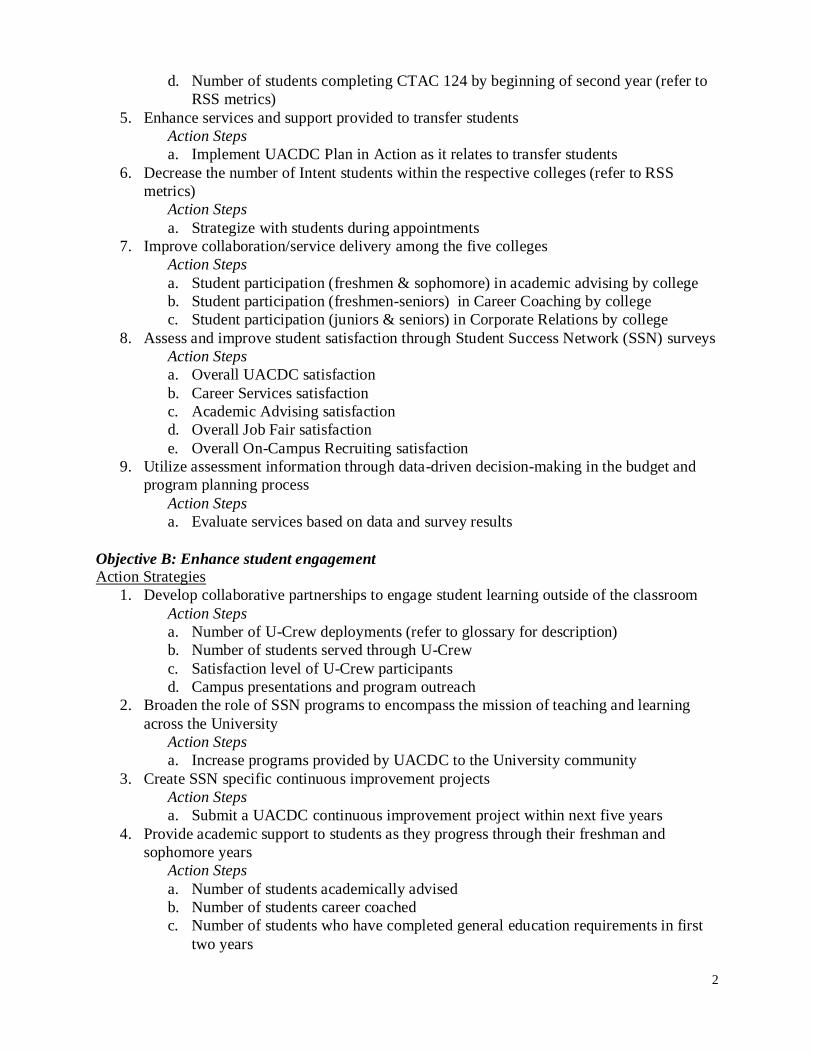
2
d. Number of students completing CTAC 124 by beginning of second year (refer to
RSS metrics)
5. Enhance services and support provided to transfer students
Action Steps
a. Implement UACDC Plan in Action as it relates to transfer students
6. Decrease the number of Intent students within the respective colleges (refer to RSS
metrics)
Action Steps
a. Strategize with students during appointments
7. Improve collaboration/service delivery among the five colleges
Action Steps
a. Student participation (freshmen & sophomore) in academic advising by college
b. Student participation (freshmen-seniors) in Career Coaching by college
c. Student participation (juniors & seniors) in Corporate Relations by college
8. Assess and improve student satisfaction through Student Success Network (SSN) surveys
Action Steps
a. Overall UACDC satisfaction
b. Career Services satisfaction
c. Academic Advising satisfaction
d. Overall Job Fair satisfaction
e. Overall On-Campus Recruiting satisfaction
9. Utilize assessment information through data-driven decision-making in the budget and
program planning process
Action Steps
a. Evaluate services based on data and survey results
Objective B: Enhance student engagement
Action Strategies
1. Develop collaborative partnerships to engage student learning outside of the classroom
Action Steps
a. Number of U-Crew deployments (refer to glossary for description)
b. Number of students served through U-Crew
c. Satisfaction level of U-Crew participants
d. Campus presentations and program outreach
2. Broaden the role of SSN programs to encompass the mission of teaching and learning
across the University
Action Steps
a. Increase programs provided by UACDC to the University community
3. Create SSN specific continuous improvement projects
Action Steps
a. Submit a UACDC continuous improvement project within next five years
4. Provide academic support to students as they progress through their freshman and
sophomore years
Action Steps
a. Number of students academically advised
b. Number of students career coached
c. Number of students who have completed general education requirements in first
two years
3
5. Create sustainable career programs to support students as they progress through their
junior and senior years by increasing:
Action Steps
a. Number of participants at college specific career events
b. Number of Corporate Relations workshops
c. Number of Internship Opportunities available
6. Establish advisory committees for different SSN areas and in collaboration with other
university efforts
Action Steps
a. Establish UACDC Advisory Board
Objective C: Enhance comprehensive support services to targeted populations
Action Strategies
1. Assess and evaluate the expansion of early intervention programs designed to improve
success rates of underprepared and “at-risk” students
Action Steps
a. Total number of letters distributed to undeclared students
b. Total number of Academic Advising appointments to undeclared Students
c. Total number of Career Coaching appointments to undeclared Students
d. Total number of new students (initial meetings)
e. Total number of returning student visits
f. Total number of SIP & PASS student advising appointments
2. Improve and consolidate UACDC processes
Action Steps
a. Overall UACDC satisfaction survey
b. Cross-Training of professional staff
c. Increase the number of group advising sessions
d. Transition to one calendar scheduling system
e. Launch and track number of visits to UACDC website
3. Identify, promote, and implement programs that increase learning opportunities and
experiences within housing in order to enhance the student residence hall experience
Action Steps
a. “LIFE” exploration floor (Themed Community) Programs
b. “LIFE” exploration floor participation
c. “LIFE” exploration floor satisfaction
d. Total number of students served during Advising outreach (Swoop In,
Registration Blitz)
e. Total number of attendees at on-campus events (Fall Major Fest)
Goal #3: To develop and implement programs which have a positive impact
on the number of students on academic probation
Objective A: Annually decrease the number of students on academic probation
Action Strategies
1. Require all students on academic probation to meet with CSAT in order to create an
academic student success plan (not applicable)
2. Place a hold on registration accounts for students who do not meet with CSAT (not
applicable)
4
3. Work with students who need assistance with major and career decision-making
(UACDC)
Action Steps
a. Personalized emails to undecided students
b. Personalized follow-ups to students who met with Career Coaches
Goal #4: To be recognized for service and public engagement
Objective A: Create community partnerships that enhance job placements
Action Strategies
1. Expand opportunities for students to engage in coop/intern, student/alumni job
shadowing experiences by increasing:
Action Steps
a. Total number of internship opportunities available
b. Total number of degree positions available
c. Number of joint programs with Alumni Relations
2. Host business leaders and alumni at sporting and other University events
Action Steps
a. Number of employers hosted at athletic and other university events
3. Improve information flow to alumni and stakeholders
Action Steps
a. Number of alumni involved in career programs
4. Improve tracking of alumni regarding professional experiences, career satisfaction, and
the role EMU played in their career path
Action Steps
a. Number of emails sent to faculty regarding graduate placement outcomes
b. Number of responses from faculty regarding graduate placement outcomes
c. Number of alumni contacts (and alumni in jobs) through social media outlets
d. Establish an alumni contact resource list (through UACDC development and
through Alumni Relations)
5. Provide better information on graduate success in workplace
Action Steps
a. Response rate on alumni survey
b. Placement rate on alumni survey
c. Number of alumni contacts (and alumni in jobs) through social media outlets
Objective B: Develop community relationships with employers, community colleges, high
schools and middle schools
Action Strategies
1. Create relationships with regional employers to expand opportunities for students
Action Steps
a. Increase job and internship opportunities for students in the greater Michigan area
2. Create programs to enhance the transfer student academic experience
Action Steps
a. Number of New Transfer Group Advising/Orientation sessions
b. Number of students who participate in New Transfer Group Advising/Orientation
c. Establish a transfer academic success program
5
3. Pilot programs in middle schools and high schools to increase the student understanding
of the collegiate experience
Action Steps
a. Offer programs to assist with enhancing middle and high school students’
understanding of the university environment as it relates to majors and careers
4. Design support systems to foster teens and orphaned or abandoned teens to transition to
and succeed in college and increase staff and student community service and civic
engagement
Action Steps
a. Offer academic and career advice to above population
5. Have appropriate SSN presence at different campus events and department programs
Action Steps
a. Number of programs provided to student organizations regarding academic and
career advising needs
b. Number of participants in programs provided to student organizations regarding
academic and career advising needs
c. Satisfaction level of participants in programs provided to student organizations
regarding academic and career advising needs
Goal #5: To seek outside funding sources to support student success initiatives
(refer to RSS Plan in Action)
Goal #6: To enhance facilities, technology, infrastructure, and plan effective
space utilization
Objective A: Improve and consolidate in-person and electronic processes and services in all
areas related to the Student Success Network
Action Strategies
1. Use technology to enhance delivery of student services and learning experiences
Action Steps
a. Number of visits to the UACDC Website
b. Number of students using social media related to UACDC
c. Explore use of online chat for advising and career coaching
d. Utilize advisor reports function through GradesFirst
Goal #7: To enhance faculty support and staff success (refer to RSS Plan in
Action)
UACDC Holding the Plan Accountable Benchmarks 11

UACDC Previous Years Benchmarks and 2011-12 Targets
Target End Result
2007-08 2008-09 2009-10 2010-11^ 2011-12 2011-12
Total Number of New Freshman Students Seen 500 - 700
New Freshman Individual Appointments 530 575 520 306 300-400
Students Participating in New Freshman Group Advising 200 - 300
Establish Number of New Freshman Group Advising Events 7 - 10
Total Number of New Transfer Students Seen 2600-3000
New Transfer Individual Appointments 2983 3077 3409 1898 1850 - 2000
Students Participating in New Transfer Group Advising 750 - 1000
Establish Number of New Transfer Group Advising Events 15 - 20
Current Student Appointments 630 758 1242 950 1050 - 1150
Increase 2nd Bachelor Appointments 570 445 599 548 600 - 650
Individualized Studies Program (ISP) Appointments 38^ 100 - 125
SIP/PASS Advising Contacts 200 - 250
Re-enroll Student Visits 284 241 356 313 350 - 400
Total UACDC Advising Walk-In Traffic 4399 4570 5627 7422 7000 - 7500
Total Advising (Appointments + Walk-Ins + Group Advising) 9396 9666 11753 11437 12000 - 13000
Increase Total CAS Student Contacts (Advising) 541^ 1750 - 2000
Increase Total COE Student Contacts (Advising) 147^ 500 -550
Increase Total COB Student Contacts (Advising) 147^ 500 - 550
Increase Total COT Student Contacts (Advising) 97^ 300 - 350
Increase Total CHHS Student Contacts (Advising) 217^ 700 - 750
Increase Total Undecided Students (Advising) 224^ 750 - 800
Major/Minor Changes 2714^ 10000 - 11000
Increase Total Number of Students Served/Supported Through Advising
Outreach (Outside UACDC)1983 3000 - 3500
Increase Academic Advising Satisfaction Level 85 - 90%
Increase Career Coaching Appointments -- Freshman 241 231 347 348 500 - 550
Increase Career Coaching Appointments – Sophomores 402 360 320 384 550 - 600
Increase Career Coaching Appointments – Juniors 915 584 504 615 700 - 750
Increase Career Coaching Appointments – Seniors 1094 840 841 1077 1200 - 1250
Increase Career Coaching Appointments – Graduate 551 552 376 295 400 - 450
Increase Career Coaching Appointments – Alumni 382 405 386 488 525 - 625
Increase Career Coaching Appointments – Other 50-75
Increase Total Career Coaching Appointments 3585 2972 2774 3237 3925 - 4300
Action StepsPrevious Year Benchmarks
Career Coaching
Academic Advising
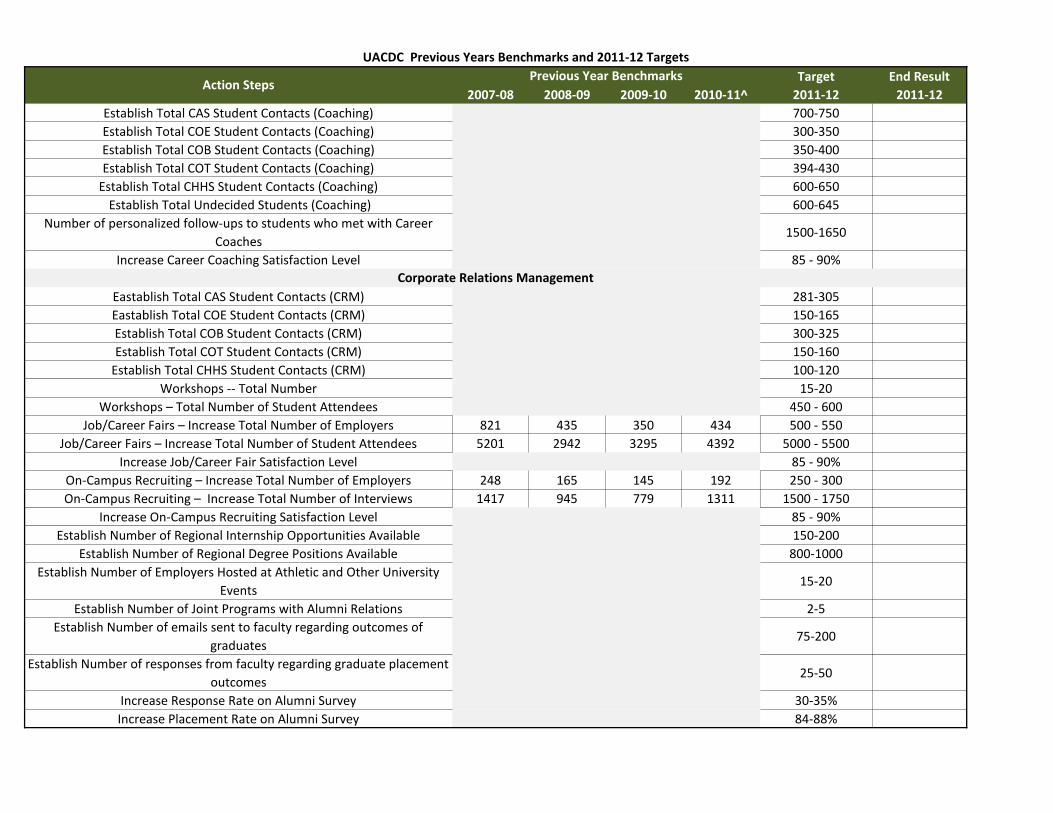
UACDC Previous Years Benchmarks and 2011-12 Targets
Target End Result
2007-08 2008-09 2009-10 2010-11^ 2011-12 2011-12Action Steps
Previous Year Benchmarks
Establish Total CAS Student Contacts (Coaching) 700-750
Establish Total COE Student Contacts (Coaching) 300-350
Establish Total COB Student Contacts (Coaching) 350-400
Establish Total COT Student Contacts (Coaching) 394-430
Establish Total CHHS Student Contacts (Coaching) 600-650
Establish Total Undecided Students (Coaching) 600-645
Number of personalized follow-ups to students who met with Career
Coaches1500-1650
Increase Career Coaching Satisfaction Level 85 - 90%
Eastablish Total CAS Student Contacts (CRM) 281-305
Eastablish Total COE Student Contacts (CRM) 150-165
Establish Total COB Student Contacts (CRM) 300-325
Establish Total COT Student Contacts (CRM) 150-160
Establish Total CHHS Student Contacts (CRM) 100-120
Workshops -- Total Number 15-20
Workshops – Total Number of Student Attendees 450 - 600
Job/Career Fairs – Increase Total Number of Employers 821 435 350 434 500 - 550
Job/Career Fairs – Increase Total Number of Student Attendees 5201 2942 3295 4392 5000 - 5500
Increase Job/Career Fair Satisfaction Level 85 - 90%
On-Campus Recruiting – Increase Total Number of Employers 248 165 145 192 250 - 300
On-Campus Recruiting – Increase Total Number of Interviews 1417 945 779 1311 1500 - 1750
Increase On-Campus Recruiting Satisfaction Level 85 - 90%
Establish Number of Regional Internship Opportunities Available 150-200
Establish Number of Regional Degree Positions Available 800-1000
Establish Number of Employers Hosted at Athletic and Other University
Events15-20
Establish Number of Joint Programs with Alumni Relations 2-5
Establish Number of emails sent to faculty regarding outcomes of
graduates75-200
Establish Number of responses from faculty regarding graduate placement
outcomes25-50
Increase Response Rate on Alumni Survey 30-35%
Increase Placement Rate on Alumni Survey 84-88%
Corporate Relations Management
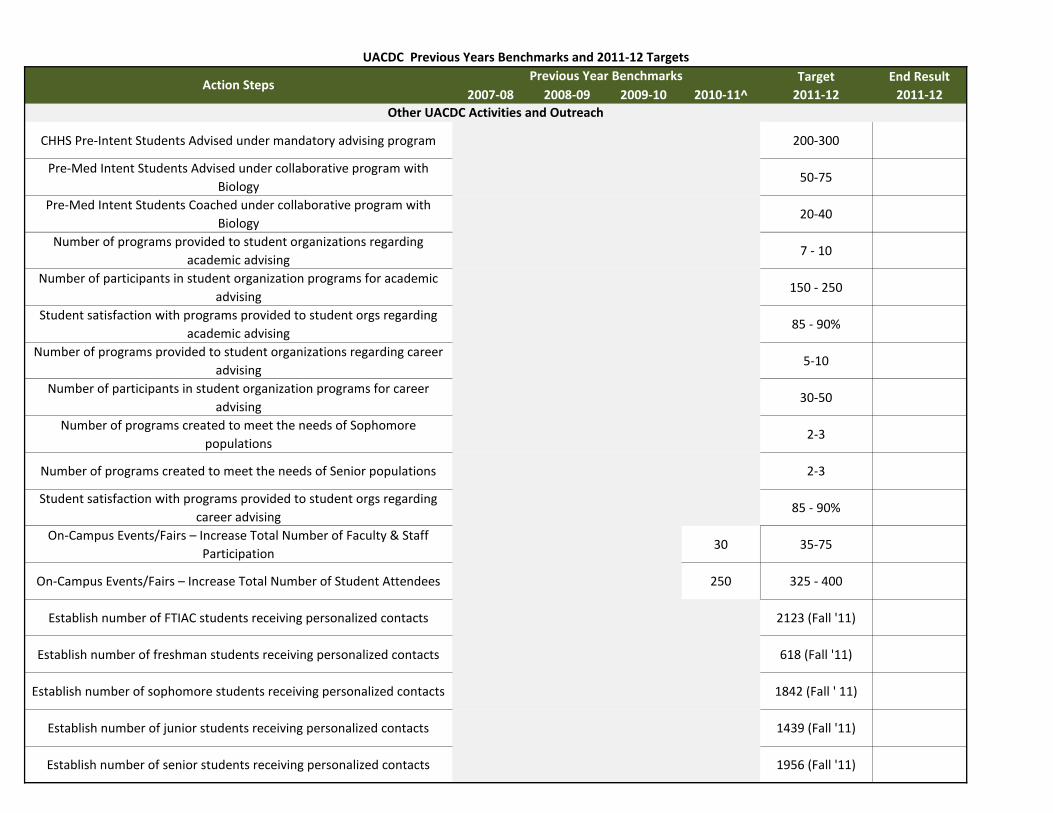
UACDC Previous Years Benchmarks and 2011-12 Targets
Target End Result
2007-08 2008-09 2009-10 2010-11^ 2011-12 2011-12Action Steps
Previous Year Benchmarks
CHHS Pre-Intent Students Advised under mandatory advising program 200-300
Pre-Med Intent Students Advised under collaborative program with
Biology50-75
Pre-Med Intent Students Coached under collaborative program with
Biology20-40
Number of programs provided to student organizations regarding
academic advising7 - 10
Number of participants in student organization programs for academic
advising150 - 250
Student satisfaction with programs provided to student orgs regarding
academic advising85 - 90%
Number of programs provided to student organizations regarding career
advising5-10
Number of participants in student organization programs for career
advising30-50
Number of programs created to meet the needs of Sophomore
populations2-3
Number of programs created to meet the needs of Senior populations 2-3
Student satisfaction with programs provided to student orgs regarding
career advising85 - 90%
On-Campus Events/Fairs – Increase Total Number of Faculty & Staff
Participation30 35-75
On-Campus Events/Fairs – Increase Total Number of Student Attendees 250 325 - 400
Establish number of FTIAC students receiving personalized contacts 2123 (Fall '11)
Establish number of freshman students receiving personalized contacts 618 (Fall '11)
Establish number of sophomore students receiving personalized contacts 1842 (Fall ' 11)
Establish number of junior students receiving personalized contacts 1439 (Fall '11)
Establish number of senior students receiving personalized contacts 1956 (Fall '11)
Other UACDC Activities and Outreach
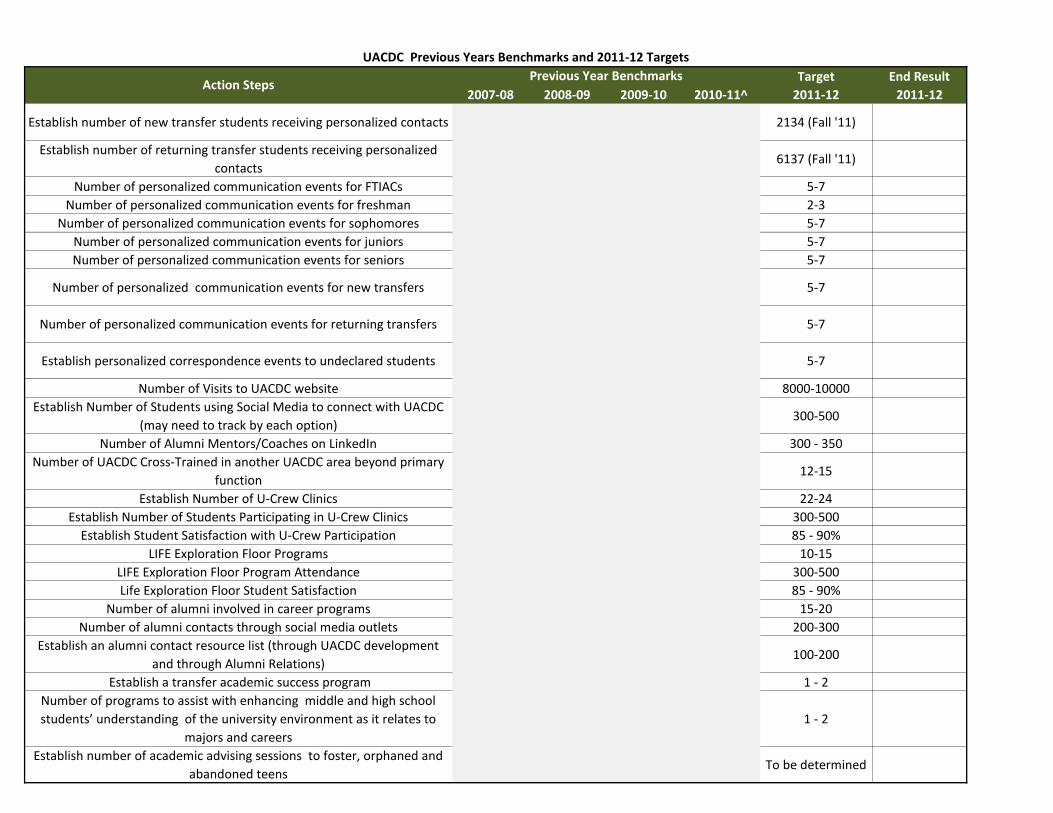
UACDC Previous Years Benchmarks and 2011-12 Targets
Target End Result
2007-08 2008-09 2009-10 2010-11^ 2011-12 2011-12Action Steps
Previous Year Benchmarks
Establish number of new transfer students receiving personalized contacts 2134 (Fall '11)
Establish number of returning transfer students receiving personalized
contacts6137 (Fall '11)
Number of personalized communication events for FTIACs 5-7
Number of personalized communication events for freshman 2-3
Number of personalized communication events for sophomores 5-7
Number of personalized communication events for juniors 5-7
Number of personalized communication events for seniors 5-7
Number of personalized communication events for new transfers 5-7
Number of personalized communication events for returning transfers 5-7
Establish personalized correspondence events to undeclared students 5-7
Number of Visits to UACDC website 8000-10000
Establish Number of Students using Social Media to connect with UACDC
(may need to track by each option)300-500
Number of Alumni Mentors/Coaches on LinkedIn 300 - 350
Number of UACDC Cross-Trained in another UACDC area beyond primary
function12-15
Establish Number of U-Crew Clinics 22-24
Establish Number of Students Participating in U-Crew Clinics 300-500
Establish Student Satisfaction with U-Crew Participation 85 - 90%
LIFE Exploration Floor Programs 10-15
LIFE Exploration Floor Program Attendance 300-500
Life Exploration Floor Student Satisfaction 85 - 90%
Number of alumni involved in career programs 15-20
Number of alumni contacts through social media outlets 200-300
Establish an alumni contact resource list (through UACDC development
and through Alumni Relations)100-200
Establish a transfer academic success program 1 - 2
Number of programs to assist with enhancing middle and high school
students’ understanding of the university environment as it relates to
majors and careers
1 - 2
Establish number of academic advising sessions to foster, orphaned and
abandoned teens To be determined
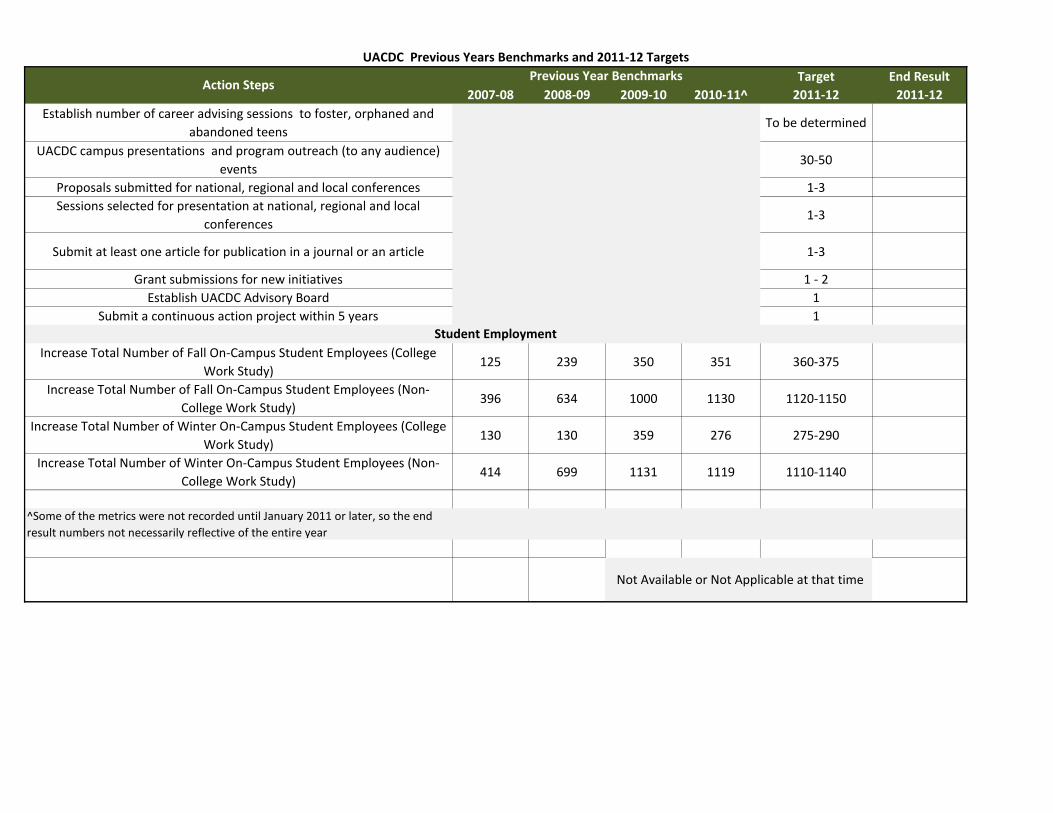
UACDC Previous Years Benchmarks and 2011-12 Targets
Target End Result
2007-08 2008-09 2009-10 2010-11^ 2011-12 2011-12Action Steps
Previous Year Benchmarks
Establish number of career advising sessions to foster, orphaned and
abandoned teens To be determined
UACDC campus presentations and program outreach (to any audience)
events30-50
Proposals submitted for national, regional and local conferences 1-3
Sessions selected for presentation at national, regional and local
conferences1-3
Submit at least one article for publication in a journal or an article 1-3
Grant submissions for new initiatives 1 - 2
Establish UACDC Advisory Board 1
Submit a continuous action project within 5 years 1
Increase Total Number of Fall On-Campus Student Employees (College
Work Study)125 239 350 351 360-375
Increase Total Number of Fall On-Campus Student Employees (Non-
College Work Study)396 634 1000 1130 1120-1150
Increase Total Number of Winter On-Campus Student Employees (College
Work Study)130 130 359 276 275-290
Increase Total Number of Winter On-Campus Student Employees (Non-
College Work Study)414 699 1131 1119 1110-1140
^Some of the metrics were not recorded until January 2011 or later, so the end
result numbers not necessarily reflective of the entire year
Not Available or Not Applicable at that time
Student Employment

UACDC Holding the Plan Accountable Future Targets 12
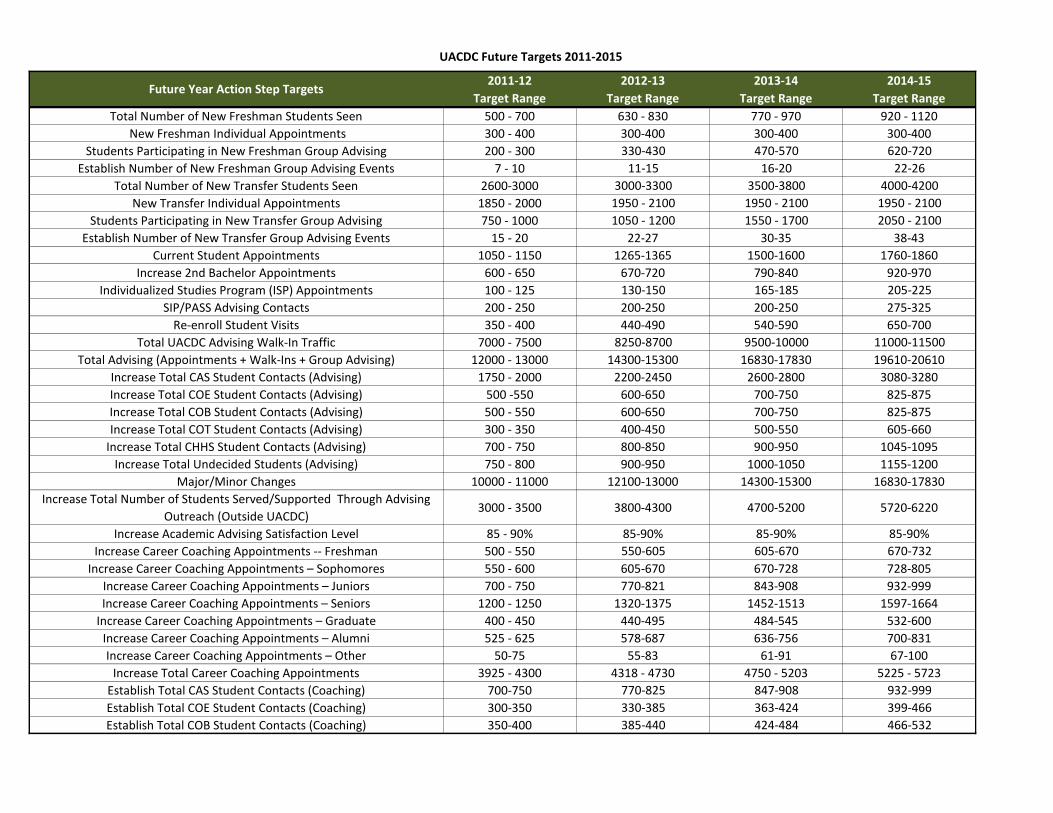
UACDC Future Targets 2011-2015
2011-12 2012-13 2013-14 2014-15
Target Range Target Range Target Range Target Range
Total Number of New Freshman Students Seen 500 - 700 630 - 830 770 - 970 920 - 1120
New Freshman Individual Appointments 300 - 400 300-400 300-400 300-400
Students Participating in New Freshman Group Advising 200 - 300 330-430 470-570 620-720
Establish Number of New Freshman Group Advising Events 7 - 10 11-15 16-20 22-26
Total Number of New Transfer Students Seen 2600-3000 3000-3300 3500-3800 4000-4200
New Transfer Individual Appointments 1850 - 2000 1950 - 2100 1950 - 2100 1950 - 2100
Students Participating in New Transfer Group Advising 750 - 1000 1050 - 1200 1550 - 1700 2050 - 2100
Establish Number of New Transfer Group Advising Events 15 - 20 22-27 30-35 38-43
Current Student Appointments 1050 - 1150 1265-1365 1500-1600 1760-1860
Increase 2nd Bachelor Appointments 600 - 650 670-720 790-840 920-970
Individualized Studies Program (ISP) Appointments 100 - 125 130-150 165-185 205-225
SIP/PASS Advising Contacts 200 - 250 200-250 200-250 275-325
Re-enroll Student Visits 350 - 400 440-490 540-590 650-700
Total UACDC Advising Walk-In Traffic 7000 - 7500 8250-8700 9500-10000 11000-11500
Total Advising (Appointments + Walk-Ins + Group Advising) 12000 - 13000 14300-15300 16830-17830 19610-20610
Increase Total CAS Student Contacts (Advising) 1750 - 2000 2200-2450 2600-2800 3080-3280
Increase Total COE Student Contacts (Advising) 500 -550 600-650 700-750 825-875
Increase Total COB Student Contacts (Advising) 500 - 550 600-650 700-750 825-875
Increase Total COT Student Contacts (Advising) 300 - 350 400-450 500-550 605-660
Increase Total CHHS Student Contacts (Advising) 700 - 750 800-850 900-950 1045-1095
Increase Total Undecided Students (Advising) 750 - 800 900-950 1000-1050 1155-1200
Major/Minor Changes 10000 - 11000 12100-13000 14300-15300 16830-17830
Increase Total Number of Students Served/Supported Through Advising
Outreach (Outside UACDC)3000 - 3500 3800-4300 4700-5200 5720-6220
Increase Academic Advising Satisfaction Level 85 - 90% 85-90% 85-90% 85-90%
Increase Career Coaching Appointments -- Freshman 500 - 550 550-605 605-670 670-732
Increase Career Coaching Appointments – Sophomores 550 - 600 605-670 670-728 728-805
Increase Career Coaching Appointments – Juniors 700 - 750 770-821 843-908 932-999
Increase Career Coaching Appointments – Seniors 1200 - 1250 1320-1375 1452-1513 1597-1664
Increase Career Coaching Appointments – Graduate 400 - 450 440-495 484-545 532-600
Increase Career Coaching Appointments – Alumni 525 - 625 578-687 636-756 700-831
Increase Career Coaching Appointments – Other 50-75 55-83 61-91 67-100
Increase Total Career Coaching Appointments 3925 - 4300 4318 - 4730 4750 - 5203 5225 - 5723
Establish Total CAS Student Contacts (Coaching) 700-750 770-825 847-908 932-999
Establish Total COE Student Contacts (Coaching) 300-350 330-385 363-424 399-466
Establish Total COB Student Contacts (Coaching) 350-400 385-440 424-484 466-532
Future Year Action Step Targets
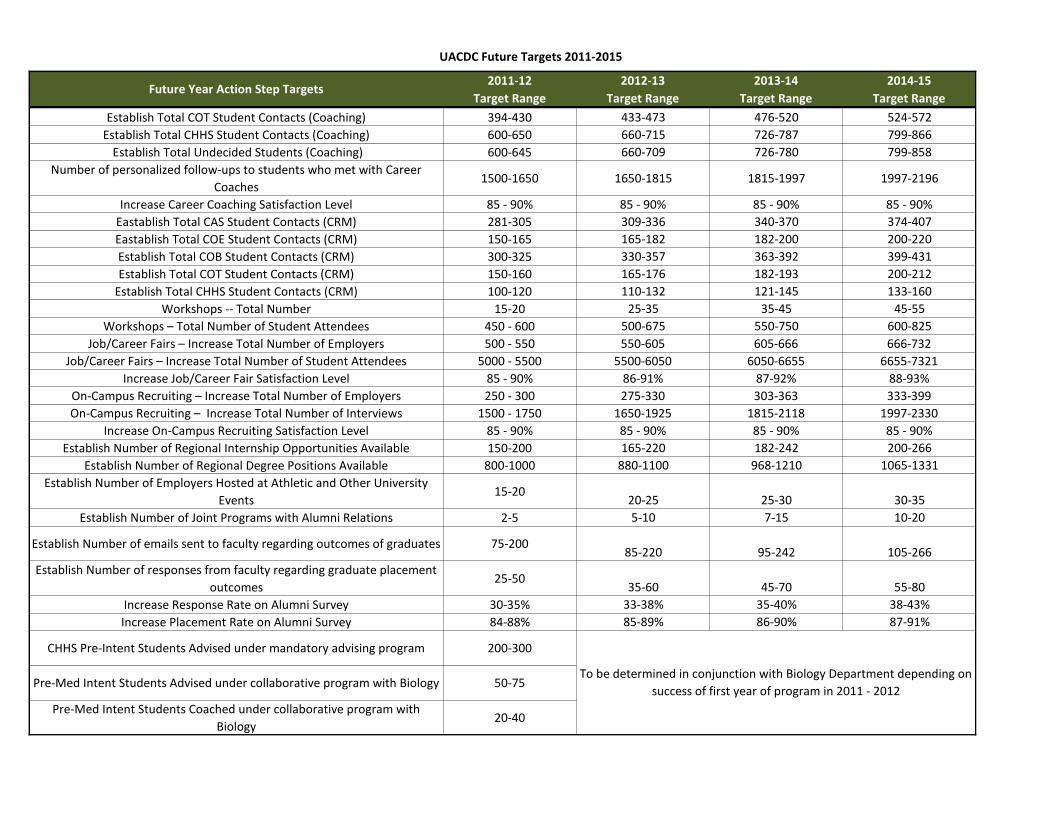
UACDC Future Targets 2011-2015
2011-12 2012-13 2013-14 2014-15
Target Range Target Range Target Range Target RangeFuture Year Action Step Targets
Establish Total COT Student Contacts (Coaching) 394-430 433-473 476-520 524-572
Establish Total CHHS Student Contacts (Coaching) 600-650 660-715 726-787 799-866
Establish Total Undecided Students (Coaching) 600-645 660-709 726-780 799-858
Number of personalized follow-ups to students who met with Career
Coaches1500-1650 1650-1815 1815-1997 1997-2196
Increase Career Coaching Satisfaction Level 85 - 90% 85 - 90% 85 - 90% 85 - 90%
Eastablish Total CAS Student Contacts (CRM) 281-305 309-336 340-370 374-407
Eastablish Total COE Student Contacts (CRM) 150-165 165-182 182-200 200-220
Establish Total COB Student Contacts (CRM) 300-325 330-357 363-392 399-431
Establish Total COT Student Contacts (CRM) 150-160 165-176 182-193 200-212
Establish Total CHHS Student Contacts (CRM) 100-120 110-132 121-145 133-160
Workshops -- Total Number 15-20 25-35 35-45 45-55
Workshops – Total Number of Student Attendees 450 - 600 500-675 550-750 600-825
Job/Career Fairs – Increase Total Number of Employers 500 - 550 550-605 605-666 666-732
Job/Career Fairs – Increase Total Number of Student Attendees 5000 - 5500 5500-6050 6050-6655 6655-7321
Increase Job/Career Fair Satisfaction Level 85 - 90% 86-91% 87-92% 88-93%
On-Campus Recruiting – Increase Total Number of Employers 250 - 300 275-330 303-363 333-399
On-Campus Recruiting – Increase Total Number of Interviews 1500 - 1750 1650-1925 1815-2118 1997-2330
Increase On-Campus Recruiting Satisfaction Level 85 - 90% 85 - 90% 85 - 90% 85 - 90%
Establish Number of Regional Internship Opportunities Available 150-200 165-220 182-242 200-266
Establish Number of Regional Degree Positions Available 800-1000 880-1100 968-1210 1065-1331
Establish Number of Employers Hosted at Athletic and Other University
Events15-20
20-25 25-30 30-35
Establish Number of Joint Programs with Alumni Relations 2-5 5-10 7-15 10-20
Establish Number of emails sent to faculty regarding outcomes of graduates 75-20085-220 95-242 105-266
Establish Number of responses from faculty regarding graduate placement
outcomes25-50
35-60 45-70 55-80
Increase Response Rate on Alumni Survey 30-35% 33-38% 35-40% 38-43%
Increase Placement Rate on Alumni Survey 84-88% 85-89% 86-90% 87-91%
CHHS Pre-Intent Students Advised under mandatory advising program 200-300
Pre-Med Intent Students Advised under collaborative program with Biology 50-75
Pre-Med Intent Students Coached under collaborative program with
Biology20-40
To be determined in conjunction with Biology Department depending on
success of first year of program in 2011 - 2012
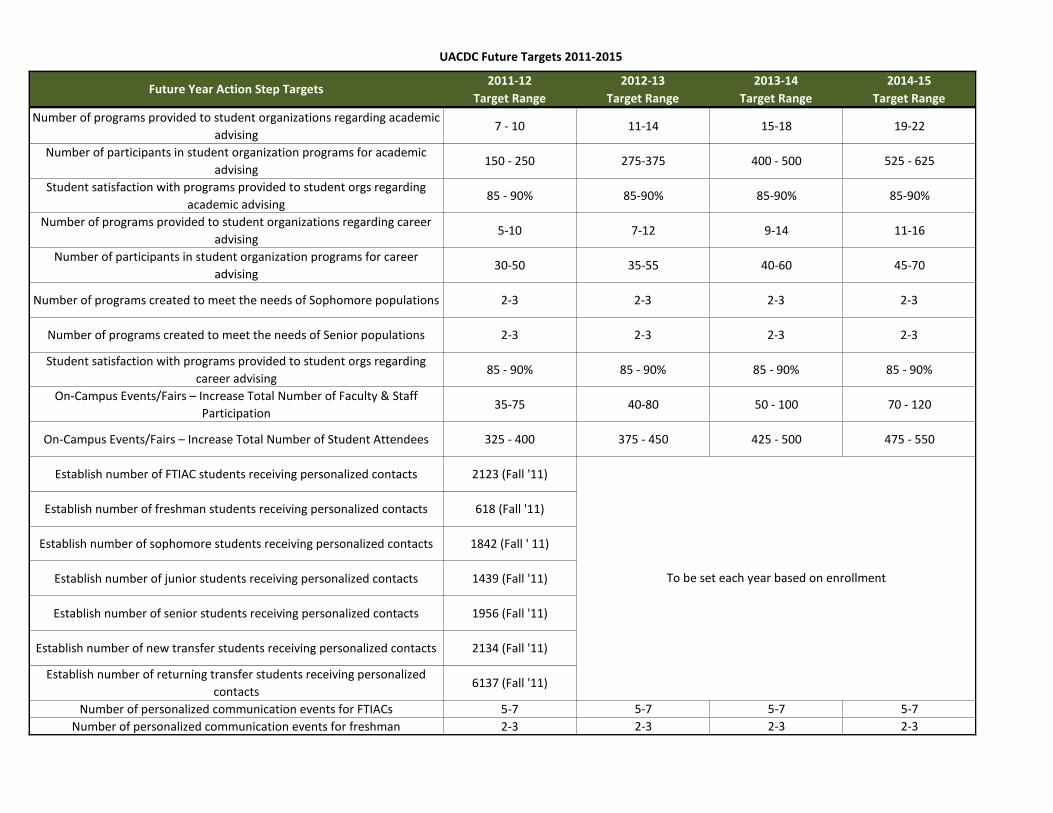
UACDC Future Targets 2011-2015
2011-12 2012-13 2013-14 2014-15
Target Range Target Range Target Range Target RangeFuture Year Action Step Targets
Number of programs provided to student organizations regarding academic
advising7 - 10 11-14 15-18 19-22
Number of participants in student organization programs for academic
advising150 - 250 275-375 400 - 500 525 - 625
Student satisfaction with programs provided to student orgs regarding
academic advising85 - 90% 85-90% 85-90% 85-90%
Number of programs provided to student organizations regarding career
advising5-10 7-12 9-14 11-16
Number of participants in student organization programs for career
advising30-50 35-55 40-60 45-70
Number of programs created to meet the needs of Sophomore populations 2-3 2-3 2-3 2-3
Number of programs created to meet the needs of Senior populations 2-3 2-3 2-3 2-3
Student satisfaction with programs provided to student orgs regarding
career advising85 - 90% 85 - 90% 85 - 90% 85 - 90%
On-Campus Events/Fairs – Increase Total Number of Faculty & Staff
Participation35-75 40-80 50 - 100 70 - 120
On-Campus Events/Fairs – Increase Total Number of Student Attendees 325 - 400 375 - 450 425 - 500 475 - 550
Establish number of FTIAC students receiving personalized contacts 2123 (Fall '11)
Establish number of freshman students receiving personalized contacts 618 (Fall '11)
Establish number of sophomore students receiving personalized contacts 1842 (Fall ' 11)
Establish number of junior students receiving personalized contacts 1439 (Fall '11)
Establish number of senior students receiving personalized contacts 1956 (Fall '11)
Establish number of new transfer students receiving personalized contacts 2134 (Fall '11)
Establish number of returning transfer students receiving personalized
contacts6137 (Fall '11)
Number of personalized communication events for FTIACs 5-7 5-7 5-7 5-7
Number of personalized communication events for freshman 2-3 2-3 2-3 2-3
To be set each year based on enrollment
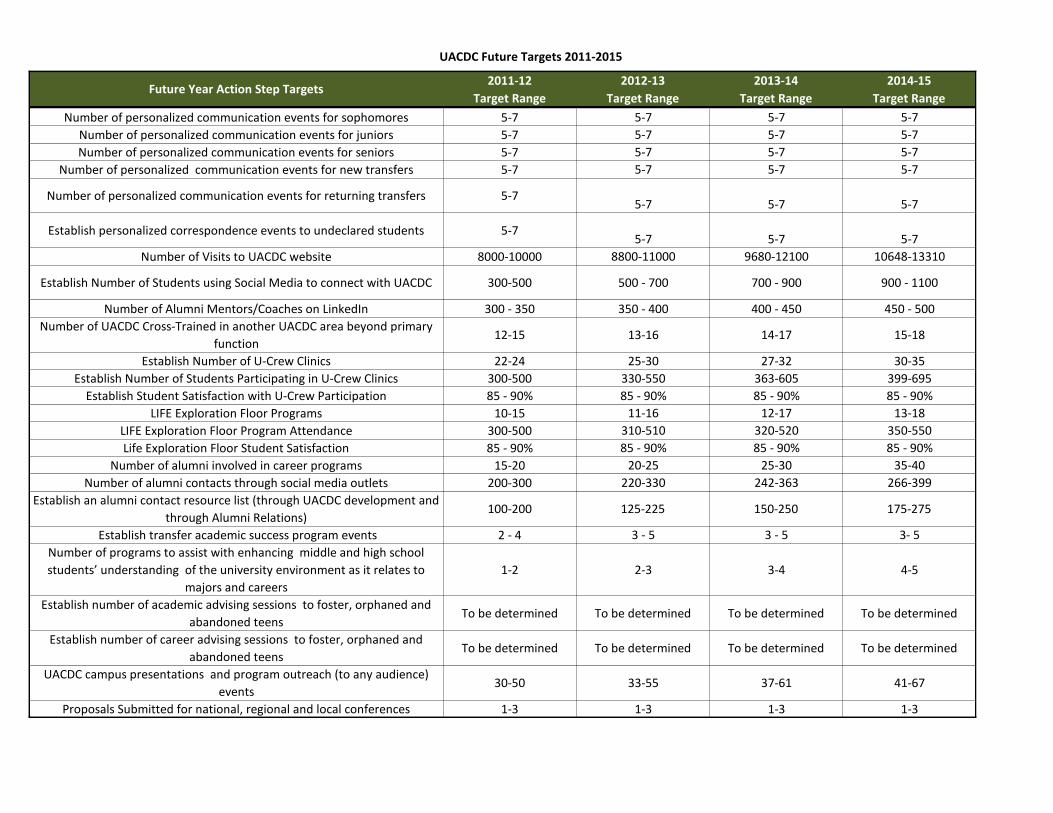
UACDC Future Targets 2011-2015
2011-12 2012-13 2013-14 2014-15
Target Range Target Range Target Range Target RangeFuture Year Action Step Targets
Number of personalized communication events for sophomores 5-7 5-7 5-7 5-7
Number of personalized communication events for juniors 5-7 5-7 5-7 5-7
Number of personalized communication events for seniors 5-7 5-7 5-7 5-7
Number of personalized communication events for new transfers 5-7 5-7 5-7 5-7
Number of personalized communication events for returning transfers 5-75-7 5-7 5-7
Establish personalized correspondence events to undeclared students 5-75-7 5-7 5-7
Number of Visits to UACDC website 8000-10000 8800-11000 9680-12100 10648-13310
Establish Number of Students using Social Media to connect with UACDC 300-500 500 - 700 700 - 900 900 - 1100
Number of Alumni Mentors/Coaches on LinkedIn 300 - 350 350 - 400 400 - 450 450 - 500
Number of UACDC Cross-Trained in another UACDC area beyond primary
function12-15 13-16 14-17 15-18
Establish Number of U-Crew Clinics 22-24 25-30 27-32 30-35
Establish Number of Students Participating in U-Crew Clinics 300-500 330-550 363-605 399-695
Establish Student Satisfaction with U-Crew Participation 85 - 90% 85 - 90% 85 - 90% 85 - 90%
LIFE Exploration Floor Programs 10-15 11-16 12-17 13-18
LIFE Exploration Floor Program Attendance 300-500 310-510 320-520 350-550
Life Exploration Floor Student Satisfaction 85 - 90% 85 - 90% 85 - 90% 85 - 90%
Number of alumni involved in career programs 15-20 20-25 25-30 35-40
Number of alumni contacts through social media outlets 200-300 220-330 242-363 266-399
Establish an alumni contact resource list (through UACDC development and
through Alumni Relations)100-200 125-225 150-250 175-275
Establish transfer academic success program events 2 - 4 3 - 5 3 - 5 3- 5
Number of programs to assist with enhancing middle and high school
students’ understanding of the university environment as it relates to
majors and careers
1-2 2-3 3-4 4-5
Establish number of academic advising sessions to foster, orphaned and
abandoned teens To be determined To be determined To be determined To be determined
Establish number of career advising sessions to foster, orphaned and
abandoned teens To be determined To be determined To be determined To be determined
UACDC campus presentations and program outreach (to any audience)
events30-50 33-55 37-61 41-67
Proposals Submitted for national, regional and local conferences 1-3 1-3 1-3 1-3
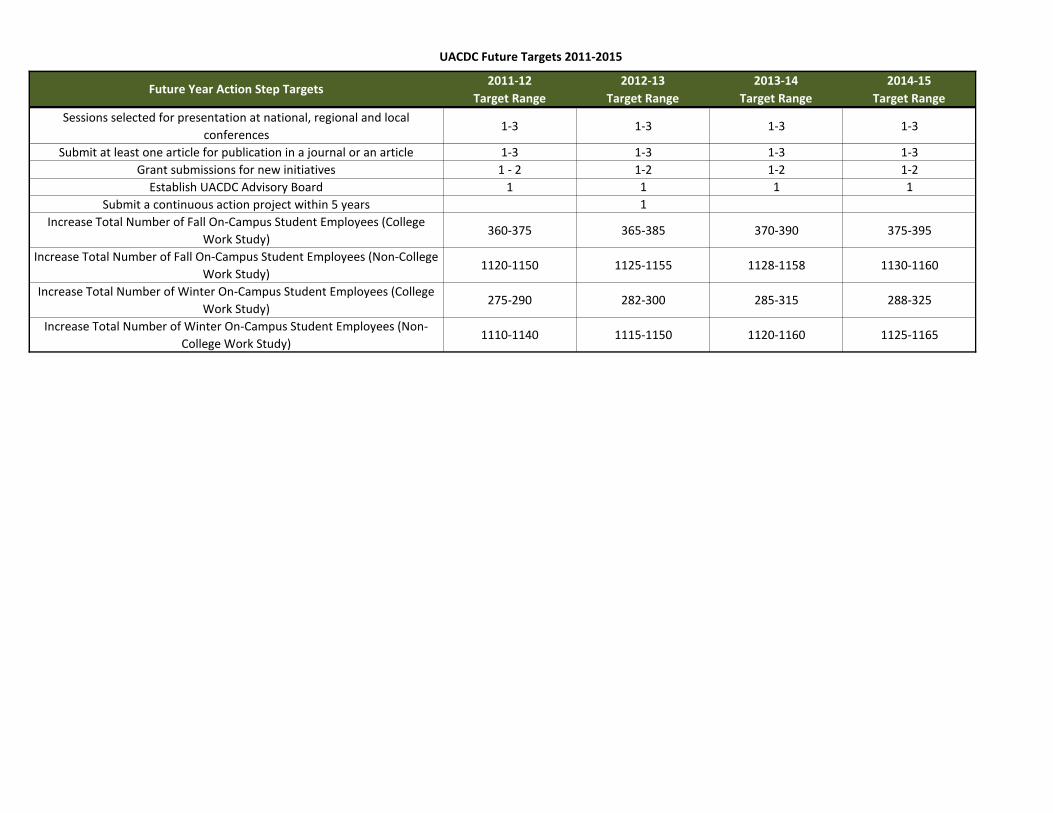
UACDC Future Targets 2011-2015
2011-12 2012-13 2013-14 2014-15
Target Range Target Range Target Range Target RangeFuture Year Action Step Targets
Sessions selected for presentation at national, regional and local
conferences1-3 1-3 1-3 1-3
Submit at least one article for publication in a journal or an article 1-3 1-3 1-3 1-3
Grant submissions for new initiatives 1 - 2 1-2 1-2 1-2
Establish UACDC Advisory Board 1 1 1 1
Submit a continuous action project within 5 years 1
Increase Total Number of Fall On-Campus Student Employees (College
Work Study)360-375 365-385 370-390 375-395
Increase Total Number of Fall On-Campus Student Employees (Non-College
Work Study)1120-1150 1125-1155 1128-1158 1130-1160
Increase Total Number of Winter On-Campus Student Employees (College
Work Study)275-290 282-300 285-315 288-325
Increase Total Number of Winter On-Campus Student Employees (Non-
College Work Study)1110-1140 1115-1150 1120-1160 1125-1165
Holman Success Center (HSC)
Plan in Action
13

1
Student Success Network Strategic Plans in Action
Holman Success Center (HSC) Strategic Plan in Action…!
Goal #1: To increase the 6-Year graduation rate for FTIAC students (refer to
RSS Plan in Action)
Goal #2: To enhance student success
Objective A: Improve student persistence, retention and graduation rates
Action Strategies
1. Collectively develop and deliver a university-wide retention program
Action Steps
a. Increase number of students who have signed the FERPA document
2. Strengthen “Freshmen Year” experience programs
Action Steps
a. Provide and monitor HSC support to the College Teams
b. Target gatepost courses for Supplemental Instruction (SI)
3. Research and evaluate implementation of “sophomore year” and “senior year” experience
programs
Action Steps
a. Provide necessary HSC support for these populations
4. Increase number of FTIAC students who complete general education in the first two years
Action Steps
a. Provide the necessary tutorial and Supplemental Instruction support to:
i. Number of students completing at least one math course by the
beginning of the second year (refer to RSS metrics)
ii. Number of students completing quantitative reasoning requirement by
end of second year (refer to RSS metrics)
iii. Number of students completing ENG 121 by beginning of the second
year (refer to RSS metrics)
iv. Number of students completing CTAC 124 by beginning of second
year (refer to RSS metrics)
5. Enhance services and support provided to transfer students
Action Steps
a. Develop ways of promoting availability of tutoring and supplemental instruction to
transfers
b. Increase use of HSC services by transfers
6. Decrease the number of Intent students within the respective colleges (not applicable)
7. Improve collaboration/service delivery among the five colleges
Action Steps
a. Enhance communication about services provided by HSC
b. Enhance quality of HSC workshops
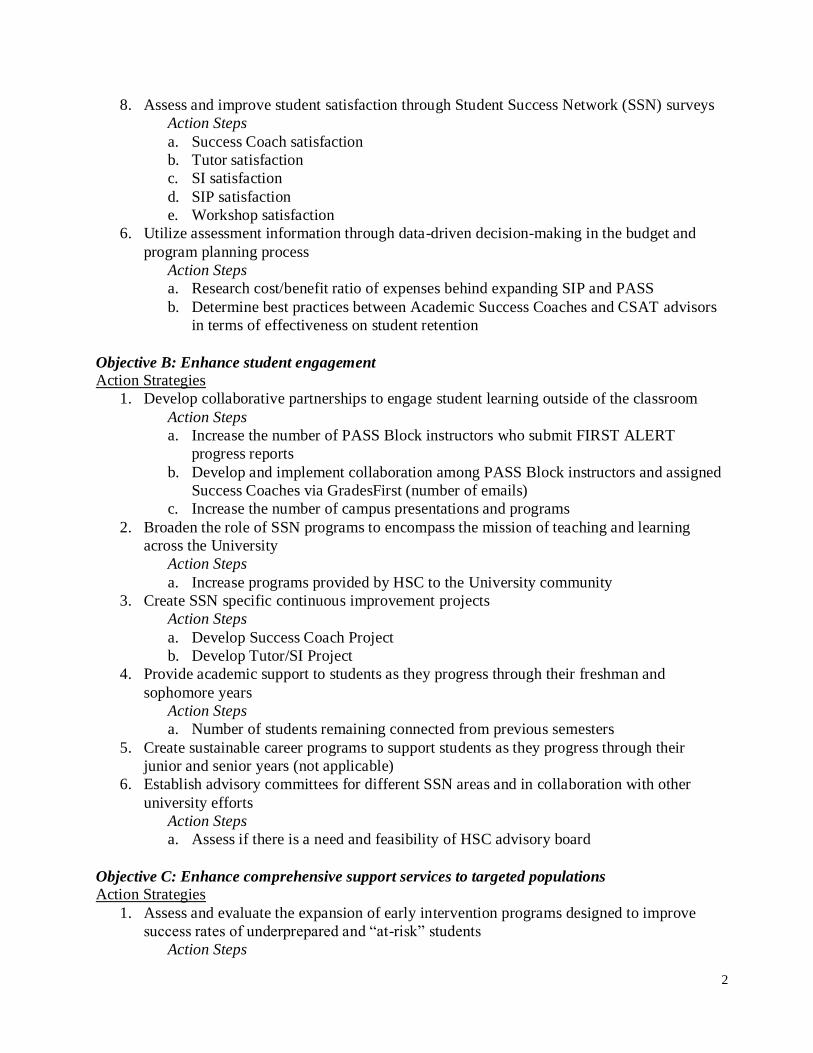
2
8. Assess and improve student satisfaction through Student Success Network (SSN) surveys
Action Steps
a. Success Coach satisfaction
b. Tutor satisfaction
c. SI satisfaction
d. SIP satisfaction
e. Workshop satisfaction
6. Utilize assessment information through data-driven decision-making in the budget and
program planning process
Action Steps
a. Research cost/benefit ratio of expenses behind expanding SIP and PASS
b. Determine best practices between Academic Success Coaches and CSAT advisors
in terms of effectiveness on student retention
Objective B: Enhance student engagement
Action Strategies
1. Develop collaborative partnerships to engage student learning outside of the classroom
Action Steps
a. Increase the number of PASS Block instructors who submit FIRST ALERT
progress reports
b. Develop and implement collaboration among PASS Block instructors and assigned
Success Coaches via GradesFirst (number of emails)
c. Increase the number of campus presentations and programs
2. Broaden the role of SSN programs to encompass the mission of teaching and learning
across the University
Action Steps
a. Increase programs provided by HSC to the University community
3. Create SSN specific continuous improvement projects
Action Steps
a. Develop Success Coach Project
b. Develop Tutor/SI Project
4. Provide academic support to students as they progress through their freshman and
sophomore years
Action Steps
a. Number of students remaining connected from previous semesters
5. Create sustainable career programs to support students as they progress through their
junior and senior years (not applicable)
6. Establish advisory committees for different SSN areas and in collaboration with other
university efforts
Action Steps
a. Assess if there is a need and feasibility of HSC advisory board
Objective C: Enhance comprehensive support services to targeted populations
Action Strategies
1. Assess and evaluate the expansion of early intervention programs designed to improve
success rates of underprepared and “at-risk” students
Action Steps
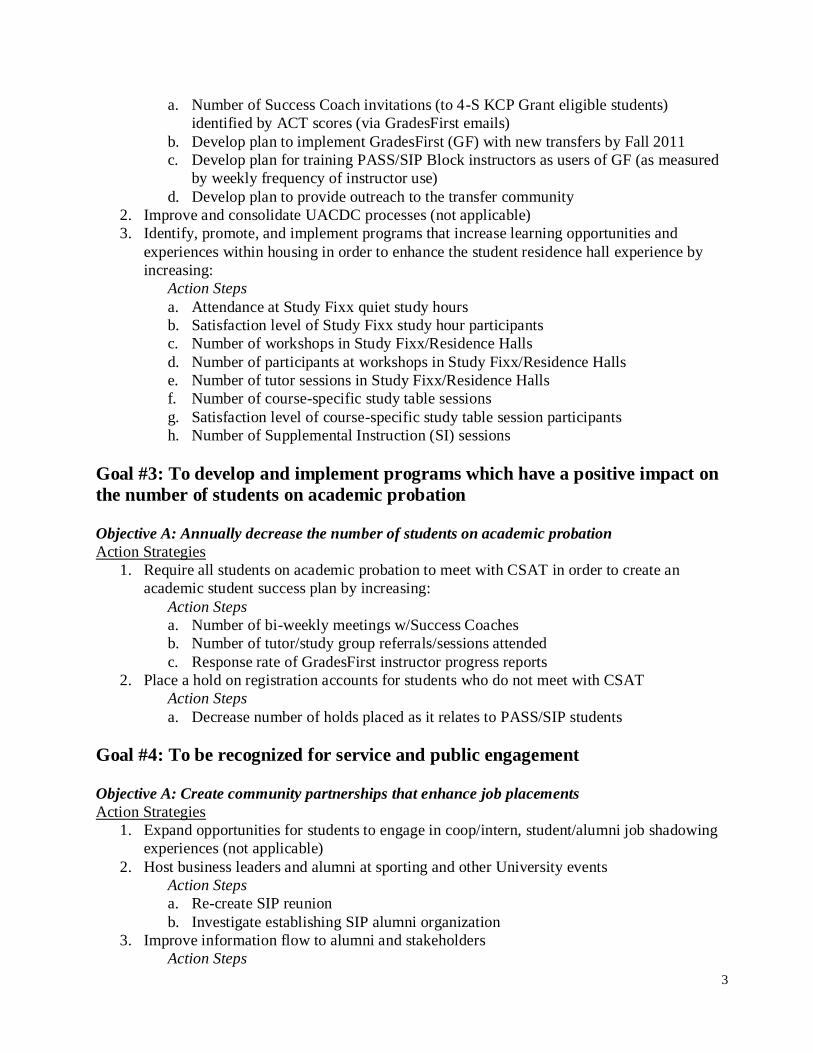
3
a. Number of Success Coach invitations (to 4-S KCP Grant eligible students)
identified by ACT scores (via GradesFirst emails)
b. Develop plan to implement GradesFirst (GF) with new transfers by Fall 2011
c. Develop plan for training PASS/SIP Block instructors as users of GF (as measured
by weekly frequency of instructor use)
d. Develop plan to provide outreach to the transfer community
2. Improve and consolidate UACDC processes (not applicable)
3. Identify, promote, and implement programs that increase learning opportunities and
experiences within housing in order to enhance the student residence hall experience by
increasing:
Action Steps
a. Attendance at Study Fixx quiet study hours
b. Satisfaction level of Study Fixx study hour participants
c. Number of workshops in Study Fixx/Residence Halls
d. Number of participants at workshops in Study Fixx/Residence Halls
e. Number of tutor sessions in Study Fixx/Residence Halls
f. Number of course-specific study table sessions
g. Satisfaction level of course-specific study table session participants
h. Number of Supplemental Instruction (SI) sessions
Goal #3: To develop and implement programs which have a positive impact on
the number of students on academic probation
Objective A: Annually decrease the number of students on academic probation
Action Strategies
1. Require all students on academic probation to meet with CSAT in order to create an
academic student success plan by increasing:
Action Steps
a. Number of bi-weekly meetings w/Success Coaches
b. Number of tutor/study group referrals/sessions attended
c. Response rate of GradesFirst instructor progress reports
2. Place a hold on registration accounts for students who do not meet with CSAT
Action Steps
a. Decrease number of holds placed as it relates to PASS/SIP students
Goal #4: To be recognized for service and public engagement
Objective A: Create community partnerships that enhance job placements
Action Strategies
1. Expand opportunities for students to engage in coop/intern, student/alumni job shadowing
experiences (not applicable)
2. Host business leaders and alumni at sporting and other University events
Action Steps
a. Re-create SIP reunion
b. Investigate establishing SIP alumni organization
3. Improve information flow to alumni and stakeholders
Action Steps
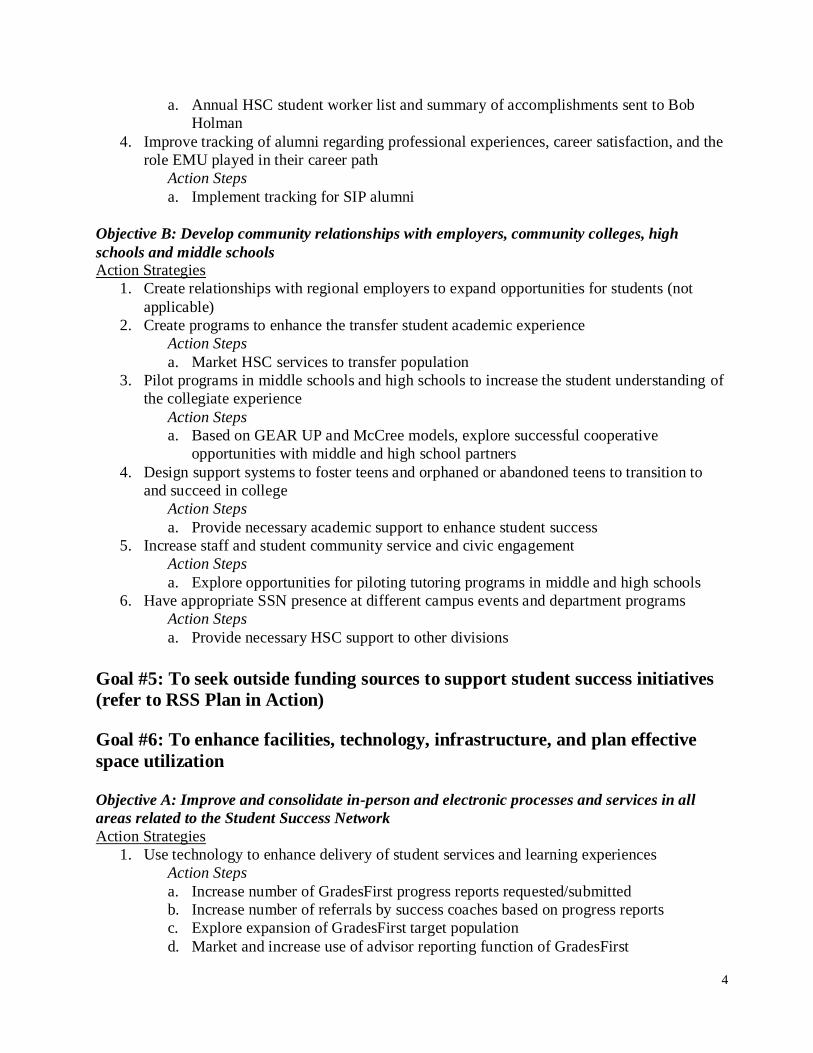
4
a. Annual HSC student worker list and summary of accomplishments sent to Bob
Holman
4. Improve tracking of alumni regarding professional experiences, career satisfaction, and the
role EMU played in their career path
Action Steps
a. Implement tracking for SIP alumni
Objective B: Develop community relationships with employers, community colleges, high
schools and middle schools
Action Strategies
1. Create relationships with regional employers to expand opportunities for students (not
applicable)
2. Create programs to enhance the transfer student academic experience
Action Steps
a. Market HSC services to transfer population
3. Pilot programs in middle schools and high schools to increase the student understanding of
the collegiate experience
Action Steps
a. Based on GEAR UP and McCree models, explore successful cooperative
opportunities with middle and high school partners
4. Design support systems to foster teens and orphaned or abandoned teens to transition to
and succeed in college
Action Steps
a. Provide necessary academic support to enhance student success
5. Increase staff and student community service and civic engagement
Action Steps
a. Explore opportunities for piloting tutoring programs in middle and high schools
6. Have appropriate SSN presence at different campus events and department programs
Action Steps
a. Provide necessary HSC support to other divisions
Goal #5: To seek outside funding sources to support student success initiatives
(refer to RSS Plan in Action)
Goal #6: To enhance facilities, technology, infrastructure, and plan effective
space utilization
Objective A: Improve and consolidate in-person and electronic processes and services in all
areas related to the Student Success Network
Action Strategies
1. Use technology to enhance delivery of student services and learning experiences
Action Steps
a. Increase number of GradesFirst progress reports requested/submitted
b. Increase number of referrals by success coaches based on progress reports
c. Explore expansion of GradesFirst target population
d. Market and increase use of advisor reporting function of GradesFirst
5
e. Explore usage of GradesFirst Facebook component amongst students
f. Create and implement web-based HSC newsletter
g. Enhance HSC website and monitor visits
h. Develop HSC social media presence
i. Explore and implement online tutoring pilot
j. Number of pilot online tutor requests/sessions held
Goal #7: To enhance faculty support and staff success (refer to RSS Plan in
Action)

HSC Holding the Plan Accountable Benchmarks 14
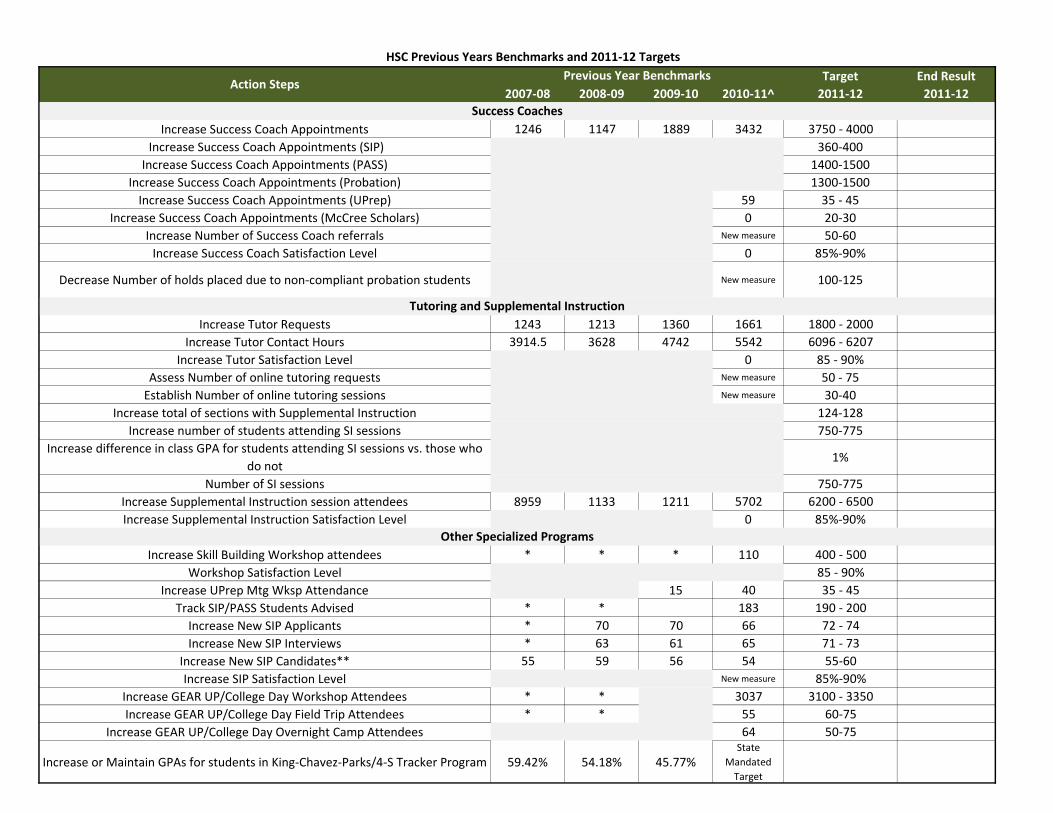
HSC Previous Years Benchmarks and 2011-12 Targets
Target End Result
2007-08 2008-09 2009-10 2010-11^ 2011-12 2011-12
Increase Success Coach Appointments 1246 1147 1889 3432 3750 - 4000
Increase Success Coach Appointments (SIP) 360-400
Increase Success Coach Appointments (PASS) 1400-1500
Increase Success Coach Appointments (Probation) 1300-1500
Increase Success Coach Appointments (UPrep) 59 35 - 45
Increase Success Coach Appointments (McCree Scholars) 0 20-30
Increase Number of Success Coach referrals New measure 50-60
Increase Success Coach Satisfaction Level 0 85%-90%
Decrease Number of holds placed due to non-compliant probation students New measure 100-125
Increase Tutor Requests 1243 1213 1360 1661 1800 - 2000
Increase Tutor Contact Hours 3914.5 3628 4742 5542 6096 - 6207
Increase Tutor Satisfaction Level 0 85 - 90%
Assess Number of online tutoring requests New measure 50 - 75
Establish Number of online tutoring sessions New measure 30-40
Increase total of sections with Supplemental Instruction 124-128
Increase number of students attending SI sessions 750-775
Increase difference in class GPA for students attending SI sessions vs. those who
do not1%
Number of SI sessions 750-775
Increase Supplemental Instruction session attendees 8959 1133 1211 5702 6200 - 6500
Increase Supplemental Instruction Satisfaction Level 0 85%-90%
Increase Skill Building Workshop attendees * * * 110 400 - 500
Workshop Satisfaction Level 85 - 90%
Increase UPrep Mtg Wksp Attendance 15 40 35 - 45
Track SIP/PASS Students Advised * * 183 190 - 200
Increase New SIP Applicants * 70 70 66 72 - 74
Increase New SIP Interviews * 63 61 65 71 - 73
Increase New SIP Candidates** 55 59 56 54 55-60
Increase SIP Satisfaction Level New measure 85%-90%
Increase GEAR UP/College Day Workshop Attendees * * 3037 3100 - 3350
Increase GEAR UP/College Day Field Trip Attendees * * 55 60-75
Increase GEAR UP/College Day Overnight Camp Attendees 64 50-75
Increase or Maintain GPAs for students in King-Chavez-Parks/4-S Tracker Program 59.42% 54.18% 45.77%State
Mandated
Target
Action StepsPrevious Year Benchmarks
Success Coaches
Tutoring and Supplemental Instruction
Other Specialized Programs
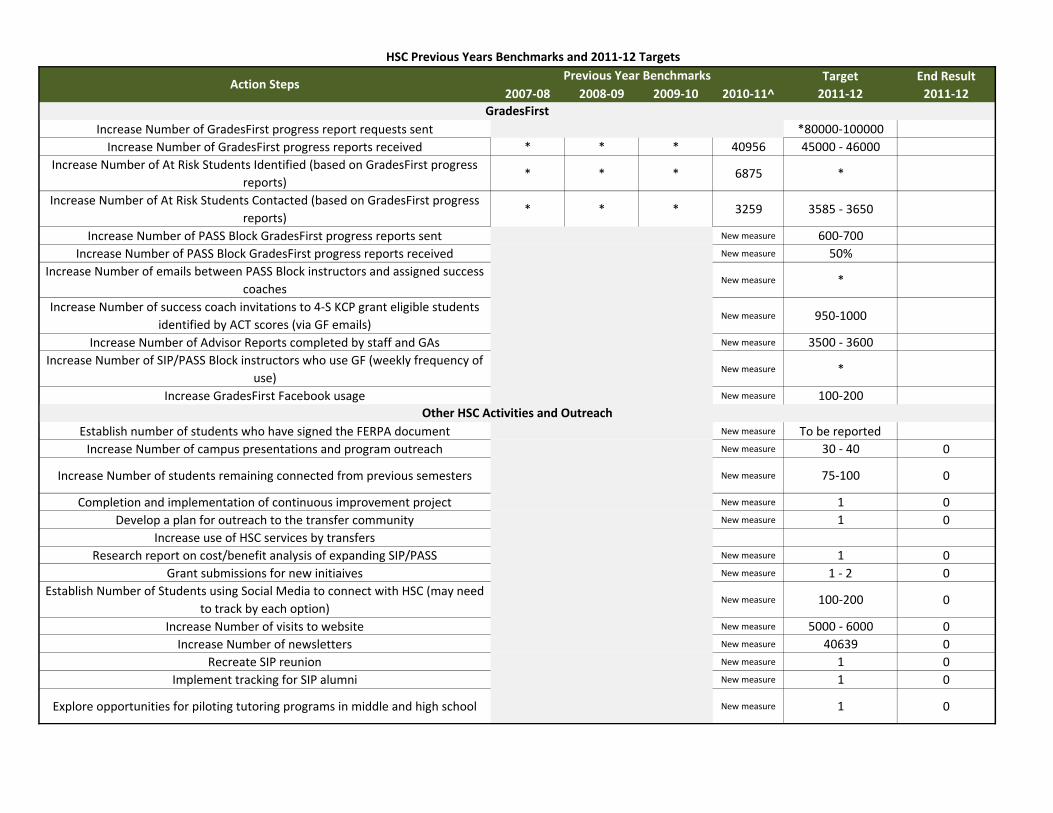
HSC Previous Years Benchmarks and 2011-12 Targets
Target End Result
2007-08 2008-09 2009-10 2010-11^ 2011-12 2011-12Action Steps
Previous Year Benchmarks
Increase Number of GradesFirst progress report requests sent *80000-100000
Increase Number of GradesFirst progress reports received * * * 40956 45000 - 46000
Increase Number of At Risk Students Identified (based on GradesFirst progress
reports)* * * 6875 *
Increase Number of At Risk Students Contacted (based on GradesFirst progress
reports)* * * 3259 3585 - 3650
Increase Number of PASS Block GradesFirst progress reports sent New measure 600-700
Increase Number of PASS Block GradesFirst progress reports received New measure 50%
Increase Number of emails between PASS Block instructors and assigned success
coachesNew measure *
Increase Number of success coach invitations to 4-S KCP grant eligible students
identified by ACT scores (via GF emails)New measure 950-1000
Increase Number of Advisor Reports completed by staff and GAs New measure 3500 - 3600
Increase Number of SIP/PASS Block instructors who use GF (weekly frequency of
use)New measure *
Increase GradesFirst Facebook usage New measure 100-200
Establish number of students who have signed the FERPA document New measure To be reported
Increase Number of campus presentations and program outreach New measure 30 - 40 0
Increase Number of students remaining connected from previous semesters New measure 75-100 0
Completion and implementation of continuous improvement project New measure 1 0
Develop a plan for outreach to the transfer community New measure 1 0
Increase use of HSC services by transfers
Research report on cost/benefit analysis of expanding SIP/PASS New measure 1 0
Grant submissions for new initiaives New measure 1 - 2 0
Establish Number of Students using Social Media to connect with HSC (may need
to track by each option)New measure 100-200 0
Increase Number of visits to website New measure 5000 - 6000 0
Increase Number of newsletters New measure 40639 0
Recreate SIP reunion New measure 1 0
Implement tracking for SIP alumni New measure 1 0
Explore opportunities for piloting tutoring programs in middle and high school New measure 1 0
Other HSC Activities and Outreach
GradesFirst
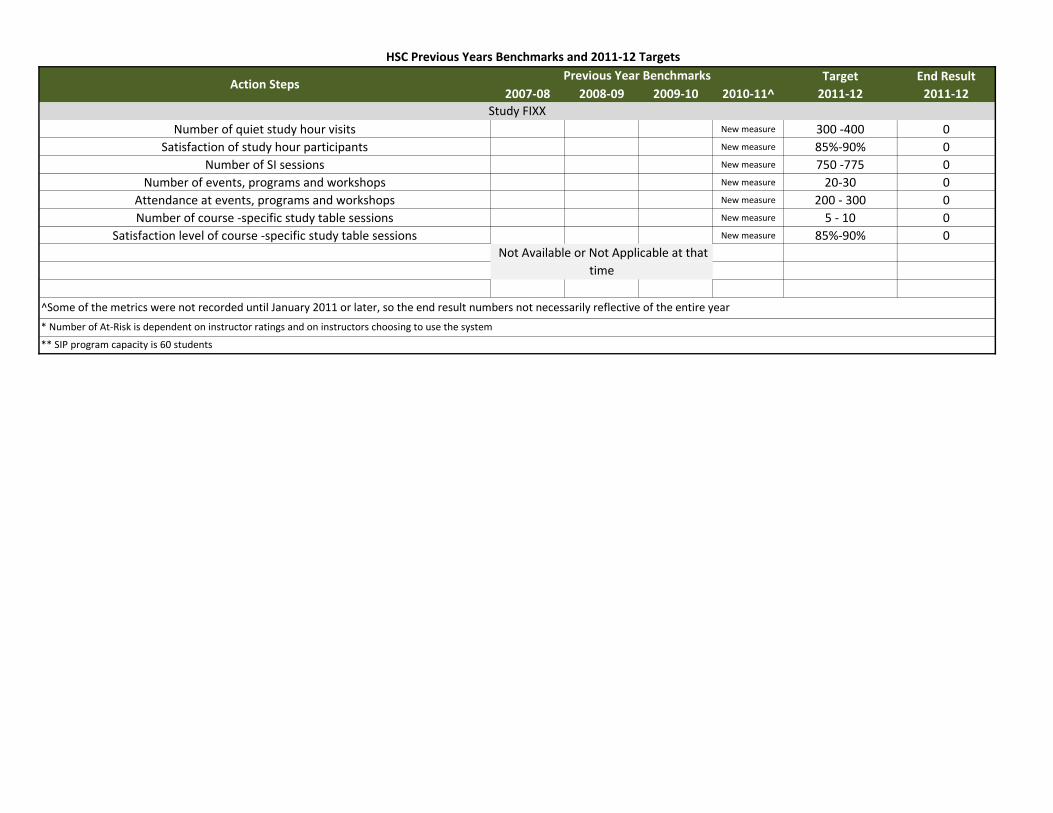
HSC Previous Years Benchmarks and 2011-12 Targets
Target End Result
2007-08 2008-09 2009-10 2010-11^ 2011-12 2011-12Action Steps
Previous Year Benchmarks
Number of quiet study hour visits New measure 300 -400 0
Satisfaction of study hour participants New measure 85%-90% 0
Number of SI sessions New measure 750 -775 0
Number of events, programs and workshops New measure 20-30 0
Attendance at events, programs and workshops New measure 200 - 300 0
Number of course -specific study table sessions New measure 5 - 10 0
Satisfaction level of course -specific study table sessions New measure 85%-90% 0
^Some of the metrics were not recorded until January 2011 or later, so the end result numbers not necessarily reflective of the entire year
* Number of At-Risk is dependent on instructor ratings and on instructors choosing to use the system
** SIP program capacity is 60 students
Study FIXX
Not Available or Not Applicable at that
time
HSC Holding the Plan Accountable Future Targets 15
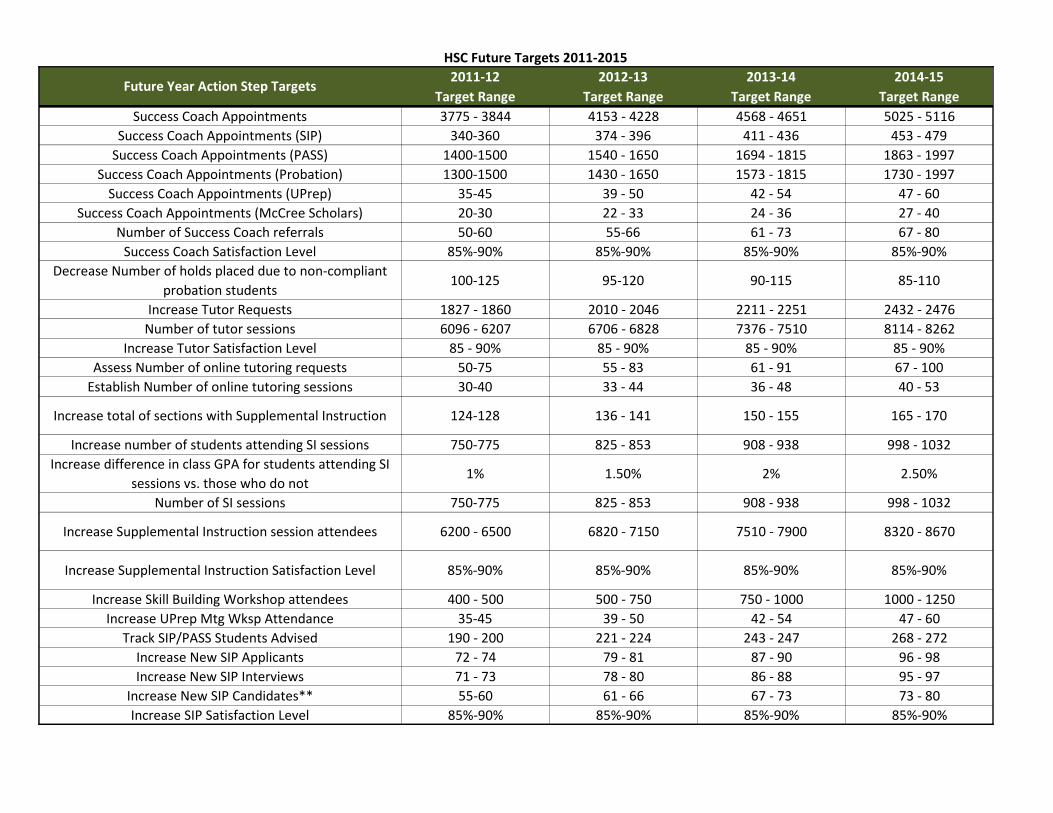
HSC Future Targets 2011-2015
2011-12 2012-13 2013-14 2014-15
Target Range Target Range Target Range Target Range
Success Coach Appointments 3775 - 3844 4153 - 4228 4568 - 4651 5025 - 5116
Success Coach Appointments (SIP) 340-360 374 - 396 411 - 436 453 - 479
Success Coach Appointments (PASS) 1400-1500 1540 - 1650 1694 - 1815 1863 - 1997
Success Coach Appointments (Probation) 1300-1500 1430 - 1650 1573 - 1815 1730 - 1997
Success Coach Appointments (UPrep) 35-45 39 - 50 42 - 54 47 - 60
Success Coach Appointments (McCree Scholars) 20-30 22 - 33 24 - 36 27 - 40
Number of Success Coach referrals 50-60 55-66 61 - 73 67 - 80
Success Coach Satisfaction Level 85%-90% 85%-90% 85%-90% 85%-90%
Decrease Number of holds placed due to non-compliant
probation students100-125 95-120 90-115 85-110
Increase Tutor Requests 1827 - 1860 2010 - 2046 2211 - 2251 2432 - 2476
Number of tutor sessions 6096 - 6207 6706 - 6828 7376 - 7510 8114 - 8262
Increase Tutor Satisfaction Level 85 - 90% 85 - 90% 85 - 90% 85 - 90%
Assess Number of online tutoring requests 50-75 55 - 83 61 - 91 67 - 100
Establish Number of online tutoring sessions 30-40 33 - 44 36 - 48 40 - 53
Increase total of sections with Supplemental Instruction 124-128 136 - 141 150 - 155 165 - 170
Increase number of students attending SI sessions 750-775 825 - 853 908 - 938 998 - 1032
Increase difference in class GPA for students attending SI
sessions vs. those who do not1% 1.50% 2% 2.50%
Number of SI sessions 750-775 825 - 853 908 - 938 998 - 1032
Increase Supplemental Instruction session attendees 6200 - 6500 6820 - 7150 7510 - 7900 8320 - 8670
Increase Supplemental Instruction Satisfaction Level 85%-90% 85%-90% 85%-90% 85%-90%
Increase Skill Building Workshop attendees 400 - 500 500 - 750 750 - 1000 1000 - 1250
Increase UPrep Mtg Wksp Attendance 35-45 39 - 50 42 - 54 47 - 60
Track SIP/PASS Students Advised 190 - 200 221 - 224 243 - 247 268 - 272
Increase New SIP Applicants 72 - 74 79 - 81 87 - 90 96 - 98
Increase New SIP Interviews 71 - 73 78 - 80 86 - 88 95 - 97
Increase New SIP Candidates** 55-60 61 - 66 67 - 73 73 - 80
Increase SIP Satisfaction Level 85%-90% 85%-90% 85%-90% 85%-90%
Future Year Action Step Targets
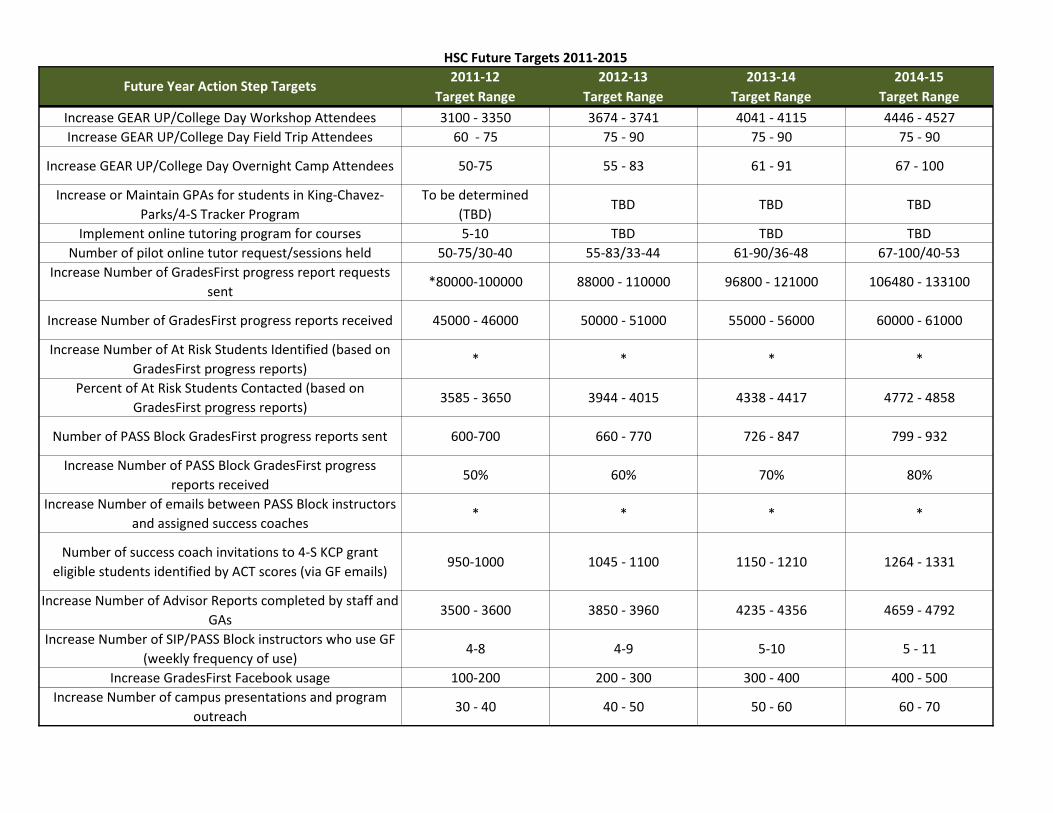
HSC Future Targets 2011-2015
2011-12 2012-13 2013-14 2014-15
Target Range Target Range Target Range Target RangeFuture Year Action Step Targets
Increase GEAR UP/College Day Workshop Attendees 3100 - 3350 3674 - 3741 4041 - 4115 4446 - 4527
Increase GEAR UP/College Day Field Trip Attendees 60 - 75 75 - 90 75 - 90 75 - 90
Increase GEAR UP/College Day Overnight Camp Attendees 50-75 55 - 83 61 - 91 67 - 100
Increase or Maintain GPAs for students in King-Chavez-
Parks/4-S Tracker Program
To be determined
(TBD)TBD TBD TBD
Implement online tutoring program for courses 5-10 TBD TBD TBD
Number of pilot online tutor request/sessions held 50-75/30-40 55-83/33-44 61-90/36-48 67-100/40-53
Increase Number of GradesFirst progress report requests
sent*80000-100000 88000 - 110000 96800 - 121000 106480 - 133100
Increase Number of GradesFirst progress reports received 45000 - 46000 50000 - 51000 55000 - 56000 60000 - 61000
Increase Number of At Risk Students Identified (based on
GradesFirst progress reports)* * * *
Percent of At Risk Students Contacted (based on
GradesFirst progress reports)3585 - 3650 3944 - 4015 4338 - 4417 4772 - 4858
Number of PASS Block GradesFirst progress reports sent 600-700 660 - 770 726 - 847 799 - 932
Increase Number of PASS Block GradesFirst progress
reports received50% 60% 70% 80%
Increase Number of emails between PASS Block instructors
and assigned success coaches* * * *
Number of success coach invitations to 4-S KCP grant
eligible students identified by ACT scores (via GF emails)950-1000 1045 - 1100 1150 - 1210 1264 - 1331
Increase Number of Advisor Reports completed by staff and
GAs3500 - 3600 3850 - 3960 4235 - 4356 4659 - 4792
Increase Number of SIP/PASS Block instructors who use GF
(weekly frequency of use)4-8 4-9 5-10 5 - 11
Increase GradesFirst Facebook usage 100-200 200 - 300 300 - 400 400 - 500
Increase Number of campus presentations and program
outreach30 - 40 40 - 50 50 - 60 60 - 70
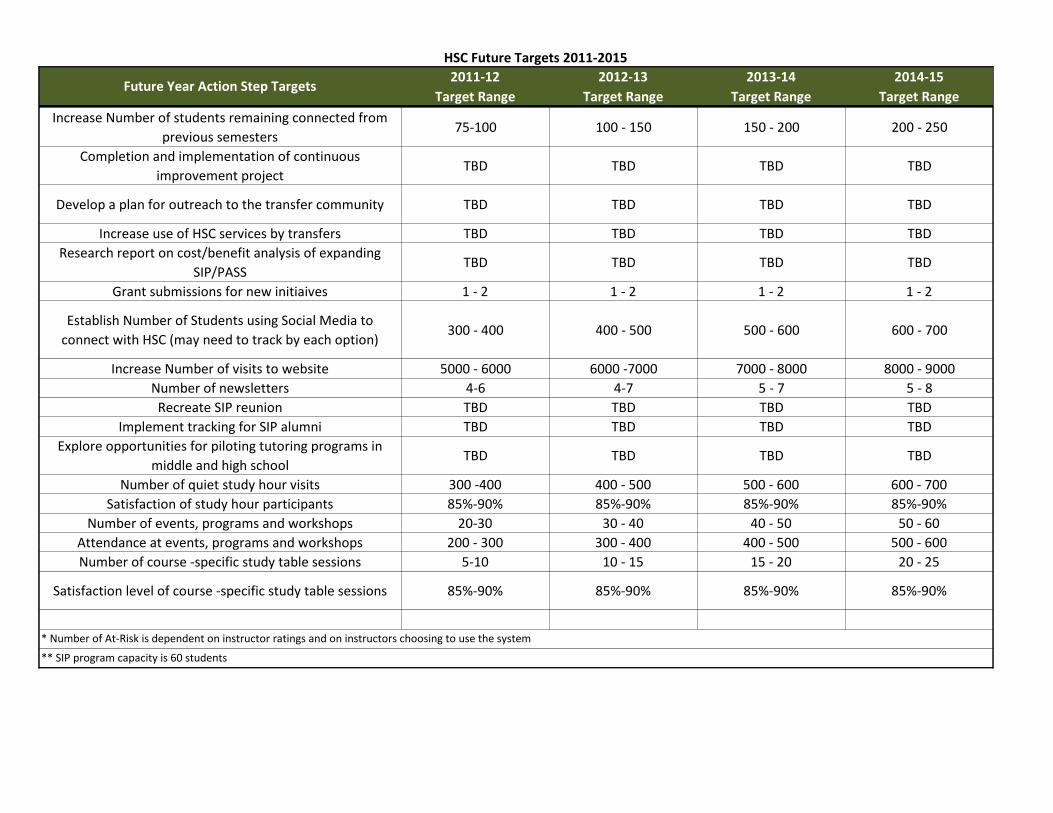
HSC Future Targets 2011-2015
2011-12 2012-13 2013-14 2014-15
Target Range Target Range Target Range Target RangeFuture Year Action Step Targets
Increase Number of students remaining connected from
previous semesters75-100 100 - 150 150 - 200 200 - 250
Completion and implementation of continuous
improvement projectTBD TBD TBD TBD
Develop a plan for outreach to the transfer community TBD TBD TBD TBD
Increase use of HSC services by transfers TBD TBD TBD TBD
Research report on cost/benefit analysis of expanding
SIP/PASSTBD TBD TBD TBD
Grant submissions for new initiaives 1 - 2 1 - 2 1 - 2 1 - 2
Establish Number of Students using Social Media to
connect with HSC (may need to track by each option)300 - 400 400 - 500 500 - 600 600 - 700
Increase Number of visits to website 5000 - 6000 6000 -7000 7000 - 8000 8000 - 9000
Number of newsletters 4-6 4-7 5 - 7 5 - 8
Recreate SIP reunion TBD TBD TBD TBD
Implement tracking for SIP alumni TBD TBD TBD TBD
Explore opportunities for piloting tutoring programs in
middle and high schoolTBD TBD TBD TBD
Number of quiet study hour visits 300 -400 400 - 500 500 - 600 600 - 700
Satisfaction of study hour participants 85%-90% 85%-90% 85%-90% 85%-90%
Number of events, programs and workshops 20-30 30 - 40 40 - 50 50 - 60
Attendance at events, programs and workshops 200 - 300 300 - 400 400 - 500 500 - 600
Number of course -specific study table sessions 5-10 10 - 15 15 - 20 20 - 25
Satisfaction level of course -specific study table sessions 85%-90% 85%-90% 85%-90% 85%-90%
* Number of At-Risk is dependent on instructor ratings and on instructors choosing to use the system
** SIP program capacity is 60 students
Coordinated Student Advising Team (CSAT)
Plan in Action
16
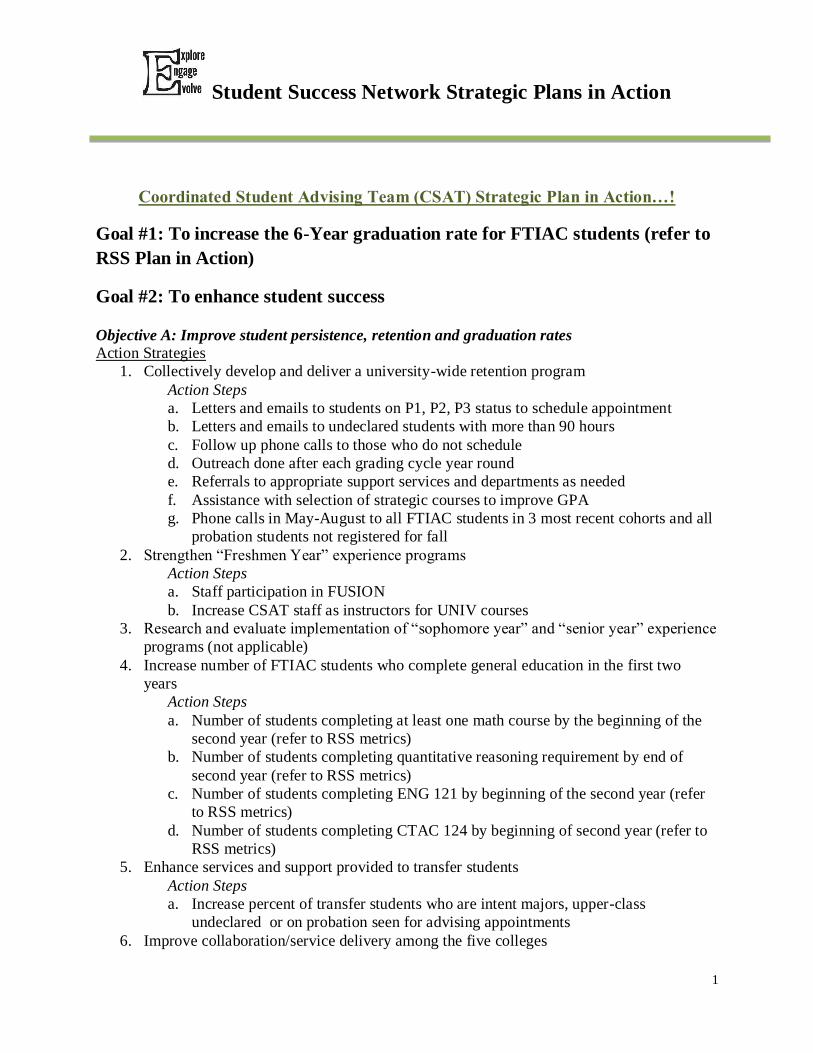
1
Student Success Network Strategic Plans in Action
Coordinated Student Advising Team (CSAT) Strategic Plan in Action…!
Goal #1: To increase the 6-Year graduation rate for FTIAC students (refer to
RSS Plan in Action)
Goal #2: To enhance student success
Objective A: Improve student persistence, retention and graduation rates
Action Strategies
1. Collectively develop and deliver a university-wide retention program
Action Steps
a. Letters and emails to students on P1, P2, P3 status to schedule appointment
b. Letters and emails to undeclared students with more than 90 hours
c. Follow up phone calls to those who do not schedule
d. Outreach done after each grading cycle year round
e. Referrals to appropriate support services and departments as needed
f. Assistance with selection of strategic courses to improve GPA
g. Phone calls in May-August to all FTIAC students in 3 most recent cohorts and all
probation students not registered for fall
2. Strengthen “Freshmen Year” experience programs
Action Steps
a. Staff participation in FUSION
b. Increase CSAT staff as instructors for UNIV courses
3. Research and evaluate implementation of “sophomore year” and “senior year” experience
programs (not applicable)
4. Increase number of FTIAC students who complete general education in the first two
years
Action Steps
a. Number of students completing at least one math course by the beginning of the
second year (refer to RSS metrics)
b. Number of students completing quantitative reasoning requirement by end of
second year (refer to RSS metrics)
c. Number of students completing ENG 121 by beginning of the second year (refer
to RSS metrics)
d. Number of students completing CTAC 124 by beginning of second year (refer to
RSS metrics)
5. Enhance services and support provided to transfer students
Action Steps
a. Increase percent of transfer students who are intent majors, upper-class
undeclared or on probation seen for advising appointments
6. Improve collaboration/service delivery among the five colleges
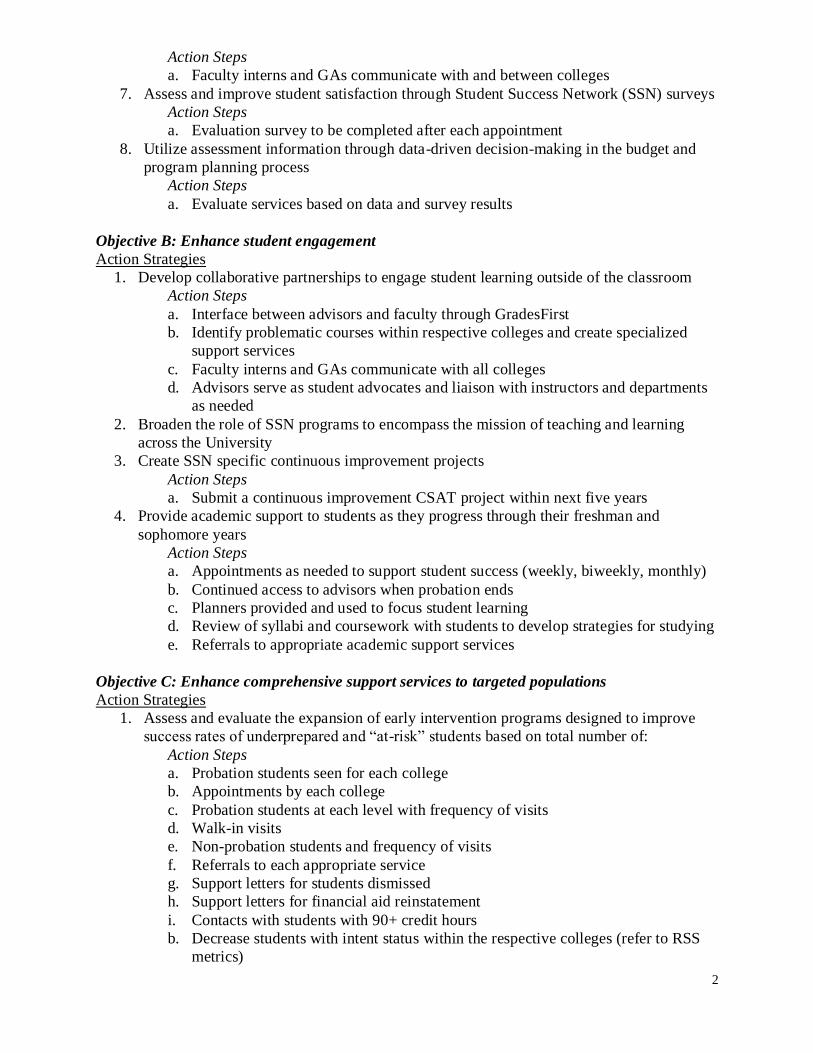
2
Action Steps
a. Faculty interns and GAs communicate with and between colleges
7. Assess and improve student satisfaction through Student Success Network (SSN) surveys
Action Steps
a. Evaluation survey to be completed after each appointment
8. Utilize assessment information through data-driven decision-making in the budget and
program planning process
Action Steps
a. Evaluate services based on data and survey results
Objective B: Enhance student engagement
Action Strategies
1. Develop collaborative partnerships to engage student learning outside of the classroom
Action Steps
a. Interface between advisors and faculty through GradesFirst
b. Identify problematic courses within respective colleges and create specialized
support services
c. Faculty interns and GAs communicate with all colleges
d. Advisors serve as student advocates and liaison with instructors and departments
as needed
2. Broaden the role of SSN programs to encompass the mission of teaching and learning
across the University
3. Create SSN specific continuous improvement projects
Action Steps
a. Submit a continuous improvement CSAT project within next five years
4. Provide academic support to students as they progress through their freshman and
sophomore years
Action Steps
a. Appointments as needed to support student success (weekly, biweekly, monthly)
b. Continued access to advisors when probation ends
c. Planners provided and used to focus student learning
d. Review of syllabi and coursework with students to develop strategies for studying
e. Referrals to appropriate academic support services
Objective C: Enhance comprehensive support services to targeted populations
Action Strategies
1. Assess and evaluate the expansion of early intervention programs designed to improve
success rates of underprepared and “at-risk” students based on total number of:
Action Steps
a. Probation students seen for each college
b. Appointments by each college
c. Probation students at each level with frequency of visits
d. Walk-in visits
e. Non-probation students and frequency of visits
f. Referrals to each appropriate service
g. Support letters for students dismissed
h. Support letters for financial aid reinstatement
i. Contacts with students with 90+ credit hours
b. Decrease students with intent status within the respective colleges (refer to RSS
metrics)
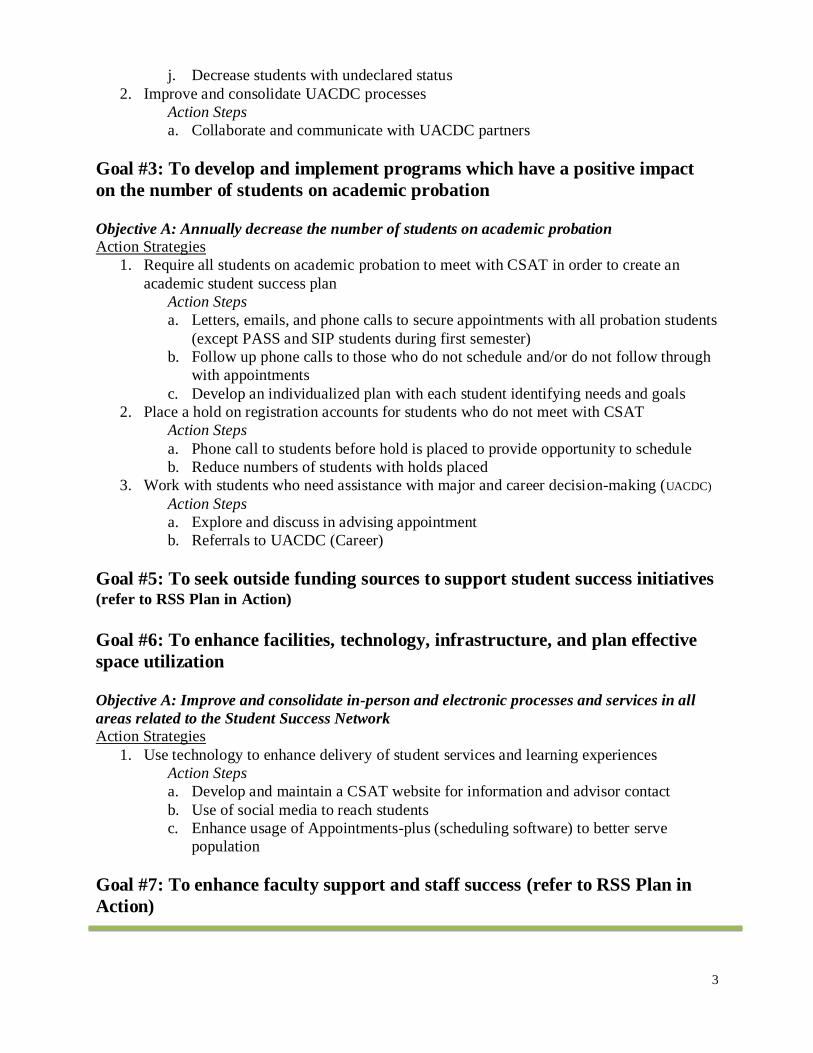
3
j. Decrease students with undeclared status
2. Improve and consolidate UACDC processes
Action Steps
a. Collaborate and communicate with UACDC partners
Goal #3: To develop and implement programs which have a positive impact
on the number of students on academic probation
Objective A: Annually decrease the number of students on academic probation
Action Strategies
1. Require all students on academic probation to meet with CSAT in order to create an
academic student success plan
Action Steps
a. Letters, emails, and phone calls to secure appointments with all probation students
(except PASS and SIP students during first semester)
b. Follow up phone calls to those who do not schedule and/or do not follow through
with appointments
c. Develop an individualized plan with each student identifying needs and goals
2. Place a hold on registration accounts for students who do not meet with CSAT
Action Steps
a. Phone call to students before hold is placed to provide opportunity to schedule
b. Reduce numbers of students with holds placed
3. Work with students who need assistance with major and career decision-making (UACDC)
Action Steps
a. Explore and discuss in advising appointment
b. Referrals to UACDC (Career)
Goal #5: To seek outside funding sources to support student success initiatives (refer to RSS Plan in Action)
Goal #6: To enhance facilities, technology, infrastructure, and plan effective
space utilization
Objective A: Improve and consolidate in-person and electronic processes and services in all
areas related to the Student Success Network
Action Strategies
1. Use technology to enhance delivery of student services and learning experiences
Action Steps
a. Develop and maintain a CSAT website for information and advisor contact
b. Use of social media to reach students
c. Enhance usage of Appointments-plus (scheduling software) to better serve
population
Goal #7: To enhance faculty support and staff success (refer to RSS Plan in
Action)

CSAT Holding the Plan Accountable Benchmarks 17
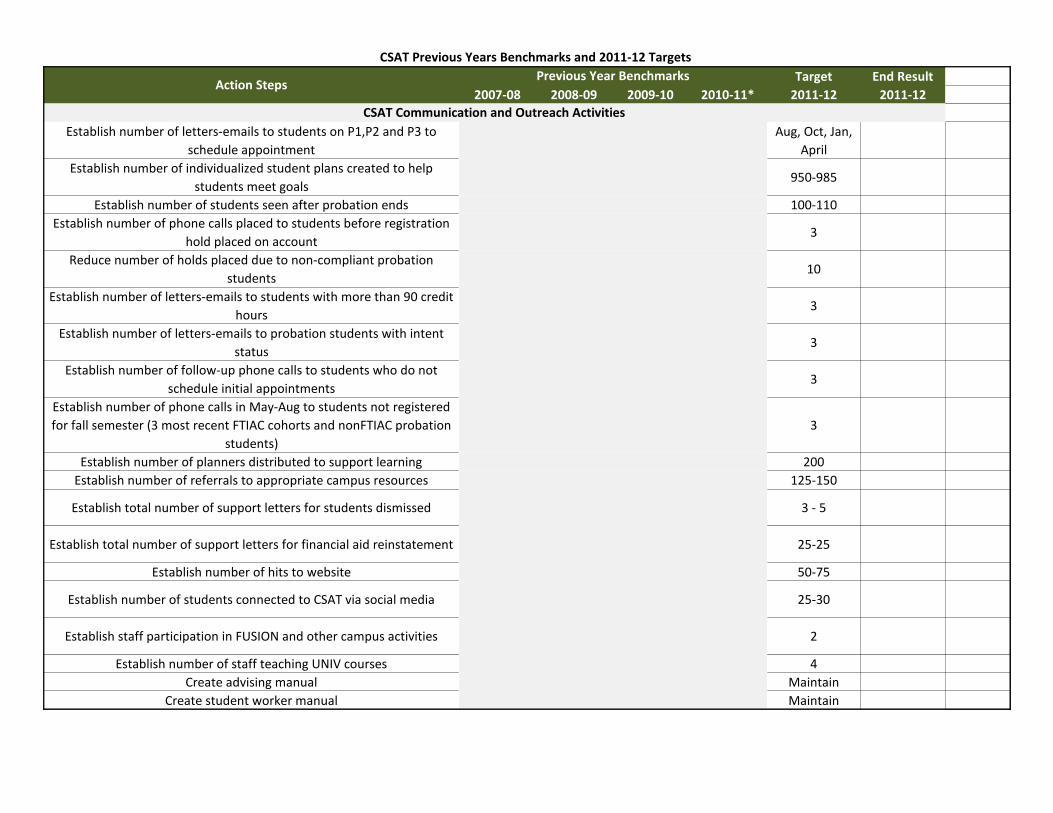
CSAT Previous Years Benchmarks and 2011-12 Targets
Target End Result
2007-08 2008-09 2009-10 2010-11* 2011-12 2011-12
Establish number of letters-emails to students on P1,P2 and P3 to
schedule appointment
Aug, Oct, Jan,
April
Establish number of individualized student plans created to help
students meet goals950-985
Establish number of students seen after probation ends 100-110
Establish number of phone calls placed to students before registration
hold placed on account3
Reduce number of holds placed due to non-compliant probation
students10
Establish number of letters-emails to students with more than 90 credit
hours3
Establish number of letters-emails to probation students with intent
status3
Establish number of follow-up phone calls to students who do not
schedule initial appointments3
Establish number of phone calls in May-Aug to students not registered
for fall semester (3 most recent FTIAC cohorts and nonFTIAC probation
students)
3
Establish number of planners distributed to support learning 200
Establish number of referrals to appropriate campus resources 125-150
Establish total number of support letters for students dismissed 3 - 5
Establish total number of support letters for financial aid reinstatement 25-25
Establish number of hits to website 50-75
Establish number of students connected to CSAT via social media 25-30
Establish staff participation in FUSION and other campus activities 2
Establish number of staff teaching UNIV courses 4
Create advising manual Maintain
Create student worker manual Maintain
Action StepsPrevious Year Benchmarks
CSAT Communication and Outreach Activities
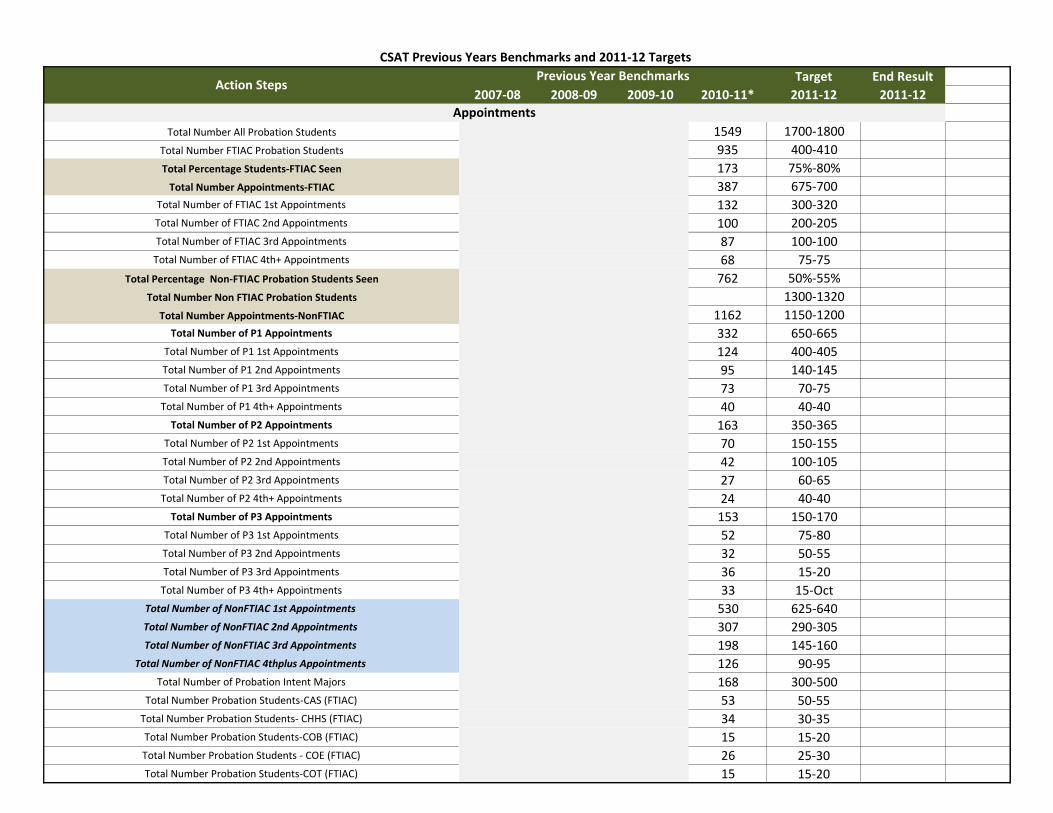
CSAT Previous Years Benchmarks and 2011-12 Targets
Target End Result
2007-08 2008-09 2009-10 2010-11* 2011-12 2011-12Action Steps
Previous Year Benchmarks
Total Number All Probation Students 1549 1700-1800
Total Number FTIAC Probation Students 935 400-410
Total Percentage Students-FTIAC Seen 173 75%-80%
Total Number Appointments-FTIAC 387 675-700
Total Number of FTIAC 1st Appointments 132 300-320
Total Number of FTIAC 2nd Appointments 100 200-205
Total Number of FTIAC 3rd Appointments 87 100-100
Total Number of FTIAC 4th+ Appointments 68 75-75
Total Percentage Non-FTIAC Probation Students Seen 762 50%-55%
Total Number Non FTIAC Probation Students 1300-1320
Total Number Appointments-NonFTIAC 1162 1150-1200
Total Number of P1 Appointments 332 650-665
Total Number of P1 1st Appointments 124 400-405
Total Number of P1 2nd Appointments 95 140-145
Total Number of P1 3rd Appointments 73 70-75
Total Number of P1 4th+ Appointments 40 40-40
Total Number of P2 Appointments 163 350-365
Total Number of P2 1st Appointments 70 150-155
Total Number of P2 2nd Appointments 42 100-105
Total Number of P2 3rd Appointments 27 60-65
Total Number of P2 4th+ Appointments 24 40-40
Total Number of P3 Appointments 153 150-170
Total Number of P3 1st Appointments 52 75-80
Total Number of P3 2nd Appointments 32 50-55
Total Number of P3 3rd Appointments 36 15-20
Total Number of P3 4th+ Appointments 33 15-Oct
Total Number of NonFTIAC 1st Appointments 530 625-640
Total Number of NonFTIAC 2nd Appointments 307 290-305
Total Number of NonFTIAC 3rd Appointments 198 145-160
Total Number of NonFTIAC 4thplus Appointments 126 90-95
Total Number of Probation Intent Majors 168 300-500
Total Number Probation Students-CAS (FTIAC) 53 50-55Total Number Probation Students- CHHS (FTIAC) 34 30-35Total Number Probation Students-COB (FTIAC) 15 15-20Total Number Probation Students - COE (FTIAC) 26 25-30Total Number Probation Students-COT (FTIAC) 15 15-20
Appointments
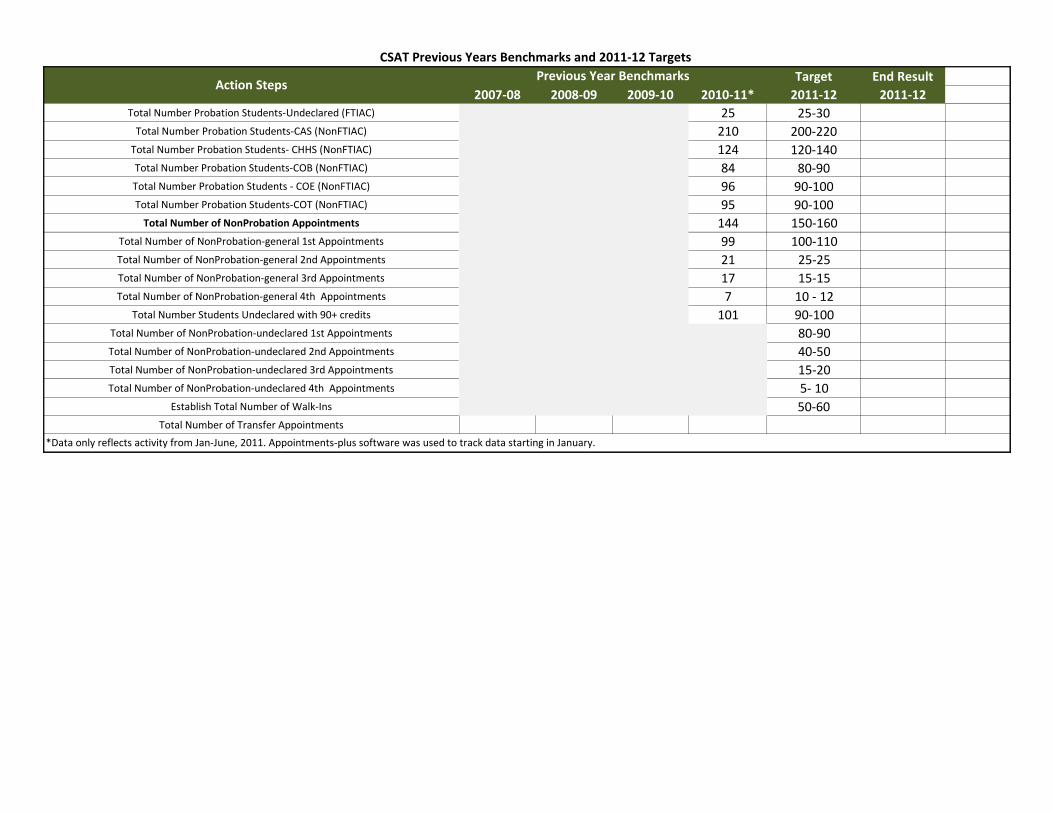
CSAT Previous Years Benchmarks and 2011-12 Targets
Target End Result
2007-08 2008-09 2009-10 2010-11* 2011-12 2011-12Action Steps
Previous Year Benchmarks
Total Number Probation Students-Undeclared (FTIAC) 25 25-30Total Number Probation Students-CAS (NonFTIAC) 210 200-220
Total Number Probation Students- CHHS (NonFTIAC) 124 120-140Total Number Probation Students-COB (NonFTIAC) 84 80-90Total Number Probation Students - COE (NonFTIAC) 96 90-100Total Number Probation Students-COT (NonFTIAC) 95 90-100
Total Number of NonProbation Appointments 144 150-160
Total Number of NonProbation-general 1st Appointments 99 100-110
Total Number of NonProbation-general 2nd Appointments 21 25-25
Total Number of NonProbation-general 3rd Appointments 17 15-15
Total Number of NonProbation-general 4th Appointments 7 10 - 12
Total Number Students Undeclared with 90+ credits 101 90-100
Total Number of NonProbation-undeclared 1st Appointments 80-90
Total Number of NonProbation-undeclared 2nd Appointments 40-50
Total Number of NonProbation-undeclared 3rd Appointments 15-20
Total Number of NonProbation-undeclared 4th Appointments 5- 10
Establish Total Number of Walk-Ins 50-60Total Number of Transfer Appointments
*Data only reflects activity from Jan-June, 2011. Appointments-plus software was used to track data starting in January.

CSAT Holding the Plan Accountable Future Targets 18
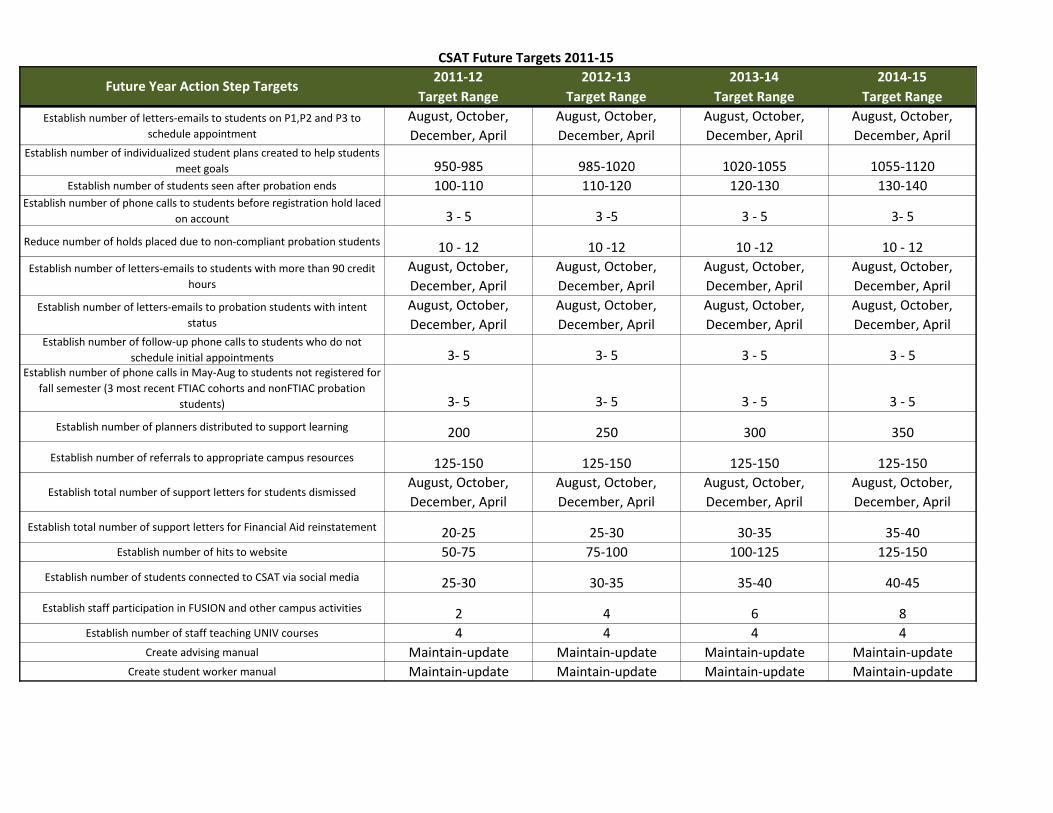
CSAT Future Targets 2011-15
2011-12 2012-13 2013-14 2014-15
Target Range Target Range Target Range Target Range
Establish number of letters-emails to students on P1,P2 and P3 to
schedule appointment
August, October,
December, April
August, October,
December, April
August, October,
December, April
August, October,
December, AprilEstablish number of individualized student plans created to help students
meet goals 950-985 985-1020 1020-1055 1055-1120
Establish number of students seen after probation ends 100-110 110-120 120-130 130-140Establish number of phone calls to students before registration hold laced
on account 3 - 5 3 -5 3 - 5 3- 5
Reduce number of holds placed due to non-compliant probation students 10 - 12 10 -12 10 -12 10 - 12
Establish number of letters-emails to students with more than 90 credit
hours
August, October,
December, April
August, October,
December, April
August, October,
December, April
August, October,
December, April
Establish number of letters-emails to probation students with intent
status
August, October,
December, April
August, October,
December, April
August, October,
December, April
August, October,
December, AprilEstablish number of follow-up phone calls to students who do not
schedule initial appointments 3- 5 3- 5 3 - 5 3 - 5Establish number of phone calls in May-Aug to students not registered for
fall semester (3 most recent FTIAC cohorts and nonFTIAC probation
students) 3- 5 3- 5 3 - 5 3 - 5
Establish number of planners distributed to support learning 200 250 300 350
Establish number of referrals to appropriate campus resources 125-150 125-150 125-150 125-150
Establish total number of support letters for students dismissedAugust, October,
December, April
August, October,
December, April
August, October,
December, April
August, October,
December, April
Establish total number of support letters for Financial Aid reinstatement 20-25 25-30 30-35 35-40
Establish number of hits to website 50-75 75-100 100-125 125-150
Establish number of students connected to CSAT via social media 25-30 30-35 35-40 40-45
Establish staff participation in FUSION and other campus activities 2 4 6 8
Establish number of staff teaching UNIV courses 4 4 4 4
Create advising manual Maintain-update Maintain-update Maintain-update Maintain-update
Create student worker manual Maintain-update Maintain-update Maintain-update Maintain-update
Future Year Action Step Targets
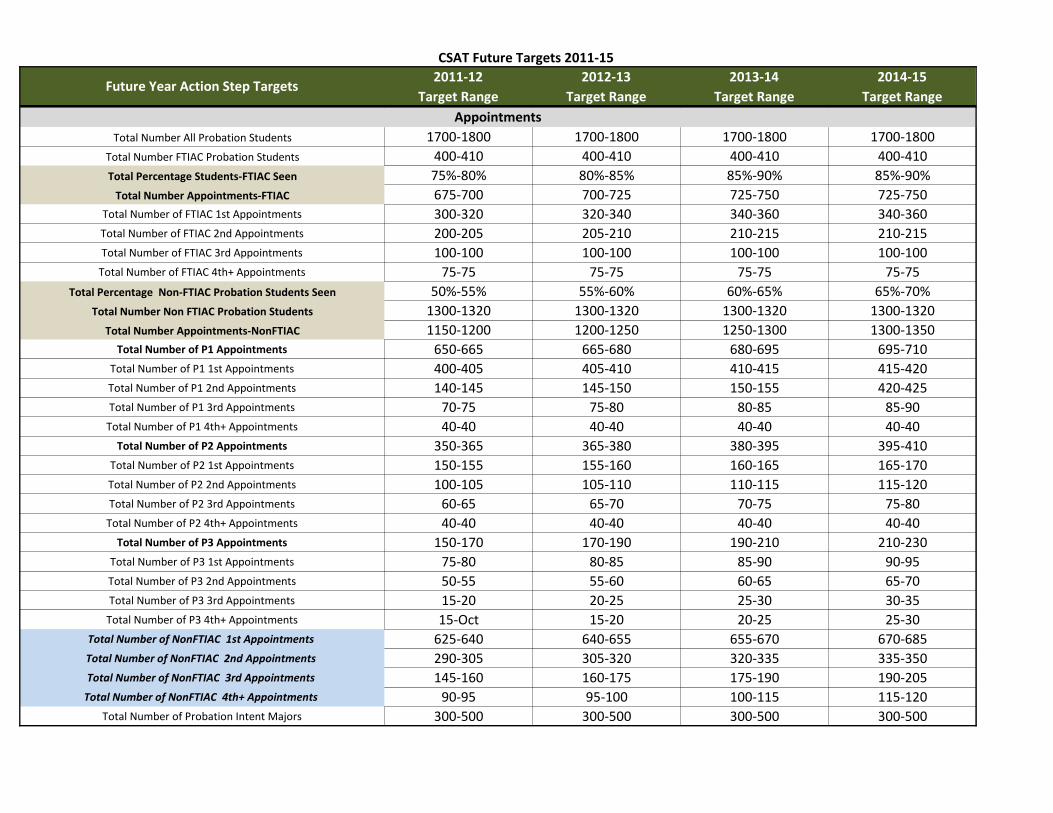
CSAT Future Targets 2011-15
2011-12 2012-13 2013-14 2014-15
Target Range Target Range Target Range Target RangeFuture Year Action Step Targets
Total Number All Probation Students 1700-1800 1700-1800 1700-1800 1700-1800
Total Number FTIAC Probation Students 400-410 400-410 400-410 400-410
Total Percentage Students-FTIAC Seen 75%-80% 80%-85% 85%-90% 85%-90%
Total Number Appointments-FTIAC 675-700 700-725 725-750 725-750
Total Number of FTIAC 1st Appointments 300-320 320-340 340-360 340-360
Total Number of FTIAC 2nd Appointments 200-205 205-210 210-215 210-215
Total Number of FTIAC 3rd Appointments 100-100 100-100 100-100 100-100
Total Number of FTIAC 4th+ Appointments 75-75 75-75 75-75 75-75
Total Percentage Non-FTIAC Probation Students Seen 50%-55% 55%-60% 60%-65% 65%-70%
Total Number Non FTIAC Probation Students 1300-1320 1300-1320 1300-1320 1300-1320
Total Number Appointments-NonFTIAC 1150-1200 1200-1250 1250-1300 1300-1350
Total Number of P1 Appointments 650-665 665-680 680-695 695-710
Total Number of P1 1st Appointments 400-405 405-410 410-415 415-420
Total Number of P1 2nd Appointments 140-145 145-150 150-155 420-425
Total Number of P1 3rd Appointments 70-75 75-80 80-85 85-90
Total Number of P1 4th+ Appointments 40-40 40-40 40-40 40-40
Total Number of P2 Appointments 350-365 365-380 380-395 395-410
Total Number of P2 1st Appointments 150-155 155-160 160-165 165-170
Total Number of P2 2nd Appointments 100-105 105-110 110-115 115-120
Total Number of P2 3rd Appointments 60-65 65-70 70-75 75-80
Total Number of P2 4th+ Appointments 40-40 40-40 40-40 40-40
Total Number of P3 Appointments 150-170 170-190 190-210 210-230
Total Number of P3 1st Appointments 75-80 80-85 85-90 90-95
Total Number of P3 2nd Appointments 50-55 55-60 60-65 65-70
Total Number of P3 3rd Appointments 15-20 20-25 25-30 30-35
Total Number of P3 4th+ Appointments 15-Oct 15-20 20-25 25-30
Total Number of NonFTIAC 1st Appointments 625-640 640-655 655-670 670-685
Total Number of NonFTIAC 2nd Appointments 290-305 305-320 320-335 335-350
Total Number of NonFTIAC 3rd Appointments 145-160 160-175 175-190 190-205
Total Number of NonFTIAC 4th+ Appointments 90-95 95-100 100-115 115-120
Total Number of Probation Intent Majors 300-500 300-500 300-500 300-500
Appointments
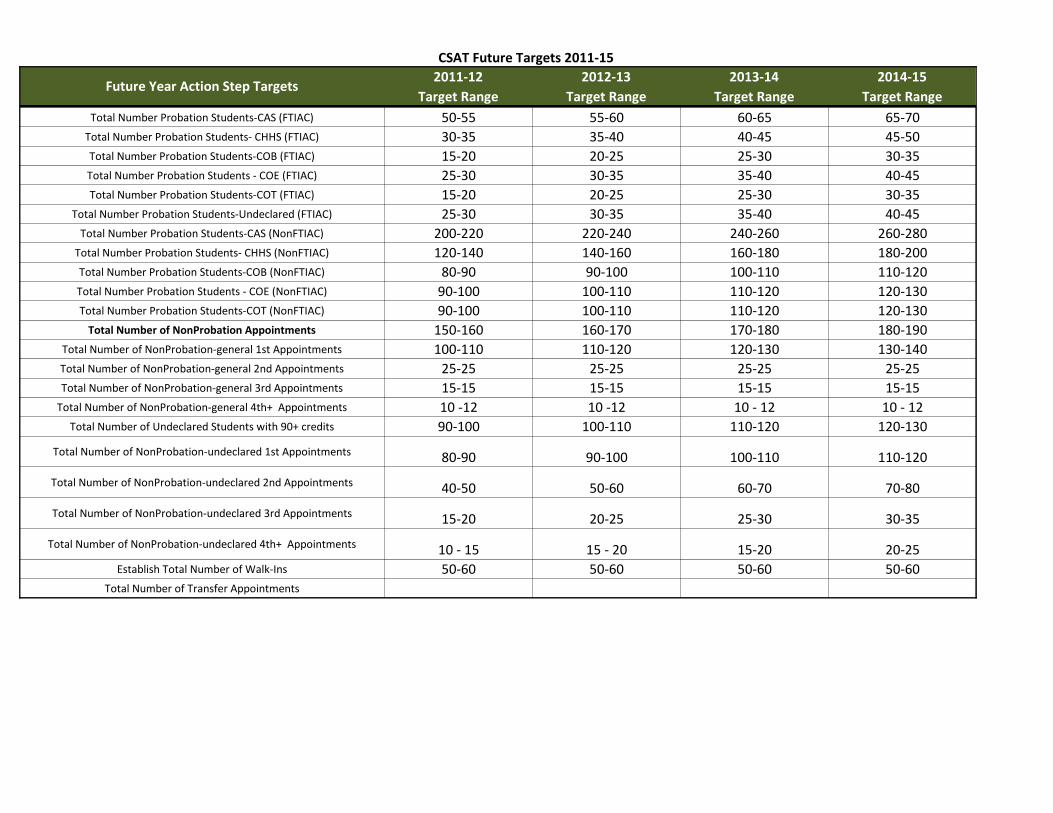
CSAT Future Targets 2011-15
2011-12 2012-13 2013-14 2014-15
Target Range Target Range Target Range Target RangeFuture Year Action Step Targets
Total Number Probation Students-CAS (FTIAC) 50-55 55-60 60-65 65-70
Total Number Probation Students- CHHS (FTIAC) 30-35 35-40 40-45 45-50
Total Number Probation Students-COB (FTIAC) 15-20 20-25 25-30 30-35
Total Number Probation Students - COE (FTIAC) 25-30 30-35 35-40 40-45
Total Number Probation Students-COT (FTIAC) 15-20 20-25 25-30 30-35
Total Number Probation Students-Undeclared (FTIAC) 25-30 30-35 35-40 40-45
Total Number Probation Students-CAS (NonFTIAC) 200-220 220-240 240-260 260-280
Total Number Probation Students- CHHS (NonFTIAC) 120-140 140-160 160-180 180-200
Total Number Probation Students-COB (NonFTIAC) 80-90 90-100 100-110 110-120
Total Number Probation Students - COE (NonFTIAC) 90-100 100-110 110-120 120-130
Total Number Probation Students-COT (NonFTIAC) 90-100 100-110 110-120 120-130
Total Number of NonProbation Appointments 150-160 160-170 170-180 180-190
Total Number of NonProbation-general 1st Appointments 100-110 110-120 120-130 130-140
Total Number of NonProbation-general 2nd Appointments 25-25 25-25 25-25 25-25
Total Number of NonProbation-general 3rd Appointments 15-15 15-15 15-15 15-15
Total Number of NonProbation-general 4th+ Appointments 10 -12 10 -12 10 - 12 10 - 12
Total Number of Undeclared Students with 90+ credits 90-100 100-110 110-120 120-130
Total Number of NonProbation-undeclared 1st Appointments 80-90 90-100 100-110 110-120
Total Number of NonProbation-undeclared 2nd Appointments 40-50 50-60 60-70 70-80
Total Number of NonProbation-undeclared 3rd Appointments 15-20 20-25 25-30 30-35
Total Number of NonProbation-undeclared 4th+ Appointments 10 - 15 15 - 20 15-20 20-25
Establish Total Number of Walk-Ins 50-60 50-60 50-60 50-60
Total Number of Transfer Appointments
Disability Resource Center (DRC)
Plan in Action 19
1
Student Success Network Strategic Plans in Action
Disability Resource Center (DRC) Strategic Plan in Action…!
Goal #1: To increase the 6-Year graduation rate for FTIAC students (refer to
RSS Plan in Action)
Goal #2: To enhance student success
Objective A: Improve student persistence, retention and graduation rates
Action Strategies
1. Collectively develop and deliver a university-wide retention program
Action Steps
a. Personalized follow-up emails after first visit
2. Strengthen “Freshmen Year” experience programs
Action Steps
a. Students participating in DRC mentor program
b. Staff hours spent on DRC mentor program
c. Students participating in DRC Live 100% Now program
d. Students participating in DRC You Are Smarter Than You Think! (YASTYT)
program
e. Staff hours spent on DRC YASTYT program
3. Research and evaluate implementation of “sophomore year” and “senior year” experience
programs (not applicable)
4. Increase number of FTIAC students who complete general education in the first two
years
Action Steps
a. Number of students completing at least one math course by the beginning of the
second year (refer to RSS metrics)
b. Number of students completing quantitative reasoning requirement by end of
second year (refer to RSS metrics)
c. Number of students completing ENG 121 by beginning of the second year (refer
to RSS metrics)
d. Number of students completing CTAC 124 by beginning of second year (refer to
RSS metrics)
5. Enhance services and support provided to transfer students
Action Steps
a. Increase numbers of transfer students using DRC services
6. Decrease the number of Intent students within the respective colleges (not applicable)
7. Improve collaboration/service delivery among the five colleges
Action Steps
a. Enhance communication and services for the DRC
2
8. Assess and improve student satisfaction through Student Success Network (SSN) surveys
Action Steps
a. Overall DRC satisfaction survey
b. DRC Mentor satisfaction survey
c. YASTYT satisfaction survey
d. Live 100% Now satisfaction survey
9. Utilize assessment information through data-driven decision-making in the budget and
program planning process
Action Steps
a. Evaluate services based on data and survey results
Objective B: Enhance student engagement
Action Strategies
1. Develop collaborative partnerships to engage student learning outside of the classroom
Action Steps
a. Students participating in DRC mentor program
b. Students participating in DRC Live 100% Now program
c. Students participating in DRC You Are Smarter Than You Think! (YASTYT)
Program
d. DRC Campus presentations and program outreach
2. Broaden the role of SSN programs to encompass the mission of teaching and learning
across the University
Action Steps
a. DRC inclusive design presentations
b. Number of faculty utilizing inclusive design strategy
3. Create SSN specific continuous improvement projects
Action Steps
a. Submit a continuous improvement DRC project within next five years
4. Provide academic support to students as they progress through their freshman and
sophomore years
Action Steps
a. Students remaining connected from previous semester
5. Create sustainable career programs to support students as they progress through their
junior and senior years
Action Steps
a. Increase DRC student population taking advantage of these services
6. Establish advisory committees for different SSN areas and in collaboration with other
university efforts
Action Steps
a. Enhance the visibility of the DRC advisory committee
Objective C: Enhance comprehensive support services to targeted populations
Action Strategies
1. Assess and evaluate the expansion of early intervention programs designed to improve
success rates of underprepared and “at-risk” students by increasing:
Action Steps
a. Total number of accommodation letters distributed
3
b. Total number of appointments
c. Total number of walk-in visits
d. Total number of new students (initial meetings)
e. Total number of returning student visits
f. Total number of students using interpreters and CART (for hearing impairments)
g. Total interpreter expenses
h. Total CART expenses
i. Total hearing impairment expenses
Goal #3: To develop and implement programs which have a positive impact
on the number of students on academic probation (refer to RSS Plan in
Action)
Goal #4: To be recognized for service and public engagement
Objective B: Develop community relationships with employers, community colleges, high
schools and middle schools
Action Strategies
1. Create relationships with regional employers to expand opportunities for students (not
applicable)
2. Create programs to enhance the transfer student academic experience
Action Steps
a. Transfer programs for our community college feeder schools
3. Pilot programs in middle schools and high schools to increase the student understanding
of the collegiate experience
Action Steps
a. Host a disability transition program at EMU in fall semester
Goal #5: To seek outside funding sources to support student success initiatives
(refer to RSS Plan in Action)
Goal #6: To enhance facilities, technology, infrastructure, and plan effective
space utilization
Objective A: Improve and consolidate in-person and electronic processes and services in all
areas related to the Student Success Network
Action Strategies
1. Use technology to enhance delivery of student services and learning experiences
Action Steps
a. Number of students using alternative media each semester
b. Number of alternative media books provided to students
c. Number of hours spent on alternative media process
Goal #7: To enhance faculty support and staff success (refer to RSS Plan in
Action)

DRC Holding the Plan Accountable Benchmarks 20

DRC Previous Year Benchmarks and 2011-12 Targets
Target End Result
2007-08 2008-09 2009-10 2010-11^ 2011-12 2011-12
Increase Total Number of Accommodation Letters Distributed 472 518 506 608 700 - 800
Increase Total Number of Appointments 379 700 - 800
Increase Total Number of Walk-Ins 151 700 - 800
Total Number of New Students (Intakes) 137 300 - 400
Personalized Follow-Up Emails After Intakes 300 - 400
Increase Total Number of Returning Student Visits 259 1000 - 1200
Establish Total number of current students with past/current DRC
connection (not using letters; initial visit only or no return to letters)900 - 1000
Establish percentage of Students Remaining Connected From Previous
Semester (excluding graduates)70 - 75%
Establish Number of Personalized Contacts to Students on Academic
Probation (Oct, Feb and June)250 - 300
Total Number of Students Using Interpreters and CART (Reported at end
of semester)8 11 10 - 15
Total Number of Interpreter and CART Service Hours per month 1978 3484 3000 - 3500
Total Interpreter Expenses $72,400 $33,621 $36,865 $148,827 $125,000 -
$150,000
Total CART Expenses $42,927 $56,464 $87,173 $78,760 $75,000 - $90,000
Total Hearing Impairment Service Expenses* $115,327 $90,085 $124,038 $227,587 $200,000 -
$240,000
Number of Students Using Alternative Media per Semester (Reported at
end of semester)14 24 25 - 30
Number of Alternative Media Books (Reported at end of semester) 140 74 125 - 150
Number of Hours Spent Weekly on Alternative Media 214^ 600 - 700
Increase Students Participating in Mentor Program (Reported at end of
semester)15 15 - 20
Increase Number of Hours Spent on Mentor Program 10 400 - 500
Mentor Program Satisfaction Level (Reported at end of Semester) 1 95% - 100%
Establish Students Participating in You Are Smarter Than You Think!
(YASTYT)30 - 40
YASTYT Program Satisfaction Level (Reported at end of Semester) 85 - 90%
Standard Resources
Action StepsPrevious Year Benchmarks
Specific Programs
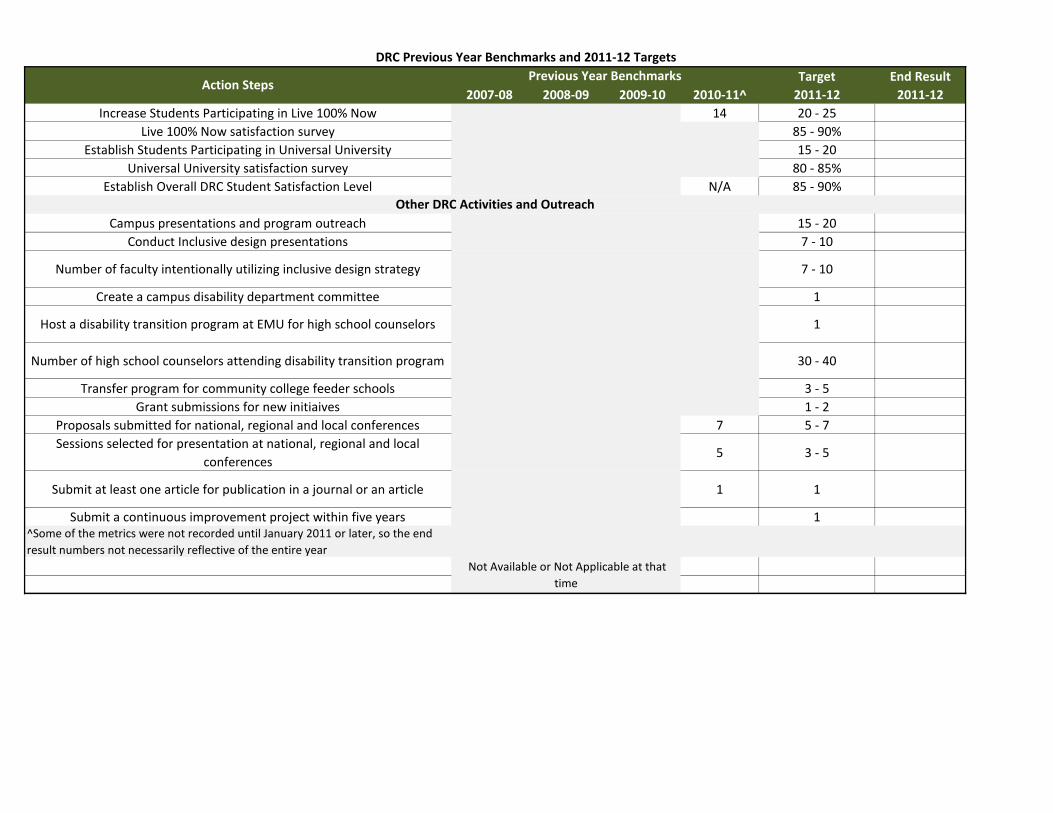
DRC Previous Year Benchmarks and 2011-12 Targets
Target End Result
2007-08 2008-09 2009-10 2010-11^ 2011-12 2011-12Action Steps
Previous Year Benchmarks
Increase Students Participating in Live 100% Now 14 20 - 25
Live 100% Now satisfaction survey 85 - 90%
Establish Students Participating in Universal University 15 - 20
Universal University satisfaction survey 80 - 85%
Establish Overall DRC Student Satisfaction Level N/A 85 - 90%
Campus presentations and program outreach 15 - 20
Conduct Inclusive design presentations 7 - 10
Number of faculty intentionally utilizing inclusive design strategy 7 - 10
Create a campus disability department committee 1
Host a disability transition program at EMU for high school counselors 1
Number of high school counselors attending disability transition program 30 - 40
Transfer program for community college feeder schools 3 - 5
Grant submissions for new initiaives 1 - 2
Proposals submitted for national, regional and local conferences 7 5 - 7
Sessions selected for presentation at national, regional and local
conferences5 3 - 5
Submit at least one article for publication in a journal or an article 1 1
Submit a continuous improvement project within five years 1^Some of the metrics were not recorded until January 2011 or later, so the end
result numbers not necessarily reflective of the entire year
Not Available or Not Applicable at that
time
Other DRC Activities and Outreach

DRC Holding the Plan Accountable Future Targets 21
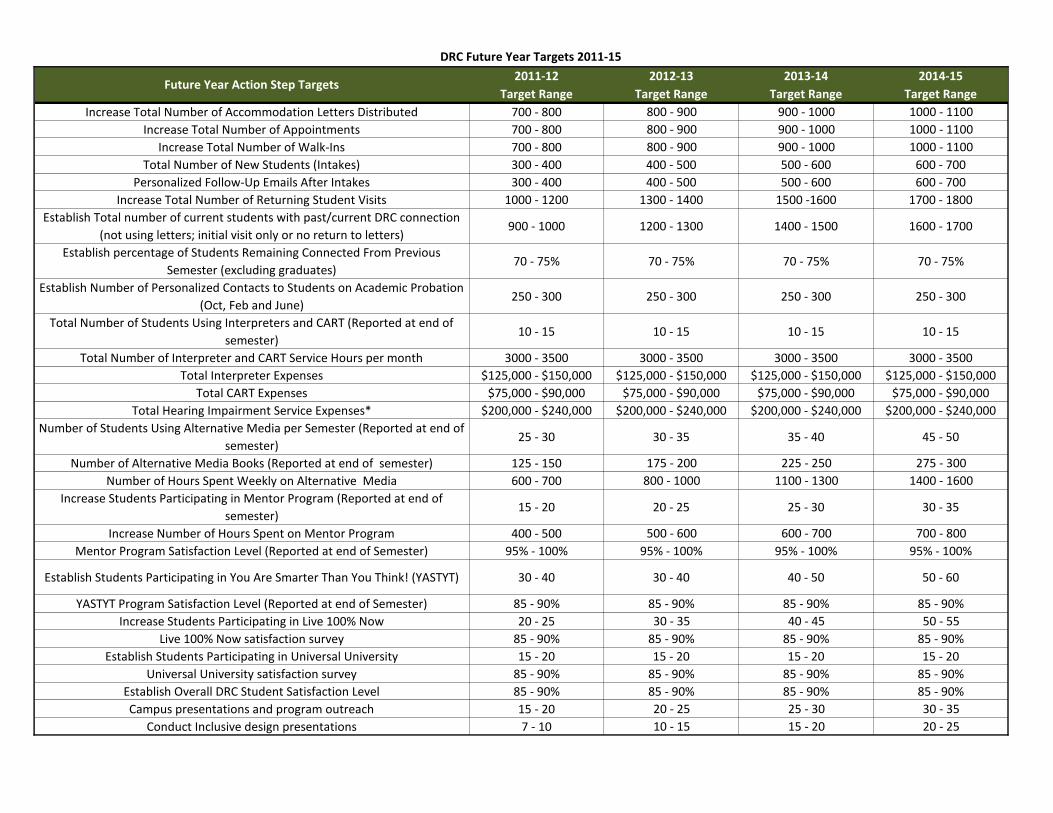
DRC Future Year Targets 2011-15
2011-12 2012-13 2013-14 2014-15
Target Range Target Range Target Range Target Range
Increase Total Number of Accommodation Letters Distributed 700 - 800 800 - 900 900 - 1000 1000 - 1100
Increase Total Number of Appointments 700 - 800 800 - 900 900 - 1000 1000 - 1100
Increase Total Number of Walk-Ins 700 - 800 800 - 900 900 - 1000 1000 - 1100
Total Number of New Students (Intakes) 300 - 400 400 - 500 500 - 600 600 - 700
Personalized Follow-Up Emails After Intakes 300 - 400 400 - 500 500 - 600 600 - 700
Increase Total Number of Returning Student Visits 1000 - 1200 1300 - 1400 1500 -1600 1700 - 1800
Establish Total number of current students with past/current DRC connection
(not using letters; initial visit only or no return to letters)900 - 1000 1200 - 1300 1400 - 1500 1600 - 1700
Establish percentage of Students Remaining Connected From Previous
Semester (excluding graduates)70 - 75% 70 - 75% 70 - 75% 70 - 75%
Establish Number of Personalized Contacts to Students on Academic Probation
(Oct, Feb and June)250 - 300 250 - 300 250 - 300 250 - 300
Total Number of Students Using Interpreters and CART (Reported at end of
semester)10 - 15 10 - 15 10 - 15 10 - 15
Total Number of Interpreter and CART Service Hours per month 3000 - 3500 3000 - 3500 3000 - 3500 3000 - 3500
Total Interpreter Expenses $125,000 - $150,000 $125,000 - $150,000 $125,000 - $150,000 $125,000 - $150,000
Total CART Expenses $75,000 - $90,000 $75,000 - $90,000 $75,000 - $90,000 $75,000 - $90,000
Total Hearing Impairment Service Expenses* $200,000 - $240,000 $200,000 - $240,000 $200,000 - $240,000 $200,000 - $240,000
Number of Students Using Alternative Media per Semester (Reported at end of
semester)25 - 30 30 - 35 35 - 40 45 - 50
Number of Alternative Media Books (Reported at end of semester) 125 - 150 175 - 200 225 - 250 275 - 300
Number of Hours Spent Weekly on Alternative Media 600 - 700 800 - 1000 1100 - 1300 1400 - 1600
Increase Students Participating in Mentor Program (Reported at end of
semester)15 - 20 20 - 25 25 - 30 30 - 35
Increase Number of Hours Spent on Mentor Program 400 - 500 500 - 600 600 - 700 700 - 800
Mentor Program Satisfaction Level (Reported at end of Semester) 95% - 100% 95% - 100% 95% - 100% 95% - 100%
Establish Students Participating in You Are Smarter Than You Think! (YASTYT) 30 - 40 30 - 40 40 - 50 50 - 60
YASTYT Program Satisfaction Level (Reported at end of Semester) 85 - 90% 85 - 90% 85 - 90% 85 - 90%
Increase Students Participating in Live 100% Now 20 - 25 30 - 35 40 - 45 50 - 55
Live 100% Now satisfaction survey 85 - 90% 85 - 90% 85 - 90% 85 - 90%
Establish Students Participating in Universal University 15 - 20 15 - 20 15 - 20 15 - 20
Universal University satisfaction survey 85 - 90% 85 - 90% 85 - 90% 85 - 90%
Establish Overall DRC Student Satisfaction Level 85 - 90% 85 - 90% 85 - 90% 85 - 90%
Campus presentations and program outreach 15 - 20 20 - 25 25 - 30 30 - 35
Conduct Inclusive design presentations 7 - 10 10 - 15 15 - 20 20 - 25
Future Year Action Step Targets
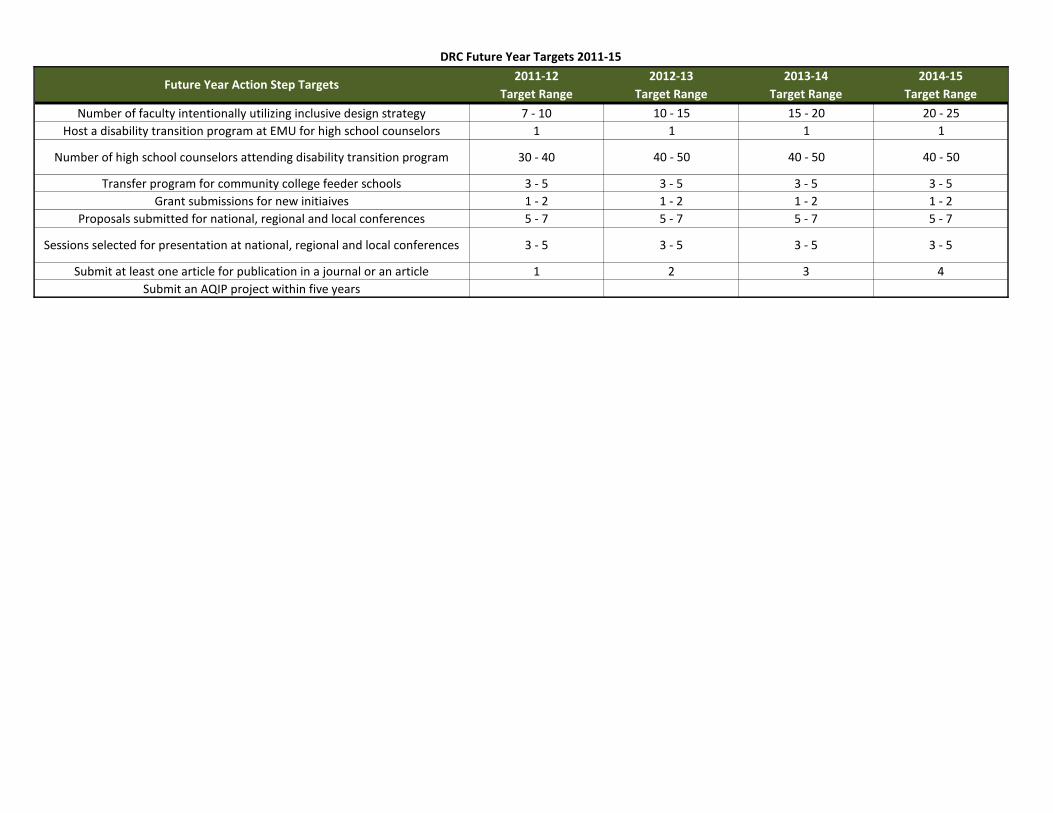
DRC Future Year Targets 2011-15
2011-12 2012-13 2013-14 2014-15
Target Range Target Range Target Range Target RangeFuture Year Action Step Targets
Number of faculty intentionally utilizing inclusive design strategy 7 - 10 10 - 15 15 - 20 20 - 25
Host a disability transition program at EMU for high school counselors 1 1 1 1
Number of high school counselors attending disability transition program 30 - 40 40 - 50 40 - 50 40 - 50
Transfer program for community college feeder schools 3 - 5 3 - 5 3 - 5 3 - 5
Grant submissions for new initiaives 1 - 2 1 - 2 1 - 2 1 - 2
Proposals submitted for national, regional and local conferences 5 - 7 5 - 7 5 - 7 5 - 7
Sessions selected for presentation at national, regional and local conferences 3 - 5 3 - 5 3 - 5 3 - 5
Submit at least one article for publication in a journal or an article 1 2 3 4
Submit an AQIP project within five years
Keys to Degrees (KTD)
Plan in Action
22
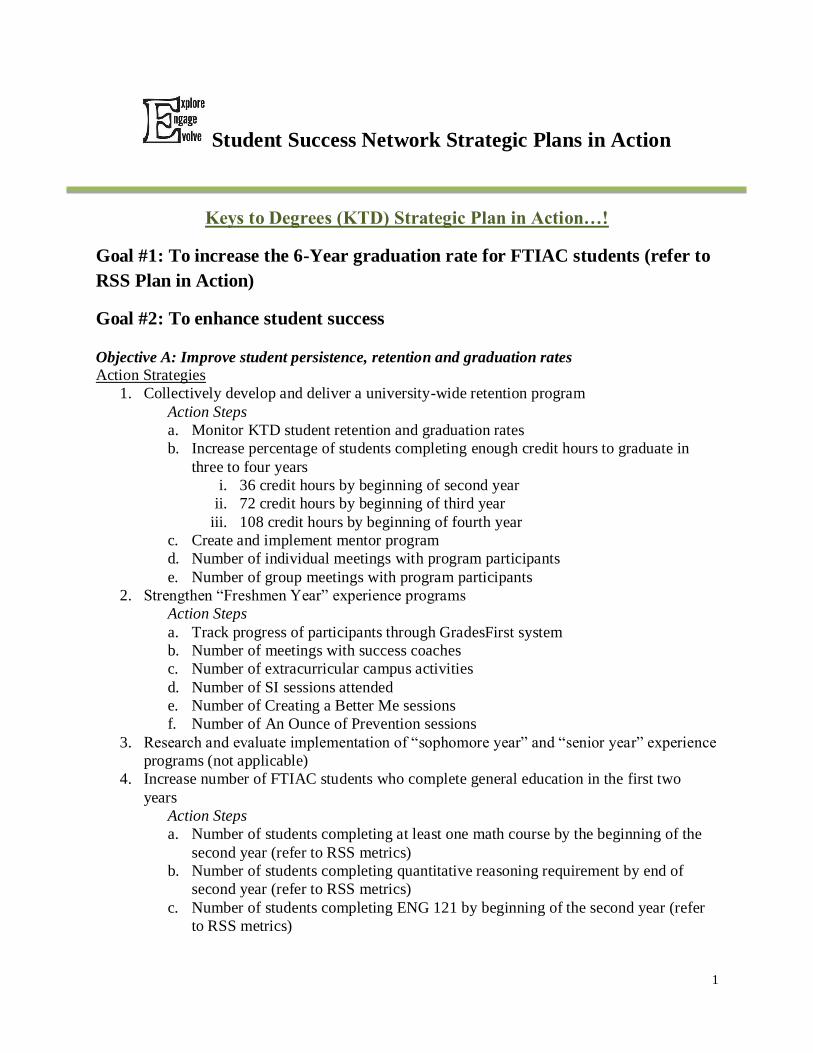
1
Student Success Network Strategic Plans in Action
Keys to Degrees (KTD) Strategic Plan in Action…!
Goal #1: To increase the 6-Year graduation rate for FTIAC students (refer to
RSS Plan in Action)
Goal #2: To enhance student success
Objective A: Improve student persistence, retention and graduation rates
Action Strategies
1. Collectively develop and deliver a university-wide retention program
Action Steps
a. Monitor KTD student retention and graduation rates
b. Increase percentage of students completing enough credit hours to graduate in
three to four years
i. 36 credit hours by beginning of second year
ii. 72 credit hours by beginning of third year
iii. 108 credit hours by beginning of fourth year
c. Create and implement mentor program
d. Number of individual meetings with program participants
e. Number of group meetings with program participants
2. Strengthen “Freshmen Year” experience programs
Action Steps
a. Track progress of participants through GradesFirst system
b. Number of meetings with success coaches
c. Number of extracurricular campus activities
d. Number of SI sessions attended
e. Number of Creating a Better Me sessions
f. Number of An Ounce of Prevention sessions
3. Research and evaluate implementation of “sophomore year” and “senior year” experience
programs (not applicable)
4. Increase number of FTIAC students who complete general education in the first two
years
Action Steps
a. Number of students completing at least one math course by the beginning of the
second year (refer to RSS metrics)
b. Number of students completing quantitative reasoning requirement by end of
second year (refer to RSS metrics)
c. Number of students completing ENG 121 by beginning of the second year (refer
to RSS metrics)
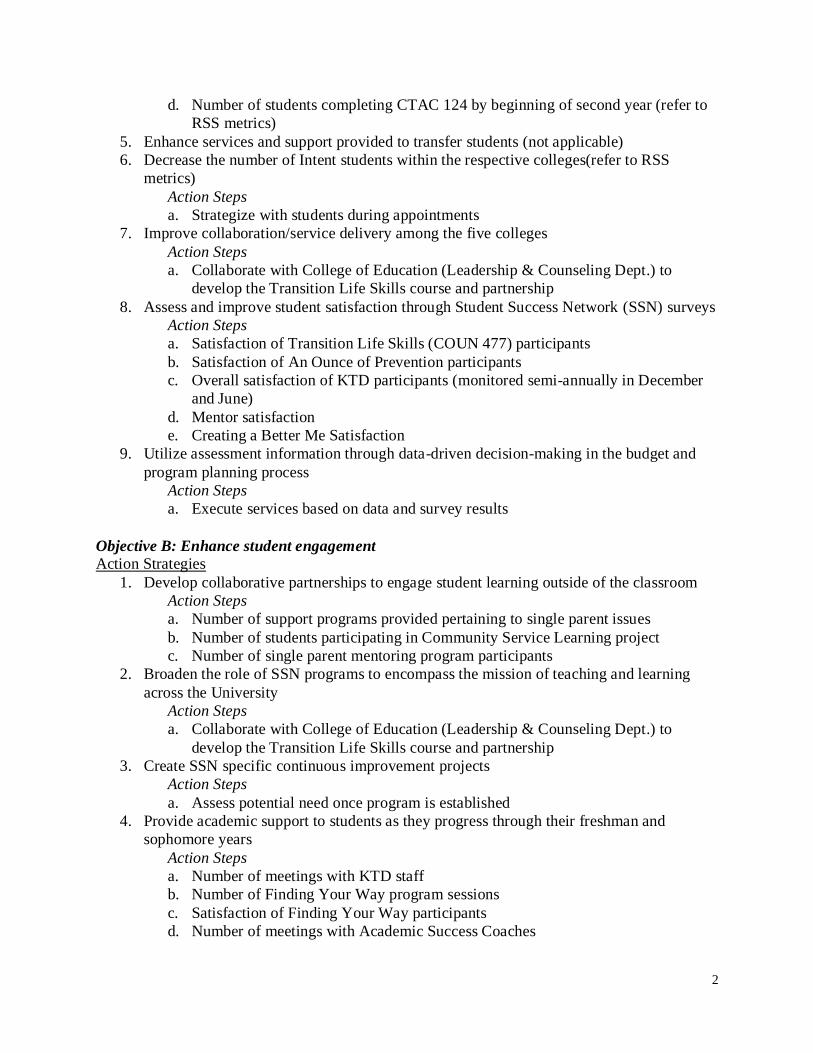
2
d. Number of students completing CTAC 124 by beginning of second year (refer to
RSS metrics)
5. Enhance services and support provided to transfer students (not applicable)
6. Decrease the number of Intent students within the respective colleges(refer to RSS
metrics)
Action Steps
a. Strategize with students during appointments
7. Improve collaboration/service delivery among the five colleges
Action Steps
a. Collaborate with College of Education (Leadership & Counseling Dept.) to
develop the Transition Life Skills course and partnership
8. Assess and improve student satisfaction through Student Success Network (SSN) surveys
Action Steps
a. Satisfaction of Transition Life Skills (COUN 477) participants
b. Satisfaction of An Ounce of Prevention participants
c. Overall satisfaction of KTD participants (monitored semi-annually in December
and June)
d. Mentor satisfaction
e. Creating a Better Me Satisfaction
9. Utilize assessment information through data-driven decision-making in the budget and
program planning process
Action Steps
a. Execute services based on data and survey results
Objective B: Enhance student engagement
Action Strategies
1. Develop collaborative partnerships to engage student learning outside of the classroom
Action Steps
a. Number of support programs provided pertaining to single parent issues
b. Number of students participating in Community Service Learning project
c. Number of single parent mentoring program participants
2. Broaden the role of SSN programs to encompass the mission of teaching and learning
across the University
Action Steps
a. Collaborate with College of Education (Leadership & Counseling Dept.) to
develop the Transition Life Skills course and partnership
3. Create SSN specific continuous improvement projects
Action Steps
a. Assess potential need once program is established
4. Provide academic support to students as they progress through their freshman and
sophomore years
Action Steps
a. Number of meetings with KTD staff
b. Number of Finding Your Way program sessions
c. Satisfaction of Finding Your Way participants
d. Number of meetings with Academic Success Coaches
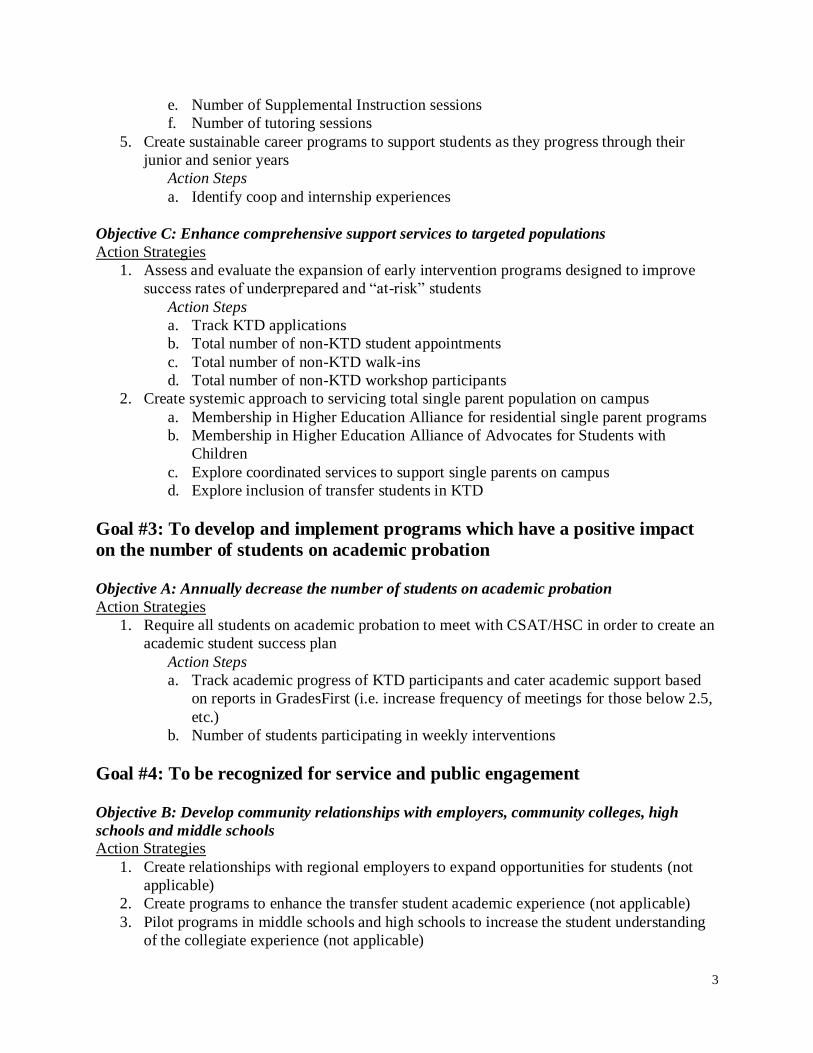
3
e. Number of Supplemental Instruction sessions
f. Number of tutoring sessions
5. Create sustainable career programs to support students as they progress through their
junior and senior years
Action Steps
a. Identify coop and internship experiences
Objective C: Enhance comprehensive support services to targeted populations
Action Strategies
1. Assess and evaluate the expansion of early intervention programs designed to improve
success rates of underprepared and “at-risk” students
Action Steps
a. Track KTD applications
b. Total number of non-KTD student appointments
c. Total number of non-KTD walk-ins
d. Total number of non-KTD workshop participants
2. Create systemic approach to servicing total single parent population on campus
a. Membership in Higher Education Alliance for residential single parent programs
b. Membership in Higher Education Alliance of Advocates for Students with
Children
c. Explore coordinated services to support single parents on campus
d. Explore inclusion of transfer students in KTD
Goal #3: To develop and implement programs which have a positive impact
on the number of students on academic probation
Objective A: Annually decrease the number of students on academic probation
Action Strategies
1. Require all students on academic probation to meet with CSAT/HSC in order to create an
academic student success plan
Action Steps
a. Track academic progress of KTD participants and cater academic support based
on reports in GradesFirst (i.e. increase frequency of meetings for those below 2.5,
etc.)
b. Number of students participating in weekly interventions
Goal #4: To be recognized for service and public engagement
Objective B: Develop community relationships with employers, community colleges, high
schools and middle schools
Action Strategies
1. Create relationships with regional employers to expand opportunities for students (not
applicable)
2. Create programs to enhance the transfer student academic experience (not applicable)
3. Pilot programs in middle schools and high schools to increase the student understanding
of the collegiate experience (not applicable)
4
4. Design support systems to foster teens and orphaned or abandoned teens to transition to
and succeed in college
Action Steps
a. Identify all local and state services to support KTD students
5. Increase staff and student community service and civic engagement
Action Steps
a. All KTD participate in community service projects
Goal #5: To seek outside funding sources to support student success initiatives
(refer to RSS Plan in Action)
Goal #6: To enhance facilities, technology, infrastructure, and plan effective
space utilization
Objective A: Improve and consolidate in-person and electronic processes and services in all
areas related to the Student Success Network
Action Strategies
1. Use technology to enhance delivery of student services and learning experiences
Action Steps
a. Track number of visits to KTD website
Goal #7: To enhance faculty support and staff success (refer to RSS Plan in
Action)

KTD Holding the Plan Accountable Benchmarks 23

KTD 2011-12 Future Targets
Target End Result
2011-12** 2011-12
General Resources and Programs
Number of individual meetings with program director 18-22
Number of collective GradesFirst Progress Reports received 120-160
Number of individual meetings with success coaches, interns, and/or
Graduate Assistants30-34
Number of individual meetings with supplemental instructors 2-4
Number of individual meetings with tutors 4-6
Number of students participating in mentor program 100%
Number of Creating a Better Me Group sessions 12-16
Number of Summer Ounce of Prevention Sessions 4 - 6
Number of Finding Your Way sessions 4-6
Number of students completing 10 hours of community service project 8-9
Satisfaction
Mentor Satisfaction 70-80%
Creating a Better Me Satisfaction 70-80%
Transition Life Skills (COUN 477) Satisfaction 70-80%
Summer Ounce of Prevention Satisfaction 70-80%
Finding Your Way satisfaction 70-80%
Overall 1st Year Keys to Degrees Satisfaction 70-80%
Academic Progress
Number of students with 3.0 and above GPA 2
Number of students with 2.5 - 2.99 GPA 5
Number of students with 2.0 - 2.49 GPA 3
Number of students with GPA below 2.0 0
Number of students participating in weekly interventions due to GPA less
than 2.53
Number of students retained annually 8
Number of students with 36+ credit-hours completed by beginning of
second year6
Number of students with 72+ credit-hours completed by beginning of third
year5
Number of students with 108+ credit-hours completed by beginning of
fourth year5
Number of students graduating with 124+ credit hours by the end of the
fourth year6
Action Steps
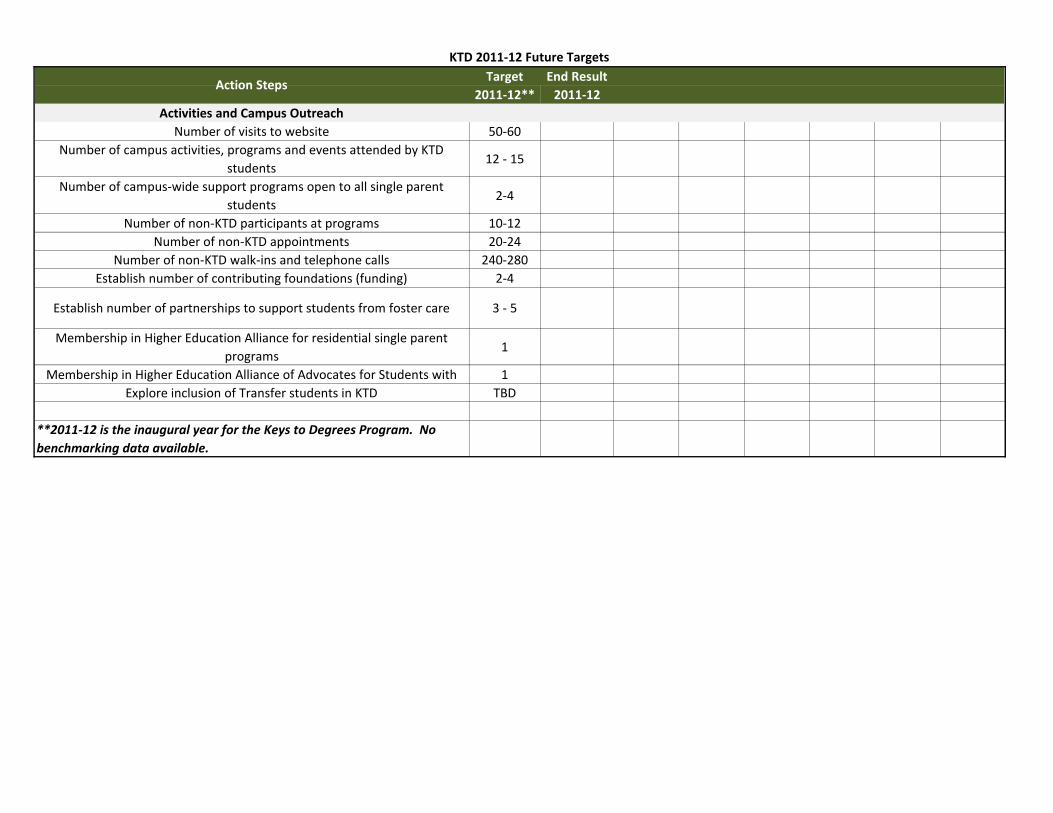
KTD 2011-12 Future Targets
Target End Result
2011-12** 2011-12Action Steps
Activities and Campus Outreach
Number of visits to website 50-60
Number of campus activities, programs and events attended by KTD
students12 - 15
Number of campus-wide support programs open to all single parent
students2-4
Number of non-KTD participants at programs 10-12
Number of non-KTD appointments 20-24
Number of non-KTD walk-ins and telephone calls 240-280
Establish number of contributing foundations (funding) 2-4
Establish number of partnerships to support students from foster care 3 - 5
Membership in Higher Education Alliance for residential single parent
programs1
Membership in Higher Education Alliance of Advocates for Students with 1
Explore inclusion of Transfer students in KTD TBD
**2011-12 is the inaugural year for the Keys to Degrees Program. No
benchmarking data available.

KTD Holding the Plan Accountable Future Targets 24
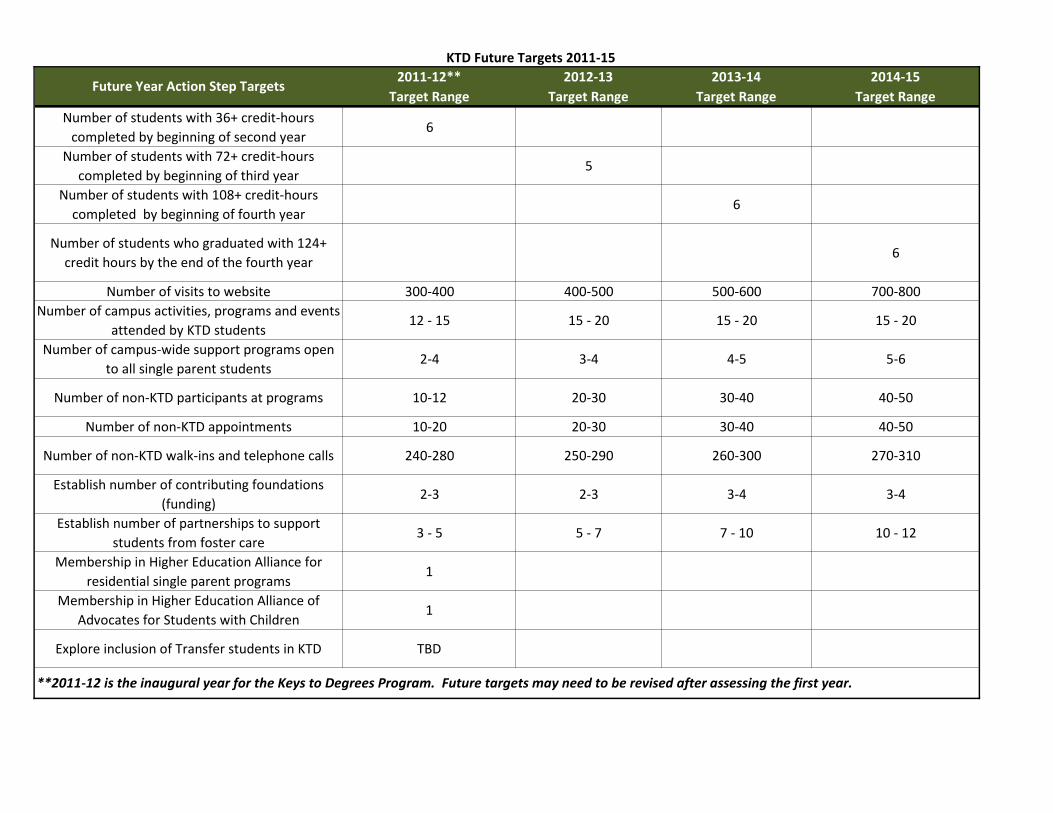
KTD Future Targets 2011-15
2011-12** 2012-13 2013-14 2014-15
Target Range Target Range Target Range Target RangeFuture Year Action Step Targets
Number of students with 36+ credit-hours
completed by beginning of second year6
Number of students with 72+ credit-hours
completed by beginning of third year5
Number of students with 108+ credit-hours
completed by beginning of fourth year6
Number of students who graduated with 124+
credit hours by the end of the fourth year6
Number of visits to website 300-400 400-500 500-600 700-800
Number of campus activities, programs and events
attended by KTD students12 - 15 15 - 20 15 - 20 15 - 20
Number of campus-wide support programs open
to all single parent students2-4 3-4 4-5 5-6
Number of non-KTD participants at programs 10-12 20-30 30-40 40-50
Number of non-KTD appointments 10-20 20-30 30-40 40-50
Number of non-KTD walk-ins and telephone calls 240-280 250-290 260-300 270-310
Establish number of contributing foundations
(funding)2-3 2-3 3-4 3-4
Establish number of partnerships to support
students from foster care3 - 5 5 - 7 7 - 10 10 - 12
Membership in Higher Education Alliance for
residential single parent programs1
Membership in Higher Education Alliance of
Advocates for Students with Children1
Explore inclusion of Transfer students in KTD TBD
**2011-12 is the inaugural year for the Keys to Degrees Program. Future targets may need to be revised after assessing the first year.
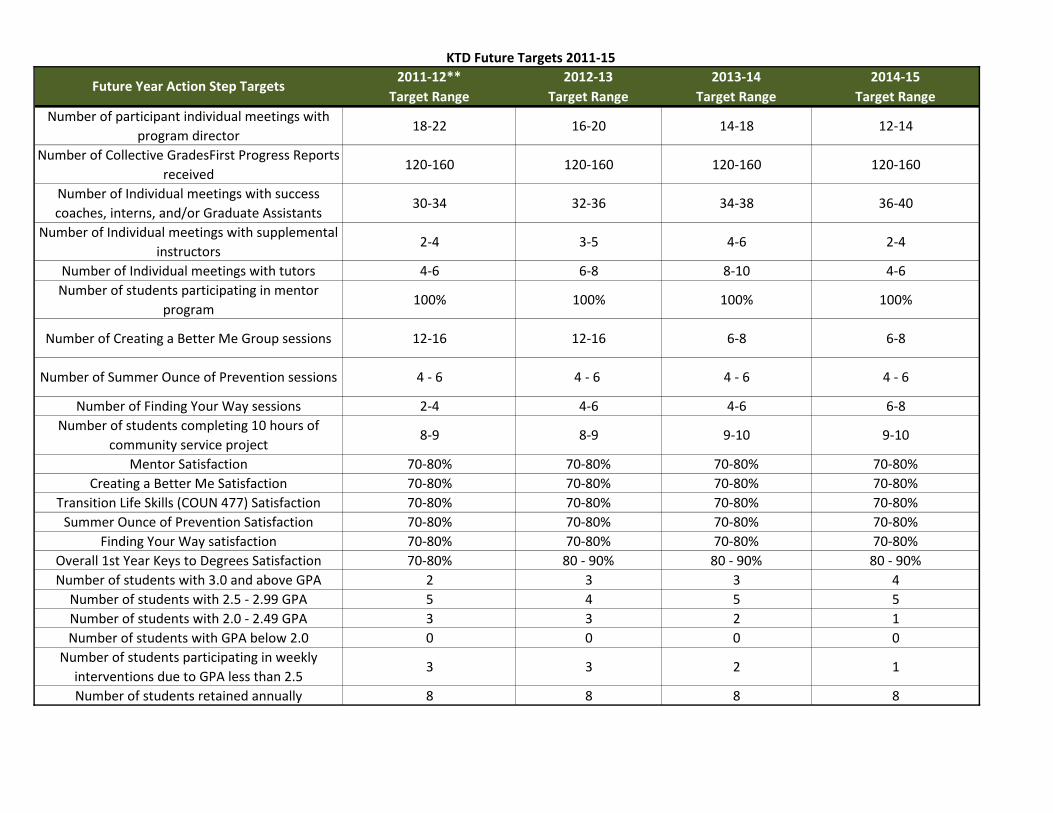
KTD Future Targets 2011-15
2011-12** 2012-13 2013-14 2014-15
Target Range Target Range Target Range Target Range
Number of participant individual meetings with
program director 18-22 16-20 14-18 12-14
Number of Collective GradesFirst Progress Reports
received120-160 120-160 120-160 120-160
Number of Individual meetings with success
coaches, interns, and/or Graduate Assistants30-34 32-36 34-38 36-40
Number of Individual meetings with supplemental
instructors2-4 3-5 4-6 2-4
Number of Individual meetings with tutors 4-6 6-8 8-10 4-6
Number of students participating in mentor
program100% 100% 100% 100%
Number of Creating a Better Me Group sessions 12-16 12-16 6-8 6-8
Number of Summer Ounce of Prevention sessions 4 - 6 4 - 6 4 - 6 4 - 6
Number of Finding Your Way sessions 2-4 4-6 4-6 6-8
Number of students completing 10 hours of
community service project8-9 8-9 9-10 9-10
Mentor Satisfaction 70-80% 70-80% 70-80% 70-80%
Creating a Better Me Satisfaction 70-80% 70-80% 70-80% 70-80%
Transition Life Skills (COUN 477) Satisfaction 70-80% 70-80% 70-80% 70-80%
Summer Ounce of Prevention Satisfaction 70-80% 70-80% 70-80% 70-80%
Finding Your Way satisfaction 70-80% 70-80% 70-80% 70-80%
Overall 1st Year Keys to Degrees Satisfaction 70-80% 80 - 90% 80 - 90% 80 - 90%
Number of students with 3.0 and above GPA 2 3 3 4
Number of students with 2.5 - 2.99 GPA 5 4 5 5
Number of students with 2.0 - 2.49 GPA 3 3 2 1
Number of students with GPA below 2.0 0 0 0 0
Number of students participating in weekly
interventions due to GPA less than 2.53 3 2 1
Number of students retained annually 8 8 8 8
Future Year Action Step Targets

Student Success Network College Teams Plan in Action
25
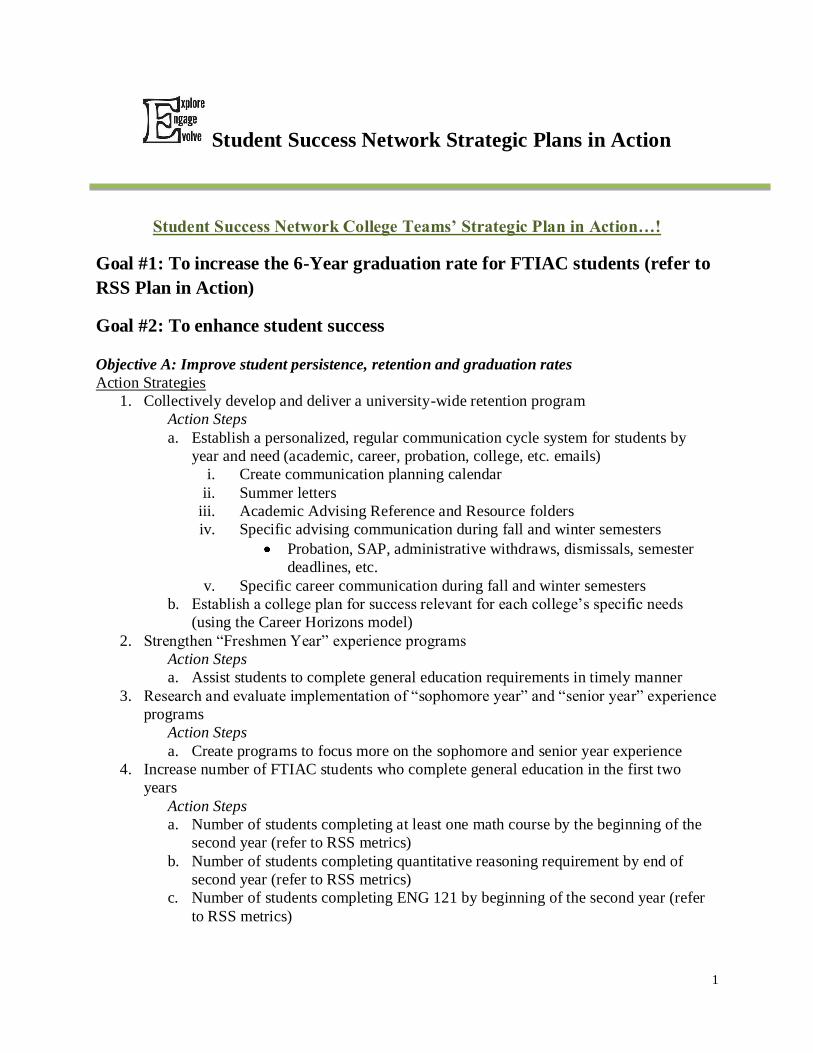
1
Student Success Network Strategic Plans in Action
Student Success Network College Teams’ Strategic Plan in Action…!
Goal #1: To increase the 6-Year graduation rate for FTIAC students (refer to
RSS Plan in Action)
Goal #2: To enhance student success
Objective A: Improve student persistence, retention and graduation rates
Action Strategies
1. Collectively develop and deliver a university-wide retention program
Action Steps
a. Establish a personalized, regular communication cycle system for students by
year and need (academic, career, probation, college, etc. emails)
i. Create communication planning calendar
ii. Summer letters
iii. Academic Advising Reference and Resource folders
iv. Specific advising communication during fall and winter semesters
Probation, SAP, administrative withdraws, dismissals, semester
deadlines, etc.
v. Specific career communication during fall and winter semesters
b. Establish a college plan for success relevant for each college’s specific needs
(using the Career Horizons model)
2. Strengthen “Freshmen Year” experience programs
Action Steps
a. Assist students to complete general education requirements in timely manner
3. Research and evaluate implementation of “sophomore year” and “senior year” experience
programs
Action Steps
a. Create programs to focus more on the sophomore and senior year experience
4. Increase number of FTIAC students who complete general education in the first two
years
Action Steps
a. Number of students completing at least one math course by the beginning of the
second year (refer to RSS metrics)
b. Number of students completing quantitative reasoning requirement by end of
second year (refer to RSS metrics)
c. Number of students completing ENG 121 by beginning of the second year (refer
to RSS metrics)
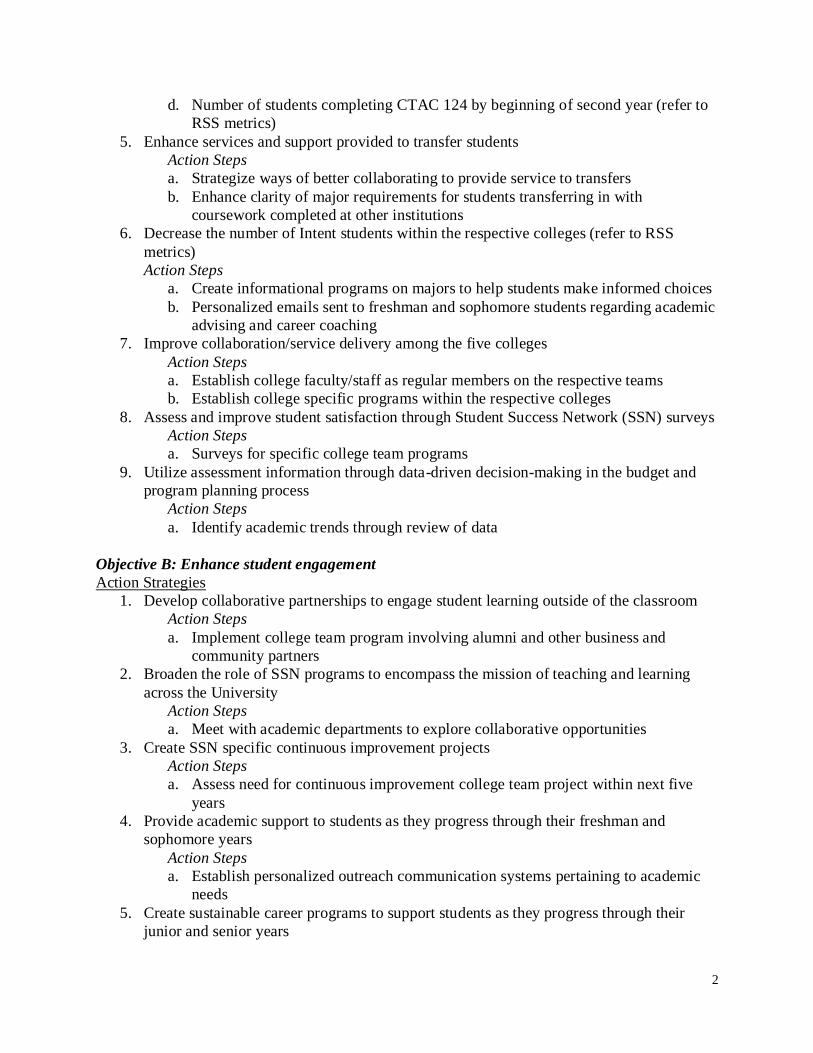
2
d. Number of students completing CTAC 124 by beginning of second year (refer to
RSS metrics)
5. Enhance services and support provided to transfer students
Action Steps
a. Strategize ways of better collaborating to provide service to transfers
b. Enhance clarity of major requirements for students transferring in with
coursework completed at other institutions
6. Decrease the number of Intent students within the respective colleges (refer to RSS
metrics)
Action Steps
a. Create informational programs on majors to help students make informed choices
b. Personalized emails sent to freshman and sophomore students regarding academic
advising and career coaching
7. Improve collaboration/service delivery among the five colleges
Action Steps
a. Establish college faculty/staff as regular members on the respective teams
b. Establish college specific programs within the respective colleges
8. Assess and improve student satisfaction through Student Success Network (SSN) surveys
Action Steps
a. Surveys for specific college team programs
9. Utilize assessment information through data-driven decision-making in the budget and
program planning process
Action Steps
a. Identify academic trends through review of data
Objective B: Enhance student engagement
Action Strategies
1. Develop collaborative partnerships to engage student learning outside of the classroom
Action Steps
a. Implement college team program involving alumni and other business and
community partners
2. Broaden the role of SSN programs to encompass the mission of teaching and learning
across the University
Action Steps
a. Meet with academic departments to explore collaborative opportunities
3. Create SSN specific continuous improvement projects
Action Steps
a. Assess need for continuous improvement college team project within next five
years
4. Provide academic support to students as they progress through their freshman and
sophomore years
Action Steps
a. Establish personalized outreach communication systems pertaining to academic
needs
5. Create sustainable career programs to support students as they progress through their
junior and senior years
4
a. Establish alumni, business and community programs within the colleges
2. Host business leaders and alumni at sporting and other University events
Objective B: Develop community relationships with employers, community colleges, high
schools and middle schools
Action Strategies
1. Create relationships with regional employers to expand opportunities for students (not
applicable)
2. Create programs to enhance the transfer student academic experience
Action Steps
a. College teams create programs to support needs of transfer population
3. Pilot programs in middle schools and high schools to increase the student understanding
of the collegiate experience (not applicable)
4. Design support systems to foster teens and orphaned or abandoned teens to transition to
and succeed in college (not applicable)
5. Increase staff and student community service and civic engagement (not applicable)
6. Have appropriate SSN presence at different campus events and department programs
Action Steps
a. Develop systemic programs by college that are sustainable
Goal #5: To seek outside funding sources to support student success initiatives
(refer to RSS Plan in Action)
Goal #6: To enhance facilities, technology, infrastructure, and plan effective
space utilization
Objective A: Improve and consolidate in-person and electronic processes and services in all
areas related to the Student Success Network
Action Strategies
1. Use technology to enhance delivery of student services and learning experiences
Action Steps
a. Establish Facebook outreach by college teams
b. Establish other social media outreach by college teams
Goal #7: To enhance faculty support and staff success (refer to RSS Plan in
Action)
3
Action Steps
a. Establish personalized outreach communication systems pertaining to career
needs
b. Establish outreach to students with 100+ hours regarding graduation audits and
major/minor confirmation
Objective C: Enhance comprehensive support services to targeted populations
Action Strategies
1. Assess and evaluate the expansion of early intervention programs designed to improve
success rates of underprepared and “at-risk” students
Action Steps
a. Establish outreach to students in 2.00 – 2.50 GPA range
b. Establish outreach to students in 2.51 – 2.99 GPA range
c. Establish follow-up strategies for GradesFirst early alert report submissions
2. Improve and consolidate UACDC processes
Action Steps
a. Strengthen communication and support of college teams
3. Identify, promote, and implement programs that increase learning opportunities and
experiences within housing in order to enhance the student residence hall experience
Action Steps
a. Create college team programs to support residential populations
b. Provide programs in Study Fixx
Goal #3: To develop and implement programs which have a positive impact
on the number of students on academic probation
Objective A: Annually decrease the number of students on academic probation
Action Strategies
1. Require all students on academic probation to meet with CSAT in order to create an
academic student success plan
Action Steps
a. College teams discuss and develop appropriate plans for students on probation
2. Place a hold on registration accounts for students who do not meet with CSAT (not
applicable)
3. Work with students who need assistance with major and career decision-making
(UACDC)
Action Steps
a. Establish personalized outreach to students who are still deciding on a major
Goal #4: To be recognized for service and public engagement
Objective A: Create community partnerships that enhance job placements
Action Strategies
1. Expand opportunities for students to engage in coop/intern, student/alumni job
shadowing experiences
Action Steps

College Teams Holding the Plan Accountable Benchmarks
26
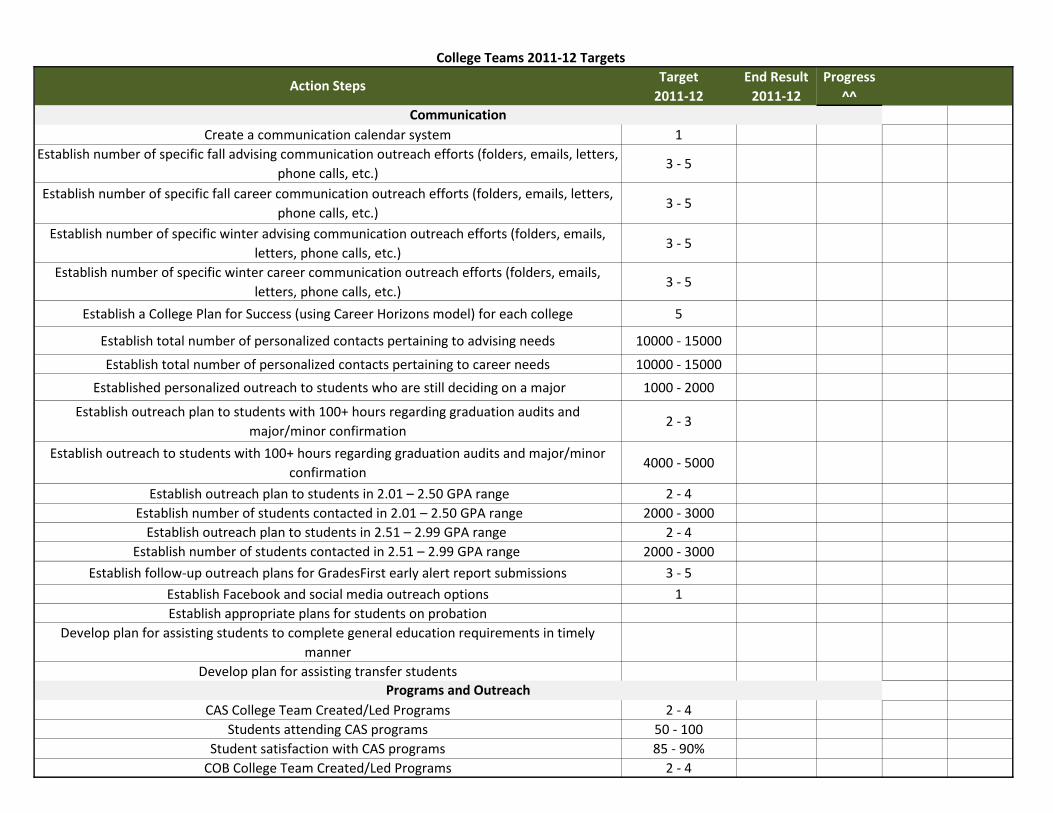
College Teams 2011-12 Targets
Target End Result Progress
2011-12 2011-12 ^^
Create a communication calendar system 1
Establish number of specific fall advising communication outreach efforts (folders, emails, letters,
phone calls, etc.)3 - 5
Establish number of specific fall career communication outreach efforts (folders, emails, letters,
phone calls, etc.)3 - 5
Establish number of specific winter advising communication outreach efforts (folders, emails,
letters, phone calls, etc.)3 - 5
Establish number of specific winter career communication outreach efforts (folders, emails,
letters, phone calls, etc.)3 - 5
Establish a College Plan for Success (using Career Horizons model) for each college 5
Establish total number of personalized contacts pertaining to advising needs 10000 - 15000
Establish total number of personalized contacts pertaining to career needs 10000 - 15000
Established personalized outreach to students who are still deciding on a major 1000 - 2000
Establish outreach plan to students with 100+ hours regarding graduation audits and
major/minor confirmation2 - 3
Establish outreach to students with 100+ hours regarding graduation audits and major/minor
confirmation4000 - 5000
Establish outreach plan to students in 2.01 – 2.50 GPA range 2 - 4
Establish number of students contacted in 2.01 – 2.50 GPA range 2000 - 3000
Establish outreach plan to students in 2.51 – 2.99 GPA range 2 - 4
Establish number of students contacted in 2.51 – 2.99 GPA range 2000 - 3000
Establish follow-up outreach plans for GradesFirst early alert report submissions 3 - 5
Establish Facebook and social media outreach options 1
Establish appropriate plans for students on probation
Develop plan for assisting students to complete general education requirements in timely
manner
Develop plan for assisting transfer students
CAS College Team Created/Led Programs 2 - 4
Students attending CAS programs 50 - 100
Student satisfaction with CAS programs 85 - 90%
COB College Team Created/Led Programs 2 - 4
Programs and Outreach
Communication
Action Steps
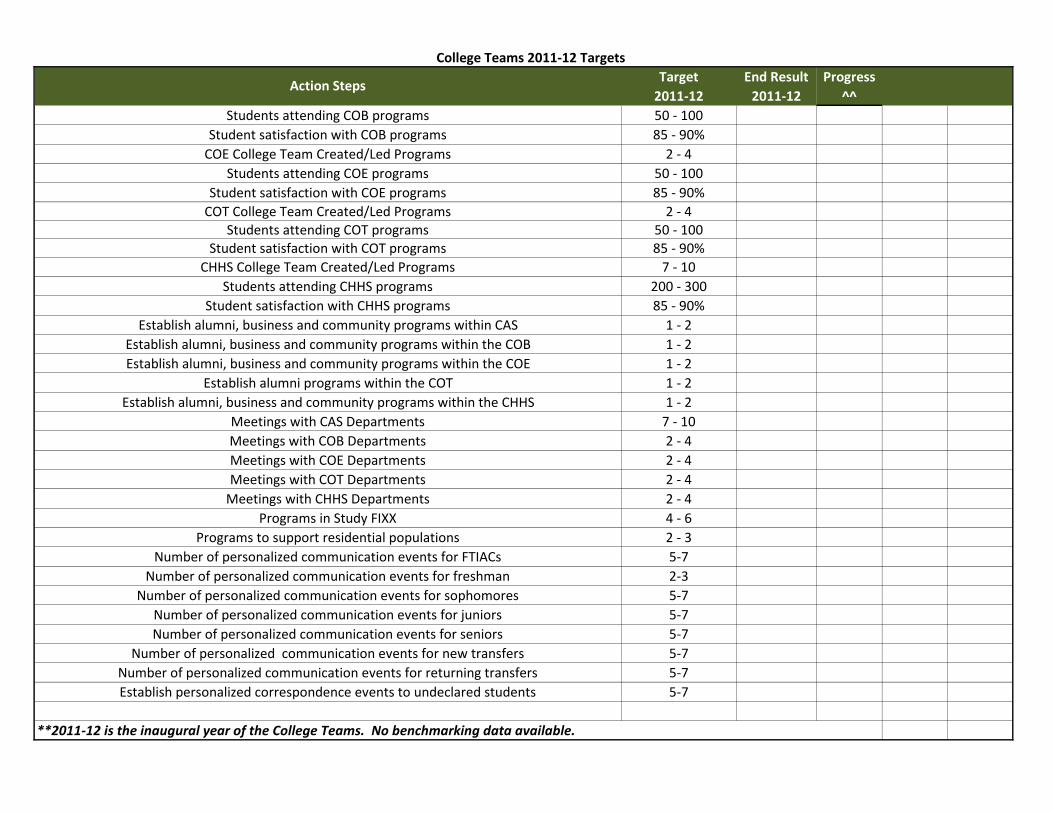
College Teams 2011-12 Targets
Target End Result Progress
2011-12 2011-12 ^^Action Steps
Students attending COB programs 50 - 100
Student satisfaction with COB programs 85 - 90%
COE College Team Created/Led Programs 2 - 4
Students attending COE programs 50 - 100
Student satisfaction with COE programs 85 - 90%
COT College Team Created/Led Programs 2 - 4Students attending COT programs 50 - 100
Student satisfaction with COT programs 85 - 90%
CHHS College Team Created/Led Programs 7 - 10
Students attending CHHS programs 200 - 300
Student satisfaction with CHHS programs 85 - 90%
Establish alumni, business and community programs within CAS 1 - 2
Establish alumni, business and community programs within the COB 1 - 2
Establish alumni, business and community programs within the COE 1 - 2
Establish alumni programs within the COT 1 - 2
Establish alumni, business and community programs within the CHHS 1 - 2
Meetings with CAS Departments 7 - 10
Meetings with COB Departments 2 - 4
Meetings with COE Departments 2 - 4
Meetings with COT Departments 2 - 4
Meetings with CHHS Departments 2 - 4
Programs in Study FIXX 4 - 6
Programs to support residential populations 2 - 3
Number of personalized communication events for FTIACs 5-7
Number of personalized communication events for freshman 2-3
Number of personalized communication events for sophomores 5-7
Number of personalized communication events for juniors 5-7
Number of personalized communication events for seniors 5-7
Number of personalized communication events for new transfers 5-7
Number of personalized communication events for returning transfers 5-7
Establish personalized correspondence events to undeclared students 5-7
**2011-12 is the inaugural year of the College Teams. No benchmarking data available.

College Teams Holding the Plan Accountable Future Targets 27
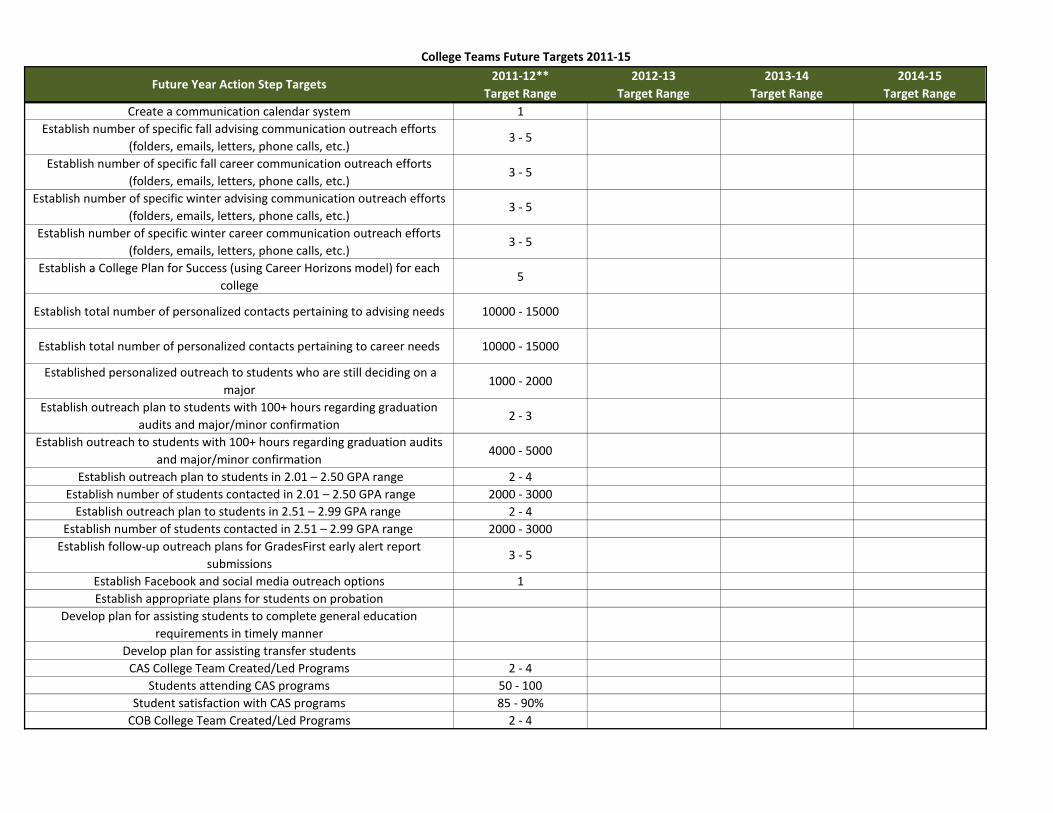
College Teams Future Targets 2011-15
2011-12** 2012-13 2013-14 2014-15
Target Range Target Range Target Range Target Range
Create a communication calendar system 1
Establish number of specific fall advising communication outreach efforts
(folders, emails, letters, phone calls, etc.)3 - 5
Establish number of specific fall career communication outreach efforts
(folders, emails, letters, phone calls, etc.)3 - 5
Establish number of specific winter advising communication outreach efforts
(folders, emails, letters, phone calls, etc.)3 - 5
Establish number of specific winter career communication outreach efforts
(folders, emails, letters, phone calls, etc.)3 - 5
Establish a College Plan for Success (using Career Horizons model) for each
college5
Establish total number of personalized contacts pertaining to advising needs 10000 - 15000
Establish total number of personalized contacts pertaining to career needs 10000 - 15000
Established personalized outreach to students who are still deciding on a
major1000 - 2000
Establish outreach plan to students with 100+ hours regarding graduation
audits and major/minor confirmation2 - 3
Establish outreach to students with 100+ hours regarding graduation audits
and major/minor confirmation4000 - 5000
Establish outreach plan to students in 2.01 – 2.50 GPA range 2 - 4
Establish number of students contacted in 2.01 – 2.50 GPA range 2000 - 3000
Establish outreach plan to students in 2.51 – 2.99 GPA range 2 - 4
Establish number of students contacted in 2.51 – 2.99 GPA range 2000 - 3000
Establish follow-up outreach plans for GradesFirst early alert report
submissions3 - 5
Establish Facebook and social media outreach options 1
Establish appropriate plans for students on probation
Develop plan for assisting students to complete general education
requirements in timely manner
Develop plan for assisting transfer students
CAS College Team Created/Led Programs 2 - 4
Students attending CAS programs 50 - 100
Student satisfaction with CAS programs 85 - 90%
COB College Team Created/Led Programs 2 - 4
Future Year Action Step Targets
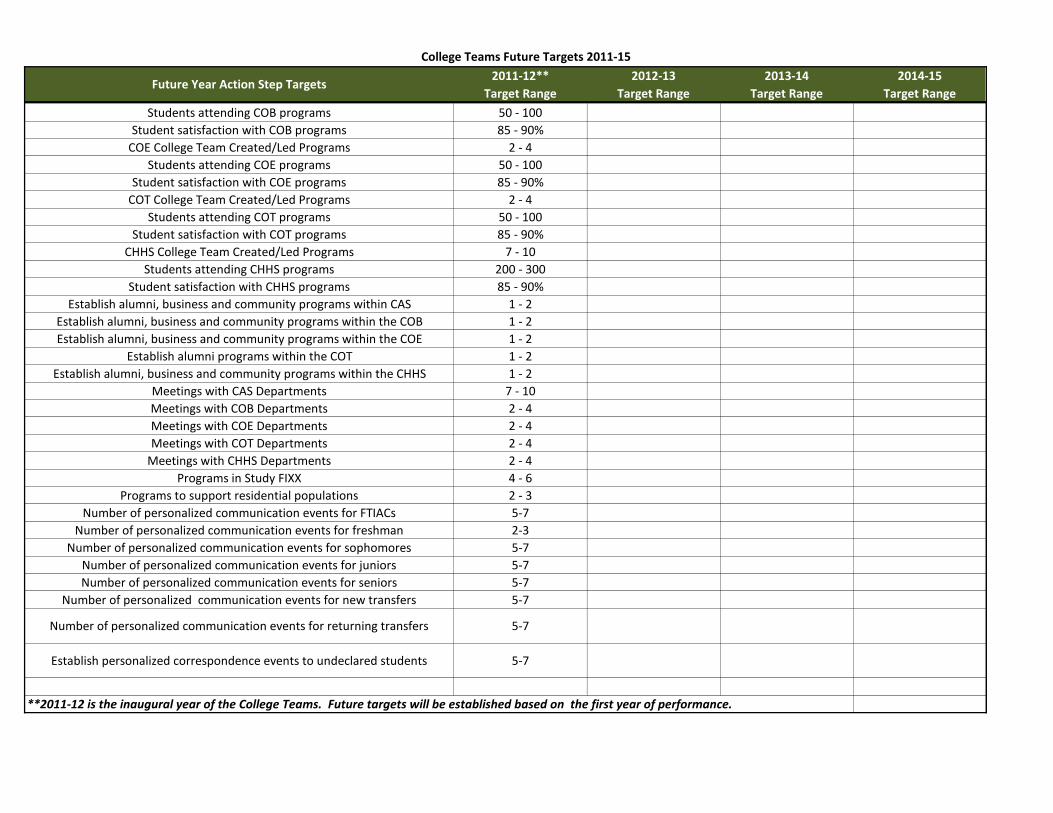
College Teams Future Targets 2011-15
2011-12** 2012-13 2013-14 2014-15
Target Range Target Range Target Range Target RangeFuture Year Action Step Targets
Students attending COB programs 50 - 100
Student satisfaction with COB programs 85 - 90%
COE College Team Created/Led Programs 2 - 4
Students attending COE programs 50 - 100
Student satisfaction with COE programs 85 - 90%
COT College Team Created/Led Programs 2 - 4
Students attending COT programs 50 - 100
Student satisfaction with COT programs 85 - 90%
CHHS College Team Created/Led Programs 7 - 10
Students attending CHHS programs 200 - 300
Student satisfaction with CHHS programs 85 - 90%
Establish alumni, business and community programs within CAS 1 - 2
Establish alumni, business and community programs within the COB 1 - 2
Establish alumni, business and community programs within the COE 1 - 2
Establish alumni programs within the COT 1 - 2
Establish alumni, business and community programs within the CHHS 1 - 2
Meetings with CAS Departments 7 - 10
Meetings with COB Departments 2 - 4
Meetings with COE Departments 2 - 4
Meetings with COT Departments 2 - 4
Meetings with CHHS Departments 2 - 4
Programs in Study FIXX 4 - 6
Programs to support residential populations 2 - 3
Number of personalized communication events for FTIACs 5-7
Number of personalized communication events for freshman 2-3
Number of personalized communication events for sophomores 5-7
Number of personalized communication events for juniors 5-7
Number of personalized communication events for seniors 5-7
Number of personalized communication events for new transfers 5-7
Number of personalized communication events for returning transfers 5-7
Establish personalized correspondence events to undeclared students 5-7
**2011-12 is the inaugural year of the College Teams. Future targets will be established based on the first year of performance.

Monthly Data Tools Samples
28
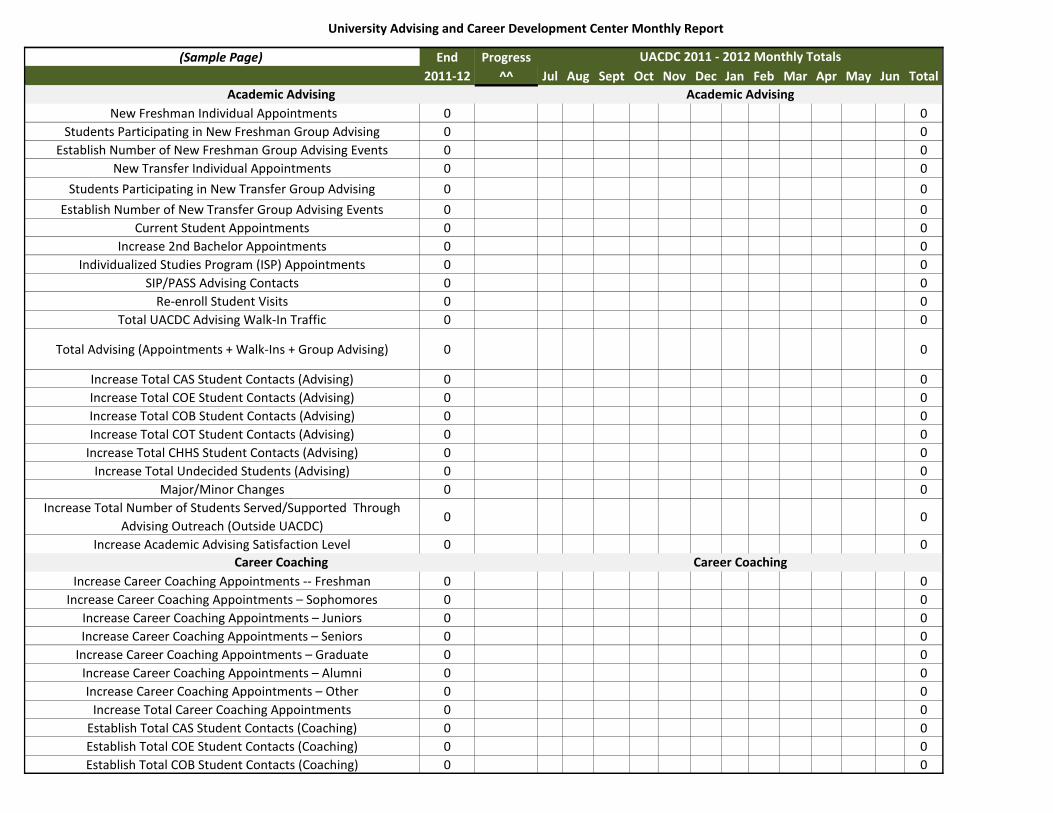
University Advising and Career Development Center Monthly Report
(Sample Page) End Progress
2011-12 ^^ Jul Aug Sept Oct Nov Dec Jan Feb Mar Apr May Jun Total
New Freshman Individual Appointments 0 0
Students Participating in New Freshman Group Advising 0 0
Establish Number of New Freshman Group Advising Events 0 0
New Transfer Individual Appointments 0 0
Students Participating in New Transfer Group Advising 0 0
Establish Number of New Transfer Group Advising Events 0 0
Current Student Appointments 0 0
Increase 2nd Bachelor Appointments 0 0
Individualized Studies Program (ISP) Appointments 0 0
SIP/PASS Advising Contacts 0 0
Re-enroll Student Visits 0 0
Total UACDC Advising Walk-In Traffic 0 0
Total Advising (Appointments + Walk-Ins + Group Advising) 0 0
Increase Total CAS Student Contacts (Advising) 0 0
Increase Total COE Student Contacts (Advising) 0 0
Increase Total COB Student Contacts (Advising) 0 0
Increase Total COT Student Contacts (Advising) 0 0
Increase Total CHHS Student Contacts (Advising) 0 0
Increase Total Undecided Students (Advising) 0 0
Major/Minor Changes 0 0
Increase Total Number of Students Served/Supported Through
Advising Outreach (Outside UACDC)0 0
Increase Academic Advising Satisfaction Level 0 0
Increase Career Coaching Appointments -- Freshman 0 0
Increase Career Coaching Appointments – Sophomores 0 0
Increase Career Coaching Appointments – Juniors 0 0
Increase Career Coaching Appointments – Seniors 0 0
Increase Career Coaching Appointments – Graduate 0 0
Increase Career Coaching Appointments – Alumni 0 0
Increase Career Coaching Appointments – Other 0 0
Increase Total Career Coaching Appointments 0 0
Establish Total CAS Student Contacts (Coaching) 0 0
Establish Total COE Student Contacts (Coaching) 0 0
Establish Total COB Student Contacts (Coaching) 0 0
UACDC 2011 - 2012 Monthly Totals
Academic Advising Academic Advising
Career Coaching Career Coaching
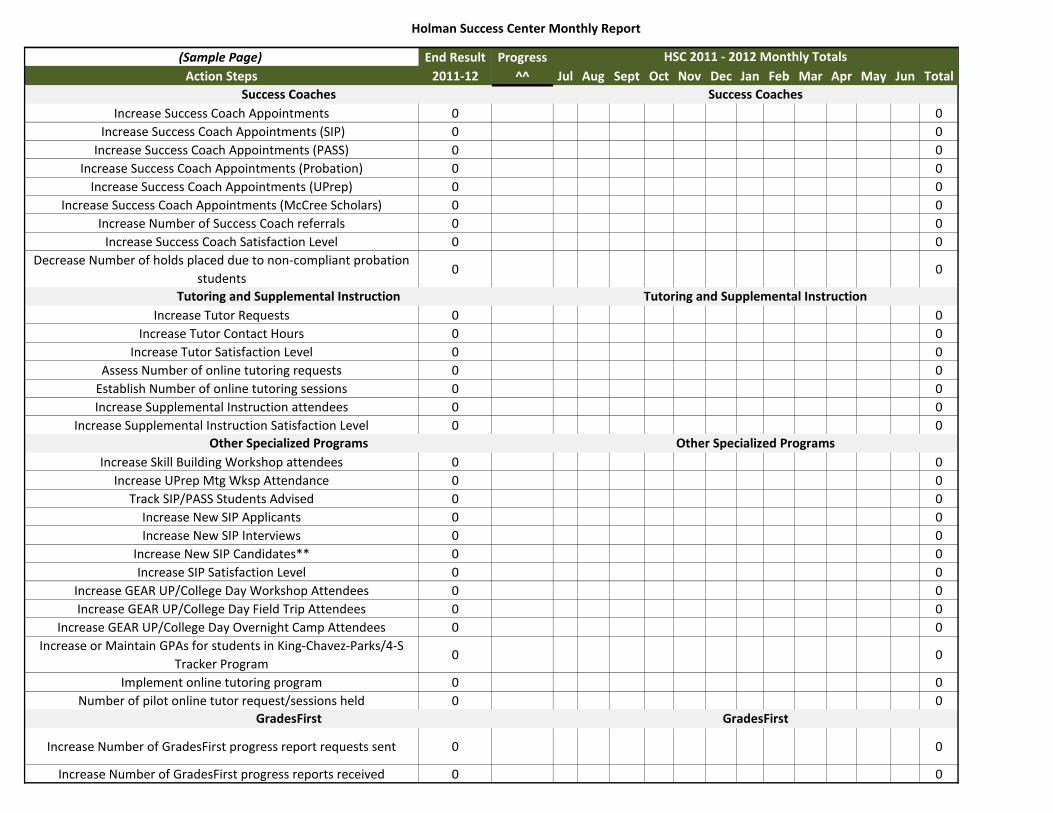
Holman Success Center Monthly Report
(Sample Page) End Result Progress
Action Steps 2011-12 ^^ Jul Aug Sept Oct Nov Dec Jan Feb Mar Apr May Jun Total
Increase Success Coach Appointments 0 0
Increase Success Coach Appointments (SIP) 0 0
Increase Success Coach Appointments (PASS) 0 0
Increase Success Coach Appointments (Probation) 0 0
Increase Success Coach Appointments (UPrep) 0 0
Increase Success Coach Appointments (McCree Scholars) 0 0
Increase Number of Success Coach referrals 0 0
Increase Success Coach Satisfaction Level 0 0
Decrease Number of holds placed due to non-compliant probation
students0 0
Increase Tutor Requests 0 0
Increase Tutor Contact Hours 0 0
Increase Tutor Satisfaction Level 0 0
Assess Number of online tutoring requests 0 0
Establish Number of online tutoring sessions 0 0
Increase Supplemental Instruction attendees 0 0
Increase Supplemental Instruction Satisfaction Level 0 0
Increase Skill Building Workshop attendees 0 0
Increase UPrep Mtg Wksp Attendance 0 0
Track SIP/PASS Students Advised 0 0
Increase New SIP Applicants 0 0
Increase New SIP Interviews 0 0
Increase New SIP Candidates** 0 0
Increase SIP Satisfaction Level 0 0
Increase GEAR UP/College Day Workshop Attendees 0 0
Increase GEAR UP/College Day Field Trip Attendees 0 0
Increase GEAR UP/College Day Overnight Camp Attendees 0 0
Increase or Maintain GPAs for students in King-Chavez-Parks/4-S
Tracker Program0 0
Implement online tutoring program 0 0
Number of pilot online tutor request/sessions held 0 0
Increase Number of GradesFirst progress report requests sent 0 0
Increase Number of GradesFirst progress reports received 0 0
HSC 2011 - 2012 Monthly Totals
Success Coaches
Tutoring and Supplemental Instruction
Success Coaches
Tutoring and Supplemental Instruction
Other Specialized Programs
GradesFirst
Other Specialized Programs
GradesFirst
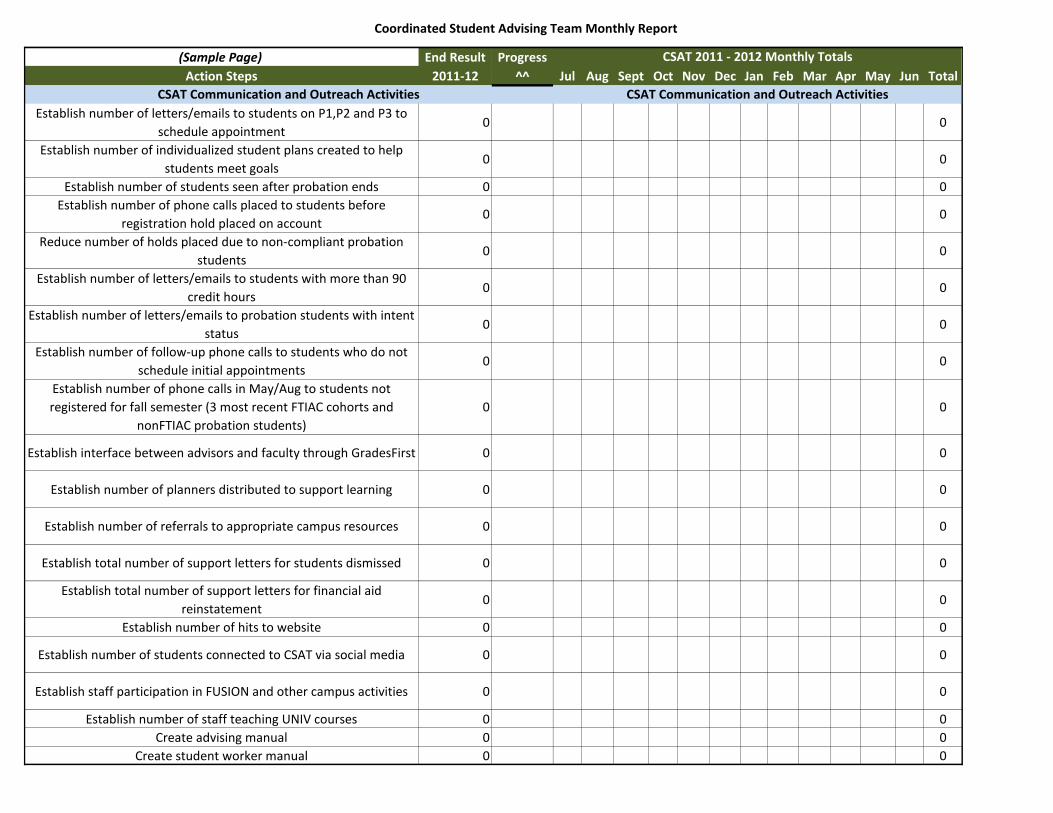
Coordinated Student Advising Team Monthly Report
(Sample Page) End Result Progress
Action Steps 2011-12 ^^ Jul Aug Sept Oct Nov Dec Jan Feb Mar Apr May Jun Total
Establish number of letters/emails to students on P1,P2 and P3 to
schedule appointment 0 0
Establish number of individualized student plans created to help
students meet goals0 0
Establish number of students seen after probation ends 0 0
Establish number of phone calls placed to students before
registration hold placed on account0 0
Reduce number of holds placed due to non-compliant probation
students0 0
Establish number of letters/emails to students with more than 90
credit hours0 0
Establish number of letters/emails to probation students with intent
status0 0
Establish number of follow-up phone calls to students who do not
schedule initial appointments0 0
Establish number of phone calls in May/Aug to students not
registered for fall semester (3 most recent FTIAC cohorts and
nonFTIAC probation students)
0 0
Establish interface between advisors and faculty through GradesFirst 0 0
Establish number of planners distributed to support learning 0 0
Establish number of referrals to appropriate campus resources 0 0
Establish total number of support letters for students dismissed 0 0
Establish total number of support letters for financial aid
reinstatement0 0
Establish number of hits to website 0 0
Establish number of students connected to CSAT via social media 0 0
Establish staff participation in FUSION and other campus activities 0 0
Establish number of staff teaching UNIV courses 0 0
Create advising manual 0 0
Create student worker manual 0 0
CSAT 2011 - 2012 Monthly Totals
CSAT Communication and Outreach ActivitiesCSAT Communication and Outreach Activities
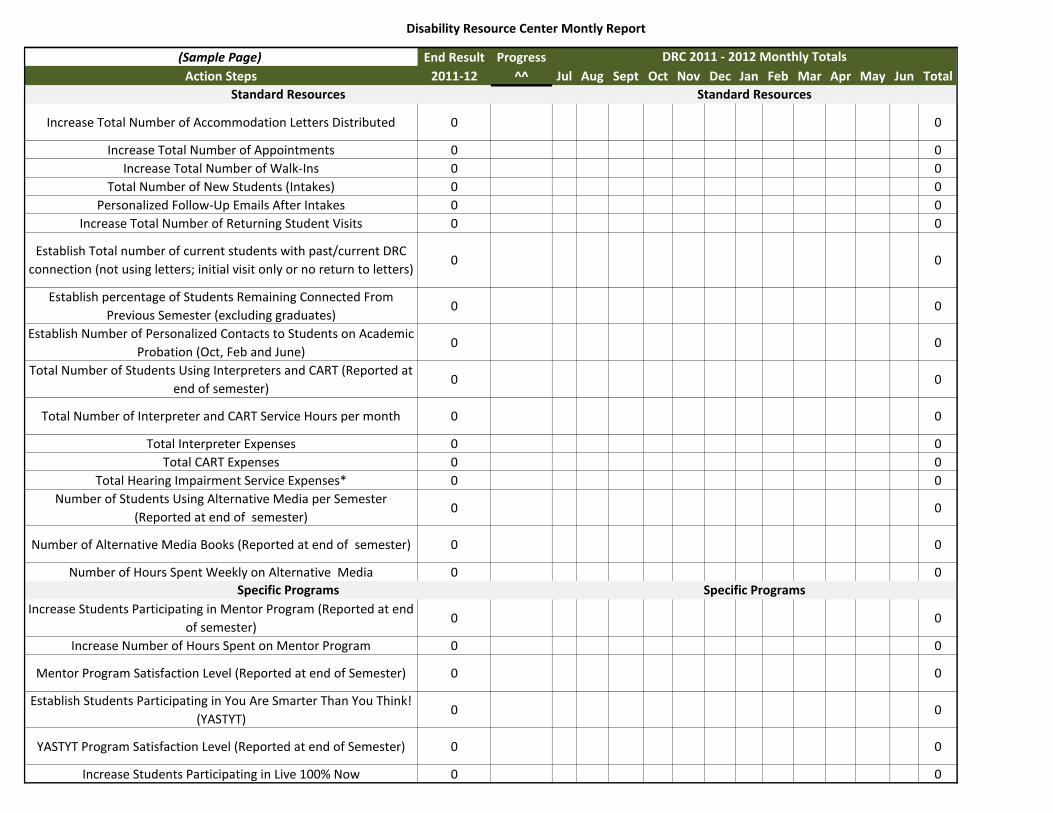
Disability Resource Center Montly Report
(Sample Page) End Result Progress
Action Steps 2011-12 ^^ Jul Aug Sept Oct Nov Dec Jan Feb Mar Apr May Jun Total
Increase Total Number of Accommodation Letters Distributed 0 0
Increase Total Number of Appointments 0 0
Increase Total Number of Walk-Ins 0 0
Total Number of New Students (Intakes) 0 0
Personalized Follow-Up Emails After Intakes 0 0
Increase Total Number of Returning Student Visits 0 0
Establish Total number of current students with past/current DRC
connection (not using letters; initial visit only or no return to letters)0 0
Establish percentage of Students Remaining Connected From
Previous Semester (excluding graduates)0 0
Establish Number of Personalized Contacts to Students on Academic
Probation (Oct, Feb and June)0 0
Total Number of Students Using Interpreters and CART (Reported at
end of semester)0 0
Total Number of Interpreter and CART Service Hours per month 0 0
Total Interpreter Expenses 0 0
Total CART Expenses 0 0
Total Hearing Impairment Service Expenses* 0 0
Number of Students Using Alternative Media per Semester
(Reported at end of semester)0 0
Number of Alternative Media Books (Reported at end of semester) 0 0
Number of Hours Spent Weekly on Alternative Media 0 0
Increase Students Participating in Mentor Program (Reported at end
of semester)0 0
Increase Number of Hours Spent on Mentor Program 0 0
Mentor Program Satisfaction Level (Reported at end of Semester) 0 0
Establish Students Participating in You Are Smarter Than You Think!
(YASTYT)0 0
YASTYT Program Satisfaction Level (Reported at end of Semester) 0 0
Increase Students Participating in Live 100% Now 0 0
DRC 2011 - 2012 Monthly Totals
Standard Resources
Specific Programs
Standard Resources
Specific Programs

KTD Monthly Report
(Sample Page) End Result Progress
Action Steps 2011-12 ^^ Jul Aug Sept Oct Nov Dec Jan Feb Mar Apr May Jun Total
Number of participant individual meetings with program director 0 0
Number of GradesFirst Progress Reports received 0 0
Number of meetings with success coaches, interns, and/or
Graduate Assistants0 0
Number of meetings with supplemental instructors 0 0
Number of meetings with tutors 0 0
Number of students participating in mentor program 0 0
Number of Creating a Better Me Group sessions 0 0
Number of Summer Ounce of Prevention Sessions
Number of Finding Your Way sessions 0 0
Number of students completing 10 hours of community service
project0 0
Number of collective Success Coach meetings 0 0
Mentor Satisfaction 0 0
Creating a Better Me Satisfaction 0 0
Transition Life Skills (COUN 477) Satisfaction 0 0
Summer Ounce of Prevention Satisfaction 0 0
Finding Your Way satisfaction 0 0
Overall 1st Year Keys to Degrees Satisfaction 0 0
Number of students deemed "at risk" 0 0
Number of students with 3.0 and above GPA 0 0
Number of students with 2.5 - 2.99 GPA 0 0
Number of students with 2.0 - 2.49 GPA 0 0
Number of students with GPA below 2.0 0 0
Number of students participating in weekly interventions due to
GPA less than 2.50 0
Number of students retained each semester from previous
semester0 0
Number of students with 36+ credit-hours completed by beginning
of second year0 0
Number of students with 72+ credit-hours completed by beginning
of third year0 0
Number of students with 108+ credit-hours completed by
beginning of fourth year0 0
Academic Progress
Satisfaction
General Resources and Programs
Academic Progress
KTD 2011 - 2012 Monthly Totals
General Resources and Programs
Satisfaction
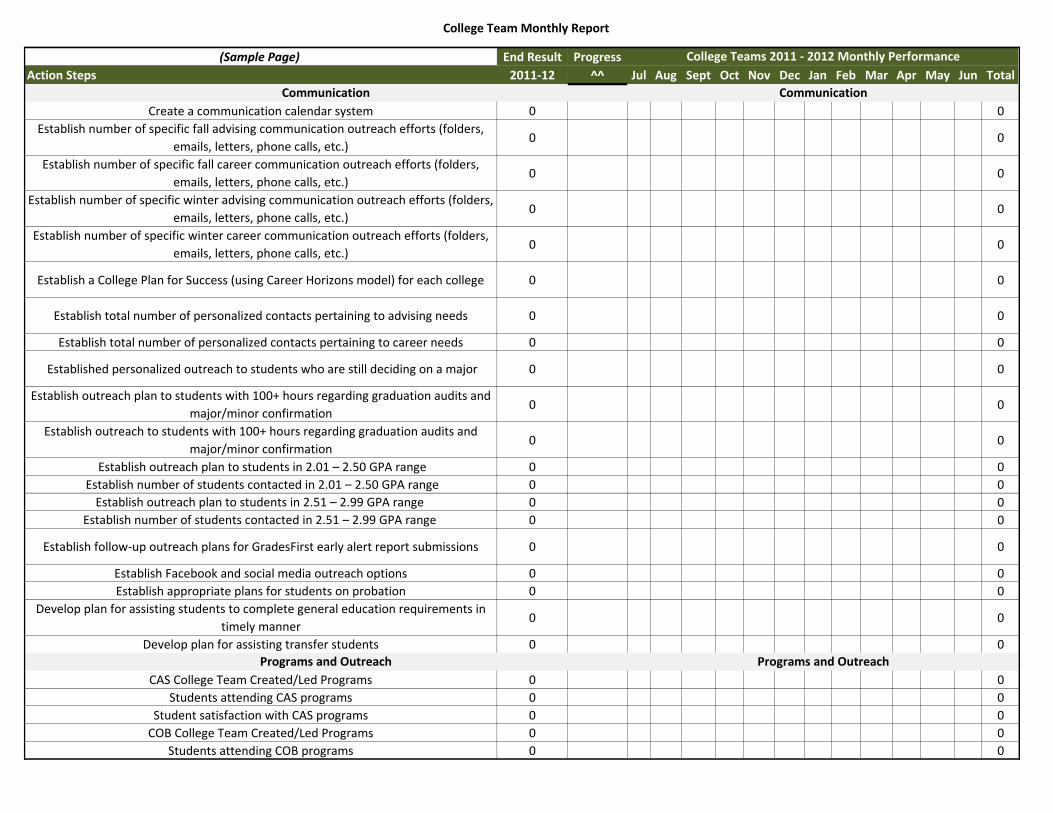
College Team Monthly Report
(Sample Page) End Result Progress
Action Steps 2011-12 ^^ Jul Aug Sept Oct Nov Dec Jan Feb Mar Apr May Jun Total
Create a communication calendar system 0 0
Establish number of specific fall advising communication outreach efforts (folders,
emails, letters, phone calls, etc.)0 0
Establish number of specific fall career communication outreach efforts (folders,
emails, letters, phone calls, etc.)0 0
Establish number of specific winter advising communication outreach efforts (folders,
emails, letters, phone calls, etc.)0 0
Establish number of specific winter career communication outreach efforts (folders,
emails, letters, phone calls, etc.)0 0
Establish a College Plan for Success (using Career Horizons model) for each college 0 0
Establish total number of personalized contacts pertaining to advising needs 0 0
Establish total number of personalized contacts pertaining to career needs 0 0
Established personalized outreach to students who are still deciding on a major 0 0
Establish outreach plan to students with 100+ hours regarding graduation audits and
major/minor confirmation0 0
Establish outreach to students with 100+ hours regarding graduation audits and
major/minor confirmation0 0
Establish outreach plan to students in 2.01 – 2.50 GPA range 0 0
Establish number of students contacted in 2.01 – 2.50 GPA range 0 0
Establish outreach plan to students in 2.51 – 2.99 GPA range 0 0
Establish number of students contacted in 2.51 – 2.99 GPA range 0 0
Establish follow-up outreach plans for GradesFirst early alert report submissions 0 0
Establish Facebook and social media outreach options 0 0
Establish appropriate plans for students on probation 0 0
Develop plan for assisting students to complete general education requirements in
timely manner0 0
Develop plan for assisting transfer students 0 0
CAS College Team Created/Led Programs 0 0
Students attending CAS programs 0 0
Student satisfaction with CAS programs 0 0
COB College Team Created/Led Programs 0 0
Students attending COB programs 0 0
College Teams 2011 - 2012 Monthly Performance
Communication
Programs and OutreachPrograms and Outreach
Communication
Quarterly Report Tools Samples
29
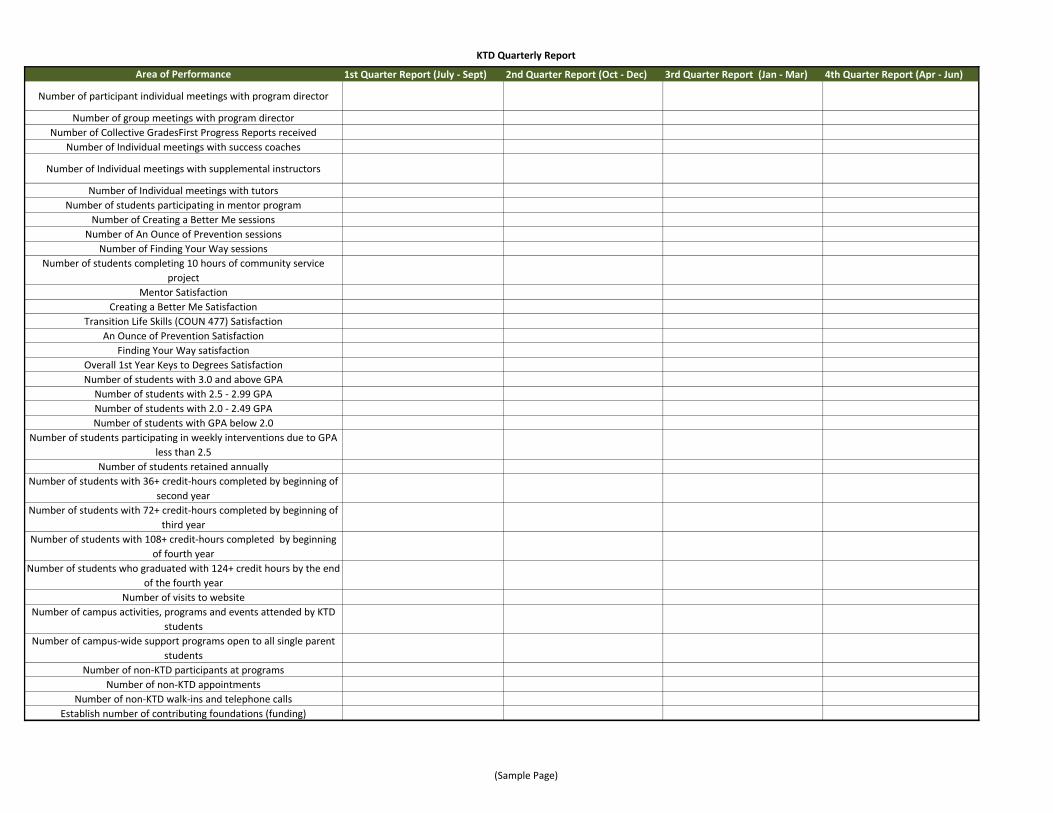
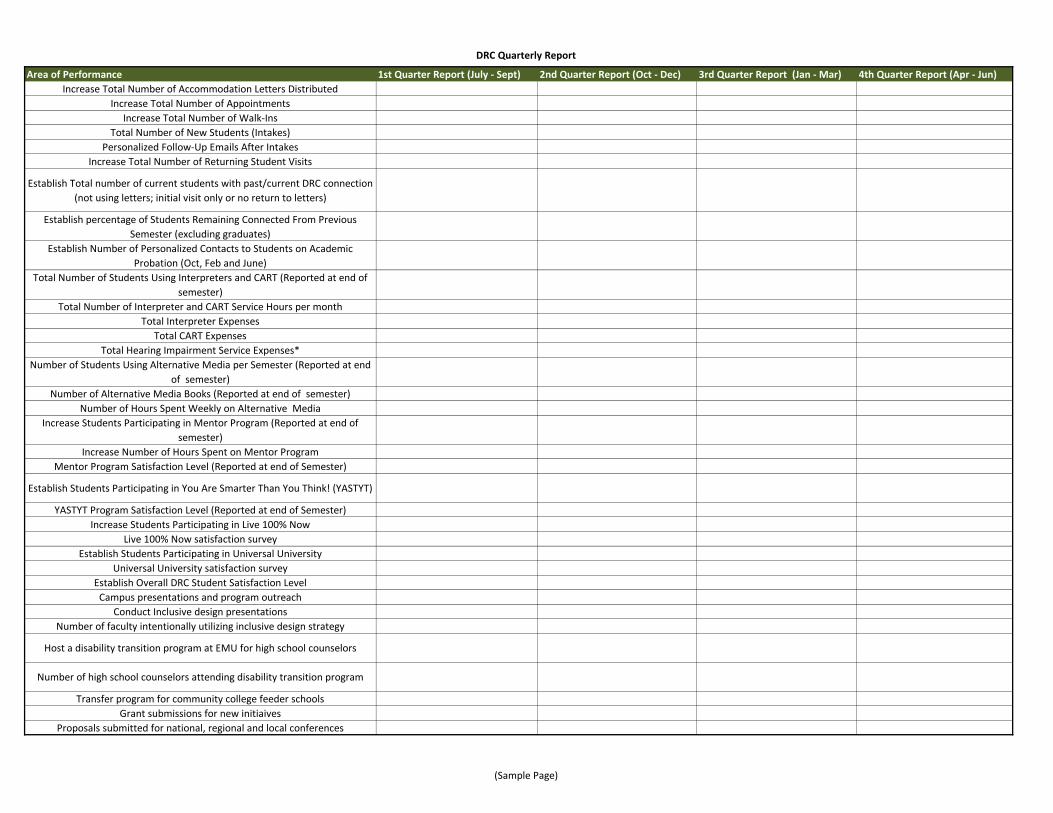

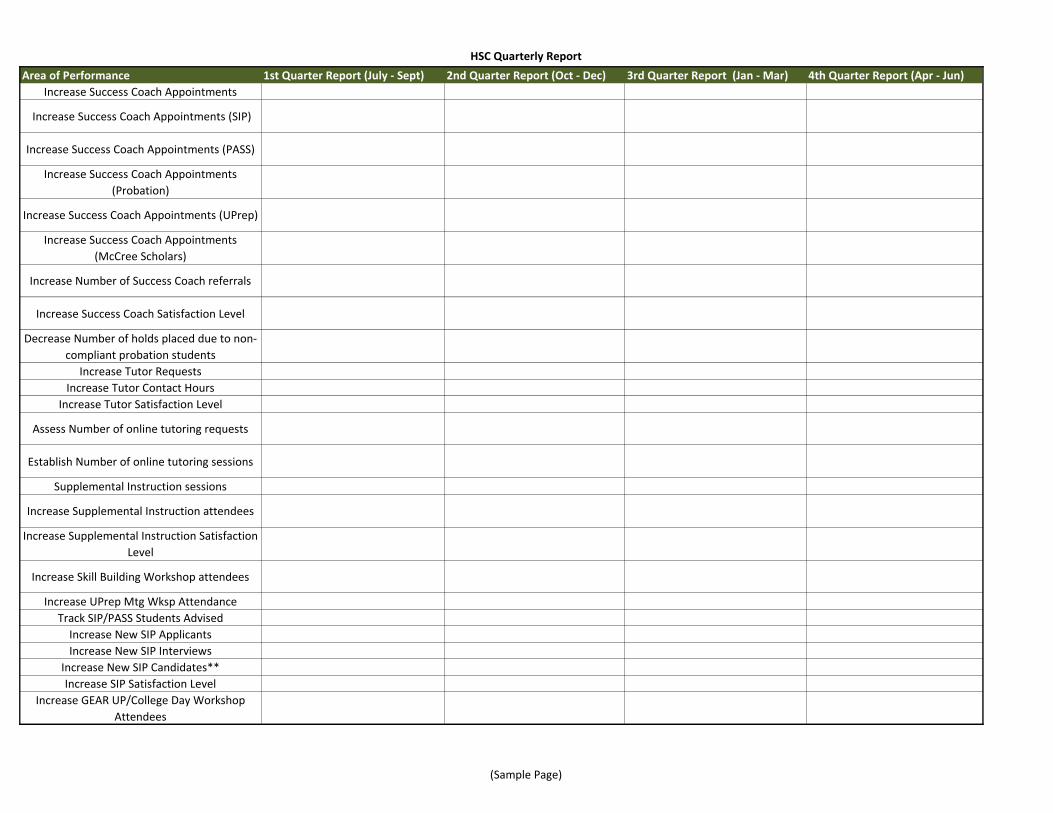
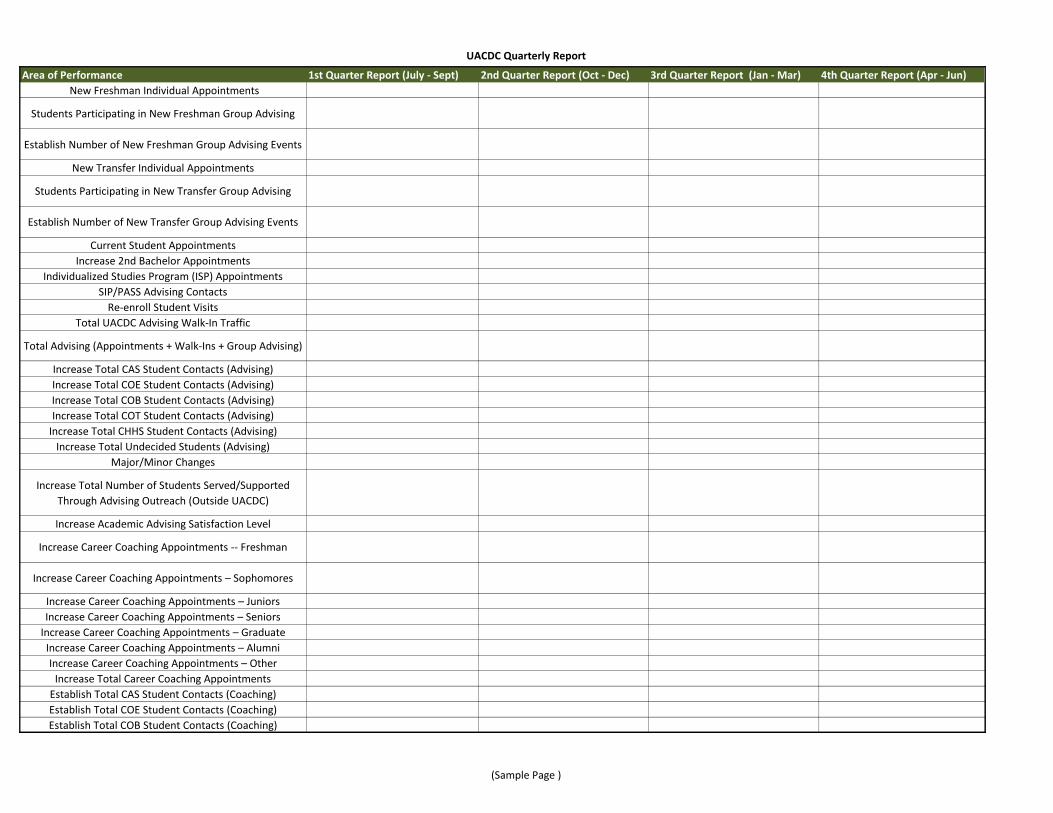
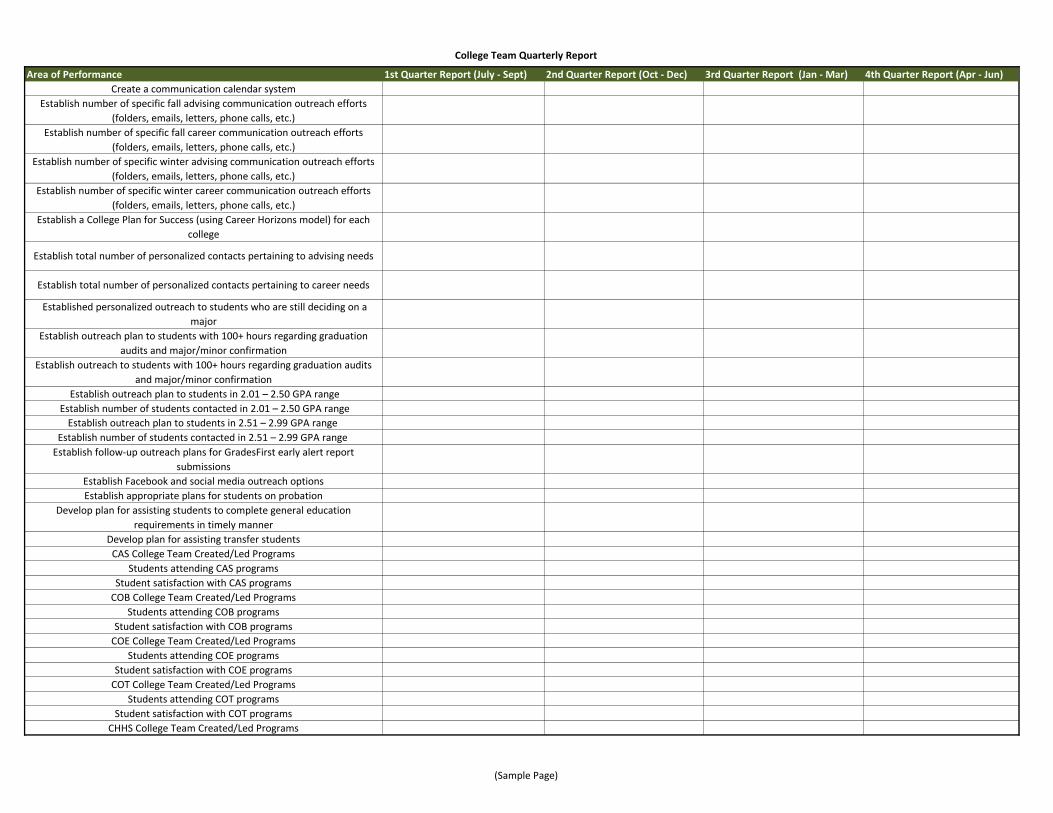
College Team Quarterly Report
Area of Performance 1st Quarter Report (July - Sept) 2nd Quarter Report (Oct - Dec) 3rd Quarter Report (Jan - Mar) 4th Quarter Report (Apr - Jun)
Create a communication calendar system
Establish number of specific fall advising communication outreach efforts
(folders, emails, letters, phone calls, etc.)
Establish number of specific fall career communication outreach efforts
(folders, emails, letters, phone calls, etc.)
Establish number of specific winter advising communication outreach efforts
(folders, emails, letters, phone calls, etc.)
Establish number of specific winter career communication outreach efforts
(folders, emails, letters, phone calls, etc.)
Establish a College Plan for Success (using Career Horizons model) for each
college
Establish total number of personalized contacts pertaining to advising needs
Establish total number of personalized contacts pertaining to career needs
Established personalized outreach to students who are still deciding on a
major
Establish outreach plan to students with 100+ hours regarding graduation
audits and major/minor confirmation
Establish outreach to students with 100+ hours regarding graduation audits
and major/minor confirmation
Establish outreach plan to students in 2.01 – 2.50 GPA range
Establish number of students contacted in 2.01 – 2.50 GPA range
Establish outreach plan to students in 2.51 – 2.99 GPA range
Establish number of students contacted in 2.51 – 2.99 GPA range
Establish follow-up outreach plans for GradesFirst early alert report
submissions
Establish Facebook and social media outreach options
Establish appropriate plans for students on probation
Develop plan for assisting students to complete general education
requirements in timely manner
Develop plan for assisting transfer students
CAS College Team Created/Led Programs
Students attending CAS programs
Student satisfaction with CAS programs
COB College Team Created/Led Programs
Students attending COB programs
Student satisfaction with COB programs
COE College Team Created/Led Programs
Students attending COE programs
Student satisfaction with COE programs
COT College Team Created/Led Programs
Students attending COT programs
Student satisfaction with COT programs
CHHS College Team Created/Led Programs
(Sample Page)