studied via global entrepreneurship monitor in denmark 2011
TRANSCRIPT

Entrepreneurial Work by Employees in Enterprises– studied via Global Entrepreneurship Monitor in Denmark 2011
Entrepreneurial work consists of discovering opportunities and exploiting opportunities. Entrepreneurial work is done in new businesses and in entrepreneurial work by employees in enterprises. Here we first focus on entrepreneurial work by employees. How is entrepre-neurial work by employees organized in time into an idea-phase and an implementation-phase, and organized in social roles of leader and supporter of entrepreneurial work? What is the volume of entrepreneurial work in various countries around the world, and is Den-mark at the top or at the bottom? What characteristics of an employee – gender, age, educa-tion – make an employee go into entrepreneurial work rather than routine work? Do entre-preneurially working employees differ from routinely working employees and independent entrepreneurs in their competencies and work-qualities? Does industry differ from other sectors in entrepreneurial work by employees? Do industrial business relations promote innovation, exporting and growth-expectations? Do partnerships among public and private enterprises promote innovation? – Then we focus on entrepreneurial work by independent entrepreneurs who start or run their own businesses. Has the level of independent entre-preneurial activity in Denmark declined during the economic recession, and is the Danish level higher or lower than in other societies? Are the cultural and institutional framework conditions in Denmark deteriorating or stable despite the recession, and are Danish condi-tions better or worse than in other societies? How do the framework conditions shape inde-pendent entrepreneurship, and what are the effects of culture and institutions? – These questions are addressed by analyzing data from our surveys in 2011 and preceding years in Denmark and many other countries, gathered mainly in our research program Global Entrepreneurship Monitor, GEM, and this year also by a survey of industrial and other firms in Denmark, generously financed by a grant from the Danish Industry Foundation, Industriens Fond. Our up-to-date surveys and analyses provide leading indicators of current changes in entrepreneurship.
Thomas Schøtt studied at the Univer-sity of Aarhus (cand.scient.), Columbia University (M.A. in statistics, and Ph.D. in sociology) and Yale University (postdoc in organizational research), was Assistant Professor and Associate Professor at the University of Pitts-burgh, is Professor in the Department of Entrepreneurship and Relation-ship Management at the University of Southern Denmark, and is also Professor (adjunct) in the Faculty of Entrepreneurship at University of Tehran. As the National Team Leader of the Danish GEM-team, he directs the Danish research program affili-ated with the Global Entrepreneurship Monitor, where he is a member of the Research Committee and leads the re-search groups on entrepreneurs’ advice networks and on enterprises’ business-relations. He teaches entrepreneur-ship, organizations, methodology and networks among people and organiza-tions. He consults to agencies and in-ternational organizations on entrepre-neurship, intervention, organizations, clusters and development in local and global regions. He researches entre-preneurship, innovation and network organization, and he has published numerous articles in international journals and several books, including the seven research monographs, Entre-preneurship in Denmark 2005; Entre-preneurship in the Regions in Den-mark 2006; Growth-Entrepreneurship in Denmark 2007; Education, Training and Networking for Entrepreneurship in Denmark 2008; Social and Com-mercial Entrepreneurship in Denmark 2009; Training and Network Organiza-tion in Entrepreneurship in Denmark 2010; and now Entrepreneurial Work by Employees in Enterprises in Den-mark 2011.
Entrepreneurial Work by Em
ployees in Enterprises
Tho
Ma
s sch
øTT
ThoMas schøTT

Entrepreneurial Work by Employees in Enterprises
– studied via Global Entrepreneurship Monitor in Denmark 2011
Thomas Schøtt

Entrepreneurial Work by Employees in Enterprises– studied via Global Entrepreneurship Monitor in Denmark 2011
© Thomas Schøtt (and GERA for items quoted from GEM surveys).
University of Southern DenmarkDepartment of Entrepreneurship and Relationship ManagementEngstien 16000 KoldingDenmarkEmail [email protected]
Layout og tryk: Jørn Thomsen Elbo A/S, Kolding
ISBN: 987-87-91070-43-3
Gengivelse af denne bog eller dele heraf er ikke tilladt uden forfatterens tilladelse, ifølge gælden lov om ophavsret.

3Entrepreneurial Work by Employees in Enterprises– studied via Global Entrepreneurship Monitor in Denmark 2011
Entrepreneurial work is discovery and exploitation of opportunities. Entrepreneurial work is done by independent entrepreneurs founding new businesses and by especially entrepreneurial employees in existing enterprises. – Here we first focus on entrepre-neurial work by employees. How is entrepreneurial work by employees organized in time into an idea-phase and an implementation-phase, and organized in social roles of leader and supporter of entrepreneurial work? What is the volume of entrepreneurial work in various countries around the world, and is Denmark at the top or at the bot-tom? What characteristics of an employee - gender, age, education - make an employee go into entrepreneurial work rather than routine work? Do entrepreneurially working employees differ from routinely working employees and independent entrepreneurs in their competencies and work-qualities? Does industry differ from other sectors in entre-preneurial work by employees? Do industrial business relations promote innovation, exporting and growth-expectations? Do partnerships among public and private enter-prises promote innovation? – Then we focus on entrepreneurial work by independent entrepreneurs who start or run their own businesses. Has the level of independent en-trepreneurial activity in Denmark declined during the economic recession, and is the Danish level higher or lower than in other societies? Are the cultural and institutional framework conditions in Denmark deteriorating or stable despite the recession, and are Danish conditions better or worse than in other societies? How do the framework con-ditions shape independent entrepreneurship, and what are the effects of culture and institutions?
These questions are addressed by analyzing data from our surveys in 2011 and pre-ceding years in Denmark and many other countries, gathered mainly in our research program Global Entrepreneurship Monitor, GEM, and this year also by a survey of in-dustrial and other firms in Denmark. Our up-to-date surveys and analyses provide lead-ing indicators of current changes in entrepreneurship.
This study is a sequel to my six research monographs, Entrepreneurship in Denmark 2005; Entrepreneurship in the Regions in Denmark 2006; Growth-Entrepreneurship in Denmark 2007; Education, Training and Networking for Entrepreneurship in Denmark 2008; and Social and Commercial Entrepreneurship in Denmark 2009; and Training and Network Organization in Entrepreneurship in Denmark 2010. This study is the thirteenth in the series of annual thematic studies of entrepreneurship in Denmark, with up-to-date analyses covering each year from 1999 through 2011. The series is part of the re-search program Global Entrepreneurship Monitor (GEM), conducted by the interna-tional consortium Global Entrepreneurship Research Association (GERA), in which the Danish team is headed by the main author. The Danish team and the consortium have collected most of the data, but the analyses and interpretations are of course the sole responsibility of the author.
The study was generously supported by a grant from the Danish Industry Founda-tion, Industriens Fond. The University of Southern Denmark – through our Department of Entrepreneurship and Relationship Management – granted me time and facilities for
Preface

Entrepreneurial Work by Employees in Enterprises– studied via Global Entrepreneurship Monitor in Denmark 2011
the research. The study benefitted from collaboration with Torben Bager, Majbritt R. Evald and Mahdokht Sedaghat and discussions with our numerous colleagues in GEM/GERA around the world. This monograph can also be viewed on the internet at www.gemconsortium.org
University of Southern Denmark, Winter solstice 2011 Thomas Schøtt

5
PrefaceContentsSammenfatning – Summary in Danish
PART 1 INTRODUCTIONChapter 1 Introduction: Entrepreneurial work by employees and independent entrepre-
neurs
PART 2 ENTREPRENEURIAL WORK BY EMPLOYEESChapter 2 Phases and roles in entrepreneurial work by employeesChapter 3 Entrepreneurial work by employees in Denmark and in other countries around
the worldChapter 4 Employees’ entrepreneurial versus routine work shaped by their backgroundChapter 5 Competencies and work-qualities of entrepreneurial employees contrasted routine employees and independent entrepreneursChapter 6 Job-creation through entrepreneurial work by employees and independent en-
trepreneurs
PART 3 ENTREPRENEURIAL WORK BY EMPLOYEES IN DANISH INDUS-TRY
Chapter 7 Employees in industry: Entrepreneurial employees compared to routine em-ployees
Chapter 8 Entrepreneurial employees: Industry compared to private non-industry and the public sector
Chapter 9 Industrial and other firms’ relations shaping innovation, export and growth-expectation
Thomas Schøtt and Mahdokht SedaghatChapter 10 Collaborations among and between public and private actors. Majbritt R. Evald, Thomas Schøtt, Ann H. Clarke and Kristin B. Munksgaard
PART 4 INDEPENDENT ENTREPRENEURSHIPChapter 11 The changing level of independent entrepreneurship in Denmark and other
societiesChapter 12 National conditions for independent entrepreneurship: Trends in Denmark
and comparisonsChapter 13 Effects of framework conditions upon level of independent entrepreneurship
PART 5 CONCLUSIONSChapter 14 Entrepreneurial work by employees and independent entrepreneurs in Nordic,
Anglo-Saxon, and Continental countries. Torben Bager and Thomas Schøtt
Appendix Technical specificationsBibliographyNational teams in Global Entrepreneurship Monitor in 2011
contents

6 Entrepreneurial Work by Employees in Enterprises
– studied via Global Entrepreneurship Monitor in Denmark 2011

7Entrepreneurial Work by Employees in Enterprises– studied via Global Entrepreneurship Monitor in Denmark 2011
sammenfatning – Danish summary
Entreprenørielt arbejde, entrepreneurial work, betegner det foretagsomme arbejde, der består i at opdage og udnytte muligheder, især forretningsmuligheder, for at starte og udvikle foretagender. Arbejdet på opdagelsen og udnyttelsen har en organisering.
Entreprenørielt arbejde udføres i organisatoriske rammer, dels ved opstart af nye virk-somheder og dels ved udvikling af nye forretningsområder eller aktiviteter inden for eksisterende virksomheder. Mellem disse to rene organisationsformer er to blandings-former, en eksisterende virksomheds opkøb af en ny virksomhed, og en ny virksomhed der dannes ved spin-off eller udskillelse fra en eksisterende virksomhed.
Entreprenørielt arbejde udføres dels i rollen som selvstændig iværksætter der starter egen virksomhed og dels i rollen som entreprenant medarbejder der udvikler nye aktiv-iteter for sin arbejdsgiver.
Opdage muligheder
Organisering Udnytte muligheder
Eksisterende virksomheder
Opdage muligheder
Overtagelse af en ny virksomhed
af en eksisterende virksomhed
Spin-off af en ny virksomhed fra en
eksisterende virksomhed
Nye virksomheder
Udnytte muligheder

8 Entrepreneurial Work by Employees in Enterprises
– studied via Global Entrepreneurship Monitor in Denmark 2011
Sammenfatning – Danish SummarySammenfatning – Danish Summary
Eksisterende virksomhed Medarbejder som intraprenør Roller: Leder og støtter Faser: Idéfase og implementeringsfase
Udnytte mulighed
Opdage mulighed
Ny virksomhed Ejer-‐leder som entreprenør/iværksætter Roller: ene ejer-‐leder og med-‐ejer-‐leder Faser: Intention, opstart, operativ
Overtagelse
Spin-‐off
I den eksisterende virksomhed udføres det entreprenørielle arbejde ofte af en medar-bejder, der undertiden betegnes intraprenør, i rollen som leder af det entreprenørielle arbejde snarere end som støtter af arbejdet. Det entreprenørielle arbejde forløber ofte i to faser, opdagelsen af en mulighed som mere konkret betegnes som idéfasen, og udnyt-telsen af muligheden som mere konkret kaldes implementeringsfasen, hvori idéen søges gennemført.
Ved opstarten af en ny virksomhed udføres det entreprenørielle arbejde ofte af en ejer-leder, der ofte betegnes som entreprenør eller iværksætter, og mere formelt i rollen som eneste ejer-leder eller som med-ejer-leder i et team af ejer-ledere. Opdagelse og ud-nyttelse af en mulighed bliver her ofte konkretiseret i tre faser, en intentionsfase hvori der planlægges en opstart, en opstartsfase hvor virksomheden begyndes, og en operativ-fase hvor virksomheden udvikler sig.
Entreprenørielt arbejde udføres til dels som en erhvervsbeskæftigelse, der egentlig bør betegnes entreprenør efter det oprindelige franske entrepreneur, der i angelsaksiske sam-fund er blevet til betegnelsen for denne beskæftigelse. Entreprenør sammenfatter hermed de beskæftigelser, der ofte betegnes iværksætter, ejer-leder og selvstændig erh-vervsdrivende, og også beskæftigelsen som entreprenant medarbejder i en eksisterende virksomhed, omend dette sjældent udkrystalliseres som en særskilt og anerkendt beskæftigelse. Betegnelsen entreprenør, og den danske betegnelse iværksætter, bruges i megen daglig tale for rollen som selvstændig starter af egen virksomhed, mens rollen som entreprenant medarbejder inden for eksisterende virksomheder undertiden beteg-nes intraprenør. Jeg foretrækker her at undgå betegnelsen intraprenør og i stedet bruge betegnelsen entreprenant medarbejder, entrepreneurial employee.
Entreprenørielt arbejde er til dels etableret og institutionaliseret som en samfundsin-
Eksisterende virksomhedMedarbejder som intraprenørRoller: Leder og støtterFaser: Idéfase og implementeringsfase
Ny virksomhedEjer-leder som entreprenør/iværksætterRoller: ene ejer-leder og med-ejer-lederFaser: Intention, opstart, operativ
Opdage mulighed
Udnytte mulighed
Overtagelse
Spin-off

9Entrepreneurial Work by Employees in Enterprises– studied via Global Entrepreneurship Monitor in Denmark 2011
Sammenfatning – Danish SummarySammenfatning – Danish Summary
stitution med institutionelle og kulturelle rammer. Den kulturelle værdi, der af samfun-det tillægges entreprenørskab, kommer kulturelt til udtryk i prestige af entreprenør som erhvervsbeskæftigelse, i anerkendelse af veludført entreprenant virke og også i under-visning i entreprenørielt virke.
Institutionaliseringen af entreprenørielt arbejde foregår også i verdenssamfundet, hvor et verdensomspændende netværk af indflydelsesrige organisationer, centreret om-kring OECD, Verdensbanken og Forenede Nationer (især FNs organisation for indus-triel udvikling UNIDO), rådgiver om rammevilkår der kan fremme entreprenørielt ar-bejde, også i Danmark (OECD 2008). Den verdensomspændende institutionalisering af entreprenørielt virke er et led i moderniseringen, udviklingen og globaliseringen af menneskeheden.
Siden 1990erne er den globale institutionalisering af entreprenørielt virke også frem-met af en international sammenslutning af forskere, nu veletableret som Global Entre-preneurship Research Association (GERA), især gennem konsortiets forskningspro-gram Global Entrepreneurship Monitor (GEM), som dette studie og forfatteren er tilknyttet, som National Team Leader for det danske forskerteam, der også omfatter medforfatterne.
I forskningsprogrammet Global Entrepreneurship Monitor gennemfører vi i konsor-tiet hvert år en spørgeskemaundersøgelse af befolkningen i hvert deltagende land og næsten hvert år også en ekspertvurdering af landets rammevilkår. Op til nu, siden beg-yndelsen i 1999, har 90 lande (eller lande-lignende samfund) deltaget i et eller flere år. Danmark har deltaget i hvert af de 13 år, så vi opdaterer løbende og spotter de aktuelle udviklingstendenser. Ved sammenligninger af mange lande kan vi studere den generelle dynamik i entreprenørielt arbejde, som den typisk er i mange lande, især i de højt ud-viklede lande, og mere specifikt den danske dynamik.
I denne bogs næste del sættes fokus på entreprenørielt arbejde der udføres af medarbe-jdere i eksisterende virksomheder. De store spørgsmål er (i Part 2):- Hvordan og hvor vidt bidrager organisering af medarbejderes entreprenørielle arbejde til
virksomheders vækst og jobskabelse?
Det første mere konkret spørgsmål om medarbejderes entreprenørielle arbejde er (Chap-ter 2):- Hvordan kan vi definere entreprenørielt arbejde så det kan skelnes fra rutine-arbejdet? - Hvordan organiseres det entreprenørielle arbejde med en arbejdsdeling i tid – i faser – og
i socialt rum – et hierarki af roller som leder og støtter?Entreprenørielt arbejde kan defineres som deltagelse i udviklingen af nye aktiviteter på arbejdspladsen, og når det eksemplificeres i interview med medarbejdere, så er det tilstrækkelig velafgrænset til at de kan fortælle hvorvidt de udfører og leder entre-prenørielt arbejde, eller understøtter det, og om de deltager i idéfasen eller implementer-ingsfasen, eller begge.
I vores spørgeskemaundersøgelse finder vi at medarbejdere i betydelig udstrækning deltager og leder entreprenørielt arbejde. Mange deltager i idéfasen og mange i imple-menteringsfasen, og mange i begge faser. Mange deltager som ledere, mange som støtter, og mange som både leder og støtter. Men rollen som leder af entreprenørielt arbejde er

10 Entrepreneurial Work by Employees in Enterprises
– studied via Global Entrepreneurship Monitor in Denmark 2011
ikke stabil, i den henseende at ret få af medarbejderne, der har ledet entreprenørielt arbe-jde i de seneste år, også nu leder sådant arbejde. Denne omskiftelighed i ledelse under-streger at rollen som intraprenør endnu ikke er udkrystalliseret i det danske samfund.
Omfanget af det entreprenørielle arbejde i landet undersøges (Chapter 3):- Hvor omfattende er medarbejderes entreprenørielle arbejde i Danmark og i andre lande
rundt omkring i verden?Spørgerunden i Danmark og tilsvarende i mange andre lande viser at omfanget i Dan-mark er meget højt, næsthøjest af samtlige undersøgte lande, kun overgået af Sverige. At det entreprenørielle arbejde er af større omfang i et andet land, endda et naboland med næsten samme samfundskultur og arbejdspladskultur, viser klart at der er mulighed og plads til forbedring i Danmark. Men stabiliteten i rollen som leder af entreprenant arbe-jde er lav i Danmark, den laveste blandt alle undersøgte lande, mens den er meget høj i nabolande såsom Sverige. Den lave stabilitet i rollen som intraprenør er formentlig en hæmsko for at forøge det entreprenørielle arbejde i Danmark. En institutionalisering eller etablering af en særlig rolle og anerkendt karriere, beskæftigelse og job som intra-prenør vil formentlig føre til en stigning i det entreprenørielle arbejde i Danmark. Rol-len som intraprenør er etableret i nogle få danske virksomheder, nok især på Danfoss, og dette kan blive et forbillede for udbredelsen i den danske virksomhedskultur.
Medarbejderes personlige baggrund kan påvirke specialiseringen i deres arbejde (Chap-ter 4):- Påvirker medarbejderes baggrund – såsom køn, alder og uddannelse - om de går ind i
entreprenørielt arbejde eller går mere ind i rutinepræget arbejde?Undersøgelsen viser at medarbejderes køn ikke påvirker retningen i deres arbejde, i og med at kvinder og mænd er lige tilbøjelige til at lede entreprenørielt arbejde. Uddan-nelse har stor indvirkning, på den måde at jo højere uddannelsen medarbejdere har, jo mere sandsynligt er det at de leder entreprenørielt arbejde.
Medarbejderes kompetencer og job-kvalitet undersøges (Chapter 5):- Hænger medarbejderes kompetencer og job-kvalitet sammen med specialiseringen i entre-
prenørielt arbejde?Undersøgelsen viser at entreprenørielle medarbejdere, sammenlignet med rutine-arbej-dere, oftere har viden til at starte et foretagende, og oftere kender nogen der starter foretagender. Entreprenørielle medarbejdere har oftere meningsfuldt arbejde med megen selvstændighed i arbejdet, og stor tilfredshed, men ofte med stress. Derfor er det ganske letforståeligt at kun et lille fåtal af de entreprenørielle medarbejdere har inten-tion om at gå ud og starte egen virksomhed.
Job-skabelse forventes når medarbejdere udvikler nye aktiviteter (Chapter 6):- Forventes mange job at skabes igennem medarbejderes entreprenørielt arbejde, mere eller
mindre som ved selvstændigt iværksætteri?Undersøgelsen viser at entreprenørielle medarbejdere forventer at deres udviklingsar-bejde vil føre til skabelse af mange nye jobs, ganske ligesom selvstændige iværksættere forventer at deres opstart af nye virksomheder vil medføre megen jobskabelse. Dette er

11Entrepreneurial Work by Employees in Enterprises– studied via Global Entrepreneurship Monitor in Denmark 2011
vigtigt for det antyder at ambitiøse ildsjæle ikke blot udfolder sig som selvstændige iværksættere, ofte ganske spektakulært og til megen hyldest i offentligheden, men også udfolder sig med ambitioner på de danske arbejdspladser.
Industriens entreprenørielle arbejde kommer i fokus i bogens efterfølgende del, Part 3.
Industriens entreprenørielle medarbejdere sammenlignes med de rutine-arbejdende i industrien (Chapter 7):- Er industriens entreprenørielle medarbejdere forskellige fra de rutine-arbejdende i deres
baggrund såsom køn, alder, uddannelse og indtægt, i deres job-kvaliteter såsom menings-fuldhed, selvstændighed, stress og tilfredshed, i deres entreprenørielle kompetencer såsom færdigheder, årvågenhed over for forretningsmuligheder, risikovillighed, og i deres inten-tion om at starte egen virksomhed?
Industriens entreprenørielle medarbejdere har samme sammensætning med hensyn til køn som de rutine-arbejdende, hvilket nok overrasker. Men de entreprenørielle medar-bejdere har betydeligt mere uddannelse end de rutine-arbejdende. De entreprenørielle medarbejdere får betydeligt højere løn, nok til dels fordi de er bedre uddannede og til dels fordi deres entreprenørielle arbejde belønnes. Industriens entreprenørielle medar-bejdere har, sammenlignet med de rutine-arbejdende, arbejde der er mere meningsfuldt og selvstændigt. Industriens entreprenørielle medarbejdere har også flere entre-prenørielle kompetencer, især har de oftere færdigheder til at starte egen virksomhed og kender oftere opstartere. Men industriens entreprenørielle medarbejdere har sjældent, måske endda sjældnere end de rutine-arbejdende, intention om snart at starte egen virk-somhed.
Industriens entreprenørielle arbejde sammenlignes med andre sektorers entreprenørielle arbejde (Chapter 8):- Er industriens entreprenørielle medarbejdere forskellige fra de entreprenørielle medarbej-
dere i den øvrige private sektor og i den offentlige sektor? Er industrien som de andre sek-torer i forventninger om vækst i form af jobskabelse?Industriens medarbejdere ser ud til at være tilbøjelige til at arbejde entreprenørielt
lidt oftere end medarbejdere i den øvrige private sektor, men mindre ofte end medarbe-jdere i den offentlige sektor. Industriens entreprenørielle medarbejdere ligner de entre-prenørielle medarbejdere i de to andre sektorer i mange henseender, især med hensyn til job-kvaliteter. Industriens entreprenørielle medarbejdere er mænd, lidt oftere end de entreprenørielle medarbejdere i den øvrige private sektor, men i den offentlige sektor er de entreprenørielle medarbejdere langt oftest kvinder. Industriens entreprenørielle me-darbejdere har særlig ofte færdigheder til at starte egen virksomhed men har lav årvå-genhed for forretningsmuligheder. Industriens entreprenørielle medarbejdere har sjældent intention om at starte egen virksomhed, sjældnere end entreprenørielle medar-bejde i den øvrige private sektor, og ligeså sjældent som entreprenørielle medarbejdere i den offentlige sektor, nok lidt overraskende. Industriens entreprenørielle medarbej-dere har forventninger til at deres udviklingsarbejde vil føre til skabelsen af mange nye jobs, høje forventninger der deles af entreprenørielle medarbejdere i den øvrige private sektor og af entreprenørielle medarbejdere i den offentlige sektor.

12 Entrepreneurial Work by Employees in Enterprises
– studied via Global Entrepreneurship Monitor in Denmark 2011
Entreprenørielt arbejde som udviklingen af nye aktiviteter foregår ikke kun inden for arbejdspladsens mure, men også i samarbejde med andre virksomheder og organisa-tioner, så derfor spørger vi (Chapter 9): - Har industriens og andre sektorers virksomheder samarbejdsrelationer med andre, som
fremmer innovation, eksport og forventninger til vækst i form af jobskabelse?Vores undersøgelse, baseret på GEM og et yderligere survey af industrielle og andre fir-maer med samme spørgsmål som i GEM, viser at firmaer varierer meget i deres netværk, og at netværk bringer fordele i form af øget innovation, øget eksport og øgede forvent-ninger til vækst og jobs. Disse effekter er stærke iblandt danske virksomheder som helhed, og specielt i industrien.
Entreprenørielt samarbejde mellem virksomheder sker i stigende grad i form af offen-tlig-private innovative partnerskaber (Chapter 10):- Hvor udbredte er samarbejder inden for og på tværs af den private sektor og den offentlige
sektor, og hvad drejer samarbejderne sig om, og hvad er deres udvikling af innovation?Undersøgelsen viser at samarbejder er mest udbredte inden for hver sektor, men også betydeligt udbredt på tværs af sektorer. Samarbejdet drejer sig særlig ofte om fælles udviklingsarbejde og er ofte innovativt.
Fokus skifter fra entreprenørielt arbejde på virksomhederne til det selvstændige entre-prenørielle virke i den næstsidste del, Part 4.
Det selvstændige entrepreneurielle virke i Danmark og andre lande afdækkes (Chapter 11):- Hvad er niveauet i selvstændigt entreprenørskab i Danmark? Er udviklingstendensen i
niveauet opadgående, stabil, eller nedadgående? Hvor højt er niveauet i Danmark sam-menlignet med andre udviklede lande?
Undersøgelsen, der opdaterer vores undersøgelser fra tidligere år, viser at Danmark fort-sat ligger under midten blandt de udviklede lande, nu især efter at den globale krise der begyndte i 2008 faktisk ramte dansk iværksætteri hårdere end den ramte i andre lande. Det danske niveau af iværksætteri i opstartsfasen, målt som voksenbefolkningens rate af iværksættere, der er i færd med at starte eller lige har startet en virksomhed, faldt under krisen der begyndte i 2008, og er nu noget lavere end det typisk er for de udviklede lande. Men når vi måler den allertidligste fase, fasen hvor folk har en intention om at starte in-den for overskuelig fremtid, så ser vi i Danmark en ny stigning i raten af folk der har til hensigt at starte ny virksomhed inden for de næste få år. Denne nylige stigning i inten-tioner i Danmark kan betragtes som en forløber, en tidlig eller ledende indikator, for en kommende stigning i opstartsraten. Men vilkårene for at omsætte en intention om at starte til handling kan jo være lammende, så derfor skal vi ikke forvente at den stigende interesse udløser en markant ny stigning i selvstændigt iværksætteriet.
Rammebetingelserne for det selvstændige iværksætteri i Danmark og andre lande følges (Chapter 12):- Hvordan er de nationale rammevilkår for entreprenørskab i Danmark? Er kulturelle og
institutionelle vilkår i Danmark under forbedring eller forringelse? Hvor gode er vilkårene i Danmark sammenlignet med betingelserne i andre lande?

13Entrepreneurial Work by Employees in Enterprises– studied via Global Entrepreneurship Monitor in Denmark 2011
Ved ekspertvurderinger har vi opnået indikatorer på rammevilkår i Danmark og i andre lande igennem de senere år. De 14 rammevilkår omfatter 4 kulturelle vilkår – indi-vidualisme som en kulturel værdi, prestige af den selvstændige iværksætter som erh-vervsbeskæftigelse, uddannelse og træning i entreprenørskab, befolkningens fær-digheder i entreprenørskab – samt 10 institutionelle vilkår: mulighederne for selvstæn-digt entreprenørskab, finansielle ressourcer, regeringspolitik for selvstændigt entre-prenørskab, offentlige støtteprogrammer, overførsel af teknologi til erhvervslivet, kom-merciel og juridisk infrastruktur, markedets åbenhed for ny virksomhed, den teknisk-fysiske infrastruktur, ophavsrettigheder og patentsystem, samt støtteforanstaltninger til vækst-entreprenørskab.
De fleste af rammevilkårene i Danmark er blevet bedre igennem de senere år. Nogle få af vilkårene er stagnerende. Få af vilkårene er alvorligt forringede igennem de senere år, mest adgangen til kapital. Alt i alt er rammen for dansk iværksætteri igennem de senere år blevet mere favorabel. Til trods for forbedringerne, så er vilkårene i Danmark stadig omkring midten i sammenligninger med de andre udviklede lande. De fleste ram-mevilkår i Danmark er som de typisk er i de udviklede lande, enkelte vilkår er betydeligt bedre i Danmark, og enkelte vilkår er betydeligt ringere i Danmark end typisk blandt de udviklede lande, så alt i alt er rammen i Danmark ret typisk.
Rammevilkårenes sammenhæng med niveauet i selvstændigt iværksætteri undersøges (Chapter 13):- Hvad er den nationale dynamik i entreprenørskab? Hvordan påvirker de kulturelle vilkår
hinanden? Hvordan er de institutionelle betingelser relateret til hinanden? Hvad er de særskilte effekter fra de kulturelle og institutionelle rammebetingelser på entreprenørsk-ab?
Rammevilkårene i et land påvirker niveauet af iværksætteri i landet betydeligt, viser en statistisk analyse af de udviklede lande. Befolkningens færdigheder fremmes betydeligt af undervisning i iværksætteri, og af værdien af individualisme i landet. Mulighederne for iværksætteri fremmes betydeligt af de mere konkrete institutionelle rammer. Gode muligheder i landet koblet med gode færdigheder i befolkningen fremmer niveauet af iværksætteri i samfundet.
Den nære sammenhæng mellem rammevilkår og niveauet i iværksætteri illustreres af Danmarks position. Danmarks rammevilkår har været som typisk for udviklede lande (over det seneste årti, som helhed). Den generelle sammenhæng mellem vilkår og niveau, medfører at niveauet i Danmark har været næsten som typisk for udviklede lande. Den tætte kobling mellem rammerne og aktivitetsniveauet illustreres også af USA. USA har haft de bedste rammevilkår, alt i alt, for iværksætteri, ifølge målingerne i GEM (over det seneste årti, som helhed). Disse rammevilkår gør at niveauet i USA har været særdeles højt, et af de højeste blandt de udviklede lande.
Entreprenant arbejde i samfundet er organiseret dels som selvstændigt iværksætteri og dels på virksomhederne som medarbejdernes entreprenante arbejde. Danmark er i top i entreprenant arbejde på virksomhederne men nær bunden i selvstændigt iværksætteri, og det omvendte forhold bør undre, men det fortjener en forklaring. I bogens sidste del (Part 5) kapitel spørger vi konkluderende (Chapter 14):

14 Entrepreneurial Work by Employees in Enterprises
– studied via Global Entrepreneurship Monitor in Denmark 2011
- Hænger et samfunds selvstændige entreprenante arbejde sammen med dets entreprenante arbejde på virksomhederne?
Vores analyse af formerne for entreprenant arbejde, specielt i de nordiske, angelsaksis-ke, og de europæiske kontinentale lande, antyder at udtryksformerne nok hænger sam-men, men på komplekse måder. Kulturen i det danske samfund – og især kulturen i de danske virksomheder, hvor vi jo fandt at entreprenante medarbejdere har jobs, der ofte er særligt meningsfulde, selvstændige og tilfredsstillende – gør nok danskere med entre-prenant lyst mere tilbøjelige til at lade deres ildsjæle folde sig ud igennem entreprenant arbejde på i de forholdsvis attraktive virksomheder end igennem selvstændigt iværk-sætteri.

15Entrepreneurial Work by Employees in Enterprises– studied via Global Entrepreneurship Monitor in Denmark 2011
Opportunity – recognition and exploitation of opportunity – is the core of entrepre-neurial work. Opportunity denotes the opportunity to make something valued by oth-ers, so much that others will exchange and pay for it. Opportunities may abound, but they are more or less recognized, and are recognized by some and not by others. Recog-nized opportunities are pursued more or less, and are exploited by some more than by others.
Organizing turns the recognition of an opportunity into pursuit and exploitation of the opportunity. Recognition is the input, and exploitation is the output. The through-put is the organizing of the pursuit.
chaPter 1 introDuction: entrePreneurial work by emPloyees anD inDePenDent entrePreneurs
The organizing may be housed in an existing enterprise or may be housed in a new en-terprise, typically. Organizing may also be housed in a switch, namely either housed in an acquisition of a new business by an existing business, or housed in a spin-off of a new business from an existing business.
Recognizing opportunity
Organizing Exploiting opportunity
Existing enterprise
Recognizing opportunity
Acquisition of a new business by an
existing business
Spin-off of a new business from an existing business
New enterprise
Exploiting opportunity

16 Entrepreneurial Work by Employees in Enterprises
– studied via Global Entrepreneurship Monitor in Denmark 2011
Organizing within both existing and new enterprises includes ownership and leader-ship, and also roles in the phases of turning recognition into exploitation.
A new enterprise typically has an owner-manager who turns recognition into exploi-tation. Indeed, a new enterprise is typically a one-person business. The new enterprise is usually considered to go through three phases: the pre-start intending phase, the start-ing phase, and the post-start operating phase.
An existing enterprise is more often an enterprise of some size, with employees who are more or less involved in turning recognition into exploitation. Such an involved employee is often called an intrapreneur, especially when leading rather than merely supporting. The process from recognition to exploitation can be considered to go through two phases, the idea-phase and the implementation-phase.
The abstract and general conception of entrepreneurial work as recognition, pursuit and exploitation of opportunity thus becomes more concrete when we consider its two major social forms, as work by an independent entrepreneur to establish, own and man-age a business, and as work by an employee within an existing enterprise.
Entrepreneurial activity, more precisely, shall here consider as both- starting and owning-managing an enterprise by an independent entrepreneur, and- leading development of new activities within an existing enterprise by an employee.
Entrepreneurial work by employees shall be examined in the next part of the book, Part 2.
Conceptualization of entrepreneurial work by employees will be addressed (in Chapter 2),- How can entrepreneurial work by employees be conceptualized and defined, so that we can
Existing businessEmployee: IntrapreneurRoles: Leader or supporterPhases: Idea and implementation
New businessOwner-manager: EntrepreneurRoles: Sole-owner or co-ownerPhases: Intending, starting, operating
Recognizing opportunity
Exploiting opportunity
Acquisition
Spin-off

17Entrepreneurial Work by Employees in Enterprises– studied via Global Entrepreneurship Monitor in Denmark 2011
identify it and distinguish it from more routine work? How is entrepreneurial work by employees organized with a division of labor in time and in social space? Specifically, how is it organized in time into phases, an idea-phase and an implementation-phase? And how is it organized in social space into a hierarchy of roles as leaders and supporters?
The national volume of entrepreneurial work by employees will be ascertained in Den-mark and around the world (in Chapter 3),- What is the volume of entrepreneurial work by employees in Denmark and in other coun-
tries around the world? Is the role of being an entrepreneurial employee a stable or tran-sient role, in Denmark and in other countries around the world?
Employees’ kind of work – entrepreneurial or routine – may be explained by their back-ground (Chapter 4),- How is the background of an employee affecting the employee’s kind of work, i.e. affecting
whether the employee will become entrepreneurially working or routinely working in the work-place?
Competencies and work-qualities of employees working entrepreneurially will be com-pared across occupations (in Chapter 5),- How are entrepreneurially working employees similar to and different from other occupa-
tions - routinely working employees and independent entrepreneurs – in their competen-cies such as entrepreneurial skills, opportunity-perception, and risk-willingness, and in the qualities of their jobs, such as satisfaction in the work-place?
Job-creation through entrepreneurial work by employees and by independent entrepre-neurs will be ascertained (in Chapter 6),- What is the potential for creation of new jobs through the entrepreneurial work by employ-
ees? Furthermore, how does this potential job-creation compare to the potential job-crea-tion through independent entrepreneurship in startups and operating businesses?
Entrepreneurial work by employees in industry in Denmark is examined in Part 3.
In industry, first, entrepreneurial employees are compared to routine employees (in Chapter 7),- Are the entrepreneurial employees in industry different from the routine employees in
industry, in their background such as gender, age, education and income, in their work-qualities such as meaningfulness, autonomy, stress and satisfaction, in their entrepre-neurial competencies such as skills, opportunity-perception, risk-willingness, and in their intentions whether to starter their own business?
Then we narrow our focus even more, to those employees in industry who are entrepre-neurial (in Chapter 8),- How are entrepreneurial employees in industry different from entrepreneurial employees
in other sectors, namely in private non-industry and in the public sector? Do entrepre-neurial employees in these three sectors differ in recruitment or manner of participation

18 Entrepreneurial Work by Employees in Enterprises
– studied via Global Entrepreneurship Monitor in Denmark 2011
in entrepreneurial work? Do the entrepreneurial employees differ across the three sectors in their background such as gender, age, education and income? Do the entrepreneurial employees differ across the sectors in work-qualities, in competencies, and intentions to start their own business?
An industrial or other firm’s entrepreneurial work is not confined within the walls of the firm. Entrepreneurial work may be pursued through networks of collaboration with other enterprises, and this may affect the firm’s performance (Chapter 9),- How does a firm pursue network relations of collaboration with other enterprises, and does
networking promote the firm’s performance in terms of innovation, exporting and expec-tations for growth in the form of job-creation?
Specifically, collaboration is now increasingly pursued through public-private innova-tion partnerships (Chapter 10),- How are public and private enterprises collaboration within their sector and with the
other sector, in the pursuit of benefits such as innovation?
National independent entrepreneurship is examined in the next part of the monograph, Part 4.
The changing level of independent entrepreneurship in Denmark and other societies is considered (in Chapter 11),- Is the trend in the level of independent entrepreneurship upward, stable or downward?
How does the level in Denmark compare to the levels in other societies?
The national conditions for independent entrepreneurship are examined; we track trends in Denmark and make comparisons to other societies in the national framework of conditions for entrepreneurship (in Chapter 12),- Are cultural and institutional conditions in Denmark improving or deteriorating? How
does the framework in Denmark compare to the framework in other societies?
Having considered the national level of independent entrepreneurship and the national framework conditions, we examine their dynamics, the effects of framework conditions upon level of entrepreneurship (in Chapter 13),- How, within a nation, are the cultural conditions affecting one another? How, within a
nation, are the institutional conditions interrelated? How are the cultural and institu-tional conditions affecting independent entrepreneurship?
We come full circle in the last part, Part 5, in that we consider both employees’ entrepre-neurial work and independent entrepreneurship, in an effort to understand how they unfold as two forms of entrepreneurial work in society (in Chapter 14),- How are independent entrepreneurship and employee entrepreneurial work jointly shaped
by the culture of society and the culture of enterprises in society?

19Entrepreneurial Work by Employees in Enterprises– studied via Global Entrepreneurship Monitor in Denmark 2011
Before all these substantive questions can be addressed, the methodological question shall be considered now,- How can we investigate the entrepreneurial work by employees and independent entrepre-
neurs?
Entrepreneurship is conceptualized as an activity that is institutionalized with a sup-portive framework in society, and with a social role for performing the activity, the en-trepreneur, including the entrepreneurial employee. Research therefore focuses on the performers of the activity and the framework of conditions affecting their work.
To understand why Denmark has its level of entrepreneurial work, we compare Den-mark to other societies, that is, we compare their activities and we compare their frame-works, in order to see how the activity is shaped by its framework.
Individuals are compared to one another, and societies are compared to one another. This requires comparable data on individuals and comparable data on societies.
global entrePreneurshiP monitor surveys
Data on societies and people are gathered in the research program Global Entrepreneur-ship Monitor conducted by the Global Entrepreneurship Research Association, which maintains an informative homepage www.gemconsortium.org (GERA 2007; Reynolds et al., 2005). GEM has so far been in full operation for 13 years, 1999 through 2011, and a total of almost 90 countries or societies have participated. Denmark has participated in each of the 13 years, but most countries have participated in only some of the years.
The almost 90 participating countries or societies include 42 developed societies: Australia, Austria, Belgium, Bosnia and Herzegovina, Canada, Croatia, the Czech Re-public, Denmark, Finland, France, Germany, Greece, Hong Kong, Hungary, Iceland, Ireland, Israel, Italy, Japan, Latvia, Lithuania, Macedonia, Montenegro, the Nether-lands, New Zealand, Norway, Poland, Portugal, Puerto Rico, Romania, Russia, South Korea, Serbia, Singapore, Slovakia, Slovenia, Spain, Sweden, Switzerland, Taiwan, the United Kingdom and the United States. The survey has also been conducted in even more developing societies including: Algeria, Angola, Argentina, Azores, Barbados, Bo-livia, Brazil, Chile, China, Colombia, Costa Rica, Dominican Republic, Ecuador, Egypt, Ghana, Guatemala, India, Indonesia, Iran, Jamaica, Jordan, Kazakhstan, Malaysia, Mexico, Myanmar, Pakistan, Palestine (West Bank and Gaza), Panama, Peru, Philip-pines, Saudi Arabia, South Africa, Syria, Thailand, Tonga, Trinidad and Tobago, Tuni-sia, Turkey, Uganda, United Arab Emirates, Uruguay, Vanuatu, Venezuela, Yemen and Zambia. Results are robust with respect to a slightly different classification of developed versus developing countries, but, of course, for many other purposes a continuum is more informative, for example that mapped in the World Values Survey (Inglehart and Wenzel 2005).
The performers of entrepreneurial work are identified and investigated in a survey of the adult population. In Denmark we have in each of the 13 years from 1999 to 2011 con-ducted a national probability sample survey of the adult population, with a new sample each year, pooling them for a total of 35.140 respondents interviewed on the telephone. Weighting the respondents enhances the validity of these surveys (weights, based on gen-

20 Entrepreneurial Work by Employees in Enterprises
– studied via Global Entrepreneurship Monitor in Denmark 2011
der, age and region, are used mainly in the analyses in Chapters 11 and 13). The question-naire asks the adults about their involvement in entrepreneurship, so as to identify entre-preneurs, including entreprenurial employees, and about their values. The entrepreneurs are asked about their experiences and characteristics of their enterprises.
Similar surveys have been conducted around the world, asking the same questions everywhere, and pooled into a total of far more than one million respondents inter-viewed in the years 1999 to 2011 in the almost 90 countries or societies.
The conditions affecting entrepreneurship have been measured, in 2009 and preced-ing years, in Denmark and in the other countries participating in GEM that year. The framework conditions in a country are rated by a panel of experts usually comprising about 40 experts in the country. The panel rates several conditions, so each condition is scored. Thereby we create a time series for each framework condition in Denmark so as to track changes (Chapter 12), to understand dynamics in the country, and to offer in-dicators for policy-making. We also compare conditions in Denmark to conditions in other countries in order to estimate effects of conditions upon entrepreneurship (Chap-ter 13), and also to offer comparative indicators for policy-making. The coupling be-tween entrepreneurship and its conditions, especially policies, differs between devel-oped countries and developing countries. In a typical developed society there is a tight coupling between entrepreneurship and policy, whereas the coupling is far looser in a typical developing society (Schøtt and Jensen 2009). Therefore, it is often most inform-ative to examine the two kinds of societies separately, and to compare Denmark to the other developed societies. However, comparing widely different countries, such as Den-mark and Iran as I am currently pursuing, can yield an understanding of how entrepre-neurship is affected by national culture – traditionalism versus rationalism-secularism – and how entrepreneurship affects development.
registry Data
Independent entrepreneurship can also be investigated through data from registries. Registries are compiled by Statistics Denmark on persons, firms and people’s work in firms (Danmarks Statistik 2005). The registry data on persons cover the lives of people. The Danish registries of individuals are very rich and unique, better than registries in most other countries, so they enable original and detailed analyses of, for example, the processes leading into the entrepreneurial vocation, out of it, and switches (Erhvervs- og Boligstyrelsen, 2002). The national registries of individuals are rather idiosyncratic to each country, and have apparently not been used for individual-level comparisons among people in different nations.
The registry data on firms cover the evolution of firms. The Danish registries of firms are also better than registries in most other countries, so they allow analyses of the growth of firms in Denmark (Erhvervs- og Byggestyrelsen, 2008, 2009, 2010, 2011). The national registries of firms are rather idiosyncratic to each country, but are never-theless used for comparisons among countries (Eurostat 2005; Hoffmann et al, 2005; OECD 2008). Registry-based measures of entrepreneurial activity are fairly highly cor-related with our TEArate (Schøtt, 2005b). But, of course, the differences among coun-tries in registration reduce validity of the comparisons among countries.

21Entrepreneurial Work by Employees in Enterprises– studied via Global Entrepreneurship Monitor in Denmark 2011
Our adult population survey has some distinct advantages over registry data. First, our survey is up-to-date and provides up-to-date leading indicators on independent en-trepreneurship. Second, our survey goes beyond the behavior and investigates, for ex-ample, people’s intentions to become entrepreneurs, their motivations, and their expec-tations. Third, our survey can study entrepreneurial employees which no registry data are suited for. Fourth, our survey is conducted around the world, using the same method everywhere, so as to enable valid comparisons.
Having now reviewed our methods, we can embark on our analyses of entrepre-neurial work in society.

22 Entrepreneurial Work by Employees in Enterprises
– studied via Global Entrepreneurship Monitor in Denmark 2011
The question here is,How is entrepreneurial work by employees organized with a division of labor in time and in social space? Specifically, how is it organized in time into phases, an idea-phase and an im-plementation-phase? And how is it organized in social space into a hierarchy of roles as leaders and supporters?
Data
This chapter uses the data from our Global Entrepreneurship Monitor survey in 2011 in Denmark of the adult population, a sample of 2015 adults. The adults were asked whether they were employed. The employed adults were asked whether they had been involved in entrepreneurial work. - In the last three years, have you been involved in the development of new activities for your
main employer, such as developing or launching new goods or services, or setting up a new business unit, a new establishment or subsidiary?
Those involved in entrepreneurial work were asked whether they participated in the idea-phase and participated in the implementation-phase. - I will now mention two phases that can be identified for developing new activities. Could
you indicate for each of these phases whether you have made a contribution in the past three years?
- The first phase consists of idea development for a new activity. This includes for example active information search, brainstorming on new activities and submitting your own ide-as to management. Have you been actively involved in this phase in the past three years?
- The second phase concerns preparation and implementation of a new activity. This in-cludes for example promoting your idea, preparing a business plan, marketing the new activity or finding financial sources and acquiring a team of workers. Have you been ac-tively involved in this phase in the past three years?
If they participated in a particular phase, they were also asked if they in that phase played a leading role or a supporting role.
And could you tell me whether you had a leading or a supporting role in this phase?
Phases in entrePreneurial work by emPloyees
Most of the employees, who were involved in entrepreneurial work, participated in the idea-phase, Table 2.1. Most of the employees also participated in the implementation-phase. Indeed, most participated in both phases, while rather few participated in only one of the phases.
chaPter 2Phases anD roles in entrePreneurial work by emPloyees

23Entrepreneurial Work by Employees in Enterprises– studied via Global Entrepreneurship Monitor in Denmark 2011
table 2.1Participation in idea-phase and implementation-phase
This indicates that the division of labor between the two phases is small. Employees are not specialized in just one of the two phases, but typically participate in both phases, both developing an idea and implementing it.
roles in entrePreneurial work by emPloyees
Many of the employees, who were involved in entrepreneurial work in either phase, were playing a leading role. Indeed, about half of the involved employees played a lead-ing role in at least one of the phases, as marked in bold in Table 2.2. The other half of the involved employees were not playing any leading role, but were playing a supporting role or some other roles in both phases. The division of labor between leading role and supporting role is rather pervasive, employees are typically specialized in either a lead-ing role or in a supporting role, and less typically play both roles.
Idea-phase
Participate No participation
Total
Implementa-tion-phase
Participate 61% 4% 65%
No participation 22% 13% 35%
Total 83% 17% 100%

24 Entrepreneurial Work by Employees in Enterprises
– studied via Global Entrepreneurship Monitor in Denmark 2011
table 2.2Leading and supporting roles in idea-phase and implementation-phase
Those who perform the recognition, pursuit and exploitation of discovery are mainly those who lead the development of ideas and their implementation, and not so much those who play supportive and other roles. This bounds the occupation of intraprenurs, the performers of entrepreneurial work within existing enterprises. This boundary cor-responds to the boundary around entrepreneurs as those starting and owning-managing enterprises.
Role in idea-phase
Lead role Lead and support
role
Support role
Not parti-ci-pating in idea-phase
Total
Role in implemen-tation phase
Lead role 15% 2% 3% 1% 21%
Lead and support role
2% 10% 5% 0% 17%
Support role
1% 2% 21% 3% 27%
Not partici-pating in impl.-phase
2% 3% 16% 13% 35%
Total 21% 17% 45% 17% 100%

25Entrepreneurial Work by Employees in Enterprises– studied via Global Entrepreneurship Monitor in Denmark 2011
Conceptualization of entrepreneurial work by employees will be addressed here,- How can entrepreneurial work by employees be conceptualized and defined, so that we can
identify it, distinguish it from more ordinary work, and ascertain the volume of entrepre-neurial work by employees in Denmark and in other countries around the world?
Entrepreneurial work by employees is here conceptualized broadly as the development of new activities performed by employees for the employer. Examples are employees’ involvement in developing or launching new goods or services or setting up a new busi-ness unit, a new establishment or subsidiary. Entrepreneurial work thus encompasses far more than innovative work.
Participation in development of new activities, as extent of participation in the adult population or among employees, is indicative of the amount of such entrepreneurial work by employees. But participation includes not only leading work but also support-ive work, and our common conception of entrepreneurship emphasizes more initiative than support. So participation in entrepreneurial work is too encompassing for an ap-propriate definition. A more appropriate definition should include leadership, especially for identifying the persons recognizing, pursuing and exploiting opportunities. There-fore entrepreneurial work will be defined, more precisely, as leading development of new activities. Including a criterion of leadership is also quite consistent with defining an independent entrepreneur as an owner-manager of an enterprise.
Data
Data for this chapter is our sample of adults, the sample of 2015 adults interviewed in our GEM Adult Population Survey in Denmark in 2011, as well as the samples inter-viewed by GEM in other countries. The adults were asked whether they were employed. The employed adults were asked whether they had participated in entrepreneurial work during recent years, and, if so, whether they were presently participating in entrepre-neurial work. Participants in entrepreneurial work were asked whether they had played a leading role in the entrepreneurial work. More precisely, our questionnaire included the following.
Employees here comprise both part-time employees and full-time employees and also comprise employees who have another occupation besides being employed.
Employees were asked,- In the last three years, have you been involved in the development of new activities for your
main employer, such as developing or launching new goods or services, or setting up a new business unit, a new establishment or subsidiary?
chaPter 3 entrePreneurial work by emPloyees in Denmark anD in other countries arounD the worlD

26 Entrepreneurial Work by Employees in Enterprises
– studied via Global Entrepreneurship Monitor in Denmark 2011
Employees who had been involved in this way were then asked about current participa-tion, ... and are you currently involved in the development of such new activity?Employees who had been participating were asked about participation in the idea-phase and the implementation-phase, and their role in each phase ... and could you tell me whether you had a leading or a supporting role in this [first,
idea] phase? ... and could you tell me whether you had a leading or a supporting role in this [sec-
ond, implementation] phase?A participant can thus be considered leading if playing such a leading role.
ParticiPating anD leaDing entrePreneurial work in Denmark
Each kind of participants in entrepreneurial work can be considered as a rate in the adult population and as a rate among employees, Table 3.1.
table 3.1Participants in entrepreneurial work in last three years, leading participants in last three years, and leading participants at present
In short, 9.2% of the adults or 12.6% of the employees are currently leading entrepre-neurial work in enterprises. They are about as many as the persons who are owning-managing a starting or operating business. We can therefore reasonably say that the amount of entrepreneurial work by employees is of a volume similar to the amount of independent entrepreneurship.
Later, in Chapter 6, the potential job-creation through entrepreneurial work by employ-ees shall be compared to the potential job-creation through independent entrepreneurship.
stability anD transiency in leaDing entrePreneurial work in Denmark
Leading entrepreneurial work is typically rather informal, it is not a task that is trained for, it is not an appointment, it is not recognized as an occupation, and it is not crystal-lized as a role that persons play rather permanently. This is in contrast to, for example, the managerial role. A manager is a role that persons are typically trained and appointed to, and they usually play a managerial role stably for many years.
Percent of adults Percent of employees
Participants in last three years 33.0% 44.9%
Leading participants in last three years
15.1% 20.7%
Leading participants at present 9.2% 12.6%
N respondents 1986 adults 1456 employees

27Entrepreneurial Work by Employees in Enterprises– studied via Global Entrepreneurship Monitor in Denmark 2011
The above table shows that 20.7% of the employees had been leading participants during the last three years, but only 12.6% are also currently participating, a fraction of .6. By contrast the fraction of managers in the last three years who are also currently managing is undoubtedly far higher than .6.
That the fraction is much higher than 0 shows that there is some stability in leading entrepreneurial work in Denmark. But that the fraction is much less than 1 shows that the stability is actually rather low. Rather, we would say there is considerable transiency in the role of leading entrepreneurial work by employees in Denmark.
Denmark shall now be compared to other countries, both in amount of entrepreneurial work by employees and in stability versus transiency in leading entrepreneurial work.
entrePreneurial work in countries arounD the worlD
The volume of entrepreneurial work by employees in a country shall now be compared across countries,- What is the volume of entrepreneurial work by employees in Denmark compared to other
countries? What is the stability versus transiency in the role of leader of entrepreneurial work in Denmark compared to other countries?
Entrepreneurial work in Denmark was considered in the above. The conclusions were that the volume in Denmark seems large, rather similar to the volume of independent entrepreneurship. Stability in the role of leading entrepreneurial activity, moreover, seems substantial, but it appears that transiency is considerable. These conclusions are vague without comparisons. However, they acquire more significance when compared to entrepreneurial work in other countries.
rate of emPloyees leaDing entrePreneurial work in Denmark anD other countries
Employees leading entrepreneurial work in recent years and at present can be consid-ered as a rate in the adult population and as a rate among employees, Table 3.2.
table 3.2Leaders in entrepreneurial work in last three years, and leaders at present, in each country
Leaders in last three years
Leaders at present
Leaders in last three years
Leaders at present
Percent of employees Percent of adults
Sweden 22.2 18.4 16.2 13.5
Denmark 20.7 12.6 15.1 9.2
Belgium 13.5 12.3 9.4 8.6
Finland 13.4 11.3 9.4 8.0

28 Entrepreneurial Work by Employees in Enterprises
– studied via Global Entrepreneurship Monitor in Denmark 2011
Chile 12.9 9.9 3.5 2.6
Nigeria 12.2 12.0 3.2 3.1
Holland 11.1 7.9 7.8 5.6
United States 10.5 8.4 6.6 5.3
Ireland 10.4 8.1 5.9 4.6
Uruguay 9.8 8.3 5.2 4.4
Bosnia and Herzegovina
9.8 7.2 3.1 2.3
Slovenia 9.3 7.4 5.1 4.1
Croatia 9.0 7.5 4.4 3.7
Australia 9.0 7.3 6.2 5.0
Lithuania 8.1 5.6 4.9 3.4
United Kingdom 8.1 5.6 4.9 3.4
Hungary 7.8 5.2 3.9 2.6
Romania 7.6 5.8 3.9 3.0
Germany 7.6 5.5 4.8 3.5
France 7.5 6.1 4.7 3.9
Peru 7.3 6.1 1.4 1.2
Argentina 7.3 5.8 3.2 2.5
Switzerland 7.2 5.1 4.6 3.3
S.Korea 6.7 6.1 2.6 2.4
Slovakia 6.5 5.2 3.4 2.7
Czech Republic 6.3 5.2 3.8 3.2
Singapore 6.2 4.8 3.3 2.6
Spain 6.1 5.5 2.7 2.5
Portugal 6.0 3.9 4.0 2.6
Japan 5.7 5.2 3.4 3.1
Poland 5.7 4.7 2.8 2.3
Latvia 5.0 3.6 3.0 2.2
Thailand 4.9 4.9 1.4 1.4
Colombia 4.9 4.3 1.7 1.5
Greece 4.9 3.8 1.6 1.3
United Arab Emirates
4.9 3.7 3.6 2.7
China 4.8 4.0 2.1 1.7

29Entrepreneurial Work by Employees in Enterprises– studied via Global Entrepreneurship Monitor in Denmark 2011
Taiwan 3.9 3.9 2.0 2.0
Algeria 3.9 3.3 .8 .7
Brazil 3.1 2.6 1.0 .8
Trinidad and Tobago
2.6 2.3 1.1 1.0
Iran 2.4 2.4 .4 .4
Venezuela 2.3 2.2 .6 .6
Mexico 2.3 2.0 .9 .8
Turkey 2.1 1.8 .7 .6
South Africa 2.0 1.6 .4 .3
Barbados 1.5 1.4 .7 .7
Pakistan 1.1 .4 .2 .1
Russia 1.0 .7 .6 .4
Malaysia .9 .9 .4 .4
Jamaica .7 .5 .2 .1
Panama .3 .2 .2 .1
Table 3.2 shows that the rate of employees leading entrepreneurial work, by any and all of the four measures, is very high in Denmark compared to other countries. Only Swe-den is higher.
An explanation of differences among countries in their level of entrepreneurial work by employees will be pursued in our last chapter, Chapter 14.
stability anD transiency in leaDing entrePreneurial work in Denmark comPareD to other countries
Leading entrepreneurial work is typically rather informal, it is not a task that is trained for, it is not an appointment, it is not recognized as an occupation, and it is not crystal-lized as a role that persons play rather permanently. This is in contrast to, for example, the managerial role. A manager is a role that persons are typically trained and appointed to, and they usually play a managerial role stably for many years.
The above table shows that 20.7% of the employees in Denmark had been leading participants during the last three years, but only 12.6% are also currently participating, a fraction of .6 in Denmark. The fraction of recent leaders who are also currently par-ticipating in entrepreneurial work is calculated for each country, Table 3.3.

30 Entrepreneurial Work by Employees in Enterprises
– studied via Global Entrepreneurship Monitor in Denmark 2011
table 3.3Fraction of recent leaders who are presently doing entrepreneurial work
Fraction
Japan .9
Belgium .9
Spain .9
S.Korea .9
Finland .8
Uruguay .8
Peru .8
Croatia .8
Sweden .8
Czech Republic .8
France .8
Poland .8
United Kingdom .8
Australia .8
United States .8
Slovenia .8
Slovakia .8
Argentina .8
Ireland .8
Singapore .8
Romania .8
Chile .8
Bosnia .7
Germany .7
Netherlands .7
Switzerland .7
Lithuania .7
Hungary .7
Portugal .6
Denmark .6
Table 3.3 shows that in Denmark stability is lowest. Transiency in the role of leading entrepreneurial work is highest in Denmark.
This result is useful for considering policy and human resource management. Em-ployee entrepreneurial work could probably be enhanced by reducing transiency and creating more stability in the role of leading entrepreneurial work.

31Entrepreneurial Work by Employees in Enterprises– studied via Global Entrepreneurship Monitor in Denmark 2011
Employees differ in their kinds of work. Some employees become entrepreneurial in their work, whereas other employees become routine in their work. The question here is,• How is employees’ kind of work – entrepreneurial versus routine – affected by their condi-
tions, their background such as gender, age and education?
We know that people’s gender affects independent entrepreneurship in the way that men are much more likely than women to start a business. But are male employees more likely than female employees to work entrepreneurially, and female employees more likely than male employees to work routinely?
We know that people’s age affects independent entrepreneurship in the way that mid-aged persons (in their 30s) are more likely than younger or older persons to start a busi-ness. But are mid-aged employees more likely than younger or older employees to work entrepreneurially?
We know that people’s education affects independent entrepreneurship in that way that educated persons are more likely than less educated persons to start a business. But are educated employees more likely than less educated employees to work entrepre-neurially?
These questions are answered here.
Data
The data analyzed in this chapter are the data on the employees identified in our survey of the adult population. The sample of employees number 1290 persons who are full-time or part-time employees, and who are not self-employed, and who had answered questions about their work. An employee’s work is considered entrepreneurial if the employee during the last three years had been leading development of new activities for the employer. If not, the employee’s work is considered routine.
Employees’ gender affecting their entrepreneurial versus routine workFemale employees and male employees seem to differ in their tendency to lead entre-
preneurial work in the way that female employees seems more likely than male employ-ees to lead entrepreneurial work, Table 4.1 (the difference is marginally statistically significant; the p-value in the two-sided chi-square test is .06).
table 4.1Employees’ entrepreneurial versus routine work, dependent on gender
chaPter 4 emPloyees’ entrePreneu-rial versus routine work shaPeD by backgrounD: genDer, age, eDucation

32 Entrepreneurial Work by Employees in Enterprises
– studied via Global Entrepreneurship Monitor in Denmark 2011
That female employees are more likely than male employees to lead entrepreneurial work is quite surprising, both because female employees are less likely than male em-ployees to be appointed to positions as formal leaders, and because women are less likely than men to become independent entrepreneurs.
emPloyees’ age affecting their entrePreneurial versus routine work
Employees of different ages differ in their tendency to become leaders of entrepreneur-ial work, Table 4.2 (differences are statistically significant; the p-value in a chi-square test is .05). Mid-aged employees appear more likely than younger employees and older employees to lead entrepreneurial work.
table 4.2Employees’ entrepreneurial versus routine work, dependent on age
Female Male
Entrepreneurial work 22% 18%
Routine work 78% 82%
Total 100% 100%
N employees 655 635
That mid-aged employees are especially likely to lead entrepreneurial work is similar to independent entrepreneurship, where mid-aged persons are more likely than younger persons and older persons to start their own business.
emPloyees’ eDucation affecting their entrePreneurial versus routine work
Employees with different levels of education differ in their tendency to lead entrepre-neurial work, Table 4.3 (the differences are highly significant; the p-value in a chi-square test is less than .0001).
Highly educated employees are far more likely than less educated employees to lead entrepreneurial work.
18-34 35-49 50-64
Entrepreneurial work 16% 24% 20%
Routine work 84% 76% 80%
Total 100% 100% 100%
N employees 465 445 380

33Entrepreneurial Work by Employees in Enterprises– studied via Global Entrepreneurship Monitor in Denmark 2011
table 4.3Employees’ entrepreneurial versus routine work, dependent on education
That employees’ education increases their likelihood of leading entrepreneurial work is similar to independent entrepreneurship, where people’s education also increases their tendency to start their own business.
In short, we conclude from the above analyses that the background of employees af-fects the kind of work in the ways that female employees are more likely than male employees to work entrepreneurially, mid-aged employees are especially likely to work entrepreneurially, and highly educated employees are far more likely than less educated employees to work entrepreneurially.
Next, we turn this around, and examine how entrepreneurial employees differ from other occupations.
Pri-mary school
Gen-eral sec-
ondary school
Voca-tional sec-
ondary school
Voca-tional educa-
tion
Short higher educa-
tion
Medi-um-
length higher educa-
tion
Bach-elor
educa-tion
Long higher educa-
tion
Entrepre-neurial work
6% 10% 11% 13% 19% 33% 18% 34%
Routine work
94% 90% 89% 87% 81% 67% 82% 66%
Total 100% 100% 100% 100% 100% 100% 100% 100%
N employ-ees
110 100 79 377 101 277 55 182

34 Entrepreneurial Work by Employees in Enterprises
– studied via Global Entrepreneurship Monitor in Denmark 2011
The entrepreneurial employees are an occupational group that may be compared and contrasted to other occupations. On the one hand, the entrepreneurial employees can be compared to the independent entrepreneurs, where these two occupational groups are similar in their entrepreneurial work, and different in their employment status, one group is employees and the other group is self-employed. On the other hand, the entre-preneurial employees can be compared to the routine employees, where these two groups are similar in the employment status as employees, and different in their kind of work, one group is entrepreneurial and the other group is working routinely. The two other occupations, the routine employees and the independent entrepreneurs differ both in their employment status and in their kind of work. The entrepreneurial employ-ees thus form an occupational group in between the two other occupations.
We should therefore expect that the entrepreneurial employees have some similarities with routine employees and some similarities with independent entrepreneurs, but that these two other occupations are widely different in many things. The things we can here examine are their backgrounds, their competencies, and their work-qualities.
The questions thus are- How are entrepreneurial employees similar to and different from other occupations – rou-
tine employees and independent entrepreneurs – in their backgrounds, competencies and work-qualities?
Data The data for this chapter is the sample of adults in the three occupational groups identi-fied in our adult population survey in Denmark in 2011. Here 2015 randomly sampled adults were interviewed, including 253 entrepreneurial employees, 1033 routine em-ployees, and 224 self-employed. All were asked about their background such as age, edu-cation and income, their entrepreneurial competencies, and their work-qualities.
The three occupational groups’ backgrounds: gender, age, education, incomeThe gender composition differs among the entrepreneurial employees, the routine
employees and the independent entrepreneurs, Table 5.1 (the differences are statisti-cally significant; a chi-square test has a p-value less than .0001).
chaPter 5comPetencies anD work-qualities of entrePreneurial emPlo-yees contrasteD routine emPloyees anD inDePenDent entrePreneurs.

35Entrepreneurial Work by Employees in Enterprises– studied via Global Entrepreneurship Monitor in Denmark 2011
table 5.1Gender of independent entrepreneurs, entrepreneurial employees and routine employees
The independent entrepreneurs are men far more often than women, and the routine employees are slightly more often men than women. By contrast, however, the entrepre-neurial employees are more often women than men.
The age composition differs among the three occupational groups, Table 5.2 (the dif-ferences are statistically significant; a chi-square test has p-value less than .0001).
table 5.2Age of independent entrepreneurs, entrepreneurial employees and routine employees
The entrepreneurial employees tend to be older than the routine employees but younger than the independent entrepreneurs.
Educational level differs among the three occupational groups, Table 5.3 (the differ-ences are statistically significant; a chi-square test has p-value less than .0001).
Independent entrepreneurs
Entrepreneuri-al employees
Routine employees
Women 28% 56% 49%
Men 72% 44% 51%
Total 100% 100% 100%
N respondents 224 253 1033
Independent entrepreneurs
Entrepreneuri-al employees
Routine em-ployees
18-34 years of age 19% 28% 38%
35-49 years of age 43% 42% 33%
50-64 years of age 38% 30% 29%
Total 100% 100% 100%
Mean 45 years 42 years 40 years
N respondents 224 257 1033

36 Entrepreneurial Work by Employees in Enterprises
– studied via Global Entrepreneurship Monitor in Denmark 2011
table 5.3Education of independent entrepreneurs, entrepreneurial employees and routine em-ployees
Independent
entrepreneursEntrepreneuri-al employees
Routine employees
Long higher education 21% 24% 12%
Bachelor education 2% 4% 4%
Medium-length higher education 16% 36% 18%
Short higher education 7% 7% 8%
Vocational education 30% 19% 32%
Vocational secondary school 7% 4% 7%
General secondary school 8% 4% 9%
Primary school 9% 3% 10%
Total 100% 100% 100%
Mean level 4.8 5.7 4.5
N respondents 183 591 718
Table 5.3 shows that the entrepreneurial employees typically have a higher education. They tend to be much more educated than both the independent entrepreneurs and the routine employees.
Income level (annual house-hold income, before taxes) differs among the three oc-cupational groups, Table 5.4 (the differences are statistically significant; a chi-square test has p value less than .0001).
table 5.4Income of independent entrepreneurs, entrepreneurial employees and routine employees
Independent
entrepreneursEntrepreneuri-al employees
Routine em-ployees
High income 18% 12% 6%
Medium income 40% 55% 44%
Low income 42% 33% 50%
Total 100% 100% 100%
Mean income 630000 670000 530000
N respondents 184 228 852

37Entrepreneurial Work by Employees in Enterprises– studied via Global Entrepreneurship Monitor in Denmark 2011
Table 5.4 shows that entrepreneurial employees have incomes that are concentrated around the middle, and higher than the incomes of routine employees. The incomes of independent entrepreneurs (including starters and well-established owner-managers) are more spread, some are very high and many are low, with an average rather similar to the average of entrepreneurial employees.
Work-qualities of entrepreneurial employees
Work-qualities of entrepreneurial employees will be compared so as to answer the ques-tions,- How are entrepreneurial employees similar to and different from other occupations - rou-
tinely working employees and independent entrepreneurs – in the qualities of their jobs, such as empowerment and satisfaction in the work-place?
Empowerment in the form of psychological empowerment at work refers partly to the feeling of meaningfulness of the work and partly to the feeling of autonomy in the work (Gretchen Spreitzer). These qualities also express a realization of one-self (Maslow). These qualities of the work situation are measured by asking employees and self-em-ployed persons to what extent they agree (or disagree) with the following statements,- I can decide on my own how I go about doing my work.- The work I do is meaningful to me.We also consider the absence of stress as a quality of the work, and measure this as ex-tent of agreement with the statement,- At my work, I am not exposed to excessive stress.Furthermore, satisfaction with work and satisfaction with income are also important qualities of the work, and are measured by asking for extent of satisfaction,- Overall, how satisfied are you with your current work?- Overall, how satisfied are you with your current work income (including both salary and
non-salary income such as payment in kind and other benefits)?Each statement is rated on a scale from -2 (very dissatisfied or disagree very much) through 0 (neutral) up to 2 (very satisfied or agree very much).
For each work-quality the average of the ratings in each occupational group is listed in Table 5.5.
The people tend to consider their work to be highly meaningful, in so far as the three averages are rather close to the highest, 2. But the groups also differ in meaningfulness (the differences are statistically significant; in an anova-test the p-value is less than .0001). The entrepreneurial employees consider their work more meaningful than the routine employ-ees do, and a little less meaningful than the independent entrepreneurs consider their work.
Autonomy in work differs among the occupations in the same way (the differences are statistically significant; in an anova-test the p-value is less than .0001). The entre-preneurial employees decide more than the routine employees do, but decide less than the independent entrepreneurs do.
Stress from work differs among the three occupations (the differences are statisti-cally significant; in an anova-test the p-value is .0002). The entrepreneurial employees are more stressed than both the independent entrepreneurs and the routine employees.

38 Entrepreneurial Work by Employees in Enterprises
– studied via Global Entrepreneurship Monitor in Denmark 2011
Satisfaction with work differs among the three occupations (the differences are sta-tistically significant; in an anova-test the p-value is .0003). The entrepreneurial employ-ees are more satisfied with their work than the routine employees, but less satisfied that the independent entrepreneurs are with their work.
Satisfaction with income is rather similar among the three occupational groups (the differences are not statistically significant; in an anova-test the p-value is .41).
table 5.5Work-qualities of independent entrepreneurs, entrepreneurial employees and routine employees
Independent entrepreneurs
Entrepreneuri-al employees
Routine employees
Meaningfulness of work 1.70 1.60 1.41
Autonomy in work 1.40 1.19 .73
No stress in work .27 -.11 .25
Satisfaction with work 1.51 1.35 1.25
Satisfaction with income .62 .48 .52
In short, as expected, the entrepreneurial employees are in several ways between the routine employees and the independent entrepreneurs. Notably, the entrepreneurial employees are autonomous, meaningfully feeling and satisfied more than the routine employees and less than the independent entrepreneurs. But in stress they are not be-tween the two, but are more stressed than both other occupational groups.
Competencies of entrepreneurial employees contrasted routine employees and inde-pendent entrepreneurs
Competencies of employees working entrepreneurially will be compared so as to an-swer the question,- How are entrepreneurial employees similar to and different from other occupations - rou-
tine employees and independent entrepreneurs – in their competencies such as entrepre-neurial skills, opportunity-perception, and risk-willingness?
Entrepreneurial skillfulness is measured by asking the adults in our GEM-survey,- Do you have the knowledge, skill and experience required to start a new business? Opportunity-perception is measured by asking,- In the next six months, will there be good opportunities for starting a business in the area
where you live?
Risk-willingness is measured by asking,- Would fear of failure prevent you from starting a business?

39Entrepreneurial Work by Employees in Enterprises– studied via Global Entrepreneurship Monitor in Denmark 2011
Acquaintance with startups is measured by asking, - Do you know someone personally who started a business in the past 2 years?
For each such competency, the percentage of persons within each occupational group, who have the competency, is listed in Table 5.6 (for each such competency, the three groups differ significantly; the p-value is less than .0002).
table 5.6Competencies of independent entrepreneurs, entrepreneurial employees and routine em-ployees
Independent entrepreneurs
Entrepreneuri-al employees
Routine employees
Entrepreneurial skill 83% 40% 28%
Opportunity-perception 59% 48% 43%
Risk-willingness 75% 61% 50%
Acquaintance with startups 56% 41% 27%
Table 5.6 shows that, for each competency, the entrepreneurial employees are in be-tween the other two occupational groups. The entrepreneurial employees are skilled, perceiving opportunities, risk-willing and acquainted with startups more often than routine employees but less often than independent entrepreneurs.
entrePreneurial emPloyees’ intention to start a new business
Some entrepreneurial employees of course intend to start their own business, rather than unfolding their entrepreneurial potential for their employer in the current work place. We would expect the entrepreneurial employees to be in between the routine em-ployees and the already independent entrepreneurs.
The intention to start is measured by asking the adults in our GEM-survey,- Are you, alone or with others, expecting to start a new business, including any type of self-
employment, within the next three years?The intentions across the three occupational groups are listed in Table 5.7 (the differ-ences are statistically significant; in a chi-square test the p-value is less than .0001). The entrepreneurial employees intend to start, as expected, more often than the routine employees and less often than the independent entrepreneurs.

40 Entrepreneurial Work by Employees in Enterprises
– studied via Global Entrepreneurship Monitor in Denmark 2011
table 5.7Intentions of independent entrepreneurs, entrepreneurial employees and routine em-ployees.
Independent
entrepreneursEntrepreneuri-al employees
Routine employees
Intend to start own business 29% 8% 6%
No intention to start 71% 92% 94%
Total 100% 100% 100%
The entrepreneurial employees are actually rather similar to the routine employees in their rare intention to start a business. In most other entrepreneurial orientations, the entrepreneurial employees are around mid-way between the routine employees and the independent entrepreneurs, but not in this one respect. Thus, being an entrepreneurial employee is not a stepping stone to becoming an independent entrepreneur. Rather, it seems to be a way of life. This interpretation is quite consistent with their empower-ment and satisfaction with their work. In the work-place the entrepreneurial employees tend to have more autonomy, have more meaningful work, be more satisfied with their work, and have higher income than the routine employees, who are undoubtedly a more salient reference-group than the independent entrepreneurs.

41Entrepreneurial Work by Employees in Enterprises– studied via Global Entrepreneurship Monitor in Denmark 2011
When new business activities are developed, new jobs are often created. So when em-ployees develop new business activities for their employer in the existing enterprise, the enterprise may be expected to grow. When young independent entrepreneurs start a new business, they may expect it to become a sizeable business. An established owner-manager may also expect the company to expand, but might of course also expect it to contract, especially during crisis.
Job-creation through entrepreneurial work by employees and by independent entre-preneurs will be ascertained,- What is the potential for creation of new jobs through the entrepreneurial work by employ-
ees? Furthermore, how does this potential job-creation compare to the potential job-crea-tion by independent entrepreneurs through the start of new businesses and through the well-established businesses?
Data
Data for ascertaining the potential job-creation is our sample of persons who in our GEM Adult Population Survey in Denmark in 2011 were identified as doing entrepre-neurial work as employees, starters of new businesses, and owner-managers of operat-ing businesses. In our survey of 2015 adults we identified persons doing entrepreneuri-al work, comprising entrepreneurial employees, starters and owner-managers.
The entrepreneurial employees were asked about expected new jobs,- How many people do you expect to be working on the new activity five years after its introduction?
The starters were likewise asked about expected new jobs,- Not counting owners, how many people, including both present and future employees, will
be working for this business five years from now?
The owner-managers of operating firms were asked about current jobs,- Not counting the owners, how many people are currently working for this business?and expected jobs- Not counting owners, how many people, including both present and future employees, will
be working for this business five years from now?The owner-manager’s expectation for change in jobs in the operating business is then the difference between these two numbers.
chaPter 6 Job-creation by entrePreneurial emPloyees anD inDePenDent entrePreneurs

42 Entrepreneurial Work by Employees in Enterprises
– studied via Global Entrepreneurship Monitor in Denmark 2011
Jobs exPecteD from entrePreneurial enDeavors
The new jobs expected by the entrepreneurial employees, by the starting independent entrepreneurs, and by the operating independent entrepreneurs, are shown in Table 6.1.
Few of the entrepreneurial employees (4%) expect that five years later none will be working on the new activity they are developing. By far most entrepreneurial employees expect that many new jobs will be created by the new activity they are developing. The independent entrepreneurs starting a new business are more modest in their expecta-tions, in that several of the starters (17%) expect no change in jobs. The owner-manag-ers operating an existing business have even lower expectations, in that some (11%) expect fewer jobs, and by far most (66%) expect no change in jobs, and very few expect many more jobs.
Expectations for new job creation are thus highest among the entrepreneurial em-ployees, lower among the independent entrepreneurs starting a new business, and low-est among the owner-managers of operating businesses.
table 6.1Jobs expected by entrepreneurial employees, starting businesses, and operating businesses
Entrepreneuri-al employees
Starting new businesses
Operating businesses
100 or more new jobs expected 20% 4% 2%
10 to 99 new jobs expected 46% 24% 7%
1 to 9 new jobs expected 37% 56% 14%
No change in jobs expected 4% 17% 66%
Fewer jobs expected - - 11%
Sum 100% 100% 100%
Total new jobs expected by sample
21818 1696 822
Total new jobs expected by population
43 million 3 million 2 million
The numbers of new jobs expected by the entrepreneurial employees can be added up in the sample; they add up to 21818 new jobs expected in our sample. Likewise, the num-ber of new jobs expected by the starters can be added up in the sample; they add up to 1696 new jobs expected in our sample. Also, the number of new jobs expected by the owner-managers of operating businesses can be added up in the sample; they add up to 822 new jobs expected in our sample. Our sample is altogether 2015 interviewed adults. These 2015 adults are interviewed in the population of roughly 4 million adults, so the sample is roughly 1/2000 of the population. The total new jobs expected in the popula-tion may therefore be estimated as roughly 2000 times the new jobs expected by the

43Entrepreneurial Work by Employees in Enterprises– studied via Global Entrepreneurship Monitor in Denmark 2011
sample. These total new jobs expected by the population are listed in the bottom row of the table.
Immediately, I emphasize that this estimate of expectations is extremely crude and in some ways misleading. First, the sum across activities or businesses was actually esti-mated by summing across leading persons. But leading persons form teams as the entity in the activity creating the jobs, so a better estimate should divide each respondent’s expectation by team-size before summing. The team-size for the entrepreneurial em-ployees is unknown, so we cannot calculate that better estimate. Second, these are the highly involved persons’ personal expectations, and such expectations are more wishful thinking than realistic forecasts (among the three kinds of persons, the most realistic are probably the experienced owner-managers, and their expectations are the most modest ones). Third, the job-creation far exceeds the whole population of the country, manifold! So the estimated is quite unrealistic, if considered as a kind of collective ex-pectation. Inevitably, the expectations cannot be met.
Instead of viewing such estimates as predictions, and then discarding them as unre-alistic or even megalomaniac and therefore useless, the expectations can more informa-tively be considered as the entrepreneurs’ ambitions or aspirations.
Policy-making that aims at promoting job-creation should therefore not focus on heightening people’s ambitions, because they are already high, but should rather focus on supporting fulfillment of entrepreneurs’ ambitions, and also on handling the many inevitable disappointments when entrepreneurs cannot meet their own ambitions.
Entrepreneurial work by employees in industry in Denmark will be examined in the next part.

44 Entrepreneurial Work by Employees in Enterprises
– studied via Global Entrepreneurship Monitor in Denmark 2011
Industry in Denmark will now be the focus, as entrepreneurial work unfolds in this sector. The questions are, - Are the entrepreneurial employees in industry different from the routine employees in
industry, in their background such as gender, age, education and income, in their work-qualities such as meaningfulness, autonomy, stress and satisfaction, in their entrepre-neurial competencies such as skills, opportunity-perception, risk-willingness, and in their intentions whether to starter their own business?These questions were addressed for Danish employees in all sectors in the preceding
chapters, but now we focus on one sector, industry.
Data The data for this chapter is the sample of employees in industry in Denmark, identified in our GEM Adult Population survey of 2015 adults in Denmark in 2011. This identified a sample of 264 employees in industry, of whom 51 worked entrepreneurially and 213 worked routinely, using the distinction made earlier.
backgrounD of entrePreneurial emPloyees comPareD to routine emPloyees
The first question is whether, among the employees in industry in Denmark, the entre-preneurial employees differ from the routine employees in their background, specifi-cally in gender, age, education and income.
The gender composition of entrepreneurial employees is similar to the gender composi-tion of the routine employees, Table 7.1 (the difference is so small that it is not significant).
table 7.1Gender of employees in industry, by kind of work
chaPter 7 emPloyees in inDustry: entrePreneurial emPloyees comPareD to routine emPloyees
Entrepreneurial employees
Routine employees
Female 33% 29%
Male 67% 71%
Total 100% 100%
N employees 51 213

45Entrepreneurial Work by Employees in Enterprises– studied via Global Entrepreneurship Monitor in Denmark 2011
The age of the entrepreneurial employees is 42 years, on average, and the age of the routine employees is 41 years, on average, so they do not differ significantly.
The education differs between the entrepreneurial employees and the routine em-ployees, Table 7.2. Entrepreneurial employees tend to be more educated than the rou-tine employees (the difference is statistically significant; the p-value is .0001). The dif-ference in educational level is actually quite large.
table 7.2Education of employees in industry, by kind of work
Income, household income before taxes, also differs, Table 7.3. Entrepreneurial employ-ees tend to have much higher income than routine employees (the difference is statisti-cally significant; the p-value is .0001).
table 7.3Income of employees in industry, by kind of work
Entrepreneurial employees
Routine employees
Long higher education 32% 7%
Bachelor education 2% 2%
Medium-length higher education 24% 8%
Short higher education 8% 7%
Vocational education 22% 42%
Vocational secondary school 0% 10%
General secondary school 10% 8%
Primary school 2% 17%
Total 100% 100%
Mean level of education 5.6 3.8
N employees 50 212
Entrepreneurial employees
Routine employees
High income 25% 5%
Medium income 52% 43%
Low income 23% 52%
Total 100% 100%
Mean income 790000 530000
N employees 44 188

46 Entrepreneurial Work by Employees in Enterprises
– studied via Global Entrepreneurship Monitor in Denmark 2011
In short, in industry in Denmark, there is no significant gender difference between en-trepreneurial employees and routine employees, and no significant age difference. In education and income, however, there are large differences, the entrepreneurial employ-ees are much more educated and have much higher income than the routine employees.
work-qualities of entrePreneurial emPloyees comPareD to routine emPloyees
The next question is whether, among the employees in industry in Denmark, the entre-preneurial employees differ from the routine employees in their qualities of work. Ex-pectedly, entrepreneurial employees have better work-quality than routine employees.
Meaningfulness differs, Table 7.4 (the difference is statistically significant; p-value .01). As expected, entrepreneurial employees tend to consider their work meaningful, more than routine employees do.
Autonomy in work also seems to differ, Table 7.4 (the difference is marginally sig-nificant; p-value is .06 one-sided). As expected, entrepreneurial employees then have autonomy, more than routine employees have.
Stress, satisfaction with work, and satisfaction with income, do not differ signifi-cantly between entrepreneurial employees and routine employees, Table 7.4 (the p-val-ues exceed .15).
table 7.4Work-qualities of employees in industry, by kind of work
In short, as expected, entrepreneurial employees have more meaning and more autono-my in their work than routine employees, but stress and satisfaction does not differ by kind of work.
entrePreneurial comPetencies of entrePreneurial emPloyees anD routine emPloyees
The next question is whether, among the employees in industry in Denmark, the entre-preneurial employees differ from the routine employees in their entrepreneurial compe-tencies. Expectedly, entrepreneurially working employees would more often posses en-
Entrepreneurial employees
Routine employees
Meaningfulness of work 1.6 1.3
Autonomy in work 1.2 .9
No stress from work .2 .4
Satisfaction with work 1.4 1.3
Satisfaction with income .7 .6

47Entrepreneurial Work by Employees in Enterprises– studied via Global Entrepreneurship Monitor in Denmark 2011
trepreneurially competencies than routinely working employees. The competencies are those examined earlier.
Entrepreneurial skills differ, Table 7.5. As expected, entrepreneurial employees are far more often entrepreneurially skilled than routine employees (the difference is statis-tically significant; p-value .0005 one-sided).
Acquaintance with a start-up differs, Table 7.5. As expected, entrepreneurial employ-ees more often knows someone starting their own business (the difference is statisti-cally significant; p-value .001 one-sided).
Opportunity-perception and risk-willingness, unexpectedly, seem rather similar be-tween the two kinds of employees, Table 7.5 (the differences are so small that they are not significant; the p-values exceed .14).
table 7.5Competencies of employees in industry, by kind of work
In short, entrepreneurial employees are skilled and acquainted with a start-up more frequently than routine employees, as expected. Unexpectedly, the two kinds of employ-ees do not differ significantly in opportunity-perception and risk-willingness.
intention to start own business
Are entrepreneurial employees intending to start their own business more often than rou-tine employees? We would expect this. Among both kinds of employees, however, roughly ten percent intend to start up, Table 7.6 (the difference is so small that it is not significant).
table 7.6Employees’ intention to start their own business, by kind of work
Entrepreneurial employees
Routine employees
Entrepreneurial skills 62% 37%
Acquaintance with startup 53% 30%
Opportunity-perception 45% 40%
Risk-willingness 62% 54%
Entrepreneurial employees
Routine employees
Intention to start business 8% 11%
No intention 92% 89%
Total 100% 100%

48 Entrepreneurial Work by Employees in Enterprises
– studied via Global Entrepreneurship Monitor in Denmark 2011
In industry, in conclusion, the entrepreneurial employees are similar to the routinely working employees in many ways. Notably, and surprisingly, the gender composition is similar. Education, however, differs, in the way that entrepreneurial employees tend to be much more educated than routine-working employees. Income also differs in the way that entrepreneurial employees have much higher income than routine employees. Work-qualities differ in the way that entrepreneurial employees have jobs that are more meaningful, autonomous and satisfying. Entrepreneurial employees also have more en-trepreneurial competencies, in the way that they more often have skills for starting a business and are acquainted with a startup.

49Entrepreneurial Work by Employees in Enterprises– studied via Global Entrepreneurship Monitor in Denmark 2011
The employees – both the entrepreneurial and the routine – in industry were the focus of the preceding chapter. We now narrow our focus even more, to those employees in industry who are entrepreneurial. We ask ourselves,
How are entrepreneurial employees in industry different from entrepreneurial em-ployees in other sectors, namely in private non-industry and in the public sector? Do entrepreneurial employees in these three sectors differ in recruitment or manner of participation in entrepreneurial work? Do the entrepreneurial employees differ across the three sectors in their background such as gender, age, education and income? Do the entrepreneurial employees differ across the sectors in work-qualities, in competencies, and intentions to start their own business? Do the sectors differ in their leading entre-preneurial employees expectations for creation of jobs?
Data
Data for comparing entrepreneurial employees in industry and other sectors is the sam-ple of entrepreneurial employees identified in our GEM adult population survey of 2015 adults. We identified entrepreneurial employees, of whom some were in industry, some in private non-industry, and some in the public sector (here including the tiny non-profit sector). They were asked questions about their work as described in earlier chap-ters.
ParticiPation in entrePreneurial work by emPloyees in inDustry anD other sectors
Employees’ participation in entrepreneurial work may be more or less extensive. Many employees are working routinely and never involved in any entrepreneurial work. Many employees have participated in entrepreneurial work in recent years, but mostly as supporting it rather than leading it, and such supportive work is also considered rou-tine. Some employees have been leading entrepreneurial during recent years, and some of them are even leading entrepreneurial work at present. Those leading entrepreneur-ial work we consider to be the entrepreneurial employees.
Participation differs among the sectors, Table 8.1. Employees in industry participate more frequently than employees in private non-industry, by any of the counts. Employ-ees in industry participate less often than employees in the public sector, by any count.
chaPter 8 entrePreneurial emPloye-es: inDustry comPareD to Private non-inDustry anD to Public sector

50 Entrepreneurial Work by Employees in Enterprises
– studied via Global Entrepreneurship Monitor in Denmark 2011
table 8.1Employees’ participation in entrepreneurial work, by sector
Private non-industry
Industry Public sector
Participated in last three years 40 47 50
Leading in last three years 18 22 23
Leading at present 10 13 15
N employees 576 264 595
In short, employees in industry participate in entrepreneurial work more frequently than employees in private non-industry but less frequently than employees in the public sector.
backgrounD of entrePreneurial emPloyees in inDustry anD other sectors
Gender composition of the entrepreneurial employees differs among the three sectors, Table 8.2. The entrepreneurial employees in industry are mostly men, like in private non-industry, whereas the entrepreneurial employees in the public sector are mostly women.
table 8.2Gender of entrepreneurial employees, by sector
Private non-industry
Industry Public sector
Female 40% 33% 67%
Male 60% 67% 33%
Total 100% 100% 100%
N employees 106 51 147
Age of the entrepreneurial employees differs among the three sectors. The age of entre-preneurial employees in industry is 42 years, on average, while the age of entrepre-neurial employees in private non-industry is 40 years, on average, and the age of entre-preneurial employees in the public sector is 45 years, on average.
Education of the entrepreneurial employees differs among the three sectors (the dif-ferences are statistically significant). The education of entrepreneurial employees in industry tends to be a little higher than the education of entrepreneurial employees in

51Entrepreneurial Work by Employees in Enterprises– studied via Global Entrepreneurship Monitor in Denmark 2011
private non-industry. But the education of entrepreneurial employees in industry tends to be a little less than the education of entrepreneurial employees in the public sector.
Incomes of the entrepreneurial employees differ among the three sectors (the differ-ences are statistically significant). The incomes (annual household incomes before tax-es) of entrepreneurial employees in industry are the highest, on average, in that they tend to be higher than the incomes of entrepreneurial employees in private non-indus-try and also higher than the incomes of entrepreneurial employees in the public sector.
In short, entrepreneurial employees differ across sectors in their background. Entre-preneurial employees in industry are especially often men, and their incomes are par-ticularly high.
work-qualities of entrePreneurial emPloyees in inDustry anD other sectors
Does industry differ from the other sectors in its entrepreneurial employees’ work-qual-ities? The sectors are not significantly different in most qualities of work, Table 8.3 (the p-values exceed .12 for four of the five qualities). Autonomy in work differs signifi-cantly among the sectors (p-value .008), in the way that autonomy is high in private non-industry and low in the public sector, with industry in between.
table 8.3Work-qualities of entrepreneurial employees, by sector
comPetencies of entrePreneurial emPloyees in inDustry anD other sectors
We would expect entrepreneurial competencies to be more prevalent among entrepre-neurial employees in the private sectors than in the public sector. There are, indeed, some differences across the three sectors, Table 8.4. As expected, entrepreneurial skills differ in the way that they are more frequent in industry and private non-industry than in the public sector (p-value is .002). As also expected, acquaintance with a startup dif-fers in the way that this is more frequent in industry and private non-industry than in the public sector (p-value is .003). Neither opportunity-perception nor risk-willingness differ significantly across the sectors (p-value exceed .30), which seems surprising.
Private non-industry
Industry Public sector
Autonomy in work 1.4 1.2 1.1
Meaningfulness of work 1.5 1.6 1.7
No stress from work .0 .2 -.2
Satisfaction with work 1.4 1.4 1.3
Satisfaction with income .6 .6 .4

52 Entrepreneurial Work by Employees in Enterprises
– studied via Global Entrepreneurship Monitor in Denmark 2011
table 8.4.Competencies of entrepreneurial employees, by sector
intentions of entrePreneurial emPloyees to start their own business
We might expect entrepreneurial employees to have an intention of starting their own busi-ness, especially in the private sectors, more often than in the public sector. Indeed, the sec-tors differ, Table 8.5 (differences are statistically significant, with p-value .007), but not quite as expected. Entrepreneurial employees in industry have intentions to start their own business less often than those in private non-industry. Indeed, entrepreneurial employees in industry are like those in the public sector, only few intend to start their own business.
table 8.5Intentions among entrepreneurial employees to start own business, by sector
Private non-industry
Industry Public sector
Entrepreneurial skills 57 62 35
Acquaintance with startup 56 53 36
Opportunity-perception 57 45 49
Risk-willingness 59 62 61
Private non-industry
Industry Public sector
Intend to start own business 21% 8% 8%
No intention to start own busi-ness
79% 92% 92%
Total 100% 100% 100%
N entrepreneurial employees 99 48 145
Job-creation by entrePreneurial emPloyees in inDustry anD other sectors
Entrepreneurial employees often expect their development of new activities for their employer to lead to the creation of new jobs. We asked those currently leading entrepre-neurial work how many new jobs they expected, Table 8.6. By far most of the entrepre-neurial employees expected their work to lead to the creation of many jobs, on average roughly 100 jobs. In the sample (from about 2000 interviewed adults), their expected job creation is several thousand, so the entrepreneurial work in the whole adult popula-tion (of roughly 4 million) would expectedly be a creation of several million jobs in each sector. Some reservations about this kind of estimation were made in an earlier chapter.

53Entrepreneurial Work by Employees in Enterprises– studied via Global Entrepreneurship Monitor in Denmark 2011
Private non-industry
Industry Public sector
100 or more jobs expected 16% 26% 20%
10 to 99 jobs expected 32% 46% 56%
1 to 9 jobs expected 47% 26% 21%
No jobs expected 5% 3% 3%
Total (N employees) 100% (73) 100% (35) 100% (104)
Median jobs expected 8 25 30
Mean jobs expected 71 107 124
Total in sample 5165 3735 12918
Total in adult population 10 million 7 million 26 million
table 8.6.Job-creation
My conclusion is not that these entrepreneurial employees are unrealistic or even mega-lomaniacs. Rather, my interpretation is that the expected job-creation should be inter-preted as ambition or aspiration.
In industry, in conclusion, employees appear to participate in entrepreneurial work more frequently than employees in other private sectors, and perhaps a little less fre-quently than employees in the public sector.
In industry, the entrepreneurial employees are mostly men, like in other private sec-tors, but unlike in the public sector where most entrepreneurial employees are women.
In industry, work-qualities of the entrepreneurial employees are rather similar to the work-qualities of employees in the other private sectors and in the public sector.
In industry, some competences are higher, in the way that entrepreneurial employees more often have entrepreneurial skills and more often are acquainted with a startup, compared to entrepreneurial employees in the public sector.
In industry, the entrepreneurial employees rarely intend to start their own business, even more rarely than entrepreneurial employees in other private sectors and as rarely as entrepreneurial employees in the public sector.
In industry, the entrepreneurial employees are ambitiously expecting growth in the form of creation of many jobs, similarly to entrepreneurial employees in the other pri-vate sectors and in the public sector.

54 Entrepreneurial Work by Employees in Enterprises
– studied via Global Entrepreneurship Monitor in Denmark 2011
Thomas Schøtt and Mahdokht Sedaghat
Entrepreneurial work is not confined within the walls of the firm, but may extend to entrepreneurial work together with other enterprises.
Competitive advantage accrues to people who are able to manage a network of col-laborative networks (Shuman et al., 2009). Network relationships are important factors affecting innovation performance and productivity (Luke et al., 2004). Firm’s perfor-mance is related to their degree of centrality within their social network (Ferriani, et al., 2009). Scholars have found that firms can gain access to different resources and they can seek to achieve competitive advantage through strong collaborations. Relationships with other organizations may enable firms to create credibility, financing, build a posi-tive image, gain information and enhance their performance such as innovation, growth and export (Zhao et al., 1995).
In this chapter we ask how a firm’s performance is affected by its networking. The as-pects of performance are here innovation, exporting and growth-expectation. Specifi-cally we examine the effects of
networking on innovationnetworking on exportnetworking on growth-expectationinnovation on exportinnovation on growth-expectationexport on growth-expectation
The hypothesize effects are illustrated in Figure 9.1. The effects form a causal model, where networking is the cause, and growth-expectation is the ultimate effect, while in-novation and export are considered intervening variables.
chaPter 9 inDustrial anD other firms’ relations shaPing their innova-tion, exPort anD growth-exPectation

55Entrepreneurial Work by Employees in Enterprises– studied via Global Entrepreneurship Monitor in Denmark 2011
figure 9.1Hypothesized effects
This model will be examined here, for the businesses in Denmark, and specifically for firms in industry.
Data
We consider the universe or population of firms in Denmark in 2011. Our sample is 471 firms whose owner-managers were surveyed in the Global Entrepreneurship Monitor or a survey with the same questions that we conducted specifically for focusing on firms in industry in Denmark. Our analyses are all based on these 471 firms, but in a table or computation the number of analyzed cases may be slightly less than 471 because of oc-casional missing information. The survey asked for each firm’s relations, innovation, export and current size and expected future size.
Our variables are on networking, innovation, exporting and growth-expectation. Our analyses will also control for other characteristics of firms, namely their proprietorship (sole-proprietor or shared proprietorship), owner-team size (number of persons own-ing-managing the firm), age of the firm, and size of the firm (number of persons working for the firm).
relationshiPs arounD a firm
A firm’s relationships in this study are collaborative relationships. Collaboration is with a specific kind of organization and is about a specific activity. Such questions were asked in the sixth European Community Innovation Survey in the format “Is your firm col-laborating with ___ about ___?” so this format seems valid and reliable (Sixth, 2008). In
Networking Innovation
Exporting
Growth-‐expectation

56 Entrepreneurial Work by Employees in Enterprises
– studied via Global Entrepreneurship Monitor in Denmark 2011
our survey we asked the owner-managers of 471 firms about nine relationships. Rela-tionships around a firm are measured by asking, -Is your firm collaborating with a research institution or other know-institution about
developing new products or services? -Is your firm collaborating with other firms or organizations about developing new prod-
ucts or services? -Is your firm collaborating with customers about developing new products or services? -Is your firm collaborating with other firms or organizations about getting supplies? -Is your firm collaborating with other firms or organizations about producing goods or
services? -Is your firm collaborating with other firms or organizations about marketing or sales? -Is your firm collaborating with other firms or organizations about delivering your prod-
ucts or services? -Is your firm collaborating with other firms or organizations about training somebody
working for your firm? -Is your firm collaborating with other firms or organizations about sharing equipment or
facilities?
Firms often have such collaborative relationships. Some relations are more frequent than others, Table 9.1. Firms frequently collaborate with customers about developing new products or services, and frequently collaborate with other firms or organizations about their production or about sales. Firms rarely collaborate with others about train-ing or about sharing facilities. Firms do not often collaborate with research institutions or other knowledge-institutions about developing new products or services.
table 9.1.Firms’ relationships
Collaboration of the firm with … Number of firms Percent firms with this collabo-
ration
a research institution or other knowledge-institution about developing new products or services
471 22%
other firms or organizations about developing new products or services
468 45%
customers about developing new products or services
466 54%
other firms or organizations about getting supplies
467 47%
other firms or organizations about producing goods or services
467 51%

57Entrepreneurial Work by Employees in Enterprises– studied via Global Entrepreneurship Monitor in Denmark 2011
Relations tend to go together, they are correlated. Underlying the relations is a tendency for networking. A firm’s relations can be considered manifestations or expressions of the firm’s propensity to network. Statistically, the relations are manifest or measured indicators of an underlying latent factor, networking, which is not itself measured, but can be considered a factor in factor-modeling and structural equations modeling.
innovation of a firm
Innovation of a firm here refers to the newness of its technology, newness to customers and competitiveness. These three aspects of innovation are measured. Newness of tech-nology is measured by asking,- Have the technologies or procedures required for this product or service been available for
less than a year, or between one to five years, or longer than five years?Newness to customers is measured by asking,- Do all, some, or none of your potential customers consider this product or service new and
unfamiliar?Competitiveness is measured by asking,- Right now, are there many, few, or no other businesses offering the same products or ser-
vices to your potential customers?Firms differ in innovation, Table 9.2. In terms of newness of technology, very few firms are highly innovative, as most firms use old technology. In terms of newness to custom-ers, also many firms are low in innovation. Also, many firms have many competitors, indicating that they are low in innovation.
other firms or organizations about marketing or sales
470 33%
other firms or organizations about delivering products or services
465 43%
other firms or organizations about training somebody working for the firm
466 12%
other firms or organizations about sharing equipment or facilities
467 21%

58 Entrepreneurial Work by Employees in Enterprises
– studied via Global Entrepreneurship Monitor in Denmark 2011
table 9.2Firms’ innovation
Newness of technology
Newness to customers
Competitiveness
High innovation 4% 30% 14%
Medium innovation 6% 27% 42%
Low innovation 89% 43% 44%
Total 100% 100% 100%
Number of firms 450 453 468
These three dimensions of innovation tend to go hand in hand. The three measures are positively correlated. They are manifestations of a single underlying factor, innovation, which is thus itself not measured, but has three measured indicators. Statistically, in-novation can thus be modeled with a factor-model that can be used for structural equa-tions modeling.
growth-exPectation
Size of a firm here refers to people who are working for the business. Current size and expected future size are measured by the two questions,- Not counting the owners, how many people are currently working for this business? - Not counting owners, how many people, including both present and future employees, will
be working for this business five years from now?Firms differ in size, both at present and expectedly in the future, Table 9.3. Most firms are small at present. Most firms are also expected to be small in the future. The table indicates a tendency for firms, overall, to expand.

59Entrepreneurial Work by Employees in Enterprises– studied via Global Entrepreneurship Monitor in Denmark 2011
Size of firm Percent firms with that size at
present
Percent firms with that size expected five
years later
0 employee 30% 29%
1 – 9 employees 56% 48%
10 – 99 employees 13% 21%
100 or more employees 2% 2%
Total 100% 100%
Number of firms 462 415
table 9.3Firms’ size at present and expected five years later
The expectation for growth or change of size of a firm can be measured by the difference between future size and present size. Rather than using the count of persons, we meas-ure size on a logarithmic scale, so the growth-expectation is the logarithm of future size (adding 1 before taking the log) minus the logarithm of the present size (adding 1 before taking the logarithm).
exPorting Exporting refers to proportion of customers that live outside the country. We have one question about exporting:- What proportion of your customers normally lives outside your country?Firms differ in their exporting, Table 9.4. Half of the firms have no export, and many have very little export. Only few firms have more customers abroad than within Den-mark.
table 9.4Firm’s exporting
Proportion of customers who are abroad Percent firms with that propor-tion of customers
abroad
90 to 100 percent of customers are abroad 5%
75 to 89 percent of customers are abroad 3%
50 to 74 percent of customers are abroad 7%
25 to 49 percent of customers are abroad 6%

60 Entrepreneurial Work by Employees in Enterprises
– studied via Global Entrepreneurship Monitor in Denmark 2011
10 to 24 percent of customers are abroad 5%
1 to 9 percent of customers are abroad 24%
None of the customers are abroad 50%
Total 100%
Number of firms 469
Exporting is thus measured by a percentage. For analysis we measure export on a loga-rithmic scale, as the logarithm of the percentage (adding 1 before taking the log).
estimateD effects for all firms in Denmark.The effects among networking, innovation, exporting and growth-expectation are esti-mated for all the firms, in a structural equations model of the causal model in Figure 9.1. In Table 9.5, each effect is indicated by a coefficient, the standardized coefficient, and these are comparable to one another, so we can see which is large and which is small. The effects are listed in Table 9.5.
table 9.5Effects estimated for all firms in Denmark, both industrial and others, about 450 firms.
Effect of networking on innovation is .04
Effect of networking on exporting is .20
Effect of networking on growth-expectation is .14
Effect of innovation on exporting is .32
Effect of innovation on growth-expectation is .10
Effect of exporting on growth-expectation is .01
Networking thus seems to promote exporting much, more than it promotes growth-ex-pectation, and far more than it promotes innovation. Innovation thus seems to promote exporting much, more than innovation promotes growth-expectation. Exporting has no significant effect on growth-expectation.
These estimated effects are drawn in Figure 9.2 as arrows where the thickness of the arrow symbolizes the magnitude of the effect.

61Entrepreneurial Work by Employees in Enterprises– studied via Global Entrepreneurship Monitor in Denmark 2011
figure 9.2Estimated effects for firms in Denmark (both industrial and others)
Networking Innovation
Exporting
Growth-‐expectation
estimateD effects for the firms in inDustry
For the firms in industry in Denmark, the effects among networking, innovation, ex-porting and growth-expectation are estimated, in the structural equations model of the causal model in Figure 9.1. In Table 9.6, each effect is indicated by a coefficient, the standardized coefficient, and these are comparable to one another, so we can see which is large and which is small. The effects are listed in Table 9.6.
table 9.6Effects estimated for the firms in industry, about 300 firms.
Effect of networking on exporting is .15
Effect of networking on growth-expectation is .23
Effect of innovation on exporting is .33
Effect of innovation on growth-expectation is .20
Effect of exporting on growth-expectation seems quite insignificant
Effect of networking on innovation seems quite insignificant
Networking thus seems to promote both exporting and growth-expectation, but seems not to affect innovation. Innovation seems to promote exporting much, more than in-novation promotes growth-expectation. Exporting has no significant effect on growth-expectation.

62 Entrepreneurial Work by Employees in Enterprises
– studied via Global Entrepreneurship Monitor in Denmark 2011
These estimated effects are drawn in Figure 9.3 as arrows where the thickness of the arrow symbolizes the magnitude of the effect.
figure 9.3Estimated effects for firms in industry.
conclusions
Firms seem to benefit from their networking. Their collaborative relationships with oth-ers in their operations seem to improve their performance in terms of innovation, ex-porting and expectation for growth. Moreover, these dimensions of performance tend to reinforce one another in the way that innovation promotes export and growth-expecta-tion. These effects are fairly strong for firms in general, and specifically for firms in in-dustry.
Networking Innovation
Exporting
Growth-‐expectation
63Entrepreneurial Work by Employees in Enterprises– studied via Global Entrepreneurship Monitor in Denmark 2011
Majbritt R. Evald, Thomas Schøtt, Ann H. Clarke and Kristin B. Munksgaard
To meet the challenges of the public sector, the political agenda in the Western world is focussed on the potential of opening up the innovation process and invite private enter-prises to contribute and participate through so-called public-private innovation partner-ships (PPIP). Public-private innovation partnerships are collaborations between public and private actors who jointly develop products or services, and who share risks, costs, and benefits (Klijn and Teisman, 2003). As such, public-private innovation partner-ships can be distinguished from other public-private arrangements such as procure-ment, outsourcing, service communities or the like. The main characteristic of a public-private innovation partnership is that it focuses on developing a solution that after-wards is delivered through public sales. As highlighted by Klijn and Theisman (2003) the common denominator of innovative collaborations between public and private or-ganisations is the joint idea development and sharing of knowledge as well as risk, costs and benefits. In a public-private innovation partnership the solution is not known be-forehand and it may not be possible to outline a full task specification prior to the devel-opment as this is defined during the joint development effort. When public and private actors engage in ongoing collaborations for innovation, however, it is difficult to draw a strong line between public-private innovation partnerships and ‘ordinary’ public-pri-vate collaborations.
Public-private innovation partnerships are gaining increasing attention in the EU (Klijn and Teisman, 2003) and in Denmark (Sørensen and Torfing, 2011), due to its potential advantages. According to Klijn and Teisman, benefits of setting-up public-private innovation partnerships can take a variety of forms, for example financial/mate-rial benefits (profits, working space, and increased transport capacity), or more intangi-bly benefits (image and knowledge development). The costs of a public-private innova-tion partnership can be one-time only (preparation, adaptation of the internal organiza-tion), or recurring (organizational co-ordination, adaptation and tuning of substantive objectives). But what is important is the added value of synergy that a public-private innovation partnership creates as public and private actors bring together knowledge and competences from the public and private sector which would otherwise never have been coupled. The promise of creating unique products or services is thus massive (Fell-er et al., 2011; Fuglsang, 2008). However, public-private innovation partnerships also induce several challenges to the public and private actors involved.
One of the challenges (Munksgaard et al., forthcoming) concerns that collaborations
chaPter 10 collaborations among anD between Public anD Private actors: sPecifically Public-Private innovation collaboration

64 Entrepreneurial Work by Employees in Enterprises
– studied via Global Entrepreneurship Monitor in Denmark 2011
between public and private actors are assigned to special legislative requirements and extensive EU rules to prohibit discriminating procurement. Concretely, the EU directive 2004/18/EC of the European Parliament and the Council of March 21, 2004, was cre-ated to coordinate procedures for the award of public works contracts, public supply contracts and public service contracts (Martin et al., 1997). This public procurement directive holds a strong emphasis on transparent and competitive procedures to meet an objective of open and fair competition. When the joint development effort of a public-private innovation partnership results in public procurement this directive applies.
Moreover, the special legislative requirements and extensive EU rules also seem to impair the possibilities to build strong and trusting relationships necessary for really opening up the innovation process between public and private actors. When the public sector pursues wide dissemination of partnership results, especially private firms are faced with difficulties as they are investing resources in idea developments without get-ting any assurance to be part of the value gained when public-private innovation part-nership projects are put out to competitive tendering. The special legislative require-ments and extensive EU rules thus complicate the building of strong and trusting rela-tionships between public and private actors, and create an imbalance between the ben-efits and cost that should be shared between the public-private innovation partnership partners especially causing inconvenience for private firms.
Another challenge (Munksgaard et al., forthcoming) concerns the embedded differ-ences that exist between public and private partners in public-private innovation part-nership settings concerning the core business, values and strategies of public and pri-vate actors respectively. The differences between public and private actors result in di-vergences in their goals and objectives potentially creating tensions in their interaction (as reported in e.g. Currie et al., 2008; Schmidt, 2008). The public partner will be de-voted to a public cause whereas the private partner will be concerned with customer preferences leading to differences in the partners’ problem definitions and related diffi-culties in realizing a value adding potential. Moreover, when actors engaging in joint innovation projects seek to obtain diverse outcomes, it may further complicate the crea-tion of a business model for applying the new solution. In general public-private innova-tion partnerships have to deal with differences in values and strategies that seem irrec-oncilable – thus the mutual innovation process involves tensions on several levels as not agreeing on what to innovative is combined with tensions of handling constant con-flicts.
In the following we set out to explore different types of collaborations among and between public and private enterprises, to be able to explore how public and private in-novation collaborations are doing in comparison with other types of collaborations (e.g. public/public and private/private collaborations). We do this as we need to gain more knowledge of how public-private innovation partnerships are perceived by public and private actors. In the following we thus test how public and private actors perceive public-private innovation partnerships by creating several working hypothesis, which can be looked at as preliminary statements of expectations. The hypotheses are mainly based on theories explaining how innovation is created in the public and private sector, and when possible based on the sparse theories of public-private innovation partner-ships.

65Entrepreneurial Work by Employees in Enterprises– studied via Global Entrepreneurship Monitor in Denmark 2011
Concretely we anticipate that while public and public collaborations or private and private collaborations may be more frequently occurring compared to public-private in-novation partnerships the different collaboration types will differ according to the con-tent of collaboration (work areas), the ease of collaboration, the technology closeness, and the innovativeness of collaboration. In line with the above introduction we formu-late several working hypotheses below. However, before formulating concrete hypothe-ses, we need to sharpen our conceptualization.
hyPothesis DeveloPment baseD on the literature review
We consider collaboration as a phenomenon that may occur between an enterprise and a sector, i.e. an enterprise in a sector. The unit under consideration is thus a pair con-sisting of an enterprise and a sector. A pair may have collaboration understood as ‘col-laboration occurs or not’. Presence or absence of collaboration are outcomes in a pair. Each outcome is more or less probable.
The likelihood of one outcome versus the other outcome depends on the characteris-tics of the pair of enterprise and sector. The enterprise may be public or private, as an important characteristic of the enterprise. The sector may be public or private as an important characteristic of the sector.
In the following we examine collaboration through different hypotheses concerning the frequency of different combinations of collaboration, the content of collaboration (work areas), the ease of collaboration and the innovativeness of collaboration.
The frequency of collaboration: How frequently different combinations of collabora-tion occur?
We consider public and private enterprises that may be collaborating with public and private sectors. Some of these possible combinations of collaboration occur relatively frequently, and some combinations occur less frequently. We can think about four rela-tive frequencies or probabilities of collaboration - these are cross-classified in Table 10.1.
table 10.1Four possible collaborations
Enterprise
Public enterprise Private enterprise
Possible col-laboration
Public sector Public-Public: Probability that public enterprises collaborate with the public sector
Private-Public:Probability that private enterprises collaborate with the public sector
Private sector Public-Private:Probability that public enterprises collaborate with the private sector
Private-Private:Probability that private enterprises collaborate with the private sector

66 Entrepreneurial Work by Employees in Enterprises
– studied via Global Entrepreneurship Monitor in Denmark 2011
These four probabilities are not constrained, they may all be high and near 1, or they may all be small and near 0, or, indeed, they may all be quite different from one another. The probabilities may be higher in one society than in another society. Over time, some probabilities may change, indeed some may increase and some may decrease. We shall here consider the probabilities in present-day Denmark.
An image is that Denmark is a society in which there has been a divide between the private and the public sector historically, between private enterprises seeking profit for their owners and public enterprises serving the people (Currie et al., 2008; Schmidt, 2008). As such there seem to be a path dependency concerning which sector private and public enterprises collaborate with – typically collaborating with others within the same sector. Opposing collaborating between sectors is rare as public-private innovation part-nerships is a rather new phenomenon. We therefore hypothesize that:
Hypothesis 1. The probabilities that public enterprises collaborate within the public sector and that private enterprises collaborate within the private sector are higher than collaboration between the sectors.
Next, we consider the collaborations that exist (and thus ignore the possible cases of collaboration that do not exist). At first we examine the content of collaboration (work areas).
The content of collaboration: Does the content among the different combinations of collaborations vary?
In the following we develop hypothesis concerning the content of collaboration. The content of collaboration refers to the activity that is in the collaboration, the work area that the collaboration is related to. More precisely we set out to explore whether the con-tent varies among the different types of collaboration in relation to work areas such as 1) development of new products and services, 2) sales and delivery and 3) effectiveness.
The first content of a collaborative relationship we consider is development of new products and services.
An image is that public enterprises are not primarily concerned with developing ser-vices and products. Rather public enterprises have for years faced the challenge of meet-ing constrained budgetary demands, which leaves little room for development (Borins, 2002; Rowe et al., 2004; Kearney et al., 2008). On the contrary private enterprises have for years been faced with increasing demands of utilising new technologies or commer-cialise new products and services (Garvin and Levesque, 2006; Elfring, 2005). As such private enterprises are more encouraged to continuously develop new products and ser-vices. Moreover as public-private innovation partnerships often are engaged in the col-laboration for the purpose of innovating we also anticipate that this type of collabora-tion are engaged in developing new products and services. This image can be stated as a hypothesis:
Hypothesis 2. The probability that collaboration of public enterprises with the public sector focuses on development is lower than the other three probabilities.
The second content of a collaboration we consider is sales and delivery. An image is that collaboration across sectors is not concerned with sales and delivery, because pub-lic-private innovation partnerships often are engaged in collaboration for the purpose of innovating. Furthermore, typically sales and delivery takes place between private/pub-lic enterprises and public/private sector when a formal contract exists. Moreover it is

67Entrepreneurial Work by Employees in Enterprises– studied via Global Entrepreneurship Monitor in Denmark 2011
more common for collaboration among private enterprises to be concerned with sales and delivery, than among public enterprises, as private enterprises are profit oriented, whereas public enterprises have multiple, intangible social and political objectives (Cur-rie et al., 2008). The image can be stated as a hypothesis:
Hypothesis 3. The probability that collaboration of private enterprises with the pri-vate sector focuses on sales and delivery is higher than the other three probabilities.
A third content of collaboration is effectiveness, i.e. an enterprise may collaborate in order to be more effective. An image is that collaboration between public enterprises within the public sector often is concerned with effectiveness. Public enterprises often work together to use existing scarce resources effectively. This may also be the case for private enterprises, as private enterprises are profit oriented and therefore seek collabo-rations concerning effectiveness (Schmidt, 2008). However, this is not the same for collaboration across sectors, as public-private innovation partnerships often are engaged in collaboration for the purpose of innovating, even though innovation also includes effectiveness. This image can be stated as a hypothesis:
Hypothesis 4. The probabilities that collaboration of public enterprises with private sector and collaboration of private enterprises with the public sector focus on effective-ness are lower than the other two probabilities.
Next we consider the ease of collaboration.
The ease of collaboration: Are the different combinations of collaboration considered easy or difficult?
Ease of collaboration is another aspect of a collaboration that we examine. A collabo-rative relationship may be considered easy, whereas another collaborative relationship may be considered difficult. An image is that collaboration involving public enterprises is difficult, but that private enterprises easily collaborate with one another because both partners are focused on profit and have a history of collaboration compared to the his-tory of public enterprises collaborating with other public enterprises. Moreover as pub-lic-private innovation partnerships still is a rather new phenomenon this type of col-laboration is also considered to be relatively difficult compared to collaboration between private enterprises. This image can be stated as a hypothesis:
Hypothesis 5. The probability that private enterprises consider their collaboration with the private sector as easy is higher than the other three probabilities.
Next we consider the closeness between the technology in collaboration and the core technology in an enterprise.
The degree of technology closeness: Do the closeness of technology vary among dif-ferent types of collaborations? The collaboration of the enterprise is using a technology which is more or less tied to the core technology in the enterprise. The technology may be closely tied to the core technology in the enterprise, or it may be partly similar to the core technology, or again it may be different from the core technology in the enterprise. When closeness of technology to core technology is a matter of degree and measured on a scale, we do not consider probabilities or frequencies, but averages. For closeness be-tween the technology in collaboration and the core technology in enterprises, we con-sider four averages or means.

68 Entrepreneurial Work by Employees in Enterprises
– studied via Global Entrepreneurship Monitor in Denmark 2011
An image is that closeness between the technology in collaboration and the core tech-nology in an enterprise is low across sectors. New knowledge is exchanged across pub-lic-private innovation partnerships. Closeness between the technology and the core technology in an enterprise is higher within sectors. Existing knowledge is more often being exchanged. These images inspire formulation of the hypothesis:
Hypothesis 6. Closeness of technology tends to be higher within sectors than be-tween sectors.
Finally we consider the innovativeness in collaborations.
The degree of innovativeness: What degree of innovativeness is in combinations of col-laboration?
Innovation in collaboration is yet another aspect of collaboration we examine. Col-laboration may be highly innovative, or may be medium, or may be low in innovation, or finally may be characterized by no innovation at all. When innovativeness is a matter of degree, and measured on a scale, we do not consider probabilities or frequencies but averages.
An image is that innovation is low within the public sector and therefore that col-laboration within this sector is low in innovativeness (Sadler, 2000; Kearney et al., 2008). Innovativeness in collaboration within the private sector may also be low, be-cause private enterprises for years have been faced with increasing demands of utilising new technologies or commercialise new products and services. As such public enter-prises are more encouraged to continuously innovative. Collaboration across sectors may be higher in innovativeness because the public-private innovation partnerships in their collaboration often are engaged for the purpose of innovating. This image inspires formulation of the hypothesis:
Hypothesis 7. Innovativeness across sectors, both ways, tends to be higher than in-novativeness within each sector.
The seven hypotheses outlined in the above will now be tested. First we map out how frequently different types of partnering occur (Hypothesis 1), and if the tendency to form each type of collaborations is strong or weak. Furthermore we also sketch out what the content of the different types of partnering is (Hypothesis 2: developing new products or services, Hypothesis 3: sales and delivery, and Hypothesis 4: effectiveness) to see if the content vary among the different types of collaborations. Thereafter, we outline whether the different types of partnering is perceived as easy or difficult by pub-lic and private actors (Hypothesis 5), and if the tendencies that occur are strong or weak. Afterwards we sketch if the different combinations of collaboration are using a technology which is more or less tied to the core technology in the different collabora-tions (Hypothesis 6), and if the tendencies that occur are strong or weak. Finally, we look more closely at the degree of innovativeness that characterize the different combi-nations of collaboration, and if the tendency is strong or weak (Hypothesis 7). From this conclusions of the seven hypotheses are extracted.

69Entrepreneurial Work by Employees in Enterprises– studied via Global Entrepreneurship Monitor in Denmark 2011
methoDs
We consider collaboration of enterprises with sectors. The unit is a pair consisting of an enterprise and a sector. We consider public enterprises and private enterprises and con-sider the public sector and the private sector. So we consider four combinations or kinds of pairs: the pair consisting of a public enterprise and the public sector, the pair of a public enterprise and the private sector, the pair of a private enterprise and public sec-tor, and the pair of a private enterprise and the private sector.
A sample of each kind of pair is needed, so we need four samples. We use data from the interviews with 2015 adults in our Adult Population Survey in our Global Entrepre-neurship Monitor project, where employees were identified and then asked to report on collaboration of their enterprise with a sector. Our samples of pairs thus derive from a sample of persons. The size of the samples of different types of pairs of an enterprise and a sector is cross-classified in Table 10.2.
table 10.2Samples of pairs of enterprises and possible collaborations
Enterprise
Public enterprises
Private enterprises
Possible collaboration Public sector 253 pairs 336 pairs
Private sector 256 pairs 346 pairs
In each pair we first measure whether collaboration is present or absent. If collaboration is present, then we ask about aspects of the collaboration, notably its focus, ease, tech-nology and innovation.
analyses anD results
In the following we test each hypothesis that we formulated above.Testing Hypothesis 1: How frequently different combinations of partnering occur?
Our hypothesis about presence versus absence of collaboration is that the probability that public and private enterprises collaborate among each other within the same sector is higher than the probability of collaboration between the sectors.
Employees who were intrapreneurially active in public enterprises and private enter-prises were asked: - “In your involvement during the last three years in the development of new activities for
your employer, has the enterprise collaborated with a public organization?” Likewise, the employees were also asked - “... has the enterprise collaborated with a private enterprise?”
Their responses enable us to calculate the proportion of the private enterprises that col-

70 Entrepreneurial Work by Employees in Enterprises
– studied via Global Entrepreneurship Monitor in Denmark 2011
laborate within the private sector, and likewise calculate the relative frequency of col-laboration for each other combination. Thus the hypothesis is tested by calculating, for each of our four samples, the relative frequency or probability of collaboration. The four relative frequencies or probabilities are listed in Table 10.3.
table 10.3The frequency of collaboration in each combination
Enterprise
Public enterprise Private enterprise
Possible collaboration Public sector .67 .28
Private sector .42 .62
The probability that private enterprises collaborate with the private sector is estimated to be .62 (i.e. 62% of the private enterprises reported to be collaborating within the private sector), and the probability that public enterprises collaborate with the public sector is estimated to be .67 (i.e. 67% of the public enterprises reported to be collaborat-ing within the public sector). These .62 and .67 probabilities are much higher than the .28 probability that private enterprises collaborate with the public sector, in accordance with our hypothesis (this difference is statistically significant). These .62 and .67 prob-abilities are also much higher than the .42 probability that public enterprises collaborate with the private sector, also in accordance with out hypothesis (this difference is statis-tically significant). Summing up, our hypothesis 1 is supported.
Testing Hypothesis 2, Hypothesis 3 and Hypothesis 4: Does the content among the different combinations of collaborations vary? The hypothesis about focus on develop-ment is that the probability that collaboration of public enterprises with the public sec-tor focuses on development is lower than the other three probabilities.
Employees in enterprises who reported collaboration were also asked about that col-laboration: - “Has the collaboration with the public sector [or private sector] been about developing
something new, products or services?”
Their responses enable us to calculate the proportion of the cases of collaboration of public enterprises within the public sector which focused on development, and the pro-portion of the cases of collaboration in each other combination which focused on devel-opment. Thus the hypothesis is tested by calculating, for each of our four samples, the relative frequency or probability of collaboration being focused on development. The four probabilities are listed in Table 10.4.

71Entrepreneurial Work by Employees in Enterprises– studied via Global Entrepreneurship Monitor in Denmark 2011
table 10.4The frequency of each combination of collaboration focusing on development
Enterprise
Public enterprise Private enterprise
Collaboration Public sector .86 .76
Private sector .80 .84
The probability that cases of collaboration within the public sector focus on develop-ment is quite high, namely .86. The .86 probability is not lower than the other probabil-ities, contrary to our hypothesis. So our hypothesis 2 is not supported by the evidence. The differences are small (and not statistically significant; the p-value is .18 for the two-by-four cross-tabulation of frequencies).
Our hypothesis about focus on distribution stated that the probability that collabora-tion of private enterprises with the private sector focuses on sales and delivery is higher than the other three probabilities.Employees who reported collaboration were also asked about that collaboration: - “Has the collaboration with the public sector [or private sector] been about sales or delivery?”
Their responses enable us to calculate the proportion of the cases of collaboration of public enterprises within the public sector which focused on distribution, and the pro-portion of the cases of collaboration in each other combination which focused on distri-bution. Thus the hypothesis is tested by calculating, for each of our four samples, the relative frequency or probability of collaboration being focused on distribution. The four estimated probabilities are listed in Table 10.5.
table 10.5The frequency of each combination of collaboration focusing on sales and delivery
Enterprise
Public enterprise Private enterprise
Collaboration Public sector .25 .48
Private sector .53 .67
The probability that cases of collaboration within the private sector focus on sales and delivery is quite high, namely .67. The .67 probability is higher than the other probabil-ities. The differences among the probabilities are quite large (and are statistically sig-nificant; the p-value is .0001 for the two-by-four cross-tabulation of frequencies). Thus the evidence supports our hypothesis.

72 Entrepreneurial Work by Employees in Enterprises
– studied via Global Entrepreneurship Monitor in Denmark 2011
Our hypothesis about focus on effectiveness states that the probability that collabora-tion between sectors among public/private enterprises and private/public sector focuses on effectiveness is lower than the other two probabilities.
Employees who reported collaboration were also asked about that collaboration, - “Has the collaboration with the public sector [or private sector] been about effectiveness?”Their responses enable us to calculate the proportion of the cases of collaboration of public enterprises within the public sector which focused on effectiveness, and the pro-portion of the cases of collaboration in each other combination which focused on effec-tiveness. Thus the hypothesis is tested by calculating, for each of our four samples, the relative frequency or probability of collaboration being focused on effectiveness. The four estimated probabilities are listed in Table 10.6.
table 10.6The frequency of each combination of collaboration focusing on effectiveness
Enterprise
Public enterprise Private enterprise
Collaboration Public sector .76 .59
Private sector .69 .68
The four probabilities are fairly similar. The differences among them are so small that the differences are not statistically significant (the p-value exceeds .05 for the four-by-two cross-tabulation of frequencies). So the data do not support Hypothesis 4.
Testing Hypothesis 5: Are the different combinations of partnering considered easy or difficult? Our hypothesis about ease of collaboration stated that the probability that private enterprises consider their collaboration with the private sector as easy is higher than the other three probabilities.
Employees who reported collaboration were also asked about that collaboration: - “Has the collaboration with the public sector [or private sector] been easy?”Their responses enable us to calculate the proportion of the cases of collaboration of public enterprises within the public sector which were considered easy, and the propor-tion of the cases of collaboration in each other combination which were considered easy. Thus the hypothesis is tested by calculating, for each of our four samples, the relative frequency or probability of collaboration that were considered easy. The four estimated probabilities are listed Table 10.7.

73Entrepreneurial Work by Employees in Enterprises– studied via Global Entrepreneurship Monitor in Denmark 2011
table 10.7The frequency of each combination of collaboration perceiving collaboration as difficult or easy
Enterprise
Public enterprise Private enterprise
Collaboration Public sector .73 .66
Private sector .84 .81
The four probabilities are not all similar. There are considerable differences and they are statistically significant (the p-value is .01 in the four-by-two cross-tabulation of fre-quencies).However, our Hypothesis 5 is only partly supported as not only private enter-prises perceive collaboration within the private sector as easy also public enterprises perceive collaboration with public and private sectors as easy.
Testing Hypothesis 6: Does the closeness vary among different combinations of col-laborations? Our hypothesis about closeness between technologies stated that closeness of technology tends to be higher within sectors than between sectors.Employees who reported collaboration were also asked about that collaboration: - “To what extent is the technology of your new activity related to the core technologies of
your employer? Is it closely related, partially related or not related?”
Not related is coded 0, partially related is coded .5 and closely related is coded 1. Close-ness of technology in collaboration of public enterprises with the public sector can then be calculated as the average among the cases of this combination. Likewise, closeness of technology in each of the other combinations can be calculated as the average. The four means or averages of closeness are listed in Table 10.8.
table 10.8Mean closeness of collaboration in each combination of collaboration
Enterprise
Public enterprise Private enterprise
Collaboration Public sector .63 .61
Private sector .69 .63
Closeness of technology is similar among the four combinations. The differences are small and not statistically significant (the p-value is .58 for the one-way anova model with four groups). So the data do not support Hypothesis 6.

74 Entrepreneurial Work by Employees in Enterprises
– studied via Global Entrepreneurship Monitor in Denmark 2011
Testing Hypothesis 7: What is the innovativeness in each combination of partnering? Our hypothesis about innovativeness stated that innovativeness across sectors, both ways, tends to be higher than innovativeness within each sector.
Employees who reported collaboration were asked about innovativeness in that col-laboration in the following two questions: - “I now want to ask about the product or service that is created in this collaboration. Will
all, some, or none of the customers consider this product or service new and unfamiliar?”. Here ‘none’ is coded 0, ‘some’ is coded .5, and ‘all’ is coded 1.
- “Right now, are there many, few, or no other businesses offering the same product or ser-vice to customers?” Here ‘many business competitors’ is coded 0, ‘few business competi-tors’ is coded .5, and ‘no business competitor is coded 1.
For both questions, a reply with measure 0 indicates low innovativeness, a reply with a measure .5 indicates medium innovativeness, and a reply with a measure 1 indicates high innovativeness. Innovativeness can therefore be measured by an index that is the mean of the two measures. With this measure of innovativeness in collaboration we can calculate the average innovativeness in the cases of collaboration in each combination of enterprises and sectors. The four means or averages of innovativeness are listed in Table 10.9.
table 10.9Mean innovativeness in each combination of collaboration
Enterprise
Public enterprise Private enterprise
Collaboration Public sector .56 .48
Private sector .57 .49
Innovativeness in collaboration of public enterprises is higher than innovativeness of private enterprises (differences are statistically significant; the probability-value is .02 for the comparison among the four means in a one-way ANOVA model). So the data do not support Hypothesis 7.
summing uP
As we stated in the beginning of this chapter we have investigated a rather new phe-nomenon called public-private innovation partnerships (PPIPS) compared to innova-tion performed in more traditional partnerships such as public-public partnerships and private-private partnerships. We have done this by creating several working hypothesis. These working hypotheses have to be looked upon as preliminary statements of expecta-tions, which we hope inspire other researchers to develop tenable theories about PPIPs. As such we have been aware of the risk of developing hypothesis that ultimately fails.

75Entrepreneurial Work by Employees in Enterprises– studied via Global Entrepreneurship Monitor in Denmark 2011
Very few of the hypotheses that we argued for in the beginning of the paper based on literature about innovation created by public and private enterprises in the public or private sector and innovations taken place in collaborations across sectors (as public-private innovation partnerships) were supported. Only 2 out of 7 hypotheses are sup-ported completely.
This concerns Hypothesis 1 saying that the probability that public and private enter-prises collaborate among each other in the same sector is higher than collaboration be-tween the sectors. This is not a surprising result as public-private innovation partner-ships is a rather new phenomenon compared to collaboration among public enterprises and collaboration among private enterprises: both can be said to have a track record in collaborating among each other.
Further it concerns Hypothesis 3 saying that the probability that collaboration of private enterprises with the private sector focuses on sales and delivery is higher than the other three probabilities. This not a surprising result as the purpose with private enterprises is commercialization and thus sales and delivery of products and services. However, sales and delivery also seems to be a rather widespread activity in collabora-tions across sectors (in public-private innovation partnerships).
Concerning Hypothesis 2 and Hypothesis 4 the differences among the four different types of collaborations are too small, and therefore no statistically significant results are obtained. We therefore cannot conclude that 1) the probability that collaboration of public enterprises within the public sector focuses on development is lower than the other types of collaboration. Further, we can also not conclude that 2) the probability that collaboration between sectors among public/private enterprises and private/public sector focuses on effectiveness is lower than the other two probabilities. What is inter-esting is that all combinations of collaborations seems to be just as involved in new product and service development and just as concerned with effectiveness.
Looking at Hypothesis 5 we can only partly support the image that private enter-prises perceive collaboration among private sector as easy. There are considerable differ-ences among the different collaboration types and the differences are statistically sig-nificant also pointing out that not only private enterprises perceive collaboration among private sector as easy (what we hypothesized) also public enterprises perceive collabora-tion with public or private sector as easy. Only private enterprises look at collaboration with the public sector as difficult. The challenges concerning public-private innovation partnerships might be harder to overcome for private enterprises than for public enter-prises, as private enterprises have a shorter time horizon favoring short term economic results and market guidance.
Concerning Hypothesis 6 and Hypothesis 7 the data could not support any of the hypothesis presented. Whereas the differences are small and not statistically significant concerning closeness of technology, Hypothesis 7 presents another image than what we proposed as the results are statistically significant: the results points out that innovative-ness in collaboration of public enterprises is higher than innovativeness of private en-terprises. These findings are also interesting and typically contradictory to what the literature in general would state, which indeed gives the impression that the public sec-tor might be more agile and innovative than ever.

76 Entrepreneurial Work by Employees in Enterprises
– studied via Global Entrepreneurship Monitor in Denmark 2011
conclusion
More and more political focus is directed towards the mutual form of public-private in-novation partnerships (PPIPs), as a widespread belief about public-private innovation partnerships seems to be that they are better suited for creating welfare innovations than other types of collaborations. The potential in public-private innovation partner-ships stems from the belief that different partner’ competences and experiences in syn-ergy will increase productivity and efficiency in the public sector and create more flex-ible, user-centered services to citizens. Intersecting collaboration is thus in demand as traditional collaborations so far has not been able to come up with satisfying solutions.
The purpose of this chapter was to investigate public-private innovation partner-ships, which is a rather new phenomenon compared to more traditional partnerships such as public-public partnerships and private-private partnerships. We established a line of working hypotheses, so to speak preliminary statements of expectations, based on innovation theory about the public and private sector. Our hope is to inspire other researchers to develop tenable theories about public-private innovation partnerships, and to create ourselves a clearer picture of the phenomenon of public-private innovation partnerships. Especially our surprising results render further research.
One of the surprising results our investigation through light on is that private enter-prises look at collaboration with the public sector as difficult, whereas public enter-prises seem to perceive these types of collaborations as fairly easy. We suggest that the challenges concerning public-private innovation partnerships might be harder to over-come for private enterprises than for public enterprises, as private enterprises have a shorter time horizon favoring short term economic results and market guidance. How-ever more might be at risk for private enterprises, as the whole foundation for engaging in public-private innovation partnerships might be problematic especially for private enterprises: It is possible that the role that procurement rules play in public-private in-novation partnership projects set some important boundaries for interaction between public and private enterprises (Munksgaard et al., forthcoming). Concerning tendering the private enterprises seem to be imposed the risk associated with being declared dis-qualified, and thus risks being unable to participate in a potential subsequent procure-ment procedure, when the public-private innovation partnership project is completed. On the other hand, the on-going publication of results in publicly funded development projects means that private enterprises cannot avoid other (possibly competing) firms also becoming aware of the output arising from the public-private innovation partner-ship projects. However, how procurement rules specifically affect public-private innova-tion partnership relationships requires further research beyond the scope and focus of this chapter.

77Entrepreneurial Work by Employees in Enterprises– studied via Global Entrepreneurship Monitor in Denmark 2011
What is the level of independent entrepreneurial activity in Denmark? More specifi-cally, this chapter addresses the issues, - Is the trend in independent entrepreneurial activity upward, stable or downward? - How does the level in Denmark compare to the levels in other societies?
Independent entrepreneurial activity is not a single circumscribed activity but is often seen as an activity with a lifecycle, that unfolds in phases as rather distinct activities (Schøtt, 2006a:16-17, 56-63, 2007a:22-24, 29-31, 2008:17, 2009, 2010, 2011). We distin-guish six specialized activities:- prospecting or intending to start a new business in the foreseeable future.- starting a new business, actively, such as by looking for facilities and financing.- new business operation, paying salary or compensation, but not yet for long.- established business operation, paying salary or compensation for long.- discontinuing or closing the business.- investing in a business.The last activity, though, is not part of the lifecycle of entrepreneurship.
These activities are performed by the independent entrepreneur. The six specialized activities entails a typology of six specialized independent entrepreneurs:- prospective starter- starter- owner-manager of a new business- owner-manager of an established business- ex-owner-manager- investorThese specialized roles tend to be sequential, but may also overlap.
To investigate independent entrepreneurial activity, we identify the independent en-trepreneurs in the adult population by our GEM-survey (Chapter 1; Reynolds et al., 2005; Schøtt, 2006a:20-23; 2007a:24-28; 2008:17-19; 2009; 2010; 2011).
The prospective starters in independent entrepreneurship are those who answer Yes to the following question,- Are you, alone or with others, expecting to start a new business, including any type of self-
employment, within the next three years?The starters in independent entrepreneurship are those answering Yes to either of the following two questions,- Are you, alone or with others, currently trying to start a new business, including any self-
employment or selling any goods or services to others?- Are you, alone or with others, currently trying to start a new business or a new venture for
your employer – an effort that is part of your normal work?
chaPter 11 the changing level of inDePenDent entrePreneurshiP in Denmark anD other societies

78 Entrepreneurial Work by Employees in Enterprises
– studied via Global Entrepreneurship Monitor in Denmark 2011
A starter, furthermore, is also required to report to be actively starting and to be an owner of the startup.
The owner-managers in independent entrepreneurship are those answering Yes to the following question,- Are you, alone or with others, currently the owner of a company you help manage, self-
employed, or selling any goods or services to others?Owner-managers are also asked when salary or compensation was first paid to owners so as to distinguish between new and established businesses. The cutoff is set at 3½ years (year of the survey and three preceding years).
The ex-owner-managers in independent entrepreneurship are those answering Yes to the following question,- Have you, in the past twelve months, shut down, discontinued or quit a business you owned
and managed, any form of self-employed, or selling goods or services to anyone (not count-ing a business that was sold)?
The investors are those answering Yes to the following question,- Have you, in the past three years, personally provided funds for a new business started by
someone else (excluding any purchases of stocks or mutual funds)?A person may of course play more than one of the above six specialized roles.
Here we focus on the early phases of independent entrepreneurship. We ignore dis-continuations and investing (Schøtt, 2008).
Data
Data for measuring level of independent entrepreneurial activity in the population are from the Adult Population Survey (APS) conducted by our research-consortium Global Entrepreneurship Monitor around the world. Over the decade 2002 to 2011 we have in GEM conducted the Adult Population Survey in almost a hundred societies in one or more years. The dynamics differ between developed societies and less developed socie-ties, so we here focus on the developed societies.
Our data are from 42 developed societies, which, besides Denmark are: Australia, Austria, Belgium, Bosnia and Herzegovina, Canada, Croatia, Czech Republic, Finland, France, Germany, Greece, Hong Kong, Hungary, Iceland, Ireland, Israel, Italy, Japan, Latvia, Lithuania, Macedonia, Montenegro, Netherlands, New Zealand, Norway, Po-land, Portugal, Puerto Rico, Romania, Russia, South Korea, Serbia, Singapore, Slovakia, Slovenia, Spain, Sweden, Switzerland, Taiwan, United Kingdom and United States. These 42 developed societies are the same as those in which we in GEM have measured the framework conditions for independent entrepreneurial as reported in the next chap-ter.
Denmark’s level of inDePenDent entrePreneurial activity
The level of each independent entrepreneurial activity in Denmark in a year can be es-timated by the prevalence or rate of the so-identified independent entrepreneurs in our surveyed sample of the adult population, Table 11.1 (observations are weighted, thereby enhancing validity). An independent entrepreneur may of course be more than one

79Entrepreneurial Work by Employees in Enterprises– studied via Global Entrepreneurship Monitor in Denmark 2011
specialized kind of independent entrepreneur, and thus be included more than once in the counts, so the total rate of independent entrepreneurship of several kinds is some-what less than the sum of the rates of the above specialized kinds of independent entre-preneurship.
The rate of prospective starters was evidently at a low in during the economic crisis that began in 2008, Table 11.1. Indeed the rate of prospective starters in 2009 was down to half of the rate two years earlier, and about a third of the rate five years earlier. The rate of prospective starters increased again in 2010 and again in 2011, a considerable increase, climbing up to a level like the level before the economic crisis. This indicator of people’s intentions is a leading indicator, it is ahead of the actual event of starting new businesses, and this leading indicator entails a rather optimistic prediction. Peo-ple’s interesting in becoming independent entrepreneurs has thus regained momentum, but whether they turn their increased interest into actually starting will be seen in the next few years.
The rate of starters actively trying to start was increasing up to 2006, but evidently declined during the economic crisis that began in 2008. In 2009 the rate of starters was down to about half of the rate three years earlier. The rate started to climb again in 2010 and has increased considerably in 2011. The rate of starters may well increase within the next few years because our leading indicator, the rate of prospective starters, began a substantial increase in 2010 and increased further in 2011.
The rate of operating new businesses also declined during the economic crisis that began in 2008. In 2009 the rate of new-business owner-managers was down to two thirds of the rate two years earlier and has stayed low. This decline, which we docu-mented earlier (Schøtt, 2009), was subsequently reconfirmed by counts of registrations of new businesses (Erhvervs- og Byggestyrelsen, 2010, 2011). The rate of operating new businesses may well increase in a few years because our leading indicator, the rate of prospective starters, began a substantial increase in 2010 and even more in 2011.
An overall measure of independent entrepreneurial activity in the early phase is the so-called TEA-rate (Total Entrepreneurial Activity, albeit this is less than the totality) which is the rate of starters and new-business owner-managers (and thus a bit less than the sum of their two rates). This TEA-rate correlates highly with other measures of entrepreneurial activity, such as registrations of new businesses (Schøtt, 2005b). The TEA-rate shows that entrepreneurship in the early phase declined during the economic crisis that began in 2008. In 2009 the TEA-rate was down to two thirds of the TEA-rate two years earlier. The rate started to climb again in 2010, and increased considerably in 2011. The rate of independent entrepreneurial activity may well increase within the next few years because our leading indicator, the rate of prospective starters, began a substantial increase in 2010 and increased further in 2011.
Another measure of independent entrepreneurial activity is the upstart-rate, the rate of new-business owner-managers relative to all owner-managers, i.e. the percentage of owner-managers who are new. This rate is similar to the measure of entrepreneurial activity based on registries, namely the percentage of firms that are newly founded (Er-hvervs- og Byggestyrelsen, 2011). The upstart-rate seems to have been stable in the years up to 2008, when the crisis began, but then declined in 2009 and has since remained much lower than before the crisis.

80 Entrepreneurial Work by Employees in Enterprises
– studied via Global Entrepreneurship Monitor in Denmark 2011
In conclusion, by any of our several measures, the level of commercial entrepreneur-ial activity in Denmark declined during the economic crisis 2008-2009 and the level in 2010 is less than the level was just a few years before. However, the leading indicator of interest in pursuing entrepreneurial activity, the rate of prospective starters, increased substantially in 2010 and increased further in 2011, and predicts, albeit with much un-certainty, an increase in rates of starting new businesses in the next few years.
table 11.1Rates of independent entrepreneurship in Denmark. Annually 2002 to 2011.
2002 2003 2004 2005 2006 2007 2008 2009 2010 2011
Prospective starters
Percent of adults 9.0% 7.3% 9.9% 9.0% 8.2% 7.7% 7.4% 3.8% 7.5% 8.9%
Starters Percent of adults 3.6% 3.0% 2.5% 2.4% 2.9% 2.3% 2.3% 1.6% 1.8% 3.1%
New-busi-ness owner-managers
Percent of adults 3.1% 3.3% 2.8% 2.4% 2.8% 3.1% 2.3% 2.0% 2.2% 1.6%
Starters and new-business owner-managers
Percent of adults (TEA) 6.5% 5.9% 5.3% 4.8% 5.3% 5.4% 4.4% 3.6% 3.8% 4.6%
New-busi-ness owner-managers
Percent of own-er-mgrs
36% 37% 36% 34% 34% 34% 34% 30% 28% 25%
national level of inDePenDent entrePreneurshiP in DeveloPeD societies
Has independent entrepreneurial activity in other developed countries also declined since 2008? For this we consider the change in the rate of starters and new-business owner-managers (the commonly used TEA rate) in the various developed countries, Table 11.2 (showing the percentage change from the mean of TEA in 2006 and 2007 to mean of TEA in 2009, 2010 and 2011).
The largest declines since 2008 in independent entrepreneurial activity have oc-curred in Hong Kong, Serbia, Portugal, Spain, Italy and Denmark. Conversely, there have actually been considerable increases in independent entrepreneurial activity in many other developed countries, despite the economic crisis. Evidently, the economic crisis in 2008 hit especially hard in Denmark. This decline in activity in Denmark was also felt by those who started or operated business around 2009, when we in 2009 asked them about their perceptions. Danish entrepreneurs reported in 2009 that the global economic crisis had made it harder to start, worsened business opportunities and re-duced their growth-expectations. The Danish entrepreneurs experienced such hard-ships more often than entrepreneurs in other developed countries (Schøtt et al, 2010).

81Entrepreneurial Work by Employees in Enterprises– studied via Global Entrepreneurship Monitor in Denmark 2011
table 11.2Percentage change in rate of starters and new-business owner-managers (TEA) from 2006-07 to 2009-11.
Countries with largest decline and countries with largest increase.
2002 2003 2004 2005 2006 2007 2008 2009 2010 2011
Prospective starters
Percent of adults 9.0% 7.3% 9.9% 9.0% 8.2% 7.7% 7.4% 3.8% 7.5% 8.9%
Starters Percent of adults 3.6% 3.0% 2.5% 2.4% 2.9% 2.3% 2.3% 1.6% 1.8% 3.1%
New-busi-ness owner-managers
Percent of adults 3.1% 3.3% 2.8% 2.4% 2.8% 3.1% 2.3% 2.0% 2.2% 1.6%
Starters and new-business owner-managers
Percent of adults (TEA) 6.5% 5.9% 5.3% 4.8% 5.3% 5.4% 4.4% 3.6% 3.8% 4.6%
New-busi-ness owner-managers
Percent of own-er-mgrs
36% 37% 36% 34% 34% 34% 34% 30% 28% 25%
Hong Kong -63%
Serbia -43%
Portugal -32%
Spain -32%
Italy -28%
Denmark -25%
Australia -23%
Croatia -23%
Ireland -10%
USA -5%
Finland -4%
Slovenia -3%
Czech Republic -3%
Norway -1%
Switzerland 3%
Where does this bring Denmark in comparison to other developed countries in the level of independent entrepreneurial activity? The commonly used measure for comparisons is the TEA-rate, Table 11.3 (2002-2011, heavily weighted toward 2011). Independent entrepreneurial activity in Denmark is at a level that is a third of the level in New Zea-land and half of the level in USA, and only slightly above the lowest countries such as Japan, Belgium and Austria. Indeed, Denmark is far below the middle among the devel-oped countries, with only 22% of the other developed countries below Denmark. On every other measure of independent entrepreneurial activity, Denmark is also well be-low the middle. Denmark was hovering somewhere around the middle among the devel-oped countries for several years before the economic crisis hit in 2008, but since 2008 Denmark has dropped far below the middle (Hancock et al, 2001, 2002, 2003, 2004; Schøtt, 2006a, 2007, 2008, 2009, 2010, 2011 ; Warhuus 2000).
Israel 8%
Japan 8%
Greece 9%
Russia 10%
Germany 10%
United Kingdom 15%
Hungary 17%
Singapore 36%
France 40%
Sweden 41%
Netherlands 42%
Belgium 46%
Romania 59%
Latvia 94%

82 Entrepreneurial Work by Employees in Enterprises
– studied via Global Entrepreneurship Monitor in Denmark 2011
table 11.3Rates of entrepreneurship in developed societies.Countries with highest rates, countries with lowest rates, USA and Denmark. 2002-2011, weighted toward 2011.
Prospective starters
Starters New-business owner-
managers
Starters and new-business owner-manag-
ers (TEA)
New-business owner-
managers
Percent of adults
Percent of adults
Percent of adults
Percent of adults
Percent of owner-
managers
41% Montenegro
12% Montenegro
8% New Zealand
15% New Zealand
48% Russia
36% Macedonia
9% Slovakia
5% Slovakia
15% Montenegro
45% Singapore
31% Serbia
9% New Zealand
5% South Korea
14% Slovakia
44% Lithuania
28% Taiwan
8% Iceland
5% Macedonia
11% Iceland
44% New Zealand
… … … …
13% USA 7% USA 4% USA 10% USA 37% USA
… … … … …
8% Denmark17 percentile
2% Denmark41 percentile
2% Denmark29 percentile
5% Denmark22 percentile
31% Denmark39 percentile
… … … … …
7% Austria
2% Austria
2% Puerto Rico
4% Belgium
24% Finland
7% Netherlands
2% Russia
2% Austria
4% Austria
23% Austria
5% Russia 2% Japan 1% Belgium 4% Japan 20% Greece
5% Japan
2% Puerto Rico
1% France
3% Puerto Rico
19% Japan

83Entrepreneurial Work by Employees in Enterprises– studied via Global Entrepreneurship Monitor in Denmark 2011
The gloomy rates are consistent with the official report Iværksætterindeks 2011 (Erh-vervs- og Byggestyrelsen, 2011). However, the official report is based mainly on trends in the past in numbers of registrations of businesses, and is thus most similar to our rates of new-business owner-managers as percent of owner-managers, and both their counts of registrations and our survey counting new-business owner-managers as a population rate or as a rate of owner-managers are showing a decline in recent years.
The past trends shown in the official report thus reconfirm the trends that were al-ready revealed and documented by our GEM-surveys in recent years (Schøtt, 2006a, 2007, 2008, 2009, 2010, 2011). But, going beyond the counts based on historical regis-tries, our ongoing GEM survey offer a leading indicator – the prospective starters – which can better reveal current changes, and this entails a more optimistic prediction.

84 Entrepreneurial Work by Employees in Enterprises
– studied via Global Entrepreneurship Monitor in Denmark 2011
How are the national conditions for independent entrepreneurship in Denmark? More specifically, this chapter answers the questions, - Are cultural and institutional conditions in Denmark improving or deteriorating, or are
they stable during the economic recession? - How does the framework in Denmark compare to the framework in other societies?Entrepreneurship does not exist in a vacuum. Entrepreneurship is an activity that is organized in society and is shaped by conditions prevailing in the society. Entrepre-neurial activity in society flourishes under some conditions and vanishes under other conditions (Morrison 2000; Shane 1992, 1993). The conditions in society shaping inde-pendent entrepreneurship are denoted the framework conditions in the society. The framework conditions are subject to intervention by the authorities in society, indeed, in recent decades they have become a focus for policy-making (Schøtt and Jensen 2008). Some framework conditions are in the culture of society, notably in its values and knowledge. Other framework conditions are in the social institutions of society, notably in its supportive arrangements, mobilization and allocation of resources, and regulation of the market.
The framework conditions in society are numerous and only partly discerned, and their effects are even less known. Here we examine 14 framework conditions in society, namely 4 cultural conditions and 10 institutional conditions, Figure 12.1
chaPter 12 national conDitions for inDePenDent entrePreneurshiP: trenDs in Denmark anD comParisons with other societies

85Entrepreneurial Work by Employees in Enterprises– studied via Global Entrepreneurship Monitor in Denmark 2011
figure 12.1Framework of culture and institutions in society.
CULTURE
Education in entrepreneurship during schooling
Skills in entrepreneurship in the population
Individualism as a value in culture
Esteem of vocation as independent entrepreneur
INDEPENDENT ENTREPRENEURSHIP
INSTITUTIONS
Financial resources for entrepreneurship
Government policies for entrepreneurship
Public programs for entrepreneurship
Technology transfer to entrepreneurship
Commercial and legal infrastructure
Internal market openness to new firms
Physical infrastructure for new firms
Intellectual property rights
Support for growth-‐entrepreneurship
Opportunities for business
Data: the national exPert survey in global entrePreneurshiP monitor
These framework conditions are measured in each country participating in the research-consortium Global Entrepreneurship Monitor. In GEM we conduct the National Expert Survey in each country in almost every year. A national panel of experts on commercial entrepreneurship in the country is surveyed and assesses each condition on a scale from a low of 1 to a high of 5 (Chapter 2; Schøtt, 2006a:20-21, 64-95; 2007:33-49; 2008:21-32;

86 Entrepreneurial Work by Employees in Enterprises
– studied via Global Entrepreneurship Monitor in Denmark 2011
2009; 2010; 2011). Almost annual assessments of conditions in Denmark and other countries enable us to track changes over time in Denmark and to compare Denmark to other countries (the framework conditions in Denmark were measured annually in the years up to 2009, but were not measured in 2010 and 2011). The measures of frame-work conditions, in so far as they affect future independent entrepreneurship, are actu-ally leading indicators of independent entrepreneurial activity.
Over the decade 2002 to 2011 we have in GEM conducted the National Expert Sur-vey in almost a hundred societies in one or more years. The dynamics differ between developed societies and less developed societies, so we here focus on the developed soci-eties. Our data are from 42 developed societies, which, besides Denmark are: Australia, Austria, Belgium, Bosnia and Herzegovina, Canada, Croatia, Czech Republic, Finland, France, Germany, Greece, Hong Kong, Hungary, Iceland, Ireland, Israel, Italy, Japan, Latvia, Lithuania, Macedonia, Montenegro, Netherlands, New Zealand, Norway, Po-land, Portugal, Puerto Rico, Romania, Russia, South Korea, Serbia, Singapore, Slovakia, Slovenia, Spain, Sweden, Switzerland, Taiwan, United Kingdom and United States. These 42 developed societies are the same as those in which we in GEM have measured the level of independent entrepreneurial as reported in the preceding chapter.
In this chapter, we examine each condition, track its changes in Denmark and com-pare Denmark to other developed countries, and then, in the next chapter, we shall es-timate effects of the conditions upon independent entrepreneurial activity.
eDucation for inDePenDent entrePreneurshiP as a cultural framework conDition
Education here refers to the formal instruction, all the way up through higher educa-tion, which provides knowledge and skills for performing the role of independent entre-preneur (Schøtt 2006a:68; 2007a:35; 2008:29; 2009; 2010; 2011). This kind of educa-tion for independent entrepreneurship in Denmark is assessed almost annually by ask-ing a panel of experts to ascertain truthfulness of each of the following statements,- In Denmark, teaching in primary and secondary education encourages creativity, self-sufficiency, and personal initiative.- In Denmark, teaching in primary and secondary education provides adequate instruction in market economic principles.- In Denmark, teaching in primary and secondary education provides adequate attention to entrepreneurship and new firm creation.- In Denmark, colleges and universities provide good and adequate preparation for starting up and growing new firms.- In Denmark, the level of business and management education provide good and adequate preparation for starting up and growing new firms. - In Denmark, the vocational, professional, and continuing education systems provide good
and adequate preparation for starting up and growing new firms.Each expert ascertains truthfulness of each statement in terms of ’Completely false’, ’Somewhat false’, ’Neither true nor false’, ’Somewhat true’ and ’Completely true’. The assessment is quantified on a scale from 1 to 5. The assessments are then averaged across the experts and averaged across the six statements for a measure for the year.

87Entrepreneurial Work by Employees in Enterprises– studied via Global Entrepreneurship Monitor in Denmark 2011
With measurement taken in recent years we can track recent changes in the extent of education for entrepreneurship.
The extent of entrepreneurial education in Denmark has changed, Table 12.1. The conveyance of entrepreneurial knowledge and skills has tended to increase over the years (for specific educational initiatives, see Erhvervs- og Byggestyrelsen 2008: 69-71).
table 12.1Education for entrepreneurship in Denmark. Annually from 2002 to 2009.
2002 2003 2004 2005 2006 2007 2008 2009
2.3 2.2 2.3 2.3 2.4 2.5 2.4 2.9
Where does this entrepreneurial education bring Denmark in comparison to other countries? The entrepreneurial content in education is likewise assessed in the other countries participating in GEM. In the years from 2002 to 2011, the framework condi-tions have been assessed in 41 other developed countries listed in Chapter 1. A sum-mary measure that reduces year-to-year fluctuations as well as emphasizes the most re-cent time is a weighted average, weighing the second year (2003) of measurement twice as much as the first year (2002), the third year (2004) three times as much as the first year, and so on up to the most recent year (2011), that is weighted ten times as much as the first year. This weighted average is used for comparing the framework conditions among the developed countries, Table 12.2 (and similar tables in the rest of this chap-ter).
Entrepreneurial education is more extensive in several developed countries, notably Singapore, Switzerland, Taiwan and Latvia. Among the developed countries, Denmark is a little below the middle, 54% of the other developed countries are above and 46% of the others are below.
table 12.2Education for entrepreneurship. The countries with most education, the countries with least, and Denmark. 2002-1011, weighted toward 2011.
Singapore 2.9
Switzerland 2.8
Taiwan 2.8
Latvia 2.8
…
Denmark 2.5 46 percentile rank

88 Entrepreneurial Work by Employees in Enterprises
– studied via Global Entrepreneurship Monitor in Denmark 2011
In short, although the entrepreneurial content in education in Denmark has been ex-panding considerably, it is still less than typical for the developed countries.
skills for the entrePreneurial vocation as a cultural framework conDition
Skills refer to the skills of the entrepreneurial vocation, which prevail in the population, and encompass techniques for starting and organizing a firm, understanding markets and managing growth (Schøtt, 2006a:70, 2007a:36, 2008:30, 2009, 2010, 2011; Schøtt and Ottósson 2009). Skills are acquired not only through formal education, but also through experience, training and networking (Bager and Nielsen, 2009; Schøtt 2006b, 2007e, 2008a, 2008b, 2009, 2010, 2011; Schøtt and Christensen 2005; Schøtt and Klyver 2006). Moreover, skills are transferred from existing firms when entrepreneurs move to start new firms (Schøtt 2005d, Schøtt and Jensen 2007). The skills of the population in Denmark are assessed by asking a panel of experts to ascertain truthfulness of each of the following statements,- In Denmark, many people know how to start and manage a high-growth business.- In Denmark, many people know how to start and manage a small business.- In Denmark, many people have experience in starting a new business.- In Denmark, many people can react quickly to good opportunities for a new business.- In Denmark, many people have the ability to organize the resources required for a new
business.Each expert ascertains truthfulness of each statement in terms of ’Completely false’, ’Some-what false’, ’Neither true nor false’, ’Somewhat true’ and ’Completely true’. The assessment is quantified on a scale from 1 to 5. The assessments are then averaged across the experts and averaged across the five statements for a measure for the year. With measurement taken in recent years, we can track recent changes in entrepreneurial skills in the population.
The skills in the population in Denmark have changed, Table 12.3. The skills have tended to increase steadily and considerably over time.
table 12.3Skills for the entrepreneurial vocation in Denmark. Annually from 2002 to 2009.
…
Bosnia 2.2
Spain 2.2
Greece 2.2
Japan 1.9
2002 2003 2004 2005 2006 2007 2008 2009
2.0 2.2 2.3 2.6 2.6 2.8 2.7 2.9

89Entrepreneurial Work by Employees in Enterprises– studied via Global Entrepreneurship Monitor in Denmark 2011
Where does this level of skills bring Denmark in comparison to other countries? Skills are assessed likewise in other countries. Skills are more extensive in many societies, notably in Iceland, Hong Kong, Israel and Taiwan, Table 12.4. Among the developed countries, Den-mark is well above the middle, with 27% of the others above and 73% of the others below.
table 12.4Skills for the entrepreneurial vocation. The countries with most skills, the countries with least, and Denmark. 2002-2011, weighted toward 2011.
Iceland 3.6
Hong Kong 3.4
Israel 3.1
Taiwan 3.0
…
Denmark 2.6 73 percentile rank
…
Sweden 2.0
France 1.8
Japan 1.6
In short, entrepreneurial skills have increased in the population in Denmark, and they are now above the typical for the developed countries.
inDiviDualism as a value in culture
Values refer to what is appreciated in society, what is considered good (Schøtt, 2006a:64, 2007a:33, 2008:28, 2009, 2010, 2011). Our culture of modernity values the individual as an actor that is not only capable of taking action, and acting alone, by own effort, but also taking responsibility for acting alone and finding ways to act and to gain by acting (Weber, 1930; Inglehart and Welzel 2005). Modernity thus has a value that we briefly can call individualism, in contrast to collectivism, valuing the collectivity and the collec-tive good (Mueller and Thomas 2000; Nakata and Sivakumar 1996; Thomas and Muel-ler 2000; Tiessen 1997). Denmark is in many ways a highly modern society but is actu-ally also rather collectively oriented.
The value attached to individualism in Denmark is assessed annually by asking a panel of experts to ascertain truthfulness of each of the following statements,- In Denmark, the national culture is highly supportive of individual success achieved through own personal efforts.- In Denmark, the national culture emphasizes self-sufficiency, autonomy, and personal
initiative.

90 Entrepreneurial Work by Employees in Enterprises
– studied via Global Entrepreneurship Monitor in Denmark 2011
- In Denmark, the national culture encourages entrepreneurial risk-taking.- In Denmark, the national culture encourages creativity and innovativeness.- In Denmark, the national culture emphasizes the responsibility that the individual
(rather than the collective) has in managing his or her own life.Each expert ascertains truthfulness of each statement in terms of ’Completely false’, ’Somewhat false’, ’Neither true nor false’, ’Somewhat true’ and ’Completely true’. The assessment is quantified on a scale from 1 to 5. The assessments are then averaged across the experts and averaged across the five statements for a measure for the year. With measurement taken in recent years, we can track recent changes in the value at-tached to individualism.
The value attached to individualism in Denmark has changed, Table 12.5. Individu-alism has tended to become more highly valued over time.
table 12.5Cultural value of individualism in Denmark. Annually from 2002 to 2009.
2002 2003 2004 2005 2006 2007 2008 2009
2.0 2.4 2.4 2.5 2.6 2.9 2.7 3.0
How does the value attached to individualism in Denmark compare to its value in other countries? Individualism is assessed likewise in other countries. Several societies are highly individualistic, notably USA, Israel, Hong Kong and Iceland, Table 11.6. Among the developed countries, Denmark is a little above the middle, 41% of the others are more individualistic, and 59% of the others are less individualistic.
table 12.6Cultural value of individualism. The countries with most individualistic values, the countries with least individualistic values, and Denmark. 2002-2011, weighted toward 2011.
USA 4.1
Israel 4.0
Hong Kong 4.0
Iceland 4.0
…
Denmark 2.7 59 percentile rank
…
Bosnia 2.2

91Entrepreneurial Work by Employees in Enterprises– studied via Global Entrepreneurship Monitor in Denmark 2011
In short, there has been a considerable increase in the cultural value attached to indi-vidualism in Denmark over time. Denmark has become more individualistic than is typical among the developed countries.
cultural esteem of the vocation as inDePenDent entrePreneur
Esteem refers to the cultural prestige of the vocation or role of the independent entre-preneur among the vocations in society, as this prestige motivates people to pursue this vocation rather than other occupations (Schøtt, 2006a:66, 2007a:34, 2008:28-29, 2009, 2010, 2011). Esteem of the entrepreneurial vocation in Denmark is assessed by asking a panel of experts to ascertain truthfulness of each of the following statements,- In Denmark, the creation of new ventures is considered an appropriate way to become
rich.- In Denmark, most people consider becoming an entrepreneur as a desirable career choice.- In Denmark, successful entrepreneurs have a high level of status and respect.- In Denmark, you will often see stories in the public media about successful entrepreneurs. - In Denmark, most people think of entrepreneurs as competent, resourceful individuals.Each expert ascertains truthfulness of each statement in terms of ’Completely false’, ’Somewhat false’, ’Neither true nor false’, ’Somewhat true’ and ’Completely true’. The assessment is quantified on a scale from 1 to 5. The assessments are then averaged across the experts and averaged across the five statements for a measure for the year. With measurement taken in recent years, we can track changes in the cultural esteem of the entrepreneurial vocation.
The esteem of the entrepreneurial vocation in Denmark has been changing, Table 12.7. The esteem has increased considerably over time.
table 12.7Esteem in Denmark. Annually from 2002 to 2009.
Slovenia 2.2
Japan 2.2
Portugal 2.0
2002 2003 2004 2005 2006 2007 2008 2009
2.9 2.9 3.1 3.2 3.4 3.5 3.4 3.6
Where does this esteem bring Denmark in comparison to other countries? Esteem is assessed similarly in the other countries participating in GEM. Esteem of the entrepre-neurial vocation is much higher in several other developed societies, notably in Israel, USA, Taiwan and Hong Kong, Table 11.8. Among the developed countries, Denmark is at the middle, 49% of the others are above and 51% of the others are below.

92 Entrepreneurial Work by Employees in Enterprises
– studied via Global Entrepreneurship Monitor in Denmark 2011
table 12.8Esteem accorded the entrepreneurial vocation.The countries with highest esteem, the countries with lowest, and Denmark.2002-2011, weighted toward 2011.
Israel 4.4
USA 4.2
Taiwan 4.2
Hong Kong 4.1
…
Denmark 3.4 51 percentile rank
…
Slovenia 2.9
Japan 2.9
Slovakia 2.8
Czech Republic 2.7
In short, the esteem of the entrepreneurial vocation has been increasing much in Den-mark, and Denmark now esteems the entrepreneurial vocation like is typical among the developed countries.
cultural framework
In the above, we examined four specific cultural framework conditions: education of-fered for independent entrepreneurship, skills of the population, individualism as a cultural value, and esteem of the vocation of independent entrepreneur. These four cultural framework conditions all tended to increase, so the cultural framework has improved overall. The cultural framework can be indicated by an index computed as the mean of the four specific measures, Table 12.9. The index of the cultural framework has increased considerably, that is, the cultural framework has improved over the years and entrepreneurial culture has become pervasive in Denmark.
table 12.9Entrepreneurial culture in Denmark (mean of four specific conditions).Annually from 2002 to 2009.
2002 2003 2004 2005 2006 2007 2008 2009
2.3 2.4 2.5 2.6 2.8 2.9 2.8 3.2

93Entrepreneurial Work by Employees in Enterprises– studied via Global Entrepreneurship Monitor in Denmark 2011
Where does this culture of independent entrepreneurship bring Denmark in com-parison to other countries? Entrepreneurial culture is assessed similarly in the other countries participating in GEM, also as the mean of the four measures of specific cul-tural conditions. Entrepreneurial culture is more prevalent in several other developed societies, notably in Hong Kong, Israel, Iceland, Taiwan and USA, Table 11.10. Among the developed countries, Denmark is well above the middle, 37% of the others are above and 63% of the others are below.
table 12.10.Entrepreneurial culture.The countries with most pervasive entrepreneurial culture, the countries with least, and Denmark.2002-2011, weighted toward 2011.
Hong Kong 3.5
Israel 3.5
Iceland 3.5
Taiwan 3.5
USA 3.5
…
Denmark 2.8 63 percentile rank
…
Bosnia 2.4
France 2.4
Portugal 2.4
Czech Republic 2.4
Japan 2.2
In short, the cultural framework in Denmark has improved considerably over the years, also in recent years despite the economic crisis, entrepreneurial culture is now perva-sive in Denmark, and Denmark now has more of an entrepreneurial culture than most other developed countries.
Having examined the cultural framework, we turn to examine a series of institu-tional framework conditions.

94 Entrepreneurial Work by Employees in Enterprises
– studied via Global Entrepreneurship Monitor in Denmark 2011
institutional framework conDitions: financial resources for entrePreneurshiP
Financial resources refer to the availability of funding for independent entrepreneur-ship (Schøtt, 2006:76, 2007:39, 2008:22, 2009, 2010, 2011). Most years, in Denmark, the financial resources are assessed by asking a panel of experts to ascertain truthful-ness of each of the following statements,- In Denmark, there is sufficient equity funding available for new and growing firms- In Denmark, there is sufficient debt funding available for new and growing firms- In Denmark, there are sufficient government subsidies available for new and growing
firms- In Denmark, there is sufficient funding available from private individuals (other than founders) for new and growing firms- In Denmark, there is sufficient venture capitalist funding available for new and growing
firms- In Denmark, there is sufficient funding available through initial public offerings (IPOs) for new and growing firmsEach expert ascertains truthfulness of each statement in terms of ’Completely false’, ’Somewhat false’, ’Neither true nor false’, ’Somewhat true’ and ’Completely true’. The assessment is quantified on a scale from 1 to 5. The assessments are then averaged across the experts and averaged across the six statements for a measure for the year. With measurement taken in recent years we can track recent changes in financial re-sources for entrepreneurship.
The availability of funding in Denmark has fluctuated over the years, Table 12.11. Resources seem to have been declining in recent years, from 2007 to 2009, that is, since the economic recession began.
2002 2003 2004 2005 2006 2007 2008 2009
3.2 3.0 2.5 2.6 2.7 2.9 2.8 2.7
table 12.11Financial resources in Denmark. Annually from 2002 to 2009.
Where does this availability of resources for independent entrepreneurship bring Den-mark compared to other countries? Availability is also measured in the other countries participating in GEM, Table 11.12. Among the developed countries, Canada, Taiwan, Israel and Belgium have greatest availability. Denmark is around the middle, with 63% of the others below.

95Entrepreneurial Work by Employees in Enterprises– studied via Global Entrepreneurship Monitor in Denmark 2011
table 12.12Financial resources. The countries with most financial resources, the countries with least financial resourc-es, and Denmark.2002-2011, weighted toward 2011.
Canada 3.3
Taiwan 3.2
Israel 3.2
Belgium 3.2
…
Denmark 2.8 63 percentile rank
…
Czech Republic 2.2
Macedonia 2.1
Slovakia 2.1
Russia 2.1
In short, availability of resources has been decreasing in the most recent years. Den-mark is around the middle among the developed countries.
government Policies towarD inDePenDent entrePreneurshiP
Government policies toward entrepreneurship refer to the policies that the national government and more local public authorities decide and implement (Schøtt, 2006a:78, 2007a:40, 2008:23, 2009, 2010, 2011). Government policies in Denmark are measured almost annually by asking a panel of experts to ascertain truthfulness of each of the fol-lowing statements,- In Denmark, Government policies (e.g., public procurement) consistently favor new firms.- In Denmark, the support for new and growing firms is a high priority for policy at the national government level.- In Denmark, the support for new and growing firms is a high priority for policy at the local government level.- In Denmark, new firms can get most of the required permits and licenses in about a week.- In Denmark, the amount of taxes is NOT a burden for new and growing firms.- In Denmark, taxes and other government regulations are applied to new and growing firms in a predictable and consistent way.- In Denmark, coping with government bureaucracy, regulations, and licensing requirements it is not unduly difficult for new and growing firms.Government policies in Denmark have been changing, Table 12.13. During the decade, policies have become more favorable.

96 Entrepreneurial Work by Employees in Enterprises
– studied via Global Entrepreneurship Monitor in Denmark 2011
table 12.13Government policies in Denmark. Annually from 2002 to 2009.
2002 2003 2004 2005 2006 2007 2008 2009
2.6 2.7 2.8 3.1 3.1 3.2 3.1 3.0
Where do these favorable policies bring Denmark compared to other countries? Govern-ment policies have been measured also in the other countries participating in GEM, Table 12.14. Among the developed countries, government policies are more favorable especially in Singapore, Iceland, Finland and Switzerland. Denmark is near the top, with 85% of the other countries having less favorable policies.
table 12.14Government policies.The countries with most favorable government policies, the countries with least sup-portive policies, and Denmark. 2002-2011, weighted toward 2011.
Singapore 3.7
Iceland 3.3
Finland 3.2
Switzerland 3.2
…
Denmark 3.0 85 percentile rank
…
Italy 1.9
Bosnia 1.8
Hungary 1.8
In short, government policies in Denmark have become more supportive, and Denmark is among the countries with most favorable policies.

97Entrepreneurial Work by Employees in Enterprises– studied via Global Entrepreneurship Monitor in Denmark 2011
Public Programs for inDePenDent entrePreneurshiP
Public program refer to the programs that are publicly available, and mostly supported by funds from the public, channeled through national and more local administrations (Schøtt, 2006a:80, 2007a:41, 2008:23-24, 2009, 2010). The adequacy of the public pro-grams in Denmark are assessed annually by asking a panel of experts to ascertain truth-fulness of each of the following statements,- In Denmark, a wide range of government assistance for new and growing firms can be obtained through contact with a single agency.- In Denmark, science parks and business incubators provide effective support for new and growing firms.- In Denmark, there are an adequate number of government programs for new and growing businesses.- In Denmark, the people working for government agencies are competent and effective in supporting new and growing firms.- In Denmark, almost anyone who needs help from a government program for a new or growing business can find what they need.- In Denmark, government programs aimed at supporting new and growing firms are effec-
tive.Adequacy of public programs in Denmark has been changing a little, Table 12.15. Ade-
2002 2003 2004 2005 2006 2007 2008 2009
3.0 2.9 2.9 3.1 3.0 3.1 3.0 3.4
quacy of the public programs has apparently been increasing most recently.
table 12.15Public programs for independent entrepreneurship in Denmark. Annually from 2002 to 2009.
Where is Denmark positioned compared to other countries in terms of supportive pub-lic programs? Public programs are likewise assessed in other countries, Table 12.16. Among the developed countries, public programs are more supportive in some coun-tries, notably Germany, Austria, Singapore and Switzerland. Denmark has very sup-portive programs, only 15% of the other countries have more supportive programs, whereas 85% of the others have less supportive programs. That Denmark has very supportive public programs is hardly surprising, as Denmark is still a welfare society, with welfare extending to public support for private business.

98 Entrepreneurial Work by Employees in Enterprises
– studied via Global Entrepreneurship Monitor in Denmark 2011
table 12.16Public programs for entrepreneurship. The countries with most supportive public programs, the countries with least, and Den-mark. 2002-2011, weighted toward 2011.
Germany 3.5
Austria 3.5
Singapore 3.4
Switzerland 3.3
…
Denmark 3.1 85 percentile rank
…
Hungary 2.1
Russia 2.1
Slovakia 2.0
Bosnia 2.0
In short, the supportiveness of public programs in Denmark has been increasing most recently, and public programs are more supportive than in by far most countries.
technology transfer to inDePenDent entrePreneurshiP
Technology transfer denotes the movement of technological knowledge from public re-search institutions to entrepreneurship (Schøtt, 2006a:82, 2007a:42, 2008:24, 2009, 2010, 2011). The extent of technology transfer in Denmark is assessed almost annually by asking a panel of experts to ascertain truthfulness of each of the following state-ments,- In Denmark, new technology, science, and other knowledge are efficiently transferred from universities and public research centers to new and growing firms.- In Denmark, new and growing firms have just as much access to new research and technology as large, established firms.- In Denmark, new and growing firms can afford the latest technology.- In Denmark, there are adequate government subsidies for new and growing firms to acquire new technology. - In Denmark, the science and technology base efficiently supports the creation of world-class new technology-based ventures in at least one area.- In Denmark, there is good support available for engineers and scientists to have their ideas commercialized through new and growing firms.Technology transfer in Denmark has been changing over the years, Table 12.17. Tech-nology transfer has steadily increased over time.

99Entrepreneurial Work by Employees in Enterprises– studied via Global Entrepreneurship Monitor in Denmark 2011
table 12.17Technology transfer in Denmark. Annually from 2002 to 2009.
2002 2003 2004 2005 2006 2007 2008 2009
2.3 2.5 2.4 2.5 2.6 2.6 2.7 2.8
Where does the increase bring Denmark, in comparison to other countries? Technolo-gy is measured likewise in many other countries, Table 12.18. Among the developed countries, technology transfer is especially extensive in Switzerland, Taiwan, Belgium and Canada. Denmark is well above the middle, with 68% of the other countries below Denmark in technology transfer.
table 12.18Technology transfer.The countries with most technology transfer, the countries with least, and Denmark. 2002-2011, weighted toward 2011.
Switzerland 3.4
Taiwan 3.1
Belgium 3.0
Canada 3.0
…
Denmark 2.6 68 percentile rank
…
Macedonia 2.1
Russia 2.0
Bosnia 1.9
Slovakia 1.8
In short, technology transfer has been increasing in Denmark, and Denmark is well above the middle among the developed countries in the extent of technology transfer.
commercial anD legal infrastructure for inDePenDent entrePreneurshiP
Commercial and legal infrastructure refers to the availability and affordability of high quality services of commercial, legal and professional kinds (Schøtt, 2006a:84, 2007a:43, 2008:24-25, 2009, 2010, 2011). The infrastructure in Denmark is measured almost an-

100 Entrepreneurial Work by Employees in Enterprises
– studied via Global Entrepreneurship Monitor in Denmark 2011
nually by asking a panel of experts to ascertain truthfulness of each of the following statements,- In Denmark, there are enough subcontractors, suppliers, and consultants to support new and growing firms.- In Denmark, new and growing firms can afford the cost of using subcontractors, suppliers, and consultants.- In Denmark, it is easy for new and growing firms to get good subcontractors, suppliers, and consultants.- In Denmark, it is easy for new and growing firms to get good, professional legal and accounting services.- In Denmark, it is easy for new and growing firms to get good banking services (checking accounts, foreign exchange transactions, letters of credit, and the like). The infrastructure in Denmark has changed over the years, Table 12.19. The availabil-ity increased up to 2006, but since 2006 availability of infrastructure has been decreas-ing.
table 12.19Commercial and legal infrastructure in Denmark. Annually from 2002 to 2009.
2002 2003 2004 2005 2006 2007 2008 2009
3.4 3.4 3.4 3.5 3.7 3.5 3.3 3.3
How does Denmark compare to other countries? The infrastructure is also measured in the other countries participating in GEM, Table 12.20. The availability is higher in sev-eral countries, notably in Canada, Israel, Switzerland and Belgium. Among the devel-oped countries, Denmark is far above the middle, with 76% of the others below.
table 12.20Commercial and legal infrastructure.The countries with most commercial and legal infrastructure, the countries with least, and Denmark.2002-2011, weighted toward 2011.
Canada 3.7
Israel 3.7
Switzerland 3.6
Belgium 3.6
…
Denmark 3.4 76 percentile rank

101Entrepreneurial Work by Employees in Enterprises– studied via Global Entrepreneurship Monitor in Denmark 2011
In short, availability of commercial and legal services in Denmark has been decreasing in the most recent years, and Denmark is far above the middle of the developed coun-tries.
internal market oPenness
Openness of the internal market refers to the ease of entry into the market for new firms (Schøtt, 2006a:86, 2007a:44, 2008:25, 2009, 2009, 2010, 2011). The openness of the internal market in Denmark is assessed almost annually by asking a panel of experts to ascertain truthfulness of each of the following statements,- In Denmark, the markets for consumer goods and services change dramatically from year
to year.- In Denmark, the markets for business-to-business goods and services change dramatically from year to year.- In Denmark, new and growing firms can easily enter new markets.- In Denmark, the new and growing firms can afford the cost of market entry.- In Denmark, new and growing firms can enter markets without being unfairly blocked by established firms.- In Denmark, the anti-trust legislation is effective and well enforced.The openness in Denmark has changed over the years, Table 12.21. Over the decade, the internal market has become a little more open.
table 12.21Internal market openness in Denmark. Annually from 2002 to 2009.
…
Bosnia 2.8
Italy 2.8
South Korea 2.4
Japan 2.2
2002 2003 2004 2005 2006 2007 2008 2009
2.6 2.6 2.5 2.8 2.9 2.7 2.7 2.8
How open is the internal market in Denmark in comparison to other countries? The openness is assessed in the other countries participating in GEM, Table 12.22. Many countries are far more open, notably Taiwan, Poland, South Korea and Iceland. Among the developed countries, Denmark is notably below the middle, with 39% of the other societies less open.

102 Entrepreneurial Work by Employees in Enterprises
– studied via Global Entrepreneurship Monitor in Denmark 2011
table 12.22Internal market openness.The countries with widest internal market openness, the countries with narrowest, and Denmark. 2002-2011, weighted toward 2011.
Taiwan 3.5
Poland 3.3
South Korea 3.2
Iceland 3.2
…
Denmark 2.7 39 percentile rank
…
Portugal 2.5
France 2.5
Israel 2.5
Spain 2.5
In short, although the internal market in Denmark has become a little more open over the years, it remains notably below the middle compared to other developed countries.
Physical infrastructure for entrePreneurshiP
Physical infrastructure encompasses facilities for transportation and communication, their availability and affordability and speed of obtaining them (Schøtt, 2006a:88, 2007a:45, 2008:25-26, 2009, 2010, 2011). Physical infrastructure in Denmark is as-sessed almost annually by asking a panel of experts to ascertain truthfulness of each of the following statements,- In Denmark, the physical infrastructure (roads, utilities, communications, waste disposal) provides good support for new and growing firms.- In Denmark, it is not too expensive for a new or growing firm to get good access to communications (phone, Internet, etc.).- In Denmark, a new or growing firm can get good access to communications (telephone, internet, etc.) in about a week.- In Denmark, new and growing firms can afford the cost of basic utilities (gas, water, electricity, sewer).- In Denmark, new or growing firms can get good access to utilities (gas, water, electricity,
sewer) in about a month.The physical infrastructure in Denmark has changed over the years, Table 12.23. The physical infrastructure improved up to 2006, but since 2006 the physical infrastructure has apparently been declining a little.
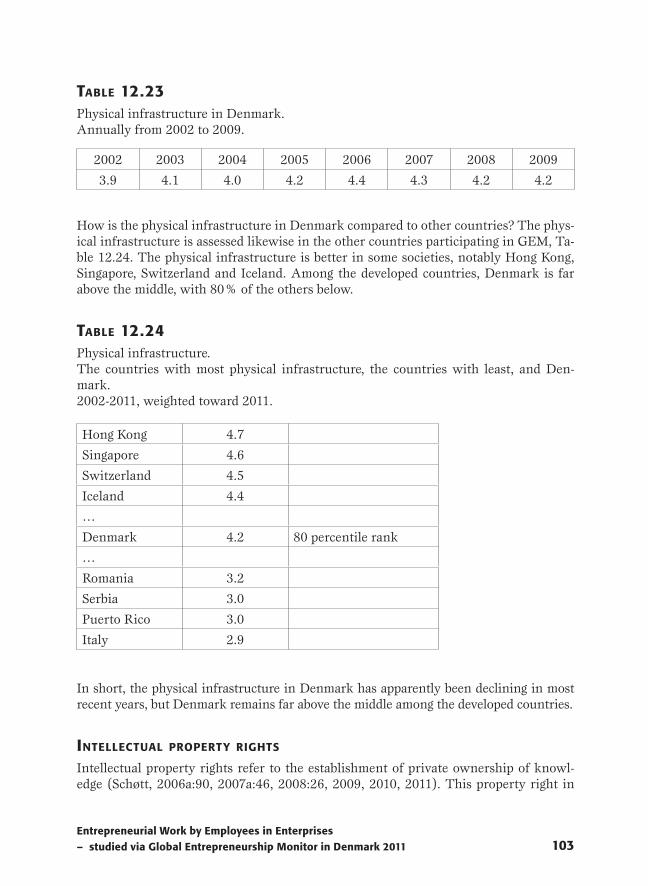
103Entrepreneurial Work by Employees in Enterprises– studied via Global Entrepreneurship Monitor in Denmark 2011
table 12.23Physical infrastructure in Denmark. Annually from 2002 to 2009.
2002 2003 2004 2005 2006 2007 2008 2009
3.9 4.1 4.0 4.2 4.4 4.3 4.2 4.2
How is the physical infrastructure in Denmark compared to other countries? The phys-ical infrastructure is assessed likewise in the other countries participating in GEM, Ta-ble 12.24. The physical infrastructure is better in some societies, notably Hong Kong, Singapore, Switzerland and Iceland. Among the developed countries, Denmark is far above the middle, with 80% of the others below.
table 12.24Physical infrastructure.The countries with most physical infrastructure, the countries with least, and Den-mark. 2002-2011, weighted toward 2011.
Hong Kong 4.7
Singapore 4.6
Switzerland 4.5
Iceland 4.4
…
Denmark 4.2 80 percentile rank
…
Romania 3.2
Serbia 3.0
Puerto Rico 3.0
Italy 2.9
In short, the physical infrastructure in Denmark has apparently been declining in most recent years, but Denmark remains far above the middle among the developed countries.
intellectual ProPerty rights
Intellectual property rights refer to the establishment of private ownership of knowl-edge (Schøtt, 2006a:90, 2007a:46, 2008:26, 2009, 2010, 2011). This property right in

104 Entrepreneurial Work by Employees in Enterprises
– studied via Global Entrepreneurship Monitor in Denmark 2011
Denmark is assessed almost annually by asking a panel of experts to ascertain truthful-ness of each of the following statements,- In Denmark, the Intellectual Property Rights (IPR) legislation is comprehensive- In Denmark, the Intellectual Property Rights (IPR) legislation is efficiently enforced.- In Denmark, the illegal sales of ’pirated’ software, videos, CDs, and other copyrighted or trademarked products is not extensive.- In Denmark, new and growing firms can trust that their patents, copyrights, and trademarks will be respected.- In Denmark, it is widely recognized that inventors’ rights for their inventions should be
respected.The rights in Denmark have been changing over the years, Table 12.25. The rights ex-panded considerably up to 2007, but since 2007 the rights have apparently been declin-ing.
table 12.25Intellectual property rights in Denmark. Annually from 2002 to 2009.
2002 2003 2004 2005 2006 2007 2008 2009
3.3 3.2 3.5 3.7 3.6 3.9 3.7 3.6
Where do these intellectual property rights bring Denmark in comparison to other countries? Rights are assessed likewise in the other countries participating in GEM. Rights are more extensive in Switzerland, Australia and Singapore, Table 12.26. Den-mark is among the developed countries with very extensive rights, as 84% of the other countries have less comprehensive rights.
table 12.26Intellectual property rights.The countries with most protective intellectual property rights, the countries with least, and Denmark. 2002-2011, weighted toward 2011.
Switzerland 4.2
Singapore 4.2
Australia 4.1
Austria 4.0
…
Denmark 3.6 84 percentile rank
…

105Entrepreneurial Work by Employees in Enterprises– studied via Global Entrepreneurship Monitor in Denmark 2011
In short, the intellectual property rights in Denmark have apparently been declining in the most recent years, but Denmark remains among the developed countries with the most extensive rights.
suPPort for growth-entrePreneurshiP
National support for growth-entrepreneurship refers to policies and programs specifi-cally designed to support high-growth firms (Schøtt, 2006a, 2007b, 2008:21-22, 2009, 2010, 2011). The institutional support for growth-entrepreneurship in Denmark is as-sessed by asking experts to ascertain truthfulness of each of the following statements,- In Denmark, there are many support initiatives that are specially tailored for high-
growth entrepreneurial activity.- In Denmark, policy-makers are aware of the importance of high-growth entrepreneurial
activity.- In Denmark, people working in entrepreneurship-support-initiatives have sufficient skills
and competence to support high-growth firms.- In Denmark, potential for rapid growth is often used as a selection criterion when choos-
ing recipients of entrepreneurship support.- In Denmark, supporting rapid firm-growth is a high priority in entrepreneurship policy.Each expert ascertains truthfulness of each statement in terms of ’Completely false’, ’Somewhat false’, ’Neither true nor false’, ’Somewhat true’ and ’Completely true’. The assessment is quantified on a scale from 1 to 5. The assessments are then averaged across the experts and averaged across the five statements for a measure for the year. With measurement taken in recent years we can track recent changes in support for growth-entrepreneurship.
Support for growth-entrepreneurship in Denmark has been increasing over the years, Table 12.27. This assessment is consistent with the changes in entrepreneurship policy and implementations, such as the establishment of advisory services specifically tailored for growth-oriented firms (Erhvervs- og Byggestyrelsen, 2007).
table 12.27Support for growth-entrepreneurship in Denmark. Annually 2005 to 2009.
Greece 2.5
Serbia 2.3
Russia 2.0
Bosnia 2.0
2005 2006 2007 2008 2009
3.4 3.3 3.7 3.6 3.9

106 Entrepreneurial Work by Employees in Enterprises
– studied via Global Entrepreneurship Monitor in Denmark 2011
Where does this bring Denmark compared to other countries? Support for growth-entrepreneurship is also assessed in the other countries participating in GEM by the same questions to a national panel of experts there, Table 12.28. Ireland, Singapore and Taiwan are more supportive of growth-entrepreneurship. Denmark is near the top, with 93% of the other countries below.
table 12.28Support for growth-entrepreneurship.The countries with most support, the countries with least support, and Denmark.2005-2011, weighted toward 2011.
Ireland 4.0
Singapore 3.7
Taiwan 3.7
Denmark 3.6 93 percentile rank
…
Greece 2.5
Slovakia 2.4
Bosnia 2.3
Czech Republic 2.3
In short, support for growth-entrepreneurship has been increasing considerably in Den-mark, and Denmark is near the top among the developed countries with most support for growth-entrepreneurship.
oPPortunities for entrePreneurshiP
Opportunities refer to the opportunities that people in the society have for exploiting business ideas by starting, running and expanding businesses (Schøtt, 2006a:74, 2007b:38, 2008:27, 2009, 2010, 2011). Opportunities are thus a broad framework con-dition that encompasses the more specific institutional framework conditions consid-ered above. Opportunities in Denmark are assessed annually by asking a panel of ex-perts to ascertain truthfulness of each of the following statements,- In Denmark, there are plenty of good opportunities for the creation of new firms.- In Denmark, there are more good opportunities for the creation of new firms than there are people able to take advantage of them.- In Denmark, good opportunities for new firms have considerably increased in the past five
years.- In Denmark, individuals can easily pursue entrepreneurial opportunities.- In Denmark, there are plenty of good opportunities to create truly high growth firms.Each expert ascertains truthfulness of each statement in terms of ’Completely false’,

107Entrepreneurial Work by Employees in Enterprises– studied via Global Entrepreneurship Monitor in Denmark 2011
’Somewhat false’, ’Neither true nor false’, ’Somewhat true’ and ’Completely true’. The assessment is quantified on a scale from 1 to 5. The assessments are then averaged across the experts and averaged across the five statements for a measure for the year. With measurement taken in recent years we can track changes in opportunities for en-trepreneurship.
Opportunities have been changing, Table 12.29. Opportunities in Denmark were ex-panding up to 2006-2007, but opportunities have been contracting since 2007, i.e. dur-ing the crisis.
table 12.29Opportunities in Denmark. Annually from 2002 to 2009.
2002 2003 2004 2005 2006 2007 2008 2009
3.3 3.3 3.3 3.5 3.6 3.6 3.4 3.4
Where does this expansion of opportunities bring Denmark now, in comparison to oth-er countries? Opportunities are assessed in the other countries participating in GEM, Table 12.30. Opportunities are greater in several countries, notably USA, Australia, New Zealand and the Netherlands. Among the developed countries, Denmark is consid-erably above the middle, with 73% of the others below.
table 12.30Opportunities for starting.The countries with greatest opportunities, the countries with least, and Denmark. 2002-2011, weighted toward 2011.
USA 3.8
Australia 3.7
New Zealand 3.6
Netherlands 3.6
…
Denmark 3.4 73 percentile rank
…
Japan 2.7
Hungary 2.7
Greece 2.6
Italy 2.6

108 Entrepreneurial Work by Employees in Enterprises
– studied via Global Entrepreneurship Monitor in Denmark 2011
In short, opportunities in Denmark may have been declining in recent years, but Denmark remains much above the middle among the developed countries.
institutional framework
In the above, we examined ten specific institutional conditions, Financial resources for entrepreneurship, Government policies for entrepreneurship, Public programs for en-trepreneurship, Technology transfer to entrepreneurship, Commercial and legal infra-structure, Internal market openness to new firms, Physical infrastructure for new firms, Intellectual property rights, Support for growth-entrepreneurship, and Opportunities for business. These specific conditions tend to go hand in hand. Therefore it is sensible to consider how they vary overall. Overall, have the institutional conditions been im-proving or declining, or are they stable, specifically during the economic recession in recent years? For this, we compute the mean of the above measures of specific institu-tional conditions, Table 12.31. The institutional framework improved up to 2006-07, but has apparently been declining slightly since 2007, during the economic crisis. This recent decline in institutional framework contrasts with the substantial, steady and continual improvement in the cultural framework examined earlier (and summarized in Table 12.9).
table 12.31.Institutional framework, as mean of specific institutional conditions, in Denmark. Annually from 2002 to 2009.
2002 2003 2004 2005 2006 2007 2008 2009
3.0 3.0 3.0 3.2 3.3 3.3 3.2 3.2
Where does this institutional framework bring Denmark in comparison to other coun-tries? The institutional framework is assessed similarly in the other countries partici-pating in GEM, here as the mean of the specific conditions. The institutional framework is more supportive in several other developed societies, notably in Singapore and Swit-zerland, Table 12.32. Among the developed countries, Denmark is much above the mid-dle, 24% of the others are above and 76% of the others are below.

109Entrepreneurial Work by Employees in Enterprises– studied via Global Entrepreneurship Monitor in Denmark 2011
table 12.32Institutional framework.The countries with most supportive institutional framework, the countries with least, and Denmark.2002-2011, weighted toward 2011.
Singapore 3.6
Switzerland 3.5
Taiwan 3.4
Austria 3.3
Canada 3.3
…
Denmark 3.2 76 percentile rank
…
Greece 2.6
Hungary 2.5
Italy 2.5
Russia 2.4
Bosnia 2.3
Denmark is thus placed well above the middle among the developed countries in both its institutional framework and cultural framework.
Next we shall examine the overall framework for independent entrepreneurship, combining both institutional and cultural conditions.
the framework overall
The framework for independent entrepreneurship has now been examined in terms of four cultural conditions and ten institutional conditions. Several of these conditions have changed over the years, and Denmark is more or less like other developed societies. Overall, how has the framework changed in Denmark? How does the framework in Denmark, overall, compare to the framework elsewhere?
To examine the trend in the overall framework, we can average the assessments of the 14 conditions examined above. The framework in Denmark, overall, has changed over the years, Table 12.33. The framework improved up to about 2006 and seems to have been stable since then.

110 Entrepreneurial Work by Employees in Enterprises
– studied via Global Entrepreneurship Monitor in Denmark 2011
table 12.33Mean of national framework conditions in Denmark. Annually from 2002 to 2009.
2002 2003 2004 2005 2006 2007 2008 2009
2.8 2.9 2.9 3.0 3.1 3.2 3.1 3.2
The framework is each other society can be ascertained by the average across the 14 conditions, Table 12.34. The framework, overall, is best in Taiwan, secondly in Singa-pore, Hong Kong, Switzerland and United States. Denmark has a framework that, over-all, is considerably better than the typical framework in the developed countries, with 71% of the developed countries having a framework less good than the framework in Denmark.
table 12.34Mean of national framework conditions. Societies with best framework, societies with weakest framework, and Denmark. 2002-2011, weighted toward 2011.
Taiwan 3.4
Singapore 3.4
Hong Kong 3.4
Switzerland 3.4
USA 3.3
…
Denmark 3.1 71 percentile rank
…
Italy 2.6
Russia 2.6
Hungary 2.5
Japan 2.5
Bosnia 2.4
Several conclusions can be drawn from the above analyses of framework conditions, their changes in Denmark, and their favorableness in Denmark in comparison to other developed countries.
Over the years several of the Danish framework conditions have become more favora-ble and are more favorable today than some years ago, notably the cultural framework

111Entrepreneurial Work by Employees in Enterprises– studied via Global Entrepreneurship Monitor in Denmark 2011
conditions. Several Danish framework conditions, however, have also been declining in recent years, during the economic crisis, notably several institutional framework condi-tions.
Where does this improvement bring Denmark compared to other countries? Most of the Danish framework conditions are rather close to the typical situation for developed countries, and rank around the middle among the developed countries. Several condi-tions are much more favorable in Denmark than typical among the developed countries. Conversely, a few conditions are less favorable in Denmark than typical among the de-veloped countries. So, overall, the framework in Denmark is notably better than is typi-cal for the developed countries.
How the framework conditions affect independent entrepreneurship will be exam-ined next.

112 Entrepreneurial Work by Employees in Enterprises
– studied via Global Entrepreneurship Monitor in Denmark 2011
What are the national dynamics of independent entrepreneurship? More specifically, this chapter addresses the questions, - How are the cultural conditions affecting one another? - How are the institutional conditions interrelated? - How are the cultural and institutional conditions affecting independent entrepreneurship?The cultural and institutional conditions are a framework for independent entrepreneur-ship in society. A favorable framework enhances independent entrepreneurship whereas an unfavorable framework hampers performance in the society. The framework is favora-ble in some societies and less favorable in other societies, and this shapes the level of inde-pendent entrepreneurial activity, so the level differs from one society to another.
Is independent entrepreneurial activity in the various countries tightly coupled with its framework conditions? Whether entrepreneurial activity goes hand-in-hand with a framework condition, in the various countries, is ascertained by the correlation be-tween the activity and the condition, computed across the countries.
The dynamics differ between developed societies and less developed societies, so we here focus on the developed societies. Our data are from 42 developed societies, which, besides Denmark are: Australia, Austria, Belgium, Bosnia and Herzegovina, Canada, Croatia, Czech Republic, Finland, France, Germany, Greece, Hong Kong, Hungary, Ice-land, Ireland, Israel, Italy, Japan, Latvia, Lithuania, Macedonia, Montenegro, Nether-lands, New Zealand, Norway, Poland, Portugal, Puerto Rico, Romania, Russia, South Korea, Serbia, Singapore, Slovakia, Slovenia, Spain, Sweden, Switzerland, Taiwan, United Kingdom and United States.
Independent entrepreneurial activity in a country is measured by the TEA-rate (Chapter 11), and each of 14 framework conditions was measured (Chapter 12). The 14 correlations between entrepreneurship and the 14 framework-conditions are all be-tween .0 and .5 (each variable is averaged across years up through 2011, and then the correlation between variables is computed across the 42 developed countries). For the developing countries, however, entrepreneurship is far less coupled with its framework conditions (Schøtt and Jensen 2009).
The framework conditions are related to each other. We shall examine how the insti-tutional conditions are interrelated and how the cultural conditions are interrelated. Then we shall examine how the institutional conditions and the cultural conditions jointly affect entrepreneurship.
institutional conDitions creating oPPortunities
Opportunities for exploiting business ideas is a condition for independent entrepre-neurship, but it is not a institutional condition like the nine others examined earlier - -
chaPter 13 effects of framework conDitions uPon level of inDePenDent entrePreneurshiP

113Entrepreneurial Work by Employees in Enterprises– studied via Global Entrepreneurship Monitor in Denmark 2011
financial resources, government policies, public programs, technology transfer, commer-cial and legal infrastructure, internal market openness, physical infrastructure, intel-lectual property rights, and support for growth-entrepreneurship. Opportunities should rather be considered as the condition emerging as a combination of the nine more basic institutional conditions. The institutional conditions are related in the way that oppor-tunities can be considered a consequence emerging as a combination of the institutional conditions, not as a straightforward sum of these conditions, but in the way that each condition has a positive effect on opportunities.
Indeed, opportunities is positively correlated with each of these nine basic institu-tional conditions, Table 13.1 (based on 42 developed countries; each correlation is sta-tistically highly significant).
A positive correlation of opportunities with an institutional condition means that, typically, a country with a favorable institutional condition provides ample opportunity (and, typically, a country with an unfavorable condition offers few opportunities). Thus, specifically, a country with abundant financial resources provides great opportu-nities, typically (and a country with poor financial resources offers few opportunities, typically). A country with supportive policies typically has great opportunities (and a country with unsupportive policies typically offers few opportunities).
The multiple correlation is the correlation of opportunities with an optimal combina-tion of institutional conditions. Countries with a combination of several favorable in-stitutional conditions tend to have especially great opportunities, and this tendency is quite strong (and those with a combination of several unfavorable institutional condi-tions tend to have especially few opportunities).
table 13.1Correlation of opportunities with each institutional condition. Based on 42 developed societies.
Financial resources .5
Government policies .6
Public programs .6
Technology transfer .5
Commercial and legal infrastructure .6
Internal market openness .3
Physical infrastructure .6
Intellectual property rights .7
Growth-entrepreneurship .6
Multiple correlation with all nine .8

114 Entrepreneurial Work by Employees in Enterprises
– studied via Global Entrepreneurship Monitor in Denmark 2011
Opportunities, as a condition, is seen in Table 13.1 to be positively correlated with each of the nine basic institutional conditions, and is highly correlated with a combination of basic institutional conditions (the multiple correlation is much higher than any of the nine correlations).
How opportunities are the consequence of a combination of the basic institutional conditions can be ascertained by a regression of opportunities on the conditions. In this regression we keep only those conditions that seem substantively significant. By this modeling, six of the eight conditions seem to matter. Commercial and legal infrastruc-ture has a large effect, a country with extensive commercial and legal infrastructure fa-cilitates opportunities, typically. Internal market openness also matters much, a country with wide openness provides many opportunities, typically. Intellectual property rights seemingly also expand opportunities. Government policies also create opportunities. Physical infrastructure also appears to enhance opportunities. Support for growth-en-trepreneurship also seems to create greater opportunities. But these various framework conditions go hand in hand with one another, so much that it is hard to disentangle their effects and to estimate the separate effect of each framework condition on oppor-tunities.
These estimated effects are shown in Figure 13.1 (statistical details are in the Ap-pendix in Table A13.1). The other institutional conditions have no separately discern-ible effects, meaning that the data on only 42 developed countries are insufficient to discern their effects, separate from the six discerned effects. The magnitude of an effect is indicated by the thickness of the arrow.

115Entrepreneurial Work by Employees in Enterprises– studied via Global Entrepreneurship Monitor in Denmark 2011
figure 13.1Estimated effects upon opportunities from institutional conditions.
Having examined how the institutional conditions are interrelated, we shall now exam-ine effects among the cultural conditions.
cultural founDation for eDucation anD skills
The four cultural conditions – education, skills, individualism and esteem – which were examined in Chapter 12, are likely to be related as causes and effects. The cultural value
105
Figure 13.1 Estimated effects upon opportunities from institutional conditions.
Having examined how the institutional conditions are interrelated, we shall now examine effects among the cultural conditions.
Commercial and legal infrastructure
Internal market openness
Government policies
Opportunities for independent entrepreneurship
Physical infrastructure
Intellectual property rights
Growth-‐entrepreneurship policy

116 Entrepreneurial Work by Employees in Enterprises
– studied via Global Entrepreneurship Monitor in Denmark 2011
a society attaches to individualism is likely to enhance the esteem of the vocation of independent entrepreneur in the society. Education for the entrepreneurial vocation in the society is likely to be affected by the esteem of the vocation in the society and also by the individualism in society. The education, in turn, expectedly affects the skillful-ness of the people in the society. This sequence of effects among cultural conditions will then promote independent entrepreneurship, we would hypothesize. The effects among cultural conditions can be estimated, like the effects among the institutional conditions were estimated, by regression analysis.
The effect upon esteem from individualism is estimated to be huge (statistical details are in the Appendix in Table A13.2). A society that values individualism also attaches high esteem to the entrepreneurial vocation, typically.
The effect upon education for entrepreneurship from individualism is also estimated to be big. A society that values individualism also offers much education in entrepre-neurship, typically. Esteem of the entrepreneurial vocation in society also has a separate effect upon the education in entrepreneurship provided by the society.
Skills are promoted mainly by individualism. A society that values individualism also has a population with extensive entrepreneurial skills, typically. Education also pro-motes skills, also when controlling for individualism, but this effect is weaker than the effect of individualism. Esteem of the entrepreneurial vocation has no discernible sepa-rate effect upon skills of the population (statistical details are in the Appendix in Table A13.4).
These effects among the cultural conditions are shown in Figure 13.2, where the thickness of an arrow represents the magnitude of the effect.
figure 13.2Estimated effects among cultural conditions.
107
Figure 13.2 Estimated effects among cultural conditions.
How these cultural conditions, jointly with opportunities, shape independent entrepreneurship will be examined next. Effects upon entrepreneurship from cultural and institutional conditions The cultural conditions and the opportunities in a society are a framework for commercial entrepreneurship in the society, and their effects upon entrepreneurial activity can be estimated. The level of independent entrepreneurial activity in a society is here measured by the TEA-‐index, the rate of early-‐phase entrepreneurs in the population, as was examined in Chapter 11. First, the association of each condition with entrepreneurial activity is indicated by their correlation, Table 13.2. Each condition has a correlation with entrepreneurial activity that is positive. Entrepreneurship is even higher correlated with a combination of the five conditions (the multiple correlation is higher than any of the five). Table 13.2 Correlation of national independent entrepreneurial activity (TEA) with opportunities and each cultural condition. Based on 42 developed societies.
Education
Individualism
Esteem
Skills

117Entrepreneurial Work by Employees in Enterprises– studied via Global Entrepreneurship Monitor in Denmark 2011
107
Figure 13.2 Estimated effects among cultural conditions.
How these cultural conditions, jointly with opportunities, shape independent entrepreneurship will be examined next. Effects upon entrepreneurship from cultural and institutional conditions The cultural conditions and the opportunities in a society are a framework for commercial entrepreneurship in the society, and their effects upon entrepreneurial activity can be estimated. The level of independent entrepreneurial activity in a society is here measured by the TEA-‐index, the rate of early-‐phase entrepreneurs in the population, as was examined in Chapter 11. First, the association of each condition with entrepreneurial activity is indicated by their correlation, Table 13.2. Each condition has a correlation with entrepreneurial activity that is positive. Entrepreneurship is even higher correlated with a combination of the five conditions (the multiple correlation is higher than any of the five). Table 13.2 Correlation of national independent entrepreneurial activity (TEA) with opportunities and each cultural condition. Based on 42 developed societies.
Education
Individualism
Esteem
Skills
How these cultural conditions, jointly with opportunities, shape independent entrepre-neurship will be examined next.
effects uPon entrePreneurshiP from cultural anD institutional conDitions The cultural conditions and the opportunities in a society are a framework for commer-cial entrepreneurship in the society, and their effects upon entrepreneurial activity can be estimated. The level of independent entrepreneurial activity in a society is here meas-ured by the TEA-index, the rate of early-phase entrepreneurs in the population, as was examined in Chapter 11.
First, the association of each condition with entrepreneurial activity is indicated by their correlation, Table 13.2. Each condition has a correlation with entrepreneurial ac-tivity that is positive. Entrepreneurship is even higher correlated with a combination of the five conditions (the multiple correlation is higher than any of the five).
table 13.2Correlation of national independent entrepreneurial activity (TEA) with opportunities and each cultural condition.Based on 42 developed societies.
Opportunities .3
Individualism .3
Esteem .1
Education .3
Skills .2
Multiple correlation with all five .4
The effect upon entrepreneurship from each condition, while holding the other conditions constant, is estimated by a regression (statistical details are in the Appendix in Table A13.5).
Opportunities have a big effect upon entrepreneurial activity. A society that provides abundant opportunities will also have a high level of entrepreneurial activity, typically, whereas a society with few opportunities will have little entrepreneurial activity. Indi-vidualism also has a large effect on entrepreneurial activity, but here I examine only its effect through the other cultural conditions that are promoted by individualism, namely esteem of the vocation of independent entrepreneur, the entrepreneurial education, and the entrepreneurial skills in society. A society that values individualism will also esteem the vocation, provide education, and promote skills, typically, whereas a society that devalues individualism will devalue the vocation, provide less education and hamper skills. Esteem of the vocation promotes education, and education promotes skills and also promotes entrepreneurship directly, and skills also promote entrepreneurship. These effects are shown in Figure 13.3.

118 Entrepreneurial Work by Employees in Enterprises
– studied via Global Entrepreneurship Monitor in Denmark 2011
Cultural conditions promote entrepreneurship through several sequences of positive effects. The cultural value attached to individualism promotes all the other three cul-tural conditions: esteem of the entrepreneurial vocation, the education in entrepreneur-ship and the entrepreneurial skillfulness of the population. Education promotes skills, so there is an indirect effect of education upon entrepreneurship in the manner that education promotes skills which in turn promote entrepreneurship.
figure 13.3Estimated effects upon developed nations’ entrepreneurship from their cultural and in-stitutional conditions.
The effect of the framework upon entrepreneurship can be graphed by plotting the countries according to their entrepreneurship and to the optimal combination of frame-work conditions, Figure 13.4, in which an asterix marks a country. The association between the framework conditions and the level of entrepreneurship is obvious, a coun-try with an extensive framework will also have a high level of entrepreneurship, typi-cally, whereas a society with a meager framework will have little entrepreneurial activ-ity.
The USA, marked U on Figure 13.4, illustrates the effect. The framework conditions in the USA are extremely extensive, and the overall framework in the USA has been better than in any other country (on average across the years). This framework places
109
Figure 13.3 Estimated effects upon developed nations’ entrepreneurship from their cultural and institutional conditions.
The effect of the framework upon entrepreneurship can be graphed by plotting the countries according to their entrepreneurship and to the optimal combination of framework conditions, Figure 13.4, in which an
Education
Individualism
Esteem
Skills
Opportunities
Entrepreneurship

119Entrepreneurial Work by Employees in Enterprises– studied via Global Entrepreneurship Monitor in Denmark 2011
the USA at the better end of the horizontal axis in Figure 13.4. The level of entrepre-neurship in the USA is among the highest among the developed countries, this entrepre-neurship places the USA very high up on the vertical axis.
Denmark, marked D in Figure 13.4, is around in the middle in its framework and is also almost around the middle in its entrepreneurial activity.
figure 13.4Plot of developed societies according to their combined framework conditions (horizon-tal axis) and their entrepreneurship (TEA, vertical axis).
In conclusion, in developed societies, both the cultural and the institutional framework conditions greatly promote independent entrepreneurial activity in discernible ways, cultural conditions enhance the entrepreneurial skills of the population and basic insti-tutional conditions create opportunities for the population to bring their skills into en-trepreneurship.
D
U
4 6 8 100
5
10
15
20

120 Entrepreneurial Work by Employees in Enterprises
– studied via Global Entrepreneurship Monitor in Denmark 2011
This tight coupling between framework and independent entrepreneurship in devel-oped societies is illustrated by the USA. The American framework has apparently been better than in the other countries (on the whole during the last decade), and conse-quently the level of entrepreneurship in the USA has also been among the highest among the developed countries.
Denmark also displays this tight coupling between framework and level of independ-ent entrepreneurship. Denmark has a level of entrepreneurship that has been rather close to typical for the developed countries (Chapter 11; on the whole during the last decade), and Denmark has a framework that is about typical (Chapter 12). This is eas-ily understood. When the country has a framework that is about typical, then we also predict the resulting level of activity to be about typical.

121Entrepreneurial Work by Employees in Enterprises– studied via Global Entrepreneurship Monitor in Denmark 2011
Torben Bager and Thomas Schøtt
Earlier in this book, Chapter 3, the level or amount of entrepreneurial work by employees was ascertained in Denmark and other countries around the world. No explanation was offered. Also earlier in this book, Chapter 11, the level of entrepreneurial work by inde-pendent entrepreneurs was ascertained around the world (also in Bosma et al., 2012).
To better understand the entrepreneurial work by both employees and independent entrepreneurs, this chapter compares several countries, namely Nordic, Anglo-Saxon and Continental countries. The questions are now,- What explains why the Nordic countries – Denmark and Sweden – have the highest level
of entrepreneurial work by employees in the world? And what explains why they also have some of the lowest levels of entrepreneurial work by independent entrepreneurs in the world?
Data The data for this chapter are mainly our GEM survey of the adult population in Den-mark, where 2015 adults were interviewed in 2011, and the GEM survey of the adult population in many other countries, using the same questionnaire. The questionnaire asked the respondents if they are employees, and then asks the employees whether they are leading entrepreneurial work, as detailed earlier, Chapter 3. The questionnaire also asked the respondents if they are independent entrepreneurs in the sense of owning and managing a new or existing business, which is used for estimating the level of independ-ent entrepreneurship in the adult population in the country. Moreover, the independent entrepreneurs were asked about their motivation for their independent entrepreneur-ship, whether they are pulled by seeing a business-opportunity or pushed by necessity for earning an income, by being an independent entrepreneur rather than being an employee or making a living in some other way. We thereby distinguish between two forms of independent entrepreneurship, opportunity-driven entrepreneurship and ne-cessity-driven entrepreneurship.
national level of various forms of entrePreneurshiP
The Nordic countries are at extreme positions along several dimensions of entrepre-neurial work. Notably, the Danish entrepreneurial activity is characterized by having:
chaPter 14 entrePreneurial work by emPloyees anD inDePenDent entrePre-neurs: unDerstanDing norDic, anglo-saxon anD continental countries

122 Entrepreneurial Work by Employees in Enterprises
– studied via Global Entrepreneurship Monitor in Denmark 2011
- a very low level of early-stage independent entrepreneurial activity (2nd lowest in the TEA-index among 23 innovation driven countries);
- a very low level of independent entrepreneurial activity motivated by necessity (3rd low-est among 23 innovation driven countries), i.e. typically motivated by business opportu-nity;
- a very high level of entrepreneurial work by employees (2nd highest among 22 innovation driven countries).
These extremes are also found in other Nordic countries, particularly in Sweden (Bos-ma et al., 2012). These societies are all highly developed with a relatively large public sector, a high level for welfare services in the social and health sectors and wide access to unemployment benefits.
In highly developed Anglo-Saxon countries like the USA and Australia, the pattern is rather different. Here the level of independent entrepreneurship and in particular ne-cessity-driven entrepreneurial activity is significantly higher while the level of entrepre-neurial work by employees is lower. An important explanatory factor is the liberal welfare state model in these countries with a relatively small public sector and low lev-els of public supported health, social and unemployment benefits. This liberal welfare state model contributes to push unemployed or marginalized people into self-employ-ment and other forms of entrepreneurial activity, nurturing a high level of early stage independent entrepreneurial activity.
Conservative continental countries like Germany and Switzerland are characterized by a relatively low level of entrepreneurial work by employees combined with moderate level of independent entrepreneurship. The relatively low level of entrepreneurial work by employees might be a consequence of relatively autocratic-conservative management structures and traditions.
Table 14.1 shows average numbers for six selected countries which can be regarded as typical for the three overall welfare state models discerned by Esping-Andersen (1991): - Anglo-Saxon/Liberal: USA, Australia- Nordic/Social Democratic: Denmark, Sweden- Continental/Conservative: Germany, Switzerland

123Entrepreneurial Work by Employees in Enterprises– studied via Global Entrepreneurship Monitor in Denmark 2011
table 14.1Forms of entrepreneurial work in selected countries in 2011
Anglo-Saxon coun-tries
Nordic countries
Continental countries
Independent entrepreneurship (Share of adult population, who own and manage a new business, max 3½ years old)
4.5%Australia 4.7%
USA 4.3%
2.0%Sweden
2.3%Denmark
1.6%
2.7%Switzerland 2.9%
Germany 2.4%
Necessity-driven entrepreneurship(Share of entrepreneurs, who are necessity-motivated rather than opportunity-motivated)
18.0%Australia 15.0%
USA 21.0%
6.8%Sweden
6.0%Denmark
7.5%
15.0%Switzerland 11.0%
Germany 19.0%
Entrepreneurial work by employees (Share of adult population, who are leading employee entrepreneurial work)
5.2%Australia 5.0%
USA 5.3%
11.4%Sweden 13.5%
Denmark 9.2%
3.4%Switzerland 3.3%
Germany 3.5%
While entrepreneurial work by employees and by independent entrepreneurs by their definition are separate and not overlapping, necessity-driven entrepreneurship is a com-ponent of independent entrepreneurship, so the low level of autonomous entrepreneur-ship in Nordic countries is partly explained by the very low pressure of necessity in these societies, and, conversely, the high level of independent entrepreneurship in An-glo-Saxon countries is partly explained by the high push of necessity in these societies. In short, for the three versions of welfare societies, we see the following patterns:- the level of early stage independent entrepreneurship is high in Anglo-Saxon countries,
low in Nordic countries and moderate in Continental countries;- the level of necessity-driven entrepreneurship is high in Anglo-Saxon countries, very low
in Nordic countries and moderate in Continental countries;- the level of entrepreneurial work by employees is very high in Nordic countries, moderate
in Anglo-Saxon countries and low in Continental countries.If societies with more mixed welfare models are included in the comparison, this overall pattern seems to hold, although variation between the country groups becomes blurred. In the Nordic countries Norway shares the same pattern as Sweden and Denmark con-cerning a low level of early stage start-up activity and necessity-driven entrepreneurial activity, but no 2011 data are available for entrepreneurial work by employees in Nor-way. Finland has, like Denmark and Sweden, a high level of entrepreneurial work by employees, but also a relatively high level of independent entrepreneurship and also of necessity-driven entrepreneurship. Among Anglo-Saxon countries, the United King-dom seems to be close to the Continental pattern while Ireland is closer to the Anglo-

124 Entrepreneurial Work by Employees in Enterprises
– studied via Global Entrepreneurship Monitor in Denmark 2011
Saxon. Among Continental countries Belgium and the Netherlands are close to the Nor-dic pattern in some respects.
The overall pattern can also be observed in GEM data from earlier years although comprehensive data on entrepreneurial work by employees are only available for 2011. However, data for entrepreneurial work by employees, counted as persons who are in the process of starting a new venture activity in collaboration with their employers, are available for all years since the inception of the GEM study in 1999 and these data also suggest that entrepreneurial work by employees is particularly important in Northern European countries like Denmark and Sweden.
Possible exPlanations of the levels of forms of entrePreneurial work
As indicated above, a number of intertwined factors might influence the observed pat-tern such as welfare state models, national cultures, managerial traditions and job-au-tonomy. By drawing on several comparative cross-national studies we may disentangle these factors.
Welfare state modelsThe achieved results underpin theory which suggest that institutions at the national level have a significant bearing on the choice entrepreneurially inclined people make between different forms of entrepreneurial activity (Baumol 1990), mediated both through ‘soft’ cultural institutions such as cultural values and work and management traditions and ‘hard’ social institutions such as access to social and health benefits and also unemployment benefits. According to Baumol’s theory, these institutional factors lead to significant variation in the prevalence of different forms of entrepreneurship in different countries while the total entrepreneurial activity level tends to be at the same level.
The GEM results seem to a high degree to support Baumol’s variation view. For Nor-dic countries the institutional context seems conducive for entrepreneurial work by employees rather than independent start-up activity. Moreover, the low level of neces-sity driven entrepreneurship in Nordic countries is likely to be closely related to the social democratic welfare state model which to a higher degree than other welfare state models provides income for unemployed and people with social and health problems. On the other hand GEM results do not support Baumol’s thesis of constant entrepre-neurial activity when all investigated GEM countries are compared. Some countries have much higher overall levels than others. One should take into consideration, though, that the GEM data only deals with productive forms of entrepreneurship while Baumol in his theory also includes unproductive and destructive forms of entrepreneurship.
The welfare model theory of Esping-Andersen (1991), suggesting the existence of three overall welfare models, has had significant impact on subsequent welfare research and received some support in empirical investigations on social and labor market fac-tors (Arts & Gelissen 2002; Asberger 2011). A discussion has unfolded among scholars about the number of welfare models which suggest that generalizing about countries and groups of countries is difficult. In this paper we have chosen to stick to Esping-Andersen’s original formulation of three distinct welfare models.

125Entrepreneurial Work by Employees in Enterprises– studied via Global Entrepreneurship Monitor in Denmark 2011
Variation in national culturesAs demonstrated by G. Hofstede (1991), cultural variation across countries is signifi-cant. His theory and work is disseminated widely and in spite of some criticism, par-ticularly on methodological issues, his theory is generally regarded as a valuable theo-retical construct with reasonable empirical backing.
In his early works he distinguished among four major dimensions of culture:- Power distance, defined as the extent to which the less powerful members of institutions
and organizations within a country expect and accept that power is distributed une-qually.
- Individualism, with high level of individualism referring to social life with loose ties among people and high level of collectivity referring to social life with close ties among people.
- Masculinity, with masculine society characterized by achievement and performance values and feminine society characterized by social and nurturing values.
- Uncertainty avoidance, defined as the extent to which people try to avoid uncertainty related to the future.
The Nordic, Anglo-Saxon and Continental welfare models seem to correlate quite strongly with these cultural dimensions. The pattern is reflected in Table 14.2 (Hofst-ede 1991; www.clearlycultural.com/geert-hofstede-cultural dimensions).
table 14.2Levels of Power distance, individualism, masculinity and uncertainty avoidance in Nor-dic, Anglo-Saxon and Continental countries (measurement in parenthesis).
Anglo-Saxon countries
(mean US, AU)
Nordic countries(mean DK, SE)
Continental countries
(mean GE, SW)
Power distance Low (38) Very low (25) Low (35)
Individualism Very high (91) High (73) High (68)
Masculinity High (62) Very low (11) High (68)
Uncertainty avoidance Low (44) Very low (26) High (62)
These cultural factors contribute to explain the entrepreneurship pattern found in the liberal Anglo-Saxon countries where individualism and acceptance of uncertainty seem to facilitate independent entrepreneurial activity, combined with a liberal welfare state model which leads to a relatively high level of necessity-driven entrepreneurial activity. Similarly, they contribute to explain why the egalitarian and collaborative, and yet indi-vidualistic and risk-oriented Nordic cultures experience a high level of entrepreneurial work by employees.
Other studies of national cultures also support the Hofstede based results. The world values survey by Inglehart and colleagues (1998), building on survey-questions about

126 Entrepreneurial Work by Employees in Enterprises
– studied via Global Entrepreneurship Monitor in Denmark 2011
six major human concerns, found that “Norway, Denmark and Sweden form a compact cluster” (Inglehart et al. 1998, page 17).
Autocratic versus participatory managerial traditionsIn order to understand the entrepreneurship pattern in Nordic, Anglo-Saxon and Con-tinental countries, factors at the macro-level of society such as welfare state models and national cultures cannot stand alone. They need to be supplemented with factors at the level of organization such as management traditions and work place cultures.
Some companies and organizations practice autocratic and hierarchical forms of management while others practice participatory and democratic forms, and although all countries have significant variation in the management methods practiced across or-ganizations inside the country, variation across countries can also be observed.
According to Perletz & Seger (2004), the variation in management forms across groups of countries is closely connected to the variation in national cultures. They end up suggesting five groups of countries with different cultures, including the Anglo-Sax-on culture, Nordic culture and Germanic culture. Management forms vary significantly across these groups in a number of respects such the level of autocratic management, the level of consensus seeking behavior and stakeholder approaches.
The Nordic culture, and particularly in the three Scandinavian countries, again ap-pear to be quite unique internationally with dominance of an egalitarian, participatory and collaborative form of management. Perlitz & Seger argue that “the Nordic manage-ment style is very decentralized and democratic. The business organizational chart is generally horizontally structured. There are almost three times fewer hierarchical ech-elons than in France, and the Power Distance between people is very low” (Perlitz & Seger 2004, p. 11).
These observations and arguments are well aligned with theory about so-called Scan-dinavian Management. Thus Grennes argues, while writing about the concept of Scan-dinavian Management based on qualitative interviews with Scandinavian managers, that “management in the three Scandinavian countries does not differ significantly from one another, but differ from that of non-Scandinavian countries” (Grenness 2003, page 9). The values shared by Scandinavian managers are “cooperation, consensus, par-ticipation and power-sharing” (Grennes 2003, page 18).
Work place culturesForms of management are closely related to work place culture, and work place culture seems to have a significant bearing on the level of entrepreneurial work by employees. The Nordic management form invites employees to participate, think independently and take initiatives beyond their normal duties while the more autocratic and hierarchi-cal forms reduce employee incentives for employees to participate and take initiative. Therefore the Nordic management form and participatory work culture is likely to be conducive to entrepreneurial work by employees.
Variation in work place cultures from one country to another may be difficult to measure. What can be successfully examined are some dimensions of work place culture such as work engagement and job-autonomy. As some degree of work engagement and job-autonomy is needed for work to be entrepreneurial, the prevalence of these charac-

127Entrepreneurial Work by Employees in Enterprises– studied via Global Entrepreneurship Monitor in Denmark 2011
teristics in a country is likely to influence the national level of entrepreneurial work by employees.
Several empirical studies also support the finding that the Nordic countries have higher degrees of work engagement and job-autonomy than other countries. According to a comparative study of eight European countries, including Sweden, Germany and United Kingdom, the average degree of work engagement varies significantly between the countries, with Sweden topping the ranking on job-autonomy and social support. According to this study “Sweden serves as a Nordic country in which employees have better opportunities to participate in decision making” (Taipali 2011, page 499). The authors also conclude that job demands often decrease work engagement while job-au-tonomy and social support increase employees engagement in their work.
This result accords well with an earlier study by Dobbin and Boychuk (1999). In a large-scale empirical study of job-autonomy in different countries, they found system-atic considerable differences in job-autonomy between Nordic countries and Anglo-Saxon countries (Australia, Canada and USA), with the Nordic countries at a signifi-cantly higher job-autonomy than the Anglo-Saxon countries. The major reason, accord-ing to these authors, was that “national employment systems carry different logics, in-stitutionalized in management, training, bargaining and employment practices. The United States, Canada and Australia represent one such logic, with rule-oriented prac-tices that limit autonomy. The Nordic countries represent another, with skill-oriented practices that expand autonomy.” (Dobbin & Boychuk 1999, page 258).
This relationship between work-place culture and entrepreneurial work by employ-ees is also found in our analysis earlier in this book, Chapter 5, of the cultural mindset of entrepreneurially working employees, routinely working employees and independent entrepreneurs. Entrepreneurial employees consider their work meaningful and autono-mous more often than routine employees, although less meaningful and autonomous than independent entrepreneurs.
conclusions
Our new focus in GEM 2011 on entrepreneurial work by employees has enabled a better understanding of factors influencing the prevalence of entrepreneurial work by employ-ees and by independent entrepreneurs at the national level. Our cross-country analyses of our GEM data demonstrate, not only that the overall level of entrepreneurial activity varies significantly from one country to another, but also that the prevalence of different forms of entrepreneurship varies significantly. This includes significant variation among countries in their level of entrepreneurial work by employees.
In order to understand factors influencing variation in the prevalence of entrepre-neurial forms, a grouping of developed countries according to their welfare state model seems appropriate as a point of departure. Nordic countries, characterized by high taxa-tion level, universal access to social benefits/health care and wide access to unemploy-ment benefits, have low levels of independent entrepreneurship, particularly entrepre-neurial activity driven by necessity, combined with a very high level of entrepreneurial work by employees. Anglo-Saxon countries such as USA and Australia have strong in-dividualistic and free market values which enhance independent entrepreneurship and

128 Entrepreneurial Work by Employees in Enterprises
– studied via Global Entrepreneurship Monitor in Denmark 2011
also a high level of necessity-driven entrepreneurship because of the relatively low level of social security and unemployment benefits. Continental countries tend to be in a mid-dle position, except in entrepreneurial work by employees, where conservative work-place and management traditions seem to result in a low level.
At least four factors seem to influence this entrepreneurship pattern between the three groups of countries:- Overall welfare state models- National cultures- Management traditions- Work-place culturesAll of these four factors seem to influence the level of entrepreneurial work by employ-ees, and they seem closely intertwined. However, it is rather unclear how they are inter-twined and how they impact the level of entrepreneurial work by employees. National cultures and welfare state models seem to be aligned and probably the ‘soft’ culture and ‘hard’ welfare system factors are mutually reinforcing. Furthermore, national cultures and work place cultures are closely intertwined, with national culture forming the broader context for work culture. At the level of organization, work cultures and man-agement forms are also closely intertwined, almost as two sides of the same coin. So, the four factors are closely intertwined and probably each of them contributes to explaining the prevalence of different forms of entrepreneurship in nations, including the level of entrepreneurial work by employees. Welfare state models and national cultures are con-textual factors helping us understand the structural ‘room’ for people to pursue differ-ent forms of entrepreneurship and the soft macro-drivers of entrepreneurial activity. Organization level factors such as work place culture and management tradition have a more direct influence on entrepreneurial work by employees, as illustrated by Figure 14.1
figure 14.1Factors influencing national level of entrepreneurial work by employees
120
probably the ‘soft’ culture and ‘hard’ welfare system factors are mutually reinforcing. Furthermore, national cultures and work place cultures are closely intertwined, with national culture forming the broader context for work culture. At the level of organization, work cultures and management forms are also closely intertwined, almost as two sides of the same coin. So, the four factors are closely intertwined and probably each of them contributes to explaining the prevalence of different forms of entrepreneurship in nations, including the level of entrepreneurial work by employees. Welfare state models and national cultures are contextual factors helping us understand the structural ‘room’ for people to pursue different forms of entrepreneurship and the soft macro-‐drivers of entrepreneurial activity. Organization level factors such as work place culture and management tradition have a more direct influence on entrepreneurial work by employees, as illustrated by Figure 14.1 Figure 14.1 Factors influencing national level of entrepreneurial work by employees Understanding these factors and relationships help us understand the specific entrepreneurship characteristics of Denmark. Being a Nordic country applying a social-‐democratic welfare state model reduces the incentives of people to start new independent enterprises compared to the liberal countries. This structural factor is complemented by a national culture which can be characterized as egalitarian and collaborative, but also as individualistic and change oriented. So, the Danish national culture enhances entrepreneurial activity and the welfare state channels the bulk of this entrepreneurial drive into entrepreneurial work by employees. At the level of organization these society-‐level structural and cultural factors are conducive for participatory forms of management combined with an engaging work culture and a high-‐level of job-‐autonomy – which again are conducive for entrepreneurial work by employees in the Danish enterprises. APPENDIX with technical specifications.
Welfare state model
Prevalence of forms of entrepreneurship
National culture
Level of entrepreneurial work by employees
Work culture
Management tradition

129Entrepreneurial Work by Employees in Enterprises– studied via Global Entrepreneurship Monitor in Denmark 2011
Understanding these factors and relationships help us understand the specific entre-preneurship characteristics of Denmark. Being a Nordic country applying a social-dem-ocratic welfare state model reduces the incentives of people to start new independent enterprises compared to the liberal countries. This structural factor is complemented by a national culture which can be characterized as egalitarian and collaborative, but also as individualistic and change oriented. So, the Danish national culture enhances entre-preneurial activity and the welfare state channels the bulk of this entrepreneurial drive into entrepreneurial work by employees. At the level of organization these society-level structural and cultural factors are conducive for participatory forms of management combined with an engaging work culture and a high-level of job-autonomy – which again are conducive for entrepreneurial work by employees in the Danish enterprises.

130 Entrepreneurial Work by Employees in Enterprises
– studied via Global Entrepreneurship Monitor in Denmark 2011
aPPenDix with technical sPecifications.Chapters 11, 12 and 13 examine the national level of independent entrepreneurship, its national framework conditions, and effects of framework conditions on the level of in-dependent entrepreneurship. The unit of analysis is a developed society. The analyses are on the developed societies, 42 developed societies, including Denmark. The 42 de-veloped societies are actually a fairly large sample of developed societies, the sample is nearly a census of all the developed societies in the world (the developed societies that have not yet participated in GEM are mainly new states in Eastern Europe such as Es-tonia, Ukraine and Belarus). The 42 developed societies are those that have participated in GEM during some or all of the years 2002-2011.
Figure 13.1 in Chapter 13 is based on the regression shown here in Table A13.1. The thicknesses of the arrows are given by the standardized regression coefficients.
table a13.1Opportunities shaped by six institutional conditions (the other institutional conditions had no separate discernible effects).Linear regression.R2 = .63N = 42 developed societies
Figure 13.2 in Chapter 13 draws the essential results from a structural equations model which includes the three linear models shown here in Tables A13.2, A13.3 and A13.4. The unit of analysis is a developed society. Data are available on all 42 developed societies participating in GEM during some or all of the years 2002-2011.
table a13.2.Esteem, as affected by individualism.
Standardized coefficient
Probability-value(one-sided)
Individualism .81 .001
Standardized regression coefficient
P-value(one-sided)
Government policies .02 .46
Commercial and legal infrastructure .38 .01
Internal market openness .30 .01
Physical infrastructure .02 .46
Intellectual property rights .29 .08
Support for growth-entrepreneurship .13 .26

131Entrepreneurial Work by Employees in Enterprises– studied via Global Entrepreneurship Monitor in Denmark 2011
Standardized coefficient
Probability-value(one-sided)
Individualism .43 .02
Esteem .17 .22
Standardized coeffi-cient
Probability-value(one-sided)
Education .12 .12
Individualism .77 .001
table a13.3.Education, as affected by individualism and esteem.
table a13.4.Skills, as affected by education and individualism.
Figure 13.3 in Chapter 13 draws the essential results from a structural equations model which includes the above three linear models (with slightly different estimates) as well as the following linear model shown here in Table A13.5. Entrepreneurial activity is measured by TEA (Chapter 11), with each country’s mean across the years 2002-2011. Opportunities (and also individualism, skills and education) is measured as the coun-try’s mean across the years 2002-2011.
table a13.5.Entrepreneurship level, as affected by opportunities, education, skills and esteem.
Coefficient Standardized coefficient
Probability-value(one-tailed)
Opportunities 1.94 .18 .15
Education 2.06 .15 .21
Skills .31 .04 .43
Esteem .07 .01 .48
Constant - 5.23
Figure 13.4 in Chapter 13 plots the developed nations according to the predicted TEA, predicted from the coefficients in Table A13.5, and the TEA. More precisely, the vertical axis refers to entrepreneurial activity, as measured by TEA (each country’s mean across the years 2002-2011). The horizontal axis refers to the level of TEA predicted by the regression, with the coefficients in Table A13.5, using the expression,
Predicted TEA = – 5.23 + 1.94 Opportunities + 2.06 Education + .31 Skills + .07 Esteem

132 Entrepreneurial Work by Employees in Enterprises
– studied via Global Entrepreneurship Monitor in Denmark 2011
Aldrich, H. E., Martinez, M. A. (2001): “Many are Called, but Few are Chosen: An Evo-lutionary Perspective for the Study of Entrepreneurship” Entrepreneurship Theory and Practice, 25(4), pp. 41-56.
Allison, C. W., Chell, E., Hayes, J. (2000): “Intuition and Entrepreneurial Behavior” European Journal of work and Organizational Psychology, 9(1), pp. 31-43.
Arts, W., Gelissen, J. (2002): “The three worlds of welfare capitalism or more? A state-of-the-art report”. Journal of European Social Policy, 12(2), 137-158.
Aspalter, C. (2011): “The development of idea-typical welfare regime theory”. Interna-tional social work, 54(6), 735-750.
Bager, T., Nielsen, S.L. (eds.), (2009): ”Entreprenørskab og kompetencer”. Copenhagen, Børsens Forlag.
Bahn, S., Greco, S., Farsi, J., Rastrigina, O., Schøtt, T. (2011): “Entrepreneurs’ expected returns affected by their networks: a cross-national study using Global Entrepreneurship Monitor data.” Asia Pacific Journal of Innovation and Entrepreneurship, 5, 2:75-94.
Baumol, W. (1990): “Entrepreneurship: productive, unproductive and destructive”. Journal of Political Economy, 98(5), 893-921.
Borins, S.(2002): “Leadership and innovation in the public sector”, Leadership and Or-ganization Development Journal, 23(8), 467-476.
Bosma, N., Levie, J. (2010): “Global Entrepreneurship Monitor 2009 Executive Report”. GERA/GEM.
Bosma, N., Wenneker, S., Amorós, J.E. (2012): “GEM Global Report 2011” (extended version). GERA/GEM.
Chesbrough, H. (2003): “The era of open innovation”. Sloan Management Review Sum-mer: 35–41.
Christensen, J. (2005): ”Entrepreneurship i vidensamfundet”. Aarhus, Aarhus Univer-sitetsforlag.
Coduras, A., Levie, J., Kelley, D., Sæmundsson, R.J., Schøtt, T. (2010): “A Global Per-spective on Entrepreneurship Education and Training”. A Special Report of the Global Entrepreneurship Monitor.
bibliograPhy

133Entrepreneurial Work by Employees in Enterprises– studied via Global Entrepreneurship Monitor in Denmark 2011
Coser, R. L. (1975): “The complexity of roles as a seedbed of individual autonomy”, in L.A.Coser (ed.), The Idea of Social Structure (New York: Harcourt, Brace, Jovanovich): 237-263.
Currie, G., Humphreys, M., Ucbasaran, D., McManus, S. (2008): “Entrepreneurial lead-ership in the English public sector: Paradox or possibility?”. Public Administration, 86(4), 987-1008.
Danish Enterprise and Construction Authority. (2008): “2008 Entrepreneurship Index - Entrepreneurship Conditions in Denmark”. Copenhagen: Danish Enterprise and Con-struction Authority.
Danish Enterprise and Construction Authority. (2009): “2009 Entrepreneurship Index - Entrepreneurship Conditions in Denmark”. Copenhagen: Danish Enterprise and Con-struction Authority.
Danmarks Statistik, (2005): “Generel Erhvervsstatistik”. In Statistisk Årbog 2005, Co-penhagen, Danmarks Statistik: 255-278.
Dobbin, F., Boychuk, T. (1999): “National employment systems and job-autonomy: Why job-autonomy is high in Nordic countries and low in United States, Canada and Australia”. Organization Studies, 20(2), 257-292.
Dodgson, M., Gann, D., Slater, A. (2006), “The role of technology in the shift towards Open Innovation: the case of Procter and Gamble”, R&D Management 36(3), 333-346.
Drucker, P., (1985): “Innovation and Entrepreneurship: Practices and Principles”. Lon-don: Heinemann.
Eckhardt, J.T., Shane, S.A. (2003): “Opportunities and entrepreneurship”. Journal of Management, 29(3): 333-349.
Elfring, T. (2005): “Dispersed and focused corporate entrepreneurship: Ways to balance exploitation and exploration”. In Tom Elfring (ed.) Corporate Entrepreneurship and Venturing, Springer, 1-21.
Erhvervs- og Boligstyrelsen, (2002): ”De nye virksomheder – 4. statistiske portræt af iværksættere”. Copenhagen, Erhvervs- og Boligstyrelsen.
Erhvervs- og Byggestyrelsen, (2007): ”Iværksætterindeks 2007 – Vilkår for iværksæt-tere i Danmark”. Copenhagen, Erhvervs- og Byggestyrelsen. www.ebst.dk
Erhvervs- og Byggestyrelsen, (2008): ”Iværksætterindeks 2008 – Vilkår for iværksæt-tere i Danmark”. Copenhagen, Erhvervs- og Byggestyrelsen. www.ebst.dk

134 Entrepreneurial Work by Employees in Enterprises
– studied via Global Entrepreneurship Monitor in Denmark 2011
Erhvervs- og Byggestyrelsen. (2009): ”Iværksætterindeks 2009 – Vilkår for iværksættere i Danmark”. Copenhagen: Danish Enterprise and Construction Agency. www.ebst.dk
Erhvervs- og Byggestyrelsen. (2010): ”Iværksætterindeks 2010 – Vilkår for iværksættere i Danmark”. Copenhagen: Danish Enterprise and Construction Agency. www.ebst.dk
Erhvervs- og Byggestyrelsen. (2011): ”Iværksætterindeks 2011 – Vilkår for iværksættere i Danmark”. Copenhagen: Danish Enterprise and Construction Agency. www.ebst.dk
Esping-Andersen, G. (1991): “The three worlds of welfare capitalism”. Princeton, NJ: Princeton University Press
Eurostat, (2005): “Business demography in Europe – results from 1997 to 2002.” Statis-tics in Focus, vol. 36.
Feller, J., Finnegang, P., Nilsson, O. (2008): “Open innovation and public administra-tion: transformational typologies and business model impacts”, European Journal of Information Systems, 1-17.
Ferriani, S., Cattani, G., Baden-Fuller,C. (2009): “The relational antecedents of project-entrepreneurship: Network centrality, team composition and project performance”. Re-search Policy 38 :1545–1558.
Forbes, D. P. (2005): “Are Some Entrepreneurs More Overconfident Than Others”. Journal of Business Venturing, 20(5), pp. 623-640.
Fuglsang, L. (2008): “Capturing the benefits of open innovation in public innovation: a case study”. International Journal of Services Technology and Management, 9(3-4), 234-248.
GERA (Global Entrepreneurship Research Association). (2011): “Global Entrepreneur-ship Monitor’s“. (GEM) homepage. http://www.gemconsortium.org
Gilbert, B. A., McDougall, P. P. & Audretsch, D. B. (2006): “New Venture Growth: A Review and Extension”. Journal of Management, 32(6), pp. 926-949.
Greennes, T. (2003): “Scandinavian managers on Scandinavian management”. Interna-tional Journal of Value Based Management, 16(1), 9-21.
Hancock, M., Klyver, K., Bager, T. (2001): “Global Entrepreneurship Monitor, Danish National Executive Report – 2000”. Copenhagen, Erhvervsfremmestyrelsen.
Hancock, M., Bager, T. (2002): “Global Entrepreneurship Monitor, Danish National Executive Report – 2001”. Odense, Odense University Press.

135Entrepreneurial Work by Employees in Enterprises– studied via Global Entrepreneurship Monitor in Denmark 2011
Hancock, M. and T. Bager, (2003): “Global Entrepreneurship Monitor, Danish National Report – 2002”. Copenhagen, Børsens Forlag.
Hancock, M. and T. Bager (eds.), (2004): ”Global Entrepreneurship Monitor, Denmark 2003”. Copenhagen, Børsens Forlag.
Hart, D.M., (2003): “Entrepreneurship policy - What it is and where it came from.” In D. M. Hart (ed.) The emergence of entrepreneurship policy - Governance, start-ups, and growth in the U.S. knowledge economy, New York, Cambridge University Press: 3-19.
Hoffmann, A., Larsen L.B., Nellemann, P. and Michelsen, N.V. (2005): ”Quality Assess-ment of Entrepreneurship Indicators”. FORA Report vol. 14. Copenhagen, Ministry of Economics and Business Affairs’ Division for Economic and Business Research.
Hofstede, G. (1991): “Cultures and organizations. Software of the mind”. McGraw Hill.
Inglehart, R., Basanez, M., Moreno, A. (1998): “Human Values and Beliefs. A Cross-Cultural Sourcebook”. Ann Arbor: The University of Michigan Press.
Inglehart, R., and Welzel, C. (2005): “Modernization, Cultural Change and Democracy”. New York: Cambridge University Press.
Inglehart, R.: “World Values Survey”. < www.worldvaluessurvey.org >
Kearney, C., Hisrich, R.D., Roche, F. (2008): “A conceptual model of public sector corporate entrepreneurship”, International Entrepreneurship Management Journal, 4, 295-313.
Kearney, C., Hisrich, R.D, Roche, F. (2009): “Public and private sector entrepreneur-ship: Similarities, differences or a combination?”, Journal of Small Business and Enter-prise Development, 16(1), 26-46.
Keupp, M. M., Gassmann, O. (2009): “Determinants and archetype users of open in-novation”, R&D Management, 39(4), 331-341.
Kirzner, I. M. (1976): “The Economic Point of View: An Essay in the History of Eco-nomic Thought”. Kansas City, Sheed and Ward.
Klijn, E., Teisman, G.R. (2003): “Institutional and Strategic Barriers to Public—Private Partnership: An Analysis of Dutch Cases”, Public Money & Management, 23 (3), 137-46.
Lee, S.M., Peterson, S.J. (2000): “Culture, entrepreneurial orientation, and global com-petitiveness.” Journal of World Business, 35(4): 401-416.
Lundstrom, A., Stevenson, L. (2005): “Entrepreneurship policy: theory and practice”. New York, Springer.

136 Entrepreneurial Work by Employees in Enterprises
– studied via Global Entrepreneurship Monitor in Denmark 2011
Morrison, A. (2000): “Entrepreneurship: What triggers it?” International Journal of Entrepreneurial Behavior & Research, 6(2): 59-71.
Mueller, S.L., Thomas, A.S. (2000): “Culture and entrepreneurial potential: a nine country study of locus and control and innovativeness”. Journal of Business Venturing, 16(1): 51-75.
Munksgaard, K. B., Evald, M. R., Clarke. A. H. and Nielsen, S. L. (forthcoming): “Open Innovation in Public-Private Partnerships?”, Ledelse og Erhvervsøkonomi.
Nakata, C., Sivakumar, K. (1996): “National culture and new product development: an integrative review.” Journal of Marketing, 60(1): 61-72.
Nordic Council of Ministers. (2010): “Nordic Entrepreneurship Monitor”. Copenhagen: Nordic Council of Ministers.
OECD. (2008): “Entrepreneurship Review of Denmark”. Paris, OECD, Directorate for Science, Technology and Industry.
Perlitz, M., Seger, F. (2004): “European cultures and management styles”. International Journal of Asian Management, 1(3), 1-26.
Peterson, R.A. (1980): “Entrepreneurship and organization.” In Nystrom, P.C. and W. H. Starbuck (eds.) Handbook of organizational design, vol. 1, Oxford, Oxford Univer-sity Press.
Pfeffer, J., Salancik, G. (1978): “The External Control of Organizations”. New York: Harper & Row.
Pittaway L., et al. (2004): “Networking and Innovation: A Systematic Review of the Evidence”. International Journal of Management Reviews, 5-6, 3-4 : 137-168.
Porter, M. E. (1991): “Towards a dynamic theory of strategy”. Strategic Management Journal. 12: 95-117.
Powell, W., et al. (1996): “Inter-organizational collaboration and the locus of innovation: networks of learning in biotechnology”. Administrative Science Quarterly 15:88-102.
Reynolds, P., Bosma, N., Autio, E., Hunt, S., de Bono, N., Servais, I., Lopez-Garcia, P., Chin, N. (2005): “Global Entrepreneurship Monitor: Data collection design and imple-mentation 1998-2003.” Small Business Economics, 24: 205-231.
Rowe, P.A., Boyce, R.A., Boyle, M.V., O’Reilly, K. (2004): “A comparative analysis of entrepreneurial approaches within public health care organisations”, Research and Evaluation, 63(2), 16-30.

137Entrepreneurial Work by Employees in Enterprises– studied via Global Entrepreneurship Monitor in Denmark 2011
Sadler, R.J. (2000): “Corporate entrepreneurship in the Public Sector: The dance of the chameleon”, Research and Evaluation, 59(2), 25-43.
Sarasvathy, D., Simon, H., Lave, L. (1998): “Perceiving and Managing Business Risks: Differences Between Entrepreneurs and Bankers”. Journal of Economic Behavior and Organization, 33(2), pp. 207–225.
Schmidt, E. K. (2008): “Research management and policy: Incentives and obstacles to a better public-private interaction”, Research Management and Policy, 21(6), 623-636.
Schumpeter, J. A. (1934): “The Theory of Economic Development”.
Schøtt, T. (2005a): “Entrepreneurial activity in a country: index constructions”. http://www.sam.sdu.dk/~tsc/TEAnotat.doc
Schøtt, T. (2005b): “Iværksætterkulturen i Danmark og andre lande – analyse via Glob-al Entrepreneurship Monitor.” In Søgaard, V., S.G. Svendsen, S.B. Bruun og C. Høyer (eds.) Årsrapport 2004/2005 – Center for Småvirksomhedsforskning, Kolding, Univer-sity of Southern Denmark, Centre for Small Business Studies: 27-30.
Schøtt, T. (2005c): “Undervisning i iværksætteri i Danmark og i andre lande - analyse via Global Entrepreneurship Monitor.” In Søgaard, V., S.G. Svendsen, S.B. Bruun og C. Høyer (eds.) Årsrapport 2004/2005 – Center for Småvirksomhedsforskning, Kolding, University of Southern Denmark, Centre for Small Business Studies: 23-26.
Schøtt, T., Christensen, J. (2005d): “Iværksætteres kompetenceudvikling – kurser i Ve-jle Amt.” In V. Søgaard, S.G. Svendsen, S.B. Bruun and C. Høyer (eds.) Årsrapport 2004/2005 – Center for Småvirksomhedsforskning, Kolding, University of Southern Denmark, Centre for Small Business Studies: 31-38.
Schøtt, T. (2006a): ”Entrepreneurship in Denmark 2005 – studied via Global Entrepre-neurship Monitor”. Kolding, University of Southern Denmark, Centre for Small Busi-ness Studies.
Schøtt, T., Klyver, K. (2006b): “Markedet for råd – efterspørgslen fra iværksættere og udbuddet fra rådgivere.” In Bager, T., P.R. Christensen, H. Neergaard and S.G. Svendsen (eds.) Iværksætterrådgivning i Danmark, Copenhagen, Børsens Forlag: 67-76.
Schøtt, T. (2007a): “Entrepreneurship in the Regions in Denmark 2006 – studied via Global Entrepreneurship Monitor”. Kolding, University of Southern Denmark, Centre for Small Business Studies.
Schøtt, T., Jensen, K.W. (2007b): “Knopskydning i og omkring danske virksomheder – Fol-low-up på Global Entrepreneurship Monitor.” In T. Bager, M.R. Evald and C. Vintergaard (eds.) Iværksætterne og de etablerede virksomheder, Copenhagen, Børsens Forlag: 31-42.

138 Entrepreneurial Work by Employees in Enterprises
– studied via Global Entrepreneurship Monitor in Denmark 2011
Schøtt, T. (2008): “Growth-Entrepreneurship in Denmark 2007 - studied via Global Entrepreneurship Monitor”. Kolding, University of Southern Denmark, Center for En-trepreneurship and Small Business Studies.
Schøtt, T. (2009a): “Education, Training and Networking for Entrepreneurship in Den-mark 2008 – studied via Global Entrepreneurship Monitor”. Kolding: University of Southern Denmark, Centre for Entrepreneurship and Small Business Studies.
Schøtt, T., Jensen, K.W. (2009b): “The Coupling between Entrepreneurship and Public Policy: Tight in Developed Countries but Loose in Developing Countries.” Estudios de Economia, 35(2): 195-214.
Schøtt, T., Ottósson, H. (2009c): ”Entreprenørers træning i entreprenørskab: effekten på foretagsomhed” In Bager, T., and S.L. Nielsen (eds.) Entreprenørskab og kompe-tencer. Copenhagen: Børsens Forlag: 23-35.
Schøtt, T. (2010a): ”Modtagelighed for innovation i befolkningens hverdagsliv og arbe-jdsliv.” In P.V.Freytag, K.W.Jensen, K.Klyver and K.B.Munksgaard (eds.) Årsrapport 2010 - Center for Entreprenørskab og Småvirksomhedsforskning. Kolding: University of Southern Denmark, Centre for Small Business Studies: 31-39.
Schøtt, T. (2010b): “Social and Commercial Entrepreneurship in Denmark 2010 - stud-ied via Global Entrepreneurship Monitor”. Kolding: University of Southern Denmark.
Schøtt, T. (2010c): ”Socialt og kommercielt iværksætteri i Region Syddanmark”. CESFO Rapport. Kolding: University of Southern Denmark, Centre for Entrepreneurship and Small Business Studies.
Schøtt, T. (2011a): “Entrepreneurs’ networking and innovation: Comparisons among countries in Latin America”. Under peer review with the journal Academia, Revista Latinoamericana de Adminstración.
Schøtt, T. (2011b): “Entrepreneurs’ networking for knowledge: Colombia compared to rest of Latin America and to Denmark”. Under peer review with the journal Innovar.
Schøtt, T. (2011c): “Training and Network Organization in Entrepreneurship in Den-mark 2010”. Kolding: University of Southern Denmark.
Shane, S. (1992): “Why do some societies invent more than others?” Journal of Busi-ness Venturing, 7(1): 29-46.
Shane, S. (1993): “Cultural influences on national rates of innovation”. Journal of Busi-ness Venturing, 8(1): 59-73.

139Entrepreneurial Work by Employees in Enterprises– studied via Global Entrepreneurship Monitor in Denmark 2011
Shane, S. (2003): “A General Theory of Entrepreneurship: The Individual-opportunity Nexus”. Cheltenham, Edward Elgar.
Shuman, J., Twombly, J. (2009): “Collaborative Networks are the Organization, An In-novation in Organization Design and Management”. Volume 8 in White Paper Series.
Sixth Community Innovation Survey Questionnnaire. 2008. http://www.bis.gov.uk/assets/biscore/corporate/docs/c/cis6-2006-2008-questionnaire.pdf
Smallbone, D., Welter, F. (2001): “The role of government in SME development in tran-sition economies”. International Small Business Journal, 19(4): 63-77.
Storey, D. J. (1994): “Understanding the Small Business Sector”. Routledge.
Strangler, D. (2009): “The Economic Future just Happen”. Kauffman Foundation.
Sundbo, J. (1998): “The Theory of Innovation: Entrepreneurs, Technology and Strate-gy”. Mass, Edward Elgar.
Swedberg, R. (ed.). (2000): “Entrepreneurship: The Social Science View”. Oxford, Ox-ford University Press.
Sørensen, E, Torfing, J. (eds.) (2011):”Samarbejdsdrevet innovation i den offentlige sek-tor”. DJØF Forlag.
Taipali, S., Selander K., Anttila, T., Nätti, J. (2011): “Work engagement in eight Euro-pean countries: The role of job demands, autonomy and social support”. International Journal of Sociology and Social Policy, 3(7/8), 486-504.
Thomas, A.S., Mueller, S.L. (2000): “A case for comparative entrepreneurship: Assess-ing the relevance of culture.” Journal of International Business Studies, 31(2): 287-301.
Tiessen, J.H. (1997): “Individualism, collectivism and entrepreneurship: a framework for international comparative research.” Journal of Business Venturing, 12(5): 367-384.
van de Vrande, V., Lemmens, C. & Vanhaverbeke, W. (2006): “Choosing governance modes for external technology sourcing”, R & D Management, 36(3), 347-363.
Warhuus, J.P. (2000): ”Global Entrepreneurship Monitor – National vurdering af iværksætteraktivitet 1999”. Copenhagen, Erhvervsfremmestyrelsen.
Weber, Max. (1930): “The Protestant Ethic and the Spirit of Capitalism”. London, Allen and Unwin.

140 Entrepreneurial Work by Employees in Enterprises
– studied via Global Entrepreneurship Monitor in Denmark 2011
Wennekers, S., Van Stel, A., Thurik, R., Reynolds, P. (2005): “Nascent entrepreneur-ship and the level of economic development”, Small Business Economics, 24(3), pp. 293-309.
Wickham, P. (2006): “Strategic Entrepreneurship”. Pearson Education Limited.
Zali, M.R., Schøtt, T., Kordnaeij, A., Najafian, M. (2011): “Entrepreneurs’ networks af-fecting innovation: Firms in Iran and Denmark”. African Journal of Business Manage-ment.
Zhao,L., Aram, J.D. (1995): “Networking and growth of young technology-intensive ventures in China”. Journal of Business Venturing, 10, 5: 349-370.

141Entrepreneurial Work by Employees in Enterprises– studied via Global Entrepreneurship Monitor in Denmark 2011
national teams in global entrePreneurshiP monitor in 2011
Team
Inst
itutio
nN
atio
nal T
eam
Mem
bers
Fina
ncia
l Spo
nsor
sA
PS V
endo
rC
onta
ct
Alg
eria
CR
EAD
Abe
dou
Abd
erra
ham
ne
Bou
yaco
ub A
hmed
K
herb
achi
Ham
idC
herr
ad S
alah
Edd
ine
Setti
Zak
ia
Ger
man
Dev
elop
men
t Coo
pera
-tio
n (D
euts
che
Ges
ells
chaf
t fue
r In
tern
atio
nale
Zus
amm
enar
beit,
G
IZ)
a.ab
edou
@cr
ead.
edu.
dz
Arg
entin
aIA
E - B
usin
ess S
choo
lSi
lvia
Tor
res C
arbo
nell
Ara
nzaz
u Ec
heza
rret
aJu
an M
artin
Rod
rigue
zH
ecto
r Roc
ha
Ban
co S
anta
nder
Rio
B
ueno
s Aire
s City
Gov
ernm
ent
MO
RI A
rgen
tina
SCar
bone
ll@ia
e.ed
u.ar
Aus
tralia
Que
ensl
and
Uni
vers
ity o
f Te
chno
logy
Per D
avid
sson
Paul
Ste
ffens
Mic
hael
Stu
etze
r
Q&
A M
arke
t Res
earc
hpe
r.dav
idss
on@
qut.e
du.a
u
Ban
glad
esh
Inte
rnat
iona
l Isl
amic
Uni
vers
ity
Chi
ttago
ngM
oham
med
Sha
msu
l Kar
im
Sham
im U
ddin
Kha
nA
bul K
alam
Aza
dA
bbas
Ali
Kha
nSi
raju
ddow
la S
hahe
enSy
ed M
d. A
ther
S.M
. Sha
fiqul
Isla
mA
. J. M
. Nur
uddi
n C
how
hdur
yA
NM
Mes
hqua
t Udd
inM
. Tah
lil A
zim
Jerr
y N
icho
lson
Md.
Mus
harr
of H
ossa
inM
d. M
oazz
am H
usai
nM
ark
Har
t
USA
ID (U
nite
d St
ates
Age
ncy
Inte
rnat
iona
l Dev
elop
men
t)A
ston
Uni
vers
ity
Org
-Que
st R
esea
rch
Lim
ited
karim
ms@
asto
n.ac
.uk
; m
sham
sulk
arim
@ya
hoo.
com
Bar
bado
sTh
e C
ave
Hill
Sch
ool o
f B
usin
ess,
The
Uni
vers
ity o
f the
W
est I
ndie
s
Mar
jorie
Wha
rton
Don
ley
Car
ringt
on, P
hDJe
anni
ne C
omm
a, P
hDPa
ul P
ound
er, P
hD
Inte
rnat
iona
l Dev
elop
men
t R
esea
rch
Cen
tre (I
DR
C)
Syst
ems C
onsu
lting
Ltd
.m
arjo
rie.w
harto
n@ca
vehi
ll.uw
i.edu
Bel
gium
Vle
rick
Leuv
en G
ent M
anag
e-m
ent S
choo
lJa
n Le
pout
reM
athi
as C
obbe
nJa
cob
Verm
eire
STO
IO (F
lem
ish
Res
earc
h O
rgan
isat
ion
for E
ntre
pren
eur-
ship
and
Inte
rnat
iona
l Ent
repr
e-ne
ursh
ip)
EWI (
Dep
artm
ent o
f Eco
nom
y,
Scie
nce
and
Inno
vatio
n)
Ded
icat
ed R
esea
rch
jan.
lepo
utre
@vl
eric
k.co
m

142 Entrepreneurial Work by Employees in Enterprises
– studied via Global Entrepreneurship Monitor in Denmark 2011
Team
Inst
itutio
nN
atio
nal T
eam
Mem
bers
Fina
ncia
l Spo
nsor
sA
PS V
endo
rC
onta
ct
Bos
nia
&
Her
zego
vina
Cen
ter f
or E
ntre
pren
eurs
hip
Dev
elop
men
t Tu
zla
(in p
art-
ners
hip
with
Uni
vers
ity o
f Tu
zla)
Bah
rija
Um
ihan
ićR
asim
Tul
umov
ićM
irela
Arif
ović
Slađ
ana
Sim
ićA
ziz
Šunj
eSl
obod
an M
arko
vić
Zden
ko K
lepi
ćSe
lma
Polji
ć
Fede
ral M
inis
try o
f Dev
elop
-m
ent,
Entre
pren
eurs
hip
and
Cra
ftsM
inis
try o
f Dev
elop
men
t and
En
trepr
eneu
rshi
p of
Tuz
la
Can
ton
Mun
icip
ality
of T
uzla
IPSO
S d
.o.o
. Sar
ajev
oof
fice@
cerp
od-tu
zla.
org
Bra
zil
Insti
tuto
Bra
silei
ro d
a Q
ualid
ade
e Pr
odut
ivid
ade
(IBQ
P)Es
cola
de A
dmin
istra
ção
de
Empr
esas
de
São
Paul
o da
Fu
ndaç
ão G
etul
io V
arga
s –
FGV-
EAES
P
Sim
ara
Mar
ia d
e So
uza
Sive
ira
Gre
coC
ésar
Ris
sete
Edua
rdo
Cam
argo
Rig
hiEl
iane
Cor
deiro
de
Vasc
once
llos
Gar
cia
Dua
rteG
ilber
to S
arfa
tiJo
ana
Paul
a M
acha
doJú
lio C
ésar
Fel
ixLa
ura
Pans
arel
laM
arce
lo A
idar
Mar
io T
amad
a N
eto
Ren
e R
odrig
ues F
erna
ndes
Rom
eu H
erbe
rt Fr
iedl
aend
er Jr
.Ta
les A
ndre
assi
Serv
iço
Bra
sile
iro d
e Apo
io à
s M
icro
e P
eque
nas E
mpr
esas
- Se
brae
Serv
iço
Soci
al d
a In
dúst
ria -
SESI
- D
epar
tam
ento
Reg
iona
l do
Par
aná
Uni
vers
idad
e Fe
dera
l do
Para
ná
- UFP
R
Inst
ituto
de
Tecn
olog
ia d
o Pa
raná
- Te
cpar
Esco
la d
e Adm
inis
traçã
o de
Em
pres
as d
e Sã
o Pa
ulo
da
Fund
ação
Get
ulio
Var
gas
– FG
V-EA
ESP
Bon
ilha
Com
unic
ação
e
Mar
ketin
g S/
C L
tda.
Bon
ilha
Pesq
uisa
sim
ara@
ibqp
.org
.br
Chi
leU
nive
rsid
ad d
el D
esar
rollo
José
Ern
esto
Am
orós
C
arlo
s Pob
lete
Car
los A
lbor
noz
Gia
nni R
oman
i
Inno
vaC
hile
Cor
foSO
FOFA
(Fed
erat
ion
of C
hile
an
Indu
stry
)En
deav
or C
hile
Opi
na S
.A.
eam
oros
@ud
d.cl
Chi
naTs
ingh
ua U
nive
rsity
Gao
Jian
Qin
Lan
Jian
g Ya
nfu
Che
ng Y
uan
Li X
ibao
Scho
ol o
f Eco
nom
ics a
nd
Man
agem
ent,T
sing
hua
Uni
ver-
sity
SIN
OTR
UST
Inte
rnat
iona
l In
form
atio
n &
Con
sulti
ng
(Bei
jing)
Co.
, Ltd
.
gaoj
@se
m.ts
ingh
ua.e
du.c
n
National teams in Global Entrepreneurship Monitor in 2011

143Entrepreneurial Work by Employees in Enterprises– studied via Global Entrepreneurship Monitor in Denmark 2011
Team
Inst
itutio
nN
atio
nal T
eam
Mem
bers
Fina
ncia
l Spo
nsor
sA
PS V
endo
rC
onta
ct
Col
ombi
aPo
ntifi
cia
Uni
vers
idad
Jave
riana
Ca
liU
nive
rsid
ad d
el N
orte
Uni
vers
idad
Ices
iU
nive
rsid
ad d
e lo
s And
es
Fern
ando
Per
eira
Fa
bian
Oso
rioA
lber
to A
rias
Liyi
s Góm
ez N
úñez
Ph.
DPi
edad
Mar
tínez
Car
azo
Ph.D
Cés
ar F
igue
roa
Soca
rrás
Rod
rigo
Vare
la V
illeg
as P
h.D
Luis
Mig
uel Á
lvar
ez V
aneg
asJu
an D
avid
Sol
er L
ibre
ros
Raú
l Fer
nand
o Q
uiro
ga M
arín
Raf
ael A
ugus
to V
esga
Faj
ardo
Dia
na C
arol
ina
Vesg
a
Cen
tro N
acio
nal d
e C
onsu
ltoría
fper
eira
@ja
veria
naca
li.ed
u.co
rvar
ela@
ices
i.edu
.co
lalv
arez
@ic
esi.e
du.c
ojd
sole
r@ic
esi.e
du.c
o
Cro
atia
J.J. S
tross
may
er U
nive
rsity
O
sije
k, F
acul
ty o
f Eco
nom
ics
Slav
ica
Sing
erN
atas
a Sa
rlija
Sanj
a Pf
eife
rSu
ncic
a O
berm
an P
eter
kaD
jula
Bor
ozan
Min
istry
of E
cono
my,
Lab
our
and
Entre
pren
eurs
hip
J.J. S
tross
may
er U
nive
rsity
O
sije
k, F
acul
ty o
f Eco
nom
ics
CEP
OR
- SM
Es a
nd E
ntre
pre-
neur
ship
Pol
icy
Cen
ter,
Zagr
eb
Puls
d.o
.o.,
Zagr
ebsi
nger
@ef
os.h
r
Cze
ch
Rep
ublic
Uni
vers
ity o
f Eco
nom
ics,
Prag
ueM
artin
Luk
esM
artin
a Ja
klM
inis
try o
f Ind
ustry
and
Tra
deFa
ctum
Inve
nio
luke
sm@
vse.
czm
artin
a.ja
kl@
vse.
cz
Den
mar
kU
nive
rsity
of S
outh
ern
Den
mar
kTh
omas
Sch
øtt
Torb
en B
ager
Poul
Rin
d C
hris
tens
enK
im K
lyve
rA
nn H
. Cla
rke
Maj
britt
Ros
tgår
d Ev
ald
Ken
t Wic
kstrø
m Je
nsen
Jesp
er P
ihl
Kris
tin B
. Mun
ksgå
rdH
eidi
R. N
iels
enM
ette
S. N
iels
enPi
a S.
Nie
lsen
Mah
dokh
t Sed
agha
tM
oham
mad
Rez
a Za
li
Jona
than
Lev
ie
M
ick
Han
cock
Shah
amak
Rez
ai
Indu
strie
ns F
ond,
Dan
ish
Indu
stry
Fou
ndat
ion
Cap
acen
t Epi
nion
tsc@
sam
.sdu.
dk
Finl
and
Turk
u Sc
hool
of E
cono
mic
s, U
nive
rsity
of T
urku
Ann
e K
oval
aine
nJa
rna
Hei
none
nTo
mm
i Puk
kine
nPe
kka
Sten
holm
Min
istry
of E
mpl
oym
ent a
nd th
e Ec
onom
yTu
rku
Scho
ol o
f Eco
nom
ics
Talo
ustu
tkim
us O
yan
ne.k
oval
aine
n@ut
u.fi
National teams in Global Entrepreneurship Monitor in 2011

144 Entrepreneurial Work by Employees in Enterprises
– studied via Global Entrepreneurship Monitor in Denmark 2011
Team
Inst
itutio
nN
atio
nal T
eam
Mem
bers
Fina
ncia
l Spo
nsor
sA
PS V
endo
rC
onta
ct
Fran
ceEM
LYO
N B
usin
ess S
choo
lA
lain
Fay
olle
Dan
ielle
Rou
sson
Cai
sse
des D
epot
sC
SAro
usso
n@em
-lyon
.com
Ger
man
yLe
ibni
z U
nive
rsitä
t Han
nove
rIn
stitu
te fo
r Em
ploy
men
t R
esea
rch
(IA
B) o
f the
Ger
man
Fe
dera
l Em
ploy
men
t Age
ncy
(BA
)
Rol
f Ste
rnbe
rgU
do B
rixy
Arn
e Vo
rder
wül
beck
e
Inst
itut f
ür A
rbei
tsm
arkt
- und
B
eruf
sfor
schu
ng (I
AB
)In
stitu
t für
Wirt
scha
fts- u
nd
Kul
turg
eogr
aphi
e, L
eibn
iz
Uni
vers
ität H
anno
ver
Zent
rum
fuer
Eva
luat
ion
und
Met
hode
n (Z
EM),
Bon
nst
ernb
erg@
wig
eo.u
ni-h
anno
ver.d
e
Gre
ece
Foun
datio
n fo
r Eco
nom
ic &
In
dust
rial R
esea
rch
(IO
BE)
Stav
ros I
oann
ides
Agg
elos
Tsa
kani
kas
Stel
ina
Cha
tzic
hris
tou
Nat
iona
l Ban
k of
Gre
ece
Dat
apow
er S
Aio
anni
des@
iobe
.gr
Gua
tem
ala
Uni
vers
idad
Fra
ncis
co M
arro
-qu
inH
ugo
Maú
lJa
ime
Dia
zIr
ene
Flor
esD
avid
Cas
asol
aM
ónic
a de
Zel
aya
Lisa
rdo
Bol
años
Uni
vers
idad
Fra
ncis
co M
arro
-qu
inK
hant
i, S.
A.
rmau
l@uf
m.e
du
Hun
gary
Uni
vers
ity o
f Péc
s Fac
ulty
of
Bus
ines
s and
Eco
nom
ics
Lász
ló S
zerb
Józs
ef U
lber
tA
ttila
Var
gaG
ábor
Már
kus
Atti
la P
ethe
őD
ietri
ch P
éter
,Zo
ltán
J. Á
csTe
rjese
n Si
riSa
ul E
strin
Rut
a Aid
is
OTK
A R
esea
rch
Foun
datio
n Th
eme
num
ber K
815
27
Regi
onal
Stu
dies
PhD
Pro
-gr
amm
e, U
nive
rsity
of P
écs
Facu
lty o
f Bus
ines
and
Econ
omic
sBu
sines
s Adm
inist
ratio
n Ph
D
Prog
ram
me,
Uni
vers
ity o
f Péc
s Fa
culty
of B
usin
es an
d Ec
onom
ics
Man
agem
ent a
nd B
usin
ess
Adm
inis
tratio
n Ph
D P
rogr
amm
e of
the
Cor
vinu
s Uni
vers
ity o
f B
udap
est
Star
t Tők
egar
anci
a Zr
t
Szoc
io-G
ráf P
iac-
és K
öz-
véle
mén
y-ku
tató
In
téze
t
szer
b@kt
k.pt
e.hu
Iran
Uni
vers
ity o
f Teh
ran
Abb
as B
azar
gan
Nez
amed
din
Fagh
ieh
Ali
.Akb
ar M
oosa
vi-M
ovah
edi
Leyl
a Sa
rafr
azA
sado
lah
kor
drna
eij
Jaha
ngir
Yado
llahi
Far
siM
ahm
od A
ham
adpo
ur D
arya
niS.
Mos
tafa
Raz
avi
Moh
amm
ad R
eza
Zali
Moh
amm
ad R
eza
Sepe
hri
Ali
Rez
aean
Iran
s M
inis
try o
f Lab
our a
nd
Soci
al A
ffairs
, Ira
n’s L
abou
r and
So
cial
Sec
urity
Inst
itute
(LSS
I)
abaz
arga
@ut
.ac.
ir
National teams in Global Entrepreneurship Monitor in 2011

145Entrepreneurial Work by Employees in Enterprises– studied via Global Entrepreneurship Monitor in Denmark 2011
Team
Inst
itutio
nN
atio
nal T
eam
Mem
bers
Fina
ncia
l Spo
nsor
sA
PS V
endo
rC
onta
ct
Irel
and
Fitz
sim
ons C
onsu
lting
Dub
lin C
ity U
nive
rsity
Bus
i-ne
ss S
choo
l
Paul
a Fi
tzsi
mon
sC
olm
O’G
orm
anEn
terp
rise
Irel
and
Forf
asIF
Fpa
ula@
fitzs
imon
s-co
nsul
ting.
com
Jam
aica
Uni
vers
ity o
f Tec
hnol
ogy,
Ja
mai
caG
irjan
auth
Boo
draj
, Ph.
D.
Patri
ce F
arqu
hars
onM
auva
lyn
Bow
en, P
h.D
.Va
netta
Ske
ete
Reg
inal
d N
ugen
tH
orac
e W
illia
ms,
D.B
.A.
Joan
Law
laO
rvill
e R
eid
IDR
C (I
nter
natio
nal D
evel
op-
men
t Res
earc
h C
entre
)U
nive
rsity
of T
echn
olog
y,
Jam
aica
KO
CI M
arke
t Res
earc
h an
d D
ata
Min
ing
Serv
ices
gboo
draj
@gm
ail.c
om
Japa
nK
eio
Uni
vers
ityTa
kehi
ko Is
obe
Soci
al S
urve
y R
esea
rch
Info
rmat
ion
Co.
,Ltd
(SSR
I)
isob
e@kb
s.kei
o.ac
.jp
Kor
eaG
yeon
gnam
Nat
iona
l Uni
ver-
sity
of S
cien
ce a
nd T
echn
olog
y (G
nTec
h)
Sung
-sik
Bah
nSa
nggu
Seo
Kyu
ng-M
o So
ngD
ong-
hw
an C
hoJo
ng-h
ae P
ark
Min
-Seo
k C
ha
Smal
l and
Med
ium
Bus
ines
s A
dmin
istra
tion(
SMB
A)
Kum
woo
Indu
stria
l Mac
hine
ry,
Co.
Han
aro
Tech
Co.
, Ltd
. K
orea
Aer
ospa
ce In
dust
ries,
Ltd
(KA
I)
Taew
an C
o., L
td.
Han
kook
Res
earc
h C
oss
bahn
@gn
tech
.ac.
kr
Latv
iaTh
e Te
liaSo
nera
Inst
itute
at t
he
Stoc
khol
m S
choo
l of E
cono
m-
ics i
n R
iga
Olg
a R
astri
gina
Mar
ija K
rum
ina
Vyac
hesl
av D
ombr
ovsk
y A
nder
s Paa
lzow
Alf
Vana
gs
Telia
Sone
ra A
BSK
DS
olga
@bi
ceps
.org
Lith
uani
aIn
tern
atio
nal B
usin
ess S
choo
l at
Viln
ius U
nive
rsity
Min
daug
as L
auzi
kas
Erik
a Va
igin
iene
Ais
te M
iliut
eV
ikin
ta R
osin
aite
Skai
ste
Bat
ulev
iciu
te
Inte
rnat
iona
l bus
ines
s sch
ool a
t V
ilniu
s uni
vers
ityEn
terp
rise
Lith
uani
aLi
thua
nian
Min
istry
of E
cono
my
min
daug
as.la
uzik
as@
gmai
l.com
Mal
aysi
aU
nive
rsiti
Tun
Abd
ul R
azak
Siri
Rol
and
Xav
ier
Leila
nie
BT
Moh
d N
orM
ohar
Bin
Yus
ofD
ewi A
mat
Sap
uan
Noo
rseh
a B
inti
Ayob
Moh
d H
anif
bin
Moh
d H
elm
i.
Uni
vers
iti T
un A
bdul
Raz
akR
ehan
stat
rola
nd@
unira
zak.
edu.
my;
xs
rola
nd@
gmai
l.com
National teams in Global Entrepreneurship Monitor in 2011

146 Entrepreneurial Work by Employees in Enterprises
– studied via Global Entrepreneurship Monitor in Denmark 2011
Team
Inst
itutio
nN
atio
nal T
eam
Mem
bers
Fina
ncia
l Spo
nsor
sA
PS V
endo
rC
onta
ct
Mex
ico
Tecn
ológ
ico
de M
onte
rrey
Mar
io A
driá
n Fl
ores
M
arci
a C
ampo
sEl
vira
Nar
anjo
Nat
zin
Lópe
z
Tecn
ológ
ico
de M
onte
rrey
C
ampu
s Leó
nR
ecto
ría d
e Es
cuel
as N
acio
nale
s de
Pos
grad
o EG
AD
E B
usin
ess
Scho
ol y
EG
AP
Ald
unci
n y
Aso
ciad
osad
rian.
flore
s@ite
sm.m
x
Net
herla
nds
EIM
Bus
ines
s & P
olic
y R
e-se
arch
Jola
nda
Hes
sels
Pete
r van
der
Zw
an
Sand
er W
enne
kers
And
ré v
an S
tel
Roy
Thu
rikPh
ilipp
Koe
lling
erIn
grid
Ver
heul
Nie
ls B
osm
a
Min
istry
of E
cono
mic
Affa
irs,
Agr
icul
ture
and
Inno
vatio
nSt
ratu
sjo
h@ei
m.n
l
Nig
eria
TOM
EB F
ound
atio
n fo
r Su
stai
nabi
lity
& Y
outh
Dev
el-
opm
ent
Bus
ines
s Sch
ool N
ethe
rland
s N
iger
ia
Rilw
an A
derin
toTu
nde
Popo
ola
Luqm
an O
lato
kunb
o O
bile
yeA
buba
kar S
adiq
Kas
umLe
re B
aale
USA
ID (U
nite
d St
ates
Age
ncy
Inte
rnat
iona
l Dev
elop
men
t)TO
MEB
Fou
ndat
ion
for S
us-
tain
abili
ty &
You
th D
evel
op-
men
tM
arke
tSig
ht C
onsu
ltanc
y Li
mite
dB
usin
ess S
choo
l Net
herla
nds
Nig
eria
grad
erin
to@
yaho
o.co
.uk
Nor
way
Bod
ø G
radu
ate
Scho
ol o
f B
usin
ess
Erle
nd B
ullv
ågLa
rs K
olve
reid
Bjø
rn W
illy
Åm
oEi
rik P
eder
sen
Inno
vatio
n N
orw
ayM
inis
try o
f Ind
ustry
and
Tra
deB
odø
Inno
vatio
n C
ente
rB
odø
Gra
duat
e Sc
hool
of
Bus
ines
s
Pola
rfak
taer
lend
.bul
lvaa
g@ui
n.no
Paki
stan
Cen
ter f
or E
ntre
pren
euria
l D
evel
opm
ent,
IBA
, Kar
achi
Sarf
raz A
. Mia
n
Zafa
r A. S
iddi
qui
M. S
hahi
d Q
ures
hiSh
ahid
R. M
irM
oeid
Sul
tan
Inst
itute
of B
usin
ess A
dmin
is-
tratio
n (I
BA
), K
arac
hiU
S A
genc
y fo
r Int
erna
tiona
l D
evel
opm
ent
Oas
is In
tern
atio
nal
sarf
raz.
mia
n@os
weg
o.ed
u
Pale
stin
eM
AS
Inst
itute
Sam
ir A
bdul
lah
Yous
ef D
aoud
Tare
q Sa
deq
Ala
a Ta
rtir
Muh
anad
Ham
edIb
rahi
m S
hika
ki
Inte
rnat
iona
l Dev
elop
men
t R
esea
rch
Cen
tre- I
DR
CTh
e Ara
b Fu
nd fo
r Eco
nom
ic &
So
cial
Dev
elop
men
t (A
FESD
)
The
Pale
stin
e C
entra
l Bur
eau
of S
tatis
tics (
PCB
S)sa
bdul
lah@
pal-e
con.
org;
sa
bdul
lah@
MA
S.ps
National teams in Global Entrepreneurship Monitor in 2011

147Entrepreneurial Work by Employees in Enterprises– studied via Global Entrepreneurship Monitor in Denmark 2011
Team
Inst
itutio
nN
atio
nal T
eam
Mem
bers
Fina
ncia
l Spo
nsor
sA
PS V
endo
rC
onta
ct
Pana
ma
Inst
ituto
de
Estu
dios
Sup
erio
res
de A
dmin
istra
ción
(IES
A)
Pana
ma
and
City
of K
now
ledg
e Fo
unda
tion
Fede
rico
Fern
ánde
z D
upou
yM
anue
l Lor
enzo
And
rés L
eón
Man
uel A
rroc
ha
The A
utho
rity
of th
e M
i-cr
o, S
mal
l and
Med
ium
Ent
er-
pris
es
IPSO
S
IPSO
Sfe
deric
o.fe
rnan
dez@
iesa
.edu
.pa
mlo
renz
o@cd
span
ama.
org
Peru
Uni
vers
idad
ESA
NJa
ime
Serid
aO
swal
do M
oral
esK
eiko
Nak
amat
su
Uni
vers
idad
ESA
N’s
Cen
ter f
or
Entre
pren
eurs
hip
Imas
enjs
erid
a@es
an.e
du.p
e
Pola
ndU
nive
rsity
of E
cono
mic
s in
Kat
owic
ePr
zem
ysła
w Z
bier
owsk
iA
nna
Tarn
awa
Paul
ina
Zadu
ra-L
icho
taD
orot
a W
ęcła
wsk
aM
ariu
sz B
ratn
icki
Woj
ciec
h D
yduc
hB
artło
mie
j J. G
abry
śR
afał
Koz
łow
ski
Izab
ella
Koz
łow
ska
Joan
na P
ach
Iwon
a K
araś
Polis
h A
genc
y fo
r Ent
erpr
ise
Dev
elop
men
tU
nive
rsity
of E
cono
mic
s in
Kat
owic
e
prze
mek
@zb
iero
wsk
i.pl
anna
_tar
naw
a@pa
rp.g
ov.p
l
Portu
gal
Soci
edad
e Po
rtugu
esa
e In
o-va
ção
(SPI
) IS
CTE
- In
stitu
to U
nive
rsitá
rio
de L
isbo
a (I
SCTE
-IU
L)
Aug
usto
Med
ina
Luís
Ret
oA
ntón
io C
aeta
no
Nel
son
Ram
alho
Dou
glas
Tho
mps
onR
ui M
onte
iroJo
ão R
odrig
ues
Nun
o G
onça
lves
Ana
Rib
eiro
ISC
TE -
Inst
ituto
Uni
vers
itário
de
Lis
boa
(ISC
TE-I
UL)
GfK
Met
ris (M
etris
–
Mét
odos
de
Rec
olha
e
Inve
stig
ação
Soc
ial,
S.A
.)
doug
last
hom
pson
@sp
i.pt
Rom
ania
Bab
eș-B
olya
i Uni
vers
ity,
Facu
lty o
f Eco
nom
ics a
nd
Bus
ines
s Adm
inis
tratio
n
Tünd
e Pe
tra P
etru
Ann
amár
ia B
enyo
vszk
iÁ
gnes
Nag
yIs
tván
Pet
eLe
hel G
yörf
yD
umitr
u M
atiș
Leve
nte
Szás
zEu
geni
a M
atiș
Bab
eș-B
olya
i Uni
vers
ity o
f C
luj-N
apoc
aO
TP B
ank
Rom
ania
Aso
ciaș
ia P
ro O
econ
omic
a
Met
ro M
edia
Tra
nsilv
ania
petra
.pet
ru@
econ
.ubb
cluj
.ro;
petru
tpet
ra@
yaho
o.co
m
National teams in Global Entrepreneurship Monitor in 2011

148 Entrepreneurial Work by Employees in Enterprises
– studied via Global Entrepreneurship Monitor in Denmark 2011
Team
Inst
itutio
nN
atio
nal T
eam
Mem
bers
Fina
ncia
l Spo
nsor
sA
PS V
endo
rC
onta
ct
Rus
sia
Stat
e U
nive
rsity
- H
ighe
r Sc
hool
of E
cono
mic
s Sa
int P
eter
sbur
g U
nive
rsity
- G
radu
ate
Scho
ol o
f Man
age-
men
t
Che
pure
nko
Ale
xand
erO
braz
tsov
a O
lga
Alim
ova
Tatia
naG
abel
ko M
aria
Mur
zach
eva
Ekat
erin
aPo
povs
kaya
Eka
terin
aVe
rkho
vska
ya O
lga
Dor
okhi
na M
aria
Shiro
kova
Gal
ina
Stat
e U
nive
rsity
- H
ighe
r Sch
ool
of E
cono
mic
sSa
int P
eter
sbur
g U
nive
rsity
- G
radu
ate
Scho
ol o
f Man
age-
men
t
Leva
da-C
ente
rac
hepu
renk
o@hs
e.ru
Sing
apor
eN
anya
ng T
echn
olog
ical
Uni
ver-
sity
Ho
Moo
n-H
o R
ingo
O
lexa
nder
Che
rnys
henk
o C
han
Kim
Yin
A
lex
Lin
Ros
a K
ang
LAI Y
oke Y
ong
Olw
en B
edfo
rdJo
nath
an P
han
Nan
yang
Tec
hnol
ogic
al U
nive
r-si
tyN
TU V
entu
res P
te L
td
hom
h@nt
u.ed
u.sg
Slov
akia
Com
eniu
s Uni
vers
ity in
Bra
tis-
lava
, Fac
ulty
of M
anag
emen
tA
nna
Pilk
ova
Zuza
na K
ovac
icov
aM
aria
Boh
dalo
vaM
aria
n H
olie
nka
Jan
Reh
akJo
zef K
omor
nik
Pete
r Sta
rcho
n
Com
eniu
s Uni
vers
ity in
Bra
tis-
lava
, Fac
ulty
of M
anag
emen
tN
atio
nal A
genc
y fo
r Dev
elop
-m
ent o
f Sm
all a
nd M
ediu
m
Ente
rpris
esC
entra
l Eur
opea
n Fo
unda
tion
Ipso
s Tam
bor S
R, s
pol.
s r. o
.w
ww
.ipso
s.sk
anna
.pilk
ova@
gmai
l.com
Slov
enia
Uni
vers
ity o
f Mar
ibor
, Fac
ulty
of
Eco
nom
ics a
nd B
usin
ess
Miro
slav
Reb
erni
kPo
lona
Tom
inc
Kat
ja C
rnog
aj
Min
istry
of E
cono
my
Slov
enia
n R
esea
rch
Age
ncy
Fina
nce
- Slo
veni
an B
usin
ess
Dai
ly
RM
PLU
Sre
bern
ik@
uni-m
b.si
Sout
h A
fric
aTh
e U
CT
Cen
tre fo
r Inn
ovat
ion
and
Entre
pren
eurs
hip,
Gra
duat
e Sc
hool
of B
usin
ess,
Uni
vers
ity
of C
ape
Tow
n
Mik
e H
errin
gton
Jacq
ui K
ewM
irand
a Si
mrie
Swis
s Sou
th A
fric
an C
oope
ra-
tion
Initi
ativ
e (S
SAC
I)So
uth
Afr
ican
Bre
wer
ies (
SAB
)Sm
all E
nter
pris
e de
velo
pmen
t A
genc
y (S
EDA
)
Nie
lsen
Sou
th A
fric
am
ike.
herr
ingt
on@
gsb.
uct.a
c.za
National teams in Global Entrepreneurship Monitor in 2011

149Entrepreneurial Work by Employees in Enterprises– studied via Global Entrepreneurship Monitor in Denmark 2011
Team
Inst
itutio
nN
atio
nal T
eam
Mem
bers
Fina
ncia
l Spo
nsor
sA
PS V
endo
rC
onta
ct
Spai
nFu
ndac
ión
Xav
ier d
e Sa
las
Uni
vers
idad
de
Extre
mad
ura
Uni
vers
idad
Aut
ónom
a de
M
adrid
Uni
vers
idad
Aut
ónom
a de
B
arce
lona
Uni
vers
idad
Mig
uel H
erná
ndez
Inst
ituto
Vas
co d
e C
ompe
titiv
i-da
d O
rkes
traU
nive
rsid
ad d
e M
urci
aC
onfe
dera
ción
de
Empr
esar
ios
de G
alic
iaU
nive
rsid
ad d
e C
anta
bria
Uni
vers
idad
de
Nav
arra
/Se
rvic
io N
avar
ro d
e Em
pleo
Uni
vers
idad
de
Zara
goza
Uni
vers
idad
de
Las P
alm
as d
e G
ran
Can
aria
Alic
ia C
odur
asR
icar
do H
erná
ndez
Ju
an C
arlo
s Día
zIs
idro
de
Pabl
oYa
ncy
Vaill
ant
José
Mª G
ómez
Iñak
i Peñ
aA
nton
io A
ragó
nA
race
li de
Luc
asF.
Javi
er M
artín
ezM
artín
Lar
raza
Luci
o Fu
ente
lsaz
Ros
a M
ª Bat
ista
Fund
ació
n X
avie
r de
Sala
sG
EM E
spañ
aIn
stitu
to O
pinò
met
re S
.L.
alic
ia.c
odur
as@
ie.e
du
Swed
enSw
edis
h En
trepr
eneu
rshi
p Fo
rum
Pont
us B
raun
erhj
elm
Per T
hulin
Kris
tina
Nys
tröm
Car
in H
olm
quis
tU
lrika
Stu
art H
amilt
on
Vin
nova
Con
fede
ratio
n of
Sw
edis
h En
ter-
pris
e
DEM
OSK
OP
pont
us.b
raun
erhj
elm
@en
trepr
enor
-sk
apsf
orum
.se
Switz
erla
ndSc
hool
of B
usin
ess A
dmin
istra
-tio
n (H
EG-F
R) F
ribou
rgR
ico
Bal
degg
er
And
reas
Brü
lhar
t Ph
ilipp
Bub
enze
r Sa
bine
Fris
chkn
echt
Th
omas
Stra
ubFr
edrik
Hac
klin
Alb
erto
n Si
egfr
ied
Pasc
al W
ild
Kom
mis
sion
für T
echn
olog
ie
und
Inno
vatio
n K
TI /
CTI
H
EG H
aute
Eco
le d
e G
estio
n Fr
ibou
rg (H
EG-F
R)
gfs B
ern
rico.
bald
egge
r@he
fr.ch
Taiw
anN
atio
nal C
heng
chi U
nive
rsity
Chi
na Y
outh
Car
eer D
evel
op-
men
t Ass
ocia
tion
Hea
dqua
rtere
(C
YC
DA
)
Cha
o-Tu
ng W
enC
hang
-Yun
g Li
uSu
-Lee
Tsa
iYu
-Tin
g C
heng
Yi-W
en C
hen
Ru-
Mei
Hsi
ehC
hung
-Min
Lo
Shih
-Fen
g C
hou
Smal
l and
Med
ium
Ent
erpr
ise
Adm
inis
tratio
n, M
inis
try o
f Ec
onom
ic A
ffairs
NC
CU
Sur
vey
Cen
ter
jtwen
@nc
cu.e
du.tw
National teams in Global Entrepreneurship Monitor in 2011

150 Entrepreneurial Work by Employees in Enterprises
– studied via Global Entrepreneurship Monitor in Denmark 2011
Team
Inst
itutio
nN
atio
nal T
eam
Mem
bers
Fina
ncia
l Spo
nsor
sA
PS V
endo
rC
onta
ct
Thai
land
Ban
gkok
Uni
vers
ity (C
EDI -
C
reat
ive
Entre
pren
eurs
hip
Dev
elop
men
t Ins
titut
e)
Pich
it A
krat
hit
Kos
on S
appr
aser
tN
avap
hol V
iriya
kunk
itV
icha
te T
antiw
anic
hLu
ckxa
wan
Pim
saw
adi
Veer
apon
g M
alai
Yupa
na W
iwat
tana
kant
ang
Sarn
Aks
aran
ugra
ha
Ban
gkok
Uni
vers
ityTN
S R
esea
rch
Inte
rnat
iona
l Th
aila
ndko
ssa5
09@
gmai
l.com
sarn
33@
gmai
l.com
Trin
idad
and
To
bago
Arth
ur L
ok Ja
ck G
radu
ate
Scho
ol o
f Bus
ines
s, U
nive
rsity
of
the
Wes
t Ind
ies
Mig
uel C
arril
lo
Col
in M
cDon
ald
Abh
ijit B
hatta
char
yaJa
n Jo
seph
Inte
rnat
iona
l Dev
elop
men
t R
esea
rch
Cen
tre (I
DR
C)
m.c
arril
lo@
gsb.
tt
Turk
eyYe
dite
pe U
nive
rsity
Smal
l and
Med
ium
Dev
elop
-m
ent O
rgan
izat
ion
(KO
SGEB
)
Esra
Kar
aden
izYe
dite
pe U
nive
rsity
Smal
l and
Med
ium
Dev
elop
-m
ent O
rgan
izat
ion
(KO
SGEB
)
Aka
dem
etre
ekar
aden
iz@
yedi
tepe
.edu
.tr
UA
EIn
stitu
te fo
r Soc
ial &
Eco
nom
ic
Res
earc
h - Z
ayed
Uni
vers
ityM
ouaw
iya A
l Aw
adC
onst
ance
Van
Hor
neV
icto
r Hua
ng
Kha
lfa F
und
for E
nter
pris
e D
evel
opm
ent -
Abu
Dha
bi
- UA
E
mou
awiy
a.al
awad
@zu
.ac.
ae
Uni
ted
Kin
gdom
Ast
on B
usin
ess S
choo
lM
ark
Har
tJo
nath
an L
evie
Mic
hael
Any
adik
e-D
anes
Yass
er A
hmad
Bha
ttiA
loña
Mar
tiare
na A
rriz
abal
aga
Moh
amm
ed K
arim
Erkk
o A
utio
Liz
Bla
ckfo
rdM
oham
med
Sha
msu
l Kar
im
Dep
artm
ent f
or B
usin
ess,
Inno
vatio
n an
d Sk
ills
PRIM
E (T
he P
rince
’s In
itiat
ive
for M
atur
e En
terp
rise)
Wel
sh A
ssem
bly
Gov
erm
ent
Inve
st N
orth
ern
Irel
and
Hun
ter C
entre
for E
ntre
pren
eur-
ship
, Stra
thcl
yde
Uni
vers
ityEn
terp
rise
UK
Birm
ingh
am C
ity C
ounc
il
IFF
Res
earc
h Lt
dm
ark.
hart@
asto
n.ac
.uk
National teams in Global Entrepreneurship Monitor in 2011

151Entrepreneurial Work by Employees in Enterprises– studied via Global Entrepreneurship Monitor in Denmark 2011
National teams in Global Entrepreneurship Monitor in 2011
Team
Inst
itutio
nN
atio
nal T
eam
Mem
bers
Fina
ncia
l Spo
nsor
sA
PS V
endo
rC
onta
ct
Uni
ted
Stat
esB
abso
n C
olle
geD
onna
Kel
ley
Abd
ul A
liC
andi
da B
rush
Mar
cia
Col
eG
ang
Hu
Meh
di M
ajbo
uri
Dia
na H
echa
varr
iaM
oria
h M
eysk
ens
Pete
r Fle
min
gM
onic
a D
ean
Thom
as S
. Lyo
nsJo
seph
Ono
chie
Alb
ert S
uhu
Ivor
y Ph
inis
eeEd
war
d R
ogof
f
Bab
son
Col
lege
Bar
uch
Col
lege
Opi
nion
Sear
ch In
c.dk
elle
y@ba
bson
.edu
Uru
guay
Uni
vers
ity o
f Mon
tevi
deo
Leon
ardo
Vei
gaPa
blo
Reg
ent
Fern
ando
Bor
raz
Alv
aro
Cris
tiani
Cec
ilia
Gom
eza
Sant
iago
Ram
osLu
cila
Arb
oley
a
Uni
vers
ity o
f Mon
tevi
deo
Ban
co S
anta
nder
Uru
guay
Equi
pos M
ori
lvei
ga@
um.e
du.u
y
Vene
zuel
aIn
stitu
to d
e Es
tudi
os S
uper
iore
s de
Adm
inis
traci
ón (I
ESA
)N
unzi
a Aul
etta
Reb
eca
Vid
alA
ram
ís R
odríg
uez
Edw
in O
jeda
nunz
ia.a
ulet
ta@
iesa
.edu
.ve
rebe
ca.v
idal
@ie
sa.e
du.v
e

152 Entrepreneurial Work by Employees in Enterprises
– studied via Global Entrepreneurship Monitor in Denmark 2011

Entrepreneurial Work by Employees in Enterprises– studied via Global Entrepreneurship Monitor in Denmark 2011
Entrepreneurial work consists of discovering opportunities and exploiting opportunities. Entrepreneurial work is done in new businesses and in entrepreneurial work by employees in enterprises. Here we first focus on entrepreneurial work by employees. How is entrepre-neurial work by employees organized in time into an idea-phase and an implementation-phase, and organized in social roles of leader and supporter of entrepreneurial work? What is the volume of entrepreneurial work in various countries around the world, and is Den-mark at the top or at the bottom? What characteristics of an employee – gender, age, educa-tion – make an employee go into entrepreneurial work rather than routine work? Do entre-preneurially working employees differ from routinely working employees and independent entrepreneurs in their competencies and work-qualities? Does industry differ from other sectors in entrepreneurial work by employees? Do industrial business relations promote innovation, exporting and growth-expectations? Do partnerships among public and private enterprises promote innovation? – Then we focus on entrepreneurial work by independent entrepreneurs who start or run their own businesses. Has the level of independent entre-preneurial activity in Denmark declined during the economic recession, and is the Danish level higher or lower than in other societies? Are the cultural and institutional framework conditions in Denmark deteriorating or stable despite the recession, and are Danish condi-tions better or worse than in other societies? How do the framework conditions shape inde-pendent entrepreneurship, and what are the effects of culture and institutions? – These questions are addressed by analyzing data from our surveys in 2011 and preceding years in Denmark and many other countries, gathered mainly in our research program Global Entrepreneurship Monitor, GEM, and this year also by a survey of industrial and other firms in Denmark, generously financed by a grant from the Danish Industry Foundation, Industriens Fond. Our up-to-date surveys and analyses provide leading indicators of current changes in entrepreneurship.
Thomas Schøtt studied at the Univer-sity of Aarhus (cand.scient.), Columbia University (M.A. in statistics, and Ph.D. in sociology) and Yale University (postdoc in organizational research), was Assistant Professor and Associate Professor at the University of Pitts-burgh, is Professor in the Department of Entrepreneurship and Relation-ship Management at the University of Southern Denmark, and is also Professor (adjunct) in the Faculty of Entrepreneurship at University of Tehran. As the National Team Leader of the Danish GEM-team, he directs the Danish research program affili-ated with the Global Entrepreneurship Monitor, where he is a member of the Research Committee and leads the re-search groups on entrepreneurs’ advice networks and on enterprises’ business-relations. He teaches entrepreneur-ship, organizations, methodology and networks among people and organiza-tions. He consults to agencies and in-ternational organizations on entrepre-neurship, intervention, organizations, clusters and development in local and global regions. He researches entre-preneurship, innovation and network organization, and he has published numerous articles in international journals and several books, including the seven research monographs, Entre-preneurship in Denmark 2005; Entre-preneurship in the Regions in Den-mark 2006; Growth-Entrepreneurship in Denmark 2007; Education, Training and Networking for Entrepreneurship in Denmark 2008; Social and Com-mercial Entrepreneurship in Denmark 2009; Training and Network Organiza-tion in Entrepreneurship in Denmark 2010; and now Entrepreneurial Work by Employees in Enterprises in Den-mark 2011.
Entrepreneurial Work by Em
ployees in Enterprises
Tho
Ma
s sch
øTT
ThoMas schøTT