studies of the planetary atmospheres in russia … · studies of the planetary atmospheres in...
TRANSCRIPT

ISSN 0001�4338, Izvestiya, Atmospheric and Oceanic Physics, 2012, Vol. 48, No. 3, pp. 309–331. © Pleiades Publishing, Ltd., 2012.Original Russian Text © O.I. Korablev, L.V. Zasova, A.A. Fedorova, D.V. Titov, N.I. Ignatiev, A.V. Rodin, V.I. Shematovich, D.A. Belyaev, I.V. Khatuntsev, M.N. Izakov,A.V. Shakun, A.V. Burlakov, B.S. Mayorov, 2012, published in Izvestiya AN. Fizika Atmosfery i Okeana, 2012, Vol. 48, No. 3, pp. 346–371.
309
1 INTRODUCTION
The report of the National Geophysical Commit�tee on Planetary Atmospheres incorporates the inves�tigations carried out in the period of 2007–2010.These investigations include spacecraft observationsand numerical modelling. Numerical modellingrelates to the dynamics of atmospheres of planets andlarge satellites, microphysics of aerosols, and pro�cesses in the outer atmospheres. Other investigationsare based on the results of measurements aboard theViking�1 and �2 spacecrafts (SC), Huygens probedescended on the surface of Titan (2005), and others.As previously, most of observational results wereobtained with instruments developed with the partici�pation of Russian scientists and installed on board theMars Express and Venus Express ESA spacecrafts.
The Mars Express SC is operational in the orbitaround Mars since 2004. The Mars Express missionand Russian participation in OMEGA mapping spec�trometer, PFS Fourier spectrometer, and SPICAMspectrometer are briefly discussed in the previousIUGG report [3] along with other results on planetaryatmospheres obtained in 2003–2006. The results ofthese experiments are also summarized in severalreview papers [4–6].
In 2006 the Venus Express SC has orbited Venus.Now, it is conducting remote global studies of itsatmosphere and climate. The spacecraft is an artificialsatellite of Venus equipped with science instrumentsfor the studies of the atmosphere, climate and theplasma environment of the planet. It has been
1 The article was translated by the authors.
launched in October 2005 from Baikonur with Soyuzlaunch vehicle with Fregat booster. Science observa�tions started immediately after the insertion into theorbit in April 2006 [7–9]. Russian Co–Is are in mostof the experiments of the project. For two instruments(versatile spectrometer SPICAV�SOIR and Fourier�spectrometer PFS) key components were contributedby Russia. Because of the malfunction of the PFSscanner [10] the instrument is not operational, andsome of its scientific goals are fulfilled with mappinginstrument Visible and Infrared Thermal ImagingSpectrometer VIRTIS (Russian Co–Is) [11]. Manystudies of the dynamic of the Venus’ atmosphere werecarried out by Russian participants of Venus Monitor�ing Camera (VMC) experiment [12].
Venus Express observations include the monitoringof the planet from the apocenter, from the ascendingbranch of the orbit, and also nadir, limb, and occulta�tion (Sun, stars and the Earth) observations in thevicinity of the pericenter. Starting from 2008 two moreobservation modes were introduced: “pendulum” andthe tracking of the chosen locations. The “pendulum”mode allows to increase the duration of dayside obser�vations preventing the overheating of the SC. The sec�ond mode allows to keep the chosen location or thelatitude range in the field of view allowing effectivelyobserve wind patterns in middle and high latitudes. Adedicated observations strategy has been developed forthe VMC camera [13–14].
The SPICAV�SOIR (Spectroscopy for the Investi�gation of the Characteristics of the Atmosphere ofVenus—Solar Occultation in the InfraRed) suite onboard Venus Express consists of three independent
Studies of the Planetary Atmospheres in Russia (2007–2010)1 O. I. Korableva, L. V. Zasovaa, A. A. Fedorovaa, D. V. Titova, b, N. I. Ignatieva, A. V. Rodina, c,
V. I. Shematovichd, D. A. Belyaeva, I. V. Khatuntseva, M. N. Izakova, A. V. Shakuna, A. V. Burlakova, and B. S. Mayorova
a Space Research Institute (IKI), Moscowb Max�Planck�Institut für Sonnensystemforschung, Katlenburg�Lindau, Germany
c Moscow Institute of Physics and Technology, Dolgoprudny, Moscow Region, Russiad Institute of Astronomy, Moscow
Received December 5, 2011
Abstract—An overview of results obtained in the field of planetary atmosphere studies in Russia in 2007–2010 prepared by the Commission on Planetary Atmospheres of the National Geophysical Committee for theNational Report on Meteorology and Atmospheric Sciences to the XXV General Assembly of the Interna�tional Union of Geodesy and Geophysics (Melbourne, 28 June–7 July 2011) [1, 2] is presented.
Keywords: planet, Mars, Venus, atmosphere, Jupiter, Saturn, Titan.
DOI: 10.1134/S0001433812030048

310
IZVESTIYA, ATMOSPHERIC AND OCEANIC PHYSICS Vol. 48 No. 3 2012
KORABLEV et al.
spectral channels: SPICAV UV, ultraviolet grating spec�trometer (118–320 nm, spectral resolution ~0.55 nm),SPICAV IR, near infrared acousto�optic filter spec�trometer (650–1700 nm, spectral resolution betterthan 1 nm), and SOIR, infrared echelle�spectrometerwith acousto�optic selection of diffraction orders forthe spectral range of 2.2–4.3 μm (resolving power~20000). The instrument is dedicated to a number ofstudies of the Venus’ atmosphere from the surface tothe hydrogen corona (~40000 km). The spectrometerscan be operated in several observation modes, includ�ing nadir, limb and occultations for the vertical sound�ing of the atmosphere. The instrument is built by threeorganizations in France, Belgium, and Russia (SpaceResearch Institute, IKI) [15]. The idea of the high�resolution spectrometer SOIR has been proposed inRussia [16, 17], and it has been built by Belgian Insti�tute of Space Aeronomy and Belgian industry [18].Russia has contributed also to its calibration, opera�tions [19, 20] and data analysis.
Many results of the Mars Express experiments aresummarized in a special issue of ESA SP [21] pub�lished with a large delay. First results of Venus Expressare published in a special section of Nature [22]. Theresults of the first phase, “nominal mission” of VenusExpress are published in a special issue of Journal ofGeophysical Research, which includes about40 papers [23]; see also [24].
The report is based on the most every results pub�lished in refereed journals. The results are groupedaround the planets.
Due to the large amount of studies following theVenus Express investigations, the current Report bythe Commission on Planetary Atmospheres of theNational Geophysical Committee is not completeregarding the modelling of dissipation in the outershells of planetary and satellites [25–29], and alsomethods [30], and instruments [31–33] for their stud�ies. Also, the ionosphere studies [34–37], and closelyrelated to Mars meteorology observations of seasonaldynamics of polar caps [38–43] are not included in theReport.
MARS
The climate of Mars is determined by the threemain cycles: CO2, H2O and dust. The measurementson orbiters and landers over the past thirty years deliv�ered a wealth of information about global patterns ofthese cycles on Mars, but their mutual dependenciesremained largely unclear. Long�term monitoring ofatmospheric cycles by various instruments of the MarsExpress orbiter allows better understanding of theseinteractions.
Study of the Mars Water Cycle
Comparison of different measurements of atmo�spheric water vapour. Estimations of the atmospheric
and surface water interaction in the Martian climatesystem are based on experimental data. The under�standing of current Martian hydrological cycle islargely based on observations of the seasonal cycle ofthe atmospheric water vapour, relatively easily mea�surable quantity, unlike the surface and subsurface res�ervoirs. For the first time full atmospheric H2O cyclewas quantified in the MAWD experiment on Viking�1and �2 orbiters [44]. Only 20 years later such measure�ments were repeated by TES on Mars Global Sur�veyor, which measured the water vapour abundance onMars in the thermal spectral range for three Martianyears from 1999 to 2005 [e.g., 45]. The TES databaseserves now as a basis for all state�of�the�art climatestudies of Mars. Since 2004, the atmospheric watercycle of Mars is being monitored with three spectrom�eters (PFS, SPICAM, OMEGA) on board the MarsExpress orbiter, which measure water vapour from thenear�infrared to the thermal infrared range. For thefirst half of 2004 Mars Express experiments operatedsimultaneously with TES. SPICAM and PFS spec�trometers continue to measure water vapour up tonow. Also, since 2006 the mapping spectrometerCRISM provides measurements of H2O onboardMars�Reconnaissance Orbiter. Thus, the water cycleon Mars is studied continuously for more than fiveMartian years.
Simultaneous measurements made it possible tocompare for the first time different methods of watervapour retrieval. Many factors affecting on the datatreatment have been considering: spectroscopic data�bases, line broadening in the CO2 atmosphere, atmo�spheric models, and the absolute accuracy of the data.It allowed to re�evaluate the uncertainties and discrep�ancies in the results of various experiments and tojudge on the question of inter�annual variations in theatmospheric H2O. Many works devoted to data pro�cessing from different experiments have been pub�lished at the time of the previous report [3]. Newresults are discussed below.
Comparison of observations at 1.38 μm band (seebelow) with the TES results in the thermal range of20–40 μm showed systematic discrepancies for all sea�sons. At the same time, the corrected TES data agreewell with the PFS (long�wavelength channel, LW)results obtained in the same spectral range [46].Although the SPICAM and TES data overlap for onlya short time, the 50% differences appearing repeatedlyover three years suggest systematic bias between thetwo different spectral bands.
The OMEGA and PFS (short�wave channel, SW)spectrometers measured the water vapour in the 2.56�μmband and their results are much less homogeneous.OMEGA data have been used both for the study ofregional, local and temporal variations of H2O (seebelow) and to measure the seasonal cycle on a globalscale [47, 48]. The PFS SW data are larger than thedata of PFS LW [49]. To reconcile the results of SWand LW channels of PFS one had to assume that the

IZVESTIYA, ATMOSPHERIC AND OCEANIC PHYSICS Vol. 48 No. 3 2012
STUDIES OF THE PLANETARY ATMOSPHERES IN RUSSIA (2007–2010) 311
bulk of the water vapour is concentrated near the sur�face. At the same time, such assumptions were notrequired to analyse SPICAM and OMEGA near IRdata, equally sensitive to the vertical profile.
The main conclusions from the comparison of dif�ferent experiments are as follows [50]:
—Correction of TES results: more than 60% of thedata (all measurements with a lower spectral resolu�tion) have been corrected downward by ~30%. Anupdated database of TES is made available [51].
—Correction of MAWD data downward by 50%,especially in summer in the northern hemisphere, andgood agreement of these measurements with the SPI�CAM results, obtained in the same near�infrared1.38 μm band.
The most reliable measurements are the data in thethermal spectral range: TES (after correction) andlong�wavelength channel of PFS [46].
The variability of the atmospheric water cycle wasfound to be substantially less than suggested before,both from year to year (the observed variations arerelated only to the variability of dust in the atmo�sphere), and at long�term (Viking epoch measure�ments do not differ from today).
Correction of the MAWD/Viking results. Duringthe analysis of the SPICAM/Mars Express data, sig�nificant differences between HITRAN2000 databaseand HITRAN2004 and later editions have been iden�tified regarding the spectroscopic parameters of thelines and in the number of those lines in the 1.38 μmband. This raises a question about the quantitative reli�ability of data analysis performed many years ago. Thereanalysis of all data of the MAWD (Mars AtmosphericWater Detector) instrument on Viking�1 and �2 orbit�ers was performed [52]. New maps of the water vapourdistribution according to the MAWD have beenretrieved taking into consideration new spectroscopicdatabases and best available climatology from generalcirculation models. As a result, the measured watervapour abundance has been decreased by a factor oftwo. The polar maximum of water vapour is about50 pr. μm. Comparison of the distribution of watervapour measured by MAWD and SPICAM showedconsistency in water cycle observations made recentlyand 30 years ago (among MY12�14 and 27�29, follow�ing the notation proposed in [53]), see Fig. 1. Thissuggests the stability of the water cycle during thisperiod.
Weak interannual variations observed for some sea�sons, in particular during the southern summer, couldbe explained by a combination of natural variability ofthe water content, and variability of the atmosphericdust. Both MAWD and SPICAM data have been pro�cessed ignoring the scattering by dust that causesunderestimation of the H2O abundance measured inthe near infrared [54].
Water vapour on local scale with OMEGA/MarsExpress data. The behaviour of the atmospheric water
over Tharsis volcanoes has been studied by infraredmapping spectrometer OMEGA. OMEGA observationsuniformly cover the full Martian year at different times ofa day. Observations showed abnormally high concentra�tion of the water vapour (up to 2000–3000 ppm) over thetops of the four volcanoes in comparison with the sur�rounding plateau. This behaviour has been observedthroughout the year and demonstrated a clear seasonaltrend [55].
The increased water vapour in the volcanic areasuggests that it is not uniformly mixed with altitudeand its content increases sharply near the surface. Thereasons for atmospheric enrichment over the volca�noes are likely connected to mesoscale circulation.Sharp changes in elevation and thermal inertia on vol�canoes are caused by slope winds transporting thewater vapour from valleys to the tops, where, at lowtemperatures, it is either deposited as a frost oradsorbed by regolith. Similar studies are performedover other regions with large elevation differences,such as the Hellas Basin and the Valles Marineris [56].
Investigation of the water vapour distribution in thenorthern polar region in spring and summer with highspatial resolution shows the evolution of the H2O max�imum during the sublimation of the polar cap and itsconnection with the distribution of hydrated mineralsobtained in the same experiment [47].
Vertical profiles of water vapour from SPI�CAM/Mars Express solar occultations. The knowl�edge of the vertical distribution of H2O and aerosol inthe Martian atmosphere helps to answer questions ofMartian meteorology related to their sources and sinksin different atmospheric layers, the interaction withthe surface, etc. Only a few measurements related tothe vertical distribution of water vapour and aerosolwere made before, revealing no global picture of sea�sonal and latitudinal variations.
For three Martian years SPICAM performed about600 solar occultation observations allowing verticalprofiling of the atmosphere. The spectral range of theinstrument includes the carbon dioxide 1.43 μm bandto retrieve the atmospheric density, and the 1.38 μmband to retrieve the water vapour abundance. Theatmospheric opacity and the properties and distribu�tion of aerosols with altitude are studied in a wholespectral range from 1 to 1.7 μm. To retrieve the gasdensities the optimal estimation algorithm for nonlin�ear equations has been used.
The observation set of MY28 (summer 2007) allowsto trace how the vertical distribution of water evolvesduring the global dust storm, which began approxi�mately at Ls = 270° in the southern hemisphere. Rela�tive water content measurements is less than 100 ppmabove 30 km. Prior to the global dust storm (Ls =250°–265°, MY28) the relative content of watervapour agreed well with the general circulation modelof Mars, water vapour content decreasing at altitudesof 40–45 km for latitudes 50°–60° N and 60 km forlatitudes 60°–65° S. The relative content below this

312
IZVESTIYA, ATMOSPHERIC AND OCEANIC PHYSICS Vol. 48 No. 3 2012
KORABLEV et al.
level was 100–160 ppm. At the same time some sys�tematic differences with the general circulation modelare found. For example, in the southern spring�sum�mer 2008 (Ls = 70°–110°, MY29) the beginning of theH2O activity at middle latitudes has been observed ear�
lier compared with the model that can be explained byunderestimation of turbulent mixing at the eveningterminator, or unusual aerosol activity. In smallamounts the water vapour was well mixed up to alti�tudes of 45 km. At the same time in the northern early
20
15
10
5
3603403203002800
260240220200180160
H2O
, p
r. m
icro
ns
Latitude –55°
Ls
20
15
10
5
3503002502000 15010050
H2O
, p
r. m
icro
ns
Latitude 0°
Ls
60
40
20
1801601401200
100804020
H2O
, p
r. m
icro
ns
Latitude 70°
Ls
60
MAWD MY12MAWD MY13
MAWD MY14SPICAM MY27
SPICAM MY28SPICAM MY29TES MY24TES MY25TES MY26
Fig. 1. Comparison of MAWD results for MY12–14 with SPICAM (MY27–29) and TES (MY24–26) datasets for three latitudebins: –55°, 0° and 70°. The data have been averaged in 5° × 5° bins (see paper [52]).

IZVESTIYA, ATMOSPHERIC AND OCEANIC PHYSICS Vol. 48 No. 3 2012
STUDIES OF THE PLANETARY ATMOSPHERES IN RUSSIA (2007–2010) 313
summer, the water activity began later compared withthe predictions of the model, which may indicate thelack of sublimation in the model, stronger interactionbetween the atmosphere and the surface, or weakervertical transport [57, 58].
Aerosol
The vertical structure and properties of aerosol fromSPICAM/Mars Express solar occultations. The verti�cal profiles of aerosol, which is frequently formed formcondensing component (water ice), and the verticaldistribution of H2O vapour (see above) are closelyconnected. The solar occultation data of SPICAM IR(~600 observations) allow good spatial coverage in lat�itude and longitude in the southern and northernhemispheres for all seasons over three Martian years.Detached cloud layers have been observed at altitudesfrom 20 to 60 km with optical depths from 0.001 to0.01. In the polar region the aerosols are concentratednear the surface, while in low and middle latitudes themain aerosol layer extends up to 25–30 km.
During MY28, the global dust storm has beenobserved. In the southern hemisphere the storm beganat Ls = 268°–270° at latitudes of about ∼64° S, whilein the northern hemisphere it started at Ls ∼ 280° atlatitude 55° N. During the dust storm the slant opticaldepth of 1 was observed up to the altitudes of 70 kmand 60 km in southern and northern hemispheresrespectively [57].
Interpretation of OMEGA/Mars Express limbmeasurements. Work on retrieval of Martian aerosolproperty vertical profiles from OMEGA spectrometerdata has been continued. The OMEGA limb scansreveal aerosol layers observed in a wide spectral rangeof 0.4–3.3 μm. A model of optical aerosol propertieswith a minimum number of variable parameters andpossibility to retrieve optical characteristics of aerosolparticles (extinction and scattering cross�sections,phase function or phase matrix) has been developed.The model assumes chemical composition of theaerosol to be known. For Mars, the optical aerosolmodel with three variable parameters is suggested:wavelength, modal radius and a parameter character�izing the width of the particles size distribution. Theinverse method based on the model, accounting formultiple scattering in the spherical symmetry atmo�sphere, allowed to retrieve vertical profiles of aerosolnumber density, modal radius of particles and thewidth of the size distribution function from OMEGAlimb measurements [59].
Numerical modelling of cloud microphysics in theMartian atmosphere. A one�dimensional numericalmodel of the condensation clouds in the Martianatmosphere based on a hybrid scheme has been devel�oped involving vertical mesh and moments of size dis�tribution of aerosol particles. The model reproducesbimodal distribution of ice particles in the clouds,including the main mode (1–2 μm) and the high�alti�
tude fraction (0.2–0.3 μm). The model reproducesprecipitation of morning fog in the boundary layer.The 1�D model of vertical transport of a passiveadmixture based on the approximation of fractionaleddy diffusion, is developed and applied to water iceclouds. This model accounts for transport by globalcirculation system and vortices of different scales [60].
Ozone and O2 (a1Δg) Dayglow
Ozone is one of the most chemically active species,indirectly related to the question of the stability of theMartian CO2�dominated atmosphere. Ultravioletsolar radiation leads to dissociation of carbon dioxideinto CO and O and their subsequent recombinationoccurs as a result of a long, complex triple collisionreaction. In turn, the recombination of O2 from theoxygen atom is quite fast. Thus, the concentration ofCO and O2 in the Martian atmosphere must be consis�tently high, but the measurements indicate low abun�dance of these minor species (see below). The reasonis likely a significant role of water vapour in the atmo�spheric stability. The CO2 stability is associated withchemical reactions involving odd hydrogen radicals(H, OH, HO2), because the hydroxyl OH can reactwith CO and restore the CO2 content much moreeffectively due to higher reaction rate. However, theseradicals are difficult to observe directly. One possibleway of indirect assessment of the HOx radicals is tomeasure ozone in the atmosphere of Mars, since it iseffectively destroyed by them and can serve as a tracerof their presence.
Ozone on Mars from SPICAM/Mars Expressdata. The study of distribution and seasonal changes ofozone on Mars with the SPICAM spectrometer hasbeen continued. The seasonal and latitudinal varia�tions, vertical distributions have been obtained; thecomparison with photochemical models within LMDatmospheric general circulation model of Mars hasbeen made [61]. It was shown that the photochemicalmodels that do not include heterogeneous chemistryon the water ice cloud particles, poorly approximatesobservations [62].
Oxygen dayglow and ozone in the atmosphere ofMars from OMEGA/Mars Express data. 2�D maps ofthe O2 day glow emission at 1.27 μm are obtained byOMEGA mapping spectrometer in the near IR spec�tral range, with spatial resolution ranging from 2 to5 km/pixel. The detection threshold is ~4 MR. In theMartian atmosphere the strong O2 emission on thedayside is produced as a result of photolysis of O3.About 90% of ozone molecules give rise to metastableoxygen state O2(а1Δg). Developed method allowsobtaining the quantitative estimation of O2 airglowintensity from OMEGA spectra despite their low spec�tral resolution, and investigation of its horizontal dis�tribution, local time and seasonal behaviour. Thehighest values of emission ~31 MR are observed on theSouth Pole for the local time 11–13 h, during the early

314
IZVESTIYA, ATMOSPHERIC AND OCEANIC PHYSICS Vol. 48 No. 3 2012
KORABLEV et al.
spring (186° < Ls < 192° MY27). In the polar regionsobserved day�to�day variability, associated with polarvortex turbulence, is 30–50% of model predictions[61] and SPICAM /Mars Express [63] UV measure�ments. In the considered data set the maximum of theO2 emission is observed at local time between 11 and15 h in the latitude range 70°–85° S during earlyspring in both hemispheres. During MY28 the maxi�mum of airglow intensity was located between 50° and60° S for the southern autumn–winter season.Increased O2 emission observed from Ls = 130°–160°at southern high latitudes may be explained by highersolar illumination during the considered period [64].
In higher latitudes, the O2 emission is usuallyobserved as a region extended within some range oflatitude and longitude. The extension in longitude isconnected with variation of the solar illumination andconsequently with local time: the emission is maximalaround noon, and it decreases in the morning and inthe afternoon. The latitude of the emission maximumis determined by two factors: H2O abundance and thesolar illumination. In winter the water vapour abun�dance decreases with the latitude, leading to theincrease of the O3 abundance, strengthening the O2emission. At the same time the solar illuminationdecreases toward high latitudes, reducing the O3 disso�ciation and the O2 emission. A higher intensity of theO2 emission found in southern high latitudes compar�ing to the north might relate to higher intensity of theHadley circulation during northern winter (perihe�lion), which transports water vapour from low lati�tudes more efficiently than in southern winter (aph�elion).
Atmospheric waves crossing the terminator areobserved for the first time in polar areas during theMY26 (in the north polar region) and MY28 (in thesouth polar region) in early spring. The spatial scale ofthe waves ranges from 100 to 130 km, and the intensityfluctuations are ~4 MR. The observations of the O2dayglow are important as a passive tracer of Martianatmospheric dynamics at high latitudes [64, 65].
Other Minor Constituents
Carbon monoxide from PFS/Mars Express data.Carbon monoxide is another important component ofthe chemical cycle of Mars. Its abundance has beenstudied by the PFS spectrometer using the fundamen�tal (1–0) CO band at 4.7 μm. Calibrated PFS data ofyear 2004 (Ls ranging from 331°.17–51°.61, end ofMY26–beginning of MY27) have been used to deriveseasonal, temporal, and spatial trends in the CO distri�bution. The globally averaged CO mixing ratio valuederived from this dataset is 11.1 × 10⁻⁴, which is com�patible within errors bars, although somewhat higher,with the value of 8 ± 3 × 10⁻⁴ determined from theground�based high�resolution observations [66].However, the derived CO mixing ratio exhibits largevariations from 3 × 10⁻⁴ to 18 × 10–4, which were anal�
ysed statistically to estimate the seasonal and latitudi�nal variations. The measurements confirm theincrease of the CO abundance in the northern hemi�sphere in the beginning of winter [67], attributed tothe condensation of CO2 on the polar cap enrichingthe atmosphere with non�condensable species. Nodefinite conclusion can be reached about other sea�sons and latitudes because of limited seasonal cover�age [68].
Modelling of the dissipation of the Martian atmo�sphere. A model of the photoelectron collision�induced component of the Mars dayglow using recentcross sections and solar flux data is developed. The cal�culation of the photoelectron source of excitation isbased on a stochastic solution of the Boltzmann equa�tion using the direct simulation Monte Carlo method.The neutral atmosphere is taken from outputs of a glo�bal circulation model, and recent inelastic collisioncross sections are adopted. The calculated verticalprofiles of the CO Cameron bands and CO2
+ doubletemissions integrated along the line of sight comparewell with the SPICAM limb profiles observed fromMars Express at Ls = 166° during the summer seasonat northern mid�latitudes. The comparison showsagreement to within the uncertainties of the excitationcross sections. Seasonal changes in the brightness andthe altitude of the emission peaks are predicted withintensity variations in the range 15–20% [69].
Estimates of the total thermal and non�thermallosses of hydrogen and the total non�thermal loss ofoxygen from the atmosphere of Mars are discussed,and their ratio is analysed. The H to O stechiometricratio of 2 : 1 has not been achieved in any of the currentmodels of various authors. The closest ratio, H : O =4 : 1, has been obtained in the model of formation of ahot oxygen corona [70].
VENUS
Composition of the Atmosphere
Vertical distribution of HDO, H2O and D/H ratiofrom SOIR/Venus Express data. Measurements of thewater vapour content in Venus’ atmosphere are impor�tant for understanding of the planetary climate. Inspite of large number of observations performed fromorbiters and landers in 1970–1990 as well as fromground�based telescopes, spatial distribution of H2Oon Venus is so far poorly constrained.
In the SOIR experiment water vapour is measuredin solar occultation using absorption lines of the gasaround 2.61 μm (3830 cm–1) at altitudes 70–110 km;HDO isotope is measured simultaneously in the range3.58 μm (2715 cm–1) at 75–95 km. It allows determi�nation of HDO/H2O ratio. Results of observations forone and a half year (from April 2006 to August 2007)have been analysed. 54 measurements of water vapourand its isotope were made at different locations frommiddle latitudes of southern hemisphere to the North

IZVESTIYA, ATMOSPHERIC AND OCEANIC PHYSICS Vol. 48 No. 3 2012
STUDIES OF THE PLANETARY ATMOSPHERES IN RUSSIA (2007–2010) 315
Pole of the planet. The analysis of 22 observations nearthe Venus North Pole, captured mainly from theorbit’s pericenter has been published. An average valueof H2O mixing ratio is 1.16 ± 0.24 ppm and 0.086 ±0.020 ppm for HDO (Fig. 2). The water vapour is uni�formly mixed at altitudes above 75 km. A smalldecrease of H2O mixing ratio at altitudes 80–90 kmmay be linked with a temperature inversion above~95 km. No significant temporal variations in verticalprofiles of water vapour are noted. The averageHDO/H2O ratio found 240 ± 25 times terrestrial, and1.5 times more than the same ratio retrieved for thelower atmosphere from ground based observations andPioneer Venus lander measurements, 157 ± 30 (see[71] for a review of Venus atmosphere compositionbefore Venus Express mission). The increased concen�tration of deuterated water may result either from lowphotodissociation rate of HDO with respect to H2O orfrom higher dissipation rate of deuterium atoms withrespect to hydrogen atoms. These new results will serveas a basis for dynamical and chemical modelling, andfor estimation of contemporary dissipation rate ofwater from Venus [72, 73] (Fig. 2).
Water vapor near the cloud tops from VIRTIS/Venus Express dayside data. Observations of the day�side of Venus performed by the high spectral resolutionchannel of VIRTIS, VIRTIS�H on�board the ESAVenus Express mission have been used to measure thealtitude of the cloud tops and the water vapour abun�dance around this level with a spatial resolution rang�ing from 100 to 10 km. This dataset supersedes previ�
ous measurements in a combination of good coverage,spatial resolution, and robustness of the method. CO2and H2O bands near 2.5 μm are analysed to determinethe cloud top altitude and water vapour abundancenear this level [74] (Fig. 3).
These measurements unambiguously prove theabsence of high variations of the water vapour abun�dance near the cloud tops, reported by a number ofmicrowave and radiometric measurements. At low lat�itudes (±40°) mean water vapour abundance equals to3 ± 1 ppm and the corresponding cloud top altitude at2.5 μm is 69.5 ± 2 km. The cloud top altitude graduallydecreases poleward from middle latitudes down to64 km, while the average H2O abundance reaches itsmaximum of 5 ppm at 70°–80° latitude with a largescatter from 1 to 15 ppm.
No local time dependence has been observed. Thecalculated mass fraction of sulphuric acid solution incloud droplets of mode 2 (~1 micron size) particles isin the range of 75–83%. The sulphuric acid shouldlikely be in a deeply supercooled liquid state. Theamount of water in vapour always exceeds that in cloudparticles, indicating that the water vapour abundancenear cloud tops is not controlled by the equilibriumwith the sulphuric acid clouds, but forced at this levelby other, e.g. dynamical, reasons. The meridional dis�tribution of the water vapour abundance is consistentwith global circulation characterized by combinedHadley and polar cells. Simultaneous observations byVMC did not reveal any systematic correlationbetween the dark UV markings with the local (on the
110
105
100
95
90
85
80
75
70
10–110–2 100
95
90
85
80
75
0.200 0.250.150.100.0570
Alt
itud
e, k
m
HDO and Н2О
orb 244
orb 251
orb 262
Relative content, ррm
HDO/H2O
Alt
itud
e, k
m
orb 244
orb 251
orb 262
Fig. 2. Vertical profiles of HDO, H2O and isotope ratio [72].

316
IZVESTIYA, ATMOSPHERIC AND OCEANIC PHYSICS Vol. 48 No. 3 2012
KORABLEV et al.
74
72
70
68
66
64
9060300–30–60
900
800
700
600
Orb
it n
umbe
r
Alt
itud
e of
th
e cl
oud
tops
, km
Latitude–90
62
15
10
5
9060300–30–60
900
800
700
600
Orb
it n
umbe
r
Rel
ativ
e co
nte
nts
, H
2O ×
10–
6
Latitude–90
0
Fig. 3. Water vapour abundance (bottom) near the cloud tops (top) as a function of latitude from VIRTIS/Venus Express data [74].

IZVESTIYA, ATMOSPHERIC AND OCEANIC PHYSICS Vol. 48 No. 3 2012
STUDIES OF THE PLANETARY ATMOSPHERES IN RUSSIA (2007–2010) 317
scale of 100 km and smaller) variations of the cloudtop altitude or water vapour abundance.
Composition of mesosphere from SOIR/VenusExpress data. High�resolution spectra by SOIR allowdetecting isolated absorption lines of minor species. Itallows to measure concentrations of HCl, HF and COin Venus’ mesosphere, and to retrieve their verticalprofiles [75]. HCl mixing ratio was obtained as 0.1–0.2 ppm at altitudes 70–90 km; that is less than0.4 ppm at ~64 km observed 40 years ago by P. Connesfrom the ground experiment (see [71]), and less than0.76 ppm at 61–67 km from nowadays telescopeobservations [76]. HF content, estimated as 1–7 ppb,is in agreement with previous results. The presentedranges of mixing ratios reflect variability with altitudeand time, not error bars.
Vertical profiles of carbon monoxide content weremeasured as well. Photodissociation of CO2 above120 km is a major source of CO in Venus’ atmosphere,and an essential part of the atmosphere above 140 kmconsists of the monoxide. Above 90 km the profilesmatch the VIRA atmospheric model [77]. Below80 km the retrieved values of 30–50 ppm are signifi�cantly larger than in VIRA, but are in agreement withother observations, for example, microwave ground�based measurements [78]. It should be mentioned thatSOIR CO profiles are characterized by a distinct min�imum (~10 ppm) at 85 km.
Upper limits for important photochemical mole�cules OCS and H2CO were improved with SOIR spec�tra. Below 90 km the OCS upper limit is 1.6 ± 2 ppb,and for H2CO it is 3 ± 2 ppb.
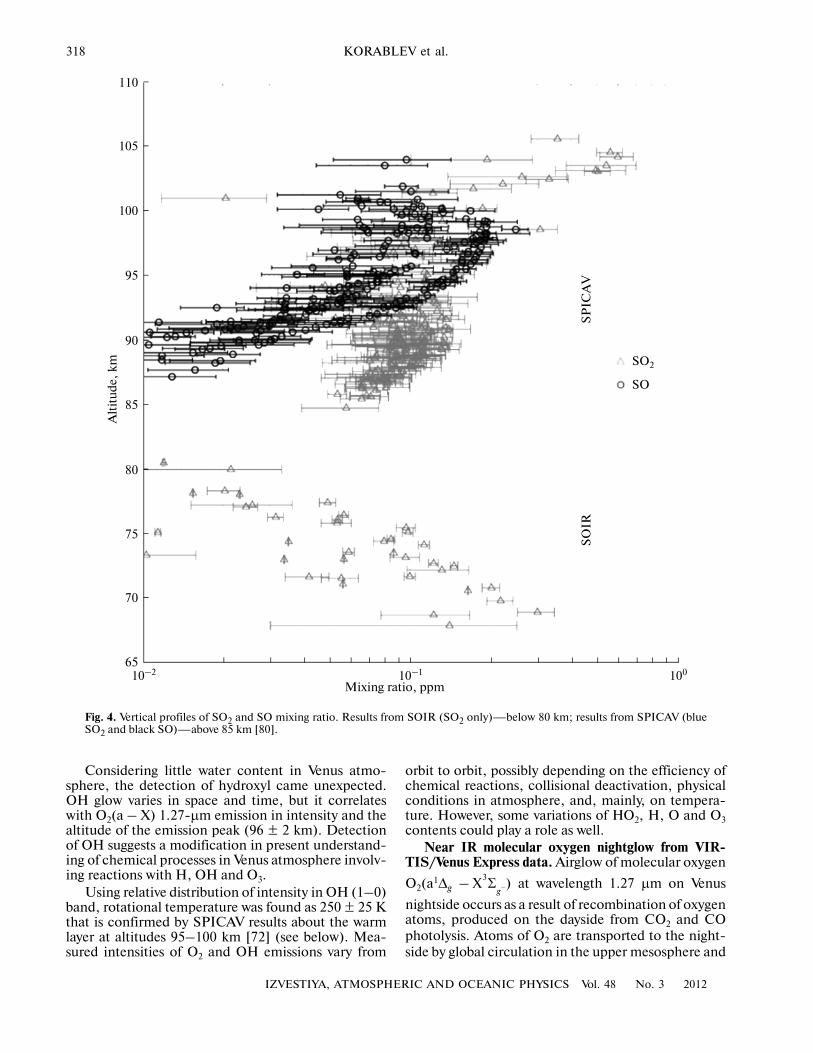
SO2 and SO above clouds from SPICAV�SOIR/Venus Express data. Sulphur dioxide is one ofimportant component of the Venus atmosphere,because this gas is directly linked with H2SO4 cloudsfully covering the planet. Variations of SO2 contentabove the clouds (altitudes >65 km), where the gas isphotodissociated, serve as an indicator of photochem�ical reactions in the atmosphere and of vertical mixingthat delivers it from lower atmospheric layers. The SO2measurements above clouds (mainly day�side nadirobservations) during many years suggest decennialvariations of the content from 0.01 to 0.5 ppm.
Measurements of SO2 and SO vertical profiles werecarried out by SPICAV/SOIR spectrometer in solaroccultations in the spectral range around 4 μm at alti�tudes 65–75 km (SOIR) and around 215 nm at 90–100 km (SPICAV). The 4�μm band of SO2 is mixedwith abundant CO2 lines that decreases the accuracy ofdetection. In parallel, absorption of sulphur monoxideSO was registered in the UV range with continuous con�centration ~10% from SO2 at altitude ~70 km. For someprofiles it was possible to establish only the upper lim�its of gaseous content. At altitudes of 80–90 km theinstrument is not sensitive to SO2 and SO absorptions.In the lower part of the profiles the sulphur dioxidemixing ratio decreases with altitude from ~0.5 ppm at~65 km to 0.05 ppm at 75 km; in the upper part an
increase is observed from ~0.1 ppm at ~90 km to~1 ppm at ~100 km (Fig. 4). The polar vertical profilesof SO2 content are similar at morning and eveninglimbs. Slant SO2 concentration correlates with aerosoloptical thickness [79, 80].
Sulphur dioxide was also measured in nadir at215 nm by SPICAV UV spectrometer at several lati�tudes of Northern hemisphere. Analysing solar radia�tion reflected and scattered from Venus’ clouds theSO2 mixing ratio was retrieved around 0.1 ppm at level~70 km confirming SOIR results [81]. The SO2 con�tent at 70 km decreases with latitude from equator topole in accordance with the cloud top decrease [82](see also Fig. 3).
New band of isotope CO2 628 from SOIR/VenusExpress data. Spectroscopic lines of an unknownabsorber nearby 2982 cm–1 (3.3 μm) were found inhigh�resolution spectra of Venus atmosphere mea�sured by SOIR spectrometer. They were attributed tothe CO2 isotopologue 16O12C18O (628) and correspondto absorption band 01111–00001. Comparing withwell�known CO2 bands, observed by SOIR, and usingcomputations, line strengths of the Q�bench for this bandwere determined. The band is two orders of magnitudemore intense than in spectroscopic database for vibra�tional�rotational molecular transactions HITEMP [83,84]. Thus, the detected band of the 628 isotopologue waspredicted theoretically, but with lines strengths drasti�cally underestimated. Due to the weakness of this bandit has never been observed in the Earth atmosphere,however it was registered on Mars [85].
Airglow
Discovery of hydroxyl airglow by VIRTIS/VenusExpress. Night airglow in OH bands was first detectedfrom high�resolution spectra of terrestrial atmospherein 1948 [86]. Meinel bands come from vibrational�rotational transitions between vibrational levels ofmajor state from ν' = 1 to ν' = 9. Photochemical mod�elling [87] suggests that hydroxyl plays a key role inreduction of the Mars CO2�atmosphere, which is dis�sociated on day�side by the solar UV; however so faronly an upper limit for the OH airglow of 50 kR wasestablished [88].
In limb Venus spectra, registered by VIRTIS imag�ing spectrometer, the hydroxyl was identified from IRMeinel bands: (2–0) at 1.40–1.49 μm with integralintensity 100 ± 40 kR and (1–0), (2–1) at 2.6–3.14 μmwith intensity 880 ± 90 kR (1 R equals to 106 photons).Vertical profiles of the airglow at the limb wereretrieved, and theirs spatial and temporal variationswere established [89] (Fig. 5). Detection of OH inVenus atmosphere by Venus Express orbiter raisedquestions about the chain of physical and chemicalreactions leading to the formation of this compound:most probably, ozone plays a major role here, like onthe Earth.
318
IZVESTIYA, ATMOSPHERIC AND OCEANIC PHYSICS Vol. 48 No. 3 2012
KORABLEV et al.
Considering little water content in Venus atmo�sphere, the detection of hydroxyl came unexpected.OH glow varies in space and time, but it correlateswith О2(a – X) 1.27�μm emission in intensity and thealtitude of the emission peak (96 ± 2 km). Detectionof OH suggests a modification in present understand�ing of chemical processes in Venus atmosphere involv�ing reactions with H, OH and O3.
Using relative distribution of intensity in OH (1–0)band, rotational temperature was found as 250 ± 25 Kthat is confirmed by SPICAV results about the warmlayer at altitudes 95–100 km [72] (see below). Mea�sured intensities of O2 and OH emissions vary from
orbit to orbit, possibly depending on the efficiency ofchemical reactions, collisional deactivation, physicalconditions in atmosphere, and, mainly, on tempera�ture. However, some variations of HO2, H, O and O3contents could play a role as well.
Near IR molecular oxygen nightglow from VIR�TIS/Venus Express data. Airglow of molecular oxygen
O2(a1Δg – ) at wavelength 1.27 μm on Venus
nightside occurs as a result of recombination of oxygenatoms, produced on the dayside from CO2 and COphotolysis. Atoms of O2 are transported to the night�side by global circulation in the upper mesosphere and
X3Σ
g–
110
105
100
95
90
85
80
75
70
10010–2 10–165
Alt
itud
e, k
m
Mixing ratio, ppm
SP
ICA
VS
OIR
SO2
SO
Fig. 4. Vertical profiles of SO2 and SO mixing ratio. Results from SOIR (SO2 only)—below 80 km; results from SPICAV (blueSO2 and black SO)—above 85 km [80].

IZVESTIYA, ATMOSPHERIC AND OCEANIC PHYSICS Vol. 48 No. 3 2012
STUDIES OF THE PLANETARY ATMOSPHERES IN RUSSIA (2007–2010) 319
thermosphere. Gas molecules elevate near the subso�lar point, pass through terminators to the night�side,and move down near the antisolar point (SS�AS circu�lation).
Reactions {2O + M → + M; + M →
O2(a1Δg) + M} in the downwelling flux at the antisolarpoint result in production of excited oxygen mole�cules, which emit photons when returning to the mainstate. Night emission О2(a – X) on 1.27 μm in Venusatmosphere was first detected in 1975 [90] and later itwas observed many times from the Earth, revealinghigh variability.
Spectrometer VIRTIS (mapping channel VIRTIS�M) allows to observe atmospheric airglows with highspatial and moderate spectral resolution. The stron�gest non�thermal emission on the Venus nightside is1.27�μm airglow. Spectrally, this band falls into thetransparency window of CO2, and analysing nadir datait is necessarily to consider contribution from thelower atmosphere radiation, scattered and reflected by
*O2*O2
clouds. At limb measurements oxygen and thermalemissions are spatially separated (Fig. 6) [91, 92].
Airglow is most intensive on planet’s limb. Obser�vations of VIRTIS allowed first measurements of ver�tical profiles of oxygen emission. Features of the air�glow are highly variable: the intensity, the peak posi�tion and width, the shape of the profile change inspace and time (Fig. 6). During one orbit a decrease ofthe intensity and increase of the peak height may benoticed with changing latitude. This could beexplained by stronger intensity of the vertical motion(SS�AS circulation) in the equatorial region, provid�ing deeper downwelling of oxygen atoms with recom�bination at higher density and temperature. On aver�age, the glow occurs near the antisolar point that isconfirmed by ground�based observations and nadirmeasurements of VIRTIS (see below).
Vertical profiles of airglow were retrieved from limbmeasurements using “onion�peeling” technique. For42 profiles with latitude coverage from 7° S to 77° Nthe altitude of emission peak is 97.4 ± 2.5 km. Thepeak is wider in equator with width 11 km at half max�
4 × 10⁻³
3 × 10⁻³
2 × 10⁻³
1 × 10⁻³
0 × 100
3.02.52.01.51.0
3.23.02.82.6
Lλ,
W/m
2 mic
ron
sr
1–0
2–1
3–2
O2
OHOH
Wavelength, microns
Fig. 5. Airglows of O2 and OH in the upper atmosphere of Venus (upper images) and a typical spectrum of VIRTIS/Venus Express(lower plots). Limb Venus spectrum is averaged within 90–100 km of altitude and 25°–35° N of latitude (local time is ~02:00 pm). OHbands at 1.40–1.49 µm (2–0) and at 2.6–3.14 µm (1–0), (2–1) are observed in addition to O2 bands (0,0) 1.27 µm and (0,1)1.58 µm. Tracks of thermal radiation from the lower atmosphere are marked by stars at 1.1, 1.18 and 1.74 µm. Synthetic spectraof OH airglow are presented as well [89].

320
IZVESTIYA, ATMOSPHERIC AND OCEANIC PHYSICS Vol. 48 No. 3 2012
KORABLEV et al.
imum, twice as more as in middle latitudes. Averageintensity of the peak is 0.52 ±0.4 MR (the maximumreaches ~2 MR). Often, a double peak was observed:the principal maximum at 96–98 km and the addi�tional one on 103–105 km. Their presence might beexplained by wave processes.
For the first time the night emission band (0–1) ofО2(a – X) was observed in spectrum of another planetat 1.58 μm (see Fig. 5.) The intensity reaches 1.2%from the band (0–0) at 1.27 μm, and vertical profilesare almost identical. Simultaneous measurements ofthose two bands allowed to estimate transition proba�bility A00/A01 = 63 ± 8.
Nadir observations of the night airglow (0–0)О2(a – X) from Venus Express orbiter allowed to reachhigh spatial resolution for the southern hemisphereglobally from equator to the Pole. In further data pro�cessing the thermal radiation, which goes from thelower atmosphere and mixes with О2 airglow, wasexcluded, as well as O2 radiation reflected fromclouds [93].
Oxygen airglow makes it possible to study the pro�cesses of atmospheric transport at altitudes 90–110 km(upper mesosphere and lower thermosphere), in therange poorly constrained by observations. Unlike inthe mesosphere, where dominates the zonal superro�tation, in the thermosphere prevails the SS�AS circu�lation with some variable contribution of zonal rota�tion. Two maxima of O2 1.27�μm airglow wereobserved: one in the antisolar point, confirming thehypothesis of SS�AS transfer. The second maximum isshifted from the antisolar point to higher latitudes andto evening part of southern hemisphere; this behaviouris not compatible with the combination of SS�AS andzonal superrotation. The O2 1.27�μm airglow fromnadir VIRTIS observations is strongly variable both onspatial and temporal scales. These variations (and alsothe occurrences of intense airglow, several times higher
than average, at any part of the nightside) come fromdownwelling fluxes at the altitude of emission. It tellsabout complicated and variable nature of circulationin this transition range.
Non�equilibrium airglow of CO2 from VIR�TIS/Venus Express data. Carbon dioxide emission inthe 4.3 μm band, occurring at local thermodynamicdisequilibrium is typical for Earth and Mars. On Venusthis dayglow was first detected by NIMS/Galileo spec�trometer. The peak of emission intensity is controlledfrom one hand by concentration of exited molecules,and from the other hand by collisional quenching.VIRTIS observations from Venus Express allow sys�tematic study of this emission on the dayside at alti�tudes of 90–120 km. Airglow peak is located at~115 km and shifts by ~10 km depending on solaremission angle. A radiative transfer non�LTE model,developed previously for Martian atmosphere, wasused for the interpretation. In the frame of the model,observed altitudes and airglow intensities match thestandard VIRA model [92].
Venus UV and EUV dayglow spectroscopy withOUVS/Pioneer Venus and UVIS/Cassini. The intensi�ties of the OI 130.4 and 135.6 nm emissions were cal�culated using Pioneer Venus (PV) Orbiter measure�ments of soft electrons precipitation. The comparisonof calculated intensities with the auroral brightnessobserved with the ultraviolet spectrometer (OUVS)on�board PV was made. For this purpose, a new elec�tron transport model based on a Monte Carlo imple�mentation of the Boltzmann equation and a multi�stream radiative transfer model to calculate the effectsof multiple scattering on the intensity field of the130.4 nm triplet were used. It was shown that theaccount for multiple scattering in the optically thickVenus atmosphere increases the auroral 130.4/135.6ratio by a factor of about 3 [94].
EUV spatially�resolved dayglow spectra obtainedby the UVIS instrument during the Cassini flyby ofVenus on 24 June 1999 were analysed. These observa�tions were obtained in the wavelength range 56.3–191.2 nm at 0.37 nm resolution; the spatial resolutionat planet was ~500 × 500 km from the distance of7000 km. Observations were made during high solaractivity. Emissions from OI (98.9 nm), Lyman�β + Ol(102.5 nm), OII (83.4 nm), NI (120 nm), CI (127.7 nm)and CO (108.8 and 115.2 nm) have been identified andtheir disc average intensities determined. They aregenerally somewhat brighter than those determinedfrom the only available HUT /Space Shuttle UV spec�tra obtained in 1995 at lower solar activity. A detailedcomparison of the intensities with the airglow modelpreviously used to analyse Venus and Mars ultravioletspectra [69] was conducted. Overall, it was found thatthe O, N2 and CO densities from the empirical VTS3model provide satisfactory agreement between the calcu�lated and the observed EUV airglow emissions [95, 96].
110
100
90
80
6040200
321_30–35
321_35–40321_40–45
321_50–55
317_15–20
271_15–20
Tan
gen
t al
titu
de,
km
Brightness, MR
76_35–40
Fig. 6. Examples of O2 emission profiles at 1.27 µm. Apurified from the thermal emission. The numbers of orbitsand the range of latitudes in which the averaging was car�ried out [91].

IZVESTIYA, ATMOSPHERIC AND OCEANIC PHYSICS Vol. 48 No. 3 2012
STUDIES OF THE PLANETARY ATMOSPHERES IN RUSSIA (2007–2010) 321
Atmospheric Dynamics
Morphology and dynamics of clouds from VMC andVIRTIS/Venus Express data. Circulation of the uppercloud layer of the Venus atmosphere was studied usingthe images of the cloud structure obtained by VenusMonitoring Camera in the UV, visible and IR spectralranges. The sequence of UV images obtained by theVMC allows to estimate the displacement of the cloudfeatures and to define the direction and speed of thewind. A significant database of estimated wind vectorswith uniform coverage in local time was created. Theperiod of observations envelops more than three Venu�sian years.
The cloud morphology on the cloud top level (~70 km)changes from chaotic structures with dominance of com�pact cloudy formations or cells in low latitudes (<40°)to more regular streaks, indicating quasi�laminarstreams in middle latitudes. In the polar region thecloud structures testify the presence of a huge globalvortex with a size of some thousand km [97]. Theobservation of the dayside of Venus in the UV demon�strates strong variability on a time scale of one day.This variability indicates fast dynamic and microphys�ical processes within the upper cloud level (Fig. 7).
Zonal and meridional profiles (Fig. 8) were con�structed by averaging of the whole data set. The speedof the zonal wind is nearly constant and equals to90 ± 10 m/s in low latitudes, reaches the maximum of
150
120
90
60
30–10
–20
–30
0
–40
–50
–60
–70
–90
–30
–80
Fig. 7. Venus was observed in UV spectral range (0.365 µm) by the VMC from the distance about 30000 km [89].

322
IZVESTIYA, ATMOSPHERIC AND OCEANIC PHYSICS Vol. 48 No. 3 2012
KORABLEV et al.
~100 m/s at latitude nearby 47° and quickly falls inhigh latitudes. The meridional component changeswithin 10�20 m/s. The accuracy of these measure�ments depends on latitude. Errors of averaging for thezonal component are 1.5�3 m/s (larger in the region ofmiddle�latitude jet and in the polar latitudes) and areabout 1.5 m/s for the meridional. Observations dem�onstrate the dependence of the zonal wind on the localsolar time.
The period of the atmosphere rotation on the equa�tor equals to five earth days, and decreases to a mini�mum of three days at latitude ~50° (Fig. 8a). Theretrieved meridional profile confirms the presence ofthe Hadley cell and allows defining its boundaries. Theascending branch of the Hadley cell is on the equatorand the descending is in the middle latitude region, atlatitudes ∼50° [98, 99].
Solar related dependences were registered for theentire data set of wind vectors obtained from VMCimages. The position of the zonal speed maximumvaries from orbit to orbit from 35° to 55° and dependson the local solar time. The value of zonal speed alsodepends on local time. Diurnal and semidiurnal com�
ponents could be tentatively identified. Consideringthe sampling limited by the dayside hemisphere, twodiurnal maxima of zonal speeds were detected: in themorning, around 8:30 local time, and in the evening,around 16:30, i.e., the maximum speeds are observednear the terminators [98].
Structure of the South polar vortex according toVIRTIS and VMC/Venus Express data. Vortex struc�tures in the polar regions also named as “Polar dipole”were observed both in northern and southern hemi�spheres. The polar vortex has been found for the firsttime in the northern polar region by Mariner 10 [100]in the UV spectral range. “S” structure of the dipolewas observed in the thermal IR�range from PioneerVenus [101]. The Fourier spectrometer experimenton�board Venera�15 (1983) demonstrated that theupper boundary of clouds around northern polardipole is lower than in surrounding areas, and theirtemperature is a little higher [102, 103]. These experi�ments dedicated to thermal sounding have detectedthe “cold collar” surrounding the polar dipole.
During Venus Express mission the circulation ofthe polar region is studied by imaging spectrometer
20
10
0
–10
–20
–80–60–40–200
–150
–130
–110
–90
–70
–50
–80–60–40–200
–30
–10
10
5
4
3
2
1
Zon
al w
ind,
m/s
Rot
atio
n p
erio
d, d
ays
Mer
idio
nal
win
d, m
/s
Latitude, deg
(a)
(b)
Fig. 8. Average profile obtained from VMC UV images: zonal speed (upper panel, solid line), meridional speed (low panel, solidline; negative velocity denotes movement from the equator to the pole).Dashed line on the upper panel corresponds to zonalperiod of the atmosphere rotation. The figure is based on ~35000 cloud displacement vectors collected over 6 Venus years.

IZVESTIYA, ATMOSPHERIC AND OCEANIC PHYSICS Vol. 48 No. 3 2012
STUDIES OF THE PLANETARY ATMOSPHERES IN RUSSIA (2007–2010) 323
VIRTIS. Images of a southern polar dipole in the shortwavelength IR�range are obtained with much higherspatial resolution than earlier. The structure of thesouthern polar dipole is studied in details (PioneerVenus and Venera�15 observed only the northerndipole).
Observations in the short wavelength IR�range onthe night side provide information on the structure anddynamics of the atmosphere below the main cloud layer.Observations are made in 1.74 and 2.35 μm (Fig. 9) spec�tral windows and in the ranges 3.7 and 5 μm, corre�sponding to different altitude layers. In all ranges glo�bal vortex near the pole is observed, confirming exist�ence of the dipole structure through the whole cloudlayer. High�altitude polar region with polar dipolerotates closely to solid�body rotation, in the directionof the zonal stream circulation. Atmospheric massesmake a complete rotation in 2.5 days. At the altitudes~50 km (1.74 μm) the rotation period in high latitudesis changing from 2.4 to 2.7 earth days. At the altitudesabout 63 km (3.7 μm) the rotational speed increases,the period being 1.9–2.6 earth days. The period corre�lates with the size of the polar vortex. The larger is itsdiameter, the longer is the rotation period, in accor�dance with conservation of the angular momentum.The centre of the vortex rotation normally doesn’tcoincide with the pole, and is shifted by a few degrees.Periodic structures associated with wave activity wereobserved both at cloud top level, and within the cloudlayer. The polar dipole demonstrates firm dependenceof the meridional speed on the local solar time. At thealtitude of 63 km the amplitude of changes of themeridional speed is systematically higher, than atheights of ~50 km [104].
Simultaneous imaging of southern polar regions inthe UV and IR ranges shows strong correlation ofmorphological details. Usually a dark ultra�violet ring
encircles the eye of polar vortex, well visible in the IRrange. Probably, this dark ring is formed by the strongjet flow in the polar latitudes. Spiral branches of thevortex begin in zone of the dark ring. Therefore, theUV contrast details on the disk of Venus are basicallythe features of thermal structure and dynamics at theupper cloud level [82].
The assumption based on the analysis of the move�ment vectors of atmospheric masses suggests the simi�larity between the polar dipole and terrestrial tropicalcyclones [105].
Cyclostrophic wind: preliminary analysis of VIR�TIS/Venus Express thermal sounding data. Data of theVIRTIS mapping spectrometer allow to study thethermal structure of the Venus mesosphere at altitudesof 60–95 km (see below). Using a cyclostrophic approx�imation wind fields can be retrieved from the tempera�ture fields assuming mean atmosphere. Obtained windfields have the following basic features: (1) middle�lati�tude jet related to the subpolar structure known as coldcollar; thermal wind speed in the jet equals to 80–90 ±10 m/s on the cloud top level (altitude ~70 km) at lat�itude 50° S; (2) wind speed decrease from the latitude60° S, approaching zero at 70° S; (3) decrease of windspeed over the jet with altitude.
Solar�related dependences of the temperature andzonal wind fields are analysed. At the nightside thetemperature on the cloud top level decreases by ~15 K,modifying the zonal wind field. The retrievedcyclostrophic thermal wind globally coincides withzonal wind patterns obtained from the cloud trackingfrom UV VMC images. The differences observed inthe middle and low latitudes may indicate the viola�tion of the cyclostrophic balance [106].
Atmospheric circulation at the altitude ~100 kmfrom apparent motions of oxygen nightglow details
0.12
0.08
0.04
2.42.01.61.20
Wavelength, micronsIntensity, W m–1 micron–1 sr–1
0 0.01 0.02
Inte
nsi
ty,
W m
–1 m
icro
n–
1 sr–
1
Intensity, W m–1 micron–1 sr–1
0 0.05 0.10
(а) (b)
Fig. 9. Night side images of the southern polar vortex of Venus obtained in 1.74 µm (a) and 2.3 µm (b) spectral bands. On the rightpanel the spectra of the night airglow concerning to the different part of the vortex are presented [89].

324
IZVESTIYA, ATMOSPHERIC AND OCEANIC PHYSICS Vol. 48 No. 3 2012
KORABLEV et al.
observed by VIRTIS/Venus Express. Using the seriesof images obtained on the night side by VIRTIS�Mspectrometer in the singlet oxygen airglow band (seeabove), and estimating apparent motions of thesedetails, the wind speed is retrieved. In part theseapparent motions reflect real movement of the airmasses at the altitudes of 95–107 km corresponding tothe peak of the airglow.
The night oxygen airglow is strongly inhomoge�neous, and its maximum is usually observed near themidnight meridian. Intense airglow was sometimesobserved in the southern polar region. Its structure isdiverse and strongly variable, both the small� and large�scale details can be used for wind tracking. The zonalcomponent of speed varies from –50 to +60 m/s, and themeridional one—from –30 to +30 m/s (uncertainty±10 m/s). Zonal and meridional speeds of oxygenclouds are strongly variable. However the mean zonalstream changes sign of speed near to the midnight. Thebrightest oxygen airglow takes place at latitudes wherethe converging meridional streams increasing concen�tration of the atomic oxygen are observed.
Mean horizontal circulation on the night side ofVenus is obtained by means spatial and temporal aver�aging of all apparent motions of the contrast details ofoxygen clouds. It consists of combination of the zonalsuperrotation and SS�AS cell. The solar�antisolar cir�culation of oxygen airglow is demonstrated: the atmo�spheric masses travel from the day side to the night sidevia terminators with the subsequent concentration inmiddle�latitude and equatorial areas about midnight[92, 107]. As considered above, below 90 km the maincomponent of the atmospheric circulation is the zonalsuperrotation. Above 90 km the movement from thesubsolar to antisolar point prevails, and speed changesthe sign about midnight. On the dayside the oxygenatoms are formed at ~90 km around noon, they moveupwards and are transferred to the nightside at~120 km. There they descend about midnight. Thissymmetry can be broken by waves of different origins.
Turbulence in the atmosphere of Venus. DifferentVenus Express observations have been considered inperception of atmospheric turbulence [108]. The tur�bulence is manifested in convective zones observed inradio occultation experiment [109], and waves of buoy�ancy and turbulent vortices apparent in UV images [97,110, 111]. Turbulent character of atmosphere is con�firmed also by the mixed vertical profiles of minor com�ponents [73, 75]. Change of character of the global circu�lation at altitude ~100 km observed on motions of oxygenairglow clouds (see Fig. 11) can be also interpreted as tur�bulence. Similar conclusions are made on the basis ofVenera�15 radio occultation data [112].
The review on the turbulence in atmospheres of theterrestrial planets is published [113].
The mechanism of superrotation of the Venusatmosphere involves several interconnected processes,including transfer of the rotational momentum fromthe planetary solid body to the atmosphere via topog�
raphy�generated airflows, transmission of themomentum to upper layers via three�dimensional tur�bulent vortex, inverse cascade of energy in large�scalequasi 2�D stream, and transmission of the rotationalmomentum horizontally trough Hadley cell. All theseprocesses contribute to the superrotation at differentaltitudes [114].
Atmospheric Structure
A warm layer in Venus night�side mesosphere fromSPICAV�SOIR/Venus Express data. The Venus meso�sphere is located between two regions of atmosphericcirculation: 4�days superrotation, which is observedon the cloud top, and subsolar�antisolar circulation inthe thermosphere (~100 km) with air upflow on thesubsolar side and transfer to the night side. A layer ofwarm air was first detected in SPICAV experiment inextended altitude range 90–120 km of the night side.This layer may come from adiabatic air heating in thedownflow, which is compensated by the upflow in thedayside [72].
Study of mesosphere structure from SOIR/VenusExpress data. The SOIR experiment dedicated tosolar occultations in IR range allows one to retrievevertical profiles of atmospheric constituents, includingH2O, CO, HCl and HF, and some of their isotopes inaltitude range 70–120 km (see above). In case of CO2,vertical profile can be obtained from 70 to 150 km,using several absorption bands. In parallel, rotationaltemperature can be calculated from the structure ofCO2 line. Technique of such retrievals was developedand demonstrated [115].
Temperature profiles of mesosphere from VIR�TIS/VEX observations. Global investigation of thethermal structure of the Venus mesosphere was firstmade in Fourier Spectrometer experiment on�boardVenera�16 [103]. Fourier�spectrometer PFS on VenusExpress is not operational, and monitoring of the tem�perature structure and thermal sounding is base on theretrievals from VIRTIS�M mapping spectrometer datain the CO2 4.3�μm band. Examples of VIRTIS�Mspectra in the range of this band are presented in [116,117]. At low latitudes, a monotonic decrease of inten�sity towards the center of the band tells about theincrease of the temperature with depth. Upon reach�ing a temperature gradient equal to the adiabatic con�vection, strong vertical mixing occurs. It brings theultraviolet absorber from the bottom of the cloudexplaining the large number of dark details at low lati�tudes. The pattern of temperature structure changesabruptly in the middle latitudes, where temperaturedecreases with depth, reaching a minimum at theupper boundary of clouds. Temperature inversion cre�ates stable stratification of the atmosphere, whichblocks the flow of matter from the bottom. Besides,low temperatures in the cold collar promote the for�mation of strong sulfuric acid mist making this areabright in the ultraviolet [117, 118].
IZVESTIYA, ATMOSPHERIC AND OCEANIC PHYSICS Vol. 48 No. 3 2012
STUDIES OF THE PLANETARY ATMOSPHERES IN RUSSIA (2007–2010) 325
Aerosol
Altimetry of the cloud tops and correlation ofdynamics and thermal structure with UV contrasts fromVIRTS and VMC/Venus Express data. Simultaneousobservations of Venus in the infrared by VIRTIS and inthe UV by VMC have been used for the first time tomap the details of the cloud top altitude and demon�strate that the ultraviolet markings are not related togaps in bright clouds but caused by the variations of theUV absorber connected to the thermal structure anddynamics of the atmosphere.
The cloud top altitude, defined as the unit opticaldepth, is retrieved from the depth of CO2 absorptionband at 1.5 μm. In low and middle latitudes the cloudtops are located at 74 ± 2 km. The altitude decreasespoleward of 50° and reaches 63–69 km in polarregions. This depression coincides with the eye of theplanetary vortex. Fast cloud motion results in varia�tions of the cloud top altitude of about 1 km over fewhours. Long�term variations of the cloud top altitudedo not exceed several hundred meters in low latitudesand are as large as several km in high latitudes. A weakmaximum is observed in equatorial region between the
subsolar point and evening terminator, where UVimages reveal a high convective activity. Convectivemixing brings ultraviolet absorbers from depth, mak�ing low latitudes appear relatively dark at these wave�lengths. In mid�latitudes, in the cold collar, deepinversions suppress the convection and block the sup�ply of absorbers, while cold temperatures createfavourable conditions for formation of bright sulphu�ric acid haze [98]. The polar depression in the cloudtops always coincides with the vortex eye observed byVIRTIS at thermal IR wavelength. Moreover, thedetailed structure of the altimetry maps shows highcorrelation with the thermal IR images at 5 μm,although the radiation at 5 μm comes from the levelslocated by several km lower than at 1.5 μm. Ultravioletdark spiral arms, which are often seen at about –70°and expand down to even lower latitudes, did notappear to be the gaps in the clouds, as it was believedbefore. They rather correspond to higher altitudesthan the surrounding brighter clouds or to the regionswith strong latitudinal gradient of the cloud top alti�tude. Simultaneous consideration of the cloud topaltimetry maps, UV dayside and IR nightside images
110
105
100
95
90
85
80
75
10–370
10–4 10–2
Alt
itud
e, k
m
Extinction coefficient β, km–1
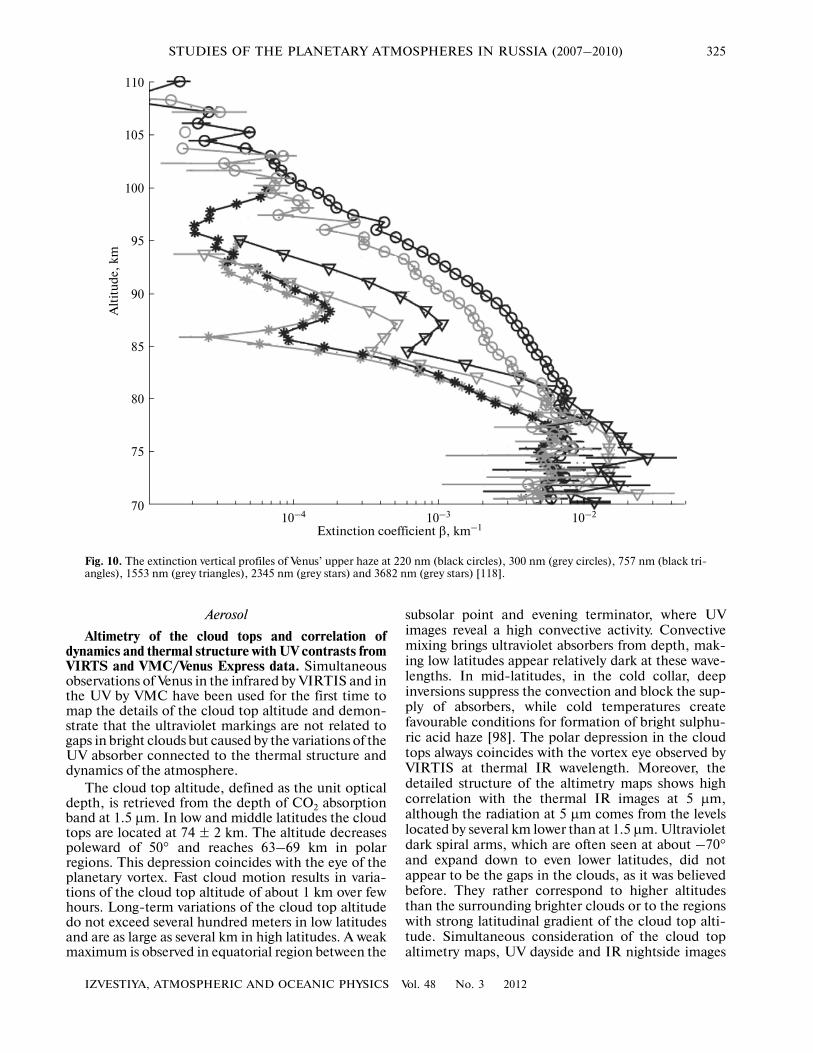
Fig. 10. The extinction vertical profiles of Venus’ upper haze at 220 nm (black circles), 300 nm (grey circles), 757 nm (black tri�angles), 1553 nm (grey triangles), 2345 nm (grey stars) and 3682 nm (grey stars) [118].
326
IZVESTIYA, ATMOSPHERIC AND OCEANIC PHYSICS Vol. 48 No. 3 2012
KORABLEV et al.
shows that the UV dark spiral arms and IR features arethe manifestations of the giant dynamic structure ofthe planetary scale polar vortex [82].
The vertical profiles of upper aerosol haze aboveclouds from SPICAV�SOIR/Venus Express solaroccultations. The three channels of the SPICAV�SOIR instrument (UV, visible�NIR and SOIR) per�form simultaneous measurements in solar occultationmode allowing to study the optical properties of aero�sol upper haze of Venus in an unprecedented spectralrange from 0.11 to 4.4 μm. The vertical profiles ofextinction have been retrieved at the altitudes from 70to 100 km. Due to the wide spectral range, the spectralbehaviour of extinction gives an unambiguous answerabout the size of particles in the assumption on the aero�sol composition. In the case of Venus this is sulphuric acidH2SO4 (80% H2O). The results show a bimodal particlesize distribution at altitudes below 80 km with the effec�tive radius of 0.1–0.2 μm and 1.5 μm, which allows todraw conclusions about various processes of formationand destruction of particles in the Venus mesosphere[118] (Fig. 10).
GIANT PLANETS AND THEIR SATELLITES
Jupiter
Remote sensing capabilities of Jupiter hot spots inthe IR spectral range. Jupiter’s atmosphere presentslimited regions of relatively thin cloud coverage (theso�called hot spots), which allow the thermal radiationfrom warmer, deeper atmospheric layers to be trans�mitted outwards. Hot spots therefore represent ameans for probing chemical composition below themain cloud deck. Payloads of future missions to Jupi�ter (Juno and EJSM) include spectro�imagers operat�ing in the infrared. Their coverage of 5 μm CH4 trans�parency windows makes them particularly suitable forthe investigation of the hot spots. The retrieval perfor�mance is evaluated for JIRAM/Juno and the VIRHISspectrometer proposed for EJSM. These instrumentsshould provide effective constraints on the mixingratios of water vapour and ammonia between 40 and70 km below the reference 1 bar pressure level (that isin the pressure range of 3.5�7 bars). Imaging capabili�ties of the instruments enable a number of studies cov�ering chemical and dynamical aspects of atmosphericevolution [119].
Saturn
Investigation of Saturn aurora. Images of Saturnaurora at the limb have been obtained with theAdvanced Camera for Surveys on the Hubble SpaceTelescope. They show that the peak of Saturn’s night�side emission is generally located 900–1300 km abovethe 1�bar level. On the other hand, methane and H2columns overlying the aurora have been determinedfrom the analysis of FUV and EUV spectra, respec�tively. Using a low�latitude model, these columns
place the emission layer at or above 610 km. One pos�sibility to solve this apparent discrepancy betweenimaging and spectral observations is to assume that thethermospheric temperature in the auroral regionsharply increases at a higher pressure level than in thelow�latitude regions. Using an electron transportcode, we estimate the characteristic energy of the pre�cipitated electrons derived from these observations tobe in the range 1–5 keV using low latitude model and5–30 keV in case of the modified model [120].
Titan
Numerical simulations of aerosols and comparisonwith Huygens data. Studies of the Titan aerosol hazemicrophysical properties based on Huygens landerdata were continued. Numerical experiments werecarried out using 1D self�consistent microphysicalmodel, taking into account coagulation, photoelectriccharging and ion/electron accretion. The modelresults are compared with the atmosphere soundingdata along lander’s descent path. It is shown that hazesize distributions are determined mainly by Coulombinteraction of coagulating particles. Above the tropo�pause the model predicts a bimodal distribution withcharacteristic monomer size of ~0.05 μm, which islikely determined by a Coulomb barrier of particlescarrying single elementary charge. The observedchange in the haze optical properties near the tropo�pause may be caused by two competing processes: cap�illary condensation of organic gases in the pores offractal aerosol particles and surface aging of particleswhose lifetime at the tropopause is longer than else�where in the atmosphere. Spectra and phase functionsof aggregates containing up to 3000 monomers havebeen calculated. Optical properties of fractal aggre�gates were assessed using discrete dipole approxima�tion in order to obtain additional information on theparticles microstructure from Huygens polarimetrydata [121, 122].
General circulation modelling of the Titan atmo�sphere and interpretation of Huygens data. A non�hydrostatic general circulation model of the Titanatmosphere has been developed for the altitude range0–250 km, based on the complete equation system ofthe elastic viscous gas dynamics. Simulations were car�ried out in the relaxation approximation with specifiedthermal profile. The model reproduces the superrotationof Titan atmosphere, polar vortices, and global patternstypical for thermal tides. Vertical profile of zonal windcomponent along the Huygens lander descent path hasbeen quantitatively reproduced [123].
CONCLUSIONS
As previously, the most of the experimental studiesin 2007–2010 have been carried out by groups of Rus�sian scientists involved in the foreign planetary mis�sions, in partcular, Venus Express and Mars Express.

IZVESTIYA, ATMOSPHERIC AND OCEANIC PHYSICS Vol. 48 No. 3 2012
STUDIES OF THE PLANETARY ATMOSPHERES IN RUSSIA (2007–2010) 327
The operation of these satellites is far from complete.The European Space Agency plans to support the sci�ence operations at least up to the end of 2012. It is esti�mated that the Mars Express propellant will be suffi�cient for at least three years. Thereby, the investiga�tions are going on. In parallel, the generalization of theresults is started. The studies of Mars atmosphere andclimate planned in the frame of Phobos�Grunt mis�sion have not happened: in November 2011 the SC hasnot left the earth orbit. One of the goals of the projectwas to study the Martian atmosphere and climateremotely from the orbit [124]; in particular, sensitivemeasurements of methane were planned [125]. Thesestudies are expected to be continued in the frame workof ESA�Roscosmos cooperation on ExoMars projects(launches planned in 2016 and 2018). The futureprojects dedicated to the studies of the atmospheres ofVenus are more ambiguous. European M�class pro�posal EVE with planned considerable Russian contri�bution [126] has missed selection, and future plans ofleading space agencies regarding Venus are not clear atthis moment.
ACKNOWLEDGMENTS
The fabrication of the Russian contribution to thepayload of Mars Express and Venus Express projectsand operation support is funded by Roscosmos in theframe work of the Federal space program of Russia.The studies included in the Report are supported bythe Russian Foundation for Basic Research, projectnos. 06�02�72563�CNRSL_a, 07�02�00850�a, 07�02�00995�a, 08�02�00263a, 08�02�01383�a, 10�02�01260a, and 10�02�93116�CNRSL_a.
REFERENCES1. Russian National Report Meteorology and Atmospheric
Sciences 2007–2010, National Geophysical CommitteeRAS, Ed. by I. I. Mokhov and A. A. Krivolutsky(MAKS Press, Moscow, 2011).
2. I. I. Mokhov, “Russian Investigations in Meteorologyand Atmospheric Sciences in 2007–2010,” Izv.,Atmos. Ocean. Phys. 48 (2012).
3. O. I. Korablev, L. V. Zasova, A. A. Fedorova, et al.,“New in the Physics of Planetary Atmosphere,” Izv.,Atmos. Ocean. Phys. 45 (4), 503–516 (2009).
4. J. P. Bibring, Y. Langevin, F. Altieri, et al., “OMEGA:Observatoire pour la Minéralogie, l’Eau, les Glaces etl’Activité,” ESA SP�1291, 75–95 (2009).
5. V. Formisano, F. Angrilli, G. Arnold, et al., “PFS:Planetary Fourier Spectrometer,” ESA SP�1291, 115–137 (2009).
6. J. L. Bertaux, O. Korablev, D. Fonteyn, et al., “SPI�CAM: Spectroscopy for the Investigation of the Char�acteristics of the Atmosphere of Mars,” ESA SP�1291,139–197 (2009).
7. D. V. Titov, H. Svedhem, D. McCoy, et al., “VenusExpress: Science, Instrumentation, and Mission Sce�narios,” Kosm. Issled. 44 (4), 349–364 (2006).
8. H. Svedhem, D. V. Titov, D. McCoy, et al., “VenusExpress—The First European Mission To Venus,”Planet. Space Sci. 55, 1636–1652 (2007).
9. H. Svedhem, D. Titov, F. Taylor, et al., “Venus ExpressMission,” J. Geophys. Res. 114, E00B33 (2009).
10. V. Formisano, F. Angrilli, G. Arnold, et al., “The Plan�etary Fourier Spectrometer (PFS) Onboard the Euro�pean Venus Express Mission,” Planet. Space Sci. 54,1298–1314 (2006).
11. P. Drossart, G. Piccioni, A. Adriani, et al., “ScientificGoals for the Observation of Venus by VIRTIS onESA/Venus Express Mission,” Planet. Space Sci. 55,1653–1672 (2007).
12. W. J. Markiewicz, D. V. Titov, N. Ignatiev, et al.,“Venus Monitoring Camera for Venus Express,”Planet. Space Sci. 55, 1701–1711 (2007).
13. D. V. Titov, H. Svedhem, D. Koschny, et al., “VenusExpress Science Planning,” Planet. Space Sci. 54,1279–1297 (2006).
14. D. Koschny, D. V. Titov, R. Hoofs, et al., “The VenusExpress Science Planning and Commanding,” ESASP�1295, 1–13 (2007).
15. J. L. Bertaux, D. Nevejans, O. Korablev, et al., “SPICAVon Venus Express: Three Spectrometers to Study theGlobal Structure and Composition of the Venus Atmo�sphere,” Planet. Space Sci. 55, 1673–1700 (2007).
16. O. I. Korablev, J. L. Bertaux, and I. I. Vinogradov,“Compact High�Resolution IR Spectrometer forAtmospheric Studies,” in Infrared Spaceborne RemoteSensing X, SPIE Proceedings , Vol. 4818, pp. 272–281(2002).
17. O. I. Korablev, J. L. Bertaux, I. I. Vinogradov, et al.,“Compact High�Resolution Echelle�AOTF NIRSpectrometer for Atmospheric Measurements,” ESASP�554, 73–80 (2004).
18. D. Nevejans, E. Neefs, E. van Ransbeeck, et al.,“Compact High�Resolution Spaceborne EchelleGrating Spectrometer with Acousto�Optical TunableFilter Based Order Sorting for the Infrared Domainfrom 2.2 to 4.3 μm,” Appl. Opt. 45, 5191–5206(2006).
19. A. Mahieux, S. Berkenbosh, R. Clairquin, et al., “In�Flight Performance and Calibration of SPICAV SOIRon board Venus Express,” Appl. Opt. 47, 2252–2265(2008).
20. A. Mahieux, V. Wilquet, R. Drummond, et al., “A NewMethod for Determining the Transfer Function of anAcousto Optical Tunable Filter,” Optics Express 17(3), 2005–2014 (2009).
21. A. Chicarro, O. G. Witasse, and A. P. Rossi, “MarsExpress: Summary of Scientific Results,” ESA SP�1291, 3–11 (2009).
22. H. Svedhem, D. V. Titov, F. W. Taylor, et al., “Venus asa More Earth�Like Planet,” Nature 450, 629–632(2007).
23. D. V. Titov, F. W. Taylor, and H. Svedhem, “Introduc�tion to the Special Section on Venus Express: Resultsof the Nominal Mission,” J. Geophys. Res. 113,E00B19 (2008).

328
IZVESTIYA, ATMOSPHERIC AND OCEANIC PHYSICS Vol. 48 No. 3 2012
KORABLEV et al.
24. D. V. Titov, H. Svedkhem, F. W. Teilor, et al., “VenusExpress: Main Results of of the First Stage of the Mis�sion,” Astron. Vestn. 43 (3), 195–217 (2009).
25. R. E. Johnson, M. R. Combi, J. L. Fox, et al., “Exo�spheres and Atmospheric Escape,” Space Sci. Rev.139, 355–397 (2008).
26. K. Liu, E. Kallio, R. Jarvinen, et al., “Hybrid Simula�tions of the O+ Ion Escape from Venus: Influence ofthe Solar Wind Density and the IMF X Component,”Adv. Space Res. 43, 1436–1441 (2009).
27. H. I. M. Lichtenegger, H. Gröller, H. Lammer, et al.,“On the Elusive Hot Oxygen Corona of Venus,” Geo�phys. Res. Lett. 36, L10204 (2009).
28. V. I. Shematovich, “Chemistry of Ionization of IceSatellites in H2O�Dominant Atmospheres,” Astron.Vestn. 42 (6), 505–520 (2008).
29. A. A. Berezhnoi, “The Role of Photochemical Pro�cesses in the Evolution of the Isotope Composition ofTitan’s Atmosphere,” Astron. Vestn. 44 (6), 530–538(2010).
30. V. I. Shematovich, “Ultraviolet Emissions in the Plan�etary Atmospheres,” Astrophys. Space Sci. (2011).
31. I. Yoshikawa, S. Kameda, K. Hikosaka, et al.,“Attempt to Identify a Source Mechanism of Mer�cury’s Sodium Exosphere by a Spectrometer usingFabry Perot Etalon,” Adv. Space Res. 42, 1172–1179(2008).
32. I. Yoshikawa, O. Korablev, S. Kameda, et al., “TheMercury Sodium Atmospheric Spectral Imager for theMMO Spacecraft of Bepi Colombo,” Planet. SpaceSci. 58, 224–237 (2010).
33. E. Chassefiére, J.�L. Maria, J.�P. Goutail, et al.,“PHEBUS: A Double Ultraviolet Spectrometer toObserve Mercury’s Exosphere,” Planet. Space Sci. 58,201–223 (2010).
34. O. Witasse, T. Cravens, M. Mendillo, et al., “SolarSystem Ionospheres,” Space Sci. Rev. 139, 235–265(2008).
35. Y.�J. Ma, K. Altwegg, T. Breus, et al., “Plasma Flowand Related Phenomena in Planetary Aeronomy,”Space Sci. Rev. 139, 311–353 (2008).
36. A. L. Gavrik, A. G. Pavel’ev, and Yu. A. Gavrik,“Detection of Ionospheric Layers on the Dayside ofVenus Ionosphere at a Height of 80–120 km by Dual�Frequency Radio Occultation Data on Venera�15 andVenera�16 Space Vehicles,” Solar�Terr. Phys. 12 (2),203–205 (2008).
37. A. G. Pavelyev, Y. A. Liou, J. Wickert, et al., “EikonalAcceleration Technique for Studying of the Earth andPlanetary Atmospheres by Radio OccultationMethod,” Geophys. Rev. Lett. 36, L21807 (2009).
38. M. L. Litvak, I. G. Mitrofanov, A. S. Kozyrev, et al.,“Long�Term Observations of Southern Winters onMars: Estimations of Column Thickness, Mass, andVolume Density of the Seasonal CO2 Deposit fromHEND/Odyssey Data,” J. Geophys. Res. 112, 13(2007).
39. M. L. Litvak, I. G. Mitrofanov, A. S. Kozyrev, et al.,“Long�Term Observations of the Southern SeasonalCap of Mars from Neutron Measurement Data
Obtained by HEND on board 2001 Mars Odyssey,”Astron. Vestn. 41 (5), 417–426 (2007).
40. R. O. Kuz’min, E. V. Zabalueva, I. G. Mitrofanov,et al., “Seasonal Redistribution of Water in the SurfaceLayer of the Mars Regolith from Data Obtained byHEND on board Mars Odyssey,” Astron. Vestn. 41 (2),99–112 (2007).
41. N. E. Demidov, U. V. Bointon, D. A. Gilichinskii,et al., “Distribution Laws of Water in Permafrost Areasof Mars from Joint Analysis HEND (Mars Odissei)and MOLA (Mars Global Serveior) Data,” Pis’maAstron. Zhurn. 34 (10), 788–800 (2007).
42. N. A. Evdokimova, R. O. Kuz’min, A. V. Rodin, et al.,“Study of the Distribution of Bound Water, Water Iceand Frost on the Surface Mars: Processing and Cor�rection of Observation Data from the OMEGA Spec�trometer on Board Mars Express,” Astron. Vestn.43 (5), 387–405 (2009).
43. A. V. Rodin, N. A. Evdokimova, R. O. Kuz’min, et al.,“Traces of Atmospheric Planetary Waves in theDynamics of Seasonal Sublimation and Condensationin Polar Regions of Mars from the OMEGA IR�Hyperspectrometer on Board Mars Express,” Kosm.Issl. 48 (2), 153–160 (2010).
44. B. M. Jakosky and C. B. Farmer, “The Seasonal andGlobal Behavior of Water Vapor in the Mars Atmo�sphere—Complete Global Results of the VikingAtmospheric Water Detector Experiment,” J. Geo�phys. Res. 87, 2999–3019 (1982).
45. M. D. Smith, “Interannual Variability in TES Atmo�spheric Observations of Mars During 1999–2003,”Icarus 167, 148–165 (2004).
46. T. Fouchet, E. Lellouch, N. I. Ignatiev, et al., “MartianWater Vapour: Mars Express PFS/LW Observations,”Icarus 190, 32–49 (2007).
47. R. Melchiorri, T. Encrenaz, T. Fouchet, et al., “WaterVapour Mapping on Mars Using OMEGA/MarsExpress,” Planet. Space Sci. 55, 333–342 (2007).
48. L. Maltagliati, D. Titov, Th. Encrenaz, et al., “AnnualSurvey of Water Vapor Behavior from the OMEGAMapping Spectrometer Onboard Mars Express,”Icarus 213, 480–495 (2011).
49. M. Tschimmel, N. I. Ignatiev, D. V. Titov, et al.,“Investigation of Water Vapour on Mars with PFS/SWof Mars Express,” Icarus 195, 557–575 (2008).
50. O. Korablev, “Atmospheric Water from Mars ExpressExperiments,” in Proceedings of the 37th COSPAR Sci�entific Assembly, July 13–20, 2008, Montreal, Canada,p. 1580.
51. M. D. Smith, “Mars Water Vapor Climatology fromMGS/TES,” in Proceedings of the Water Vapor CycleWorkshop, April 21–23, 2008, Paris, France. http://www.aero.jussieu.fr/info�pratique/seminaire/MarsWC�Site/Progmon2_files/1_Smith_TESclimatology_MWCW2008.pdf.
52. A. A. Fedorova, A. Yu. Trokhimovsky, O. Korablev,et al., “Viking Observation of Water Vapor on Mars:Revision from Up�to�Date Spectroscopy and Atmo�spheric Models,” Icarus 208, 156–164 (2010).
53. R. T. Clancy, M. J. Wolff, and P. R. Christensen, “MarsAerosol Studies with the MGS TES Emission Phase

IZVESTIYA, ATMOSPHERIC AND OCEANIC PHYSICS Vol. 48 No. 3 2012
STUDIES OF THE PLANETARY ATMOSPHERES IN RUSSIA (2007–2010) 329
Function Observations: Optical Depths, ParticleSizes, and Ice Cloud Types Versus Latitude and SolarLongitude,” J. Geophys. Res. 108 (2003).
54. A. A. Fedorova, A. V. Rodin, and I. V. Baklanova,“MAWD Observations Revisited: Seasonal Behaviorof Water Vapor in the Martian Atmosphere,” Icarus171, 54–67 (2004).
55. L. Maltagliati, D. V. Titov, Th. Encrenaz, et al.,“Observations of Atmospheric Water Vapor Above theTharsis Volcanoes on Mars with the OMEGA/MExImaging Spectrometer,” Icarus 194, 53–64 (2008).
56. T. Encrenaz, T. Fouchet, R. Melchiorri, et al.,“A Study of the Martian Water Vapor over Hellas usingOMEGA and PFS Aboard Mars Express,” Astron.Astrophys. 484, 547–553 (2008).
57. A. Fedorova, O. Korablev, J.�L. Bertaux, et al., “SolarInfrared Occultations by the SPICAM Experiment onMars�Express: Simultaneous Observations of H2O,CO2 and Aerosol Vertical Distribution,” Icarus 200,96–117 (2009).
58. L. Maltagliati, A. Fedorova, F. Montmessin, et al.,“Water vapor Vertical Profiles in Mars’ Atmosphere bySPICAM/MEx Solar Occultations,” in EGU GeneralAssembly May 2–7, 2010, Vienna, Austria, p. 12392.
59. A. V. Vasil’ev, B. S. Maiorov, J. P. Bibring, “Recon�struction of Altitude Profiles of Microphysical Char�acteristics of Martian Aerosols by Limb MeasurementsOMEGA Spectrometer of Mars Express Mission,”Astron. Vestn. 43 (5), 406–418 (2009).
60. A. V. Burlakov and A. V. Rodin, “One�DimensionalNumerical Model of the Kinetics of H2O Cloud For�mation in the Martian Atmosphere,” Astron. Vestn.46 (1), 21–33 (2012).
61. F. Lefevre, S. Lebonnois, F. Montmessin, et al.,“Three�Dimensional Modeling of Ozone on Mars,”J. Geophys. Res. 109, E07004 (2004).
62. F. Lefevre, J.�L. Bertaux, S. Perrier, et al., “The Mar�tian Ozone Layer as Seen by SPICAM/Mars�Express,” Proceedings of the Seventh InternationalConference on Mars, July 9–13, 2007, p. 3137.
63. S. Perrier, J. L. Bertaux, S. Lebonnois, et al., “GlobalDistribution of Total Ozone on Mars from /MEX UVMeasurements,” J. Geophys. Res. 111, E09S06(2006).
64. F. Altieri, L. Zasova, E. D’Aversa, et al., “O2 1.27 μmEmission Maps as Derived from OMEGA/MEx Data,”Icarus 204, 499–511 (2009).
65. A. Migliorini, F. Altieri, L. Zasova, et al., “OxygenAirglow Emission on Venus and Mars as Seen by VIR�TIS/VEX and OMEGA/MEX Imaging Spectrome�ters,” Planet. Space Sci. 59, 981–987 (2011).
66. L. D. Kaplan, J. Connes, and P. Connes, “CarbonMonoxide in the Martian Atmosphere,” Astron. J.157, L187–L192 (1969).
67. V. A. Krasnopolsky, “Long�Term SpectroscopicObservations of Mars using IRTF/CSHELL: Mappingof O2 Dayglow, CO and Search for CH4,” Icarus 190,93–102 (2007).
68. F. Billebaud, J. Brillet, E. Lellouch, et al., “Observa�tions of CO in the Atmosphere of Mars with PFS
Onboard Mars Express,” Planet. Space Sci. 57, 1446–1457 (2009).
69. V. I. Shematovich, D. V. Bisikalo, J.�C. Gérard, et al.,“Monte Carlo Model of Electron Transport for theCalculation of Mars Dayglow Emissions,” J. Geophys.Res. 113, E02011 (2008).
70. V. I. Shematovich, G. A. Tsvetkov, M. A. Krest’yani�kova, et al., “Stochastic Models Hot Planetary andSatellite Coronas: Total Water Loss in the MartianAtmosphere,” Astron. Vestn. 41 (2), 113–119 (2007).
71. C. De Bergh, V. I. Moroz, F. W. Taylor, et al., “Com�position of the Atmosphere of Venus Below theClouds,” Planet. Space Sci. 54, 1389–1397 (2006).
72. J. L. Bertaux, A. C. Vandaele, O. Korablev, et al., “AWarm Layer in Venus’ Cryosphere and High AltitudeMeasurements of HF, HCl, H2O and HDO,” Nature450, 646–649 (2007).
73. A. Fedorova, O. Korablev, A. C. Vandaele, et al.,“HDO and H2O Vertical Distributions and IsotopicRatio in the Venus Mesosphere by SOIR Spectrometeron Board Venus Express,” J. Geophys. Res. 113,E00B22 (2008).
74. V. Cottini, N. I. Ignatiev, G. Piccioni, et al., “WaterVapor Near the Cloud Tops of Venus from VenusExpress/VIRTIS Dayside Data,” Icarus (2011).
75. A. C. Vandaele, M. De Maziere, R. Drummond, et al.,“Composition of the Venus Mesosphere Measured bySolar Occultation at Infrared on Board VenusExpress,” J. Geophys. Res. 113, E00B23 (2008).
76. N. Iwagami, S. Ohtsuki, K. Tokuda, et al., “Hemi�spheric Distributions of HCl Above and Below theVenus’ Clouds by Ground�Based 1.7 μm Spectros�copy,” Planet. Space Sci. 56, 1424–1434 (2008).
77. G. M. Keating, J.�L. Bertaux, S. W. Bougher, et al.,VIRA (Venus International Reference Atmosphere)Models of Venus Neutral Upper Atmosphere: Structureand Composition, Ed. by A. J. Kliore, V. I. Moroz, andG. M. Keating, Adv. Space Res. 5, 117–171 (1985).
78. R. T. Clancy, B. Sandor, and G. H. Moriarty�Schieven, “Observational Definition of the VenusMesopause: Vertical Structure, Diurnal Variation, andTemporal Instability,” Icarus 161, 1–16 (2003).
79. D. Belyaev, O. Korablev, A. Fedorova, et al., “FirstObservations of SO2 Above Venus’ Clouds by Means ofSolar Occultation in the Infrared,” J. Geophys. Res.113, E00B25 (2008).
80. D. A. Belyaev, F. Montmessin, J. L. Bertaux, et al.,“Vertical Profiling of SO2 and SO Above Venus’ Cloudsby SPICAV/SOIR Solar Occultations,” Icarus (2011).
81. E. Marcq, D. Belyaev, F. Montmessin, et al., “AnInvestigation of the SO2 Content of the VenusianMesosphere Using SPICAV�UV in Nadir Mode,”Icarus 211, 58–69 (2011).
82. N. I. Ignatiev, D. V. Titov, G. Piccioni, et al., “Altime�try of the Venus Cloud Tops from the Venus ExpressObservations,” J. Geophys. Res. 114, E00B43 (2009).
83. J. L. Bertaux, A. C. Vandaele, V. Wilquet, et al., “FirstObservation of 628 CO2 Isotope Band at 3.3 μm in theAtmosphere of Venus by Solar Occultation from VenusExpress,” Icarus 195, 28–33 (2008).

330
IZVESTIYA, ATMOSPHERIC AND OCEANIC PHYSICS Vol. 48 No. 3 2012
KORABLEV et al.
84. V. Wilquet, A. Mahieux, A. C. Vandaele, et al., “LineParameters for the 01111–00001 Band of 12C16O18Ofrom SOIR Measurements of the Venus Atmosphere,”J. Quantit. Spectroscop. Radiat. Transf. 109, 895–905(2008).
85. G. Villanueva, M. J. Mumma, R. Novak, et al., “Iden�tification of a New Band System of Isotopic CO2 Near3.3 μm: Implications for Remote Sensing of Biomar�ker Gases on Mars,” Icarus 195, 34–44 (2008).
86. A. B. Meinel, “OH Emission Band in the Spectrum ofthe Night Sky. I,” Astrophys. J. 111, 555–564 (1950).
87. S. K. Atreya and Z. G. Gu, “Stability of the MartianAtmosphere. Is Geterogeneous Catalisis Essential?,”J. Geophys. Res. 99, 13133–13145 (1994).
88. V. A. Krasnopol’skii, A. A. Krys’ko, and V. N. Rogachev,“UV�Photometry of Mars on the Mars�5 Satellite,”Kosm. Issl. 15 (2), 255–260 (1977).
89. G. Piccioni, P. Drossart, L. Zasova, et al., “FirstDetection of Hydroxyl in the Atmosphere of Venus,”Astron. Astrophys. 483, L29–L33 (2008).
90. P. Connes, J. F. Noxon, W. A. Traub, et al., “O2(a1Δg)Emission in the Day and Night Airglow of Venus,”Astrophys. J. 233, L29–L32 (1979).
91. G. Piccioni, L. Zasova, A. Migliorini, et al., “Near�IROxygen Nightglow Observed by VIRTIS in the VenusUpper Atmosphere,” J. Geophys. Res. 114, E00B38(2009).
92. P. Drossart, G. Piccioni, J. C. Gérard, et al., “ADynamic Upper Atmosphere of Venus as Revealed byVIRTIS on Venus Express,” Nature 450, 641–645(2007).
93. A. V. Shakun, L. V. Zasova, J. Piccioni, et al., “Studyof O2(a1Δg) Glow on Venus Nighside from Nadir Dataof the VIRTIS�M/Venera�Ekspress,” Kosm. Issl. 48(3), 239–245 (2010).
94. J. C. Gérard, B. Hubert, V. I. Shematovich, et al.,“The Venus Ultraviolet Oxygen Dayglow and Aurora:Model Comparison with Observations,” Planet. SpaceSci. 56, 542–552 (2008).
95. B. Hubert, J. C. Gérard, J. Gustin, et al., “UVISObservations of the FUV OI and CO 4P Venus Day�glow During the Cassini Flyby,” Icarus 207, 549–557(2010).
96. J.�C. Gérard, B. Hubert, J. Gustin, et al., “EUV Spec�troscopy of the Venus Dayglow with UVIS onCassini,” Icarus 211, 70–80 (2011).
97. W. J. Markiewicz, D. V. Titov, S. S. Limaye, et al.,“Morphology and Dynamics of the Upper CloudLayer of Venus,” Nature 450, 633–636 (2007).
98. D. V. Titov, F. W. Taylor, H. Svedhem, et al., “Atmo�spheric Structure and Dynamics as the Cause of Ultra�violet Markings in the Clouds of Venus,” Nature 456,620–623 (2008).
99. R. Moissl, I. Khatuntsev, S. S. Limaye, et al., “VenusCloud Top Winds from Tracking UV Features in VenusMonitoring Camera Images,” J. Geophys. Res. 114,B31 (2009).
100. B. C. Murray, M. J. S. Belton, G. E. Danielson, et al.,“Venus: Atmospheric Motion and Structure from
Mariner 10 Pictures,” Science 183, 1307–1315(1974).
101. F. W. Taylor, R. Beer, M. T. Chahine, et al., “Structureand Meteorology of the Middle Atmosphere of VenusInfrared Remote Sensing from the Pioneer Orbiter,”J. Geophys. Res. 85, 7963–8006 (1980).
102. L. V. Zasova, V. I. Moroz, V. M. Linkin, et al., “Struc�ture of the Venus Atmosphere from the Surface up to100 km,” Kosm. Issl. 44 (4), 381–400 (2006).
103. L. V. Zasova, N. Ignatiev, I. Khatuntsev, et al., “Struc�ture of the Venus Atmosphere,” Planet. Space Sci. 55,1712–1728 (2007).
104. G. Piccioni, P. Drossart, A. Sanchez�Lavega, et al.,“South�Polar Features on Venus Similar to ThoseNear the North Pole,” Nature 450, 637–640 (2007).
105. S. Limaye, J. P. Kossin, Ch. Rozoff, et al., “Vortex Cir�culation on Venus: Dynamical Similarities with Ter�restrial Hurricanes,” Geophys. Rev. Lett. 36, L04204(2009).
106. A. Piccialli, D. Titov, D. Grassi, et al., “CyclostrophicWinds from the Visible and Infrared Thermal ImagingSpectrometer Temperature Sounding: a PreliminaryAnalysis,” J. Geophys. Res. 113, E00B11 (2008).
107. R. Hueso, A. Sanchez�Lavega, G. Piccioni, et al.,“Morphology and Dynamics of Venus Oxygen Airglowfrom Venus Express/Visible and Infrared ThermalImaging Spectrometer Observations,” J. Geophys.Res. 113, B02 (2008).
108. M. N. Izakov, “Venus Express Spacecraft: Confirma�tion of Turbulence in the Mesosphere of Venus,”Astron. Vestn. 44 (2), 99–107 (2010).
109. S. Tellmann, M. Patzold, B. Hausler, et al., “Structureof the Venus Neutral Atmosphere As Observed by theRadio Science Experiment VeRa on Venus Express,” J.Geophys. Res. 114, B36 (2009).
110. J. Peralta, R. Hueso, A. Sanchez�Lavega, et al.,“Characterization of Mesoscale Gravity Waves in theUpper and Lower Clouds of Venus from VEX�VIRTISImages,” J. Geophys. Res. 113, B18 (2008).
111. M. N. Izakov, “Dissipation of Buoyancy and Turbu�lence Waves in the Venus Atmosphere,” Astron. Vestn.44 (6), 507–518 (2010).
112. V. N. Gubenko and V. E. Andreev, “The Identificationof the Fluctuation Effects related to the Turbulenceand “Permanent” Layers in the Atmosphere of Venusfrom Radio Occultation Data,” Astron. Astrophys.Trans 26 (6), 507–515 (2007).
113. M. N. Izakov, “Turbulence in the Free Atmospheres ofEarth, Mars, and Venus (Review),” Astron. Vestn.41 (5), 387–416 (2007).
114. M. N. Izakov, “On a Possible Mechanism of Superro�tation of the Venus Atmosphere,” Astron. Vestn.45 (3), 247–252 (2011).
115. A. Mahieux, A. C. Vandaele, E. Neefs, et al., “Densi�ties and Temperatures in the Venus Mesosphere andLower Thermosphere Retrieved from SOIR on BoardVenus Express: Retrieval Technique,” J. Geophys.Res. 115, E12014 (2010).
116. D. Grassi, A. Migliorini, L. Montabone, et al., “Ther�mal Structure of Venusian Nighttime Mesosphere as

IZVESTIYA, ATMOSPHERIC AND OCEANIC PHYSICS Vol. 48 No. 3 2012
STUDIES OF THE PLANETARY ATMOSPHERES IN RUSSIA (2007–2010) 331
Observed by VIRTIS�Venus Express,” J. Geophys.Res. 115, E09007 (2010).
117. D. Grassi, P. Drossart, G. Piccioni, et al., “Retrieval ofAir Temperature Profiles in the Venusian Mesospherefrom VIRTIS�M Data: Description and Validation ofAlgorithms,” J. Geophys. Res. 113, E00B09 (2008).
118. V. Wilquet, A. Fedorova, F. Montmessin, et al., “Char�acterization of the Upper Haze by SPICAV/SOIRSolar Occultation in UV to Mid�IR Onboard VenusExpress,” J. Geophys. Res. 114, B42 (2009).
119. D. Grassi, A. Adriani, M. L. Moriconi, et al., “Jupi�ter’s Hot Spots: Quantitative Assessment of theRetrieval Capabilities of Future IR Spectro�Imagers,”Planet. Space Sci. 58, 1265–1278 (2010).
120. J. C. Gerard, B. Bonfond, J. Gustin, et al., “Altitude ofSaturn’s Aurora and Its Implications for the Charac�teristic Energy of Precipitated Electrons,” Geophys.Rev. Lett. 36, L02202 (2009).
121. Yu. V. Skorov, H. U. Keller, and A. V. Rodin, “OpticalProperties of Aerosols in Titan’s Atmosphere,” Planet.Space Sci. 56, 660–668 (2008).
122. Yu. V. Skorov, H. U. Keller, and A. V. Rodin, “OpticalProperties of Aerosols in Titan’s Atmosphere: LargeFluffy Aggregates,” Planet. Space Sci. 58, 1802–1810(2010).
123. I. V. Mingalev, V. S. Mingalev, O. V. Mingalev, et al.,“Numerical Simulation of the Circulation of Titan’sAtmosphere: Interpretation of Huygens SoundingData,” Kosm. Issl. 47 (2), 134–145 (2009).
124. L. M. Zelenyi, A. V. Zakharov, G. M. Polishchuk,et al., “Phobos�Grunt Expedition Project,” Astron.Vestn. 44 (1), 17–28 (2010).
125. O. I. Korablev, A. V. Grigor’ev, B. E. Moshkin, et al.,“AOST: Fourier�Spectrometer for Studying Mars andPhobos,” Astron. Vestn. 46 (1) 31–40 (2012).
126. E. Chassefiere, O. Korablev, T. Imamura, et al.,“European Venus Explorer (EVE): An In�situ Missionto Venus,” Exper. Astron. 23, 741–760 (2009).