studies on growth kinetics of nanoparticles formation in...
TRANSCRIPT

Studies on Growth Kinetics of Nanoparticles
Formation In Bulk Solution
A Project submitted to the National Institute of Technology, Rourkela
In partial fulfilment of the requirements
for Bachelor of Technology (Chemical Engineering)
By
Subhasish Panigrahi
Roll No. 10600028
Under the guidance of Dr. Santanu Paria
DEPARTMENT OF CHEMICAL ENGINEERING NATIONAL INSTITUTE OF TECHNOLOGY, ROURKELA
ORISSA -769008, INDIA 2010

ii
DEPARTMENT OF CHEMICAL ENGINEERING NATIONAL INSTITUTE OF TECHNOLOGY,
ROURKELA -769 008, INDIA
CERTIFICATE
The project report entitled “Studies on growth kinetics of nanoparticles formation in bulk
solution”, submitted for the partial fulfilment for the degree of Bachelor of Technology in
Chemical Engineering, National Institute of Technology, Rourkela.
SUBHASISH PANIGRAHI Roll. No-10600028
Dr. S. Paria Department of Chemical Engineering
National Institute of Technology Rourkela - 769008
INDIA

iii
ACKNOWLEDGEMENT
It is with a feeling of great pleasure that I express my most sincere heartfelt gratitude to Dr.
Santanu Paria for suggesting the topic for my project and for his ready and able guidance
throughout the course of preparing this report. I am greatly indebted to him for constructive
suggestions and criticism from time to time during the progress of my work.
I thank the staff members of my department for their invaluable help and guidance. I owe a
depth of gratitude to Prof. S. K. Agarwal, H.O.D, Department of Chemical Engineering, for
all the facilities provided during the course of my tenure and for giving me good suggestions
and encouraging me during my work. A special thanks to my Ph.D seniors Mr. Rajib Ghosh
Chaudhury, Mr. Nihar Ranjan Biswal and Mr. Menaketan Ray for helping me and giving me
good suggestions during my project work. Lastly, I thank all my class mates, who have
helped me in some form or the other in the completion of my report.
N.I.T. Rourkela Date:
SUBHASISH PANIGRAHI Roll No: 10600028

iv
CONTENTS CERTIFICATE ii
ACKNOWLEDGEMENT iii
ABSTRACT vi
CONTENTS iv
LIST OF FIGURES vii
NOMENCLATURE ix
CHAPTER 1 INTRODUCTION 1-6
1.1 Introduction 1
1.2 History 1
1.3 Methods for synthesis of nanoparticles 2
1.3.1 Sol-Gel Method 2
1.3.2 Microemulsion Method 2
1.3.3 Mechanochemical synthesis 3
1.3.3.1 Sonochemical Synthesis 4
1.3.3.2 Electrodeposition Synthesis 4
1.3.4 Chemical vapour deposition method 4
1.4 Application of nanoparticles 4
1.5 Application of sulfur nanoparticles 5
CHAPTER 2 LITERATURE REVIEW 7-14 2.1 Introduction 7
2.2 Nucleation 7
2.3 Mechanism of Growth 9
2.4 Theoretical background 10
2.5 Present Work 13
v
CHAPTER 3 DEVELOPMENT OF THE MATHEMATICAL
MODEL AND CALCULATION 15-25 3.1 Development of mathematical model (LSW Model) 15
3.1.1 Basic assumptions 15
3.1.2 Formulation 15
3.2 Mathematical model using Solvent-shift method 22
3.2.1 Basic assumptions 22
3.3 Sample calculation (LSW approach) 23
3.4 Sample calculation (Solvent shift approach) 24
CHAPTER 4 RESULTS AND DISCUSSIONS 26-38 4.1 Effect of different parameters on growth kinetics based
on LSW Model. 26
4.1.1 Effect of concentration on growth kinetics. 26
4.1.2 Effect of temperature on growth kinetics. 27
4.1.3 Effect of surface energy on growth kinetics. 28
4.2 Effect of different parameters on growth kinetics based
on Solvent-Shifting Model. 29
4.2.1 Effect of mass concentration on growth kinetics. 29
4.2.2 Effect of number density on growth kinetics. 30
4.3 Comparison between theoretical and experimental datas. 30
4.3.1 Comparison between experimental and theoretical datas
Of effect of concentration on growth kinetics. 30
4.3.2 Comparison between the experimental and theoretical
datas of effect of temperature on growth kinetics. 35
4.4 Error discussion. 37
CHAPTER 6 CONCLUSION 39 6.1 Conclusion. 39
REFERENCES 40-43

vi
ABSTRACT
Nanoparticles are gaining lots of importance recently due to their exciting applications in
different fields like biomedical, pharmaceutical, electronics etc. In this report we studied the
mechanism of nucleation and growth of formation of sulfur nanoparticles in aqueous
medium. The main objective of this project is to study the effect of various parameters on the
growth rate on the basis of size distribution of sulfur nanoparticles. The sulfur nanoparticles
were prepared by acid catalyzed precipitation reaction from sodium thiosulphate. The growth
rate of the particle depends on various factors, such as reactant concentration, acid to reactant
ratio, diffusivity of the sulfur molecules, and temperature of the reaction and surface energy
of the particles. As the sulfur nanoparticles are formed by precipitation reaction, the overall
process can be divided into nucleation, growth and particle agglomeration. For this reaction
nucleation is very fast. Actually as the reaction rate is very fast the growth rate mainly
depends on the diffusion of the newborn particle from the bulk phase to the surface of the
nuclei. So this is a diffusion limited growth reaction and mainly depends on diffusivity of the
particle. The effect of different parameters on the growth rate of the formation of sulfur
nanoparticles is studied by using the mathematical model derived by Lifshitz, Slyozov and
Wagner and using LSW theory and also the results are compared with the experimental
values of the size distribution of the formation of sulfur nanoparticles in aqueous medium.
Key words: Sulfur nanoparticles, Nucleation, Growth, and Diffusion limited growth.

vii
LIST OF FIGURES
FIGURE NO. DESCRIPTION PAGE NO.
Figure.2 LaMer’s Diagram (Concentration vs. Time). 8
Figure.3 (a) The profile of solute concentration in a diffusion
layer. 15
Figure.3 (b) The diffusion layer around a spherical particle. 15
Figure.4.1 Effect of different reactant concentrations on growth
kinetics at 298K. 26
Figure.4.2 Effects of different temperatures on growth kinetics
at 5mM concentration. 27
Figure.4.3 Effect of surface energy on growth kinetics at 10mM
concentration. 28
Figure.4.4 Effect of mass concentration on growth kinetics at
300K temperature. 29
Figure.4.5 Effect of number densities on growth kinetics at
300K temperature. 30
Figure.4.6 Comparison of the theoretical and experimental effect of
0.5mM reactant concentration on growth kinetics at 298K. 31
Figure.4.7 Comparison between theoretical and experimental effect
Of 1mM reactant concentration at 298K temperature. 32
Figure.4.8 Comparison between experimental and theoretical effect
of 5mM concentration on growth kinetics at 298K. 33
Figure.4.9 Comparison between experimental and theoretical
effect of 10mM reactant concentration on growth kinetics
at 298K 34
viii
Figure.4.10 Comparison between the theoretical and experimental
effect of 288K temperature on growth kinetics at 5mM
reactant concentration. 35
Figure.4.11 Comparison between the theoretical and experimental
Effect of 301K temperature on growth kinetics at 5mM
Reactant concentration. 36
Figure.4.12 Comparison of experimental and theoretical effect of
315K temperature on growth kinetics at 5mM reactant
Concentration. 37

ix
NOMENCLATURE
x radius at any time, m
dK 1st order decomposition rate constant, s-1
mV molar volume, m3 kmol-1
J flux, kmol m-2 s-1
D diffusion coefficient, m2 s-1
thickness of the diffusion layer, m
AC concentration at the interface, kmol m-3
BC concentration at the bulk phase, kmol m-3
RC solubility of the particle with radius ‘r’
C equilibrium concentration at the flat surface ( Bulk solubility)
interfacial energy, J m-2
R universal gas constant, kg m2 kmol-1 s-2 k-1
T temperature, k
K coarsening constant, m3 s-1
BK Boltzmann’s constant, J k-1
viscosity of water, kg m-1s-1
r atomic radius, m
N number density, m-3

1
CHAPTER 1
Introduction
1.1 Introduction
In nanotechnology, a particle is defined as a small object that behaves as a whole unit in
terms of its transport properties. Mainly, nanoparticles are sized in between 1to
100nanometers in all the three dimensions. Generally, nanoparticles are considered as an
invention of modern science. Nanoparticles are of great scientific interest as they are
effectively acting as a bridge between bulk materials and atom or molecular structures. Bulk
materials have constant physical properties regardless of its size, but at the nano-scale this is
totally an opposite case. Size dependent properties are observed such as quantum
confinement in semiconductor particles, surface plasmon resonance in some metal particles
and superparamagnetism in magnetic materials. The properties of the materials change as
their size approaches the nano dimension and as the percentage of atoms at the surface
becomes significant. For bulk materials larger than one micrometer the percentage of atoms
at the surface is minuscule relative to the total number of atoms of the materials. The
interesting and sometimes unexpected properties of nanoparticles are partly due to the aspects
of the surface of the material dominating the properties in lieu of the bulk properties.
Nanoparticles have a very high surface area to volume ratio. This provides a tremendous
driving force in diffusion, especially at elevated temperatures and this also provides a large
number of molecules for interaction. Sintering can take place at lower temperatures, over
shorter time scales than for larger particles. This is theoretically does not affect the density of
final product, though flow difficulties and the tendency of nanoparticles to agglomerate
complicates matters. The large surface area to volume ratio also reduces the incipient melting
temperature of nanoparticles (Buffat et al., 1976). 1.2 History
The first use of the concepts in ‘nanotechnology’ was in “There’s Plenty of Room at the
Bottom”, the talk given by physicist Richard Feynman at an American Physical Society
meeting at Caltech on December 29, 1959. Feynman described a process by which the ability
to manipulate individual atoms and molecules might be developed, using one set of precise

2
tools to build and operate another proportionally smaller set, and so on down to the needed
scale. He also noted that scaling issues would arise from the changing magnitude of various
physical phenomena: gravity would become less important, surface tension and Vander
Waals attraction would become increasingly more significant, etc. This basic idea appeared
plausible, and exponentially assembly enhances it with parallelism to produce a useful
quantity of end products. The term “nanotechnology” was defined by Tokyo Science
University Professor Norio Taniguchi in 1974 and according to him “Nano-technology”
mainly consists of the processing of, separation, consolidation and deformation of materials
by one atom or by one molecule. In the 1980s the basic idea of this definition was explored in
much more depth by Dr. K. Eric Drexler, who promoted the technological significance of
nano-scale phenomena and devices through speeches the books Engines of Creation: The
Coming Era of Nanotechnology (1986). Nanotechnology and nano-science got started in the
early 1980s with two majors’ developments; the birth of cluster science and the invention of
scanning tunnelling microscope (STM). This development led to the discovery of fullerenes
in 1985 and carbon nano-tubes a few years later. In another development, the synthesis and
properties of semiconductor nano-crystals was studied; this led to a fast increasing number of
metal and metal oxide nanoparticles and quantum dots. The atomic force microscope (AFM
or SFM) was invented six years after the STM was invented.
1.3 Methods for the synthesis of nanoparticles There are various methods used for the synthesis of nanoparticles. These methods are as
follows;
1.3.1 Sol-Gel Method The sol-gel process is a wet-chemical technique, it is also known as chemical solution
deposition method widely used in the fields of materials science and ceramic engineering.
These methods are mainly used for the fabrication of materials, mainly like metal oxide
particle synthesis starting from a chemical solution (sol, short for solution) which acts as the
precursor for an integrated network (or gel) of either discrete particles or network polymers
(Brinker et al., 1990). Sol-gel approach is a cheap and low-temperature technique that
controls the product’s chemical composition. Even small quantities of dopants, such as
organic dyes and rare earth metals, can be introduced in the sol and end up uniformly
dispersed in the final product. It can be also used in ceramics processing and manufacturing
as an investment casting material, or as a means of producing very thin films of metal oxides
for various purposes. Sol-gel derived materials have various applications in optics,

3
electronics, energy, space, biosensors, medicine and separation technology (Klein et al.,
1994; Corriu et al., 2009).
1.3.2 Microemulsion Method In microemulsion method particle size can be controlled exactly. Microemulsion is a mixture
of oil and aqueous phase with surfactant and cosurfactant. In microemulsion surfactants are
formed reverse micelles and cosurfactant reduce the electrostatic repulsion force between the
surfactant molecules. For particle formation, reagents are added in aqueous phase. Here
micelles help in nucleation and growth of nanoparticles. By changing the molar ratio of water
to surfactant, particle size and morphology can be controlled.
Xie et al. (2009) have prepared nano sulfur particles from sublimed sulfur. They added
cystine solution drop wise to the sulfur ethanol saturated solution with ultrasonic treatment
and cystine nano sulfur solution was obtained. The size of the cystine nano sulfur were
around 50-100nm. Deshpande et al. (2008) have prepared sulfur nanoparticles using
biodegradable iron chelate catalyst in reverse microemulsion method. They obtained rhombic
sulfur of average particle size 10nm. Wang et al. (2006) prepared sulfur nanoparticles from
sodium polysulfide by acid catalysis in reverse microemulsion method. They obtained
monoclinic sulfur of average particle size 20nm. In this method polysulfide is the source of
sulfur but for polysulfide synthesis nano sulfur is required and this problem is also same for
Xie et al.(2009).
1.3.3 Mechanochemical synthesis
This is a technique, where both mechanical force and chemical treatment are applied for
nanoparticles synthesis. Chemical reactions occur at the interfaces of the nano-meter-sized
grains that are continuously re-generated during milling (Koch et al., 1992). The reactions
can occur either in a steady state manner or self-propagating combustive manner (Takacs et
al., 1996; Shaffer et al., 1990). The reaction that occurs in a self-propagating combustive
manner results in micron-sized particles due to high temperature, while the reactions that
occur in a steady state manner result in a nano-sized particle is formed (Ding et al., 1995). So,
to avoid self-propagating combustion, appropriate selection of milling parameters to reduce
collision energy and by addition of inert diluents to the starting powder mixture to reduce the
reaction rate is required. By selecting suitable conditions such as chemical reaction paths,
stoichiometry of starting materials and milling conditions, mechanochemical processing can

4
be used to synthesise nano-crystalline particles dispersed within a soluble salt matrix.
Selective removal of the matrix phase by washing the resulting powder with appropriate
solvents can yield nanoparticles of the desired phase as small as 5 nm (McCormick et al.,
2001). A wide range of nanoparticles have been synthesised by mechanochemical processing.
There are mainly two types of mechanical force are used for particle synthesis, these are
1.3.3.1. Sonochemical Synthesis Sonochemical method has been widely used to fabricate nanoparticles with special structures.
The chemical effects of ultrasonic sound arise from acoustic cavitations. That is the
formation, growth and implosive collapse of bubbles in a liquid can drive many chemical
reactions (Dierking et al., 1997; Kosbar et al., 1997). Hence it offers a very attractive method
for the preparation of nanoparticles with different morphologies, including metals and oxides
(Rajaram et al., 1995; Hudson et al 1998). The advantage in the ultrasound irradiation to the
synthesis of mesoporous materials is a drastic reduction in fabrication time and the ability to
induce aggregation of nanoparticles into porous structures without destroying the micellar
structure. Sonication frequency range is 20 kHz to 1 MHz
1.3.3.2. Electrodeposition Synthesis Formation of shell over the core with charged polymers and inorganic materials can be
carried out by this method in presence of electrical potential. In general, electric field is
varied like a wave with positive and negative cycle. The metal deposits on the core surface
during negative cycle and charged polymer deposits during the positive cycle.
1.3.4 Chemical vapour deposition method Chemical vapor deposition (CVD) is a chemical process used to produce high-purity, high-
performance solid materials. The process is often used in the semiconductor industry to
produce thin films. In a typical CVD process, the substrate is exposed to one or more volatile
precursors, which react or decompose on the substrate surface to produce the desired deposit.
Frequently, volatile by-products are also produced, which are removed by gas flow through
the reaction chamber. Chemistry vapour deposition (CVD) was used in the preparation of
nano-sulfur under severe conditions (Yang et al., 2003).
1.4 Application of Nanoparticles

5
• Nanoparticles are used in paints, coatings and fillers.
• Drug delivery - Nanoparticles for absorption through the skin, eyes and for inhalation, to
avoid stomach enzymes, which fortunately don't exist in the lungs, destroying drugs nano-
capsules for delayed release; and dendrimers for drug delivery.
• Solar energy - Efficient solar cells are already developed by using nanoparticles and with
the promise of drastic cost reductions on the horizon. Some will even produce hydrogen.
Nanoparticles on the cell has been increased the cell power output by 67% in the
ultraviolet range and about 10% in visible range (Choy et al., 2004).
• Nanoparticles are also used in Fuel cells.
• Display technologies and e-paper - A competitive area, with e-paper and carbon nanotube
based field emission displays expected to be slugging it out with liquid-crystal displays.
• Nano-tubes – Both used as raw materials and as products. Multi-walled nano-tubes, the
cheap and dirty kind, are already going into composites for increasing conductivity at
much lower filler loads. Single-walled nano-tubes will have a much bigger effect in the
longer term.
• Catalysis – Nanoparticles are also used as catalyst.
• Nano-composites - Mainly clay-based for structural applications (increased strength) or
with novel properties. These are already used in automotive and aerospace industries.
• Storage technologies – It is also used for developing nano-tube RAM and terabyte hard
drives.
• Nano-crystalline bulk materials or steels containing nano-particulates - some industries are
using steel with nano-particulate carbon added during the rolling process.
• Coatings – Due to some its special properties, such as electro-chromic and self-cleaning
properties, nanoparticles are used in coatings.
• Sensors - Bio and chemical sensors made from nano-wires and nano-tubes because of high
sensitivity of nanoparticles to any chemicals.
• Bio-analysis - Devices using atomic force microscopes and quantum dots are already
being readied for market.
• Textiles – Nano-fibres in stain-resistant trousers are already available.
1.5 Application of Sulfur Nanoparticles Sulfur is a biologically active element. The sulfur and sulfur containing compounds presented
various biological activities such as removal of heavy metals, radical-scavenging,

6
antimicrobial activity, antioxidant and antitumor activities (Seokwon et al., 2006; Robert et
al., 2003). The shape and size of sulfur particles are important factors affecting their
properties and applications. Sulfur nanoparticles are paid much attention in the field of
science and technology and their applications in chemistry and biochemistry have aroused
some chemists' interest. In the area of agricultural field sulfur is used as fungicide against the
apple scab disease under colder conditions (Ellis et al., 1998). Nano size sulfur particles also
have many important applications like pharmaceutical, synthesis nano composites for lithium
batteries (Zheng et al., 2006; Yong et al., 2007).

7
CHAPTER 2
Literature Review
2.1 Introduction The fundamental study on kinetics of precipitation reaction is important to improve the
industrial precipitation process. The precipitation reaction is a combination of two stage
process, nucleation and growth. Nucleation plays an important role in controlling the
properties of the final product, size distribution and nature of the phase. Precipitation reaction
is only the phase transformation from liquid to solid with chemical reaction. According to
classical theory nucleation is a minimization process in terms of energy of the overall system.
Whenever particles are generated from the homogeneous liquid mixture, a new solid liquid
interfacial area is generated with a specific surface energy proportional to the square of its
radius. Whereas, considering the bulk energy, due to the formation of the solid, the energy
gained is proportional to the cube of the particle radius. These two energy terms are opposite
in nature. The change in total energy is mainly due to the contribution of these two, but some
other factors like, motion of the particles in the medium, electrostatic contribution and total
energy. In case of precipitation reaction initially, surface energy dominates the total energy
and the reaction become unfavorable. Nucleation and growth of sulfur solution formation is
extensively studied by V. K. LaMer and co-workers (LaMer, 1947; 1950; 1952) and
developed the mechanism of formation of nano crystals or colloids from a homogeneous
supersaturated aqueous medium. According to them, in a short time period nucleation process
is completed and the particles having larger size than critical radius started to grow. The
growth process is controlled by either diffusion or surface reaction.
2.2 Nucleation Nucleation is the process by which atoms (or ions) that are free in solution come together to
produce a thermodynamically stable cluster. The cluster must exceed a specific size (the
critical size) determined by the competition between the aggregate curvature (Laplace
pressure) and the free energy favouring the growth of the new phase. Once the critical size is
exceeded, the cluster becomes a supercritical nucleus capable of further growth. If the
nucleus is smaller than the critical size, spontaneous dissolution can occur (Tojo et al., 2006).

8
LaMer et al. (1950) have studied extensively nucleation and growth in sulfur solutions, from
which they developed an understanding of the mechanism for the formation of colloids or
nanocrystals from a homogeneous, supersaturated medium. Their mechanism suggested that a
synthesis of the colloid should be designed in such a way that the concentration increases
rapidly, rising above the saturation concentration for a long period, when a short burst of
nucleation occurs with the formation of a large number of nuclei in a short space of time.
These particles grow rapidly and lower the concentration below the nucleation level whilst
allowing the particles to grow further at a rate determined by the slowest step in the growth
process, thus separating the nucleation and growth in time. LaMer’s mechanism is depicted
schematically by means of the simple diagram shown in fig.3.1. The requirements for mono-
dispersity, as evident from LaMer’s diagram, are a high rate of nucleation leading to the burst
of nuclei formation in a short period, an initial fast rate of growth of these nuclei to reduce
the concentration below the nucleation concentration rapidly and an eventual slow rate of
growth leading to a long growth period compared to the nucleation period.
Fig.2. LaMer’s Diagram (Concentration vs. Time). (LaMer et al., 1950).
They also derived the rates of growth of solutions prepared by this method. This diagram
(fig.2) illustrates the variation of the concentration with time during a precipitation reaction
and is based on the principle that the nucleation is the limiting step in the precipitation
reaction. In the first step, the concentration increases continuously with increasing time. As

9
the concentration reaches the critical super saturation value, nucleation occurs. This leads to a
decrease of the concentration. Between the concentrations Cmax and Cmin the nucleation
occurs. Later, the decrease of the concentration is due to the growth of the particles by
diffusion. This growth occurs until the concentration reaches the solubility value. This model
has been applied to the microemulsion medium, i.e., that nucleation occurs in the first part of
the reaction and later only growth of the particles occurs. If this model is followed, the size of
the particles will increase continuously with the concentration of the precursor or a minimum
in the variation of the size with the concentration can also be expected. This stems from the
fact that the number of nuclei is constant and the increase of concentration leads to an
increase of the size of the particles (Destree et al., 2006).
2.3 Mechanism of Growth Nucleation occurs over sometime with constant monomer concentration. Eventually surface
growth of clusters begins to occur which depletes the monomer supply. When the monomer
concentration falls below the critical level for nucleation, nucleation ends. A general analysis
of the growth process is then important to understand nanocrystal synthesis. In general, the
surface to volume ratio in nanoparticles is quite high. As a result of the large surface area
present, it is observed that surface excess energy becomes more important in very small
particles, constituting a non negligible percentage of the total energy. Hence, for a solution
that is initially not in thermodynamic equilibrium, a mechanism that allows the formation of
large particles at the cost of smaller particles reduces the surface energy and hence plays a
key role in the growth of nanocrystals. Coarsening effects, controlled either by mass transport
or diffusion, are often termed the Ostwald ripening process. This diffusion limited Ostwald
ripening process is the most predominant growth mechanism (Lifshitz et al., 1961; Wagner et
al., 1961).
The diffusion process is dominated by the surface energy of the nanoparticles. The interfacial
energy is the energy associated with an interface due to differences between the chemical
potential of atoms in an interfacial region and atoms in neighboring bulk phases. For a solid
species present at a solid-liquid interface, the chemical potential of a particle increases with
decreasing particle size, the equilibrium solute concentration for a small particle is much
larger than for a large particle, as described by the Gibbs-Thompson equation. The resulting
concentration gradients lead to transport of the solute from the smaller particles to larger

10
particles. The equilibrium concentration of the nano-crystal in the liquid phase is dependent
on the local curvature of the solid phase. Differences in the local equilibrium concentrations,
due to variations in curvature, set up concentration gradients and provide the driving force for
the growth of larger particles at the expense of smaller particles (Sugimoto, 1987; Rao et al.,
2007).
2.4 Theoretical background There are various model developed for the mechanism of the nanoparticles formation, these
are as follows
Ethayaraja et al. (2008) have studied the model for core-shell nanoparticles formation by ion-
exchange mechanism and stated that core-shell nanoparticles can be synthesized by partial
exchange of the cation of the core nanoparticles by a second cation of the desired shell
compound. Process time and cation concentration can be varied to control the thickness of the
shell. They have developed a mathematical model that describes the process of ion-exchange
from preformed spherical nanoparticles. The overall process consists of diffusion of the
cation from the solution to the core-nanoparticles surface, then solid-state diffusion of the
cation across the shell, and finally the cation exchange reaction. The reaction rate is very fast,
so diffusion in the shell is the slowest step and also the rate-controlling step. This model was
compared with the available experimental data of CdS-PbS core-shell nanoparticles
formation at various [Pb2+]/ [Cd2+] molar ratios and at different process times. The model can
be useful for a priori specification of experimental conditions required for a desired shell
thickness.
Mehra et al. (2006) have proposed shell growth mechanism to occur simultaneously with ion-
exchange. This is a more general scheme by which they could explain the outer core-shell
diameter. However, in their simulation, ion-exchange being still limited to only a monolayer
formation, their scheme cannot explain complete conversion of a core nanoparticle to another
nanoparticle of a different material, via the intermediate core-shell structure.
LaMer et al. (1945) have studied the kinetics of diffusion controlled molecular and ionic
reactions in solution as determined by measurements of the quenching of fluorescence.
Theory of chemical kinetics states that the absolute rate of reaction is determined by the
concentration of activated complexes, in equilibrium with the reactants and products, and
multiplied by the frequency with which these critical complexes decompose to form the end

11
products. In some of the rapid reactions like quenching of fluorescence by iodide ions, the
rate controlling process is the diffusion of the reactants. Because of the condensed nature of
liquids, collisions in solutions are complex as compared to gases. The reactants diffuse
through the solution, as a result of thermal motion, and finally collide. The pair is surrounded
by a cage of solvent molecules and in this manner is held in coordination so that reactants
execute motion or vibration relative to each other. To calculate the reaction rate, they have
considered one solution is at rest and another solution is moving towards it and diffusion
occurs due to the thermal motion of the molecules. They have considered the forces acting
between the molecules, diffusion force, friction force and electrical force. In their experiment,
they have considered the effect of inter-ionic forces on the rate of diffusion. For the
calculation, they have assumed the quencher as the centres of diffusion and the concentration
of excited fluorescent molecules is taken to be zero on the surface of the quencher, due to the
quenching. Finally, they have stated that quenching process, involves an encounter between a
dye molecule excited by light absorption (fluorescein ion) and a quencher (iodide ion).
Following the encounter, the energy of excitation is converted into thermal motion of the
surrounding solvent molecules. A direct measurement of the time decay of fluorescence and
also investigating quenching is too difficult for precision studies because of the extremely
short half-life period.
LaMer et al. (1952) have studied the kinetics of the formation of the carbinol of crystal violet
and they have stated that, the fading of crystal violet in the presence of hydroxyl ion follows
quantitatively the Bronsted-Debye law for primary kinetic salt effects. Crystal violet obeys
Beer's law at the wave length of maximum absorption. There is a strong specific solvent
effect: the addition of acetone or dioxane to an aqueous solution of the dye produces a shift in
the absorption peak of the crystal violet ion toward longer wave lengths and at low
concentrations of organic solvents, produces an effect on the specific reaction rate which is
opposite to that expected on the basis of the decrease in dielectric constant The use of
normalized rate constants does not improve the agreement with simple electrostatic theory.
The energy of activation in acetone-water mixtures greater than in the case of water alone, at
this ionic strength, contrary to the expected decrease due to the lowering of the columbic
activation energy in this reaction between oppositely charged ions produced by lowering the
dielectric constant. The activation energy for the carbinol formation of malachite green is less
than that for crystal violet. The higher rate constant of the former is due to reduction in
activation energy, also to less negative entropy of activation. Sufficient alkali was employed
12
in these experiments to give reactions faster than this. So, in this experiment alkali
consumption is more.
Keuren et al. (2003) have studied the growth kinetics of anthracene nanoparticles by using a
method called ‘solvent shift’. In this method they have reduced the solute solubility by
changing the ratio of two components of a binary solvent to get super saturation quickly and
initially, the particle size of the particles increased rapidly followed by much slower growth.
They have used dynamic light scattering (DLS) for characterizing particles above 10 nm, and
UV–VIS absorption spectroscopy to look at molecular arrangement. These measurements are
performed both as functions of composition (ratio of water to acetone in the binary solvent)
and as functions of time after changing the solubility. By correlating these results, they got an
idea on the size and structure of the nanoparticles as functions of time and conditions during
nucleation and growth. The nanoparticles formed in their systems, the super saturation
condition is created initially and the system then allowed equilibrating. The growth of the
particles is accompanied by the depletion of solute from the bulk solution, leading eventually
to the end of the supersaturated condition. They have neglected the surface term in the free
energy difference, which will mean the equilibrium concentration at the surface will have a
dependence on the particle size. They have started with nucleation sites that are already larger
than the critical size. In order to understand the growth of the particles, they have used a
simple model describing the mass transport to the particle surface through diffusion, coupled
to the decrease in bulk solute concentration. They have assumed that the growth of the
particles is a diffusion-limited process. For the calculation part, they have taken the values of
diffusivity coefficient and viscosity that are available in the theory.
Hale et al. (2005) have studied the growth kinetics and modelling of ZnO nanoparticles. They
have used the Ostwald ripening process for study of the growth kinetics. They have used the
Gibbs–Thomson equation and Fick’s law for the derivation of the rate law. From the Ostwald
ripening process, they have concluded that the formation of many small particles is
kinetically favoured and the large particles are thermodynamically favoured. This is because
small particles have a larger surface area-to-volume ratio than large particles and are
consequently easier to produce. Molecules on the surface are energetically less stable than the
ones already well ordered and packed in the interior. Large particles, with their greater
volume-to-surface area ratio, therefore represent a lower-energy state. Hence, many small
particles will attain a lower-energy state if transformed into large particles. They have used

13
the experimental values of solubility and hydrodynamic radius to calculate the diffusion
coefficient from Stokes-Einstein equation and Ostwald model and then, compared the two
models. They have calculated absorbance of a dilute solution of small particles from Mie
theory and also used some dielectric properties.
Wong et al. (1998) have studied the growth kinetics of nanocrystalline ZnO particles from
colloidal suspensions. Colloidal chemistry techniques were used to synthesize ZnO particles
in the nanometre size regime. The particle kinetics was determined by monitoring the optical
band edge absorption and using the effective mass model to approximate the particle size as a
function of time. In this model, the higher curvature and the chemical potential of the smaller
particles provide a driving force for dissolution. Particle sizes and Crystal structure
identification were determined by using high-resolution transmission electron microscope
and X-ray diffraction respectively. The concentration of Zn2+ in the colloidal suspensions was
determined by atomic absorption spectroscopy of solution isolated from the ZnO particles by
dialysis. They have noted that particle sizes of less than about 1.5 nm could not be obtained.
For the particle growth kinetics they have used Ostwald ripening model and Stokes-Einstein
equation and compared the two models. But in colloidal suspensions both diffusion and
convection can contribute to ion motion.
Oskam et al. (2002) have studied the growth kinetics of TiO2 nanoparticles from titanium
(IV) alkoxide at high Water/titanium ratio. The radius of primary particles was found to be
between 1.5 and 8 nm, and the average particle radius cubed is shown to increase linearly
with time in agreement with the Lifshitz-Slyozov-Wagner model for coarsening. The rate
constant for coarsening increases with temperature due to the temperature dependence of the
viscosity of the solution and the equilibrium solubility of TiO2. At longer times and higher
temperatures, secondary particles formed by epitaxial self-assembly of primary particles were
observed with high-resolution transmission electron microscopy. The number of primary
particles per secondary particle increases with time and the percentage of primary particles
present in the colloid decreases with increasing temperature.
2.5 Present Work In this project, the mechanism of the formation of sulfur nanoparticles from sodium
thiosulfate solution using oxalic acid in aqueous medium as a catalyst is studied. Here, we are

14
using two approaches that is LSW Model and another one is Solvent-Shift approach. By
using this approach we are mainly studying the effect of various parameters on the growth
kinetics of the particles. In LSW approach, the considered parameters are reactant
concentration, temperature, diffusion coefficient and the surface energy. In Solvent-shift
approach the varying parameters are mass concentration and the number density. In LSW
approach diffusion is the slowest step and also the rate controlling step. Here, nanoparticles
are formed mainly by diffusion and also model is developed by using the concept of Fick’s
first law of diffusion. But in Solvent-shift approach we are using the mass concentration of
the solute. Some datas are taken from the literature available and these values are substituted
in the mathematical model derived. New datas are generated from the model with respect to
particle radius and time. Then, these generated values are compared with the experimental
values and error is calculated with respect to the experimental values.
15
CHAPTER 3
Development Of The Mathematical Model and Calculation
3.1 Development of mathematical model (LSW Model)
The growth of nanocrystals in solution involves two important processes, the nucleation
followed by the growth of the nanocrystals (Rao et al., 2007).
3.1.1 Basic assumptions The assumptions are made according to the LSW theory (Lifshitz et al., 1961; Wagner et al.,
1961; Rao et al., 2007).
• Particles are assumed to be spherical in a supersaturated medium.
• The total mass of the solute is conserved.
• Assumptions of the particle being spherical are characterized only by the radius
distribution.
• Processes such as nucleation and aggregation that introduce new particles are
negligible.
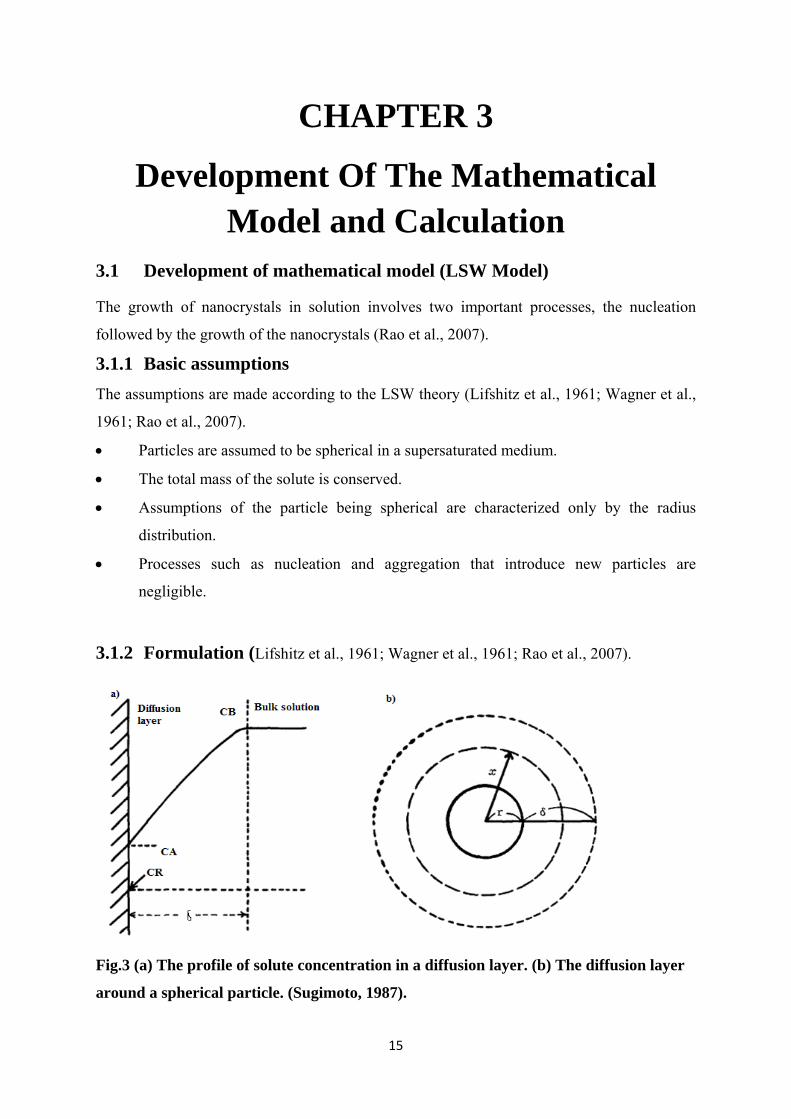
3.1.2 Formulation (Lifshitz et al., 1961; Wagner et al., 1961; Rao et al., 2007).
Fig.3 (a) The profile of solute concentration in a diffusion layer. (b) The diffusion layer
around a spherical particle. (Sugimoto, 1987).

16
x = Radius at any time
By using Fick’s first law, the flux passing through a spherical surface with radius ‘x’
within the diffusion layer is
dxdcxDJ ××= 24π (3.1)
Where,
=J Flux
=D Coefficient of diffusion
=dxdc Concentration gradient
=δ Thickness of the diffusion layer
=AC Concentration at the interface
=BC Concentration at the bulk phase
At steady state, J is constant over the diffusion layer ‘ x ’. Here, diffusion of the
molecules from interface to the bulk phase taken place. Then, solving the equation (3.1)
and integrating with proper limits,
∫∫ =×+ B
A
C
C
r
r
dcDxdxJ π
δ
42
(3.2)
∫=⎥⎦⎤
⎢⎣⎡−
+ B
A
C
C
r
r
dcDx
J πδ
41
[ ]AB CCDrr
J −=⎥⎦⎤
⎢⎣⎡ +
+− πδ
411
[ ]AB CCDrr
J −=⎥⎦⎤
⎢⎣⎡
+− π
δ411
( ) [ ]AB CCDrr
rrJ −=⎥⎦
⎤⎢⎣
⎡+−+ πδ
δ 4
17
( ) [ ]AB CCDrr
J −=⎥⎦
⎤⎢⎣
⎡+
πδ
δ 4
( ) ( )δ
δπ +−=
rrCCDJ AB4 (3.3)
The above flux is due to diffusion.
Another flux is due to the first order reaction at the surface. This flux can be equated to
the consumption rate of the monomer species at the surface of the particles (Rao et al.,
2007). So the flux due to the reaction is,
( )RAd CCKrJ −×= 24π (3.4)
Where,
=dK First order decomposition rate constant
=RC Solubility of the particle with radius ‘ r ’
At steady state two fluxes (flux due to diffusion and reaction at the surface) are same.
Then
⎟⎠⎞
⎜⎝⎛ +
=−−
δδr
rKD
CCCC
dAB
RA
⎟⎠⎞
⎜⎝⎛ +=
−−
δr
rKD
CCCC
dAB
RA 1 (3.5)
Atoms in a crystal mVr
34 3π
= (3.6)
Rate of species entering, ⎟⎟⎠
⎞⎜⎜⎝
⎛=
mVr
dtdJ
34 3π
(3.7)
dtdr
VrJm
×=24π

18
24 rJV
dtdr m
π= (3.8)
Where,
=dtdr Growth rate
=mV Molar volume
In solution, it is very difficult to measure AC , so we have to eliminate AC from the two
equations (3.3) and (3.4).
( )RAd CCKrJ −×= 24π
dRA Kr
JCC 24π=−
Rd
A CKr
JC += 24π (3.9)
Substituting the value of AC in equation (3.3), we get
( )AB CCrDrJ −⎟⎠⎞
⎜⎝⎛ +=
δπ 14
⎟⎟⎠
⎞⎜⎜⎝
⎛−−⎟
⎠⎞
⎜⎝⎛ += R
dB C
KrJCrDrJ 24
14πδ
π
( )RBd
CCrDrrKr
JDrJ −⎟⎠⎞
⎜⎝⎛ +=⎟
⎠⎞
⎜⎝⎛ +⎟⎟⎠
⎞⎜⎜⎝
⎛×
δπ
δππ 141
44 2
( )RBd
CCrDrrrKDJ −⎟
⎠⎞
⎜⎝⎛ +=⎟⎟
⎠
⎞⎜⎜⎝
⎛⎟⎠⎞
⎜⎝⎛ ++
δπ
δ1411
( )
⎟⎟⎠
⎞⎜⎜⎝
⎛⎟⎠⎞
⎜⎝⎛ ++
−⎟⎠⎞
⎜⎝⎛ +
=
δ
δπ
rrKD
CCrDrJ
d
RB
11
14
(3.10)
Substituting the value of J in equation (4), we get

19
( )
2411
14
rrrKD
VCCrDr
dtdr
d
mRB
πδ
δπ
⎟⎟⎠
⎞⎜⎜⎝
⎛⎟⎠⎞
⎜⎝⎛ ++
−⎟⎠⎞
⎜⎝⎛ +
=
( )
⎟⎟⎠
⎞⎜⎜⎝
⎛⎟⎠⎞
⎜⎝⎛ ++
−⎟⎠⎞
⎜⎝⎛ +
=
δ
δr
rKDr
VCCrD
dtdr
d
mRB
11
1 (3.11)
According to Gibb’s- Thompson equation
⎟⎠
⎞⎜⎝
⎛
∞= rRTV
R
m
eCCσ2
(3.12)
Where,
=∞C Equilibrium concentration at the flat surface (Bulk solubility).
=σ Interfacial energy
=R Universal gas constant
=T Temperature
Assuming that rRTVmσ2
is very small, so neglecting the higher order terms in the series
expansion, we get
⎟⎠⎞
⎜⎝⎛ += ∞ rRT
VCC m
Rσ2
1 (3.13)
Similarly BC can be written as
⎟⎟⎠
⎞⎜⎜⎝
⎛+= ∞ RTr
VCC
B
mB
σ21
(3.14)
Substituting the values of BC and RC in equation (3.11), we get

20
( )
⎟⎟⎠
⎞⎜⎜⎝
⎛⎟⎠⎞
⎜⎝⎛ ++
−⎟⎠⎞
⎜⎝⎛ +
=
δ
δr
rKDr
VCCrD
dtdr
d
mRB
11
1
⎟⎟⎠
⎞⎜⎜⎝
⎛⎟⎠⎞
⎜⎝⎛ ++
⎥⎦
⎤⎢⎣
⎡⎟⎠⎞
⎜⎝⎛ +−⎟⎟
⎠
⎞⎜⎜⎝
⎛+⎟
⎠⎞
⎜⎝⎛ +
=∞∞
δ
σσδ
rrKDr
rRTV
CRTr
VCVrD
dtdr
d
m
B
mm
11
21
211
⎥⎦
⎤⎢⎣
⎡⎟⎠⎞
⎜⎝⎛ ++
⎟⎟⎠
⎞⎜⎜⎝
⎛−⎟
⎠⎞
⎜⎝⎛ +
=∞
δ
σδ
rrKD
rDRT
rrCVrD
dtdr
d
Bm
111
1121 2
⎥⎦
⎤⎢⎣
⎡⎟⎠⎞
⎜⎝⎛ ++
⎟⎟⎠
⎞⎜⎜⎝
⎛−⎟
⎠⎞
⎜⎝⎛ +
=∞
δ
δσ
rrKD
rRT
rrrCV
dtdr
d
Bm
111
1112 2
(3.15)
Mainly diffusion layer thicknesses are of the order of microns. So, in case of nano-crystal
we assume, δ<<r
So for δ<<r , equation (3.15) became
⎟⎟⎠
⎞⎜⎜⎝
⎛+
⎟⎟⎠
⎞⎜⎜⎝
⎛−
=∞
d
Bm
rKDrRT
rrCV
dtdr
11
112 2σ (3.16)
This is a diffusion limited growth mechanism. In this case diffusion is the slowest step
and also the rate controlling step and the particle growth is mainly controlled by the
diffusion of the monomers to the surface (Lifshitz et al., 1961; Wagner, 1961).

21
So drKD <<
Then equation (3.16) reduces to
rRTrr
CDV
dtdr B
m ⎟⎟⎠
⎞⎜⎜⎝
⎛−
=∞
112 2 σ
RTrrrCDV
dtdr B
m
2
2 12 ⎟⎟⎠
⎞⎜⎜⎝
⎛−
=∞σ
2
1
rrr
Kdtdr B
D
⎟⎟⎠
⎞⎜⎜⎝
⎛−
×= (3.17)
Where, RT
CDVK m
D∞=
σ22 (Constant) (3.18)
If the total mass of the system is kept conserved, the LSW theory showed that the ratio
Brr is constant. So, then assuming
Brr as constant, equation (3.17) reduces to,
2rConstK
dtdr D ×=
(3.19)
2rK
dtdr C=
∫∫ =t
C
r
r
dtKdrr0
2
0
( ) tKrr C=− 30
3
31

22
Ktrr =− 30
3 (3.20)
Where ‘ 0r ’ is the average radius of the particle at time 0=t
RTCDV
K m
98 2
∞=σ
(3.21)
According to Einstein-Stokes equation
rTKD B
πη6=
(3.22)
Where,
=BK Boltzmann constant.
=η Viscosity of water.
=r Atomic radius of the particle.
3.2 Mathematical model using Solvent-shift method (Keuren et al., 2003).
3.2.1 Basic assumptions
• The growth of the particles is a diffusion-limited process.
• Particles are assumed to be spherical.
• Initially the solute concentration is taken to be supersaturated in the bulk.
• Free surface energy is assumed to be neglected.
They have used diffusion equation in spherical coordinates and using mass concentration,
they developed the mathematical model. The final equation of the model was
( )
a
aC
CXCXC
XCCND
t0
32tan
31ln
61
43 1
3
33
⎥⎥⎦
⎤
⎢⎢⎣
⎡⎟⎟⎠
⎞⎜⎜⎝
⎛ −+⎟⎟
⎠
⎞⎜⎜⎝
⎛
+−
= −
π (3.23)
23
( )31
301004
3⎥⎦
⎤⎢⎣
⎡−−= a
NC φφ
πρ (3.24)
Where,
N= Number density of the particle.
=ρ Density of the solute.
C= Constant.
=0a Initial particle radius.
=a Final particle radius.
=10φ Initial bulk concentration.
Then by applying Taylor’s series expansion in the equation (3.23) and assuming the initial
particle radius and initial bulk concentration to be zero we got,
1924787.08 23 CCtNDCa +−
=π
(3.25)
Then by substituting the values of known parameters we can get the particle size with respect
to the time.
3.3 Sample calculation (LSW approach).
For the calculation of the theoretical values, some assumptions are taken and some derived
equations are used by using LSW theory. Then, some datas of particle size and time are
generated and compared to the experimental values.
In those three equations (3.20, 3.21. 3.22) some datas are used which are taken from the
literature.
Vm=Molar volume of sulfur, 0.0155 m3 kmole-1
(http://environmentalchemistry.com/yogi/periodic/S.html).
R=Universal gas constant, 8314.3 kg m2 kmole-1 s2 K-1.

24
T=Temperature, 298K.
KB=Boltzmann constant, 1.3806×10⁻²³ J K-1.
r=Atomic radius of sulfur, 109×10-12 m
(http://environmentalchemistry.com/yogi/periodic/S.html).
η=Viscosity of water, 0.891×10⁻³ kg m-1 s-1(at 298K)
(http://www.engineeringtoolbox.com/absolute-dynamic-viscosity-water-d_575.html).
σ=Surface energy of sulfur, 40×10-3 J m-2 (Chibowski et al., 2008).
D=Diffusion coefficient.
D is calculated by using equation (2) at 298K.
==r
TKD B
πη6129
123
23
1024782.21010910891.06
298103806.1 −−−−
−
×=×××××
×× smπ
K=Coarsening constant.
K is calculated by using equation (1) for the thiosulphate concentration at C∞=0.5mM,
because here I assume that there is 100% conversion of thiosulphate to sulfur and also the
total massof the solute is conserved.
13243922
108749.32983.83149
0005.010401024782.20155.089
8 −−−−
∞ ×=××
××××××== sm
RTCDV
K m σ
Here, r0=0, because at time (t) =0 initial particle radius is zero.
All the above values are substituted in the equation (3). Then with increasing time we got the
particle radius and it increases with time. Then those values generated are compared with the
experimental values available (Ghosh Chaudhuri, 2009).
3.4 Sample calculation (Solvent shift approach).
Here, I assumed that 100 numbers of molecules combine to form nuclei then radius of the
nuclei is

25
( )mr
rr
rr
n
sn
ns
10
31
33
1005933.5
100
34
34100
−×=
×=
=× ππ
Where, rs= Atomic radius of sulfur.
rn= Nuclei radius.
Then by applying mass balance and assuming 100% conversion,
Density of sulfur = 2.07 kg m-3
22
33
1085.2
10321007.2
×≤
×≤××× −
N
VN n
Then by substituting all known values in equation (3.25) we can get the values of radius with
respect to time.

26
CHAPTER 4
Results and Discussion
4.1 Effect of different parameters on growth kinetics based on LSW
Model
4.1.1 Effect of concentration on growth kinetics.
0
100
200
300
400
500
600
700
0 100 200 300 400 500
0.5mM1mM5mM10mM
Part
icle
size
(nm
)
Time (min)
Fig.4.1. Effect of different reactant concentrations on growth kinetics at 298K.
In the Fig.4.1, the effects of different reactant concentrations on the particle size are shown.
From the plot, it is concluded that with increase in reactant concentration particle growth
increases. According to LaMer (1948) rate of the reaction depends on the concentration of the
thiosulphate and acid (reactant). This means, with increase in reactant concentration the
27
density of the nucleate particles also increases. Then, there are more collisions between the
particles and due to coarsening the smaller particles gets larger in size by minimizing the
energy. Also, as the concentration of particles at the interface increases, the rate of reaction
becomes dominated by the diffusion of particles away from the interface. This allows space
for the reagents to diffuse to the interface, meet and react. An increase in the transport of
reagents to the interface will lead to an increase in the rate of reaction and accordingly growth
of the particles increases (Lee et al., 2009). From the above graph it is shown that, for 10mM
thiosulphate concentration the growth rate is higher than others and for 0.5mM thiosulphate
concentration, the growth rate is very low and it comes to equilibrium quickly. Finally, it is
concluded that with increase in reactant concentration the particle size increases.
4.1.2 Effect of temperature on growth kinetics.
0
100
200
300
400
500
600
700
0 100 200 300 400 500
288K301K315KPa
rtic
le si
ze (n
m)
Time (min)
5mM Concentration
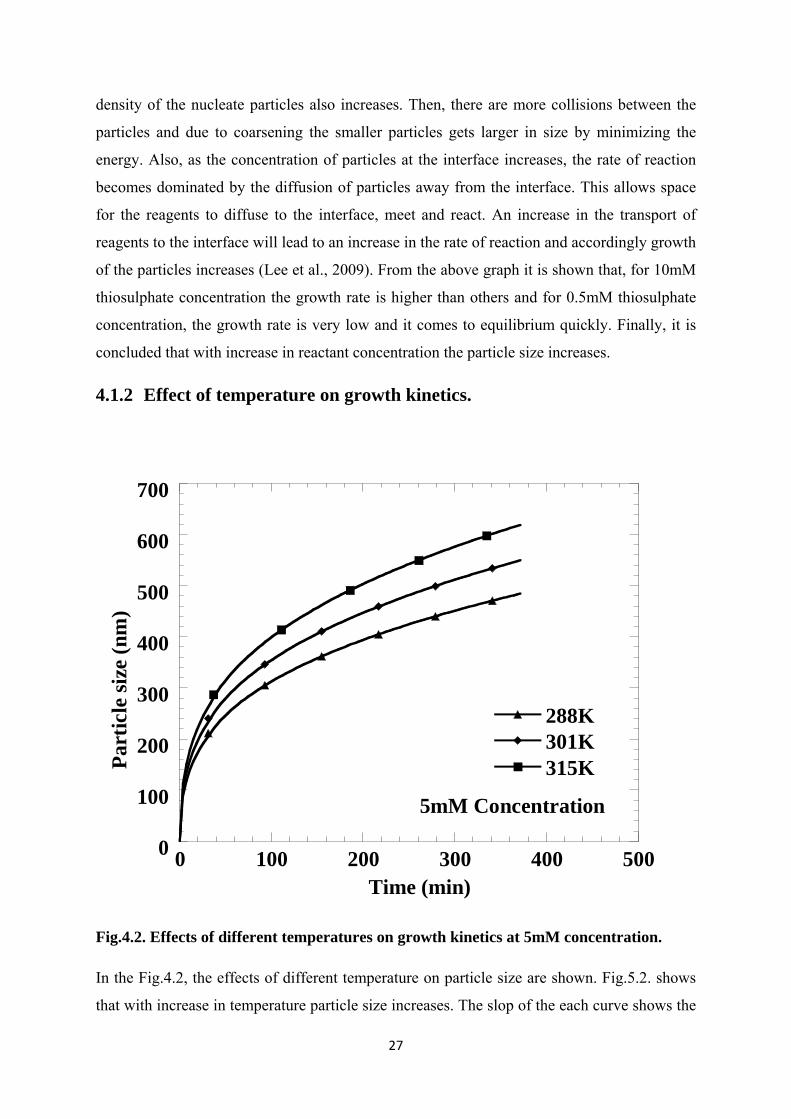
Fig.4.2. Effects of different temperatures on growth kinetics at 5mM concentration.
In the Fig.4.2, the effects of different temperature on particle size are shown. Fig.5.2. shows
that with increase in temperature particle size increases. The slop of the each curve shows the

28
growth of the particle at separate temperature. The order of the slop of the each curve at
different temperature is, 315K>301K>288K. In an endothermic reaction thiosulphate
disproportionate to form sulfur and sulfonic acid, so with increase in temperature rate of the
reaction increases. With increase in temperature the particles gain more kinetic energy and
collision between the particles increases. Due to increase in collision the smaller particles
combine rapidly and form larger particles and their size increases due to coarsening. So, it is
concluded that with increase in temperature particle size increases.
4.1.3 Effect of surface energy on growth kinetics.
0
100
200
300
400
500
600
0 50 100 150 200 250 300 350 400
0.03 J/m2
0.045 J/m2
0.06 J/m2
Part
icle
size
(nm
)
Time (min)
10mM Concentration
Fig.4.3. Effect of surface energy on growth kinetics at 10mM concentration.
In the above plot, effects of surface energy on particle size are shown. The slop of each curve
shows the growth of the particle at different surface energy. Figure shows that with increase
in surface energy particle size increases also reaction becomes faster. The order of the slop of
the curve with different surface energy is 0.06>0.045>0.03(J/m2).Fig.5.3. Displays that the
curve with surface energy 0.06 J/m2 reaches a certain particle size rapidly but the other curves
with surface energy 0.045 J/m2 and 0.03 J/m2 take more time to reach that particle size.

29
Surface energy means the energy applied to increase the surface area for the interaction of
large number of particles and for this reason reaction is very fast with increase in surface
energy Due to the high surface energy the particles are unstable. Then the particles minimize
the surface energy by increasing their size and due to this agglomeration also take place.
Finally, it is concluded that with increase in surface energy particle size increases and the
reaction becomes faster.
4.2 Effect of different parameters on growth kinetics based on Solvent-
Shifting Model (Keuren et al., 2003).
4.2.1 Effect of mass concentration on growth kinetics.
0
200
400
600
800
1000
1200
1400
0 5 10 15 20 25 30
0.32 kg m-3
0.16 kg m-3
0.016 kg m-3
0.032 kg m-3
Part
icle
size
(nm
)
Time (min)
300K Temperature
Fig.4.4. Effect of mass concentration on growth kinetics at 300K temperature.
In the Fig.4.4, the effect of mass concentration on particle size is shown. Figure shows that
with increase in mass concentration particle size increases. Due to increase in mass
concentration density of the nucleate molecules increases. So there will be more collision
between the molecules and then the smaller particle combine to form the larger particle. So,
due to more number of molecules and more collisions the particle having higher mass
30
concentration acquire bigger size particle than the others. Figure displays that particles
having lower mass concentration comes to saturation level very fast. So it is concluded that
with increase in mass concentration particle size increases.
4.2.2 Effect of number density on growth kinetics.
0
0,05
0,1
0,15
0,2
0,25
0,3
0,35
0,4
0 5 10 15 20 25 30
1.425*1022 m-3
9.5*1021 m-3
7.125*1021 m-3
Part
icle
size
(nm
)
Time (min)
0.32 kg m-3 Mass concentration
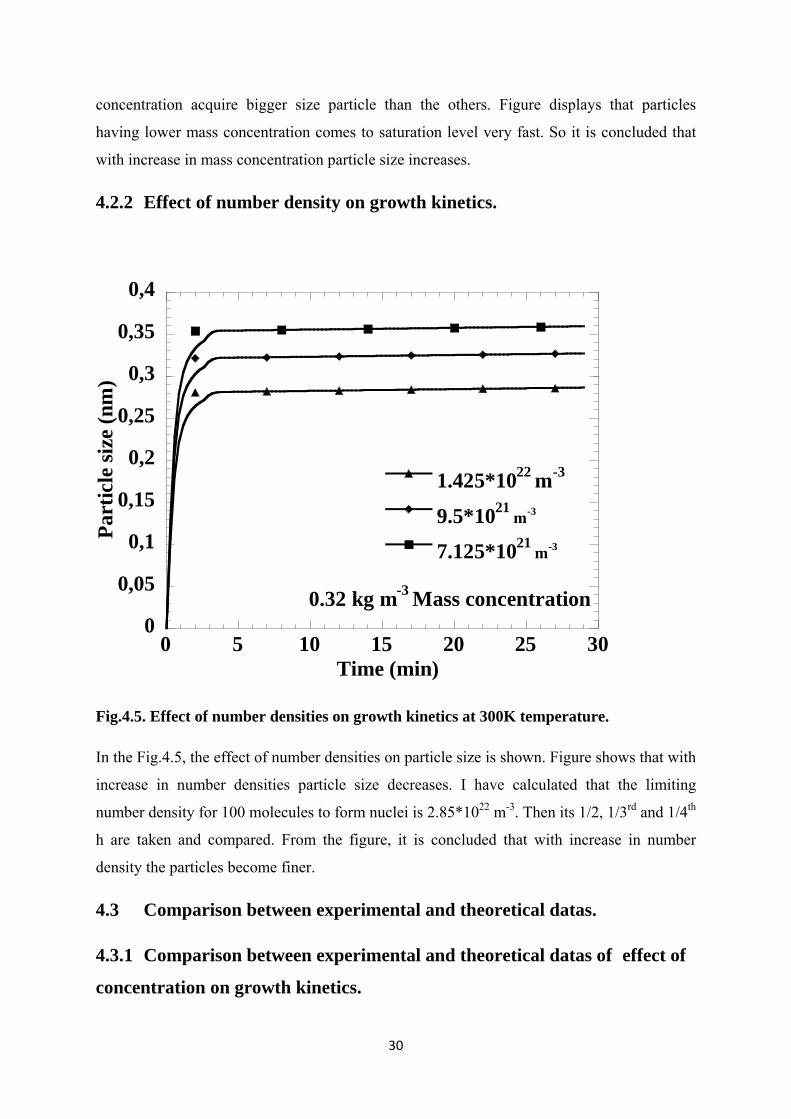
Fig.4.5. Effect of number densities on growth kinetics at 300K temperature.
In the Fig.4.5, the effect of number densities on particle size is shown. Figure shows that with
increase in number densities particle size decreases. I have calculated that the limiting
number density for 100 molecules to form nuclei is 2.85*1022 m-3. Then its 1/2, 1/3rd and 1/4th
h are taken and compared. From the figure, it is concluded that with increase in number
density the particles become finer.
4.3 Comparison between experimental and theoretical datas.
4.3.1 Comparison between experimental and theoretical datas of effect of
concentration on growth kinetics.

31
Discussion
0
50
100
150
200
0 50 100 150 200
TheoreticalExperimentalPa
rtic
le si
ze (n
m)
Time (min)
0.5mM Concentration
Fig.4.6. Comparison of the theoretical and experimental effect of 0.5mM reactant
concentration on growth kinetics at 298K.
In the above figure, the comparison between the experimental datas and the theoretical datas
of 0.5mM thiosulphate concentration are shown. The plot is in between time in minute and
particle size (diameter) in nanometre. From the plot, it is concluded that the curve of the
experimental values is increasing rapidly and then comes to a saturation level after 30
minutes and according to the theoretical values the curve is suddenly increasing upto 10
minutes and then slowly comes to the saturation level, but it will take more time to come to
saturation level than the experimental curve as shown in figure.
For 0.5mM concentration the final particle size, according to the experimental values is
178.3nm (Ghosh Chaudhuri, 2009) and from theoretical the final particle size is 175.4nm.
The error calculated with respect to the experimental value is 1.6% according to the final
particle size but with respect to the time at 60 minutes error is 31%.

32
0
50
100
150
200
250
0 50 100 150 200
TheoreticalExperimental
Part
icle
size
(nm
)
Time (min)
1mM Concentration
Fig.4.7. Comparison between theoretical and experimental effect of 1mM reactant
concentration on growth kinetics at 298K temperature.
In the Fig.4.7, the comparison between the experimental datas and the theoretical datas of
particle size and time of 1mM thiosulphate concentration are shown. From the plot, it is
concluded that the curve of the experimental values is increasing rapidly and then comes to a
saturation level after 50 minutes and according to the theoretical values the curve is suddenly
increasing more than the experimental curve and cuts the curve at about 70nm particle size
and then slowly comes to the saturation level, but it will take more time to come to saturation
level than the experimental curve as shown in figure. The particle size calculation is same as
before.

33
0
200
400
600
800
1000
0 50 100 150 200
TheoreticalExperimental
Part
icle
size
(nm
)
Time (min)
5mM Concentration
Fig.4.8. Comparison between experimental and theoretical effect of 5mM concentration
on growth kinetics at 298K.
In the Fig.4.8, the comparison between the experimental datas and the theoretical datas of
particle size and time of 5mM thiosulphate concentration are shown. From the plot, it is
concluded that the curve of the experimental values is increasing rapidly and then comes to a
saturation level after 160 minutes and according to the theoretical values the curve is
suddenly increasing with the experimental curve and then slowly comes to the saturation
level, but it will take more time to come to saturation level than the experimental curve as
shown in figure. The experimental curve reaches the equilibrium at about 890.1nm at 235
minutes and theoretically it. Reaches equilibrium at about 460nm at about 314 minutes, but at
235 minutes the theoretical particle size is 417.6nm. So the error is 48.32% with respect to
the final particle size and with respect to time at 235 minutes error is 53%. The particle size
calculation is same as before.

34
0
200
400
600
800
1000
1200
1400
0 50 100 150 200
TheoreticalExperimental
Part
icle
size
(nm
)
Time (min)
10mM Concentration
Fig.4.9. Comparison between experimental and theoretical effect of 10mM reactant
concentration on growth kinetics at 298K.
In the above plot, the comparison between the experimental datas and the theoretical datas of
particle size and time of 10mM thiosulphate concentration are shown. From the plot, it is
concluded that the curve of the experimental values is increasing rapidly and then comes to a
saturation level after 180 minutes and according to the theoretical values the curve is
suddenly increasing with the experimental curve upto a size of 160nm and then slowly comes
to the saturation level, but it will take more time to come to saturation level than the
experimental curve as shown in figure. The experimental curve reaches the equilibrium at
about 1239.7nm at 210 minutes and theoretically it reaches equilibrium at about 641.6nm at
about 426 minutes, but at 210 minutes the theoretical particle size is 506.8nm. So the error is
48.24% with respect to the final particle size.

35
4.3.2 Comparison between the experimental and theoretical datas of effect
of temperature on growth kinetics.
Discussion
0
100
200
300
400
500
600
0 50 100 150 200 250 300 350 400
TheoreticalExperimental
Part
icle
size
(nm
)
Time (min)
288K Temperature
Fig.4.10. Comparison between experimental and theoretical effect of 288K temperature
on growth kinetics at 5mM reactant concentration.
In the above plot, the comparison between the experimental datas and the theoretical datas of
particle size and time at 288K temperature are shown. The plot shows that the experimental
curve came to equilibrium at about 180 minutes and the particle size is 506.8nm. According
to the theoretical curve it came to saturation slowly than the experimental curve and the time
taken is 220 minutes and the particle size is 406.6nm. The error calculated with respect to the
final particle is about 19.77%. The calculation of the particle size is same as before by using

36
equations (1, 2, and 3). Here at different temperatures, surface energy changes and with
increase in temperature surface energy increases.
For the calculation surface energy range for sulfur is available (Chibowski et al., 2008).
Experimental datas of particle size at different temperatures are available (Ghosh Chaudhuri,
2009).
0
200
400
600
800
1000
0 50 100 150 200 250 300 350 400
TheoreticalExperimental
Part
icle
size
(nm
)
Time (min)
301K Temperature
Fig.4.11. Comparison of experimental and theoretical effect of 301K temperature on
growth kinetics at 5mM reactant concentration.
In the fig.4.11, the comparison between the experimental datas and the theoretical datas of
particle size and time at 301K temperature are shown. According to the figure shown the
theoretical curve increasing rapidly with the experimental curve upto a height of 120nm and
then it slows down to saturation level. The plot shows that the experimental curve came to
equilibrium at about 210 minutes and the particle size is 890.1nm. According to the
theoretical curve it came to saturation slowly than the experimental curve and the time taken

37
is 347 minutes and the particle size is 537.05nm. The error calculated with respect to the final
particle is about 39.66%.
0
200
400
600
800
1000
1200
0 50 100 150 200 250 300 350 400
TheoreticalExperimental
Part
icle
size
(nm
)
Time (min)
315K Temperature
Fig.4.12. Comparison of experimental and theoretical effect of 315K temperature on
growth kinetics at 5mM reactant concentration.
In the Fig.4.12, the comparison between the experimental datas and the theoretical datas of
particle size and time at 315K temperature are shown. The plot shows that the experimental
curve came to equilibrium at about 210 minutes and the particle size is 1058nm. According to
the theoretical curve it came to saturation slowly than the experimental curve and the time
taken is 372 minutes and the particle size is 619nm. The error calculated with respect to the
final particle size is about 41.49%.
4.4 Error discussion

38
The theoretical datas are not properly fitted to the experimental datas as shown in the figure
may be due to some error in assumptions taken or may be in the experimental datas. At first,
in the theory, nucleation is neglected and only the coarsening part is shown in the figure, but
in the experiment both nucleation and coarsening of the particles occurred. Coarsening part is
the slowest process and saturation part of the curve and nucleation is the fastest process. In
the above figures shown the theoretical datas having only the coarsening part is compared
with the experimental datas having both nucleation and coarsening part. So, due to this there
might be some error. Again, we have assumed that there is 100% conversion of thiosulphate
to sulfur particle and also the mass of the solute is conserved. For this reason, we have taken
that the initial concentration of thiosulphate as the final bulk concentration of the sulfur
particle and there is no change in particle concentration, particle concentration is constant
from starting to the end. But in the experiment it is not the same because in nucleation stage
the particle concentration increases up to critical supersaturation and at growth process
particle concentration decreases. So, for this reason there might be some error. Again, in
place of hydrodynamic radius we have taken the atomic radius of sulfur because in many
papers, hydrodynamic radius was not described in detailed and also how to calculate
hydrodynamic radius not described in any papers. Generally, hydrodynamic radius is larger
than the atomic radius. Due to this also there might be some error. Another factor for which
there might be some error is solubility. With increase in temperature solubility we are
keeping constant but in some papers it was written that solubility increases with increase in
temperature and also particle size increases due to increase in solubility (Segets et al.,
2009).Error is calculated theoretical with respect to experimental.
100exp
exp% ×−
=erimental
ltheoreticaerimentalerror
39
CHAPTER 5
Conclusion 5.1 Conclusion. In this project we have studied the mechanism of formation of sulfur nanoparticles from
thiosulphate solution in aqueous media. According to the mechanism every precipitation
reaction is followed by nucleation, growth and agglomeration. Nucleation is the very fast
stage and then growth is the slowest step and also the rate determining step. After nucleation,
the particles having the size more than critical size started growing and the particles having
size less than critical size again dissolved in the solution. In this project diffusion is rate
determining step. Here we have applied two models that is LSW Model and Solvent-Shifting
Model. There were some assumptions we have taken in both the models and then using the
equations we have generated the theoretical datas of particle size with respect to time and
then we have compared those datas with the experimental datas. From the figures shown in
Chapter.5, we concluded that with increase in reactant concentration the particle size
increases due to increase in collisions between the particles. Particle size also increases with
increase in temperature due increase in kinetic energy and collisions between the molecules.
Surface energy also plays a very important role, with increase in surface energy particle size
increases and also the growth rate is very fast due to the increase in surface area of the
particles which provides the interaction of large number of molecules. The theoretical datas
not fitted properly with the experimental datas as shown in Chapter.5, due to some error. The
error might be due to some assumptions we have taken that is nucleation was neglected and
total mass of the solute is conserved. From the Solvent-Shifting model we have concluded
that particle size increases with increase in mass concentration and also increasing number
density makes the particle finer.

40
References
Reference
Buffat, P.; Borel, J.P. Size effect on the melting temperature of gold particle. J. Phys. Rev.
1976, A13, 2287-2298.
Brinker, C.J.; Scherer, G. W. Sol-Gel Science: The Physics and Chemistry of Sol-Gel
Processing. Academic Press, 1990, ISBN 0121349705.
Chibowski, E.; Terpilowski, K. Surface free energy of sulfur—Revisited I. Yellow and
orange samples solidified against glass surface. J. Colloid and Interface Science. 2008, 319
505–513.
Choy, J.H.; Jang E.S.; Won J.H.; Chung, J.H.; Jang D.J.; Kim Y.W. Hydrothermal route to
ZnO nanocoral reefs and nanofibers. J. Appl. Phys. Lett. 2004, 84, 287-289.
Corriu, R.; Anh, R.T. Molecular Chemistry of Sol-Gel Derived Nanomaterials. John Wiley
and Sons. 2009, ISBN 0470721170.
Deshpande, A.S.; Khomane, R.B.; Vaidya, B.K.; Joshi, R.M.; Harle, A.S.; Kulkarni, B.D.
Sulfur Nanoparticle synthesis and characterization from H2S gas, using novel biodegradable
iron chelate in W/O microemulsion. J. Nanoscale Research Lett. 2008, 3, 221-229.
Destree, C.; Nagy, J.B. Mechanism of formation of inorganic and organic nanoparticles from
microemulsions. J. Advances in Colloid Interface Sci. 2006, 123-126, 353-367.
Dierking, I.; Koshbar, L.L.; Afzali-Ardakani, A.; Lowe, A.C.; Held, G.A. Two stage
switching behaviour of polymer stabilized cholesteric textures. J. Apply. Phys. 1997, 81,
3007-3014.
Dierking, I.; Koshbar, L.L.; Lowe, A.C.; Held, G.A.; Miller, R.D. J. Phys. Rev. Lett. 1997,
79, 3443.
Ding, J.; Miao, W.F.; McCormick, P.G.; Street, R. Mechanochemical synthesis of ultrafine
Fe powder. J. Appl. Phys. Lett. 1995, 67, 3804.
Ellis, M.N.; Ferree, D.C.; Funt, R.C.; Madden, L.V. Effects of an apple scab-resistant cultivar
on use patterns of inorganic and organic fungicides and economics of disease control. J. Plant
disease. 1998, 82, 428-433.

41
Ethayaraja, M.; Bandyopadhyaya, R. Model for Core-Shell Nanoparticles Formation by Ion-
Exchange Mechanism. J. Ind. Eng. Chem. Res. 2008, 47, 5982-5985.
Ghosh Chaudhuri, R. Synthesis and Characterization of S@AgBr Core-Shell Nanoparticles.
M.Tech. Thesis. 2009, N.I.T, Rourkela, India.
Guo, Y.; Zhao, J.;Yang,S.; Yu, K.;Wang, Z.;Zhang, H. Preparation and characterization of
monoclinic sulfur nanoparticles by water in oil microemulsion technique. Powder Technol.
2006, 162, 83-86.
Hale, P. S.; Maddox, L. M.; Shapter, J. G.; Voelcker, N. H.; Ford, M. J.; Waclawik, E. R.
Growth Kinetics and Modelling of ZnO Nanoparticles. J. Chemical Education. 2005, 82,
775-778.
Keuren, E. V.; Georgieva, E.; Durst, M. Kinetics of the Growth of Anthracene Nanoparticles.
J. Dispersion Sci. Technol. 2003, 24, 721–729.
Klein, L. Sol-Gel Optics: Processing and Applications. Springer Verlag. 1994, ISBN
0792394240.
Koch, C.C.; Cho, Y. S. Nanocrystals by high energy ball milling. J. Nanostructured Mater.
1992, 1, 207-212.
LaMer, V. K.; Kenyon, A. S. Kinetics of the mono dispersed sulfur solution from
thiosulphate and acid. J. Colloidal Sci. 1947, 2, 257-264.
LaMer, V. K.; Denegar, R. H. Theory, production and mechanism of formation of mono
dispersed hydrosols. J. Am. Chem. Soc. 1950, 72, 4847-4854.
LaMer, V. K. Nucleation in phase transition. J. Ind. Eng. Chem. 1952, 44, 1270-1277.
LaMer, V.K.; Turgeon, J.C. The Kinetics of the Formation of the Carbinol of Crystal Violet.
J. Am. Chem. Soc. 1952, 74, 5988-5994.
LaMer, V.K.; Umberger, J.Q. The Kinetics of Diffusion Controlled Molecular and Ionic
Reactions in Solution as Determined by Measurements of the Quenching of fluorescence. J.
Am. Chem. Soc. 1945, 67, 1099-1109.
Lee, W. P.; Chen, H.; Dryfe, R.; Ding, Y. Kinetics of nanoparticle synthesis by liquid–liquid
interfacial reaction. Colloids Surf. A 2009, 343, 3–7.
Lifshitz, I.M.; Slyozov, V.V. The kinetics of precipitation from supersaturated solid
solutions. J. Phys. Chem. Solids. 1961, 19, 35-50.

42
McCormick, P.G.; Tsuzuki, T.; Robinson, J.S.; Ding, J. Nanopowders synthesized by
mechanochemical processing. J.Adv. Mater. 2001, 13, 1008-1010.
Oskam, G.; Nellore, A.; Penn, R. L.; Searson, P. C. The Growth Kinetics of TiO2
Nanoparticles from Titanium(IV) Alkoxide at High Water/Titanium Ratio. J. Phys. Chem. B.
2003, 107, 1734-1738.
Rajaram, C.V.; Hudson, S.D.; Chien, L.C. Morphology of Polymer-Stabilized Liquid
Crystals. J. Chem. Mater. 1995, 7, 2300-2308.
Rajaram, C.V.; Hudson, S.D.; Chien, L.C. Morphology of dia-crylate copolymer networks
formed in liquid crystalline media. Polymer. 1998, 39, 5315-5319.
Rao, C.N.R.; Muller, A; Cheetham, A.K. Nanomaterials Chemistry Recent Developments
and directions. WILEY-VCH Verlag GmbH & Co. 2007, 140-144.
Robert, J.C.; Basu, T.K. Sulfur: its clinical and toxicologic aspects. J. Nutrition. 2003, 19, 54-
61.
Sarkar, D.; Gupta, P.; Gautam, A.; Khilar, K.C. Reuse of surfactant/oil phase in nanoparticles
synthesis using W/O microemulsion. AIChE. 2008, 54(2), 582-587.
Segets, D.; Gradl, J.; Taylor, R. K.; Vassilev, V.; Peukert, W. Analysis of Optical
Absorbance Spectra for the Determination of ZnO Nanoparticle Size Distribution, Solubility,
and Surface Energy. J. Am. Chem. Soc. 2009, 3, 1703-1710.
Seokwon, K.; Roman, K.; Musah, R.A. Antibacterial and antifungal activity of sulfur
containing compounds from petiberia alliacea L. J. Ethnopharmacology. 2006, 104, 188-192.
Shaffer, G.B.; McCormick, P.G. Nanopowders synthesized by Mechanochemical processing.
J. Mater. Sci. Lett. 1990, 9, 1014-1016.
Shukla, D.; Mehra, A. Modeling shell formation in core-shell nanocrystals in reverse micelle
systems. Langmuir. 2006, 22, 9500-9506.
Sugimoto, T. Preparation of monodispersed colloidal particles. Adv. Colloid Interface Sci.
1987, 28, 65-108.
Takacs, L. Multiple Combustion Induced by Ball Milling. J. Appl. Phys. Lett. 1996, 69, 436-
438.
Tojo, C.; Barroso, F.; Dios, M. Critical nucleus size effects on nanoparticle formation in
microemulsions. J. Colloid Interface Sci. 2006, 296, 591–598.

43
Wagner, C. Theory of precipitate change by redissolution. J. Z.Elektrochem. 1961, 65, 581-
591.
Wong, E. M.; Bonevich, J. E.; Searson, P. C. Growth Kinetics of Nanocrystalline ZnO
Particles from Colloidal Suspensions. J. Phys. Chem. B 1998, 102, 7770-7775.
Xie, X.Y.; Zheng, W.J.; Bai, Y.; Liu, J. Cystine modified nanosulfur and its spectral
properties. J. Mater. Lett. 2009, 63, 1374-1376.
Yang, H.; McCormick, P.G. Mechanochemical Processing. J. Metall. Mater. Trans. 1998,
29B, 449-445.
http://www.engineeringtoolbox.com/absolute-dynamic-viscosity-water-d_575.html.
http://environmentalchemistry.com/yogi/periodic/S.html.