studies on some physicochemical parameters of soil samples
TRANSCRIPT

Research Guru Volume-10 Issue-3(December,2016) (ISSN:2349-266X)
Page | 113
Research Guru: Online Journal of Multidisciplinary Subjects (Peer-Reviewed)
Studies on Some Physicochemical
Parameters of Soil Samples in Santalpur
Taluka, District Patan, Gujarat, India
Devdatt J. Patel, Pradhuman A. Parmar & Upendra R. Patel*
Department of Chemistry, M.N. College Visnagar, Gujarat, India.
Abstract:
Soil is an important vital component, medium of unconsolidated nutrients and
materials, forms the life layer of plants. The physicochemical parameters of soil determine
their adaptability to cultivation. The present work has been carried out to study some
parameters of soil samples collected from Santalpur Taluka, District Patan. Five
representative locations were selected for the study and 20 samples from each location and
direction of area were collected The soil characterization was carried out for the parameters
like pH, Electrical conductivity, organic carbon, available potash, calcium, magnesium,
sulphur, phosphorous, copper, iron, manganese and zinc. Low, medium & high range of all
parameter also calculated from analysis data. The variations of amount of nutrients were
observed in the soil due to different places. This information will be helpful to the farmers to
solve the problems related to soil nutrients amount of which fertilizers to be added to soil to
increase the yield of crops.
Keywords: Component, Nutrients, Characterization, Electrical conductivity.
Introduction: Soil testing refers to the chemical analysis of soils and is well recognized as a scientific
means for quick characterization of the fertility status of soils and predicting the nutrient
requirement of crops [1-5]. It also includes testing of soils for other properties like texture,
structure, pH, Cation Exchange Capacity, water holding capacity, electrical conductivity and
parameters for amelioration of chemically deteriorated soils for recommending soil amendments,
such as, gypsum for alkali soils and lime for acid soils. One of the objectives of soil tests is to sort
out the nutrient deficient areas from non-deficient ones. This information is important for
determining whether the soils could supply adequate nutrients for optimum crop production or
not. Soils testing take the guesswork out of mainting the soil in optimum condition for plant
growth and developments. Different plants have different soil pH and nutrient requirements.
Testing is inexpensive when compared to investments in yours plants, amendments, time and
efforts. The Fertilizer guidelines provide with the soil test results are based on
environmentally-friendly soil fertility management’s practices. A soil test will assess the
present’s levels of major plant nutrients, soil pH, micronutrients and provide an estimate of
total soil lead. Recommendation will include the amounts of limestone and fertilizer, if
necessary, to meet the requirements of the specific plant or crop being grown. If elevated soil
lead levels are indicated, appropriate information will be including with your results to

Research Guru Volume-10 Issue-3(December,2016) (ISSN:2349-266X)
Page | 114
Research Guru: Online Journal of Multidisciplinary Subjects (Peer-Reviewed)
address this problem. Different studies have shown that the most of the plant nutrients are
optimally available to plants at pH range between 6.5 to 7.5 ranges [5-7]. There are 17
essential nutrients which are required for plant growth.
Phosphorous is an essential element for plant growth and is often applied to agricultural land
to increase crop production. Through soil phosphorous testing, the amounting of phosphorous
fertilizer required to achieve maximum plant grow can be determined. Soil with low or
medium phosphorous content will likely show higher yields if extra phosphorous is added.
However, crops are not likely to respond with a yield increase in soils with high or very high
phosphorous content. Agricultural nutrients such as potassium (K), magnesium (Mg), and
Calcium (Ca) are very important for plants growths and development. The analysis of these
nutrients elements is thus helpful in assessing the fertility of the soil and improving soil
quality prior to planting or during crop growth. Many researchers have made attempt for
analysis of soil samples from different sites to know the fertility status of soil [8-12].
The soil test aimed at soil fertility evaluation with resulting fertilizer recommendation is,
therefore, the actual connecting link between the agronomic research and its practical
application to the farmers’ field. Soil testing can be divided into four steps (1) sampling (2)
analysis (3) interpretation and (4) recommendations. One of the most important aspects of
soil testing is that of obtaining a representative sample of the area.
Plant Nutrients
Although plants absorb a large number of elements, all of them are not essential for
the growth of plant. The elements which are required by plant for their normal growth,
development, metabolism and to complete their life cycle are called the essential ones. Some
of these are required in large amounts and some in traces. Nutrients are classified as Primary
(Macro), Secondary and micro, and are further classified as follow:
Major nutrients required for plant growth
Class 1: Carbon, hydrogen and oxygen (C, H, O).
Class 2: Nitrogen, potassium and phosphorus.
Secondary Nutrients: Magnesium, Calcium and sulphur
Micro nutrients: Iron, boron, zinc, molybdenum, manganese, copper and chlorine.
Soil testing can be divided into four steps (1) sampling (2) analysis (3) interpretation and
(4) recommendations. One of the most important aspects of soil testing is that of obtaining a
representative sample of the area.
CHEMICAL & EQUIPMENTS
Potassium chloride, Buffer tablate, Sulphuric acid, Potassium dichromate, Sodium
bicarbonate, activated charcoal (phosphorous free), Ammonium molybdate, Stannous
chloride, Ammonium acetate, Calcium chloride, Glacial acetic acid, Barium chloride, Gum
acacia, Sodium diethyl dithiocarbomate, Sodium hydroxide, Muroxide, Ethylene di amine

Research Guru Volume-10 Issue-3(December,2016) (ISSN:2349-266X)
Page | 115
Research Guru: Online Journal of Multidisciplinary Subjects (Peer-Reviewed)
tetraacetate, Ammonia buffer, Diethylenetriamine pentaacetic acid, Eriochrome black-T,
were procured from s.d. fine chem Ltd. All chemicals are of analytical grade reagent.
pH was measured on pH meter (systronics Model No-335), Conductivity was
measured on conductivity meter (systronics Model No-304), Optical density was measured
on colorimeter (systronics Model No-202), Analytical balance (Wensar Model No-PGB200)
was used to weigh samples and reagents, Flame photometer (systronics Model No-128) was
used for analysis of Potash, Micro Nutrients was analyzed on Double beam atomic absorption
spectrophotometer (Elico Model No-SL 194).
METHOD OF ANALYSIS:-
(1) pH
10 g soil & 20 ml distilled water were taken in 50 ml beaker & stirred for 30 min. In 50 ml
beaker taken 10 g soil and added 20 ml distilled water and stir for 30 min. Adjusted the
temperature of pH meter at 25 0C. Calibrated the pH meter using 4, 7.0, 9.2 pH buffer
solution. Washed the electrode with distilled water and clean by filter paper. Immerses
electrode in above suspense solution and note the reading.
(2) Potassium
Method for graph factor of Potassium
Prepared following stock solution and from it make various potash ppm solutions and run in
flame photometer and note down potash ppm the reading.
Table No-1: Reading for Standard Graph of Potassium
Flask No.
Stock solution Concentration of Pottash in 100
ml Volumetric Solution (ppm)
Reading of Flame
Photometer
1 0.0ml (Blank) ---------- 0
2 1.0ml 10ppm 38
3 1.5ml 15ppm 47.5
4 2.0ml 20ppm 54.5
5 2.5ml 25ppm 64.5
6 3.0ml 30ppm 74
7 4.0ml 40ppm 96
Total 140ppm 374.5
Calculation
1 Reading = Total Solution of ppm / Total Reading
=140 / 374.5
= 0.374
Research Guru Volume-10 Issue-3(December,2016) (ISSN:2349-266X)
Page | 116
Research Guru: Online Journal of Multidisciplinary Subjects (Peer-Reviewed)
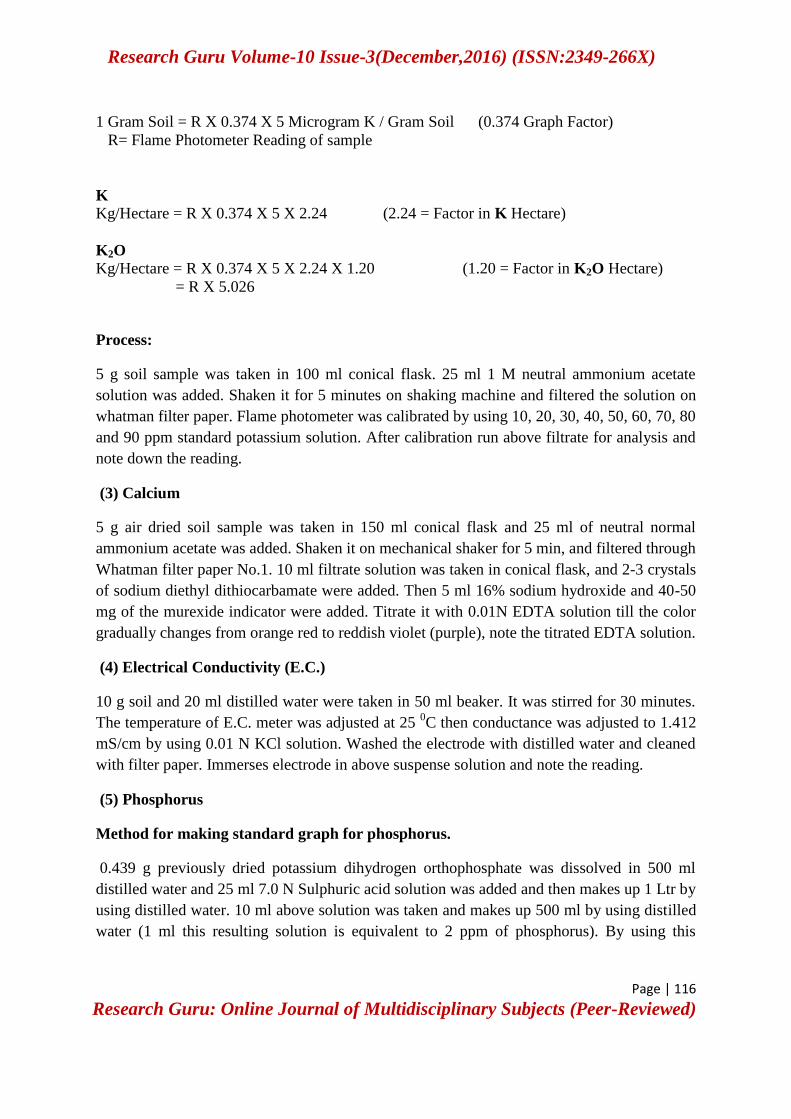
1 Gram Soil = R X 0.374 X 5 Microgram K / Gram Soil (0.374 Graph Factor)
R= Flame Photometer Reading of sample
K
Kg/Hectare = R X 0.374 X 5 X 2.24 (2.24 = Factor in K Hectare)
K2O
Kg/Hectare = R X 0.374 X 5 X 2.24 X 1.20 (1.20 = Factor in K2O Hectare)
= R X 5.026
Process:
5 g soil sample was taken in 100 ml conical flask. 25 ml 1 M neutral ammonium acetate
solution was added. Shaken it for 5 minutes on shaking machine and filtered the solution on
whatman filter paper. Flame photometer was calibrated by using 10, 20, 30, 40, 50, 60, 70, 80
and 90 ppm standard potassium solution. After calibration run above filtrate for analysis and
note down the reading.
(3) Calcium
5 g air dried soil sample was taken in 150 ml conical flask and 25 ml of neutral normal
ammonium acetate was added. Shaken it on mechanical shaker for 5 min, and filtered through
Whatman filter paper No.1. 10 ml filtrate solution was taken in conical flask, and 2-3 crystals
of sodium diethyl dithiocarbamate were added. Then 5 ml 16% sodium hydroxide and 40-50
mg of the murexide indicator were added. Titrate it with 0.01N EDTA solution till the color
gradually changes from orange red to reddish violet (purple), note the titrated EDTA solution.
(4) Electrical Conductivity (E.C.)
10 g soil and 20 ml distilled water were taken in 50 ml beaker. It was stirred for 30 minutes.
The temperature of E.C. meter was adjusted at 25 0C then conductance was adjusted to 1.412
mS/cm by using 0.01 N KCl solution. Washed the electrode with distilled water and cleaned
with filter paper. Immerses electrode in above suspense solution and note the reading.
(5) Phosphorus
Method for making standard graph for phosphorus.
0.439 g previously dried potassium dihydrogen orthophosphate was dissolved in 500 ml
distilled water and 25 ml 7.0 N Sulphuric acid solution was added and then makes up 1 Ltr by
using distilled water. 10 ml above solution was taken and makes up 500 ml by using distilled
water (1 ml this resulting solution is equivalent to 2 ppm of phosphorus). By using this

Research Guru Volume-10 Issue-3(December,2016) (ISSN:2349-266X)
Page | 117
Research Guru: Online Journal of Multidisciplinary Subjects (Peer-Reviewed)
solution, various standard phosphorus ppm solutions were prepared and measured and their
optical densities (O.D.) were measured by using red filter.
Table No-2: Standard Graph of Phosphorous
Flask
No.
2 ppm Working
Solution of
Phosphorous
8.5 pH Solution
of Sodium
Bicarbonate
1.5
Percentage
Solution of
Ammonium
Molybdate-
HCl
Working
Solution of
Steanus
Chloride
O.D.
1 0 Blank 5 ml 5 ml 1 ml 0
2 1 ml = 2 ppm 5 ml 5 ml 1 ml 22
3 2 ml = 4 ppm 5 ml 5 ml 1 ml 36
4 3 ml = 6 ppm 5 ml 5 ml 1 ml 57
5 4 ml = 8 ppm 5 ml 5 ml 1 ml 81
6 5 ml = 10 ppm 5 ml 5 ml 1 ml 103
7 10 ml = 20 ppm 5 ml 5 ml 1 ml 197
Total = 50 ppm 496
Calculation
1 Reading
= Total Solution of ppm / Total Reading
=50 / 496
= 0.101
0.1010 Microgram P (Graph Factor)
1 Gram Soil = R X 0.1010 X 4 Microgram P/ Gram Soil
R =Colorimeter Reading of Sample 0. 1010= Graph Factor
P (Kg/ Hectare) = R X 0.1010 X 4 X 2.24 (2.24 = Factor in 'P' Hectare)
P2O5 Kg/ Hectare = R X 0.1010 X 4 X 2.24 X 2.29 (2.29 = Factor in 'P2O5 ' Hectare)
P2O5 Kg/ Hectare = R X 2.0723584
Research Guru Volume-10 Issue-3(December,2016) (ISSN:2349-266X)
Page | 118
Research Guru: Online Journal of Multidisciplinary Subjects (Peer-Reviewed)
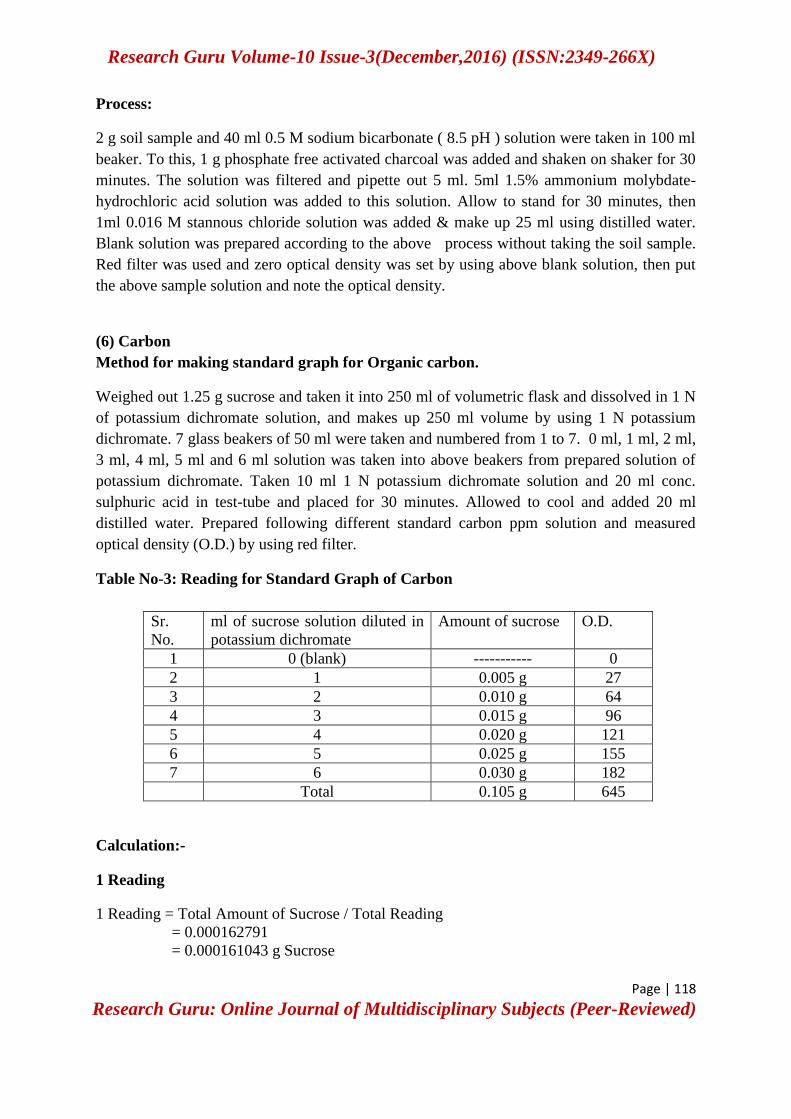
Process:
2 g soil sample and 40 ml 0.5 M sodium bicarbonate ( 8.5 pH ) solution were taken in 100 ml
beaker. To this, 1 g phosphate free activated charcoal was added and shaken on shaker for 30
minutes. The solution was filtered and pipette out 5 ml. 5ml 1.5% ammonium molybdate-
hydrochloric acid solution was added to this solution. Allow to stand for 30 minutes, then
1ml 0.016 M stannous chloride solution was added & make up 25 ml using distilled water.
Blank solution was prepared according to the above process without taking the soil sample.
Red filter was used and zero optical density was set by using above blank solution, then put
the above sample solution and note the optical density.
(6) Carbon
Method for making standard graph for Organic carbon.
Weighed out 1.25 g sucrose and taken it into 250 ml of volumetric flask and dissolved in 1 N
of potassium dichromate solution, and makes up 250 ml volume by using 1 N potassium
dichromate. 7 glass beakers of 50 ml were taken and numbered from 1 to 7. 0 ml, 1 ml, 2 ml,
3 ml, 4 ml, 5 ml and 6 ml solution was taken into above beakers from prepared solution of
potassium dichromate. Taken 10 ml 1 N potassium dichromate solution and 20 ml conc.
sulphuric acid in test-tube and placed for 30 minutes. Allowed to cool and added 20 ml
distilled water. Prepared following different standard carbon ppm solution and measured
optical density (O.D.) by using red filter.
Table No-3: Reading for Standard Graph of Carbon
Sr.
No.
ml of sucrose solution diluted in
potassium dichromate
Amount of sucrose O.D.
1 0 (blank) ----------- 0
2 1 0.005 g 27
3 2 0.010 g 64
4 3 0.015 g 96
5 4 0.020 g 121
6 5 0.025 g 155
7 6 0.030 g 182
Total 0.105 g 645
Calculation:-
1 Reading
1 Reading = Total Amount of Sucrose / Total Reading
= 0.000162791
= 0.000161043 g Sucrose

Research Guru Volume-10 Issue-3(December,2016) (ISSN:2349-266X)
Page | 119
Research Guru: Online Journal of Multidisciplinary Subjects (Peer-Reviewed)
1 Reading Carbon value:
0.00006837
0.00006764 gram organic carbon
1 Reading Graph Factor Value = 0.000067638 X 100
= 0.0067638
Process:
Taken 1.0 g soil sample in 100 ml beaker. 10 ml 1 N Potassium dichromate solution and 20
ml conc. Sulfuric acid were added to the sample and cooled the solution for 30 minutes. 20
ml distilled water was slowly added and allowed for 12 hrs for oxidation. Then first set zero
optical density using blank solution (as above method without taking soil sample). Measured
optical density (O.D.) of soil sample by using red filter and note down the reading.
(7) Magnesium
5 g air dried soil sample was taken in conical flask. To this, 25 ml of neutral ammonium
acetate solution was added. The solution was shaken on mechanical shaker and filtered
through Whatman (No.1) filter paper. 5 ml solution was pipetted out in conical flask. To this
solution, 2-3 crystal sodium diethyl dithiocarbamate, 5 ml of ammonium chloride-ammonium
hydroxide buffer solution and 3-4 drops of Eriochrome black-T indicator were added.
Titrated it slowly against 0.01 M EDTA solution. At the end point color changed from wine
red to blue.
(8) Sulphur
Method for making standard graph for Sulphur
Weighted out 5.434 g potassium sulphate and make up 1 Ltr by using distilled water
(this solution contains 1000 ppm of sulphur). 25 ml this solution was taken and make up 1 Ltr
with distilled water (this is working standard solution of sulphur). Taken 0.0 (Blank), 1.0, 2.0,
3.0, 4.0, 5.0, 6.0, 7.0, 8.0, and 10 ml working solution in 25 ml volumetric flask. In every
flask 1.0 g barium chloride and 1 ml gum acacia solution were added, and make up 25 ml by
using distilled water. Then optical density of blank solution was set to zero using blue filter.

Research Guru Volume-10 Issue-3(December,2016) (ISSN:2349-266X)
Page | 120
Research Guru: Online Journal of Multidisciplinary Subjects (Peer-Reviewed)
Table No-4: Reading for Standard Graph of Sulphur
Sr. No. Working standard sulphur solution in ml ppm O.D.
1 0 0 0
2 1 1 10
3 2 2 22
4 3 3 31
5 4 4 42
6 5 5 52
7 6 6 64
8 7 7 86
9 8 8 101
10 10 10 124
Total ppm 46 Total: 532
Calculation:-
1 Reading = Total ppm of Sulphar/Total reading
1 Reading = 46/532
=0.09
Sulphar ppm or mg/kg
Sulphar ppm or mg/kg = sample reading X graph Factor X 50 X 25 /20 X 10
Sample Reading X 0.084871 X 50 X 25/200
Sulphar ppm = Sample Reading X 0.530443 or mg/kg
Process:
10 g air dried soil sample was taken in 150 ml conical flask. 50 ml 0.15% calcium
chloride extracting solution was added and shaken on mechanical shaker for 30 min. Filtered
it on whatman filter No. 42. 20 ml filtrate was taken in 25 ml volumetric flask. 2 ml glacial
acetic acid, 1 g crystal of barium chloride and 1 ml gum acacia solution were added. Make up
the volume to 25 ml, then first set zero optical density using blank solution (as above method
without taking soil sample).Measured optical densities (O.D) of above prepared sample by
using blue filter.

Research Guru Volume-10 Issue-3(December,2016) (ISSN:2349-266X)
Page | 121
Research Guru: Online Journal of Multidisciplinary Subjects (Peer-Reviewed)
(9) Micronutrients (Cu, Fe, Mn, Zn) analysis by AAS
Preparation of D.T.P.A extracting solution
1.967 g D.T.P.A. and 13.3 ml triethanol amine were taken in 500 ml flask. 400 ml distilled
water was added. 1.47 g calcium chloride dihydrate was taken in 1ltr flask and dissolved in
400 ml distilled water. To this solution, previously prepared D.T.P.A. & T.E.A. solution was
added and pH was adjusted to 7.3 by using add 1M HCl. Make up 1 ltr with distilled water.
Analysis method for micronutrients (Cu, Fe, Mn, Zn)
Weighted 20 g dried soil sample in a plastic bottle, then added 40 ml of D.P.T.A.
solution. Shake on mechanical shaker for 2 hrs. Filtered it on whatman filter No. 40 in funnel
cum test tube. Prepared standard curve for element by using different working ppm solution
as per standard method of analysis and condition suggested by Elico brochure and then run
the sample and note the ppm of elements. Obtained ppm reading multiped with factor 2.0.
Result and Discussion
Soil sampling
Soil sampling was done during the dry season. Soil sampling was done at five
randomly located points within each farm. The soils were sampled at two depths, 0 to 15 cm,
15 to 35 cm, using mini-soil pits dug at each sampling point. The soil samples were air dried
in the laboratory and sieved through a 2 mm sieve for different types of laboratory analyses.
The Results of soil samples & its LMH data shown in table no: 7(A), 7(B), 8(A), 8(B), 9(A),
9(B), 10(A), 10(B), 11(A), and 11(B).

Research Guru Volume-10 Issue-3(December,2016) (ISSN:2349-266X)
Page | 122
Research Guru: Online Journal of Multidisciplinary Subjects (Peer-Reviewed)
Calculation of soil fertility Index:
=
Table No-6: Calculation of Low, Medium, High rating of soil fertility
Index:
Sr. No. Rang Rating
1 Less than 1.67 Low
2 1.67 to 2.33 Medium
3 Greater than 2.33 High
Table No-5: Critical Limits of Nutrients:-
Sr.
No. Parameters Unit
Critical Limits
Low Medium High
1 pH ------ <6.5 6.5-8.2 >8.2
2 Electric Conductance ------ <1 1-3 >3
3 Organic carbon % <0.51 0.51-0.75 >0.75
4 Phosphorous Kg/Hectare <26 26-60 >60
5 Potash Kg/Hectare <151 151-300 >300
6 Zinc ppm <0.5 0.5-1.0 >1.0
7 Ferrous ppm <5 5-10 >10
8 Sulphur ppm <10 10-20 >20
9 Manganese ppm <5 5-10 >10
10 Copper ppm <0.2 0.2-0.4 >0.4
11 Magnesium ppm <1.0 1.0-2.0 >2.0
12 Calcium ppm <1.5 1.5-3.0 >3.0

Research Guru Volume-10 Issue-3(December,2016) (ISSN:2349-266X)
Page | 123
Research Guru: Online Journal of Multidisciplinary Subjects (Peer-Reviewed)
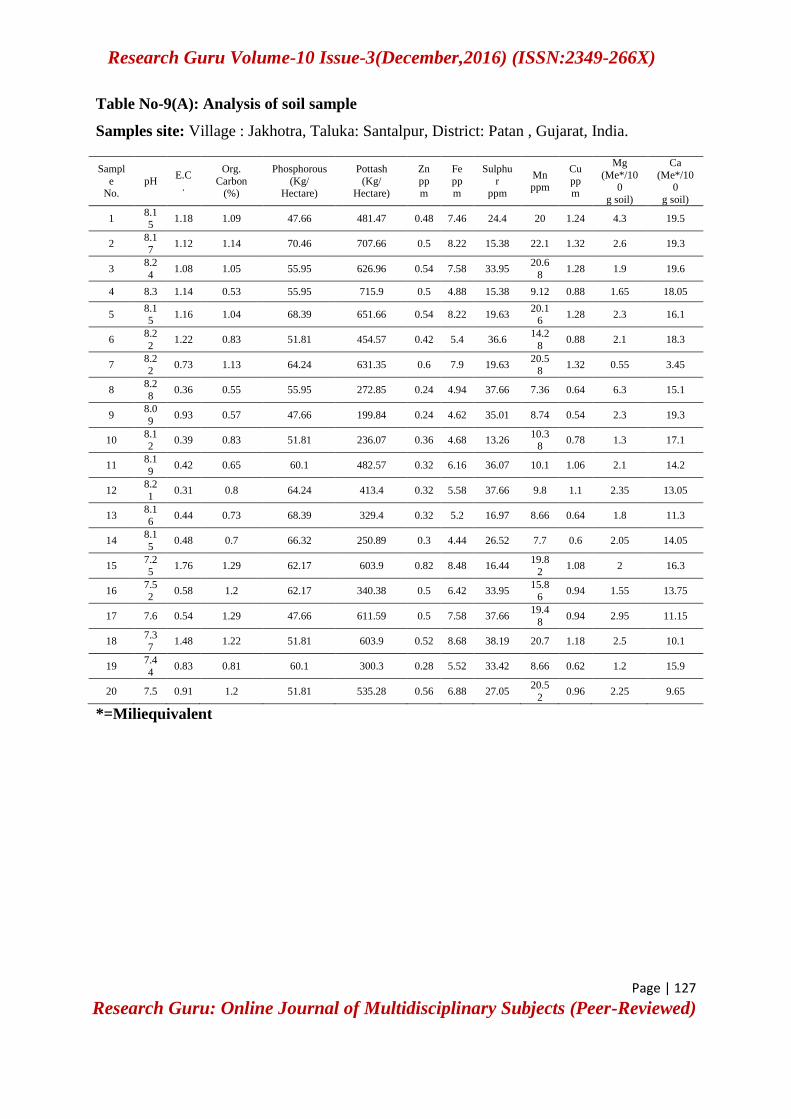
Table No-7(A): Analysis of soil sample
Samples site: Village : Vauva, Taluka: Santalpur, District: Patan , Gujarat, India.
SampleNo.
pH E.C.
Org.
Carbon
(%)
Phosphorou
s (Kg/
Hectare)
Pottash
(Kg/
Hectare)
Zn ppm
Fe ppm
Sulphu
r
ppm
Mn ppm
Cu ppm
Mg
(Me*/100
g soil)
Ca
(Me*/100
g soil)
1 8 0.23 0.51 58.03 525.94 0.68 7.36 31.3 9.8 2.44 1.95 12.55
2 7.8 0.32 0.99 39.37 473.02 1.16 6.3 19.63 11.04 2.6 2.7 11.1
3 7.5 0.33 0.49 84.97 290.42 0.7 7.62 32.89 8.88 1.68 1.75 13.55
4 7.3 0.4 0.74 76.68 377.27 1.4 7.42 32.36 1.58 2.18 2.85 14.45
5 7.7 0.31 0.8 66.32 246.28 0.64 6.62 17.5 8.44 1.6 2.3 13.4
6 7.6 0.28 0.83 45.59 278.89 1.56 7.42 31.3 13.32 3.04 1.85 12.35
7 7.9 0.4 0.87 84.97 389.79 0.8 6.86 21.22 10.92 1.54 2.75 19.35
8 7.3 0.35 0.53 62.17 224.54 0.92 9.2 18.04 9.2 2 2.7 151
9 7.7 0.49 0.45 80.82 242.66 0.46 6.54 25.99 9.16 1.44 1.85 12.15
10 7.4 0.29 0.59 68.39 206.97 0.46 9.34 13.26 6.14 1.6 2 13.6
11 7.9 0.37 0.55 70.46 341.48 0.84 7.04 28.64 11.22 2.54 1.6 11.4
12 8.1 0.22 0.57 78.75 307.99 1.08 6.62 25.46 12.56 2.06 1.55 13.15
13 7.8 0.33 0.51 47.66 396.38 0.54 9.34 18.04 6.3 1.34 1.5 9.9
14 7.4 0.23 0.76 55.95 203.68 1.72 9.14 33.42 14.36 3.54 1.55 12.35
15 7.4 0.36 0.8 8.82 200.39 0.8 5.92 36.6 10.6 1.9 0.8 13.3
16 8 0.24 0.62 53.88 208.62 0.8 6.18 18.57 10.32 1.66 2.3 13.9
17 7.3 0.24 0.49 60.1 362.89 0.78 6.68 26.52 11.46 1.66 2.35 14.05
18 7.8 0.24 0.99 62.17 208.62 0.36 6.92 25.46 7.26 1.34 1.45 8.65
19 7.7 0.39 0.64 76.68 193.8 2.28 6.54 23.87 5.64 1.16 1.25 8.45
20 7.8 0.52 0.32 58.03 272.85 2.34 8.5 19.1 12.18 1.12 2.45 10.35
*=Miliequivalent
Research Guru Volume-10 Issue-3(December,2016) (ISSN:2349-266X)
Page | 124
Research Guru: Online Journal of Multidisciplinary Subjects (Peer-Reviewed)
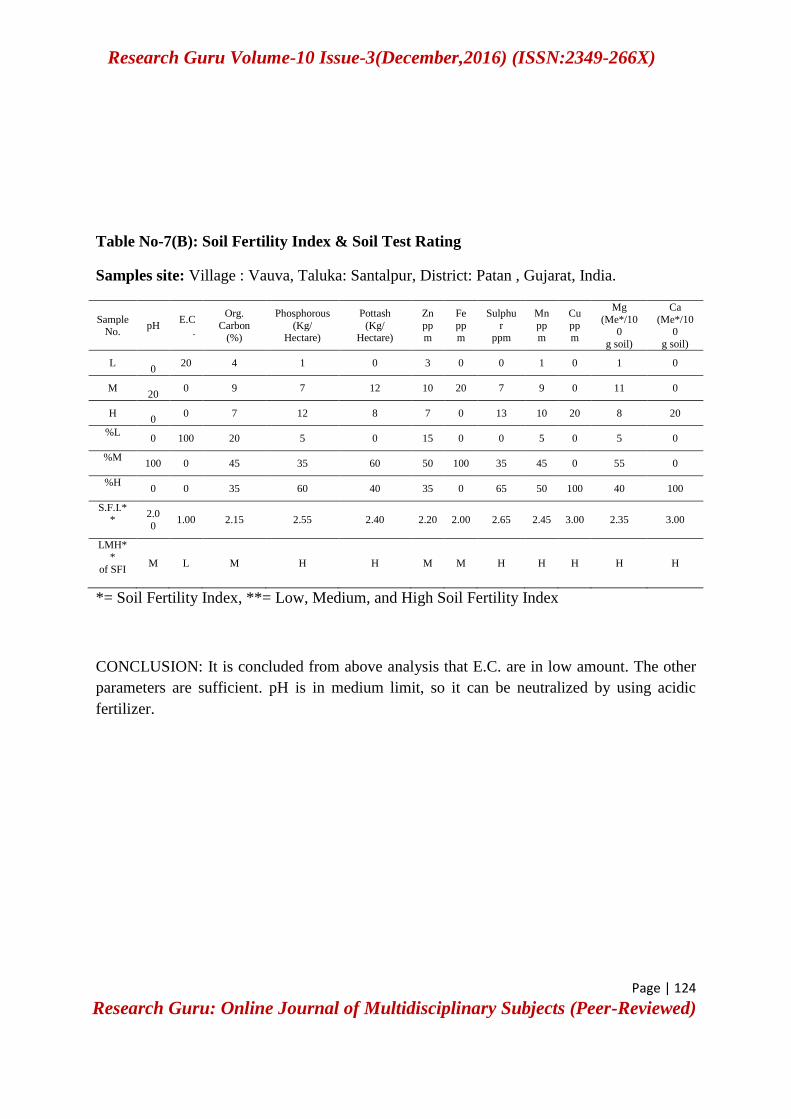
Table No-7(B): Soil Fertility Index & Soil Test Rating
Samples site: Village : Vauva, Taluka: Santalpur, District: Patan , Gujarat, India.
Sample No.
pH E.C
.
Org.
Carbon (%)
Phosphorous
(Kg/ Hectare)
Pottash
(Kg/ Hectare)
Zn
ppm
Fe
ppm
Sulphu
r ppm
Mn
ppm
Cu
ppm
Mg
(Me*/100
g soil)
Ca
(Me*/100
g soil)
L
0 20 4 1 0 3 0 0 1 0 1 0
M
20 0 9 7 12 10 20 7 9 0 11 0
H
0 0 7 12 8 7 0 13 10 20 8 20
%L
0 100 20 5 0 15 0 0 5 0 5 0
%M
100 0 45 35 60 50 100 35 45 0 55 0
%H
0 0 35 60 40 35 0 65 50 100 40 100
S.F.I.**
2.0
0 1.00 2.15 2.55 2.40 2.20 2.00 2.65 2.45 3.00 2.35 3.00
LMH**
of SFI
M L M H H M M H H H H H
*= Soil Fertility Index, **= Low, Medium, and High Soil Fertility Index
CONCLUSION: It is concluded from above analysis that E.C. are in low amount. The other
parameters are sufficient. pH is in medium limit, so it can be neutralized by using acidic
fertilizer.
Research Guru Volume-10 Issue-3(December,2016) (ISSN:2349-266X)
Page | 125
Research Guru: Online Journal of Multidisciplinary Subjects (Peer-Reviewed)
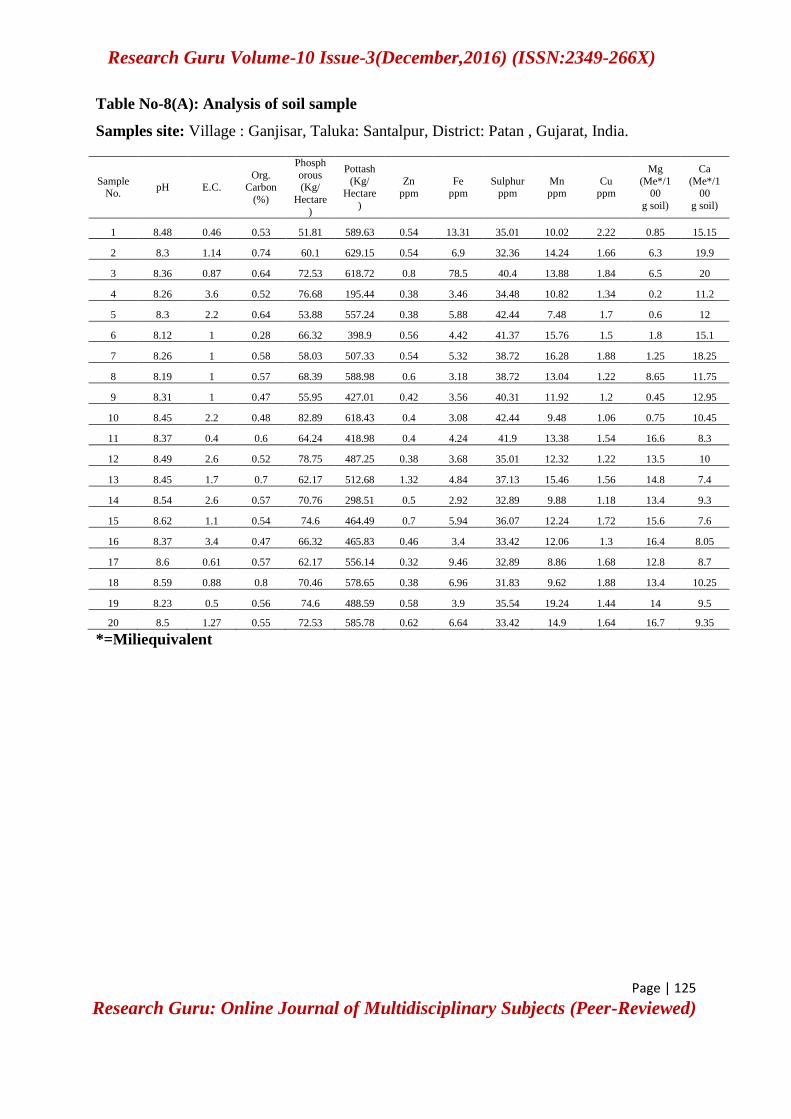
Table No-8(A): Analysis of soil sample
Samples site: Village : Ganjisar, Taluka: Santalpur, District: Patan , Gujarat, India.
Sample No.
pH E.C. Org.
Carbon
(%)
Phosph
orous (Kg/
Hectare)
Pottash
(Kg/ Hectare
)
Zn ppm
Fe ppm
Sulphur ppm
Mn ppm
Cu ppm
Mg
(Me*/100
g soil)
Ca
(Me*/100
g soil)
1 8.48 0.46 0.53 51.81 589.63 0.54 13.31 35.01 10.02 2.22 0.85 15.15
2 8.3 1.14 0.74 60.1 629.15 0.54 6.9 32.36 14.24 1.66 6.3 19.9
3 8.36 0.87 0.64 72.53 618.72 0.8 78.5 40.4 13.88 1.84 6.5 20
4 8.26 3.6 0.52 76.68 195.44 0.38 3.46 34.48 10.82 1.34 0.2 11.2
5 8.3 2.2 0.64 53.88 557.24 0.38 5.88 42.44 7.48 1.7 0.6 12
6 8.12 1 0.28 66.32 398.9 0.56 4.42 41.37 15.76 1.5 1.8 15.1
7 8.26 1 0.58 58.03 507.33 0.54 5.32 38.72 16.28 1.88 1.25 18.25
8 8.19 1 0.57 68.39 588.98 0.6 3.18 38.72 13.04 1.22 8.65 11.75
9 8.31 1 0.47 55.95 427.01 0.42 3.56 40.31 11.92 1.2 0.45 12.95
10 8.45 2.2 0.48 82.89 618.43 0.4 3.08 42.44 9.48 1.06 0.75 10.45
11 8.37 0.4 0.6 64.24 418.98 0.4 4.24 41.9 13.38 1.54 16.6 8.3
12 8.49 2.6 0.52 78.75 487.25 0.38 3.68 35.01 12.32 1.22 13.5 10
13 8.45 1.7 0.7 62.17 512.68 1.32 4.84 37.13 15.46 1.56 14.8 7.4
14 8.54 2.6 0.57 70.76 298.51 0.5 2.92 32.89 9.88 1.18 13.4 9.3
15 8.62 1.1 0.54 74.6 464.49 0.7 5.94 36.07 12.24 1.72 15.6 7.6
16 8.37 3.4 0.47 66.32 465.83 0.46 3.4 33.42 12.06 1.3 16.4 8.05
17 8.6 0.61 0.57 62.17 556.14 0.32 9.46 32.89 8.86 1.68 12.8 8.7
18 8.59 0.88 0.8 70.46 578.65 0.38 6.96 31.83 9.62 1.88 13.4 10.25
19 8.23 0.5 0.56 74.6 488.59 0.58 3.9 35.54 19.24 1.44 14 9.5
20 8.5 1.27 0.55 72.53 585.78 0.62 6.64 33.42 14.9 1.64 16.7 9.35
*=Miliequivalent

Research Guru Volume-10 Issue-3(December,2016) (ISSN:2349-266X)
Page | 126
Research Guru: Online Journal of Multidisciplinary Subjects (Peer-Reviewed)
Table No-8(B): Soil Fertility Index & Soil Test Rating
Samples site: Village : Ganjisar, Taluka: Santalpur, District: Patan , Gujarat, India.
Sample
No. pH
E.C
.
Org. Carbon
(%)
Phosphorous (Kg/
Hectare)
Pottash (Kg/
Hectare)
Zn pp
m
Fe pp
m
Sulphur
ppm
Mn pp
m
Cu pp
m
Mg
(Me*/
100 g soil)
Ca
(Me*/
100 g soil)
L 0 6 4 0 0 9 11 0 0 0 5 0
M 2 12 15 4 2 10 7 0 5 0 2 0
H 18 2 1 16 18 1 2 20 15 20 13 20
%L
0 30 20 0 0 45 55 0 0 0 25 0
%M
10 60 75 20 10 50 35 0 25 0 10 0
%H
90 10 5 80 90 5 10 100 75 100 65 100
S.F.I.*
2.90 1.8
0
1.85 2.80 2.90 1.60 1.55 3.00 2.75 3.0
0
2.40 3.00
LMH** of SFI
H M M H H L L H H H H H
*= Soil Fertility Index, **= Low, Medium, and High Soil Fertility Index
CONCLUSION: It is concluded from above analysis that Fe and Zn are in low amount.
Ferrous ammonium sulphate & Zinc Sulphate should be added for better plant growth &
productivity. The other parameters are sufficient. pH is in high limit, so it can be neutralized
by using acidic fertilizer.
Research Guru Volume-10 Issue-3(December,2016) (ISSN:2349-266X)
Page | 127
Research Guru: Online Journal of Multidisciplinary Subjects (Peer-Reviewed)
Table No-9(A): Analysis of soil sample
Samples site: Village : Jakhotra, Taluka: Santalpur, District: Patan , Gujarat, India.
Sampl
e No.
pH E.C
.
Org.
Carbon (%)
Phosphorous
(Kg/ Hectare)
Pottash
(Kg/ Hectare)
Zn
ppm
Fe
ppm
Sulphu
r ppm
Mn ppm
Cu
ppm
Mg
(Me*/100
g soil)
Ca
(Me*/100
g soil)
1 8.15
1.18 1.09 47.66 481.47 0.48 7.46 24.4 20 1.24 4.3 19.5
2 8.1
7 1.12 1.14 70.46 707.66 0.5 8.22 15.38 22.1 1.32 2.6 19.3
3 8.2
4 1.08 1.05 55.95 626.96 0.54 7.58 33.95
20.6
8 1.28 1.9 19.6
4 8.3 1.14 0.53 55.95 715.9 0.5 4.88 15.38 9.12 0.88 1.65 18.05
5 8.15
1.16 1.04 68.39 651.66 0.54 8.22 19.63 20.1
6 1.28 2.3 16.1
6 8.2
2 1.22 0.83 51.81 454.57 0.42 5.4 36.6
14.2
8 0.88 2.1 18.3
7 8.2
2 0.73 1.13 64.24 631.35 0.6 7.9 19.63
20.5
8 1.32 0.55 3.45
8 8.2
8 0.36 0.55 55.95 272.85 0.24 4.94 37.66 7.36 0.64 6.3 15.1
9 8.0
9 0.93 0.57 47.66 199.84 0.24 4.62 35.01 8.74 0.54 2.3 19.3
10 8.12
0.39 0.83 51.81 236.07 0.36 4.68 13.26 10.3
8 0.78 1.3 17.1
11 8.1
9 0.42 0.65 60.1 482.57 0.32 6.16 36.07 10.1 1.06 2.1 14.2
12 8.2
1 0.31 0.8 64.24 413.4 0.32 5.58 37.66 9.8 1.1 2.35 13.05
13 8.16
0.44 0.73 68.39 329.4 0.32 5.2 16.97 8.66 0.64 1.8 11.3
14 8.1
5 0.48 0.7 66.32 250.89 0.3 4.44 26.52 7.7 0.6 2.05 14.05
15 7.25
1.76 1.29 62.17 603.9 0.82 8.48 16.44 19.8
2 1.08 2 16.3
16 7.52
0.58 1.2 62.17 340.38 0.5 6.42 33.95 15.8
6 0.94 1.55 13.75
17 7.6 0.54 1.29 47.66 611.59 0.5 7.58 37.66 19.4
8 0.94 2.95 11.15
18 7.37
1.48 1.22 51.81 603.9 0.52 8.68 38.19 20.7 1.18 2.5 10.1
19 7.4
4 0.83 0.81 60.1 300.3 0.28 5.52 33.42 8.66 0.62 1.2 15.9
20 7.5 0.91 1.2 51.81 535.28 0.56 6.88 27.05 20.5
2 0.96 2.25 9.65
*=Miliequivalent

Research Guru Volume-10 Issue-3(December,2016) (ISSN:2349-266X)
Page | 128
Research Guru: Online Journal of Multidisciplinary Subjects (Peer-Reviewed)
Table No-9(B): Soil Fertility Index & Soil Test Rating
Samples site: Village : Jakhotra, Taluka: Santalpur, District: Patan , Gujarat, India.
Sample
No. pH
E.C
.
Org.
Carbon (%)
Phosphorous
(Kg/
Hectare)
Pottash
(Kg/
Hectare)
Zn
pp
m
Fe
pp
m
Sulphu
r
ppm
Mn
pp
m
Cu
pp
m
Mg
(Me*/
100
g soil)
Ca
(Me*/
100
g soil)
L 0 12 0 0 0 10 5 0 0 0 1 0
M 14 8 6 10 4 10 15 7 7 0 7 0
H 6 0 14 10 16 0 0 13 13 20 12 20
%L 0 60 0 0 0 50 25 0 0 0 5 0
%M 70 40 30 50 20 50 75 35 35 0 35 0
%H 30 0 70 50 80 0 0 65 65 100 60 100
S.F.I.* 2.30 1.40 2.70 2.50 2.80 1.50 1.75 2.65 2.65 3.0
0 2.55 3.00
LMH** of
SFI M L H H H L M H H H H H
*= Soil Fertility Index, **= Low, Medium, and High Soil Fertility Index
CONCLUSION: It is concluded from above analysis that E.C. and Zn are in low amount.
Zinc Sulphate should be added for better plant growth & productivity. The other parameters
are sufficient. pH is in medium limit, so it can be neutralized by using acidic fertilizer.

Research Guru Volume-10 Issue-3(December,2016) (ISSN:2349-266X)
Page | 129
Research Guru: Online Journal of Multidisciplinary Subjects (Peer-Reviewed)
Table No-10(A): Analysis of soil sample
Samples site: Village : Piparala, Taluka: Santalpur, District: Patan , Gujarat, India.
Sampl
e
No.
pH E.C
.
Org.
Carbon
(%)
Phosphorous
(Kg/
Hectare)
Pottash
(Kg/
Hectare)
Zn
pp
m
Fe
ppm
Sulphu
r
ppm
Mn
ppm
Cu
pp
m
Mg
(Me*/10
0
g soil)
Ca
(Me*/10
0
g soil)
2 8.38
0.32 0.2 72.53 497.42
0.44
10.58 10.61
11.12
1.44 3.1 9.2
3 8 0.28 0.24 55.95 369.19
0.48
11.34 14.85
12.54 1.7 1.65 8.95
4
7.9
5
0.3
6 0.26 66.32 456.33
0.4
8
10.9
6 22.28 11.8
1.6
2 1 9.9
5 8.38
0.32 0.2 72.53 497.42
0.44
10.58 10.61
11.12
1.44 3.1 9.2
6
8.1
7
0.4
1 0.21 58.03 543.61
0.4
8
10.8
6 19.1
13.3
4
1.5
8 3.05 8.35
7
8.1
2
0.2
9 0.53 51.81 617.9
0.4
4
11.3
4 27.58
12.0
6
1.4
8 1.25 12.1
8 8.08
0.31 0.22 60.1 552.84 0.4
16.52 21.75
13.24
1.26 2 10.1
9
7.8
5
0.3
5 0.32 80.82 583.63
0.3
6
10.8
6 25.46
12.8
8
1.3
4 2.15 14.2
10
8.1
7
0.2
5 0.63 53.88 564.49
0.5
2
13.6
6 18.04
22.0
2
1.3
8 3.2 11.1
11 8.08
0.27 0.27 62.17 617.5 0.5
11.44 27.58
12.52
1.72 3.6 7.1
12
7.9
4
0.2
1 0.32 55.95 372.53 0.5
12.2
2 21.22 12.2
1.5
2 1.4 5.4
13 7.98
1.08 0.34 72.53 638.49
0.92
12.82 14.32
16.82
1.82 2 10
14
7.9
2
0.4
1 0.25 80.82 613.78
0.4
8 12 20.16
13.1
2
1.7
4 3.4 5.6
15
7.8
7
0.3
1 0.51 53.88 524.84
0.3
4 9.54 9.02
11.9
8
1.2
4 3.95 4.95
16 8.17
0.36 0.53 68.39 650.02
0.52 11.8 13.26
16.52
1.86 3.7 5.3
17
8.0
9
0.2
3 0.32 58.03 520.45
0.5
4
13.1
2 27.58
14.5
8 2.1 4.1 4.5
18
8.0
4
0.2
4 0.27 78.75 527.07
0.5
4
12.3
2 15.91
12.6
8
1.7
4 3.45 4.75
19 7.93
0.21 0.3 70.46 639.58
1.26 13.9 6.37
14.98 1.9 4.3 5.6
20
8.0
1
0.2
5 0.32 51.81 461.55
0.2
4 9.98 18.57
12.4
4 0.9 3.7 5.1
*=Miliequivalent
Research Guru Volume-10 Issue-3(December,2016) (ISSN:2349-266X)
Page | 130
Research Guru: Online Journal of Multidisciplinary Subjects (Peer-Reviewed)
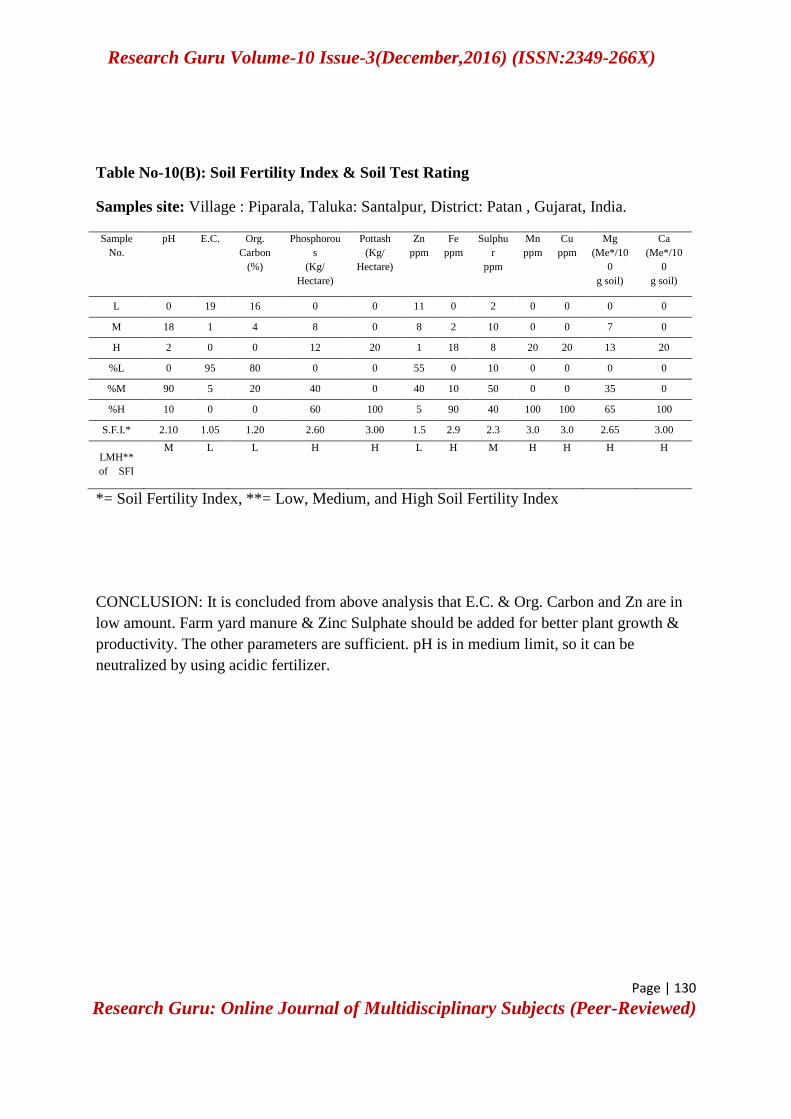
Table No-10(B): Soil Fertility Index & Soil Test Rating
Samples site: Village : Piparala, Taluka: Santalpur, District: Patan , Gujarat, India.
Sample
No.
pH E.C. Org.
Carbon
(%)
Phosphorou
s
(Kg/
Hectare)
Pottash
(Kg/
Hectare)
Zn
ppm
Fe
ppm
Sulphu
r
ppm
Mn
ppm
Cu
ppm
Mg
(Me*/10
0
g soil)
Ca
(Me*/10
0
g soil)
L 0 19 16 0 0 11 0 2 0 0 0 0
M 18 1 4 8 0 8 2 10 0 0 7 0
H 2 0 0 12 20 1 18 8 20 20 13 20
%L 0 95 80 0 0 55 0 10 0 0 0 0
%M 90 5 20 40 0 40 10 50 0 0 35 0
%H 10 0 0 60 100 5 90 40 100 100 65 100
S.F.I.* 2.10 1.05 1.20 2.60 3.00 1.5 2.9 2.3 3.0 3.0 2.65 3.00
LMH**
of SFI
M L L H H L H M H H H H
*= Soil Fertility Index, **= Low, Medium, and High Soil Fertility Index
CONCLUSION: It is concluded from above analysis that E.C. & Org. Carbon and Zn are in
low amount. Farm yard manure & Zinc Sulphate should be added for better plant growth &
productivity. The other parameters are sufficient. pH is in medium limit, so it can be
neutralized by using acidic fertilizer.
Research Guru Volume-10 Issue-3(December,2016) (ISSN:2349-266X)
Page | 131
Research Guru: Online Journal of Multidisciplinary Subjects (Peer-Reviewed)
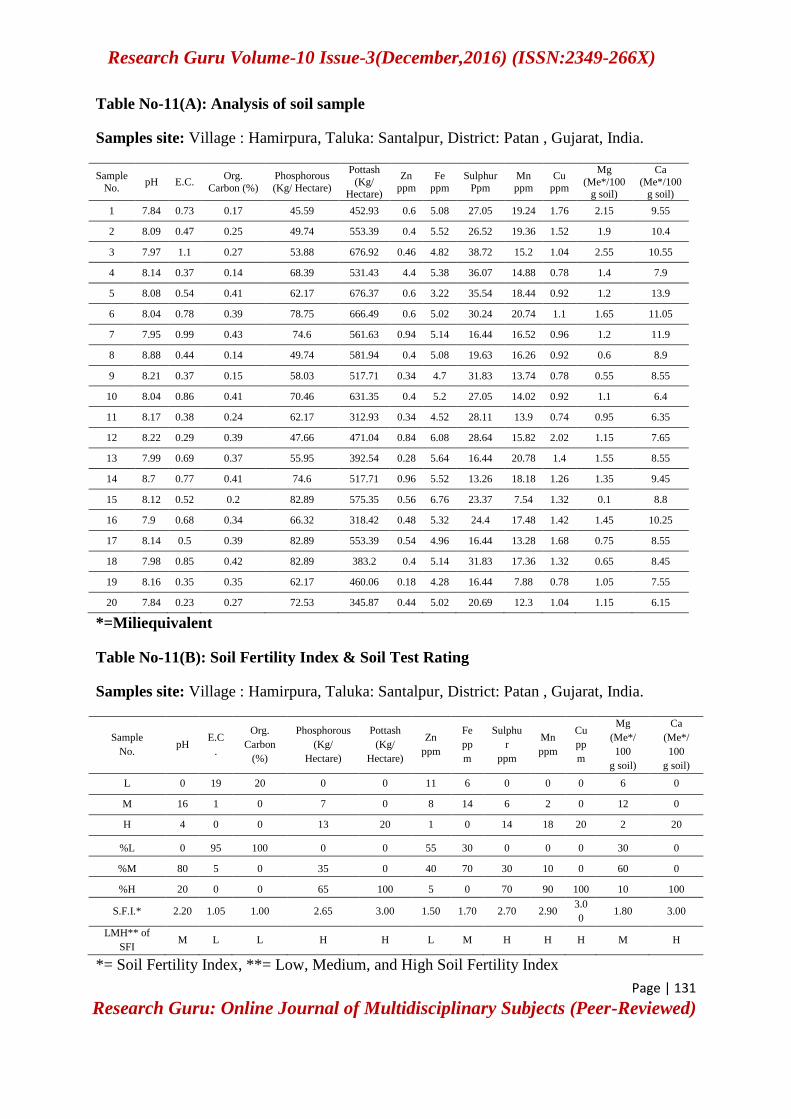
Table No-11(A): Analysis of soil sample
Samples site: Village : Hamirpura, Taluka: Santalpur, District: Patan , Gujarat, India.
Sample
No. pH E.C.
Org.
Carbon (%)
Phosphorous
(Kg/ Hectare)
Pottash
(Kg/ Hectare)
Zn
ppm
Fe
ppm
Sulphur
Ppm
Mn
ppm
Cu
ppm
Mg
(Me*/100 g soil)
Ca
(Me*/100 g soil)
1 7.84 0.73 0.17 45.59 452.93 0.6 5.08 27.05 19.24 1.76 2.15 9.55
2 8.09 0.47 0.25 49.74 553.39 0.4 5.52 26.52 19.36 1.52 1.9 10.4
3 7.97 1.1 0.27 53.88 676.92 0.46 4.82 38.72 15.2 1.04 2.55 10.55
4 8.14 0.37 0.14 68.39 531.43 4.4 5.38 36.07 14.88 0.78 1.4 7.9
5 8.08 0.54 0.41 62.17 676.37 0.6 3.22 35.54 18.44 0.92 1.2 13.9
6 8.04 0.78 0.39 78.75 666.49 0.6 5.02 30.24 20.74 1.1 1.65 11.05
7 7.95 0.99 0.43 74.6 561.63 0.94 5.14 16.44 16.52 0.96 1.2 11.9
8 8.88 0.44 0.14 49.74 581.94 0.4 5.08 19.63 16.26 0.92 0.6 8.9
9 8.21 0.37 0.15 58.03 517.71 0.34 4.7 31.83 13.74 0.78 0.55 8.55
10 8.04 0.86 0.41 70.46 631.35 0.4 5.2 27.05 14.02 0.92 1.1 6.4
11 8.17 0.38 0.24 62.17 312.93 0.34 4.52 28.11 13.9 0.74 0.95 6.35
12 8.22 0.29 0.39 47.66 471.04 0.84 6.08 28.64 15.82 2.02 1.15 7.65
13 7.99 0.69 0.37 55.95 392.54 0.28 5.64 16.44 20.78 1.4 1.55 8.55
14 8.7 0.77 0.41 74.6 517.71 0.96 5.52 13.26 18.18 1.26 1.35 9.45
15 8.12 0.52 0.2 82.89 575.35 0.56 6.76 23.37 7.54 1.32 0.1 8.8
16 7.9 0.68 0.34 66.32 318.42 0.48 5.32 24.4 17.48 1.42 1.45 10.25
17 8.14 0.5 0.39 82.89 553.39 0.54 4.96 16.44 13.28 1.68 0.75 8.55
18 7.98 0.85 0.42 82.89 383.2 0.4 5.14 31.83 17.36 1.32 0.65 8.45
19 8.16 0.35 0.35 62.17 460.06 0.18 4.28 16.44 7.88 0.78 1.05 7.55
20 7.84 0.23 0.27 72.53 345.87 0.44 5.02 20.69 12.3 1.04 1.15 6.15
*=Miliequivalent
Table No-11(B): Soil Fertility Index & Soil Test Rating
Samples site: Village : Hamirpura, Taluka: Santalpur, District: Patan , Gujarat, India.
Sample
No. pH
E.C
.
Org.
Carbon
(%)
Phosphorous
(Kg/
Hectare)
Pottash
(Kg/
Hectare)
Zn
ppm
Fe
pp
m
Sulphu
r
ppm
Mn
ppm
Cu
pp
m
Mg
(Me*/
100
g soil)
Ca
(Me*/
100
g soil)
L 0 19 20 0 0 11 6 0 0 0 6 0
M 16 1 0 7 0 8 14 6 2 0 12 0
H 4 0 0 13 20 1 0 14 18 20 2 20
%L 0 95 100 0 0 55 30 0 0 0 30 0
%M 80 5 0 35 0 40 70 30 10 0 60 0
%H 20 0 0 65 100 5 0 70 90 100 10 100
S.F.I.* 2.20 1.05 1.00 2.65 3.00 1.50 1.70 2.70 2.90 3.0
0 1.80 3.00
LMH** of
SFI M L L H H L M H H H M H
*= Soil Fertility Index, **= Low, Medium, and High Soil Fertility Index
Research Guru Volume-10 Issue-3(December,2016) (ISSN:2349-266X)
Page | 132
Research Guru: Online Journal of Multidisciplinary Subjects (Peer-Reviewed)
CONCLUSION: It is concluded from above analysis that E.C. & Org. Carbon and Zn are in
low amount. Farm yard manure & Zinc Sulphate should be added for better plant growth &
productivity. The other parameters are sufficient. pH is in medium limit, so it can be
neutralized by using acidic fertilizer.
Reference:
1. Tucker, M. R. Volumetric soil measure for routine soil testing. Comm. Soil Sci. and
Plant Anal. Vol. 15(7), pp. 833-840, 1984.
2. Hatfield, A. L. Soil test reporting: a nutrient index system. Comm. Soil Sci. and Plant
Anal. Vol. 3(5), pp. 425-436, 1972.
3. Pramod N. Kamble, Anil R. Kurhe, Gorakash M. Pondhe, Viswas B. Gaikwad, Erland
Baath international journal of scientific & technology research , ISSN 2277-8616,
Vol. 2 (3), pp. 216-218, 2013.
4. Dr. M.R. Dalwadi, Dr. V.R. Bhatt, soil and water testing Anand, Gujarat India 2008.
5. M.L Jakson, Soil Chemical analysis, Prentice-Hall of India Pvt. Ltd., New Delhi., pp.
123-126, 1967.
6. G. Reid, J. Dirou, How to interpret your soil test. North Coast of NSW, 2004.
7. R.D. Rhue and G. Kidder, Analytical procedures used by the IFAS extension soil
laboratory and the interpretation of results. Soil Sci. Dept., Univ. Florida, Gainesville,
1983.
8. Marx E.S., Hart J., and Stevens R. G., Soil test interpretation guide. Oregon State
University, 1999.
9. E. O. McLean and M. E. Watson, “Soil Measurements of Plant-Available Potassium,”
In: R. D. Munson, Ed., Po- tassium in Agriculture, Soil Science Society of America,
Madison, pp. 227-308,1985.
10. V. S. Mali, N. A. Zende, U. K. Verma. “Correlation between soil physic-chemical
properties and available micronutrients in salt effected soils,” 17th WCSS, Thailand
2002.
11. N. C. Brady, “The Nature and Properties of Soils,” Mac- millan Publishing Company,
New York, 1990.
12. E. E. Akporhonor and P. O. Agbaire, African Journal of Pure and Applied Chemistry.
Vol. 3(7), pp. 131-134, 2009.