study and development of an innovative 3g/4g wireless...
TRANSCRIPT

Study and development of an innovative
University of TRENTO - Faculty of Engineering
Master of Science in Telecommunications Engineering
Student
Alessandro POLO
Study and development of an innovative
3G/4G wireless network analysis tool
Advisors
Prof. Andrea MASSA Alessandro POLO
TRENTO
31 October 2012
Dr. Giacomo OLIVERI
Ing. Lorenzo GANDINI (Vodafone)
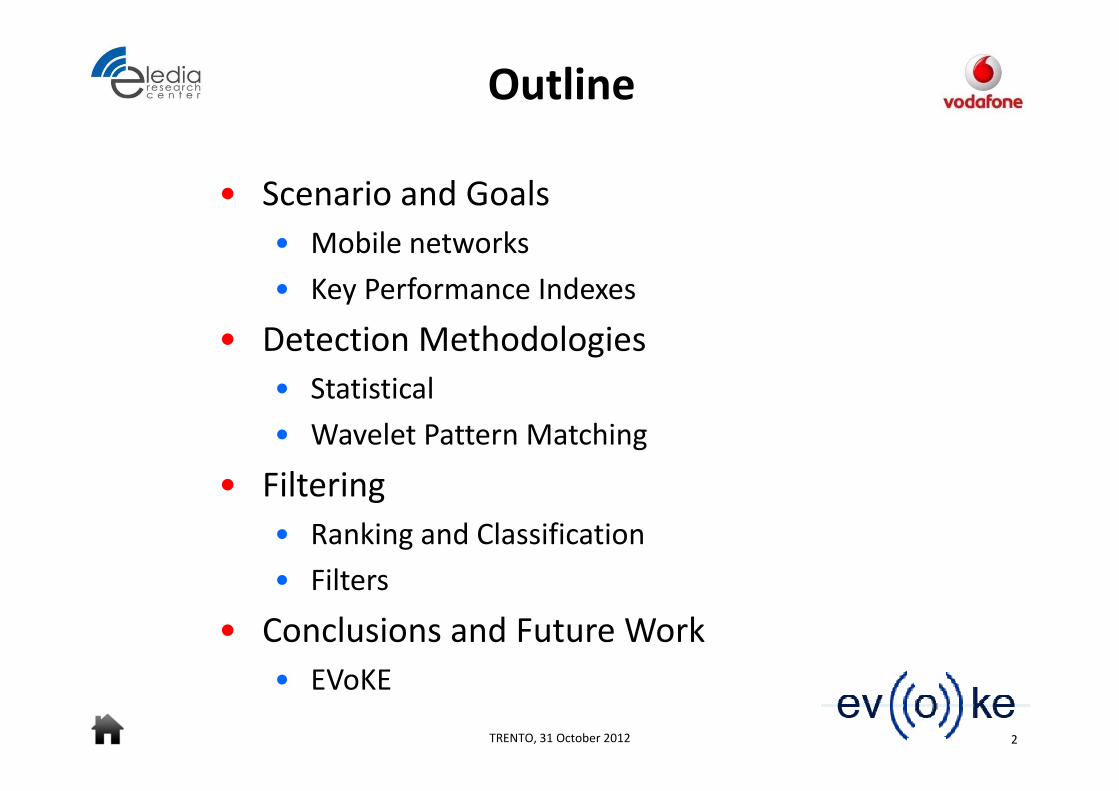
Outline
• Scenario and Goals
• Mobile networks
• Key Performance Indexes• Key Performance Indexes
• Detection Methodologies
• Statistical
• Wavelet Pattern Matching
• Filtering
• Ranking and Classification
2TRENTO, 31 October 2012
• Ranking and Classification
• Filters
• Conclusions and Future Work
• EVoKE
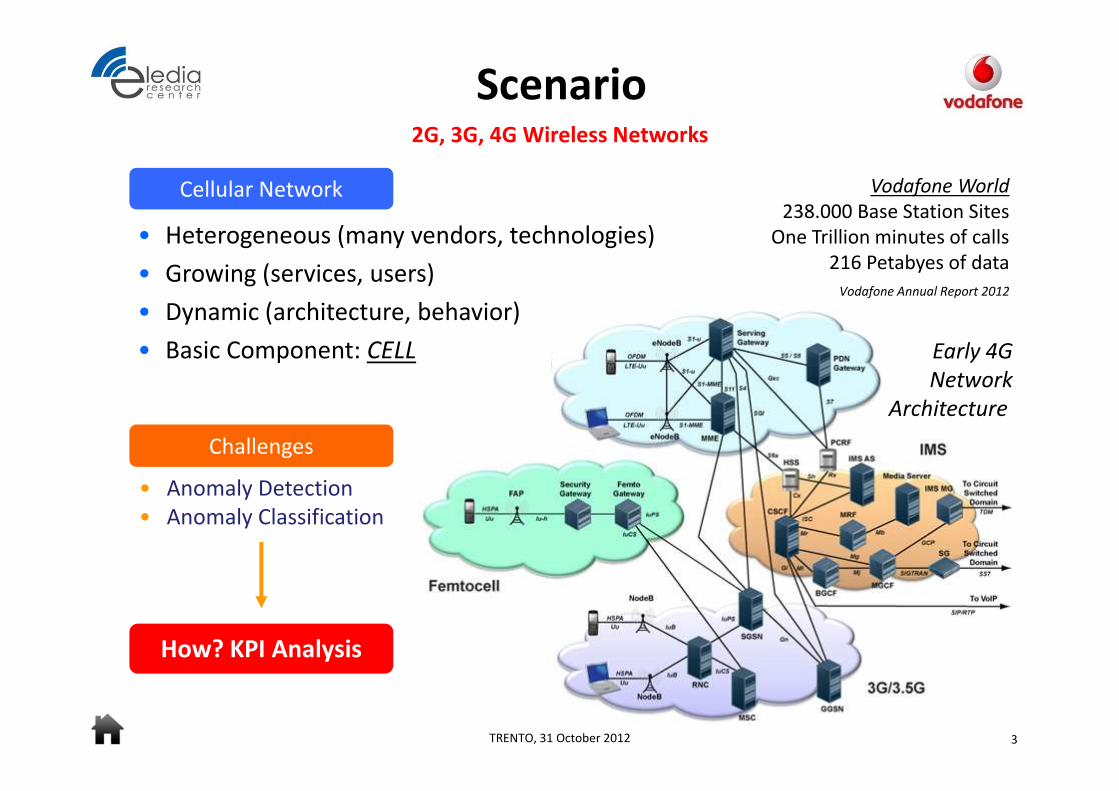
Scenario2G, 3G, 4G Wireless Networks
Vodafone World
238.000 Base Station Sites
One Trillion minutes of calls
216 Petabyes of data
• Heterogeneous (many vendors, technologies)
• Growing (services, users)
Cellular Network
Vodafone Annual Report 2012• Growing (services, users)
• Dynamic (architecture, behavior)
• Basic Component: CELL
• Anomaly Detection
• Anomaly Classification
Challenges
Early 4G
Network
Architecture
3TRENTO, 31 October 2012
How? KPI Analysis
• Anomaly Classification

Key Performance IndexesDiagnostic Stream
• Time Series
• Discrete Multivariate random process
KPI Performance measurement
KPIs
(e.g. number of failed calls: DROPS)
Italy 2G, 3G
> 1 Gb/day to evaluate
• Discrete Multivariate random process
• Mathematical Distribution (PDF)
CELL 122412 (Duomo, MI), Rate of 3G failed connections
Thesis Objectives Anomaly Detection
• Identify anomalies (e.g. peaks/zeros)
• Alarm Ranking
• Minimize False-Alarm Rate
Live DATABASE
KPIs
4TRENTO, 31 October 2012
• Statistical Methods
• Pattern Matching
(Haar Wavelet)
Tools
• Minimize False-Alarm Rate

ApproachKPIs Analysis
CELL 129692 (Medolago, BG), HSDPA Establishment Failure Rate
1. Detection
Live Input: KPIs 1. Detection 2. Filtering Results
RAW data → Detected Alarms → Filtered Alarms →
• Post-process Detected Alarms
1. Detection
• Evaluate RAW data (KPIs)
• Identify any possible anomaly
• Generate Alarms
2. FilteringCELL 142213 (Basaluzzo, AL), Dropped Calls
5TRENTO, 31 October 2012
• Post-process Detected Alarms
• Alarms Aggregation, Ranking
• False-Positive Reduction
• Data size
• Processing TimeConstraints

1. Detectiona) Statistical Approach
Available Voice Traffic Channels of CELL 100868 (Viale Piave, MI)
IDEA Evaluate sample vs. statistics (range, mean, ..) within a Window
IF sample << expected
Example:
Advantages Drawbacks
#Traffic Channels: Low → Alarm
Evaluation Window: Length = N previous samples
IF sample << expected
value (e.g. median)
Anomaly Found
(depends on Detector settings)
Point Anomaly
6TRENTO, 31 October 2012
Advantages
• Simple, Computationally Efficient
• No training
• Universal parameters (thresholds)
Drawbacks
• Window’s Length (lower-bound)
• Data Distribution (PDF), Masking
• Prone to non-zero trend, step
Methods Selection: Which statistical tests?
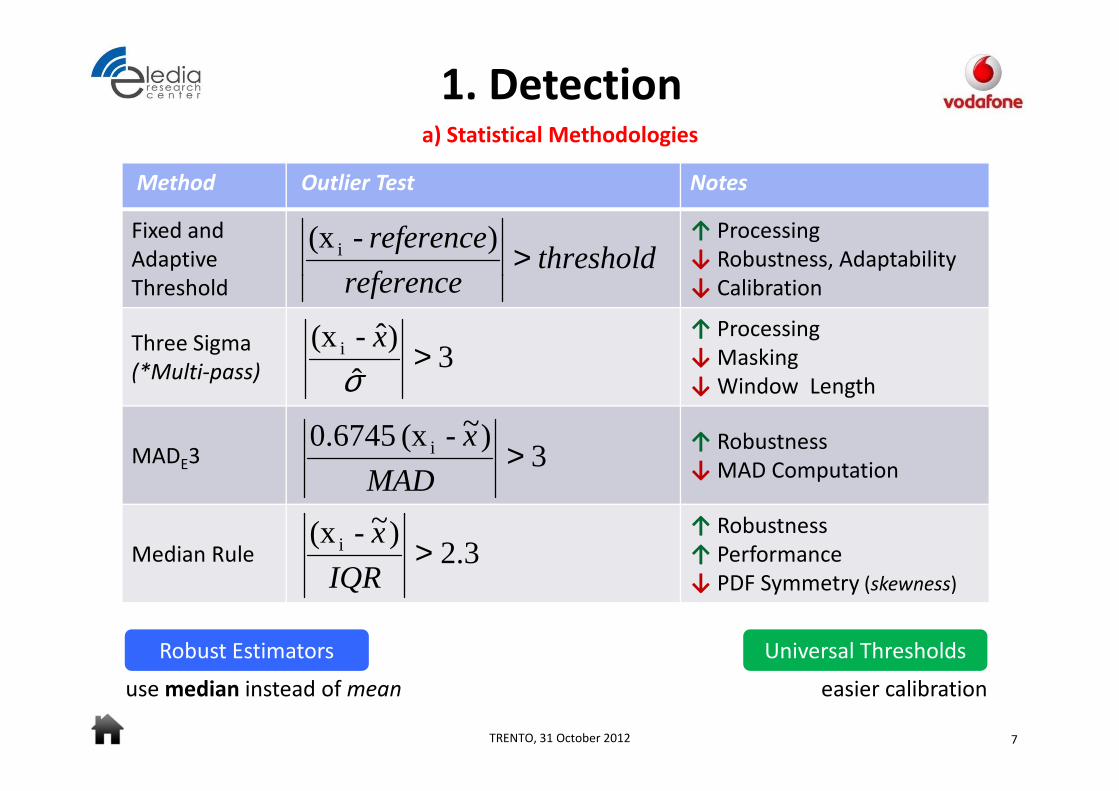
1. Detectiona) Statistical Methodologies
Method Outlier Test Notes
Fixed and
Adaptive
Threshold
↑ Processing
↓ Robustness, Adaptability
↓ Calibration
thresholdreference
reference>
) -(x i
Threshold ↓ Calibration
Three Sigma
(*Multi-pass)
↑ Processing
↓ Masking
↓ Window Length
MADE3↑ Robustness
↓ MAD Computation
↑ Robustness)~ -(x x
3)~ -(x 0.6745 i >
MAD
x
3ˆ
)ˆ -(x i >σ
x
reference
7TRENTO, 31 October 2012
Robust Estimators
use median instead of mean
Median Rule
↑ Robustness
↑ Performance
↓ PDF Symmetry (skewness)
3.2)~ -(x i >
IQR
x
Universal Thresholds
easier calibration
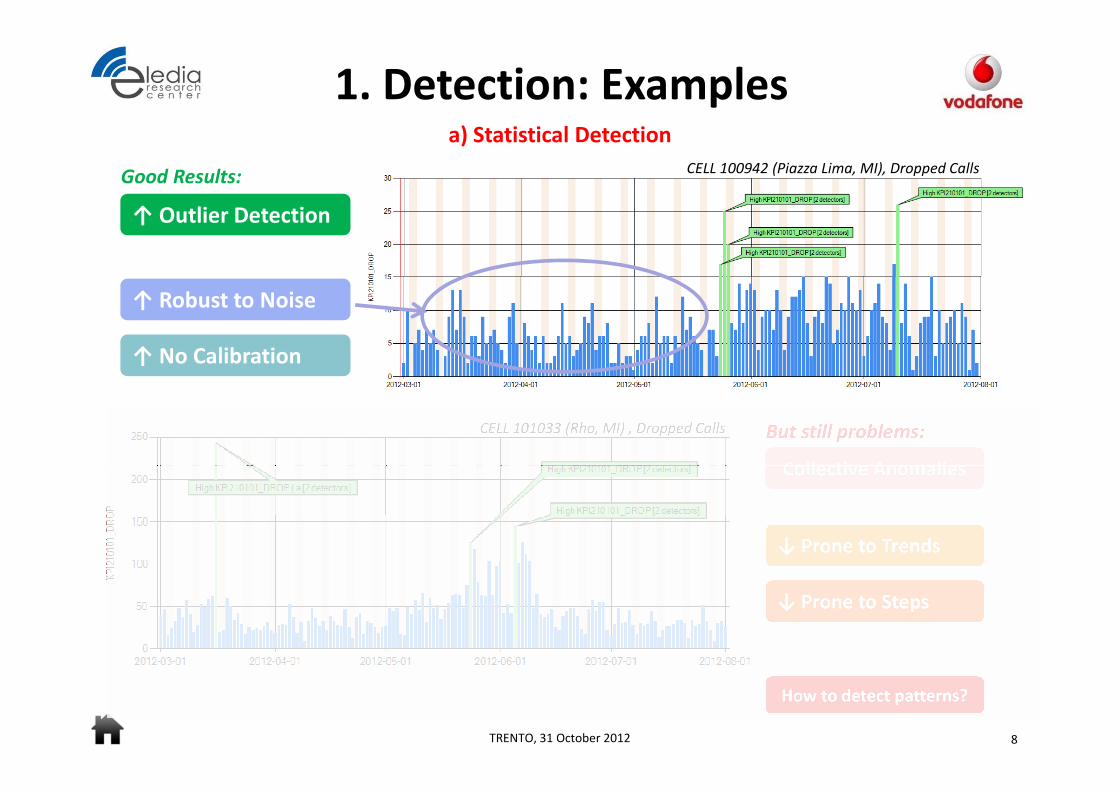
1. Detection: Examplesa) Statistical Detection
CELL 100942 (Piazza Lima, MI), Dropped Calls
↑ Outlier Detection
Good Results:
CELL 101033 (Rho, MI) , Dropped Calls
↑ Robust to Noise
↑ No Calibration
But still problems:
Collective Anomalies
8TRENTO, 31 October 2012
How to detect patterns?
↓ Prone to Trends
↓ Prone to Steps

1. Detection: Examplesa) Statistical Detection
CELL 100942 (Piazza Lima, MI), Dropped Calls
↑ Outlier Detection
Good Results:
CELL 101033 (Rho, MI) , Dropped Calls
↑ No Calibration
But still problems:
Collective Anomalies
↑ Robust to Noise
9TRENTO, 31 October 2012
How to detect patterns?
↓ Prone to Trends
↓ Prone to Steps

1. Detection: Examplesa) Statistical Detection
CELL 100942 (Piazza Lima, MI), Dropped Calls
↑ Outlier Detection
↑ Robust to Noise
Good Results:
CELL 101033 (Rho, MI) , Dropped Calls
↑ Robust to Noise
↑ No Calibration
But still problems:
Collective Anomalies
10TRENTO, 31 October 2012
How to detect patterns?
↓ Prone to Trends
↓ Prone to Steps
step

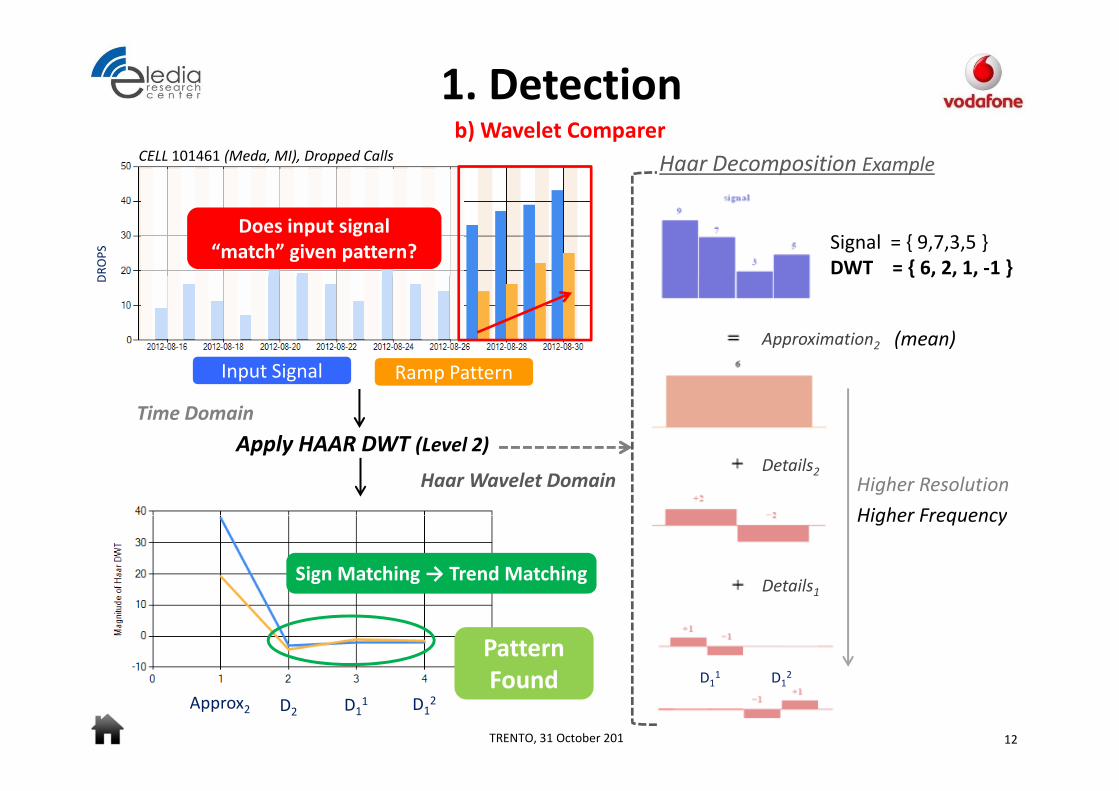
1. Detectionb) Wavelet Comparer
IDEA Pattern Matching in Wavelet Domain
CELL 134801 (Lainate Sud, MI)
Ramp
orWavelets
Why?
CELL 100492 (Basiglio, MI)
or
Trend
Step
Advantages
Which Mother Wavelet?
Wavelets
• Multi-Resolution
• Time and Frequency Localization
Haar Wavelet
11TRENTO, 31 October 2012
How to detect patterns?
Drawbacks
• Based on mean, not robust
• Prone to punctual outliers
• Computational Complexity O(N)
• Easy (local) Trend recognition
1. Detectionb) Wavelet Comparer
Signal = { 9,7,3,5 }
DWT = { 6, 2, 1, -1 }
Haar Decomposition Example
DR
OP
S
CELL 101461 (Meda, MI), Dropped Calls
Does input signal
“match” given pattern?
Input Signal
Approximation2
Details2
DWT = { 6, 2, 1, -1 }
Higher Resolution
Higher Frequency
DR
OP
S
Apply HAAR DWT (Level 2)
Ramp Pattern
Time Domain
Haar Wavelet Domain
(mean)
12TRENTO, 31 October 2012
D2 D11 D1
2Approx2
Details1
Higher Frequency
D11 D1
2
Sign Matching → Trend Matching
Pattern
Found

1. Detectionb) Wavelet Comparer: Example
HS
DP
A E
FR
CELL 101581 (Gattinara Centro, VC), HSDPA Establishment Failure Rate
Monotonic
Step Pattern
HS
DP
A E
FR
Input Signal
Mismatching Sign
13TRENTO, 31 October 2012
D3 D21 D2
2
D11,2,3,4
Approx3Haar DWT
Coefficients →
Pattern
NOT Matching

2. FilteringChallenges
Live Input: KPIs 1. Detection 2. Filtering Results
RAW data → Detected Alarms → Filtered Alarms →
• Aggregation
• Classification
• False-Positives Reduction
Filtering Objectives Alarm Ranking
Network Maintenance Efficiency
Reduce
work load
14TRENTO, 31 October 2012
Network operators are busy,
the system is designed
to improve efficiency
Network Maintenance Efficiency
• Highlight Alarms of Interest
• Automate Best Practices
• Integrate Know-How
How?

2. FilteringIntrinsic Detection Ranking
reference
reference iievent
x- =Score
Alarm Priority? Deviation from Expected value
Is this enough
for domain experts?
High Score!
(e.g. reference = median)
Priority is Affected by
• Previous Behavior
• KPI, Cell relevance
• Not static (change in time)
• ..
CELL 131881 (Arluno Casello A4, MI), Dropped Calls
for domain experts?
No, because:
15TRENTO, 31 October 2012
Lower Score
Smarter Ranking →
• ..
Domain Experts requirebut the Alarm is persistent,
It’s priority↑

2. Filtering
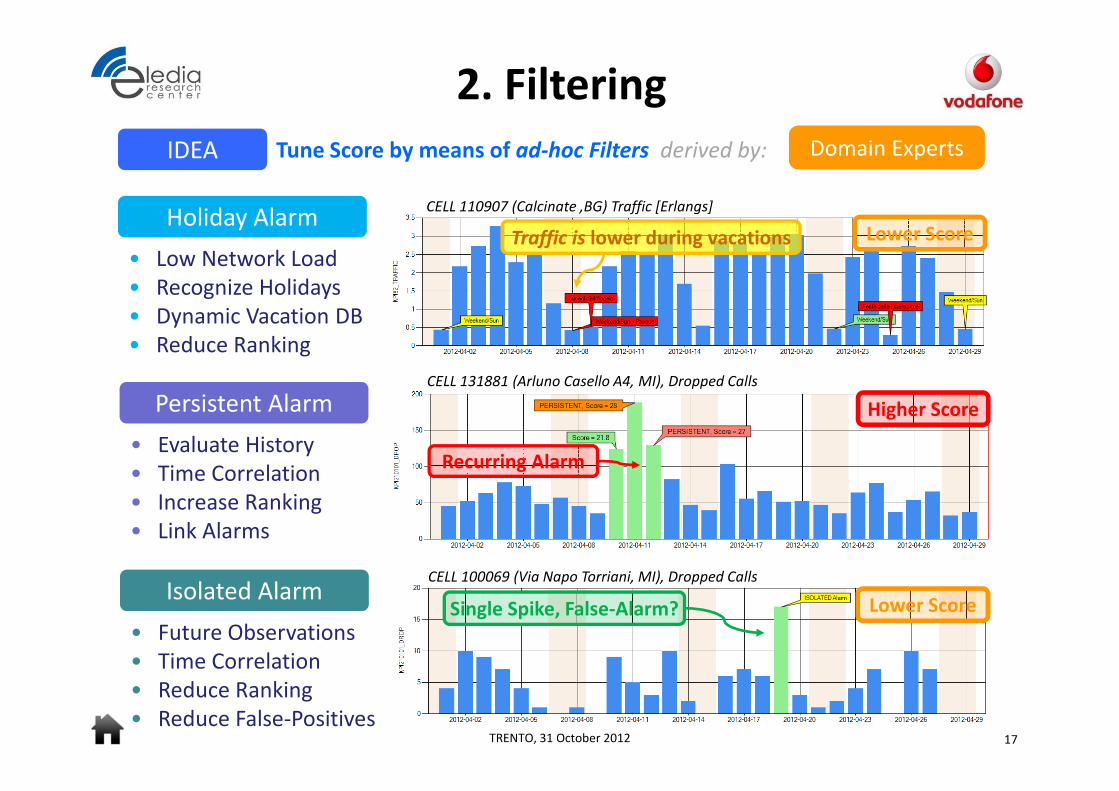
IDEA Tune Score by means of ad-hoc Filters derived by: Domain Experts
Improve Ranking: Example
CELL 131881 (Arluno Casello A4, MI), Dropped Calls
Persistent Alarm
Filter Filtering
16TRENTO, 31 October 2012
Filter Filtering
Increased Score
2. Filtering
CELL 110907 (Calcinate ,BG) Traffic [Erlangs]Holiday Alarm
• Low Network Load
• Recognize Holidays
Traffic is lower during vacations
IDEA Tune Score by means of ad-hoc Filters derived by: Domain Experts
Lower Score
• Recognize Holidays
• Dynamic Vacation DB
• Reduce Ranking
CELL 131881 (Arluno Casello A4, MI), Dropped Calls
Persistent Alarm
• Evaluate History
• Time Correlation
• Increase Ranking
Recurring Alarm
Higher Score
17TRENTO, 31 October 2012
• Increase Ranking
• Link Alarms
CELL 100069 (Via Napo Torriani, MI), Dropped Calls
Isolated Alarm
• Future Observations
• Time Correlation
• Reduce Ranking
• Reduce False-Positives
Single Spike, False-Alarm? Lower Score

Summary Results
CELL 113433 (Paderno-castelletto, MI), Dropped Calls
Refined Score = 52
1. Anomalies Detection (green samples)
2. Aggregation, Tagging, Re-Scoring (colored labels)
Refined Score = 87
(even if sample is lower)
Refined Score = 52
18TRENTO, 31 October 2012
↓ False-Positives
Decreased Score
↑ Alarm Notified
Increased Score
with State of the Art
Commercial tool
Comparison →
Less priority More priority
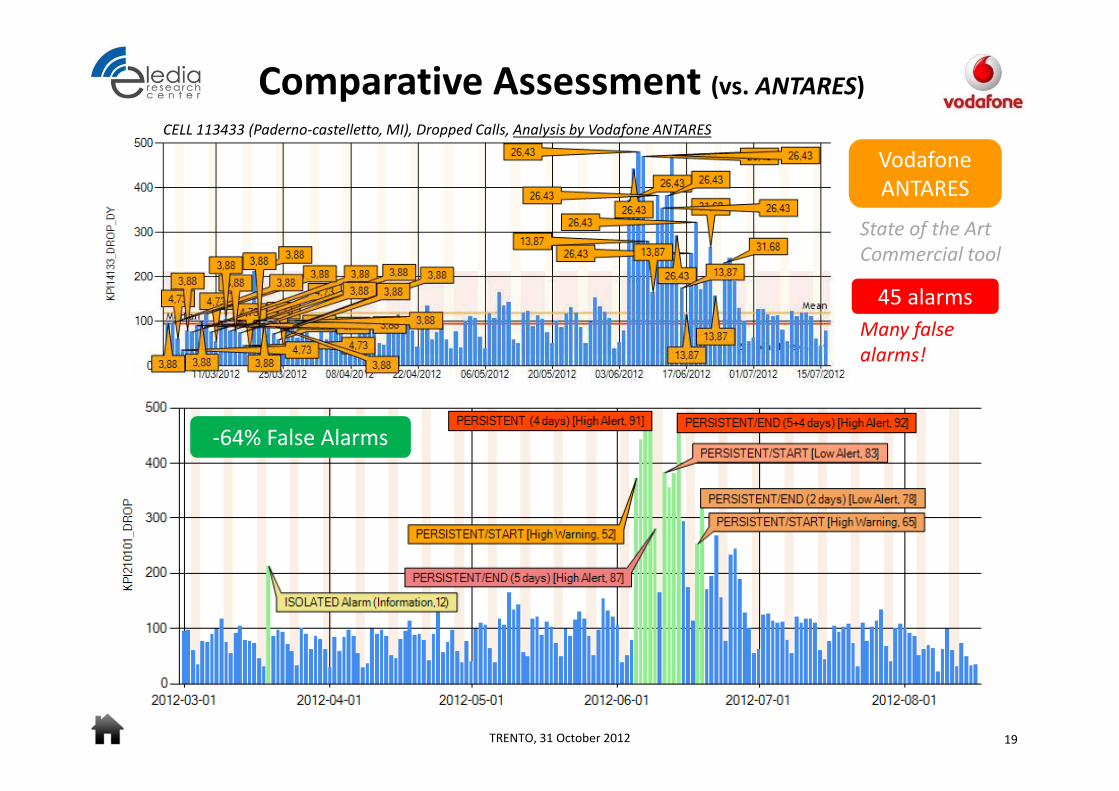
Comparative Assessment (vs. ANTARES)
CELL 113433 (Paderno-castelletto, MI), Dropped Calls, Analysis by Vodafone ANTARES
Vodafone
ANTARES
State of the Art
Commercial tool
-64% False Alarms
45 alarms
Many false
alarms!
19TRENTO, 31 October 2012
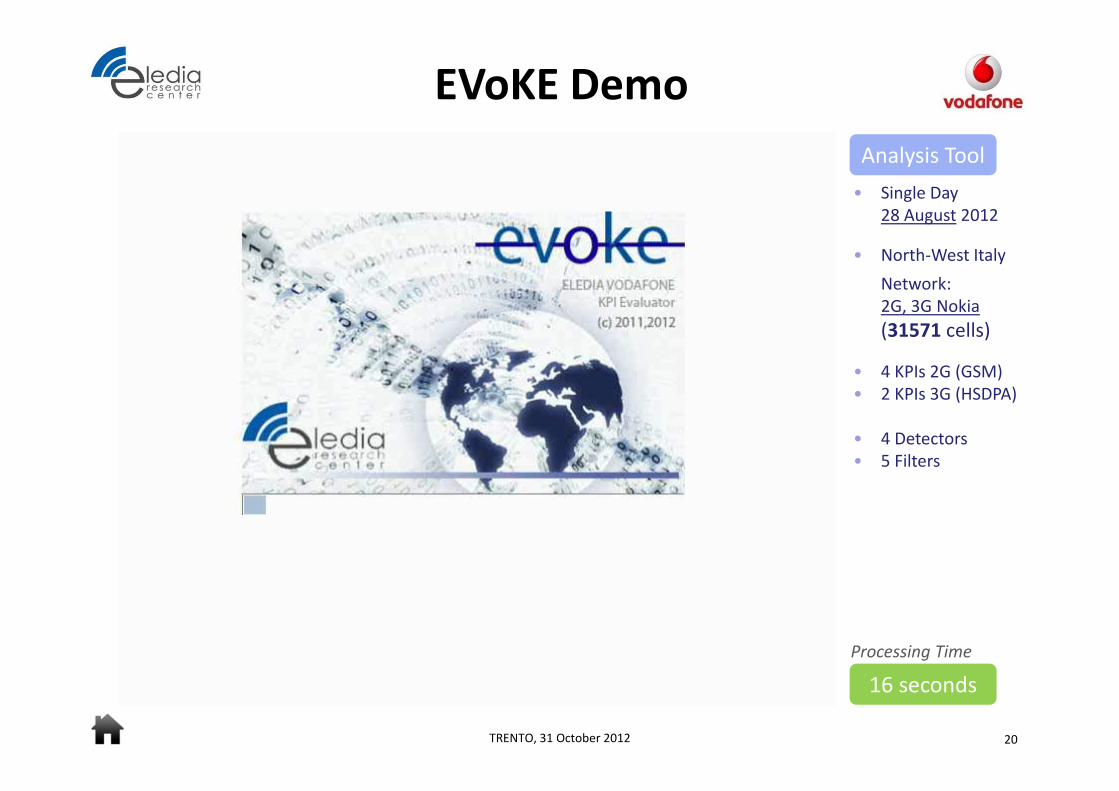
EVoKE Demo
Analysis Tool
• Single Day
28 August 2012
• North-West Italy
Network:Network:
2G, 3G Nokia
(31571 cells)
• 4 KPIs 2G (GSM)
• 2 KPIs 3G (HSDPA)
• 4 Detectors
• 5 Filters
20TRENTO, 31 October 2012
16 seconds
Processing Time

EVoKE Geo Viewer
Daily Results
Visual Navigation
Shown Example
• 28 August 2012
• North-West Italy
Network: 3G Nokia
(18087 cells)
• KPIs: 3G HSDPA
• Traffic [Kb]
• Establishment
21TRENTO, 31 October 2012
• Establishment
Failure Rate [%]
Spatial Correlation
NN N Few nearby alarms,
Highest Resolution
Many alarms,
Low resolution
Many alarms,
Higher resolution

Conclusions
Resume
• Scenario: Mobile networks, KPIs
• Detection: Statistical Methods, Haar Wavelet
• Filtering: Ranking and Classification
• Results: EVoKE
Future Work
22TRENTO, 31 October 2012
• Alarms Correlation (Space, Causality)
• Classification (SVM, Bayesian networks)

Thank you
23TRENTO, 31 October 2012