study design and analytical results used to evaluate a .... department of the interior u.s....
TRANSCRIPT

U.S. Department of the Interior U.S. Geological Survey
Study Design and Analytical Results Used to Evaluate a Surface-Water Point Sampler for Volatile Organic Compounds
By Michael J. Halde, Gregory C. Delzer, and John S. Zogorski
Open-File Report 98-651

U.S. Department of the Interior
Bruce Babbitt, Secretary
U.S. Geological SurveyCharles G. Groat, Director
The use of firm, trade, and brand names in this report is for identification purposes only and does not constitute endorsement by the U.S. Geological Survey.
Rapid City, South Dakota: 1999
For additional information write to:
District Chief U.S. Geological Survey 1608 Mt. View Road Rapid City, SD 57702
Copies of this report can be purchased from:
U.S. Geological Survey Branch of Information Services Box 25286 Denver, CO 80225-0286

FOREWORDThe mission of the U.S. Geological Survey
(USGS) is to assess the quantity and quality of the earth resources of the Nation and to provide informa tion that will assist resource managers and policy- makers at Federal, State, and local levels in making sound decisions. Assessment of water-quality condi tions and trends is an important part of this overall mission.
One of the greatest challenges faced by water- resources scientists is acquiring reliable information that will guide the use and protection of the Nation's water resources. That challenge is being addressed by Federal, State, interstate, and local water-resource agencies and by many academic institutions. These organizations are collecting water-quality data for a host of purposes that include: compliance with permits and water-supply standards; development of remedia tion plans for a specific contamination problem; oper ational decisions on industrial, wastewater, or water- supply facilities; and research on factors that affect water quality. An additional need for water-quality information is to provide a basis on which regional and national-level policy decisions can be based. Wise decisions must be based on sound information. As a society we need to know whether certain types of water-quality problems are isolated or ubiquitous, whether there are significant differences in conditions among regions, whether the conditions are changing over time, and why these conditions change from place to place and over time. The information can be used to help determine the efficacy of existing water- quality policies and to help analysts determine the need for and likely consequences of new policies.
To address these needs, the Congress appropri ated funds in 1986 for the USGS to begin a pilot program in seven project areas to develop and refine the National Water-Quality Assessment (NAWQA) Program. In 1991, the USGS began full implementa tion of the program. The NAWQA Program builds upon an existing base of water-quality studies of the USGS, as well as those of other Federal, State, and local agencies. The objectives of the NAWQA Program are to:
Describe current water-quality conditions for a large part of the Nation's freshwater streams, rivers, and aquifers.
Describe how water quality is changing overtime.
Improve understanding of the primary natural and human factors that affect water-quality conditions.
This information will help support the develop ment and evaluation of management, regulatory, and monitoring decisions by other Federal, State, and local agencies to protect, use, and enhance water resources.
The goals of the NAWQA Program are being achieved through ongoing and proposed investigations of 59 of the Nation's most important river basins and aquifer systems, which are referred to as Study Units. These Study Units are distributed throughout the Nation and cover a diversity of hydrogeologic settings. More than two-thirds of the Nation's fresh water use occurs within the 59 Study Units and more than two-thirds of the people served by public water- supply systems live within their boundaries.
National synthesis of data analysis, based on aggregation of comparable information obtained from the Study Units, is a major component of the program. This effort focuses on selected water-quality topics using nationally consistent information. Comparative studies will explain differences and similarities in observed water-quality conditions among study areas and will identify changes and trends and their causes. The first topics addressed by the national synthesis are pesticides, nutrients, volatile organic compounds, and aquatic biology. Discussions on these and other water- quality topics will be published in periodic summaries of the quality of the Nation's ground and surface water as the information becomes available.
This report is an element of the comprehensive body of information developed as part of the NAWQA Program. The program depends heavily on the advice, cooperation, and information from many Federal, State, interstate, Tribal, and local agencies and the public. The assistance and suggestions of all are greatly appreciated.
Robert M. Hirsch Chief Hydrologist
Foreword III


CONTENTS
Abstract.................................................................................................................................................................................. 1Introduction ......................................................................................................................................................................^ 1Acknowledgments................................................................................................................................................................. 2Study design ................................................................................. 3
Laboratory testing........................................................................................................................................................ 3Field testing................................................................................................................................................................. 3
Analytical and statistical results............................................................................................................................................ 6References cited.................................................................................................................................................................^ 9
ILLUSTRATIONS
1. Photograph showing surface-water point sampler evaluated for collection of volatile organiccompounds and component parts/related items.......................................................................................................... 2
2. Graphical comparison of concentrations of 87 volatile organic compounds (VOCs) in samples collected by VOC point sampler with concentrations in samples collected by glass-siphon sampler during laboratory testing............................................................................................................................... 7
3. Graphical comparison of concentrations of 87 volatile organic compounds (VOCs) in samples collected by VOC point sampler with concentrations in samples collected by hand-dipping method during field testing......................................................................................................................................... 8
TABLES
1. Volatile organic compounds analyzed by the U.S. Geological Survey NationalWater-Quality Assessment Program........................................................................................................................ 4
2. Results of replicate-sample analysis for volatile organic compounds (VOCs) duringlaboratory and field testing of selected sampling equipment.................................................................................. 13
3. Results of quality-control sample analysis for volatile organic compounds duringlaboratory and field testing of selected surface-water sampling equipment........................................................... 28
CONVERSION FACTORS
Multiply By To obtain
microgram per liter (|lg/L)1.0 part per billion ___________
Temperature can be converted to degrees Celsius (°C) or degrees Fahrenheit (°F) by the following equations:
°C = (°F-32)/1.8
°F= (1.8x°C) + 32
Contents

Study Design and Analytical Results Used to Evaluate a Surface-Water Point Sampler for Volatile Organic CompoundsBy Michael J. Halde, Gregory C. Delzer, and John S. Zogorski
ABSTRACT
The most common technique used to sample streams for volatile organic compounds (VOCs) is dipping volatile organic analysis (VOA) vials by hand midstream. This technique does not assure that samples are collected in a consistent manner. A point sampler was designed to collect samples for the U.S. Geological Survey National Water- Quality Assessment (NAWQA) Program in sur face water in a uniform and consistent manner nationwide. This report documents the study design used to evaluate the VOC point sampler, as well as comparative data from glass-siphoning and hand-dipping methods used in the laboratory and field, respectively. Quality-control data collected during the evaluation, specifically source-solution blanks, canister blanks, equipment blanks, and field blanks, also are presented.
The study indicates that the VOC point sam pler collects samples in a representative manner, as compared to the glass-siphoning and hand- dipping methods. The relative standard deviation for replicate samples collected by the VOC point sampler was less than 10 percent for 57 of 73 VOCs calculated, indicating a high degree of sample reproducibility. Analyte loss was found to be negligible based, in part, on a comparison of laboratory data to expected recovered concentra tions. Furthermore, the cleaning protocol was found to be effective in eliminating any contami nation of water samples from the point sampler.
INTRODUCTION
Ground water has been sampled for the analysis of volatile organic compounds (VOCs) by the U.S. Geological Survey (USGS) National Water-Quality Assessment (NAWQA) Program since 1993. To understand the occurrence of VOCs in other compo nents of the hydrologic cycle, the NAWQA Program began sampling small urban streams for VOCs in 1996. Prior to NAWQA's national emphasis on VOCs, little work had been done within the USGS on VOC field methods or sampling equipment for collecting VOCs from surface water. The most common technique used to sample streams for VOCs is dipping volatile organic analysis (VOA) vials by hand midstream. Conse quently, the USGS did not have specific guidelines or a proven sampler to collect VOC samples from surface water.
To collect VOC samples from surface water in a uniform and consistent manner nationwide, a surface- water VOC point sampler was designed by the USGS and Wildlife Supply Company (Wildco) located in Saginaw, Michigan. The sampler (fig. 1) is manufac tured by Wildco and is constructed of stainless steel and refrigeration-grade copper. The sampler was designed to collect a sample intended for VOC analysis at a single point in shallow urban streams. The VOC point sampler currently (1998) is being used by NAWQA's study units to collect samples from about 10 urban streams (Lopes and Price, 1997). Guidance on the proper use of the sampler in the field has been developed and documented by Shelton (1997).
The purposes of this report are to: (1) document the study design used to evaluate the surface-water VOC point sampler and (2) report the analytical results. This report documents the analytical data
Introduction

determined for laboratory and field studies to evaluate the point sampler for sample reproducibility, VOC loss, and sample contamination.
ACKNOWLEDGMENTS
Many people have assisted with the develop ment, design, and testing of the VOC point sampler. In particular, we gratefully appreciate the help of USGS employees Ronald E. Rathbun, Larry R. Shelton,
Thomas J. Lopes, Bruce D. Lindsey; Dr. James F. Pankow, Oregon Graduate Institute of Science and Technology in Beaverton, Oregon; and Jason Love, graduate student of the South Dakota School of Mines and Technology in Rapid City, South Dakota. The VOC analysts at the USGS NWQL including Brooke F. Connor, Donna L. Rose, Sonja R. Abney, Lucinda K. Murtagh, and Mary C. Noriega, are acknowledged for their continued involvement and suggestions in USGS VOC studies.
EXPLANATIONA) ASSEMBLED SURFACE-WATER POINT SAMPLER EVALUATED FOR COLLECTION OF
VOLATILE ORGANIC COMPOUNDS (VOCs) AND COMPONENT PARTS/RELATED ITEMS
B) REPLACEABLE AIR EXHAUST TUBE
C) INSIDE OF BODY OF VOC POINT SAMPLER SHOWING HOLDER FOR VOLATILE ORGANIC ANALYSIS (VGA) VIALS
D) ENGINEER'S SCALE FOR REFERENCE (APPROXIMATELY 12 INCHES IN LENGTH)
E) BOTTOM OF VOC POINT SAMPLER LID SHOWING REPLACEABLE FILLING PORTS
F) VGA VIALS
G) CANISTER LID
H) CANISTER USED TO PROCESS FIELD BLANKS
Figure 1. Surface-water point sampler evaluated for collection of volatile organic compounds and component parts/related items.
2 Study Design and Analytical Results Used to Evaluate a Surface-Water Point Sampler for VOCs

STUDY DESIGN
This study was designed to verify the perfor mance of the VOC point sampler. Sample reproduc- ibility, analyte loss, and sample contamination were evaluated using sequential replicate samples collected by the VOC point sampler from a water matrix known to contain VOCs. Concurrent samples were collected with the VOC point sampler and also by siphoning through a glass bore tube during laboratory testing or hand dipping VOA vials during field testing. The samples were collected from a stainless-steel reservoir during laboratory testing and from a stream during field testing. Equipment blanks and field blanks were collected at prescribed steps of the study to determine whether equipment-cleaning protocols adequately removed VOCs from the VOC point sampler. Each time the equipment was cleaned, the equipment- cleaning protocol described by Shelton (1997) was followed.
The 87 VOCs analyzed by the USGS National Water-Quality Laboratory (NWQL) in Arvada, Colorado, for the NAWQA Program and this study are listed in table 1. Analytes are divided into two groups NAWQA target analytes (55 compounds) and other analytes (32 compounds). The compounds 1,3- and 1,4-dimethylbenzene are reported as separate target analytes in table 1, however, the NWQL reports the sum of the concentration of these two compounds because they co-elute during analysis. NAWQA target analytes were selected for emphasis in the NAWQA Program because of their known human-health and (or) aquatic-life concern or because of their high frequency of occurrence in surface water and ground water (John Zogorski, USGS, written commun., 1994). The "other analytes" were selected because they are on the U.S. Environmental Protection Agency's list for analysis using their revised method for drinking-water samples (Connor and others, 1998).
Laboratory Testing
Laboratory testing was done to provide con trolled conditions under which the VOC point sampler could be evaluated. The VOC point sampler and a glass siphon were cleaned and wrapped in aluminum foil until sampling began. Three blank samples were collected using the VOC point sampler at the start of the laboratory testing prior to collecting samples known to contain VOCs. The three blank samples consisted of a source-solution blank, an initial canister blank, and an initial equipment blank. The source-
solution blank was collected to determine if VOCs were present in the NWQL volatile-grade blank water. The initial canister blank was collected to determine if the canister, from which the equipment blank was collected, was contaminated with VOCs. The initial equipment blank was collected to characterize the con dition of the VOC point sampler prior to collection of laboratory samples. Blank samples were collected according to methods described by Mueller and others (1997). Following quality-control sampling, replicate sampling was done in the laboratory from a reservoir.
A 115-liter stainless-steel reservoir located under a fume hood was filled with tap water, kept constant at 20°Celsius, and stirred with a mixer for 24 hours. The reservoir was then spiked with 75 VOCs and mixed for 5 minutes. Concentrations of approxi mately 0.3 |J.g/L were spiked for 59 compounds. Fifteen VOCs were spiked to achieve a concentration of approximately 1.2|j,g/L. Trans-l,4-dichloro-2- butene was spiked to 3.0 |J,g/L (table 2 at the end of this report). Only 75 of the 87 analytes listed in table 1 were added because a previously prepared VOC mix was used. The mixer was then turned off, and seven replicate samples were collected concurrently from the spiked reservoir with the VOC point sampler and glass siphon, under quiescent conditions. Both the VOC point sampler and glass siphon were cleaned between each replicate sample. After all replicate samples were collected, the samplers were cleaned again, and a final canister and a final equipment blank were collected with the VOC point sampler.
To test the effectiveness of the cleaning protocol, the VOC point sampler was soaked in a solution of 75 VOCs (each at a concentration of approximately 80 |ig/L) for 3.5 minutes. The sampler was then cleaned, and a high-concentration canister blank and a high-concentration equipment blank were collected.
Field Testing
Field testing was done to determine how the point sampler would perform under actual environ mental conditions. Field testing was conducted during May 29 and 30, 1996, at Cedar Run, a spring-fed stream in Harrisburg, Pennsylvania. The spring was contaminated by a leaking underground storage tank and has measurable concentrations of gasoline-related VOCs and chlorinated VOCs. Prior to sample collection, the VOC point sampler was cleaned. Two blank samples were collected using the VOC point sampler prior to collection of samples from the stream known to contain VOCs. The two blank samples
Study Design
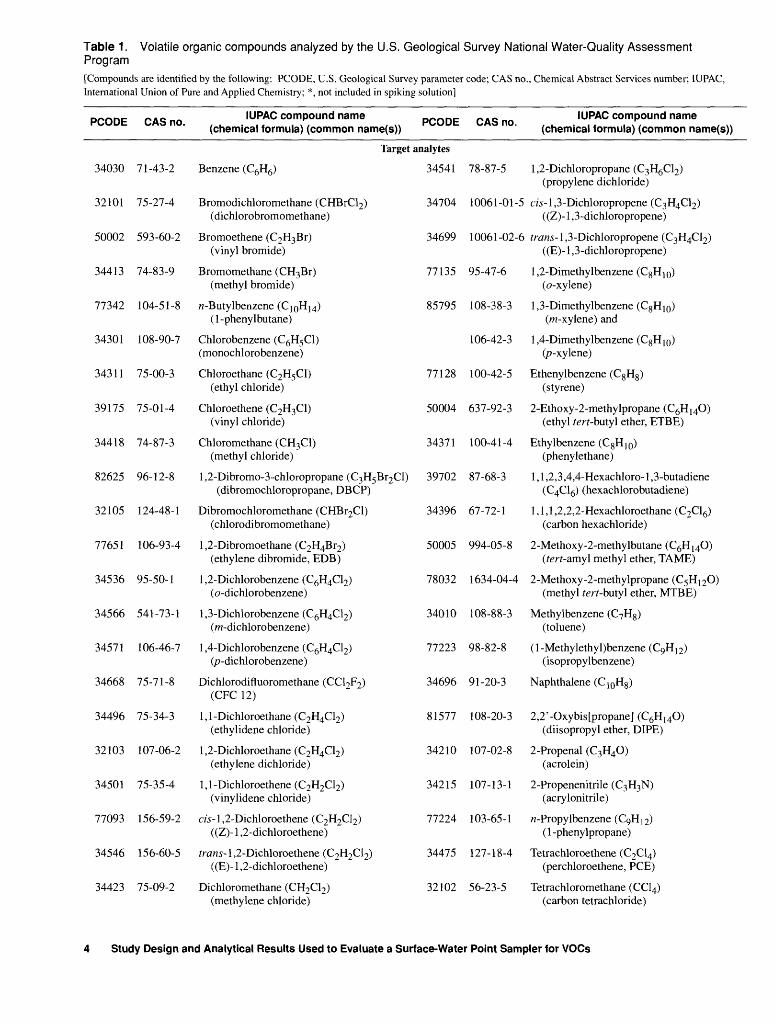
Table 1. Volatile organic compounds analyzed by the U.S. Geological Survey National Water-Quality Assessment Program[Compounds are identified by the following: PCODE, U.S. Geological Survey parameter code; CAS no., Chemical Abstract Services number; IUPAC, International Union of Pure and Applied Chemistry; *, not included in spiking solution]
PCODE CAS no.IUPAC compound name
(chemical formula) (common name(s)) PCODE CAS no. IUPAC compound name (chemical formula) (common name(s))
Target analytes
34030
32101
50002
34413
77342
34301
34311
39175
34418
82625
32105
77651
34536
34566
34571
34668
34496
32103
34501
77093
34546
34423
71-43-2
75-27-4
593-60-2
74-83-9
104-51-8
108-90-7
75-00-3
75-01-4
74-87-3
96-12-8
124-48-1
106-93-4
95-50-1
541-73-1
106-46-7
75-71-8
75-34-3
107-06-2
75-35-4
156-59-2
156-60-5
75-09-2
Benzene (CgH6)
Bromodichloromethane (CHBrCl2) (dichlorobromomethane)
Bromoethene (C2H3Br) (vinyl bromide)
Bromomethane (CH3Br) (methyl bromide)
«-Butylbenzene (CjoH 14) (1-phenylbutane)
Chlorobenzene (C6H5C1) (monochlorobenzene)
Chloroethane (C2H5C1) (ethyl chloride)
Chloroethene (C2H3 C1) (vinyl chloride)
Chloromethane (CH3C1) (methyl chloride)
1 ,2-Dibromo-3-chloropropane (C3H5Br2Cl) (dibromochloropropane, DBCP)
Dibromochloromethane (CHBr2Cl) (chlorodibromomethane)
1,2-Dibromoethane (C2H4Br2) (ethylene dibromide, EDB)
1,2-Dichlorobenzene (C6H4C12) (o-dichlorobenzene)
1,3-Dichlorobenzene (C6H4C12) (m-dichlorobenzene)
1,4-Dichlorobenzene (C6H4C12) (p-dichlorobenzene)
Dichlorodifluoromethane (CC12F2) (CFC 12)
1,1-Dichloroethane (C2H4C12) (ethylidene chloride)
1,2-Dichloroethane (C2H4C12) (ethylene dichloride)
1,1-Dichloroethene (C2H2C12) (vinylidene chloride)
cis-l ,2-Dichloroethene (C2H2C12) ((Z)- 1 ,2-dichloroethene)
trans- 1 ,2-Dichloroethene (C2H2C12) ((E)- 1 ,2-dichloroethene)
Dichloromethane (CH2C12) (methylene chloride)
34541
34704
34699
77135
85795
77128
50004
34371
39702
34396
50005
78032
34010
77223
34696
81577
34210
34215
77224
34475
32102
78-87-5
10061-01-5
10061-02-6
95-47-6
108-38-3
106-42-3
100-42-5
637-92-3
100-41-4
87-68-3
67-72-1
994-05-8
1634-04-4
108-88-3
98-82-8
91-20-3
108-20-3
107-02-8
107-13-1
103-65-1
127-18-4
56-23-5
1 ,2-Dichloropropane (C3H£C12) (propylene dichloride)
cis- 1 ,3-Dichloropropene (C3H4C12) ((Z)- 1 ,3-dichloropropene)
trans- 1 ,3-Dichloropropene (C3H4C12) ((E)- 1 ,3-dichloropropene)
1 ,2-Dimethylbenzene (C8H10) (o-xylene)
1,3-Dimethylbenzene (C8Hj0) (m-xylene) and
1 ,4-Dimethylbenzene (CgHjo) (p-xylene)
Ethenylbenzene (C8H8) (styrene)
2-Ethoxy-2-methylpropane (C6H 14O) (ethyl tert-buty\ ether, ETBE)
Ethylbenzene (C8H 10) (phenylethane)
1 , 1 ,2,3 ,4,4-Hexachloro- 1 ,3-butadiene(C4Clg) (hexachlorobutadiene)
1,1,1 ,2,2,2-Hexachloroethane (C2C16) (carbon hexachloride)
2-Methoxy-2-methylbutane (C6H 14O) (tert-amyl methyl ether, TAME)
2-Methoxy-2-methylpropane (C^H j 2O) (methyl tert-butyl ether, MTBE)
Methylbenzene (C7H8) (toluene)
(l-Methylethyl)benzene (C9H 12) (isopropylbenzene)
Naphthalene (C 10H8)
2,2'-Oxybis[propane] (C6H 14O) (diisopropyl ether, DIPE)
2-Propenal (C3H4O) (acrolein)
2-Propenenitrile (C3H3N) (acrylonitrile)
«-Propylbenzene (CgH 12) ( 1 -phenylpropane)
Tetrachloroethene (C2C14) (perchloroethene, PCE)
Tetrachloromethane (CC14) (carbon tetrachloride)
Study Design and Analytical Results Used to Evaluate a Surface-Water Point Sampler for VOCs
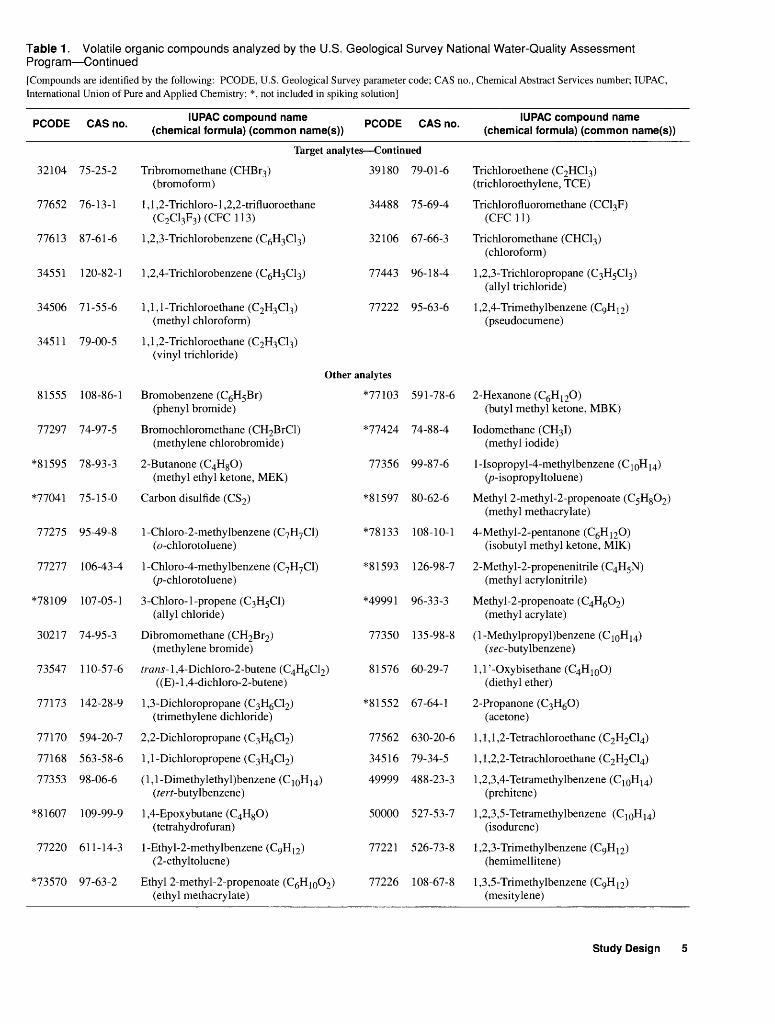
Table 1 . Volatile organic compounds analyzed by the U.S. Geological Survey National Water-Quality Assessment Program Continued
[Compounds are identified by the following: PCODE, U.S. Geological Survey parameter code; CAS no., Chemical Abstract Services number; IUPAC, International Union of Pure and Applied Chemistry; *, not included in spiking solution]
PCODE CAS no.IUPAC compound name
(chemical formula) (common name(s)) PCODE CAS no.IUPAC compound name
(chemical formula) (common name(s))
32104 75-25-2
77652 76-13-1
77613 87-61-6
34551 120-82-1
34506 71-55-6
34511 79-00-5
Tribromomethane (CHBr3 ) (bromoform)
Target analytes Continued
39180 79-01-6
1,1,2-Trichloro-1,2,2-trifluoroethane(C2C13F3)(CFC113)
1,2,3-Trichlorobenzene (CgH3Cl3 )
1,2,4-Trichlorobenzene (C6H3C13 )
1.1.1-Trichloroethane (C2H3 C13 ) (methyl chloroform)
1.1.2-Trichloroethane (C2H3 C13 ) (vinyl trichloride)
34488 75-69-4
32106 67-66-3
77443 96-18-4
77222 95-63-6
Trichloroethene (C2HC13) (trichloroethylene, TCE)
Trichlorofluoromethane (CC13F) (CFC11)
Trichloromethane (CHC13 ) (chloroform)
1.2.3-Trichloropropane (C3H5C13 ) (allyl trichloride)
1.2.4-Trimethylbenzene (C9H 12) (pseudocumene)
Other analytes
81555
77297
*81595
*77041
77275
77277
*78109
30217
73547
77173
11110
77168
77353
*81607
77220
*73570
108-86-1
74-97-5
78-93-3
75-15-0
95-49-8
106-43-4
107-05-1
74-95-3
110-57-6
142-28-9
594-20-7
563-58-6
98-06-6
109-99-9
611-14-3
97-63-2
Bromobenzene (CgH5Br) (phenyl bromide)
Bromochloromethane (CH2BrCl) (methylene chlorobromide)
2-Butanone (C4H8O) (methyl ethyl ketone, MEK)
Carbon disulfide (CS2)
1 -Chloro-2-methylbenzene (C7H7 C1) (o-chlorotoluene)
1 -Chloro-4-methylbenzene (C7H7 C1) (p-chlorotoluene)
3-Chloro-l-propene (C3 H5C1) (allyl chloride)
Dibromomethane (CH2Br2) (methylene bromide)
trans- 1 ,4-Dichloro-2-butene (C4H6C12) ((E)- 1 ,4-dichloro-2-butene)
1,3-Dichloropropane (C3 HgCl2) (trimethylene dichloride)
2,2-Dichloropropane (C3 H6C12)
1,1-Dichloropropene (C3H4C12)
(1,1 -Dimethylethyl)benzene (C \ 0H j 4) (terf-butylbenzene)
1,4-Epoxybutane (C4H8O) (tetrahydrofuran)
l-Ethyl-2-methylbenzene (C9H 12 ) (2-ethyltoluene)
Ethyl 2-methyl-2-propenoate (C6H 10O2 ) (ethyl methacrylate)
*77103
*77424
77356
*81597
*78133
*81593
*49991
77350
81576
*81552
77562
34516
49999
50000
77221
77226
591-78-6
74-88-4
99-87-6
80-62-6
108-10-1
126-98-7
96-33-3
135-98-8
60-29-7
67-64-1
630-20-6
79-34-5
488-23-3
527-53-7
526-73-8
108-67-8
2-Hexanone (CgH12O) (butyl methyl ketone, MBK)
lodomethane (CH3I) (methyl iodide)
1 -Isopropyl-4-methylbenzene (C j oH j 4) (p-isopropyltoluene)
Methyl 2-methyl-2-propenoate (C5H8O2) (methyl methacrylate)
4-Methyl-2-pentanone (C6H 12O) (isobutyl methyl ketone, MIK)
2-Methyl-2-propenenitrile (C4H5N) (methyl acrylonitrile)
Methyl-2-propenoate (C4H6O2) (methyl acrylate)
(l-Methylpropyl)benzene (CjoHj 4) (sec-butylbenzene)
l,l'-Oxybisethane (C4H 10O) (diethyl ether)
2-Propanone (C3 H6O) (acetone)
1,1,1 ,2-Tetrachloroethane (C2H2C14)
1 , 1 ,2,2-Tetrachloroethane (C2H2C14)
l,2,3,4-Tetramethylbenzene(C 10H 14) (prehitene)
1,2,3,5-Tetramethylbenzene (CjoHj4) (isodurene)
1 ,2,3-Trimethylbenzene (C9Hj 2) (hemimellitene)
1,3,5-Trimethylbenzene (C9H 12) (mesitylene)
Study Design

consisted of an initial canister blank and an initial equipment blank. A source-solution blank was not col lected. The initial canister blank was collected to deter mine if the canister, from which the equipment blank was collected, was contaminated with VOCs. The initial equipment blank was collected to characterize the condition of the VOC point sampler prior to collec tion of field samples. Blanks were collected according to methods described by Mueller and others (1997).
Seven concurrent samples were collected near midstream using both the VOC point sampler and by hand dipping a VGA vial in the stream. The VOC point sampler was cleaned between each replicate sample. After all replicate samples were collected, the samplers were cleaned again and a final canister and a final equipment blank were collected with the VOC point sampler.
ANALYTICAL AND STATISTICAL RESULTS
Results of the replicate analyses for laboratory and field testing are listed in table 2. Results of quality- control samples are listed in table 3 at the end of this report. If a concentration is preceded by a less than (<) symbol, the compound was not detected in the sample. If a concentration is preceded by an "E," the compound was detected in the sample but its concentration was estimated (Connor and others, 1998). For statistical purposes, estimated concentrations were considered the same as non-estimated concentrations.
Table 2 lists the percent relative standard devia tion (% RSD) among replicates for each sampler as well as the statistically determined two-sided p-value. The % RSD is a measure of reproducibility. If the % RSD is low (<10%), similarity between replicates is high. Percent RSD was only calculated for laboratory testing because the concentration of the solution being sampled remained constant. The two-sided p-value was determined using the sign test to compare the rep licates between the VOC point sampler and either the glass-siphon (laboratory) or hand-dipping (field) method. The sign test is nonparametric and is used to test for differences between two populations. For this study, the null hypothesis is that there is no systematic difference between samples collected using the VOC point sampler and either the glass-siphon or hand- dipping method. For a confidence level of 95 percent, this hypothesis would be rejected at p-values less than 0.025 and accepted at p-values greater than or equal to 0.025. Thus, as p-values increase, there is increasing
confidence that there is no systematic difference between samples collected using the VOC point sampler and either of the other two methods.
The % RSD values in table 2 are relatively small, with 57 of 73 calculated values for % RSD less than 10 for the VOC point sampler, representing a high degree of reproducibility. This compares well to 56 of 72 cal culated values for % RSD less than 10 for the glass- siphon sampler. The two-sided p-values in table 2 show that sample results do not vary between the VOC point sampler and either glass siphoning in the labora tory study or hand dipping in the field for most VOCs. As seen in table 2, 98 of 101 p-values are greater than 0.025 (95% confidence interval), which indicates little difference between sampling methods.
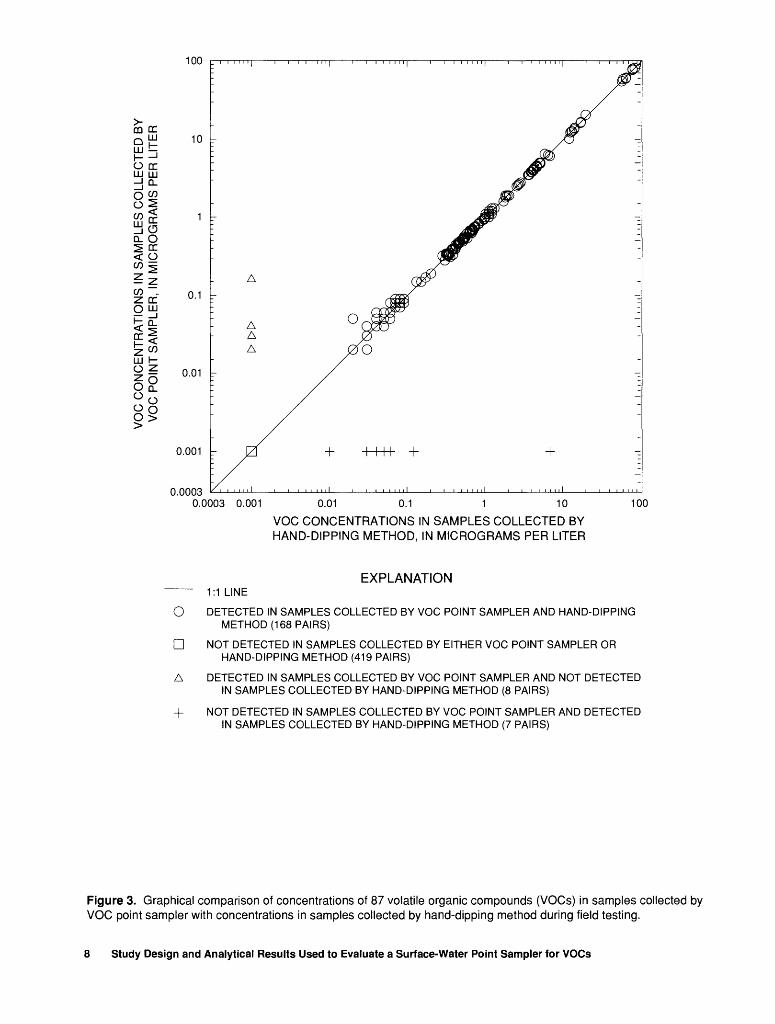
Data were plotted to visually compare results of the VOC point sampler, the glass-siphon method (lab oratory), and the hand-dipping method (field). Figure 2 illustrates the laboratory comparisons, and figure 3 illustrates the field comparisons. The figures show the VOC point sampler performed well in com parison to the other two sampling methods. Some scatter is visible at lower concentrations and could be due to analytical procedures in the laboratory, effects of the sampler, or possibly both.
From figure 2, it can be seen that analyte loss is very minimal. Concentrations of approximately 0.3 |J.g/L was spiked for 59 compounds. Fifteen VOCs were spiked to achieve a concentration of approxi mately 1.2 |J.g/L and trans-l,4-dichloro-2-butene was spiked to 3.0 |J,g/L. These concentrations can be seen in figure 2 at concentrations similar to those that were initially spiked. Clusters of data can be seen at 0.3,1.2, and 3 |J,g/L. The values at approximately 10 |j,g/L are for the compound 2-propanone, a possible contaminant in the spiking solution.
The quality-control samples (table 3) show that decontamination protocols are adequate to fully clean the VOC point sampler. Detected concentrations of select compounds were traced back to the source solution, and not considered to be contamination by the VOC point sampler, canister, or cleaning protocols. Specifically, two VOCs, trichloromethane (chloro form) and 2-propanone, were present in the source solution and detected in all quality-control samples. Three other random detections were found in the quality-control blanks. Chlorobenzene and 1,1,2,3,4, 4-hexachloro-l ,3-butadiene were detected in the initial canister blank in the laboratory, but these compounds were not detected in the associated equipment blank. A low concentration (E0.03 |J,g/L) of 2-butanone was detected in the high-concentration equipment blank.
Study Design and Analytical Results Used to Evaluate a Surface-Water Point Sampler for VOCs

100
CQ DC
O DC LU LU
Q- O2 DC< OCO ^
CO ~
Z DCO LU
£ ^< -5
f <z coLU I-o z
8§
0.0003
0.01 r
0.001 r
0.0003 0.001 0.01 0.1 1 10
VOC CONCENTRATIONS IN SAMPLES COLLECTED BY GLASS-SIPHON SAMPLER, IN MICROGRAMS PER LITER
100
EXPLANATION
O
D
A
1:1 LINE
DETECTED IN SAMPLES COLLECTED BY VOC POINT SAMPLER AND GLASS-SIPHON SAMPLER (512 PAIRS)
NOT DETECTED IN SAMPLES COLLECTED BY EITHER VOC POINT SAMPLER OR GLASS-SIPHON SAMPLER (80 PAIRS)
DETECTED IN SAMPLES COLLECTED BY VOC POINT SAMPLER AND NOT DETECTED IN SAMPLES COLLECTED BY GLASS-SIPHON SAMPLER (4 PAIRS)
NOT DETECTED IN SAMPLES COLLECTED BY VOC POINT SAMPLER AND DETECTED IN SAMPLES COLLECTED BY GLASS-SIPHON SAMPLER (6 PAIRS)
Figure 2. Graphical comparison of concentrations of 87 volatile organic compounds (VOCs) in samples collected by VOC point sampler with concentrations in samples collected by glass-siphon sampler during laboratory testing.
Analytical and Statistical Results
100
00 CC
O CC LU LU
Q- OS or < o
IIc/) -Z CC
62°0
8§
10
0.1
^ 0.01
0.001
0.00030.0003 0.001 0.01 0.1 1 10
VOC CONCENTRATIONS IN SAMPLES COLLECTED BY HAND-DIPPING METHOD, IN MICROGRAMS PER LITER
100
EXPLANATION
O
D
A
1:1 LINE
DETECTED IN SAMPLES COLLECTED BY VOC POINT SAMPLER AND HAND-DIPPING METHOD (168 PAIRS)
NOT DETECTED IN SAMPLES COLLECTED BY EITHER VOC POINT SAMPLER OR HAND-DIPPING METHOD (419 PAIRS)
DETECTED IN SAMPLES COLLECTED BY VOC POINT SAMPLER AND NOT DETECTED IN SAMPLES COLLECTED BY HAND-DIPPING METHOD (8 PAIRS)
NOT DETECTED IN SAMPLES COLLECTED BY VOC POINT SAMPLER AND DETECTED IN SAMPLES COLLECTED BY HAND-DIPPING METHOD (7 PAIRS)
Figure 3. Graphical comparison of concentrations of 87 volatile organic compounds (VOCs) in samples collected by VOC point sampler with concentrations in samples collected by hand-dipping method during field testing.
8 Study Design and Analytical Results Used to Evaluate a Surface-Water Point Sampler for VOCs

REFERENCES CITED
Connor, B.F., Rose, D.L., Noriega, M.C., Murtagh, L.K., and Abney, S.R., 1998, Methods of analysis by the U.S. Geological Survey National Water-Quality Labora tory Determination of 86 volatile organic compounds in water by gas chromatography/mass spectrometry, including detections less than reporting limits: U.S. Geological Survey Open-File Report 97-829, 78 p.
Helsel, D.R., and Hirsch, R.M., 1992, Statistical methods in water resources: New York, Elsevier Science Publish ing Company, Inc., 522 p.
Lopes, T.J., and Price, C.V., 1997, Study plan for urban stream indicator sites of the National Water-Quality Assessment Program: U.S. Geological Survey Open- File Report 97-25, 15 p.
Mueller, D.K, Martin, J.D., and Lopes, T.J., 1997, Quality- control design for surface-water sampling in the National Water-Quality Assessment Program: U.S. Geological Survey Open-File Report 97-223, 17 p.
Shelton, L.R., 1997, Field guide for collecting samples for analysis of volatile organic compounds in stream water for the National Water-Quality Assessment Program: U.S. Geological Survey Open-File Report 97-401, 14 p.
References Cited 9

10

TABLES 2 and 3
ii

A2

Tabl
e 2.
R
esul
ts o
f re
plic
ate-
sam
ple
anal
ysis
for
vola
tile
orga
nic
com
poun
ds (
VO
Cs)
dur
ing
labo
rato
ry a
nd fi
eld
test
ing
of s
elec
ted
sam
plin
g eq
uipm
ent
[IU
PAC
, Int
erna
tiona
l Uni
on o
f Pur
e an
d A
pplie
d C
hem
istr
y.
Sam
ple
type
: PS
L, s
ampl
e co
llect
ed in
the
labo
rato
ry w
ith t
he V
OC
poi
nt s
ampl
er;
SSL
, sam
ple
colle
cted
in t
he l
abor
ator
y w
ith t
he g
lass
-sip
hon
sam
pler
; PS
F, s
ampl
e co
llect
ed in
the
fie
ld w
ith t
he V
OC
poi
nt s
ampl
er;
HD
F, s
ampl
e co
llect
ed i
n th
e fi
eld
by h
and-
dipp
ing
met
hod;
% R
SD,
perc
enta
ge o
f re
lativ
e st
anda
rd d
evia
tion;
p-v
alue
, st
atis
tical
m
easu
re o
f di
ffer
ence
bet
wee
n sa
mpl
ing
met
hods
det
erm
ined
by
sign
test
; ,
not
cal
cula
ted;
<, n
ot d
etec
ted
in t
he s
ampl
e; E
, est
imat
ed;
**, p
ossi
ble
cont
amin
ant
in s
piki
ng s
olut
ion]
IUPA
C co
mpo
und
nam
e Sa
mpl
e ty
pe
Con
cent
ratio
n, in
mic
rogr
ams
per
liter
Rep
licat
e sa
mpl
e nu
mbe
r
12
34
56
7
% R
SD2-
side
d p-
valu
e
Tar
get
anal
ytes
Ben
zene
PS
L
SSL
PSF
HD
F
Bro
mod
ichl
orom
etha
ne
PSL
SSL
PSF
HD
F
Bro
moe
then
e PS
L
SSL
PSF
HD
F
Bro
mom
etha
ne
PSL
SSL
PSF
HD
F
n-B
utyl
benz
ene
PSL
SSL
PSF
HD
F
Chl
orob
enze
ne
PSL
SSL
to S
PSF
(D 10
HD
F
0.28 .3
2
12.7
12.8 .3
2
.30
<.10
<.10 .4
0
.45
<.10
<.10
E.3
5
E.3
9
<.10
<.10 .2
1
.22
.44
.41
1.3
1.3
<.05
<.05
0.28 .3
0
13.4
13.6 .2
8
.28
<.10
<.10 .3
7
.44
<.10
<.10
E.2
8
E.3
3
<.10
<.10 .2
3
.21
.48
.46
1.2
1.2
<.05
<.05
0.29 .3
2
14.0
13.8 .3
2
.33
<.1
0
<.1
0
.49
.44
<.1
0
<.1
0
E.3
9
E.3
5
<.10
<.10 .2
2
.23
.47
.44
1.3
1.2
<.05
<.05
0.29 .3
1
12.7
12.6 .3
4
.30
<.2
0
<.20 .4
4
.40
<.2
0
<.2
0
E.3
3
E.3
4
<.2
0
<.2
0
.23
.22
.42
.42
1.2
1.2
<.1
0
<.1
0
0.28 .2
6
16.5
16.6 .2
7
.34
<.10
<.10 .3
9
.46
<.10
<.10
E.3
0
E.4
0
<.10
<.10 .2
2
.22
.54
.58
1.2
1.2
<.05
<.05
0.29 .2
9
16.7
16.7 .2
9
.27
<.10
<.10 .4
0
.42
<.10
<.10
E.3
5
E.4
0
<.1
0
<.10 .2
2
.22
.56
.53
1.2
1.3
<.05
<.05
0.29 .2
5
16.3
16.5 .3
0
.31
<.10
<.10 .4
1
.37
<.10
<.10
E.3
3
E.3
2
<.10
<.10 .2
3
.21
.61
.57
1.2
1.2
<.05
<.05
1.9
9.6
-- 8.2
8.2
-- -- 9.5
7.4
-- --
E10
.8
E9.
5
-- -- 3.4
3.2
-- 4.0
4.0
-- -.
0.68
7
.687
.999
.999
.453
.999
.219
.999

(/)
§_
Tabl
e 2.
R
esul
ts o
f rep
licat
e-sa
mpl
e an
alys
is f
or v
olat
ile o
rgan
ic c
ompo
unds
(V
OC
s) d
urin
g la
bora
tory
and
fiel
d te
stin
g of
sel
ecte
d sa
mpl
ing
equi
pmen
t Con
tinue
d[I
UPA
C, I
nter
natio
nal
Uni
on o
f Pur
e an
d A
pplie
d C
hem
istr
y.
Sam
ple
type
: PS
L, s
ampl
e co
llect
ed in
the
labo
rato
ry w
ith th
e V
OC
poi
nt s
ampl
er;
SSL
, sa
mpl
e co
llect
ed i
n th
e la
bora
tory
with
the
glas
s-si
phon
sa
mpl
er;
PSF,
sam
ple
colle
cted
in
the
fiel
d w
ith th
e V
OC
poi
nt s
ampl
er;
HD
F, s
ampl
e co
llect
ed i
n th
e fi
eld
by h
and-
dipp
ing
met
hod;
% R
SD, p
erce
ntag
e of
rela
tive
stan
dard
dev
iatio
n; p
-val
ue,
stat
istic
al
mea
sure
of
diff
eren
ce b
etw
een
sam
plin
g m
etho
ds d
eter
min
ed b
y si
gn te
st; , n
ot c
alcu
late
d; <
, not
det
ecte
d in
the
sam
ple;
E, e
stim
ated
; **
, pos
sibl
e co
ntam
inan
t in
spi
king
sol
utio
n]
O
(D
CO <|
IUPA
C co
mpo
und
nam
eCD a
Sam
ple
type
Con
cent
ratio
n, in
mic
rogr
ams
per
liter
Rep
licat
e sa
mpl
e nu
mbe
r
12
34
56
7
% R
SD2-
side
d p-
valu
e
^
Tar
get
anal
ytes
C
onti
nued
CD.
"S
Chl
oroe
than
eo 3J § CO C £
C
hlor
oeth
ene
3 m CD.
C CD <D CD £P
Chl
orom
etha
ne3. CD
8 1(D TJ 5-
1 ,2-
Dib
rom
o-3-
chlo
ropr
opan
e
CD 3 o (D 0* O
Dib
rom
ochl
orom
etha
neO CO
1 ,2-
Dib
rom
oeth
ane
PSL
SSL
PSF
HD
F
PSL
SSL
PSF
HD
F
PSL
SSL
PSF
HD
F
PSL
SSL
PSF
HD
F
PSL
SSL
PSF
HD
F
PSL
SSL
PSF
HD
F
0.29 .3
6
E.0
8
E.0
7
.34
.36
< 10
<. 1
0
E.3
5
E.3
8
E.0
5
E.0
4
E.2
0
<50
<.50
<5
0
.29
.28
<10
<10
.33
.29
<10
<10
0.29 .3
1
<.10
<.10 .3
2
.35
< 10
<. 1
0
E.31
E.3
2
<2
0
E.0
3
E.2
2
E.2
3
<.50
<.50 .3
1
.28
<1
0
<.10 .2
6
.31
<.10
<.10
0.31 .3
3
<.10
E.0
5
.38
.33
< 10
<.10
E.3
4
E.3
8
<2
0
<.20
E.3
0
E.21
<50
<.50 .3
0
.26
<.10
<.10 .2
7
.29
<.10
<.10
0.32 .3
2
<.20
<.20 .3
6
.36
<.20
<.20
E.3
8
E.3
9
<.40
E.0
4
E.2
5
E.1
8
<1.0
<1.0 .2
8
.31
<.20
<20
.28
.26
<.20
<.20
0.34 .3
3
E.0
8
E.0
6
.30
.34
< 10
<.10
E.2
8
E.3
3
E.0
6
E.0
5
E.3
4
E.2
6
<.50
<.50 .3
4
.30
<.10
<.10 .2
9
.33
<.10
<10
0.30 .3
3
<.10
E.0
6
.36
.33
< 10
<. 1
0
E.2
9
E.3
3
E.0
5
E.0
5
E.2
1
E.2
3
<.50
<.50 .2
9
.29
<.10
<.10 .2
2
.28
<10
<.10
0.32 .3
4
E.0
7
E.0
8
.40
.32
< 10
<. 1
0
E.3
5
E.3
1
E.0
6
E.0
6
E.2
2
E.2
0
<.5
0
<.50 .3
0
.27
<.10
<.1
0
.26
.30
<.1
0
<.10
5.9
4.8
9.8
4.6
__
El 1
.0
E9.
6
__
E21
.1 _ _ -- 6.5
6.0
- -- 12.3 7.6
- _
0.21
9
.999
.999
.125 ^n
n. j\
j\j
.999
.219
.453

Tabl
e 2.
R
esul
ts o
f re
plic
ate-
sam
ple
anal
ysis
for
vola
tile
orga
nic
com
poun
ds (
VO
Cs)
dur
ing
labo
rato
ry a
nd f
ield
test
ing
of s
elec
ted
sam
plin
g eq
uipm
ent C
ontin
ued
[IU
PAC
, Int
erna
tiona
l U
nion
of P
ure
and
App
lied
Che
mis
try.
Sa
mpl
e ty
pe:
PSL
, sa
mpl
e co
llect
ed in
the
labo
rato
ry w
ith t
he V
OC
poi
nt s
ampl
er;
SSL
, sam
ple
colle
cted
in th
e la
bora
tory
with
the
glas
s-si
phon
sa
mpl
er;
PSF,
sam
ple
colle
cted
in th
e fi
eld
with
the
VO
C p
oint
sam
pler
; H
DF,
sam
ple
colle
cted
in t
he f
ield
by
hand
-dip
ping
met
hod;
% R
SD, p
erce
ntag
e of
rela
tive
stan
dard
dev
iatio
n; p
-val
ue,
stat
istic
al
mea
sure
of d
iffe
renc
e be
twee
n sa
mpl
ing
met
hods
det
erm
ined
by
sign
test
; ,
not
cal
cula
ted;
<, n
ot d
etec
ted
in t
he s
ampl
e; E
, est
imat
ed;
**, p
ossi
ble
cont
amin
ant
in s
piki
ng s
olut
ion]
IUPA
C co
mpo
und
nam
e . ty
pe
Con
cent
ratio
n, in
mic
rogr
ams
per
liter
Rep
licat
e sa
mpl
e nu
mbe
r
12
34
56
7
% R
SD2-
side
d p-
valu
e
Tar
get a
naly
tes C
ontin
ued
1 ,2-
Dic
hlor
oben
zene
PS
L
SSL
PSF
HD
F
1,3-
Dic
hlor
oben
zene
PS
L
SSL
PSF
HD
F
1 ,4-
Dic
hlor
oben
zene
PS
L
SSL
PSF
HD
F
Dic
hlor
odif
luor
omet
hane
PS
L
SSL
PSF
HD
F
1 , 1
-Dic
hlor
oeth
ane
PSL
SSL
PSF
HD
F
1 ,2-
Dic
hlor
oeth
ane
PSL
SSL
8- PS
F<D 10
H
DF
1.2
1.2
<.05
<.05
1.2
1.3
<.05
<.05
1.2
1.3
<.05
<.05
E.4
5
E.5
5
<.2
0
<.20 .2
9
.30
E.0
6
E.0
6
.30
.34
<.52
<.49
1.2
1.2
<.05
<.05
1.3
1.3
<.05
<.05 1.2
1.2
<.05
<.05
E.4
6
E.4
5
<.20
<.20 .2
8
.30
E.0
6
E.0
6
.28
.26
<.51
<.52
1.2
1.2
<.05
<.05
1.2
1.3
<.05
<.05
1.2
1.2
<.05
<.05
E.4
9
E.4
5
<.20
<.2
0
.28
.33
E.0
6
E.0
6
.31
.30
<.5
4
<.52
1.2
1.2
<.10
<.10
1.2
1.2
<.10
<.10
1.2
1.3
<.10
<.10
E.4
0
E.41
<.40
<.40 .3
0
.29
<.10
<.10 .2
8
.28
<.46
<.46
1.2
1.2
<.05
<.05
1.2
1.2
<.05
<.05
1.2
1.2
<.05
<.05
E.4
6
E.4
4
<.20
<.20 .2
9
.29
E.0
7
E.0
7
.27
.26
<.59
<.62
1.2
1.2
<.05
<.05
1.2
1.2
<.05
<.05
1.2
1.2
<.05
<.05
E.4
5
E.4
6
<.20
<.20 .3
0
.30
E.0
7
E.0
8
.25
.27
<.66
<.61
1.2
1.1
<.05
<.05
1.2
1.2
<.05
<.05
1.3
1.1
<.05
<.05
E.4
7
E.4
6
<.20
<.20 .2
8
.30
E.0
7
E.0
7
.27
.27
<.61
<.58
0 3.2
-- -- 3.1
4.3
-- - 3.1
5.7
-- - E6.
1
E9.
4
-- - 3.1
4.5
-- 7.1
10.2
..
0.99
9
.500
.999
.999
.375
.999
.999

w Q.
Tab
le 2
. R
esul
ts o
f re
plic
ate-
sam
ple
anal
ysis
for
vola
tile
orga
nic
com
poun
ds (
VO
Cs)
dur
ing
labo
rato
ry a
nd f
ield
tes
ting
of s
elec
ted
sam
plin
g e
qu
ipm
en
t C
on
tinu
ed
[IU
PAC
, Int
erna
tiona
l U
nion
of P
ure
and
App
lied
Che
mis
try.
Sa
mpl
e ty
pe:
PSL
, sam
ple
colle
cted
in t
he la
bora
tory
with
the
VO
C p
oint
sam
pler
; SS
L, s
ampl
e co
llect
ed in
the
labo
rato
ry w
ith th
e gl
ass-
siph
on
sam
pler
; PS
F, s
ampl
e co
llect
ed in
the
fie
ld w
ith t
he V
OC
poi
nt s
ampl
er;
HD
F, s
ampl
e co
llect
ed in
the
fie
ld b
y ha
nd-d
ippi
ng m
etho
d; %
RSD
, pe
rcen
tage
of
rela
tive
stan
dard
dev
iatio
n; p
-val
ue,
stat
istic
al
mea
sure
of d
iffe
renc
e be
twee
n sa
mpl
ing
met
hods
det
erm
ined
by
sign
test
; , n
ot c
alcu
late
d; <
, not
det
ecte
d in
the
sam
ple;
E, e
stim
ated
; **
, pos
sibl
e co
ntam
inan
t in
spi
king
sol
utio
n]
O (D
<A <§
IUPA
C co
mpo
und
nam
eQ)
Q.
3 SL "5.
1,1
-Dic
hlor
oeth
ene
o" 2J. 30 (D
(A <A C (A g_
c/5-
l,2-D
ichl
oroe
then
e
0 m 1 c Q) <D Q) £!?
?ra/
i5-l
,2-D
ichl
oroe
then
e
3 o 1 5 =j-
Dic
hlor
omet
hane
W Q) 3 o (D 3 O
1 ,2-
Dic
hlor
opro
pane
O (A
c/5-
l,3-D
ichl
orop
rope
ne
Sam
ple
type
Con
cent
ratio
n, in
mic
rogr
ams
per
liter
Rep
licat
e sa
mpl
e nu
mbe
r
12
34
56
7
% R
SD2-
side
d p-
valu
e
Tar
get a
naly
tes C
ontin
ued
PSL
SSL
PSF
HD
F
PSL
SSL
PSF
HD
F
PSL
SSL
PSF
HD
F
PSL
SSL
PSF
HD
F
PSL
SSL
PSF
HD
F
PSL
SSL
PSF
HD
F
0.34 .4
2
<.10
<.10 .3
1
.32
E.0
2
E.0
3
.29
.30
<.05
<.05 .5
9
.63
<.10
<..1
0
.28
.26
<.05
<.05 .2
8
.22
<10
<.10
0.36 .3
3
<.10
<.10 .2
7
.30
E.0
3
E.0
3
.32
.27
<.05
<.05 .5
1
.57
<.10
<10 .2
8
.31
<.05
<.05 .2
6
.29
<10
<10
0.32 .3
3
<.10
<.10 .2
8
.31
E.0
4
E.0
3
.28
.31
<.05
<.05 .5
8
.61
<.10
<.10 .2
6
.30
<.05
<.05 .2
6
.21
<10
<.10
0.36 .3
4
<.20
<.20 .2
8
.33
E.0
4
<.10 .3
0
.32
<.10
<.10 .6
3
.63
<.20
<.20 .2
8
.28
<.10
'
<.10 .2
8
.25
<.20
<.20
0.32 .4
3
<10
<.10 .3
1
.31
E.0
5
E.0
2
.28
.30
<.05
<.05 .5
0
.51
<.10
<.10 .2
5
.29
<.05
<.05 .2
0
.27
<.10
<.10
0.37 .3
1
<.10
<.10 .2
8
.30
E.0
3
<.05 .3
1
.30
<.05
<.05 .5
6
.58
<.10
<.10 .2
6
.31
<.05
<.05 .2
6
.25
<.10
<.10
0.33 .3
6
<10
<.10 .2
7
.28
E.0
2
<.05 .2
9
.24
<.05
<.05 .4
8
.53
<.10
<.10 .2
8
.28
<.05
<.05 .1
9
.24
<.10
<.10
6.0
13.0
-- .. 6.0
5.2
5.1
9.4
_ -- 10.0 8.2
_ - 4.8
6.3
- -- 14.9
11.1
-
0.99
9
.031
.999
.999
.031
.375
.999

Tab
le 2
. R
esul
ts o
f re
plic
ate-
sam
ple
anal
ysis
for
vol
atile
org
anic
com
poun
ds (
VO
Cs)
dur
ing
labo
rato
ry a
nd f
ield
tes
ting
of s
elec
ted
sam
plin
g e
qu
ipm
en
t C
on
tinu
ed
[IU
PAC
, Int
erna
tiona
l U
nion
of P
ure
and
App
lied
Che
mis
try.
Sa
mpl
e ty
pe:
PSL
, sam
ple
colle
cted
in t
he la
bora
tory
with
the
VO
C p
oint
sam
pler
; SS
L, s
ampl
e co
llect
ed in
the
labo
rato
ry w
ith th
e gl
ass-
siph
on
sam
pler
; PS
F, s
ampl
e co
llect
ed i
n th
e fi
eld
with
the
VO
C p
oint
sam
pler
; H
DF,
sam
ple
colle
cted
in t
he f
ield
by
hand
-dip
ping
met
hod;
% R
SD,
perc
enta
ge o
f re
lativ
e st
anda
rd d
evia
tion;
p-v
alue
, st
atis
tical
m
easu
re o
f di
ffer
ence
bet
wee
n sa
mpl
ing
met
hods
det
erm
ined
by
sign
tes
t; , n
ot c
alcu
late
d; <
, not
det
ecte
d in
the
sam
ple;
E, e
stim
ated
; **
, pos
sibl
e co
ntam
inan
t in
spi
king
sol
utio
n]
(D to
IUPA
C co
mpo
und
nam
eS
ampl
e ty
pe
Con
cent
ratio
n, in
mic
rogr
ams
per
liter
Rep
licat
e sa
mpl
e nu
mbe
r
12
34
56
7
% R
SD2-
side
d p-
valu
e
Tar
get a
naly
tes C
ontin
ued
tran
s-l ,
3-D
ichl
orop
rope
ne
1 ,2-
Dim
ethy
lben
zene
1 ,3-
Dim
ethy
lben
zene
anc
i1 ,
4-D
imet
hylb
enze
ne
Eth
enyl
benz
ene
2-E
thox
y-2-
met
hylp
ropa
ne
Eth
ylbe
nzen
e
PSL
SSL
PSF
HD
F
PSL
SSL
PSF
HD
F
PSL
SSL
PSF
HD
F
PSL
SSL
PSF
HD
F
PSL
SSL
PSF
HD
F
PSL
SSL
PSF
HD
F
0.24 .2
3
<.10
<.1
0
1.2
1.1 .3
3
.34
1.3
1.4
4.1
4.1 .2
3
.23
<.05
<.05 .3
2
.32
<.10
<.10 .2
4
.26
1.8
1.8
0.24 .2
1
<.10
<.10
1.2
1.1 .3
3
.33
1.4
1.3
4.3
4.2 .2
5
.20
<.05
<.05 .2
8
.34
<.10
<.10 .2
6
.24
1.8
1.8
0.26 .2
2
<.10
<.1
0
1.2
1.2 .3
3
.32
1.4
1.4
4.3
4.2 .2
6
.25
<.05
<.05 .2
8
.29
<.10
<.10 .2
4
.25
1.9
1.8
0.25 .2
1
<.20
<.20
1.2
1.1 .2
8
.30
1.4
1.3
4.0
4.1 .2
6
.24
<.10
<.10 .2
9
.29
<.20
<.20 .2
6
.25
1.6
1.7
0.33 .2
1
<.10
<.1
0
1.2
1.1 .3
3
.32
1.4
1.4
4.4
4.5 .2
5
.23
<.05
<.05 .2
8
.29
<.10
<.10 .2
5
.26
1.9
1.9
0.28 .1
6
<.10
<.10
1.2
1.2 .3
3
.33
1.3
1.4
4.5
4.5 .2
4
.24
<.05
<.05 .3
3
.29
<.10
<.10 .2
4
.26
1.9
2.0
0.27 .2
1
<.10
<.1
0
1.2
1.1 .3
2
.33
1.5
1.3
4.6
4.5 .2
5
.22
<.05
<.05 .2
6
.30
<.10
<.10 .2
5
.23
1.9
1.9
11.8
10.7
- -- 0 4.3
5.0
3.9
- 4.3
7.1
-- - 8.5
6.5
-- - 3.6
4.6
0.01
6
.062
.999
.999
.999
.062
.375
.999
.999

Tabl
e 2.
R
esul
ts o
f re
plic
ate-
sam
ple
anal
ysis
for
vola
tile
orga
nic
com
poun
ds (
VO
Cs)
dur
ing
labo
rato
ry a
nd f
ield
test
ing
of s
elec
ted
sam
plin
g eq
uipm
ent C
ontin
ued
[IU
PAC
, Int
erna
tiona
l U
nion
of P
ure
and
App
lied
Che
mis
try.
Sa
mpl
e ty
pe:
PSL
, sam
ple
colle
cted
in th
e la
bora
tory
with
the
VO
C p
oint
sam
pler
; SS
L, s
ampl
e co
llect
ed in
the
labo
rato
ry w
ith th
e gl
ass-
siph
on
sam
pler
; PS
F, s
ampl
e co
llect
ed in
the
fiel
d w
ith t
he V
OC
poi
nt s
ampl
er;
HD
F, s
ampl
e co
llect
ed in
the
fiel
d by
han
d-di
ppin
g m
etho
d; %
RSD
, per
cent
age
of re
lativ
e st
anda
rd d
evia
tion;
p-v
alue
, sta
tistic
al
mea
sure
of d
iffe
renc
e be
twee
n sa
mpl
ing
met
hods
det
erm
ined
by
sign
test
; --
, not
cal
cula
ted;
<, n
ot d
etec
ted
in t
he s
ampl
e; E
, est
imat
ed;
**, p
ossi
ble
cont
amin
ant
in s
piki
ng s
olut
ion]
a (D
(A <§
IUPA
C co
mpo
und
nam
eCO 3 a
Sam
ple
type
Con
cent
ratio
n, in
mic
rogr
ams
per
liter
Rep
licat
e sa
mpl
e nu
mbe
r
12
34
56
7
% R
SD2-
side
d p-
valu
e
^
Tar
get
anal
ytes
C
onti
nued
CO <
1,1,
2,3
,4 ,4
-Hex
achl
oro-
l ,3-
buta
dien
eo co_ 3J (D
(A (A C <|
1 ,
1 , 1
,2 ,2
,2-H
exac
hlor
oeth
ane
o m 2. c CO (D CO ^
2-M
etho
xy-2
-met
hylb
utan
eCO 8 i CO 0 Q 5-
2-
Met
hoxy
-2-m
ethy
lpro
pane
c? 3 9 i o" O
Met
hylb
enze
neO (A
(1 -M
ethy
leth
yl)b
enze
ne
PSL
SSL
PSF
HD
F
PSL
SSL
PSF
HD
F
PSL
SSL
PSF
HD
F
PSL
SSL
PSF
HD
F
PSL
SSL
PSF
HD
F
PSL
SSL
PSF
HD
F
0.23 .2
5
<.20
<.20 .3
4
.36
<.05
<.05 .3
2
.32
<.10
<.10 .3
4
.33
55.0
55.8 .2
7
.28
.93
.95
1.2
1.2
2.6
2.6
0.27 .2
2
<.20
<.20 .3
3
.34
<.05
<.05 .2
8
.29
<.10
<.10 .3
2
.33
58.6
57.3 .2
8
.27
.95
.96
1.2
1.2
2.7
2.7
0.24 .2
6
<.20
<.2
0
.33
.32
<.05
<.05 .2
9
.28
<.10
<.10 .3
0
.35
59.5
62.3 .2
8
.28
1.0 .9
8
1.2
1.2
2.8
2.8
0.23 .2
0
<.40
<.40 .3
3
.35
<.1
0
<.10 .3
0
.32
<.20
<.20 .3
2
.33
61.0
63.0 .2
6
.27
.90
.89
1.2
1.2
2.5
2.5
0.24 .2
5
<.20
<.20 .3
2
.31
<.05
<.05 .3
1
.32
<.10
<.10 .3
2
.32
76.8
76.3 .2
6
.28
1.0
1.0
1.2
1.2
3.5
3.5
0.24 .2
6
<.20
<.20 .3
2
.35
<.05
<.05 .2
8
.30
< .1
4
<.14 .3
4
.31
80.8
81.3 .2
6
.27
1.0
1.0
1.2
1.2
3.5
3.5
0.24 .1
9
<.20
<.20 .3
3
.30
<.05
<.05 .3
0
.26
<.10
<.14 .2
8
.27
78.9
76.1 .2
4
.26
1.0
1.0
1.2
1.1
3.5
3.6
5.6
12.6
- 2.1
6.9
5.0
7.8
_ _ 6.7
7.9
_ 5.3
2.8
--
.00
3.2
_- ..
0.99
9
.999
.687
.999
.999
.219
.999
.999
.999

Tabl
e 2.
R
esul
ts o
f re
plic
ate-
sam
ple
anal
ysis
for
vola
tile
orga
nic
com
poun
ds (
VO
Cs)
dur
ing
labo
rato
ry a
nd f
ield
tes
ting
of s
elec
ted
sam
plin
g eq
uipm
ent C
ontin
ued
[IU
PAC
, Int
erna
tiona
l U
nion
of P
ure
and
App
lied
Che
mis
try.
Sa
mpl
e ty
pe:
PSL
, sam
ple
colle
cted
in t
he l
abor
ator
y w
ith th
e V
OC
poi
nt s
ampl
er;
SSL
, sam
ple
colle
cted
in th
e la
bora
tory
with
the
glas
s-si
phon
sa
mpl
er;
PSF,
sam
ple
colle
cted
in
the
fiel
d w
ith t
he V
OC
poi
nt s
ampl
er;
HD
F, s
ampl
e co
llect
ed i
n th
e fi
eld
by h
and-
dipp
ing
met
hod;
% R
SD,
perc
enta
ge o
f rel
ativ
e st
anda
rd d
evia
tion;
p-v
alue
, st
atis
tical
m
easu
re o
f di
ffer
ence
bet
wee
n sa
mpl
ing
met
hods
det
erm
ined
by
sign
test
; , n
ot c
alcu
late
d; <
, not
det
ecte
d in
the
sam
ple;
E, e
stim
ated
; **
, pos
sibl
e co
ntam
inan
t in
spi
king
sol
utio
n]
IUPA
C co
mpo
und
nam
e Sa
mpl
eC
once
ntra
tion
, in
mic
rogr
ams
per
liter
Rep
lica
te s
ampl
e nu
mbe
r
12
34
56
% R
SD
7
2-si
ded
p-va
lue
Tar
get a
naly
tes C
ontin
ued
Nap
htha
lene
PS
L
SSL
PSF
HD
F
2,2'
-Oxy
bis[
prop
ane]
PS
L
SSL
PSF
HD
F
2-Pr
open
al
PSL
SSL
PSF
HD
F
2-Pr
open
enitr
ile
PSL
SSL
PSF
HD
F
n-Pr
opyl
benz
ene
PSL
SSL
PSF
HD
F
Tet
rach
loro
ethe
ne
PSL
SSL
o-
PSF
(D M
HD
F
0.26
.29
.35
.34
E.2
5
E.2
9
<.10
<.10
E2.
0
E2.
8
<4.4
<4.4 1.6
1.8
<11.
3
<11.
2
1.1
1.2
3.8
3.8 .2
6
.28
E.0
5
E.0
6
0.29
.21
.33
.38
E.3
0
E.2
3
<10
<.10
El .
6
E1.
5
<4.8
<4.5 1.1 1.2
<11.
3
<11.
7
1.2
1.1
3.8
3.9 .2
7
.26
E.0
6
E.0
6
0.29
.29
.34
.31
E.2
8
E.2
7
<.10
<.10
E1.
3
<2.0
<4.3
<3.5 1.7
1.3
<12.
0
<11.
5
1.1 1.1
4.0
4.0 .2
7
.25
E.0
6
E.0
6
0.28
.29
.32
.28
E.2
8
E.3
2
<.20
<.20
E.7
0
<2.0
<3.9
<5.0 1.0
1.5
<11.
7
<11.
1 1.2
1.1
3.5
3.6 .2
6
.29
E.0
5
E.0
4
0.26 .2
8
.31
.35
E.3
1
E.2
7
<.10
<.10
<2.0
<2.0
<4.0
<4.5 1.3
1.4
<14.
6
<14.
9
1.1
1.2
4.9
5.0 .2
4
.26
E.0
5
E.0
5
0.28
.24
.32
.33
E.2
8
E.2
9
<.10
<.10
<2.0
<2.0
<3.8
<3.8 1.3
1.2
<14.
6
<14.
3
1.1
1.2
5.0
4.9 .2
9
.28
E.0
4
E.0
5
0.29
4.
8
.23
13.0
.34
.32
E.2
7 E
6.9
E.2
1 E
14.0
<.10
<.10
<2.0
<2.0
<5.2
<5.0 1.2
19.4
1.3
15.3
<14.
0
<15.
1 1.2
4.6
1.1
4.7
5.0
5.0 .2
8 6.
0
.25
6.0
E.0
5
E.0
5
0.99
9
.999
.999
.999
.453
.999
.625
.999
.999

Tabl
e 2.
R
esul
ts o
f re
plic
ate-
sam
ple
anal
ysis
for
vol
atile
org
anic
com
poun
ds (
VO
Cs)
dur
ing
labo
rato
ry a
nd f
ield
tes
ting
of s
elec
ted
sam
plin
g eq
uipm
ent C
ontin
ued
[IU
PAC
, Int
erna
tiona
l U
nion
of P
ure
and
App
lied
Che
mis
try.
Sa
mpl
e ty
pe:
PSL
, sa
mpl
e co
llect
ed in
the
labo
rato
ry w
ith th
e V
OC
poi
nt s
ampl
er;
SSL
, sa
mpl
e co
llect
ed in
the
labo
rato
ry w
ith th
e gl
ass-
siph
on
sam
pler
; PS
F, s
ampl
e co
llect
ed in
the
fiel
d w
ith t
he V
OC
poi
nt s
ampl
er;
HD
F, s
ampl
e co
llect
ed in
the
fiel
d by
han
d-di
ppin
g m
etho
d; %
RSD
, pe
rcen
tage
of
rela
tive
stan
dard
dev
iatio
n; p
-val
ue,
stat
istic
al
mea
sure
of
diff
eren
ce b
etw
een
sam
plin
g m
etho
ds d
eter
min
ed b
y si
gn t
est;
, n
ot c
alcu
late
d; <
, not
det
ecte
d in
the
sam
ple;
E, e
stim
ated
; **
, pos
sibl
e co
ntam
inan
t in
spi
king
sol
utio
n]
O
w <B
IUPA
C co
mpo
und
nam
eD) Q
.
3 SL "5.
Tet
rach
loro
met
hane
o' SL 3D W <fi C g_
Tri
brom
omet
hane
0 m SL c D) flf
D) [0
1,1
,2-T
rich
loro
-l ,2
,2-t
rifl
ouro
etha
ne
2 (0 « ? TJ 5-
1,2,
3-T
rich
loro
benz
ene
i 3 -o_ ^ o" O
1 ,2,
4-T
rich
loro
benz
ene
O W
1,1,
1 -T
rich
loro
etha
ne
Sam
ple
type
Con
cent
ratio
n, in
mic
rogr
ams
per
liter
Rep
licat
e sa
mpl
e nu
mbe
r
12
34
56
7
% R
SD2-
side
d p-
valu
e
Tar
get a
naly
tes C
ontin
ued
PSL
SSL
PSF
HD
F
PSL
SSL
PS
F
HD
F
PSL
SSL
PSF
HD
F
PSL
SSL
PSF
HD
F
PSL
SSL
PSF
HD
F
PSL
SSL
PSF
HD
F
0.27 .2
8
<.05
<.05 .2
6
.26
<.20
<.20 .3
3
.36
<.05
<.05 .2
6
.26
<.20
<.20 .2
5
.28
<.20
<.20 .2
9
.32
<.05
<.05
0.28 .2
9
<.05
<.05 .2
2
.22
<.20
<.20 .2
9
.33
<.05
<.05 .2
6
.27
<.20
<.20 .2
6
.25
<.20
<.20 .3
1
.29
E.0
3
<.05
0.28 .2
9
<.05
<.05 .3
1
.20
<.20
<.20 .3
0
.33
<.05
<.05 .2
7
.24
<.20
<.20 .2
7
.24
<.20
<.20 .2
9
.30
E.0
4
E.0
3
0.26 .2
6
<.10
<.10 .3
2
.21
<.40
<.40 .3
6
.35
<.10
<.10 .2
9
.25
<.40
<.40 .2
6
.27
<.40
<.40 .3
2
.28
E.0
3
<.10
0.28 .2
9
<.05
<.05 .2
0
.25
<.20
<.20 .2
9
.35
<.05
<.05 .2
6
.28
<.20
<.20 .2
6
.28
<.20
<.20 .2
9
.29
E.0
3
<.05
0.27 .3
0
<.05
<.05 .2
8
.21
<.20
<.20 .3
2
.36
<.05
<.05 .3
1
.23
<.20
<.20 .2
7
.30
<.20
<.20 .2
8
.28
E.0
3
E.0
3
0.26 .2
7
<.05
<.05 .2
5
.24
<.20
<.20 .2
8
.28
<.05
<.05 .2
5
E.1
8
<.20
<.20 .2
7
.28
<.20
<.20 .2
8
.27
E.0
3
E.0
3
3.3
4.9
-- 16.8
10.1
9.1
8.3
- _ 7.8
E13
.6
-- - 2.9
7.5
-- -- 5.1
5.6
_
0.03
1
.375
.219
~
.687
.453
.999
.999

Tabl
e 2.
R
esul
ts o
f re
plic
ate-
sam
ple
anal
ysis
for
vola
tile
orga
nic
com
poun
ds (
VO
Cs)
dur
ing
labo
rato
ry a
nd f
ield
tes
ting
of s
elec
ted
sam
plin
g eq
uipm
ent C
ontin
ued
[IU
PAC
, In
tern
atio
nal
Uni
on o
f Pu
re a
nd A
pplie
d C
hem
istr
y.
Sam
ple
type
: PS
L,
sam
ple
colle
cted
in
the
labo
rato
ry w
ith t
he V
OC
poi
nt s
ampl
er;
SSL
, sam
ple
colle
cted
in th
e la
bora
tory
with
the
gla
ss-s
ipho
n sa
mpl
er;
PSF,
sam
ple
colle
cted
in t
he f
ield
with
the
VO
C p
oint
sam
pler
; H
DF,
sam
ple
colle
cted
in
the
fiel
d by
han
d-di
ppin
g m
etho
d; %
RSD
, per
cent
age
of re
lativ
e st
anda
rd d
evia
tion;
p-v
alue
, st
atis
tical
m
easu
re o
f di
ffer
ence
bet
wee
n sa
mpl
ing
met
hods
det
erm
ined
by
sign
test
; ,
not
cal
cula
ted;
<, n
ot d
etec
ted
in th
e sa
mpl
e; E
, est
imat
ed;
**,
poss
ible
con
tam
inan
t in
spi
king
sol
utio
n]
IUPA
C co
mpo
und
nam
e Sa
mpl
e ty
pe
Con
cent
ratio
n, in
mic
rogr
ams
per
liter
Rep
licat
e sa
mpl
e nu
mbe
r
12
34
56
7
% R
SD2-
side
d p-
valu
e
Tar
get a
naly
tes C
ontin
ued
1 , 1
,2-T
rich
loro
etha
ne
Tri
chlo
roet
hene
Tri
chlo
rofl
uoro
met
hane
Tri
chlo
rom
etha
ne
1 ,2,
3-T
rich
loro
prop
ane
1 ,2,
4-T
rim
ethy
lben
zene
PSL
SSL
PSF
HD
F
PSL
SSL
PSF
HD
F
PSL
SSL
PSF
HD
F
PSL
SSL
PSF
HD
F
PSL
SSL
PSF
HD
F
PSL
SSL
PSF
HD
F
0.33
.28
<.10
<.10 .2
6
.27
<.31
<.33 .3
5
.41
<.10
<.10 .3
1
.29
1.0
1.0 .2
8
.26
<.20
<.20 .2
1
.21
.51
.50
0.27
.33
<.10
<.10 .2
6
.28
<.33
<.33 .3
6
.40
<.10
<.10 .3
0
.30
1.1
1.1 .3
2
.27
<.20
<.20 .2
5
.18
.53
.51
0.25 .2
7
<.10
<.10 .2
9
.28
<.35
<.30 .3
9
.40
<.10
<.10 .2
9
.28
1.1
1.1 .3
1
.34
<.20
<.20 .2
4
.22
.49
.47
0.31
.31
<.2
0
<.20 .2
9
.27
<.32
<.36 .3
7
.38
<.20
<.20 .2
8
.31
1.0
1.1 .3
1
.34
<.40
<.40 .2
4
.22
.49
.51
0.28
.26
<.1
0
<.10 .2
4
.26
<.32
<.28 .3
6
.38
<.1
0
<.10 .2
9
.30
1.0
1.0 .3
0
.30
<.2
0
<.20 .2
3
.20
.45
.44
0.26 .3
3
<.10
<.10 .2
6
.26
<.28
<.30 .3
8
.40
<.10
<.10 .2
8
.29
1.0
1.0 .29
.32
<.20
<.20 .2
4
.22
.47
.45
0.32
.28
<.10
<.10 .2
7
.26
<.30
<.33 .3
3
.34
<.10
<.10 .2
9
.27
1.1 1.0 .28
.26
<.20
<.20 .2
4
.21
.48
.46
10.8
9.8
- -- 6.7
3.4
-- -- 5.4
6.1
- -- 3.7
4.6
5.3
12.0
-- - 5.4
7.0
0.99
9
.999
~~
.016
.999
.999
.999
.031
.125
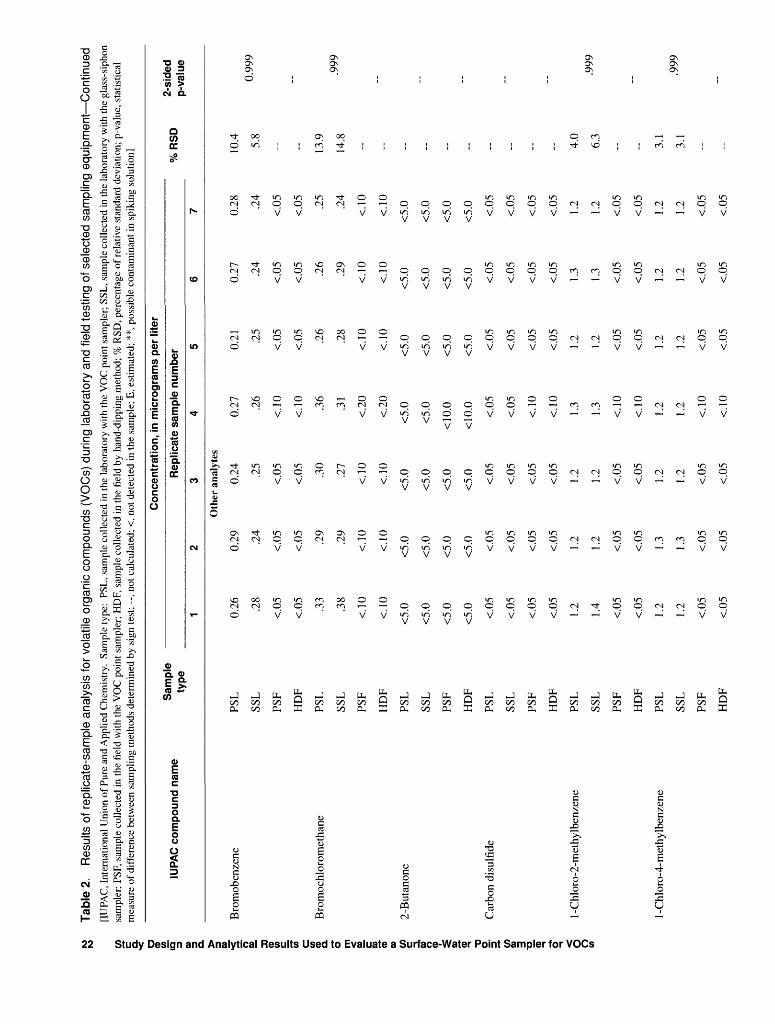
w Q.
Tab
le 2
. R
esul
ts o
f re
plic
ate-
sam
ple
anal
ysis
for
vol
atile
org
anic
com
poun
ds (
VO
Cs)
dur
ing
labo
rato
ry a
nd f
ield
tes
ting
of s
elec
ted
sam
plin
g e
qu
ipm
en
t C
on
tinu
ed
[IU
PAC
, Int
erna
tiona
l U
nion
of P
ure
and
App
lied
Che
mis
try.
Sa
mpl
e ty
pe:
PSL
, sam
ple
colle
cted
in th
e la
bora
tory
with
the
VO
C p
oint
sam
pler
; SS
L, s
ampl
e co
llect
ed in
the
labo
rato
ry w
ith th
e gl
ass-
siph
on
sam
pler
; PS
F, s
ampl
e co
llect
ed i
n th
e fi
eld
with
the
VO
C p
oint
sam
pler
; H
DF,
sam
ple
colle
cted
in
the
fiel
d by
han
d-di
ppin
g m
etho
d; %
RSD
, per
cent
age
of re
lativ
e st
anda
rd d
evia
tion;
p-v
alue
, st
atis
tical
m
easu
re o
f di
ffer
ence
bet
wee
n sa
mpl
ing
met
hods
det
erm
ined
by
sign
tes
t; , n
ot c
alcu
late
d; <
, not
det
ecte
d in
the
sam
ple;
E, e
stim
ated
; **
, pos
sibl
e co
ntam
inan
t in
spi
king
sol
utio
n]
Design and Analyti
cal Results
U (A (D
Q.
0 m 0) c m <$ 0) W 1
o <p » JD TJ
0
E3' i 3 T
J (D o1 O o (A
IUPA
C co
mpo
und
nam
e
Bro
mob
enze
ne
Bro
moc
hlor
orne
than
e
2-B
utan
one
Car
bon
disu
lfid
e
1 -C
hlor
o-2-
met
hylb
enze
ne
1 -C
hlor
o-4-
met
hylb
enze
ne
Sam
ple
type
PSL
SSL
PSF
HD
F
PSL
SSL
PSF
HD
F
PSL
SSL
PSF
HD
F
PSL
SSL
PSF
HD
F
PSL
SSL
PSF
HD
F
PSL
SSL
PSF
HD
F
Con
cent
ratio
n, in
mic
rogr
ams
per
liter
Rep
licat
e sa
mpl
e nu
mbe
r
1 0.26
.28
<.05
<.05 .3
3
.38
<.10
<.10
<5.0
<5.0
<5.0
<5.0 <.05
<.05
<.05
<.05
1.2
1.4
<.05
<.05
1.2
1.2
<.05
<.05
23
Oth
er a
naly
tes
0.29
0.
24
.24
.25
<.05
<.
05
<.05
<.
05
.29
.29
<.10
<.10
<5.0
<5.0
<5.0
<5.0 <.05
<.05
<.05
<.05 1.2
1.2
<.05
<.05
1.3
1.3
<.05
<.05
.30
.27
<.10
<.10
<5.0
<5.0
<5.0
<5.0 <.05
<.05
<.05
<.05
1.2
1.2
<.05
<.05
1.2
1.2
<.05
<.05
4 0.27
.26
.36
.31
<.20
<.20
<5.0
<5.0
<10.
0
<10.
0
<.05
<.05
<.10
<.10
1.3
1.3
<.10
<.10
1.2
1.2
<.10
<.10
5 0.21
.25
<.05
<.05 .2
6
.28
<.10
<.10
<5.0
<5.0
<5.0
<5.0 <.05
<.05
<.05
<.05 1.2
1.2
<.05
<.05
1.2
1.2
<.05
<.05
6 0.27
.24
<.05
<.05 .2
6
.29
<.10
<.10
<5.0
<5.0
<5.0
<5.0 <.05
<.05
<.05
<.05
1.3
1.3
<.05
<.05
1.2
1.2
<.05
<.05
7
% R
SD
0.28
10
.4
.24
5.8
<.05
<.05
< <. <5 <5 <5 <5 <. <. <. <. 1. 1. <. <. 1. 1, <
.25
13.9
.24
14.8
.10
.10
.0 .0 .0 .0 .05
.05
.05
.05
.2
4.0
.2
6.3
.05
.05
.2
3.1
.2
3.1
.05
2-si
ded
p-va
lue
0.99
9
.999
-
.999
.999
<.05

Tabl
e 2.
R
esul
ts o
f re
plic
ate-
sam
ple
anal
ysis
for
vola
tile
orga
nic
com
poun
ds (
VO
Cs)
dur
ing
labo
rato
ry a
nd f
ield
tes
ting
of s
elec
ted
sam
plin
g eq
uipm
ent C
ontin
ued
[IU
PAC
, Int
erna
tiona
l U
nion
of P
ure
and
App
lied
Che
mis
try.
Sa
mpl
e ty
pe:
PSL
, sa
mpl
e co
llect
ed in
the
labo
rato
ry w
ith th
e V
OC
poi
nt s
ampl
er;
SSL
, sam
ple
colle
cted
in t
he l
abor
ator
y w
ith th
e gl
ass-
siph
on
sam
pler
; PS
F, s
ampl
e co
llect
ed in
the
fie
ld w
ith t
he V
OC
poi
nt s
ampl
er;
HD
F, s
ampl
e co
llect
ed in
the
fiel
d by
han
d-di
ppin
g m
etho
d; %
RSD
, per
cent
age
of re
lativ
e st
anda
rd d
evia
tion;
p-v
alue
, st
atis
tical
m
easu
re o
f di
ffer
ence
bet
wee
n sa
mpl
ing
met
hods
det
erm
ined
by
sign
test
; , n
ot c
alcu
late
d; <
, not
det
ecte
d in
the
sam
ple;
E,
estim
ated
; **
, pos
sibl
e co
ntam
inan
t in
spi
king
sol
utio
n]
IUPA
C co
mpo
und
nam
eSa
mpl
e ty
pe
Con
cent
ratio
n, in
mic
rogr
ams
per
liter
Rep
licat
e sa
mpl
e nu
mbe
r
12
34
56
% R
SD
7
2-si
ded
p-va
lue
Oth
er a
naly
tes C
ontin
ued
3-C
hlor
o- 1
-pro
pene
Dib
rom
omet
hane
tram
- 1 ,4
-Dic
hlor
o-2-
bute
ne
1 ,3-
Dic
hlor
opro
pane
2,2-
Dic
hlor
opro
pane
1 ,1 -
Dic
hlor
opro
pene
PSL
SSL
PSF
HD
F
PSL
SSL
PSF
HD
F
PSL
SSL
PSF
HD
F
PSL
SSL
PSF
HD
F
PSL
SSL
PSF
HD
F
PSL
SSL
PSF
HD
F
<0.1
0
<.10
<.10
<.10 .2
9
.31
<.10
<.10
4.6
3.8
<5.0
<5.0 .2
7
.28
<.05
<.05 .1
9
.19
<.05
<.05 .2
6
.30
<.05
<.05
<0.1
0
<.10
<.10
<.10 .3
0
.33
<.10
<.10
4.4
4.1
<5.0
<5.0 .2
8
.32
<.05
<.05 .2
1
.18
<.05
<.05 .2
8
.29
<.05
<.05
<0.1
0
<.10
<.10
<.10 .3
2
.29
<.10
<.10
3.8
4.4
<5.0
<5.0 .2
7
.29
<.05
<.05 .1
7
.19
<.05
<.05 .2
8
.27
<.05
<.05
<0.1
0
<.10
<.20
<.20 .3
1
.34
<.20
<.20
4.0
4.5
<10.
0
<10.
0 .30
.28
<.10
<.10 .1
7
.17
<.10
<.10 .2
8
.28
<.10
<.10
<0.1
0
<.10
<.10
<.10 .3
0
.33
<.10
<.10
4.4
4.4
<5.0
<5.0 .2
9
.26
<.05
<.05 .1
6
.20
<.05
<.05 .2
9
.27
<.05
<.05
<0.1
0
<.10
<.10
<.10 .2
9
.26
<.10
<.10
4.5
4.5
<5.0
<5.0 .2
9
.33
<.05
<.05 .1
6
.19
<.05
<.05 .2
8
.28
<.05
<.05
<0.1
0
<.10
<.10
<.10 .2
6 6.
4
.23
13.7
<.10
<.10
4.1
6.9
3.6
8.7
<5.0
<5.0 .2
9 4.
0
.26
9.5
<.05
<.05 .1
9 10
.4
.16
7.6
<.05
<.05 .2
8 3.
2
.27
4.1
<.05
<.05
" 0.99
9
.999
~
.999
.999
.999
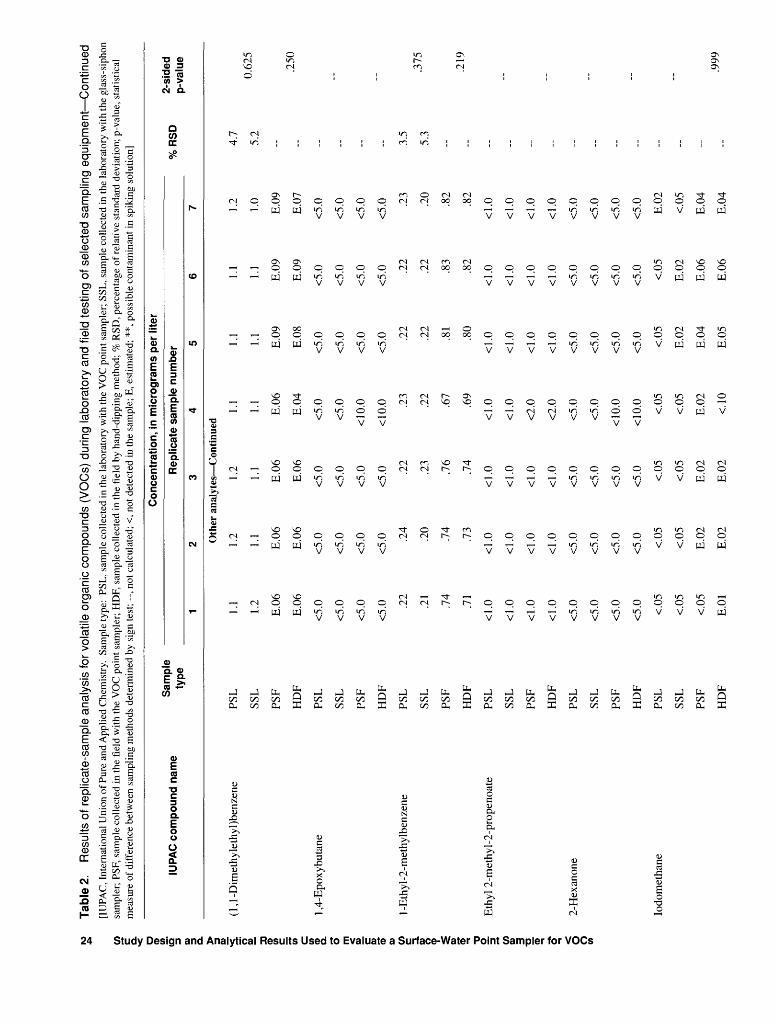
CO
Q.
Tabl
e 2.
R
esul
ts o
f re
plic
ate-
sam
ple
anal
ysis
for
vola
tile
orga
nic
com
poun
ds (
VO
Cs)
dur
ing
labo
rato
ry a
nd f
ield
tes
ting
of s
elec
ted
sam
plin
g eq
uipm
ent C
ontin
ued
[IU
PAC
, Int
erna
tiona
l Uni
on o
f Pur
e an
d A
pplie
d C
hem
istr
y.
Sam
ple
type
: PS
L, s
ampl
e co
llect
ed in
the
lab
orat
ory
with
the
VO
C p
oint
sam
pler
; SS
L, s
ampl
e co
llect
ed in
the
lab
orat
ory
with
the
glas
s-si
phon
sa
mpl
er;
PSF,
sam
ple
colle
cted
in
the
fiel
d w
ith th
e V
OC
poi
nt s
ampl
er;
HD
F, s
ampl
e co
llect
ed in
the
fie
ld b
y ha
nd-d
ippi
ng m
etho
d; %
RSD
, pe
rcen
tage
of r
elat
ive
stan
dard
dev
iatio
n; p
-val
ue,
stat
istic
al
mea
sure
of
diff
eren
ce b
etw
een
sam
plin
g m
etho
ds d
eter
min
ed b
y si
gn t
est;
, n
ot c
alcu
late
d; <
, not
det
ecte
d in
the
sam
ple;
E,
estim
ated
; **
, pos
sibl
e co
ntam
inan
t in
spi
king
sol
utio
n]
O (D
(0 to'
3
D> E.
IUPA
C co
mpo
und
nam
eSa
mpl
e ty
pe
Con
cent
ratio
n, in
mic
rogr
ams
per
liter
Rep
licat
e sa
mpl
e nu
mbe
r
12
34
56
% R
SD
7
2-si
ded
p-va
lue
^
Oth
er a
naly
tes C
onti
nued
CD.
"< 8 DO 1 w C (0 (D
Q.
0 m CD C 0) <D D> CO 1 ? <D t -o 0 3J w 3 o <D 3- O o (0
(1 ,l
-Dim
ethy
leth
yl)b
enze
ne
1 ,4-
Epo
xybu
tane
1 -E
thyl
-2-m
ethy
lben
zene
Eth
yl 2
-met
hyl-
2-pr
open
oate
2-H
exan
one
lodo
met
hane
PSL
SSL
PSF
HD
F
PSL
SSL
PSF
HD
F
PSL
SSL
PSF
HD
F
PSL
SSL
PSF
HD
F
PSL
SSL
PSF
HD
F
PSL
SSL
PSF
HD
F
1.1 1.2
E.0
6
E.0
6
<5.0
<5.0
<5.0
<5.0 .2
2
.21
.74
.71
<1.0
<1.0
<1.0
<1.0
<5.0
<5.0
<5.0
<5.0 <.05
<.05
<.05
E.01
1.2
1.1 E.0
6
E.0
6
<5.0
<5.0
<5.0
<5.0 .2
4
.20
.74
.73
<1.0
<1.0
<1.0
<1.0
<5.0
<5.0
<5.0
<5.0 <.05
<.05
E.0
2
E.0
2
1.2
1.1 E.0
6
E.0
6
<5.0
<5.0
<5.0
<5.0 .2
2
.23
.76
.74
<1.0
<1.0
<1.0
<1.0
<5.0
<5.0
<5.0
<5.0 <.05
<.05
E.0
2
E.0
2
1.1 1.1 E.0
6
E.0
4
<5.0
<5.0
<10.
0
<10.
0 .23
.22
.67
.69
<1.0
<1.0
<2.0
<2.0
<5.0
<5.0
<10.
0
<10.
0
<.05
<.05
E.0
2
<.10
1.1 1.1 E.09
E.08
<5.0
<5.0
<5.0
<5.0 .2
2
.22
.81
.80
<1.0
<1.0
<1.0
<1.0
<5.0
<5.0
<5.0
<5.0 <.05
E.0
2
E.0
4
E.05
1.1 1.1 E.0
9
E.09
<5.0
<5.0
<5.0
<5.0 .2
2
.22
.83
.82
<1.0
<1.0
<1.0
<1.0
<5.0
<5.0
<5.0
<5.0 <.05
E.0
2
E.0
6
E.0
6
1.2
4.7
1.0
5.2
E.09
E.07
<5.0
<5.0
<5.0
<5.0 .2
3 3.
5
.20
5.3
.82
.82
<1.0
<1.0
<1.0
<1.0
<5.0
<5.0
<5.0
<5.0
E.0
2
<.05
E.0
4
E.0
4
0.62
5
.250
.375
.219
.999

Tabl
e 2.
R
esul
ts o
f re
plic
ate-
sam
ple
anal
ysis
for
vola
tile
orga
nic
com
poun
ds (
VO
Cs)
dur
ing
labo
rato
ry a
nd f
ield
test
ing
of s
elec
ted
sam
plin
g eq
uipm
ent C
ontin
ued
[IU
PAC
, Int
erna
tiona
l U
nion
of P
ure
and
App
lied
Che
mis
try.
Sa
mpl
e ty
pe:
PSL
, sa
mpl
e co
llect
ed in
the
lab
orat
ory
with
the
VO
C p
oint
sam
pler
; SS
L, s
ampl
e co
llect
ed in
the
labo
rato
ry w
ith t
he g
lass
-sip
hon
sam
pler
; PS
F, s
ampl
e co
llect
ed in
the
fie
ld w
ith t
he V
OC
poi
nt s
ampl
er;
HD
F, s
ampl
e co
llect
ed in
the
fiel
d by
han
d-di
ppin
g m
etho
d; %
RSD
, per
cent
age
of re
lativ
e st
anda
rd d
evia
tion;
p-v
alue
, st
atis
tical
m
easu
re o
f dif
fere
nce
betw
een
sam
plin
g m
etho
ds d
eter
min
ed b
y si
gn te
st; , n
ot c
alcu
late
d; <
, not
det
ecte
d in
the
sam
ple;
E, e
stim
ated
; **
, pos
sibl
e co
ntam
inan
t in
spik
ing
solu
tion]
jy <D
IUPA
C co
mpo
und
nam
eSa
mpl
eC
once
ntra
tion,
in m
icro
gram
s pe
r lit
er
Rep
licat
e sa
mpl
e nu
mbe
r
12
34
56
% R
SD
*'S'7
a p-
valu
e7
Oth
er a
naly
tes C
ontin
ued
1 -Is
opro
pyl-
4-m
ethy
lben
zene
Met
hyl
2-m
ethy
l-2-
prop
enoa
te
4-M
ethy
l-2-
pent
anon
e
2-M
ethy
l-2-
prop
enen
itrile
Met
hyl-
2-pr
open
oate
( 1 -M
ethy
lpro
pyl)
benz
ene
PSL
SSL
PSF
HD
F
PSL
SSL
PSF
HD
F
PSL
SSL
PSF
HD
F
PSL
SSL
PSF
HD
F
PSL
SSL
PSF
HD
F
PSL
SSL
PSF
HD
F
0.22 .2
4
E.0
8
E.0
9
<1.0
<1.0
<1.0
<1.0
<5.0
<5.0
<5.0
<5.0
<2.0
<2.0
<2.0
<2.0
<2.0
<2.
0
<2.0
<2.0 1.1
1.2 .3
9
.38
0.24 .2
1
E.0
8
E.0
6
<1.0
<1.0
<1.0
<1.
0
<5.0
<5.0
<5.
0
<5.0
<2.
0
<2.0
<2.0
<2.0
<2.0
<2.0
<2.0
<2.0 1.2
1.1 .4
0
.40
0.23 .2
3
E.0
8
E.0
7
<1.0
<1.0
<1.0
<1.0
<5.0
<5.0
<5.0
<5.0
<2.0
<2.0
<2.0
<2.0
<2.0
<2.
0
<2.0
<2.0 1.2
1.2 .3
9
.41
0.23 .2
4
E.0
7
E.0
7
<1.0
<1.0
<2.0
<2.0
<5.0
<5.0
<10.
0
<10.
0
<2.0
<2.0
<4.0
<4.
0
<2.0
<2.0
<4.0
<4.0 1.2
1.2 .3
9
.37
0.23 .2
1
E.0
7
E.0
8
<1.0
<1.0
<1.0
<1.0
<5.0
<5.0
<5.0
<5.0
<2.0
<2.0
<2.0
<2.
0
<2.0
<2.
0
<2.0
<2.0 1.2
1.2 .5
3
.53
0.22 .2
3
E.0
8
E.0
9
<1.0
<1.0
<1.0
<1.0
<5.0
<5.0
<5.0
<5.0
<2.0
<2.0
<2.0
<2.0
<2.0
<2.0
<2.0
<2.0 1.1
1.2 .5
2
.52
0.23
3.
009
99.2
2 5.
6 U
'yyy
E.0
899
9 E
.08
--
^
<1.0
<1.0
<1.0
<1.0
<5.0
<5.0
<5.0
<5.0
<2.0
<2.0
<2.0
<2.0
<2.0
<2.0
<2.0
<2.0 1.2
4.2
999
1.1
4.2
>Wy
.54
999
.54
-
-yw

Tabl
e 2.
R
esul
ts o
f re
plic
ate-
sam
ple
anal
ysis
for
vol
atile
org
anic
com
poun
ds (
VO
Cs)
dur
ing
labo
rato
ry a
nd fi
eld
test
ing
of s
elec
ted
sam
plin
g eq
uipm
ent C
ontin
ued
[IU
PAC
, Int
erna
tiona
l U
nion
of P
ure
and
App
lied
Che
mis
try.
Sa
mpl
e ty
pe:
PSL
, sam
ple
colle
cted
in th
e la
bora
tory
with
the
VO
C p
oint
sam
pler
; SS
L, s
ampl
e co
llect
ed in
the
labo
rato
ry w
ith t
he g
lass
-sip
hon
Study
Design and
sam
pler
; PS
F, s
ampl
e co
llect
ed i
n th
e fi
eld
with
the
VO
C p
oint
sam
pler
; H
DF,
sam
ple
colle
cted
in
the
fiel
d by
han
d-di
ppin
g m
etho
d; %
RSD
, per
cent
age
of re
lativ
e st
anda
rd d
evia
tion;
p-v
alue
, st
atis
tical
m
easu
re o
f di
ffer
ence
bet
wee
n sa
mpl
ing
met
hods
det
erm
ined
by
sign
tes
t; ,
not
calc
ulat
ed;
<, n
ot d
etec
ted
in th
e sa
mpl
e; E
, est
imat
ed;
**, p
ossi
ble
cont
amin
ant
in s
piki
ng s
olut
ion]
IUPA
C co
mpo
und
nam
eSa
mpl
e ty
pe
Con
cent
ratio
n, in
mic
rogr
ams
per
liter
Rep
licat
e sa
mpl
e nu
mbe
r
12
34
56
7
% R
SD2-
side
d p-
valu
e
^
Oth
er a
naly
tes C
onti
nued
o> 5. £ 30 c en C Q.
0 m E" o> <S i i(0 i TJ
0 i 3 o (0 31 o o (0
l,l'-
Oxy
bise
than
e
** 2
-Pro
pano
ne
1,1,
1 ,2
-Tet
rach
loro
etha
ne
1 ,1
,2,2
-Tet
rach
loro
etha
ne
1 ,2,
3,4-
Tet
ram
ethy
lben
zene
1 ,2,
3,5-
Tet
ram
ethy
lben
zene
PSL
SSL
PSF
HD
F
PSL
SSL
PSF
HD
F
PSL
SSL
PSF
HD
F
PSL
SSL
PSF
HD
F
PSL
SSL
PSF
HD
F
PSL
SSL
PSF
HD
F
<0.1
0
<.10
<.10
< 10
E11
.6
E14
.0
<5.0 6.7 .3
0
.25
<.05
<.05 .2
8
.31
<.10
<.10
E.21 .2
1
<.86
<.78
E.1
2
E.l
l
.17
.17
<0.1
0
<.10
<.10
<.10
E9.
7
Ell
.l 6.1
6.6 .2
8
.30
<.05
<.05 .3
0
.35
<.10
<.10
E.2
9
.19
<.80
<.82
E.1
8
E.l
l
.15
.15
<0.1
0
E.1
2
<.1
0
< 10
E10
.6
E11
.4 6.3
6.3 .3
2
.29
<.05
<.05 .2
5
.30
<.10
<.10 .2
4
.25
<.78
<.73
E.1
7
E.1
4
.15
.13
<0.1
0
E.l
l
<.20
<.20
E10
.0
E11
.6 6.5
5.7 .3
1
.32
<.10
<.10 .2
9
.30
<.20
<.20 .2
7
.23
<.86
<.91
E.1
7
E.1
5
.19
.20
<0.1
0
E.l
l
<.10
< 10
E10
.1
E12
.2
10.2
11.8 .2
8
.26
<.05
<.05 .2
9
.32
<.10
<.10 .2
8
.24
<.91
<.89
E.1
9
E.1
3
<.05 .1
2
<0.1
0
<.10
<.10
< 10
E10
.9
E10
.6
20.6
19.2 .2
7
.26
<.05
<.05 .2
9
.26
<.10
<.10 .3
0
.27
<.92
<.8
6
E.1
7
E.1
5
<.05
<.05
<0.1
0
E.0
9
<.10
< 10
E9.
3
E9.
4
12.3
12.2 .2
5
.26
<.05
<.05 .3
0
.28
<.10
<.10
E.3
0
.26
<1.0 <.96
E.1
8
E.1
4
.16
<.05
- - E7.
5
El 2
.4
- 8.5
9.5
_ __ 6.0
9.5
_ --
E12
.5
12.0
-- --
E13
.5
E12
.8
_
-- - 0.12
5
.999
.999
""
.453
.219
.016
.999
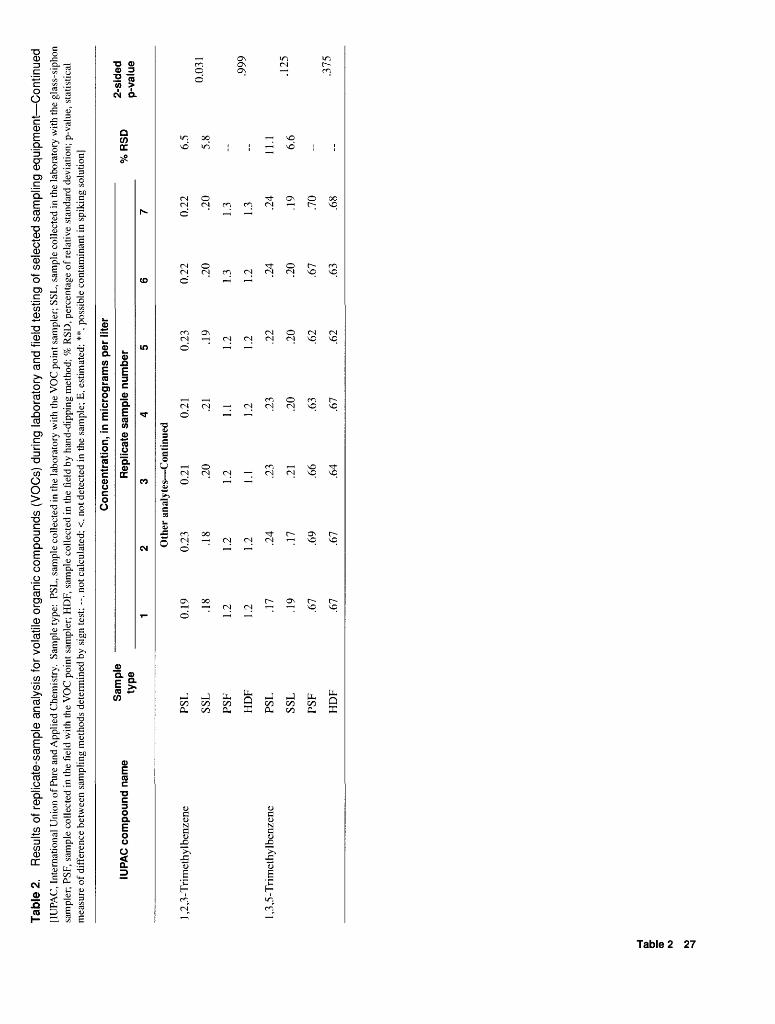
Tabl
e 2.
R
esul
ts o
f re
plic
ate-
sam
ple
anal
ysis
for
vola
tile
orga
nic
com
poun
ds (
VO
Cs)
dur
ing
labo
rato
ry a
nd f
ield
tes
ting
of s
elec
ted
sam
plin
g eq
uipm
ent C
ontin
ued
[IU
PAC
, Int
erna
tiona
l U
nion
of
Pure
and
App
lied
Che
mis
try.
Sa
mpl
e ty
pe:
PSL
, sam
ple
colle
cted
in th
e la
bora
tory
with
the
VO
C p
oint
sam
pler
; SS
L, s
ampl
e co
llect
ed i
n th
e la
bora
tory
with
the
glas
s-si
phon
sa
mpl
er;
PSF,
sam
ple
colle
cted
in
the
fiel
d w
ith t
he V
OC
poi
nt s
ampl
er;
HD
F, s
ampl
e co
llect
ed in
the
fie
ld b
y ha
nd-d
ippi
ng m
etho
d; %
RSD
, per
cent
age
of re
lativ
e st
anda
rd d
evia
tion;
p-v
alue
, st
atis
tical
m
easu
re o
f di
ffer
ence
bet
wee
n sa
mpl
ing
met
hods
det
erm
ined
by
sign
tes
t; --
, not
cal
cula
ted;
<, n
ot d
etec
ted
in t
he s
ampl
e; E
, est
imat
ed;
**, p
ossi
ble
cont
amin
ant i
n sp
ikin
g so
lutio
n]
IUPA
C co
mpo
und
nam
eSa
mpl
e ty
pe
Con
cent
ratio
n, in
mic
rogr
ams
per
liter
Rep
licat
e sa
mpl
e nu
mbe
r
12
34
56
% R
SD
7
2-si
ded
p-va
lue
Oth
er a
naly
tes C
onti
nued
1 1,2,3
-Tri
met
hylb
enze
ne
,3,5
-Tri
met
hylb
enze
ne
PSL
SSL
PSF
HD
F
PSL
SSL
PSF
HD
F
0.19 .1
8
1.2
1.2 .1
7
.19
.67
.67
0.23 .1
8
1.2
1.2 .2
4
.17
.69
.67
0.21 .2
0
1.2
1.1 .2
3
.21
.66
.64
0.21 .2
1
1.1
1.2 .2
3
.20
.63
.67
0.23 .1
9
1.2
1.2 .2
2
.20
.62
.62
0.22 .2
0
1.3
1.2 .2
4
.20
.67
.63
0.22
6.
5
.20
5.8
1.3
1.3 .2
4 11
.1
.19
6.6
.70
.68
0.03
1
.999
.125
.375
01 o; <D
10

Tabl
e 3.
R
esul
ts o
f qua
lity-
cont
rol s
ampl
e an
alys
is f
or v
olat
ile o
rgan
ic c
ompo
unds
dur
ing
labo
rato
ry a
nd f
ield
tes
ting
of s
elec
ted
surfa
ce-w
ater
sam
plin
g eq
uipm
ent
tn
[IU
PAC
, Int
erna
tiona
l U
nion
of P
ure
and
§_
HC
CB
, hig
h-co
ncen
trat
ion
cani
ster
bla
nk
CD
IUPA
C co
mpo
und
nam
e3
CD 3 Q
.
3 ,ST
Ben
zene
8 B
rom
odic
hlor
omet
hane
o B
rom
oeth
ene
tn %
Bro
mom
etha
ne
w n-
But
ylbe
nzen
e
o C
hlor
oben
zene
m g C
hlor
oeth
ane
E"
Si
Chl
oroe
then
e
^
Chl
orom
etha
nec 5}-
1 ,
2-D
ibro
mo-
3-ch
loro
prop
ane
o ^
Dib
rom
ochl
orom
etha
neCD o
1 ,2-
Dib
rom
oeth
ane
o 1 ,
2-D
ichl
orob
enze
ne5' JJ)
1 ,
3-D
ichl
orob
enze
neCD ^
1 ,4-
Dic
hlor
oben
zene
^.
Dic
hlor
odif
luor
omet
hane
0 <
1,1
-Dic
hlor
oeth
ane
O $
1 ,2-
Dic
hlor
oeth
ane
1 ,1 -
Dic
hlor
oeth
ene
cis-
1 ,2
-Dic
hlor
oeth
ene
tran
s- 1
,2-D
ichl
oroe
then
e
Dic
hlor
omet
hane
1 ,2-
Dic
hlor
opro
pane
cis-
1 ,3
-Dic
hlor
opro
pene
tran
s-l ,
3-D
ichl
orop
rope
ne
App
lied
Che
mis
try;
SSB
, so
urce
-sol
utio
n bl
ank;
IC
B,
initi
al c
anis
ter
blan
k;
; HC
EB
, hig
h-co
ncen
trat
ion
equi
pmen
t bla
nk;
<, n
ot d
etec
ted
in t
he s
ampl
e;
Con
cent
ratio
ns in
lab
orat
ory
blan
ks.
SSB
ICB
IEB
FCB
IEB
, ini
tial
eqi
E, e
stim
ated
]iip
men
t bl
ank;
, in
mic
rogr
ams
per
liter
FEB
HCC
BH
CEB
FCB
, fin
al c
anis
ter
blan
k; F
E:B,
fin
al e
quip
rrle
nt b
lank
;
Con
cent
ratio
ns in
fie
ld b
lank
s,
in m
icro
gram
s pe
r lit
er
ICB
IEB
FC
BF
EB
Tar
get
anal
ytes
<0.0
5
<.10
<.10
<.10
<.05
<.05
<.10
<.10
<.20
<.50
<.10
<.10
<.05
<.05
<.05
<.20
<.05
<.05
<.10
<.05
<.05
<.10
<.05
<.10
<.10
<0.0
5
<.10
<.10
<.10
<.05
<.05
<.10
<.10
<.20
<.50
<.10
<.10
<.05
<.05
<.05
<.20
<.05
<.05
<.10
<.05
<.05
<.10
<.05
<.10
<.10
<0.0
5
<.10
<.10
<.10
<.05
E.01
<.10
<.10
<.20
<.50
<.10
<.10
<.05
<.05
<.05
<.20
<.05
<.05
<.10
<.05
<.05
<.10
<.05
<.10
<.10
<0.0
5
<.10
<.10
<.10
<.05
<.05
<.10
<.10
<.20
<.50
<.10
<.10
<.05
<.05
<.05
<.20
<.05
<.05
<.10
<.05
<.05
<.10
<.05
<.10
<.10
<0.0
5
<.10
<.10
<.10
<.05
<.05
<.10
<.10
<.20
<.50
<.10
<.10
<.05
<.05
<.05
<.20
<.05
<.05
<.10
<.05
<.05
<.10
<.05
<.10
<.10
<0.0
5
<.10
<.10
<.10
<.05
<.05
<.10
<.10
<.20
<.50
<.10
<.10
<.05
<.05
<.05
<.20
<.05
<.05
<.10
<.05
<.05
<.10
<.05
<.10
<.10
<0.0
5
<.10
<.10
<.10
<.05
<.05
<.10
<.10
<.20
<.50
<.10
<.10
<.05
<.05
<.05
<.20
<.05
<.05
<.10
<.05
<.05
<.10
<.05
<.10
<.10
<0.0
5
<.10
<.10
<.10
<.05
<.05
<.10
<.10
<.20
<.50
<.10
<.10
<.05
<.05
<.05
<.20
<.05
<.05
<.10
<.05
<.05
<.10
<.05
<.10
<.10
<0.0
5
<.10
<.10
<.10
<.05
<.05
<.10
<.10
<.20
<.50
<.10
<.10
<.05
<.05
<.05
<.20
<.05
<.05
<.10
<.05
<.05
<.10
<.05
<.10
<.10
<0.0
5
<.10
<.10
<.10
<.05
<.05
<.10
<.10
<.20
<.50
<.10
<.10
<.05
<.05
<.05
<.20
<.05
<.05
<.10
<.05
<.05
<.10
<.05
<.10
<.10
<0.0
5
<.10
<.10
<.10
<.05
<.05
<.10
<.10
<.20
<.50
<.10
<.10
<.05
<.05
<.05
<.20
<.05
<.05
<.10
<.05
<.05
<.10
<.05
<.10
<.10

0) cr
Tabl
e 3.
R
esul
ts o
f qua
lity-
cont
rol s
ampl
e an
alys
is f
or v
olat
ile o
rgan
ic c
ompo
unds
dur
ing
labo
rato
ry a
nd f
ield
test
ing
equi
pmen
t C
ontin
ued
[IU
PAC
, Int
erna
tiona
l U
nion
of
Pure
and
App
lied
Che
mis
try;
SSB
, so
urce
-sol
utio
n bl
ank;
IC
B,
initi
al c
anis
ter
blan
k; I
EB
, in
itial
equ
ipm
ent
blan
k;
HC
CB
, hig
h-co
ncen
trat
ion
cani
ster
bla
nk;
HC
EB
, hig
h-co
ncen
trat
ion
equi
pmen
t bla
nk;
<, n
ot d
etec
ted
in t
he s
ampl
e; E
, est
imat
ed]
of s
elec
ted
surfa
ce-w
ater
sam
plin
g
FCB
, fin
al c
anis
ter
blan
k; F
EB
, fin
al e
quip
men
t bl
ank;
IUPA
C co
mpo
und
nam
eC
once
ntra
tion
s in
lab
orat
ory
blan
ks,
SSB
ICB
IEB
FCB
, in
mic
rogr
ams
per
liter
FEB
HC
CB
HC
EB
Con
cent
rati
ons
in f
ield
bla
nks,
in
mic
rogr
ams
per
liter
ICB
IEB
FCB
FEB
Tar
get
anal
ytes
C
onti
nued
1 ,2-
Dim
ethy
lben
zene
1,3-
and
1 ,4
-Dim
ethy
lben
zene
Eth
enyl
benz
ene
2-E
thox
y-2-
met
hylp
ropa
ne
Eth
ylbe
nzen
e
1,1,
2,3
,4,4
-Hex
achl
oro-
1 ,3
-but
adie
ne
1 , 1
,1 ,2
,2,2
-Hex
achl
oroe
than
e
2-M
etho
xy-2
-met
hylb
utan
e
2-M
etho
xy-2
-met
hylp
ropa
ne
Met
hylb
enze
ne
(1 -M
ethy
leth
yl)b
enze
ne
Nap
htha
lene
2,2
' -O
xybi
s [pr
opan
e]
2-Pr
open
al
2-Pr
open
enitr
ile
n-Pr
opyl
benz
ene
Tet
rach
l oro
ethe
ne
Tet
rach
loro
met
hane
Tri
brom
omet
hane
1 , 1
,2-T
rich
loro
- 1 ,2
,2-t
rifl
uoro
etha
ne
1 ,2,
3-T
rich
loro
benz
ene
1 ,2,
4-T
rich
loro
benz
ene
1,1,
1 -T
rich
loro
e tha
ne
1 , 1
,2-T
rich
loro
etha
ne
Tri
chlo
roet
hene
<0.0
5
<.05
<.05
<.10
<.05
<.20
<.05
<.10
<.05
<.05
<.20
<.10
<2.0
<2.0 <.05
<.05
<.05
<.20
<.05
<.20
<.20
<.05
<.1
0
<.05
<0.0
5
<.05
<.05
<.10
<.05
<.20
<.05
<.10
<.05
<.05
<.20
<.10
<2.0
<2.0
<.05
<.05
<.05
<.2
0
<.05
<.2
0
<.2
0
<.05
<.1
0
<.05
<0.0
5
<.05
<.05
<.10
<.05
E.0
4
<.05
<.1
0
<.05
<.05
<.20
<.10
<2.0
<2.0
<.05
<.05
<.05
<.2
0
<.05
<.2
0
<.2
0
<.05
<.1
0
<.05
<0.0
5
<.05
<.05
<.10
<.05
<.20
<.05
<.10
<.05
<.05
<.20
<.1
0
<2.
0
<2.0 <.05
<.05
<.05
<.20
<.05
<.20
<.20
<.05
<.1
0
<.05
<0.0
5
<.05
<.05
<.10
<.05
<.20
<.05
<.10
<.05
<.05
<.20
<.10
<2.0
<2.0 <.05
<.05
<.05
<.20
<.05
<.20
<.20
<.05
<.10
<.05
<0.0
5
<.05
<.05
<.10
<.05
<.2
0
<.05
<.1
0
<.05
<.05
<.20
<.10
<2.0
<2.
0
<.05
<.05
<.05
<.20
<.05
<.2
0
<.2
0
<.05
<.1
0
<.05
<0.0
5
<.05
<.05
<.10
<.05
<.20
<.05
<.10
<.05
<.05
<.20
<.10
<2.0
<2.
0
<.05
<.05
<.05
<.20
<.05
<.20
<.20
<.05
<.1
0
<.05
<0.0
5
<.05
<.05
<.10
<.05
<.20
<.05
<.10
<.05
<.05
<.2
0
<.10
<2.0
<2.0
<.05
<.05
<.05
<.20
<.05
<.20
<.20
<.05
<.1
0
<.05
<0.0
5
<.05
<.05
<.1
0
<.05
<.2
0
<.05
<.1
0
<.05
<.05
<.2
0
<.1
0
<2.0
<2.
0
<.05
<.05
<.05
<.2
0
<.05
<.2
0
<.2
0
<.05
<.1
0
<.05
<0.0
5
<.05
<.05
<.10
<.05
<.20
<.05
<.10
<.05
<.05
<.20
<.10
<2.0
<2.0 <.05
<.05
<.05
<.20
<.05
<.20
<.20
<.05
<.10
<.05
<0.0
5
<.05
<.05
<.1
0
<.05
<.2
0
<.05
<.10
<.05
<.05
<.2
0
<.10
<2.
0
<2.0 <.05
<.05
<.05
<.2
0
<.05
<.2
0
<.2
0
<.05
<.1
0
<.05

(/)
Tabl
e 3.
R
esul
ts o
f qua
lity-
cont
rol s
ampl
e an
alys
is f
or v
olat
ile o
rgan
ic c
ompo
unds
dur
ing
labo
rato
ry a
nd f
ield
tes
ting
equi
pmen
t Con
tinue
d[I
UPA
C, I
nter
natio
nal
Uni
on o
f Pu
re a
nd A
pplie
d C
hem
istr
y; S
SB,
sour
ce-s
olut
ion
blan
k; I
CB
, in
itial
can
iste
r bl
ank;
IE
B,
initi
al e
quip
men
t bla
nk;
HC
CB
, hig
h-co
ncen
trat
ion
cani
ster
bla
nk;
HC
EB
, hig
h-co
ncen
trat
ion
equi
pmen
t bla
nk;
<, n
ot d
etec
ted
in th
e sa
mpl
e; E
, est
imat
ed]
of s
elec
ted
surf
ace-
wat
er s
ampl
ing
FCB
, fin
al c
anis
ter
blan
k; F
EB
, fi
nal
equi
pmen
t bla
nk;
O
0> <E'
IUPA
C co
mpo
und
nam
e0) 3 Q
.
JJ-
Tri
chlo
rofl
uoro
met
hane
8 T
rich
loro
met
hane
n> 1 ,
2,3-
Tri
chlo
ropr
opan
ec jj
1 ,
2,4-
Tri
met
hylb
enze
ne
f Q. g-
Bro
mob
enze
ne
< B
rom
ochl
orom
etha
ne
2.
2-B
utan
one
o> " C
arbo
n di
sulf
ide
3-
1 -C
hlor
o-2-
met
hylb
enze
neo ?
1 -C
hlor
o-4-
met
hylb
enze
neQ) ;j
3-
Chl
oro-
l-pr
open
e
o D
ibro
mom
etha
ne
JJJ
fra«
s-l,4
-Dic
hlor
o-2-
bute
ne
.3
1 ,3-
Dic
hlor
opro
pane
^
2,2-
Dic
hlor
opro
pane
o <
1,
1 -D
ichl
orop
rope
ne
O £
(1,1
-Dim
ethy
leth
yl)b
enze
ne
1,4-
Epo
xybu
tane
1 -E
thyl
-2-m
ethy
lben
zene
Eth
yl 2
-met
hyl-
2-pr
open
oate
2-H
exan
one
lodo
met
hane
1 -Is
opro
pyl-
4-m
ethy
lben
zene
Met
hyl
2-m
ethy
l-2-
prop
enoa
te
Con
cent
ratio
ns in
lab
orat
ory
blan
ks.
SSB
ICB
IEB
FCB
, in
mic
rogr
ams
per
liter
FEB
HC
CB
HC
EB
Con
cent
ratio
ns in
fiel
d bl
anks
, in
mic
rogr
ams
per
liter
ICB
IEB
FCB
FEB
Tar
get
anal
ytes
C
onti
nued
<0.1
0
E.0
4
<.2
0
<.05
<.05
<.10
<5.0 <.05
<.05
<.05
<1
0
<5.0 <.05
<.05
<.05
<.05
<5.0 <.05
<1.0
<5.0 <.05
<.05
<1.0
<0.1
0
E.0
4
<.2
0
<.05
<.05
<.10
<5.0 <.05
<.05
<.05
<1
0
<5.0 <.05
<.05
<.05
<.05
<5.0 <.05
<1.0
<5.
0
<.05
<.05
<1.0
<0.1
0
E.0
5
<.20
<.05
<.05
<.10
<5.0 <.05
<.05
<.05
<.10
<5.0 <.05
<.05
<.05
<.05
<5.0 <.05
<1.0
<5.0 <.05
<.05
<1.0
<0.1
0
E.0
5
<.20
<.05
<0.1
0
E.0
4
<.20
<.05
Oth
er a
naly
tes
<.05
<.
05
<.10
<5.
0
<.05
<.05
<.05
<.10
<5.0 <.05
<.05
<.05
<.05
<5.
0
<.05
<1.
0
<5.
0
<.05
<.05
<1.0
<.10
<5.0 <.05
<.05
<.05
<.10
<5.0 <.05
<.05
<.05
<.05
<5.0 <.05
<1.0
<5.0 <.05
<.05
<1.0
<0.
10
E.0
4
<.2
0
<.05
<.05
<.10
<5.
0
<.05
<.05
<.05
<.10
<5.0 <.05
<.05
<.05
<.05
<5.
0
<.05
<1.0
<5.0 <.05
<.05
<1.0
<0.
10
E.0
5
<.2
0
<.05
<.05
<.1
0
E.3
0
<.05
<.05
<.05
<.1
0
<5.
0
<.05
<.05
<.05
<.05
<5.0 <.05
<1.0
<5.
0
<.05
<.05
<1.
0
<0.1
0
E.0
4
<.20
<.05
<.05
<.10
<5.0 <.05
<.05
<.05
<.10
<5.0 <.05
<.05
<.05
<.05
<5.0 <.05
<1.0
<5.0 <.05
<.05
<1.0
<0.
10
E.0
4
<.2
0
<.05
<.05
<.1
0
<5.
0
<.05
<.05
<.05
<.10
<5.
0
<.05
<.05
<.05
<.05
<5.
0
<.05
<1.
0
<5.
0
<.05
<.05
<1.0
<0.1
0
E.0
4
<.20
<.05
<.05
<.10
<5.0 <.05
<.05
<.05
<.10
<5.0 <.05
<.05
<.05
<.05
<5.0 <.05
<1.0
<5.0 <.05
<.05
<1.0
<0.
10
E.0
4
<.20
<.05
<.05
<.10
<5.0 <.05
<.05
<.05
<.1
0
<5.
0
<.05
<.05
<.05
<.05
<5.0 <.05
<1.0
<5.0 <.05
<.05
<1.
0

Tabl
e 3.
R
esul
ts o
f qua
lity-
cont
rol s
ampl
e an
alys
is f
or v
olat
ile o
rgan
ic c
ompo
unds
dur
ing
labo
rato
ry a
nd f
ield
tes
ting
equi
pmen
t Con
tinue
d[I
UPA
C,
Inte
rnat
iona
l U
nion
of P
ure
and
App
lied
Che
mis
try;
SSB
, so
urce
-sol
utio
n bl
ank;
IC
B,
initi
al c
anis
ter
blan
k; I
EB
, ini
tial
equi
pmen
t bla
nk;
HC
CB
, hig
h-co
ncen
trat
ion
cani
ster
bla
nk;
HC
EB
, hig
h-co
ncen
trat
ion
equi
pmen
t bla
nk;
<, n
ot d
etec
ted
in th
e sa
mpl
e; E
, est
imat
ed]
of s
elec
ted
surfa
ce-w
ater
sam
plin
g
FCB
, fin
al c
anis
ter
blan
k; F
EE
, fi
nal
equi
pmen
t bla
nk;
IUPA
C co
mpo
und
nam
eC
once
ntra
tions
in l
abor
ator
y bl
anks
, in
mic
rogr
ams
per
liter
SSB
ICB
IEB
FCB
FEB
HC
CB
HC
EB
Con
cent
rati
ons
in f
ield
bla
nks,
in
mic
rogr
ams
per
liter
ICB
IEB
FCB
FEB
Oth
er a
naly
tes C
ontin
ued
4-M
ethy
l-2-
pent
anon
e
2- M
ethy
l-2
-pro
pene
nitr
ile
Met
hyl-
2-pr
open
oate
(1 -M
ethy
lpro
pyl)
benz
ene
1,1
'-Oxy
bise
than
e
2-Pr
open
one
1,1,
1 ,2
-Tet
rach
loro
etha
ne
1 , 1
,2,2
-Tet
rach
loro
etha
ne
1 ,2,
3,4-
Tet
ram
ethy
lben
zene
1 ,2,
3,5-
Tet
ram
ethy
lben
zene
1 ,2,
3-T
rim
ethy
lben
zene
1 ,3
,5 -T
rim
ethy
l ben
zene
<5.0
<2.0
<2.0 <.05
<.10
E1.
2
<.05
<.10
<.05
<.05
<.05
<.05
<5.0
<2.0
<2.0 <.05
<.10
E1.
3
<.05
<10
<.05
<.05
<.05
<.05
<5.0
<2.0
<2.0 <.05
<.10
El.
4
<.05
<.10
<.05
<.05
<.05
<.05
<5.
0
<2.0
<2.0 <.05
<.10
E1.
5
<.05
<.1
0
<.05
<.05
<.05
<.05
<5.0
<2.0
<2.0 <.05
<.10
E1.
8
<.05
<10
<.05
<.05
<.05
<.05
<5.0
<2.
0
<2.0 <.05
<.10
<5.
0
<.05
<.10
<.05
<.05
<.05
<.05
<5.0
<2.0
<2.0 <.05
<.10
El .
3
<.05
<.10
<.05
<.05
<.05
<.05
<5.0
<2.0
<2.0 <.05
<.10
<5.
0
<.05
<.10
<.05
<.05
<.05
<.05
<5.0
<2.
0
<2.
0
<.05
<.1
0
<5.
0
<.05
<.1
0
<.05
<.05
<.05
<.05
<5.0
<2.0
<2.0 <.05
<10
<5.0 <.05
<.10
<05
<.05
<.05
<.05
<5.0
<2.0
<2.0 <.05
<.10
<5.
0
<.05
<.10
<.05
<.05
<.05
<.05