study of a new method of funding for public schools in...
TRANSCRIPT

Study of a New Method of Funding for Public Schools in Nevada
Submitted: August 22, 2012 Submitted To: Nevada Legislative Counsel Bureau
Julie Waller Senior Program Analyst, Fiscal Analysis Division Nevada Legislative Counsel Bureau 401 South Carson Street Carson City, NV 89701-4747
Submitted By: Dr. Jay Chambers, Dr. Jesse Levin and Antonia Wang (AIR) Professor Deborah Verstegen (University of Nevada, Reno) Professor Emerita Teresa Jordan (University of Nevada, Las Vegas) Professor Bruce Baker (Rutgers University)
American Institutes for Research 2800 Campus Drive, Suite 200, San Mateo, CA 94403 | 650.843.8100 | TTY 877‐334‐3499 | www.air.org
Education, Human Development, and the Workforce

ContentsIntroduction .................................................................................................................................................. 1
Study Objectives ....................................................................................................................................... 1
Organization of Study ............................................................................................................................... 2
Chapter 1—Overview and Analysis of Nevada Plan ..................................................................................... 3
Evolution of Nevada Funding System (History/Previous Studies/Stakeholder Input) .............................. 3
The Early Years ...................................................................................................................................... 3
1948–68 ................................................................................................................................................ 4
1968–88 ................................................................................................................................................ 6
1988–06 ................................................................................................................................................ 7
The 2006 Adequacy Study..................................................................................................................... 8
2000–12 Equity ..................................................................................................................................... 9
National Ranking and Reports .................................................................................................................. 9
Stakeholder Input ................................................................................................................................... 11
Primary Issues ..................................................................................................................................... 11
Primary Requests for Consideration ................................................................................................... 12
How the Current Funding System Works (Formula/Revenue Sources) .................................................. 13
The Nevada Plan ..................................................................................................................................... 13
Revenue Sources ................................................................................................................................. 16
The Minimum Foundation Program ................................................................................................... 18
External Categorical Funds .................................................................................................................. 18
Capital Outlay ...................................................................................................................................... 18
Analysis of Funding System Based on Criteria for an Optimal System ................................................... 19
Issues to Explore ................................................................................................................................. 24
Chapter 2—Inventory of State Finance Systems ........................................................................................ 26
Inventory of State Finance Systems ........................................................................................................ 26
Major State Finance Systems .............................................................................................................. 26
Key Issues in Choosing a Funding Formula ......................................................................................... 29
Financing Individual Student/District Needs and Characteristics ....................................................... 30
Summary ................................................................................................................................................. 39
Chapter 3—Identifying Adjustments Used to Address Cost Factors .......................................................... 40

Defining Cost Factors .............................................................................................................................. 40
General Methodology ............................................................................................................................. 43
Determining Similar States ..................................................................................................................... 44
Identifying Cost Adjustments .................................................................................................................. 47
Identifying Student Poverty Cost Adjustments ................................................................................... 47
Identifying Scale of Operations Cost Adjustments ............................................................................. 51
Identifying Special Education Cost Adjustments ................................................................................ 55
Identifying English Learner Cost Adjustments .................................................................................... 56
A Note on Suggested Adjustments From Cost Studies ....................................................................... 57
Identifying Differential Wage Cost Adjustments ................................................................................ 59
Chapter 4—Simulation of Alternative Practices in Nevada ........................................................................ 61
Our Understanding of the Distributive School Account (DSA) Model .................................................... 61
How the DSA Treats Scale and Price ................................................................................................... 61
Isolating the Impact of Current Cost Factor Adjustments in the DSA ................................................ 63
Simulating Cost Factor Adjustments Using the Funding Adjustment Simulator (FAS) ........................... 66
Incorporating the Comparable Wage Index (CWI) Into the DSA ........................................................ 66
Using the Nevada Funding Adjustment Simulator (FAS) .................................................................... 70
Simulating Differential Wage Cost Adjustments ................................................................................. 74
Simulating Student Poverty Cost Adjustments ................................................................................... 74
Simulating English Learner Cost Adjustments .................................................................................... 77
Simulating Scale of Operations Cost Adjustments .............................................................................. 77
Simulating Multiple Cost Adjustments ............................................................................................... 82
A Note on the Intention of the FAS ..................................................................................................... 82
Analysis of Alternative Special Education Cost Adjustments .................................................................. 82
Students With Disabilities ................................................................................................................... 84
The Fixed Allocation per Pupil ............................................................................................................ 88
Weighted Pupil Funding ...................................................................................................................... 88
A Census‐Based Approach .................................................................................................................. 89
Census‐Based Model Combined With a Catastrophic Aid Program ................................................... 90
The Impact of Adding Gifted Students ................................................................................................ 94
Analysis of the Special Education Funding Options ............................................................................ 97
Chapter 5—Recommendations ................................................................................................................. 101

Distributive School Account DSA Model Recommendations ................................................................ 101
Modify DSA Adjustments for Scale/Density and Geographic Differences in Staffing Prices to Ensure
Equity Across Districts ....................................................................................................................... 101
Incorporate New Adjustments for Low‐Income Students and English Learners Into the DSA to
Ensure Equity Across Districts ........................................................................................................... 105
Recommendations for Funding Special Education ............................................................................... 108
Documenting How Special Education Is Funded .............................................................................. 108
Establish One or More Panels to Consider Special Education Funding Policy Recommendations ... 109
General Recommendations .................................................................................................................. 111
References ................................................................................................................................................ 114
Appendixes ................................................................................................................................................ 119
Appendix A—District Groupings in the Distributive School Account (DSA) Model .............................. 119
Appendix B—Teacher Allotment Table in Distributive School Account (DSA) Model .......................... 120
Appendix C—State and Local Revenue Sources in Nevada .................................................................. 121
Appendix D—Special Education Policies and Programs by State ......................................................... 122
Appendix E—Low‐Income/At‐Risk Policies and Programs by State ..................................................... 148
Appendix F—Weights for Low‐Income/At‐Risk Students by State ....................................................... 160
Appendix G—English Learner Policies and Programs by State ............................................................. 162
Appendix H—Weights for English Language Learners (ELL) Students by State .................................... 169
Appendix I—Density/Sparsity of Small Schools by State ...................................................................... 171
Appendix J—Gifted and Talented Policies and Programs by State ....................................................... 182
Appendix K—National Center for Education Statistics (NCES) Locale Definitions ................................ 189
Appendix L—Description of the NCES Comparable Wage Index (CWI) ................................................ 190
Appendix M—Description of Basic Support Ratio (BSR) Calculations .................................................. 191

American Institutes for Research Study of New Funding Method for Nevada Public Schools—1
IntroductionThe Nevada Plan for School Finance currently forms the basis for funding K–12 education in the
state. This funding allocation model guarantees a level of state funding per pupil and is
intended to equitably distribute funds to all districts. American Institutes for Research (AIR) was
commissioned to conduct the following study to investigate how the state finance system could
be improved by determining how it could best address the differential funding needs of
students and smaller rural districts are met.
StudyObjectivesThe purpose of this study is to evaluate options available to the state for improving the equity
by which funds are distributed to students living in all parts of the state. The project consists of
four major activities to carry out this evaluation:
Provide an in‐depth overview of the current Nevada Plan.
Develop an inventory of state finance systems that shows how states are addressing the
additional costs of serving students with specific needs (e.g., poverty, English learners,
and special education) and how they adjusting for differences in services being provided
in rural, remote areas.
Analyze methods used in selected comparable states for addressing the individual
student needs and special district characteristics.
Provide recommendations to improve Nevada’s existing school funding model and
incorporate best practices for ensuring student needs and challenges of delivering
education in smaller rural, remote districts are addressed.
This report presents the results of this investigation. The work has been conducted over the
past three months and has involved analyzing data collected from all 50 U.S. states. AIR team
members have examined state funding formulas, demographic characteristics, and fiscal data
from all of the states and based on empirical analyses of these data, have attempted to identify
the best practices that lead to an equitable distribution of funding with respect to the incidence
of students in poverty, English learners, students enrolled in special education programs, and
students attending schools in districts that have a small‐scale of operations.
Over the course of the study, we have gathered and analyzed data on enrollment, student
demographics, district characteristics, and other relevant data pertaining to patterns of cost
and resource allocation in public schools for Nevada. Some data came from the Nevada
Department of Education, and we have interviewed a number of key knowledgeable individuals
who have been immersed in the inner workings and modifications of the Nevada Plan. In
addition, the team also had the opportunity to gather information from representatives of the

American Institutes for Research Study of New Funding Method for Nevada Public Schools—2
Nevada School Districts at a session organized for the Nevada School Superintendents annual
meetings held on June 18 in South Lake Tahoe, Nevada.
The report examines in considerable detail the Distributive School Account (DSA) Equity
Allocation Model, which proved to be a transparent but intricate mechanism that encompasses
the key adjustments intended to achieve an equitable distribution of revenues across the
state’s districts. The report also includes a detailed analysis of the allocation of funding for
special education services in the state.
With a clear understanding of how the current system works, the team then created a modeling
tool designed to simulate the distributive effects of adopting various funding adjustments to
account for the additional costs related to serving students with various needs or serving
students in larger or smaller, more remote districts. The simulation model, the Formula
Adjustment Simulator (FAS), is designed to facilitate thoughtful decision making by Nevada
State policymakers by providing a structure for analyzing the data and showing the impact of
alternative approaches to improving the Nevada Plan.
OrganizationofStudyThe remainder of the report is organized as follows: Chapter 1 provides a detailed overview and
historical account of the Nevada state funding system; Chapter 2 includes a comprehensive
state inventory of finance systems that documents the different types of funding mechanisms
used by states throughout the country; Chapter 3 contains two analyses that identify (1) states
that are similar to Nevada in terms of the needs of the students they serve and scale with which
their districts operate and (2) alternative funding practices that might be implemented by
Nevada to promote greater funding equity to its students and districts; Chapter 4 documents
the development of the simulation model (FAS) introduced earlier and includes a series of
alternative funding practices that are simulated in the context of the Nevada finance system;
and Chapter 5 provides our suggested recommendations and concluding thoughts.

American Institutes for Research Study of New Funding Method for Nevada Public Schools—3
Chapter1—OverviewandAnalysisofNevadaPlan
This Chapter responds to the two of the tasks in Objective 1 under the scope of work: (a) to
present a historical overview of Nevada’s K–12 school finance system, including requested
input from stakeholders and (b) to provide an in‐depth description of the current funding
allocation system for public elementary and secondary schools. This part of the report is divided
into four sections: (1) Evolution of Nevada Funding System (History/Previous
Studies/Stakeholder Input), (2) How the Current Funding System Works (Formula/Revenue
Sources), (3) Analysis of the Funding System Based on Criteria for an Optimal System, and (4)
Issues to Explore.
While the purpose of this study is narrowly focused, that is, to explore how the differentiated
needs of students might be addressed in Nevada’s funding allocation system, an overview of
the current system provides an opportunity to examine the allocation system in its entirety. In
fact, “the current economic downturn may provide an opportunity for the state to take its time
to thoroughly analyze the total funding allocation system.”1 In this way, when the economic
environment improves, the state would have a comprehensive plan for implementing an
updated Nevada Plan consistent with current state educational goals and accountability efforts.
Thus, comments in this section will focus on both current issues identified in this study and
potential issues that the state may wish to explore in the future.
EvolutionofNevadaFundingSystem(History/PreviousStudies/StakeholderInput)
TheEarlyYearsThe public school system in Nevada was established by the first session of Nevada’s legislature
in 1865. It was based on previous territorial laws, the laws of California, and the Nevada
Constitution. The legislature of 1865 created a system financed partly by state funds derived
from a permanent school fund, special taxes, and some support from the state general fund.
The basis for the distribution of monies was amended several times in the early history of the
state. Originally, funds were allocated based on the actual number of school‐aged children
residing within the district. However, this resulted in rural districts suffering from a lack of
minimum support to operate schools. The Apportionment Law of 1877 established an
apportionment unit based on 100 children, age 6 to 18, per unit as determined by census
count.2 This was called a teacher apportionment unit. Subsequent to the law, 25 percent of
1 Comment from participant at stakeholders meeting with Nevada district superintendents, NASA, Lake Tahoe, Nevada, June 18, 2012. 2 Bennett, R. A. (2003). An analysis of Nevada’s public school funding system. Unpublished Ed.D. dissertation, University of Nevada, Las Vegas.

American Institutes for Research Study of New Funding Method for Nevada Public Schools—4
funding for schools was based on a unit allocation, and 75 percent of funding continued to be
based on a per‐pupil census count. The law was amended in 1885 to again benefit rural districts
by increasing the unit proportion of funding from 25 percent to 40 percent.
Nevada has had an ongoing struggle to determine the best apportionment methods to address
the needs of both rural and more urban areas. In 1890, the apportionment law was changed by
redefining a teacher unit based on 75 children per unit instead of 100. In 1911, a new
apportionment law established a teacher allotment unit based on 30 children per unit. This new
apportionment law required 70 percent of the funding allocation to be distributed by teacher
units and 30 percent distributed by per‐pupil count.
In subsequent years, legislative interest shifted to a focus on the taxation process and taxpayer
fairness. In 1917, the legislature changed the evolution of the distributive school account by
pledging a definite or predictable sum of money to school districts rather than a proportional
part of monies available. It also established procedures for levying a state school support tax.
The changes in the collection and distribution of state revenues for education were the first
indications of the state’s concern for the equalization of district wealth. The assessed valuation
of property within school districts had begun to vary widely.
In 1925, the state legislature changed how it would allocate funds from child census counts to
counts based on the actual number of pupils enrolled in school. The apportionment and
distribution laws changed little up to and through the 1940s. If costs increased, districts relied on
the counties to provide increases in the per‐pupil apportionment. The counties carried the burden
of increases until the 1947 legislature provided a substantial increase in the teacher unit allocations.
1948–68A formal recommendation was made to the 1947–48 Nevada Legislature to appoint an interim
committee of the State Department of Education to consider the reorganization of the
educational system within the state. The Nevada School Finance Survey Group determined that
Nevada was facing many education problems because of the number of school districts and
their small size, which resulted in organizational inefficiencies. As of June 1947, Nevada had 238
school districts, many with fewer than 10 students. The group recommended that schools be
administered on a community interest, county unit, or regional basis. It also recommended the
creation of a position for Assistant Superintendent for Finance, Budgeting, and Statistics. This
recommendation reflected the study group’s belief that many of the problems facing the
financing of schools were due to a lack of modern accounting and budgeting procedures within
the State Department of Education.3 Finally, the group recommended further study of high‐cost
programs such as capital improvements and pupil transportation. The Survey Group’s
recommendations led to the continuous study of the Nevada school system over the next decade.
3 Ibid, p. 61.

American Institutes for Research Study of New Funding Method for Nevada Public Schools—5
Governor Charles H. Russell commissioned the Governor’s School Survey Committee to compile
a report of Public Education in Nevada.4 The Division of Surveys and Field Services at George
Peabody College for Teachers was commissioned to complete the report.5 The task of the
survey staff was “to determine the conditions in Nevada public schools, to identify problems
that require solution, and to express its professional judgment as to the proper solution of the
problems.”6 This report became known as the Peabody Report and provided comprehensive
recommendations that resulted in dramatic changes in how Nevada funded its public schools.
The report was delivered to the Survey Committee on November 6, 1954, and recommended
the following:
Allocating dollars per teacher unit
Providing allocations based on average daily attendance (ADA)
Making school districts county co‐terminus
Funding transportation
Allowing districts more flexibility in assessing additional taxes to support education
Although not all of the recommendations were adopted, the Peabody Study resulted in
“increased appropriations and made possible the operation of the schools on a more adequate
financial basis.”7
In 1959, the legislature authorized the governor to appoint another school survey committee.
The Governor’s School Survey Committee contracted with the University of Wyoming to
complete a fact‐finding study of Nevada schools. The areas of finance, personnel, business
management, and curriculum were explored. One of the primary areas of concern was the
sufficiency of funds for public schools. In fact, the 1959 legislature had to enact an emergency
distributive school fund for one year and then continued it for the second year of the biennia.
Another concern was the increasing inequity to taxpayers as the result of varying assessed
valuations of property throughout the state. The charge to the Wyoming study committee was
to “determine if Nevada’s then current ‘minimum assistance program’ met the criteria of a
minimum foundation program.”8 The Wyoming study results were submitted to Governor
Grant Sawyer’s survey committee in 1960. Based on the Wyoming study, the Governor’s School
Survey Committee outlined principles for the development of a state funding allocation system
4 McClurkin, W. D. (1954). Public education in Nevada: A survey report. Nashville, TN: George Peabody College for Teachers, Division of Survey and Field Services. 5 Ibid 6 Ibid, p. vii. 7 Stetler, B. F. (1959). Biennial report of the superintendent of public instruction of the state of Nevada. Appendix to Journal of Senate and State Assembly. Carson City, NV. p. 12. 8 National Education Association. (2011). Rankings & estimates. Washington, DC: NEA Research. Retrieved from http://www.nea.org/assets/docs/NEA_Rankings_And_Estimates_FINAL_20120209.pdf

American Institutes for Research Study of New Funding Method for Nevada Public Schools—6
that lead to the adoption of the Nevada Plan in 1967. It is still the basis of the Nevada funding
formula used today. The committee’s recommendations were as follows:
Every child should have an equal educational opportunity.
State law should define the minimum foundation program in broad terms of both educational standards and costs.
The program should encourage the development of local school administrative units and attendance areas that are large enough to facilitate operation of a complete economical and efficient education program.
The program should be determined by an equitable, objective, practical, and weighted measure of educational need.
The program should include the cost of transportation.
The program should include the cost of capital outlay.
State aid should be apportioned strictly on the basis of an objective formula easily comprehended by state and local agents.
All school districts should support the foundation program at a uniform rate of local taxation.
State support of the equalization plan should be the difference between the amount of revenue raised locally and the objectively determined level of the foundation guarantee.
In the 1960s, Nevada was ranked fourth in the nation in per‐pupil expenditures,9 which
compares with current national rankings that vary from 37th to 48th in per‐pupil expenditures.
The percentage of state revenues for education was at 54.6 percent, well above average for the
nation, as compared with the proportion of current state revenues at 30.8 percent, well below
average for the nation.10
1968–88
Subsequent to the Wyoming study, several pivotal events occurred in relation to Nevada’s
funding allocation system11:
1963—Legislature commissioned a study to develop the Nevada funding formula based on the Wyoming study’s recommendations.
1967—The Nevada Legislature enacted the state funding formula, subsequently referred to as the Nevada Plan.
9 Sawyer, G. (1963). Message of governor Grant Sawyer to the legislature of Nevada. Appendix to Journal of Senate and State Assembly. Carson City, NV. 10 National Center for Education Statistics. (2011). Digest of education statistics. Retrieved from http://nces.ed.gov/programs/digest/2011menu_tables.asp 11 Bittman, D. T. (2003). A history of public school finance and educational trends within the state of Nevada: Summary and conclusions. Unpublished Ph.D. dissertation, University of Nevada, Las Vegas.

American Institutes for Research Study of New Funding Method for Nevada Public Schools—7
1971—A study commissioned by Governor O’Callahan recommended all statutory references to joint school districts be deleted from the Nevada Revised Statutes; it also recommended consolidation.
1973—Funding for special education was enacted as an add‐on to the Nevada Plan and distributed as a unit allocation.
1977—An economic trigger for the property tax rate was enacted into law; also, the Nevada Assembly reviewed concept of deconsolidation for CCSD but no action was taken.
1979—A property tax relief package was approved; proposal to study the practicality of deconsolidation was not adopted.
1981—The tax rate was detriggered to provide relief to state; study of Nevada Plan authorized; and the local school support tax was raised from 1.0 percent to 1.5 percent.
1983—The property tax dedicated to public schools was raised from $0.50 to $0.75 per $100 of assessed valuation.
1984—The Senate approved the school finance study; counties with more than 400,000 population were authorized to earmark $0.60 of real property transfer tax for school district capital projects.
1988–06
1988—The Price Waterhouse Study was commissioned to examine fiscal affairs of state and local governments, to analyze Nevada’s taxing system and intergovernmental relationships, and to make policy recommendations the 1989 Nevada Legislature enacted.
1988—The Interim Study Committee examined class size reduction.
1989—The Nevada Legislature enacted the Class‐Size Reduction Act, establishing categorical funding for class size reduction for Grades K–3 through a phase‐in program.
1991—The Nevada Legislature increased the local school support tax from 1.5 percent to 2.25 percent on taxable sales.
1995—A study commissioned to explore the feasibility of reconfiguring the structure of Nevada’s school districts was conducted by Management Analysis & Planning Associates (MAP). Eight of 34 recommendations were adopted. Major items adopted included the following: (1) a process for realigning districts initiated locally or by voter petition, (2) provision for charter schools, (3) provision for a statewide technology plan, and (4) provision for an interim committee to explore the state’s participation in financing school construction.
1997—The Nevada Education Reform Act (NERA) was passed as Nevada’s accountability program.

American Institutes for Research Study of New Funding Method for Nevada Public Schools—8
The2006AdequacyStudyWith increased pressure to respond to both federal and state accountability demands for
ensuring every child has the opportunity to meet standards and pass proficiency exams, Nevada
districts were feeling the strain of trying to meet expectations under current funding levels. This
was, in part, due to functioning under a funding allocation system that had been developed at
an earlier time in Nevada’s history; a time when the state had less population, was
demographically homogeneous, and was basically a rural state.
In 2006, a study was commissioned to look at the adequacy of Nevada’s funding system in the
context of new national and state accountability demands. Conducted by Augenblick, Palaich
and Associates, Estimating the Cost of an Adequate Education in Nevada12 focused on
determining two key cost elements: (1) a base, per‐student cost adjusted for district size and (2)
additional cost weights (add‐on weights) for children with special needs, including special
education children, children at risk of failing in school, English language learners (ELLs), and
children in Career and Technical Education (CTE) programs. Results of a Professional Judgment
methodology recommended a starting cost of an increased funding level of $79.6 million, or
$231 per student on average, and a goal cost representing the starting cost plus add‐on weights
for special education and CTE programs. The projected cost using 2003–04 data adjusted for
inflation was $3,551.3 million. The report provided a nine‐year phase‐in to increase revenues to
meet adequacy funding projections. The student cost weights from the professional judgment
methodology yielded weights for small, moderate, and large districts and are summarized in
Table 1.1. They range from a weight of 0.04 for a child enrolled in CTE in a large district to 3.55
for a child with severe special education needs in a small district.
Table 1.1. Added Cost Weights for Nevada Students With Special Needs*
Special Needs Small District Moderate District Large District
SPED Mild 1.04 0.88 0.89
SPED Moderate 1.69 1.28 1.29
SPED Severe 3.55 2.52 2.44
At‐Risk 0.31 0.29 0.35
ELLs 1.21 0.56 0.47
CTE 0.14 0.05 0.04 * Figures taken from John Augenblick et al. Estimating the Cost of an Adequate Education
in Nevada (Denver, CO: Augenblick, Palaich and Associates, Inc., 2006).
Since the Adequacy Study, there has been an economic downturn both nationally and in the
state. To date, no action has been taken on the study’s recommendations.
12 Augenblick, J., Silverstein, J., Brown, A. R., Rose, D., DeCesare, D., & Anderson, A. B. (2006). Estimating the cost of an adequate education in Nevada. Denver, CO: Augenblick, Palaich and Associates, Inc.

American Institutes for Research Study of New Funding Method for Nevada Public Schools—9
2000–12EquityOver the past decade, the equity of the Nevada funding allocation system appears to have
eroded.13 14 15 For example, in 1991, the coefficient of variation for net current expenditures
was 0.0103.16 A coefficient of variation is the standard deviation of a distribution divided by the
mean, expressed as a percentage. It represents the degree to which the dispersal of a
distribution clusters near the mean. The value ranges from 0 to 1.0. The lower the coefficient of
variation is, the greater the equity is. The Augenblick study reported a coefficient of variation of
0.473 for 2003–04 but district populations were not weighted, resulting in an overinflated
measure. In the field of school finance, a coefficient of 0.150 or less is considered to be
acceptable.17 In other words, two thirds of the distribution of per‐pupil expenditures should be
within 15 percent of the mean. Equity measures overall are problematic for Nevada because
70‐plus percent of the student population resides within one school district (Clark County).
Equity measures are based on the underlying assumption of a normal distribution curve, which
Nevada does not demonstrate.
NationalRankingandReportsExamining national rankings in school finance requires the careful consideration of the
definitions used in calculating those rankings. Different entities use different definitions, so it is
important to make certain, if you are making comparisons, to compare “apples” with “apples.”
Although one might criticize individual rankings and how they are calculated, the important
thing to examine is the overall pattern of a state’s performance over time. For Nevada, the
historical pattern of performance for per‐pupil expenditures as well as other measures in the
NEA Estimates and Rankings is not exemplary. When the Nevada Plan was adopted in the
1960s, the state ranked fourth in per pupil expenditures. Over the past decade, Nevada has
consistently ranked in the lowest quartile for per‐pupil expenditures and other funding
measures for public education, sometimes ranking in 46th or 48th place.18 In the most recent
NEA Rankings & Estimates 19 Nevada ranked 48th in current expenditures per pupil and 50th in
public school revenue per $1,000 of personal income, a measure of state effort for education. It
is the opinion of the research team that there is substantial room for improvement in meeting
the reasonably equal educational opportunity needs of the state’s school children.
13 Jordan, K. F., & Lyons, T. S. (1990). Financing Education in an Era of Change. Bloomington, IN: Phi Delta Kappa. 14 Augenblick, J., Silverstein, J., Brown, A. R., Rose, D., DeCesare, D., & Anderson, A. B. (2006). Estimating the cost of an adequate education in Nevada. Denver, CO: Augenblick, Palaich and Associates, Inc. 15 Baker, B. D., Sciarra, D. G., & Farrie, D. (2010). Is school funding fair? A national report card. Newark, NJ: Education Law Center. Retrieved from http://www.schoolfundingfairness.org/National_Report_Card_2010.pdf 16 Bennett, R. A. (2003). An analysis of Nevada’s public school funding system. Unpublished Ed.D. dissertation, University of Nevada, Las Vegas. 17 Adequacy Study, p. 105. 18National Education Association. (2011). Rankings & estimates. Washington, DC: NEA Research. Retrieved from http://www.nea.org/assets/docs/NEA_Rankings_And_Estimates_FINAL_20120209.pdf 19Ibid.

American Institutes for Research Study of New Funding Method for Nevada Public Schools—10
In the most recent National Report Card for 2012, prepared for the Rutgers Education Law
Center, Nevada received low rankings or grades on three of four “fairness measures.”20 The
Report Card consists of separate but interrelated fairness measures. The 50 states plus the
District of Columbia were evaluated on each of these measures. The four measures are as
follows:
Funding Level—This measures the overall level of state and local revenue provided
to school districts and compares each state’s average per‐pupil revenue with that of
other states, including states within the region. To recognize the variety of interstate
differences, each state’s revenue level is adjusted to reflect differences in regional
wages, poverty, economies of scale, and population density. Nevada ranked 38th
for 2009, the most recent year reported.
Funding Distribution—This measures the distribution of funding across local districts
within a state, relative to student poverty. The measure shows whether a state
provides more or less funding to schools based on their poverty concentration, using
simulations ranging from 0 percent to 30 percent child poverty. Nevada received a
grade of “F.” (Five states received a grade of “F” for 2009.)
Effort—This measures differences in state spending for education relative to state
fiscal capacity. “Effort” is defined as the ratio of state spending to state per‐capita
gross domestic product (GDP). Nevada received a grade of “F.” (This grade
translates to an effort index of 0.032—indices ranged from 0.024 in Delaware to
0.063 in Vermont, with those falling below 0.033 receiving a grade of “F.” Fourteen
states received this grade for 2009.)
Coverage—This measures the proportion of school‐age children attending the
state’s public schools, as compared with those not attending the state’s public
schools (primarily parochial and private schools but also home‐schooling). The share
of the state’s students in public schools and the median household income of those
students, are important indicators of the distribution of funding relative to student
poverty (especially where more affluent households simply opt out of public
schooling), and the overall effort to provide fair school funding.21 Nevada ranked
17th for 2009. This was the most positive measure for Nevada of the four fairness
measures. The state has a private/public income ratio of 2.01. Income ratios ranged
from 1.18 for Wyoming to 3.49 for the District of Columbia. Nevada had a median
household income for public schools of $71,515 and for private schools of $109,262.
20 Baker, B. D., Sciarra, D. G., & Farrie, D. (2010). Is school funding fair? A national report card. Newark, NJ: Education Law Center. Retrieved from http://www.schoolfundingfairness.org/National_Report_Card_2010.pdf 21 Ibid, p. 7.

American Institutes for Research Study of New Funding Method for Nevada Public Schools—11
Nevada has made recent attempts to improve the overall equity of its funding allocation
system, particularly with the new Equity Allocation Model described in the next section.
However, the state should consider providing close scrutiny of equity or fairness measures in
the future and planning strategies for improvement.
StakeholderInputAs part of the overview for this study, two stakeholder meetings were held to gather
information regarding concerns and issues with the Nevada funding allocation system.
Participants were provided a brief overview of the study as well as instructions and questions to
guide group discussion. In addition, an e‐mail address was created to receive ongoing input
from individuals following the meetings. The stakeholder meetings were held on June 18, 2012,
for district superintendents/designees and on June 22, 2012, for district financial
officers/business managers.
Stakeholder input was consolidated into a continuous anonymous transcript. The transcript was
coded and recurring themes identified. Primary issues and requests for consideration are
outlined below, with words in bold denoting recurring terms emphasized in the transcript. The
overarching concern of stakeholders was funding that took into consideration the unique
characteristics of schools, students, and districts.
PrimaryIssues
Reduction in funding has resulted in no textbook adoptions despite textbooks currently
in use becoming obsolete.
Reduction in funding has resulted in reduction in teaching staff and an increase in class
size (e.g., class size increases in one district were as follows: kindergarten grew 12
percent; first and second grades grew 37.5 percent; and third grade grew 15.8 percent).
Concessions in salary and benefits have resulted in the erosion of funding for the
effective delivery of programs.
Differential treatment in the funding of charter schools versus regular public schools
calls into question the equity of charter school funding.
The current funding level is a barrier to the educational success of students.
Noneducational factors and differentials between geographic areas are critical factors
for rural districts.
The question of equity in the funding formula leaves 15 districts “terrified” as long as
the inadequacy of funding is not addressed.

American Institutes for Research Study of New Funding Method for Nevada Public Schools—12
Legislated authority for districts to have greater flexibility in spending and relief in the
area of collective bargaining is needed in order for districts to spend monies effectively
and efficiently.
PrimaryRequestsforConsideration
Provision of information on how other states fund education and models of funding
Consideration of the fact that few states have the rural attributes found in Nevada, with
a sales tax‐based economy and capped ad valorem rates
Additional flexibility in spending and a loosening of bureaucratic requirements to allow
districts to maximize the efficiency with which dollars are used
Establishment of a rainy day fund to ensure the stability of the DSA model
Recognition of the differentiated needs of students
Recognition of the higher cost of educating students in rural communities
Recognition of the cost/weighting of each district’s unique characteristics, economies of
scale, and geographic cost difference
Provision of a hold‐harmless phase‐in for any redistribution of funds to avoid excessive reductions in funding in any given year
Funding for facilities to charter schools that have demonstrated high performance
Elimination of sponsorship fees for charter schools
In addition, the transcript was entered into Wordle22 to provide a visual representation of
stakeholder input. Wordle is a software program that creates “word clouds” from the text
provided. The clouds give greater prominence to words that appear more frequently in the
source text. Figure 1.1 presents the illustration generated using the stakeholder transcript.
22Wordle. (n.d.). Beautiful word clouds. Retrieved from http://www.wordle.net

American Institutes for Research Study of New Funding Method for Nevada Public Schools—13
Figure 1.1. Word Cloud From Stakeholder Transcript
HowtheCurrentFundingSystemWorks(Formula/RevenueSources)
TheNevadaPlanThe primary objective of the Nevada funding formula, the Nevada Plan, for elementary and
secondary education is to “ensure each Nevada child [receives] a reasonably equal
educational opportunity”.23 The Nevada Plan is an equalized minimum foundation
program that is designed to recognize local variation in wealth and expenditures per
pupil. A foundation program is the most common type of funding formula used in the
United States. As we will see in Chapter 2, 36 of the 50 states use some form of a
foundation program.24 In essence, in a minimum foundation program the state sets a
guaranteed amount of money per pupil for educating elementary and secondary pupils,
determines the amount of money per pupil districts can raise from local revenue sources,
and then pays the difference between the local revenues raised and the state
guarantee.25
The Nevada formula is expressed in both per‐pupil weights and unit allocations. The
Nevada Revised Statutes state that the plan “should supplement local financial ability
to whatever extent necessary in each school district to provide programs of
23 Nevada Revised Statutes, 2011, 387.121. 24 Verstegen, D. A. (2012). A quick glance at school finance: A 50‐state survey of school finance policies and programs. Vol. I: State by state descriptions. Retrieved from http://education.unlv.edu/centers/ceps/study/documents/AQuickGlanceatSchoolFinance‐Vol.I.pdf 25 Odden, A. R., & Picus, L. O. (2008). School finance: A policy perspective (4th ed.). New York: McGraw‐Hill.

American Institutes for Research Study of New Funding Method for Nevada Public Schools—14
instruction in both compulsory and elective subjects that offer full opportunity for
every Nevada child to receive the benefit of the purposes for which public schools are
maintained.”26 The basic support guarantee is dispersed from the general fund
through a DSA. The primary purpose of the DSA is to provide the financial mechanism by
which the state meets its obligation under the Nevada Plan provision.27 DSA payments
are paid to districts quarterly in August, November, February, and May to meet the
state’s share of the basic support guarantee. However, since 2009, in accordance
with a determination made by the State Controller (pursuant to Section 8 NRS
387.124), the state has paid DSA apportionments on a monthly basis.
The Nevada Plan is referred to as an “equity allocation model” and is composed of 12
calculation modules. There are three additional modules that provide supporting
documentation and underlying assumptions for the allocation model.28 These
modules were developed and refined through an expert committee that commenced
its work in 2004. The model allows for the calculation of each district’s unique basic
support guarantee. Two of the primary reasons for the update of the model were to
add additional transparency to the program and to refine the district grouping used
in the individual district calculations of their basic support guarantee that dealt with
size, density, and sparsity. (See Appendix A for district groupings.) The following is a
description of the basic components of the Nevada Plan.
Basic Support Ratio. This part of the formula determines the staffing and operating
expenditures for each district with adjustments related to density, sparsity, size, and
differences in educational costs among districts. It is expressed as a ratio that
represents the relative cost of a district doing business in Nevada compared with the
statewide average cost. It takes into account certain economies of scale for districts
to services. Staffing costs are determined by aggregating school enrollments within
attendance areas with allowable teacher staffing units assigned by projecting the
aggregated enrollments through a Teacher Allotment Table maintained by the
Nevada Department of Education (see Appendix B). Once units are assigned to each
attendance area, they are aggregated within their respective districts. Operating
costs are based on prior year expenditures incrementally increased for inflation and
additional monies when the general fund allows. The basic support ratios for Nevada
districts are indexed to the mean, which is expressed as a 1.0. Ratios ranged from
26 Nevada Revised Statutes, 2011, 387.121. 27 Bennett, R. A. (2003). An analysis of Nevada’s public school funding system. Unpublished Ed.D. dissertation, University of Nevada, Las Vegas. 28 Nevada State Department of Education Administrative and Fiscal Services. (2011).The Nevada plan: Nevada revised statutes (NRS) 387.121: Guaranteed per pupil level of educational financial support. Las Vegas, NV: Author.

American Institutes for Research Study of New Funding Method for Nevada Public Schools—15
0.9621 (Clark) to 3.1398 (Esmeralda) for 2010–11.29 Although the state refers to this
as a cost‐based formula,30 technically it is not. The formula calculations are based on
incrementally adjusted historical expenditure data rather than on data that
accurately takes into account the differential cost of providing education across the
various districts in the state.
Wealth Adjustment Factor. This component adjusts for each district’s local revenues
(wealth). These adjustments are referred to as outside revenues because they are
not guaranteed by the state, but they still are regarded as part of the Nevada Plan.
Basically, the calculation functions to regress districts’ local wealth toward the mean
local wealth for the state. This particular component is the primary reason that
Nevada historically has scored high on some national rankings for equity.31 However,
it should be noted that, at the time, these particular rankings looked at only one
aspect of equity, horizontal taxpayer equity. These rankings did not consider
performance on other components of equity, such as horizontal or vertical pupil
equity. Horizontal pupil equity refers to treating pupils in like circumstances
similarly. Vertical pupil equity refers to treating pupils in different circumstances
according to their differentiated needs.
Transportation Allotment. This component of the formula functions as a percentage
cost reimbursement program. The state reimburses 85 percent of allowable capital
and operating expenditures based on a four‐year rolling average adjusted for
inflation.
Basic Support Level. This component combines the previous three components of the
Nevada Plan to arrive at a district’s preliminary basic support level. Because the state
basic support guarantee includes transportation costs, these costs must first be
backed out of the total. Then the guarantee is “adjusted” for the district’s “cost of
doing business.” This results in the Adjusted Basic Support per Pupil (ABSSP). Finally,
the three components of the Nevada Plan are added together.
Illustration:
ABSPP = [state basic support guarantee] –
[state average transportation allotment] x
[basic support ratio]
29 Nevada Department of Education DSA Module 10 2010‐11. 30 Ibid. 31 National Education Association. (2011). Rankings & estimates. Washington, DC: NEA Research. Retrieved from http://www.nea.org/assets/docs/NEA_Rankings_And_Estimates_FINAL_20120209.pdf

American Institutes for Research Study of New Funding Method for Nevada Public Schools—16
Preliminary Basic Support Per‐Pupil = [ABSSP] +
[per‐pupil wealth adjustment factor] +
[per‐pupil transportation allotment]
Special Education Units. After the unique preliminary basic support for each district
is calculated, units are added for special education programming. These units
function as an add‐on to the Nevada Plan formula. The funding units were initially
designed to cover the cost of an average teacher salary for a specified number of
special education pupils by disability. Since the baseline units were established, they
have been increased incrementally; however, the increases have not always mirrored
the proportional increases in some district’s special education population. Thus, the
number of units allocated appears to be idiosyncratic across some districts with like
characteristics. This draws the equity of the distribution of special education units
into question.32 The unit allocation for 2011–12 was $39,768, which represents
approximately 69 percent of the average cost of a teacher ($57,312).
Once the special education units for a district are allotted the total individual
district’s state guarantee can be calculated.
Illustration:
State Basic Support Guarantee = [total weighted pupil enrollment] x
[preliminary basic support guarantee per pupil] +
[total value of special education units]
The weighted pupil enrollment in the formula is determined by a single count day at
the end of September. There are currently two per‐pupil weights in the formula: 1.0
for pupils in Grades 1–12 and 0.6 for prekindergarten and kindergarten pupils
officially enrolled by count day. Nevada’s specific formula is currently not in statute
as formulae are in most states.
RevenueSourcesThe Nevada Plan’s financial support for elementary and secondary schools is
composed of a combination of state and local revenues. The state’s major General Fund
revenue sources are a 2 percent state sales tax, gaming taxes, an insurance premium tax and a
tax based on wages paid by an employer to employees. State revenue sources also include an
out‐of‐state 2.25 percent local school support sales tax not attributable to any single
32 Parrish, T. B., & Shambaugh, L. (2009). Analysis of special education funding in Nevada. Washington, DC: American Institute of Research.

American Institutes for Research Study of New Funding Method for Nevada Public Schools—17
county or school district and a portion of an annual slot‐machine tax. Two locally
generated tax revenues also are included in the Nevada Plan: a county‐collected 2.25
percent sales tax (increased by the 2009 Legislature to 2.60 percent beginning July 1,
2010 through June 30 2011, and extended by the 2011 Legislature through June 30,
2013) and a one‐third of $0.75 or $0.25 per $100 of assessed valuation property tax.33
In addition to Nevada Plan revenues, districts have designated local revenue sources
“outside of the plan.” These funds consist of two thirds of $0.75 or $0.50 per $100 of
assessed valuation property tax, a portion of the governmental services tax (GST), franchise
fees, unrestricted federal revenues, interest, and other local revenues dedicated to education.
(See Appendix C for a diagram of complete state and local revenue sources.)34
The proportion of revenues for education from different governmental sources is 62.6 percent
local, 30.8 percent state, and 6.6 percent federal.35 This is somewhat atypical as most states
have increased their state share so that state and local share percentages are closer to each
other. In many cases these changes were in response to litigation.36 The proportion of revenues
from different sources is 51 percent from sales tax, 19 percent from property tax, 15 percent
from gaming tax, and 15 percent from other sources.37 Thus, Nevada’s major source of revenue
for schools is the sales tax. This leaves the state particularly vulnerable to the vagaries of
economic downturns as evidenced by the last two legislative sessions.38 An over‐reliance on the
sales tax, because it is a regressive tax, also can result in the poor paying a disproportional
share of their income for education when compared with other segments of the population.39
Nevada has no local leeway. Local revenue levels are specified by the state legislature.40 In
other words, there is no local choice regarding revenues for operations. Districts may not go to
the voters to ask for additional revenues for operations as is possible in some other states.41
Although this may contribute to Nevada’s ability to maintain a standard of equity it also puts an
increased burden on the state to ensure funding is sufficient to maintain “programs of
instruction . . . that offer full opportunity for every . . . child.”42 If the state
33 Nevada State Department of Education Administrative and Fiscal Services. (2011). The Nevada plan: Nevada revised statutes (NRS) 387.121: Guaranteed per pupil level of educational financial support. Las Vegas, NV: Author. 34 Ibid. 35 Nevada State Department of Education. (2012). State and local revenue sources in Nevada. Carson City, NV: Author. 36 Brimley, V., & Verstegen, D. A. (2012). Financing education in a climate of change. New York: Pearson. 37 Pepper Sturm, LCB Annual Report 2012. 38 Takahashi, P. (2012, August 6).With pink slips looming, arbitration victory is bittersweet for teachers union. Las Vegas Sun. Retrieved from http://www.lasvegassun.com/news/2012/may/02/school‐district‐says‐teacher‐layoffs‐way‐after‐arb/ 39 Baker, B. D., Green, P., & Richards, C. E. (2008). Financing education systems. Upper Saddle River, NJ: Pearson. 40 NRS 374.015 41 Ibid. 42 Ibid.

American Institutes for Research Study of New Funding Method for Nevada Public Schools—18
guarantee is insufficient to achieve its educational purpose, a district has no
authority to raise the needed additional revenues in order to meet state goals and
accountability benchmarks.
TheMinimumFoundationProgramOnce local revenues are determined, the minimum foundation program can be
calculated to determine the amount of money coming to districts from the state.
Illustration:
State Aid = [State Basic Support Guarantee] (calculated through Nevada Plan) –
[Specified Nevada Plan Local Revenues] (combined revenues from
$2.25 of sales tax and $0.25 per $100 of assessed valuation for
property tax)
ExternalCategoricalFundsNevada provides funding for several categorical programs. These are funds that are earmarked
for a specific educational purpose but are outside the per‐pupil expenditures provided under
the Nevada Plan. Examples include the Class‐Size Reduction program, Early Childhood
Education, remediation programs, and student counseling services.43 Because of the current
economic downturn, several categorical programs are no longer being funded, such as signing
bonuses for in‐demand teachers, innovation/prevention of remediation, and disruptive
students.44 The advantages of external categorical dollars are as follows: (1) they are earmarked
funds that must be spent for their intended purpose and (2) they are relatively easy to add to
existing state legislation. The disadvantages are as follows: (1) they are outside the basic
support guarantee and thus can be easily eliminated (as discussed earlier) and (2) they may be
less flexible as to how dollars can be used. (A state has specific rules and regulations for
external categorical dollars. These stipulations may result in a loss of flexibility and may curtail
districts from delivering programs in a way they deem most effective for their unique student
populations.) External categorical funds are not equalized and thus may have an adverse effect
on the overall equity of a state’s funding allocation system. Finally, with categorical funds that
are dispersed partly through pupil count data and partly through grant applications, smaller
districts that do not have grant writing expertise on staff may be disadvantaged.
CapitalOutlayEssentially, there is no capital outlay funding provided through the state except for capital
expenditures for transportation (i.e., buses, cars, etc.). Revenues for capital expenditures such
as building schools must be raised locally either through bonds or pay‐as‐you‐go programs.
43 Pepper Sturm 2012 LCB Annual report. 44 J. Teska, personal communication, June 29, 2011.

American Institutes for Research Study of New Funding Method for Nevada Public Schools—19
There is a mandated legislative limit on bonded indebtedness: “The total bonded indebtedness
of a county school district must at no time exceed an amount equal to 15 percent of the total of
the last assessed valuation of taxable property.”45 As education is a state responsibility this
places Nevada in a potentially vulnerable position. Traditionally, capital outlay costs have been
borne exclusively by local districts. Despite education being a state responsibility, many states
have not supported local school construction.46 One major problem with local capital outlay
funding is the low assessed valuation of property in small districts. In these districts bonding for
school construction may become a mathematical impossibility. The cost of a new building or a
major renovation could exceed the assessed valuation of a small district. Yet, wealthy and/or
larger districts are able to build or renovate educational facilities with a small tax levy because
of the accumulative assessed valuation. Such potential inequities can undermine a state’s
concept of “reasonably equal educational opportunity.”
AnalysisofFundingSystemBasedonCriteriaforanOptimalSystemThe research literature in public school finance provides multiple criteria for an optimal funding
allocation system. Providing criteria for analysis offers the means by which a state can evaluate
and refine the elements of its own program. For the purpose of this study, the eight criteria
outlined by Chambers and Levin (2009) will be used.47 Although this is not an exhaustive list, it
provides us with the most pertinent elements to examine Nevada’s current funding system. In
addition to the authors’ analysis of the funding formula, comments relative to these criteria
were incorporated from stakeholder meetings.48 The criteria are as follows:
Sufficiently Funded and Equitable on Both Horizontal and Vertical Dimensions. The resource
allocation system provides sufficient funding for programs that meet the needs of a specific
population of students. The system must be horizontally and vertically equitable, that is,
distribute funds to serve students with like needs in a like manner and serve students with
different needs in systematically different ways.
The current funding system only addresses the vertical equity needs of special education pupils.
It does not provide differentiated resources for the needs of other types of pupils. The purpose
of the Wyoming study, discussed in the first section of this chapter, was to address the needs of
taxpayers. The Wyoming study was the impetus for the last major changes to the Nevada state
funding formula other than the addition of special education units in 1973. The current formula
45 Nevada Revised Statutes 387.440. 46 Verstegen, D. A. (2012). A quick glance at school finance: A 50‐state survey of school finance policies and programs. Vol. I: State by state descriptions. Retrieved from http://education.unlv.edu/centers/ceps/study/documents/AQuickGlanceatSchoolFinance‐Vol.I.pdf 47 Chambers, J. G., & Levin, J. D. (2009). Determining the cost of providing an adequate education for all students. Washington, DC: National Education Association. 48 Comments from stakeholders meeting with Nevada district superintendents, NASA, Lake Tahoe, Nevada, June 18, 2012.

American Institutes for Research Study of New Funding Method for Nevada Public Schools—20
is an elegantly designed funding mechanism suitable for an essentially homogeneous rural
state. This makes sense in view of the population base and demographic characteristics of
Nevada in 1967 when the Nevada Plan was implemented. However, the Nevada of the 1960s
and 1970s is not the Nevada of today. Nevada is a diverse state in terms of types of schools
(from one room school houses to 3,000‐plus comprehensive high schools), types of pupils (the
largest school district is now majority minority), and languages spoken (approximately 145
different languages).49
As discussed in the historical overview, Nevada’s performance on some equity measures has
eroded over the past decade. Addressing the differentiated needs of pupils and the unique
needs of necessary small schools were the two most common comments from the stakeholders
meetings conducted under this project. Stakeholders stated that with the current level of
resources, they were not able to sufficiently meet the needs of all of their students. The
student groups mentioned most often for which they struggled to provide effective
programming were at‐risk, ELL, special education, and gifted and talented. In the most recent
National Report Card, Nevada received a grade of “F” for the years 2007, 2008, and 2009 in the
distribution of funding across local districts within a state relative to student poverty.50 This was
one of four fairness measures discussed in the historical overview section of this chapter. This
grade is to be expected in view of the fact that the Nevada Plan does not currently address the
differentiated needs of children in poverty. In addition to the above equity challenges, Nevada
also may exhibit vulnerabilities in the equity of its capital outlay program, particularly for
districts near the ceiling of their bonded indebtedness. In view of these multiple challenges, the
Nevada Plan currently does not meet this criterion for an optimal funding allocation system.
Transparent, Understandable, and Accessible. The system must be clear to all stakeholders,
straightforward, and based on publicly available data.
The State Department of Education has made great strides to ensure transparency of its
funding system. It seeks input from its constituents and commits to continuous improvement.
The formula is broken down into separate modules through its Equity Allocation Model that
explains and illustrates each module. Districts are provided worksheets for submitting Nevada
Plan data elements. The Equity Allocation Model is readily available from the State Department
of Education. However, although the end calculations are available through these modules, it is
difficult to arrive at the underlying data elements. It is not always clear what calculations are
going on “behind” the module data columns. This makes simulation calculations difficult. The
Nevada Plan currently only partially meets this criterion for an optimal funding allocation system.
49 Ryan, C. (2011, March 14). School district seeks study on actual cost of educating students. Las Vegas Sun. Retrieved from http://www.lasvegassun.com/news/2011/mar/14/school‐district‐seeks‐study‐actual‐cost‐educating‐/ 50 Baker, B. D., Sciarra, D. G., & Farrie, D. (2010). Is school funding fair? A national report card. Newark, NJ: Education Law Center. Retrieved from http://www.schoolfundingfairness.org/National_Report_Card_2010.pdf

American Institutes for Research Study of New Funding Method for Nevada Public Schools—21
Cost Based. The formula must carefully enumerate and justify the differential costs of providing
programs to diverse student populations in different settings.
Except for special education funding, the current formula does not enumerate nor justify the
differential costs of providing programs to diverse student populations in different settings. In
addition, the funding formula calculations are incrementally adjusted historical
expenditure data based on a benchmark. Making adjustments to outdated data runs the
risk of perpetuating past inequities. It can lead to the consistent overfunding or underfunding
of programs. The state currently has no provision or process for systematically reviewing cost
ratios or cost data used in its formula. The Nevada Plan currently does not meet this criterion
for an optimal funding allocation system.
Capable of Minimizing Incentives. The funding formula should guard against distortion caused
by overidentification or misreporting of students in need, enrollment sizes, and so on.
The state provides clear definitions for components in the Nevada Plan and because of minimal
weighting, there are limited opportunities for a district to distort data. The Nevada Plan
currently meets this criterion for an optimal funding allocation system. However, there is a
vulnerability that comes more from the “informal negotiations” with districts and
“adjustments” that come after the basic formula is calculated. These may put some districts at
an unfair advantage or disrupt the overall equity of the program.51 One might hypothesize that
if continuous adjustments are necessary to bring the formula in line with current realities, then
perhaps the funding model is no longer viable to meet the educational needs of the state.
Reasonable in Its Administrative Costs. Administrative costs should be minimal at both local
and state levels and the system not overburdened by excessive data and reporting
requirements.
In the data provided, administrative costs were not specified. Steps have been taken by the
State Department of Education to clarify, simplify, and make more transparent the data
demands placed on districts for Nevada Plan information. Although earmarked funds, as well as
unfunded or underfunded mandates, could increase overall administrative costs there was not
sufficient data to evaluate this claim. There was not sufficient information to determine
whether or not the Nevada Plan meets this criterion for an optimal funding allocation
system.
Predictable, Stable, and Timely. The system should be robust and stable enough to allow
policymakers to project future needs and to plan to allocate resources properly and
systematically in advance.
51 Comments from stakeholders meeting with Nevada district superintendents, NASA, Lake Tahoe, Nevada, June 18, 2012.

American Institutes for Research Study of New Funding Method for Nevada Public Schools—22
Stability and predictability are necessary in a state funding system in order for districts to plan
and proceed in an orderly manner from one fiscal year to the next. However, because schools
are financed through tax revenues, a change in the economic conditions can disrupt the
stability of funding.52 As stated earlier, this was particularly true of Nevada because of the
overreliance on the sales tax for the funding of schools. “For this reason, most experts contend
that school funding should come from multiple tax sources which respond in different ways to
changing economic conditions.”53 Because of Nevada’s taxation system for education, the
Nevada Plan currently does not meet this criterion for an optimal funding allocation system.
Accountable for Learning Outcomes and Spending. The state should monitor that resources are
being used effectively and progress toward the educational goal is being realized, which will
require an appropriate accountability structure in place that can support data‐driven decision
making. The system should also provide wide latitude to schools that are producing favorable
result.
Nevada has a comprehensive accountability system based on the requirements of the No Child
Left Behind (NCLB) Act that is monitored by the federal Department of Education. There are
four basic premises of the program: (1) accountability for results, (2) emphasis on doing what
works based on scientific research, (3) expanded parental options, and (4) expanded local
control and flexibility.
NCLB requires that states implement an accountability system for schools that evaluates
whether they are making adequate yearly progress (AYP) toward the goals of the legislation. In
compliance with NCLB, Nevada AYP classifications are made annually and are based on the
percentage of students tested (participation), the percentage of students who score at or above
the proficient level on annual statewide tests of academic achievement, and another academic
indicator: school attendance or graduation rate.54 The state also requires school improvement
plans. Moreover, the state requires that fiscal data be disaggregated to the school and program
level using a downward accounting model.55 The accountability system is clearly delineated on
the Department of Education website and provides, among other things, fiscal, demographic,
attendance, and test performance data. The state also has recently implemented new state
performance standards and a growth model for determining student progress. The Nevada
Plan currently meets this criterion for an optimal funding allocation system. However, an
additional observation is that the funding system does not appear to be linked to state goals or
accountability outcomes. The formula provides no incentives for productivity or educational
outcomes. This may be an area of future exploration.
52 Jordan, K. F., & Lyons, T. S. (1990). Financing education in an era of change. Bloomington IN: Phi Delta Kappa. 53 Ibid, p. 26. 54 Nevada Department of Education. (2007). A guide to No Child Left Behind & adequate yearly progress analyses in Nevada. Carson City, NV: Author. Retrieved from http://nde.doe.nv.gov/APAC.htm 55 EDadmin, In$ite. (2012). http://www2.edmin.com/products/InSite/index.cfm

American Institutes for Research Study of New Funding Method for Nevada Public Schools—23
Politically Acceptable. Implementation should avoid major sudden short‐term loss of funding to
schools.
The Nevada Plan has several mechanisms to ensure a district does not have to experience a
sudden loss in funds. It includes a “hold‐harmless” provision to protect districts during times of
declining enrollment. The hold‐harmless provision provides that enrollment must be based
upon the larger of the current year’s enrollment, or that of either of the previous two years.
The provision holds a district harmless for a one‐year period except for districts with declining
enrollments of 5 percent or more, which are afforded two years.
An additional provision assists school districts with significant growth in enrollment within the
school year. If a district grows by more than 3 percent but less than 6 percent after the second
school month, a growth increment of 2 percent of basic support is added to the guaranteed
level of funding. If a district grows by more than 6 percent, the growth increment is 4 percent.56
The Nevada Plan currently meets this criterion for an optimal funding allocation system.
56 Nevada State Legislative Counsel Bureau, Fiscal Analysis Division. (2011). The Nevada plan for school finance: An overview [Legislative session]. Carson, NV: Author.

American Institutes for Research Study of New Funding Method for Nevada Public Schools—24
A summary of Nevada’s performance on the optimal funding criteria is included in Table 1.2.
Table 1.2. Summary of Performance on Optimal Funding Criteria*
Optimal Funding Criteria Meets
Criteria
Partially
Meets
Criteria
Does Not
Meet
Criterion
Insufficient
Data to
Evaluate
Sufficiently funded; equitable on both
horizontal/vertical dimensions √
Transparent, understandable, and
accessible √
Cost based √
Capable of minimizing incentives √
Reasonable in its administrative costs √
Predictable, stable, and timely √
Accountable for learning outcomes
and spending √
Politically acceptable √
* Optimal funding criteria taken from Jay G. Chambers and Jesse D. Levin, Determining the Cost of Providing an
Adequate Education for All Students (Washington, DC: National Education Association, 2009).
IssuestoExploreSeveral issues evolved from the analysis of Nevada’s funding allocation system that require
dialogue and further exploration. In some cases, we have noted that the item was beyond the
scope of the current study.
The current formula does not sufficiently address the vertical equity needs of the
pupils in the state.
The funding formula was developed for state conditions that have dramatically
changed since its inception.
The Nevada Plan uses incrementally adjusted expenditure data based on a benchmark.
Making adjustments to outdated data runs the risk of perpetuating past inequities.
The state has not updated cost data either through a cost study or costing‐out process.
Currently, the state can only perpetuate the benchmark data incrementally. This can
lead to the overfunding or underfunding of programs.
There is no mandated periodic review of the Nevada Plan. Many states require a
periodic review; for example, every five years. This insures the funding formula is based
on current costs and district characteristics.

American Institutes for Research Study of New Funding Method for Nevada Public Schools—25
The state uses a single count day for enrollment calculation in the Nevada Plan. This
may act as a disincentive to hold pupils in school. It could be a contributing factor to
dropout statistics.
There is no state funding support for capital outlay. This may be an issue for districts at
or near their bonding capacity to be able to maintain and renovate existing facilities or
build new ones. Capital outlay is beyond the scope of the current project.
There is no local leeway. This imposes a greater burden on the state to ensure funding
so that all students have the opportunity to meet state standards and pass appropriate
proficiency examinations. Approaches to providing local leeway or taxation are beyond
the scope of the current study.
The Nevada funding allocation system does not have a sufficiently diverse tax base to
enhance funding stability during changing economic conditions. The diversity of the
current tax base is beyond the scope of the current project.
The funding system does not appear to be linked to state goals or accountability
outcomes. The formula provides no incentives for productivity or educational
outcomes.
Although this study will focus on the vertical equity issues within the formula, the additional
issues can form a nexus for future discussion and planning of possible funding system
refinements.

American Institutes for Research Study of New Funding Method for Nevada Public Schools—26
Chapter2—InventoryofStateFinanceSystems
InventoryofStateFinanceSystems
This chapter responds to the first task listed under the scope of work, development of an
inventory of state finance systems that address individual student needs and characteristics,
including the following: (1) students with disabilities; (2) English language learners (ELLs); (3)
students who are at‐risk as defined by such metrics as test scores or eligibility for free or
reduced‐priced meals; and (4) any other individual student needs and characteristics addressed
in the funding models of other states that are deemed notable. Also discussed, as delineated in
the scope of work, is a list of states that incorporate the needs and challenges of school districts
in remote areas and small schools in their methods for financing public schools. The
information source is a 50‐state survey of state finance policies and programs with data from
fiscal year (FY) 2011.57
These findings are discussed later. First, the major approach for distributing state aid for public
K–12 schooling is reviewed across states to provide a context for discussion of student needs.
Then, mechanisms used to pay for students with special needs and high costs are discussed.
Next, district factors for small schools in remote areas are examined and compared across the
states. Finally, an emerging area of interest is discussed: gifted and talented education funding.
MajorStateFinanceSystems
The 50‐state school finance survey showed that no fundamentally new state finance
distribution models have emerged in recent years. Most states are financing schooling using
funding systems that have been in place for almost a century. However, they have modified
these systems in important ways. States are moving to weighted systems to tailor funding
streams to individual student needs and characteristics and providing additional funding for
remote schools/districts. Also, adequacy—that is, whether funding is sufficient to meet state
laws, rules and regulations‐‐is emerging as a target for the state guarantee under foundation
programs, the type of finance system used in Nevada and the most heavily used system today
(45 states use this system).58
57 Verstegen, D. A. (2011). A 50‐state survey of school finance policies and programs. www.schoolfinances.info. Data were collected from the chief finance officer or their designee in all 50 states for 2010–11, formatted, and posted for peer review and verification on the Web. Changes were incorporated and uploaded to the website. For previous work using 2007 data, see Verstegen, D. A. (2011). Public education finance systems in the United States and funding policies for populations with special educational needs. Education Policy Analysis Archives, 19(21). Retrieved from http://redalyc.uaemex.mx/redalyc/pdf/2750/275019735021.pdf. See also, Verstegen, D. A., & Jordan, T. S. (2009). A fifty‐state survey of school finance policies and programs: An overview. Journal of Education Finance, 34(3), 212–230. 58 See Verstegen, D. A., & Knoeppel, R. C. (in press). Statehouse to schoolhouse: Education finance apportionment systems in the United States. Journal of Education Finance.

American Institutes for Research Study of New Funding Method for Nevada Public Schools—27
Table 2.1 provides a listing of the number of states using each major type of finance system
drawn from the 50‐state survey. As shown in the table, states provide funding to their public
elementary and secondary school districts using one of four types of finance formulae:
Foundation Programs (36 states)—Provides a uniform state guarantee per pupil, with
state and local district funding.
District Power Equalization Systems (3 states)—Provides funding that varies based on
tax rates.
Full State Funding (1 state)—All funding is collected and distributed by the state.
Flat Grants (1 state)—Provides a uniform amount per pupil from state funds; localities
can add funding to this amount.
Combination Systems (9 states)—These combine several funding plans (listed earlier).
Table 2.1. State School Finance Formulae, by State
Finance System State
Foundation program (36)
AK, AL, AZ, AR, CA, CO, DE, FL,
ID, IN, IA, KS, ME, MA, MI,
MN, MS, MO, NE, NV, NH, NJ, NM, NY,
ND, OH, OR, PA, RI, SC, SD, TN, VA,
WA, WV, WY
Full state funding (1) HI
Flat grant (1) NC
District power equalizing (DPE) (3) CT, VT, WI
Combination/Tiered system (9) GA, IL, KY, LA, MT, MD, OK, TX, UT
TheFoundationProgram
The survey findings showed that the Foundation School Program (FSP) was the finance system
of choice, with 36 states reporting using it, including Nevada. When states employing a
foundation program as part of a combination/tiered funding approach are added to states
supporting education through these funding plans, the total number of states using foundation
formulae to pay for public elementary and secondary education increases to 45 states.
Recently, New York, Indiana, and Michigan have shifted to a foundation program for funding
public education.

American Institutes for Research Study of New Funding Method for Nevada Public Schools—28
Foundation program allocation schemes support education through a set state guarantee of
funding per pupil or per teacher, which historically was intended to pay for a basic or minimum
education program. Localities contribute to the state guarantee through a uniform tax rate or
the funding that would result from it. Local support is drawn mainly from the property tax
although some states, like Nevada, also use the sales tax for local funding under the plan. With
similar tax efforts, poor localities raise less funding and wealthy localities raise more funding
because of variations in the local property tax base. The state makes up the difference up to the
state guarantee per pupil—this is called “equalization.” Usually localities can “go beyond” this
amount with additional property taxes that are not equalized by the state.59
The state guarantee per pupil varies across the states. For 2011, Arizona reports providing
$3,267.72 per weighted student (where differential weights exist for grade level, special
education, small and isolated schools, ELL, and other areas approved by the legislature); the
foundation amount in Arkansas is $6,023 per student in average daily membership (ADM)
based on the previous year’s attendance. In Nevada, for the 2011 fiscal year, the foundation
program provided $5,192 in basic support per student enrolled on count day.
The local contribution to the FSP also varies across the states. In Colorado, it is capped at 27
mills ($27 per $1,000 of assessed valuation of property [or $2.70 per $100 assessed valuation]).
The local contribution for public schooling under the Nevada Plan is $0.25 per $100 assessed
valuation (2.5 mills per $1,000 assessed valuation) and 2.25 percent of sales taxes.60 Additional
property taxes ($0.50 per $100 assessed valuation) and various other revenues collected
outside basic aid also contribute to funding under the Nevada Plan.
Of those states employing a FSP, a few (e.g., Alabama) use a teacher unit for allocation
purposes, but most states base allocations on a pupil unit. Students are counted in various
ways. Utah has a weighted student foundation program with additional weight given to
students in small/sparse districts. In Virginia, students are counted for seven months and an
average is taken to determine average daily membership (ADM). In Nevada, there is only a
single count of students enrolled on the last day of the first month of school.
DistrictPowerEqualizingSystems
Unlike FSPs, District Power Equalizing (DPE) Systems support taxpayer equity, rather than pupil
equity, by providing equal yield in the form of funding for similar tax rates (effort) across the
state. They consist of a guaranteed tax base system, guaranteed yield approach, and
percentage equalizing formulae. These are quickly becoming obsolete, most likely because they
permit differential funding per pupil across the state based on variations in tax rates. Only three
59 Brimley, V. D., Verstegen, D. A., & Garfield, R. (2012). Financing education in a climate of change. New York: Pearson. 60 Currently, 2.6 percent of sales tax is provided for public education through the Local School Support Tax (LSST).

American Institutes for Research Study of New Funding Method for Nevada Public Schools—29
states reported using a district power equalization approach, including Vermont (guaranteed
yield), Wisconsin (three‐tiered guaranteed tax base), and Connecticut (percentage
equalization).
These finance systems shift decision choices and policy options for taxing and spending from
the state to the locality. There are various levels of state support based on local choices unlike a
foundation program that provides a single level of basic aid per pupil. For example, the
guaranteed yield system in Vermont has a base of $8,544 per pupil at a tax rate of 8.6 mills. For
every percent of funding the voters add to this amount, the tax rate goes up 1 percent—until
double tax rates become operative above 125 percent of the average spending level.
OtherFundingApproaches
Other major finance systems used by states include full state funding (FSF) or the flat grant—
each is used in only one state. Although local funds are not part of the finance plan under FSF,
flat grants do permit local supplements but they are not equalized by the state. Flat grants were
used by states as an initial means of assistance for schooling but have since been abandoned as
a major approach for state funding because they provide low levels of aid and drive inequalities
because of the excess local funding permitted. North Carolina reports using a flat grant as the
major state aid mechanism. Hawaii is the only state that reports employing full state funding. In
Hawaii, all public education funding is collected and distributed by the state.
Interestingly, nine states provide two‐tiered systems, that is, combination approaches to
distribute funding to school districts: Georgia pays for schools through a combination
foundation and guaranteed yield formula, Illinois uses three finance formulae. In Kentucky,
under SEEK (Support Education Excellence in Kentucky), funding is derived from a base
foundation level with an optional two tiers of supplementation under a District Power
Equalization Program.
KeyIssuesinChoosingaFundingFormula
A key issue related to funding formulae and the amount of funds they provide per pupil is
whether the funding plan is equitable with respect to providing equal opportunities for all
students, regardless of their circumstance. Another issue is whether the amount of funding is
adequate—sufficient to teach all children to ambitious standards, laws, and requirements. The
following are some examples of how selected states have addressed this issue of adequacy:
In South Carolina, base funding supports a minimally adequate education, according to
the state.
Maine’s foundation program specifically mentions that it is an “adequacy”‐based
formula—it uses cost analysis to establish the amount, level, and cost of education
components needed in each school to ensure all students have equitable opportunities
to achieve proficiency on learning standards.

American Institutes for Research Study of New Funding Method for Nevada Public Schools—30
Missouri develops an “adequacy target” based on several factors, including the average
current expenditures of districts meeting all performance standards established by the
Missouri State Board of Education.
Therefore, whether the adequacy target funds a minimum or quality education is an important
issue that the state inventories raise. Many states have moved away from the minimum
foundation program to providing an adequate foundation program that targets quality, often in
response to school finance litigation.61 Also, how basic support is determined is another
important issue. In the past, the amount of the major equalizing grant was based more on
politics or residual budgeting than on a rational basis anchored in research.62
FinancingIndividualStudent/DistrictNeedsandCharacteristics
States also provide finance adjustments to the foundation amount/basic support to
acknowledge cost pressures beyond the control of the school district that affect providing an
equitable educational opportunity for all students. These cost pressures include size (e.g.,
enrollment), geography (e.g., locale type or dispersion of enrollment), labor market
characteristics (e.g., supply and demand for labor and cost of living), and special student needs
and characteristics (e.g., poverty, English learner, or disability status of students). Students in
poverty (as a proxy for students at risk of low performance or dropping out of school), students
with limited English proficiency, or students with disabilities may require additional resources
(e.g., smaller classes, specialized staff, or instructional materials) to meet state standards, laws,
and goals. Small and remote school districts may also experience higher education per‐pupil
costs because of diseconomies of scale.
Provisions to increase funds for justifiably higher costs than the foundation amount can be
included in the major finance grant through weights or can be added to that amount as a
separate provision outside the major finance formula, through categorical aid. A question
remains concerning whether the amounts expended for high‐cost students are sufficient and
the interplay of funding streams when students fall into several special categories. Another
issue is what constitutes best practice in providing funding for individual student/district needs.
Federal aid also is provided for individual student needs and characteristics, as specified later.
However, rules and regulations accompanying the receipt federal aid—including supplement
not supplant and maintenance of effort—usually disallow comingling of federal, state and local
dollars. 61 Verstegen, D. A. (2004). Towards a theory of adequacy: The continuing saga of equal educational opportunity in the context of state constitutional challenges to school finance systems. Saint Louis University Public Law Review, 33(2), 499–530. Verstegen, D. A. (2002). Financing adequacy: Towards new models of education finance that support standards‐based reform. Journal of Education Finance, 27(3), 749–781. Verstegen, D. A. (1998). Judicial analysis during the new wave of school finance litigation: The new adequacy in education. Journal of Education Finance, 24(1), 51–68. 62 Verstegen, D. A. (2002). Financing adequacy: Towards new models of education finance that support standards‐based reform. Journal of Education Finance, 27(3), 749–781.

American Institutes for Research Study of New Funding Method for Nevada Public Schools—31
SpecialEducationFunding
Table 2.2 lists funding mechanisms states use to pay for students receiving special education
and related services. Appendix D provides a brief description of each state’s special education
funding provision. State aid for exceptional students is supplemented by federal aid under the
Individuals with Disabilities Education and Improvement Act (IDEIA).
According to the 50‐state survey, all but one state reports providing state aid for special
education although apportionment systems vary. Generally, states pay for special education
programs and services using one of four methods:
Per‐pupil funding—either pupil weighted or a flat grant
Cost reimbursement—state defines eligible costs
Instructional/teacher units—funds to support teachers
Census—based on total student population rather than eligibility for special education
States may also provide funding for services through intermediate units rather than directly to
the local education agency (LEA) as is the case in Colorado, New York, Montana, and Wisconsin.
Other approaches include funding for extraordinary high‐cost students, which is used in tandem
with other apportionment methods (described in more detail later).
Student Weights. Overall, 20 states reported providing assistance for special education
students through weights that recognize the excess cost of programs and services beyond
general education. For example, if additional special education costs are 90 percent above
general education funding, the special education weight would be 0.90; the total student weight
(including general education) would be 1.90.63 States may set limits on the percentage of
students funded under weighted systems to limit costs and can include multiple or single
weights for different categories of disability to reflect cost variations. When states use weights
to fund special education, as general funding increases or decreases, so does special education
funding. Weights treat special students equitably but provide no incentive for efficiency.
Weights also vary widely across states. Some of the options used by states are highlighted in
the following list:
Several states (e.g., Maryland, Oregon, and Utah) use a single weight to fund special
education programs.
63 Parrish, T. B., & Verstegen, D. A. (1994). Fiscal provisions of the Individuals with Disabilities Education Act: Policy issues and alternatives (Policy Paper No. 3). Palo Alto, CA: American Institutes for Research, Center for Special Education Finance. For seminal work on special education costs, see Rossmiller, R. A., Hale, J. A., & Frohreich, L. E. (1970). Educational programs for exceptional children: Resource configurations and costs (National Education Finance Project, Special Study No. 2). Madison: University of Wisconsin. Verstegen, D. A. (1994). Fiscal provisions of the Individuals with Disabilities Education Act: Historical overview (Policy Paper No. 2). Palo Alto, CA: American Institutes for Research, Center for Special Education Finance.

American Institutes for Research Study of New Funding Method for Nevada Public Schools—32
Arizona has 10 weights and Oklahoma has 12 weights based on a student’s disability (e.g.,
orthopedic impairment, visual impairment).
Texas has nine weights based on instructional arrangements (e.g., resource room, self‐
contained), including a weight (an additional 0.10) for “mainstreamed students.”
Hawaii uses four broad categories of need coupled with hours a week that services are
rendered. Indiana has five categories of support.
Iowa provides three weights based on need: 0.72, 1.21, and 2.74.
Delaware and Kentucky have three broad weighted categories based on exceptionality. For
example, Kentucky provides funding for children and youths with mild, moderate, and severe
disabilities, weighted 0.24, 1.17, and 2.35, respectively.
Table 2.2. State Allocation Policies for Special Education
Allocation Mechanism State
Per pupil/Weighting (20) AZ, FL, GA, HI, IA, KS, KY, LA, MD, MO,
NY, OH, OK, OR, SC, TN, TX, UT, WA, WV
Cost reimbursement (7) AR, IN, ME, MI, MN, NE, VT, WY
Unit (6) AL, DE, ID, MS, NV, VA
Census (9) CA, ID, IL, MA, NJ, NC, ND, NM, PA
Other (16)* AL, AR, CA, CO, CT, ID, IL, MD, MN,
MT, NH, NY, ND, OR, SD, WA
*Multiple methods are used in some states.
Cost Reimbursement and Unit Based Funding of Special Education. States also use cost
reimbursement methods to support special education. These methods usually define eligible
cost‐categories and the percentage of these costs that will be reimbursed by the state. Seven
states currently use this approach. In addition, six states use instructional unit approaches that
pay for teachers, generally based on need or the number of students served. Nevada uses this
“unit” approach to pay for special education and related services.
Census‐Based Funding of Special Education. A new category of interest is census‐based
funding. It provides funding based on an overall percentage of total students in a school district,
not on the basis of the number of students eligible for special education and related services.
Thus, this model provides no fiscal incentives for classification yet provides funding for special
education programs and related services. California uses this model and reports that it is based
on the assumption that over reasonably large geographic areas, the incidence of disabilities is
relatively uniformly distributed. New Jersey’s new funding system for special education also
uses a census‐based method of funding.

American Institutes for Research Study of New Funding Method for Nevada Public Schools—33
Other Approaches to Funding Special Education. Sixteen (16) states report “other” funding
approaches that may be used in combination or singularly. Alaska provides a block grant to
districts that funds special students, including vocational education, gifted and talented, and
bicultural/bilingual students. Illinois and several other states use additional types of funding for
special education such as personnel reimbursement, preschool and private school placement
funding allocations.
Another common example is to couple census funding with “other” state assistance for
extraordinary or, what are often referred to as catastrophic, costs a district may incur for the
most severely involved students with disabilities. Several states report funding extraordinarily
high‐cost, exceptional students. For example, Alabama reports a “catastrophic” funding
category for this purpose, Connecticut reports an Excess Cost Grant for extraordinary costs a
school district may incur for special education students, defined as 4.5 times the prior year’s
average cost per pupil. Massachusetts has a “circuit breaker” that provides state funds special
education costs above 4 times the foundation budget at 75 percent of costs.
FundingforLow‐Income/At‐RiskStudentsandELLs
Several states report providing supplemental funding for low‐income/at‐risk students and
English learners, as shown in Tables 2.3 and 2.4. Appendix E provides a short description of
state‐by‐state funding provisions for low‐income students or students at‐risk of dropping out of
school. Appendix F provides a listing of weights states use for funding low‐income/at‐risk
students. A state‐by‐state description of funding mechanisms for English learners/limited
English proficient students is shown in Appendix G. A listing of ELL funding and weights is
provided in Appendix H. State funds for low‐income students are supplemented by federal aid
under Title I of the Elementary and Secondary Education Act, also called the No Child Left
Behind Act.
Most states use weighted approaches to address the needs of low‐income/at‐risk students and
ELLs. Variations among these states include the eligibility requirements put in place and
whether the funding adjustment occurs inside or outside the major finance system. In addition,
formulae for low‐income/at‐risk students may be used to target funding to a school based on
federal FRPL participation (which defines eligible incomes), but once funding is received at a
school site, it is available to redistribute based on particular needs, such as low test scores or
remediation that are identified by the school district.
Currently, 34 states supplement the general state finance system for low‐income students, a
proxy for low achievement and/or being at risk of dropping out of school. There are 14 states
that do not provide additional funding for these students, including Nevada. A few states base
funding directly on the number of students in need of remediation, which is a notable change

American Institutes for Research Study of New Funding Method for Nevada Public Schools—34
from the past when funding was based on the number of students eligible for the federal free
or reduced‐price lunch (FRPL) program—the factor most used today. For example:
In Kentucky, the eligibility criterion is based on free lunch recipients only
In Michigan, it is free breakfast, lunch, or milk pupils
In Iowa, eligibility is based partially on both the free or reduced‐price lunch count and
the enrollment of the school district used for the budget.
In Kansas, participation is based on free meals, with additional funds based on density
and nonproficient at‐risk students.
Table 2.3. State Funding Mechanisms for Low‐Income/At‐Risk Students
Program/Policy Yes—36 No—14
Low‐Income/ At‐Risk Funding
AL, CA, CO, CT, DE, GA,
HI, IL, IN, IA, KS, KY,
LA, MA, MD, ME, MI, MN,
MS, MO, NE, NH, NJ, NY,
NC, OH, OK, OR, PA, SC,
TN, TX, VT, VA, WA, WI
AK, AZ, AR, FL,
ID, MT, NV, NM,ND, RI,
SD, UT,WV, WY
Survey information revealed that some states provide additional funding based on
performance, or provide assistance for students at‐risk of dropping out of school. For example:
New York provides state support for students who are at‐risk of not meeting learning
standards.
South Carolina provides funding directly for students who fail to meet statewide
standards in reading, writing, and mathematics or who do not meet the first‐grade‐
readiness test standards.
In Delaware, an Academic Excellence unit is provided for each group of 250 pupils.
Funds also are provided for extra time for students at risk of not meeting state
standards in core subjects.
Weights vary but range from an additional 0.05 in Mississippi to 0.97 in Maryland. The average
weight is 0.29—or an additional 29 percent funding per pupil beyond the base.64 However,
most states provide about an additional 0.20 to 0.25 in funding for low‐income students and
target eligibility on either federal FRPL status or both.
Missouri provides an additional 25 percent
64 The ELL and low‐income range and average reflect computations of single weights reported by states not multiple or sliding scale weights.

American Institutes for Research Study of New Funding Method for Nevada Public Schools—35
Kentucky, 15 percent
Georgia, 31 percent
Minnesota, 100 percent for free lunch recipients and 50 percent for reduced‐price lunch
recipients
Kansas, 45.6 percent
Georgia, 53.37 percent
Some states provide funding on a sliding scale based on prevalence rates (concentrations) of
students that are low income, because larger concentrations of low‐income students incur
higher costs, on average. This is a new area of support that emerged in survey findings.
In Arkansas, for a school district in which 90 percent or more students are eligible for
FRPL, the state provides an additional $1,488 per pupil. For 70 percent to 90 percent,
additional funding is $992. For less than 70 percent, additional funding is $496 per pupil.
In Kansas, a weight of 45.6 percent is used with additional funds available for high or
medium density. For example, for high density (students on free meals exceed 50
percent of total district enrollment) or a density of 212.1 students per square mile and a
free lunch percentage of at least 35.1 percent and above—districts receive 0.10 per at‐
risk student.
In New Hampshire, differentiated funding varies by school based on the rate of free and
reduced‐price lunch recipients from 12 percent (additional funding of $863 per student)
to above 48 percent (additional funding of $3,450 per student).
Depending on the overall context of the funding allocation system and the supplemental
manner in which the differentiated needs of students may be addressed, lack of formula
funding may put school districts in a position of having to make a false choice: either take funds
from the general education program to pay for high‐cost students at‐risk of failing academically
and/or dropping out of school or ignore the special needs of these students altogether.
FundingforEnglishLearners
Funding for ELLs, bilingual education, or students with limited English proficiency (LEP) is a
growing area of interest across the states. These funding policies are shown in Table 2.4 by
state and are described in Appendix G. Appendix H provides illustrative listing of state funding
approaches for ELL students including weighted approaches. Federal aid for ELL is provided
through Title III, Part A—English Language Acquisition—under the Elementary and Secondary
Education Act.
Currently, more than 85 percent of states provide additional support for ELL or LEP students.
Only eight states, including Nevada, do not provide funding for ELL/LEP students.

American Institutes for Research Study of New Funding Method for Nevada Public Schools—36
Table 2.4. State Funding Mechanisms for ELLs
Funding Policy Yes—42 No—8
English Language Learner/ Limited English Proficient
AL, AK, AZ, AR, CA, CT,
FL, HI, ID, IL, IN, IA, GA,
KY, KS, LA, ME, MD, MA,
MI, MN, MO, NE, NH, NJ,
NM, NY, NC, ND, OK, OH,
OR, RI, TN, TX, UT, VA,
VT, WA, WI, WV, WY
CO, DE, MS, MT,
NV,PA, SC, SD
States support English learners through a variety of funding methods, including weighted
approaches as well as with block grants, per‐pupil funding, unit funding, and lump‐sum general
state appropriations. Weights vary widely from 0.10 in Texas to 0.99 in Maryland. The average
weight is 0.387, or anther 38.7 percent in funding. Selected approaches for the states follow:
Wyoming provides a full‐time teacher for every 100 ELL students.
In Arizona, a weight of 0.115 is included in the basic state aid calculations.
Florida reports funding for speakers of other languages weighted at 0.147.
The new weighted‐student formula in Hawaii supports ELL students at 0.2373 of general
education aid.
Iowa provides an additional 0.22 per pupil.
Missouri supports LEP students at 0.60 of Basic Aid when the count of students exceeds
the statewide threshold, currently at 1.1 percent of the district’s average daily
attendance.
New Jersey provides an additional 0.50 for a student who is limited English proficient
(LEP). If a student is both LEP and low income, the weight is 0.125.
Only three states provide no additional support for either compensatory education or English
learners: Nevada, Montana, and South Dakota.
FundingforRemoteandSmallSchools
Table 2.5 lists states that provide funding for remote and small schools through their finance
system. Appendix I provides a short description of each state’s provision for distributing these
funds to school districts. As shown, 32 states recognize size and/or sparsity of small schools or

American Institutes for Research Study of New Funding Method for Nevada Public Schools—37
districts.65 Small size is used to adjust funding in 25 states; 15 states provide assistance to
isolated school districts with some states employing both adjustments. Eighteen states do not
include either factor in their funding system while several states include both.
Table 2.5. State Funding Mechanisms for Sparsity/Density of Small Schools
Program/Policy Yes—32 No—18
Sparsity/Density or Small Schools
AK, AZ, AR, CA, FL,
HI, ID, IN, IA, KS,
LA, ME, MI, MN, MO,
NV, NM, NY, NC, ND,
OH, OK, OR, SD, TX,
UT, VT, VA, WA. WV,
WI, WY
AL, CO, CT, DE,
GA, IL, KY, MD,
MA, MS, MT, NE,
NH, NJ, PA, RI,
SC, TN
The following represents some highlights of how different states incorporate size and sparsity
into their finance system for K–12 schools:
Florida has a sparsity index that recognizes the relatively higher operating cost of
smaller districts due to sparse student populations.
Kansas employs a linear transition formula ranging from 100 to 1,622 students.
Districts with fewer than 100 students have a low‐enrollment weight of $3,993.42
per pupil. Each increase or decrease of one pupil changes the low‐enrollment weight
down or up (i.e., inversely to the enrollment change). High enrollments of 1,622 and
over are weighted an additional 0.03504 times the Basic State Aid Per Pupil (BSAPP).
In New Mexico, the following types of schools and districts qualify for additional aid:
Schools with fewer than 200 elementary and junior high school pupils
Districts with fewer than 200 or 400 senior high school pupils
Districts with between 4,000 and 10,000 average daily membership (ADM), but
fewer than 4,000 ADM per high school
Districts with fewer than 4,000 total ADM
In Oklahoma, school district size of 529 or less is weighted in the State Aid formula
with a Small School District Weight.
Wyoming uses multiple adjustments to provide needed teachers based on size. An
elementary school with fewer than 49 pupils in average daily attendance receives
65 See also Grider, A., & Verstegen, D. A. (2000). Legislation, litigation and rural & small schools: A survey of the states. Journal of Education Finance, 26(1), 103–120.

American Institutes for Research Study of New Funding Method for Nevada Public Schools—38
one full time teacher for every 7 students and one assistant principal position. If it
has more than 49 students, then it receives a minimum of 6 teachers.
OtherIndividualStudentNeedsandCharacteristics
There are a variety of other weights/adjustments states use to tailor funding systems to meet
unique student and district needs in K–12 education. For example, approximately 28 states,
including Nevada, fund vocational education, or career and/or technical education. In
Louisiana, students in vocational education have a supplemental cost weight of 0.06. Hawaii
adds a supplemental cost weight for transient students of 0.05. In New Jersey, security aid is a
component of the funding system. In Alaska, a cost differential is incorporated into the funding
system. Pennsylvania and Maryland employ geographic cost of education adjustments.
In addition to weights for student characteristics and needs, the most prevalent type of funding
weights used across the states is for different grade levels. These modify base funding amounts
by grade level within a school. For example, Hawaii provides supplemental weights for grade‐
level differences, which are as follows: 0.15 for K–2, 0.0347 for elementary school, 0.1004 for
middle school, and 0.0240 for high school.
GiftedandTalentedFundingPolicy
Another area of funding for special student characteristics emerging from the survey findings is
for gifted and talented students (G&T). Information on funding for G&T students is shown by
state in Table 2.6; Appendix J describes each state’s policy for financing gifted and talented
students. Currently, 33 states provide additional funding for G&T student programs as part of
their finance system; 17 states, including Nevada, do not provide separate G&T funding.66
In Arkansas, an incremental weight of 0.15 is provided per pupil based on 5 percent of
the school district’s ADM the previous year.
In Virginia, the state provides one instructional position per 1,000 eligible students.
Hawaii has an incremental weight for gifted and talented students of 0.0265 for an
estimated 3 percent of the school’s total population.
Louisiana reports an incremental weight of 0.60 for gifted students.
66 Nevada does not receive additional federal aid for gifted and talented students.

American Institutes for Research Study of New Funding Method for Nevada Public Schools—39
Table 2.6. State Funding Mechanisms for Gifted and Talented
Funding Policy Yes—33 No—17
Gifted and Talented AK, AR, CA, CO, FL,
GA, HI, ID, IA, IN, KY, LA,
ME, MD, MN, MS, MO, MT,
NJ, NM, NC, ND, OH, OK,
PA, SC, TN, TX, UT, VA
WA, WI, WY
AL, AZ, CT, DE, IL, KS,
MA, MI, NE, NV,
NH, NY, OR, RI,
SD, VT, WV
Only two states, South Dakota and Nevada, report no additional state funding for any of the
following student needs and characteristics: compensatory/at risk students, English learners,
or gifted and talented students.67
Summary
Nevada provides funding to public schools using a foundation program—the finance system
used in whole or in part in 45 states. However, Nevada’s funding system was created in 1967,
and it has changed little over the past nearly 50 years. It generally lacks support for individual
student needs and characteristics. Much has changed since the state initiated the Nevada Plan
in 1967. Nevada was mainly a rural state then with greater homogeneity—but student diversity
has grown enormously since that time. Yet, Nevada is one of only two states that does not fund
low‐income/at‐risk students, English learners, or gifted and talented students. Moreover, small
and remote schools do not receive additional state aid. As the committee that recommended
the Nevada Plan stated at the time, “Future experience may dictate necessary changes not
indicated by today’s conditions.” Perhaps that time has arrived in the Silver State.
67 Note the inclusion of Nevada in this statement reflects how the Nevada Department of Education responded to the survey item. However, the authors acknowledge that the state does provide some funding for G&T technology as well as allows special education funding to be used for G&T students. Nevertheless, it does not have a separate programmatic funding stream for G&T students.

American Institutes for Research Study of New Funding Method for Nevada Public Schools—40
Chapter3—IdentifyingAdjustmentsUsedtoAddressCostFactors
DefiningCostFactorsThe main motivation behind this study is to investigate adjustments that might be made to the Nevada school finance system to improve the equity with which it allocates funding to districts based on the needs of the student population served, as well as regional characteristics that affect the costs of providing educational services. This is well‐aligned to general consensus in the field of education finance. Specifically, the research questions embedded in our investigation are responsive to a large body of work in the education finance literature that focuses on identifying factors that differentiate the costs of providing education among various settings. In the Handbook of Research in Education Finance and Policy, Duncombe and Yinger (2008) sum up the main factors thought to affect educational costs (cost factors):
Education costs can be affected by three categories of factors, each of which is outside of the district control: 1) geographic differences in resource prices, 2) district size, and 3) the special needs of some students. (p. 238)
We operationalize these cost factors with the following definitions and explanations of how
these factors affect the cost of providing similar educational opportunity across students with
differing circumstances:
Student Needs—Pupil characteristics that necessitate additional and/or specialized services, including low‐income (eligible for free or reduced‐price lunch [FRPL]), English language learner (ELL) designation, and enrollment in special education programs.
Students from low‐income families, whose first language is one other than English, or who have been identified with a disability will require additional services to meet their needs to achieve state outcome standards. These additional services require the investment of additional personnel and non‐labor resources, that is, additional costs. Vertical equity (i.e., ensuring students with varying needs have the same educational opportunities) will require the state to ensure the provision of additional dollars for schools and districts who have larger shares of these special need populations of students.
Scale of District Operations—Geographic and population characteristics of a school district, including enrollment (number of students served by a district) and student population density (district enrollment divided by the area of a district in square miles).
Scale refers to the factors that may result in costs associated with the diseconomies
of small school districts. In fact, scale is really a short‐hand term for a combination of
factors that include the size as measured by enrollment; density, as measured by the
enrollment per square mile; and sparsity of population (as reflected in the dispersion
of population within a geographic area). Remote rural districts that are located far
away from more urbanized communities may require schools to operate at

American Institutes for Research Study of New Funding Method for Nevada Public Schools—41
necessarily small sizes because of the cost of transporting children to and from
schools—that is, to avoid children spending inordinate amounts of time on school
buses. Such schools will be small and will require replication of certain minimum
levels of administrative and support costs (the services of principals, pupil support,
and custodial personnel) and the combination of educational services across
multiple grade levels (e.g., self‐contained classes with three or more grade levels per
classroom). Both of these factors will tend to raise the cost per pupil of providing
quality educational services.
The cost perspective on economies of scale is of primary interest in school finance
policy. This is because the measurement of cost differences across districts of varied
size has direct implications for the design of state school funding formulas. For
example, if it is found to cost 25 percent more than average to provide comparable
education services in a district with only 300 pupils, then the state may choose to
allocate an additional 25 percent aid per pupil. Legislators should be cognizant,
however, of the anticonsolidation incentive created by such policies.
Figure 3.1 provides a general depiction of how unified (K–12) school district per‐
pupil operating costs vary with district size, holding outcomes, and other factors
constant (from Baker, 2005).68 Y represents the per‐pupil costs of achieving a
specific level of student outcomes in a district that is scale efficient (2,000 to 6,000
or more students). This cost is set to 1.0 (1 x basic cost). Costs rise for smaller
districts along a curve, increasing gradually for districts with below 2,000 students
down to 1,000 students, then increasing more sharply approaching 300 students and
fewer. In studies of marginal costs associated with economies of scale, the marginal
costs for the smallest districts range from about 20 percent to 100 percent above
basic costs in scale efficient districts.
68 Baker, B. D. (2005). The emerging shape of educational adequacy: From theoretical assumptions to empirical evidence. Journal of Education Finance, 30(3), 277–305.

American Institutes for Research Study of New Funding Method for Nevada Public Schools—42
Figure 3.1. General Depiction of the Relationship Between Per‐Pupil Operating
Costs and District Size
Geographic Differences in Resource Prices—Differences in the costs to hire similarly qualified staff across different regional labor markets.
Adjustments for this cost factor focus on assessing the geographic variations in the
cost of providing educational services across arising out of differences in the labor
markets within which districts operate. It attempts to answer the following question:
“How much more or less does it cost to recruit and employ comparable teachers,
administrators, and other school staff in different locations throughout a state?”
Ideally, to properly control for the true variation in staffing costs across labor
markets (districts), one must utilize estimate that reflects factors that are solely
outside the control of local school district decision makers. That is, one cannot
simply compare the average salaries of teachers and other educational staff across
districts, as these reflect preferences of the demand rather than the supply side of
the market (for instance, the preference of some districts to pay much higher wages
regardless of what the going rate is for teachers in their immediate labor market).
Cos
t p
er P
upil
2,000 to 6,000
District Enrollment
<300 >10,000
Y (1.0)
(2.0)
Figure 2District size and costs

American Institutes for Research Study of New Funding Method for Nevada Public Schools—43
GeneralMethodologyThe proscribed methodology developed in the original scope of work dictated a sequential
approach in which the research team would first identify five states that were similar to Nevada
in terms of various cost factors related to student needs (poverty, English learners, special
education) and scale of district operations (district size in terms of enrollment, degree of
remoteness, etc.). Next, it would be determined whether or not each of the five similar states
included an adjustment mechanism in its school funding systems for the differential costs of
providing education to students in remote rural areas. Any states that did not incorporate such
an adjustment in their funding system would be discarded and replaced with an alternative
state that did make use of such an adjustment. As a final step, the funding mechanisms of this
group of similar states that also made use of rural remote funding adjustments would be
evaluated for effective practices in terms of funding adjustments to account for the differential
costs of serving students in remote rural areas but also for student needs. The application of
these cost adjustment practices would then be simulated in the context of the Nevada state
funding system.
Figure 3.2 depicts the intersection between this state selection criteria and identification of
effective practices in a Venn diagram, where the intersection of all three circles denoted by the
star in the diagram represents the target set of states with effective funding practices,
necessarily including remote rural adjustments, that are similar in terms of student needs and
regional characteristic to Nevada.
Figure 3.2. Venn Diagram of Selection of States to Identify Effective Funding Practices
States Similar to Nevada in Terms of Student Needs and
Regional Characteristics
States With Effective Funding
Practices
States With Explicit Funding Adjustments for Students in Remote Rural
Areas
Target Set of Effective
School Funding
Practices

American Institutes for Research Study of New Funding Method for Nevada Public Schools—44
This chapter provides more in‐depth descriptions of the research steps taken to identify similar
states and the effective funding practices used to address each of the various cost factors.
DeterminingSimilarStatesSelecting comparison states to serve as Nevada’s “peers” with respect to student needs and
district characteristics required compilation and synthesis of a broad collection of extant,
publicly available data sets containing demographic, administrative, organizational, and fiscal
information. These data were used, as proposed, to investigate and characterize the diversity of
districts within states along types of dimensions: student needs, district remoteness and
rurality, and revenue sources.
Selecting states similar to Nevada is a difficult task given the heterogeneity of states and
Nevada’s uniqueness. Because no common algorithms exist for selecting similar entities based
on the types of data and criteria involved, the research team developed a relatively
straightforward methodology. The approach identifies states that are similar to Nevada with
respect to the variables of interest by focusing on average district‐level measures of student
needs, district remoteness, and revenue sources within groups of districts categorized by four
locale classifications. The locale area classifications are determined by the National Center for
Educational Statistics for every school district in the nation, which denote the degree of
remoteness based upon population and proximity to urban areas. These four main locale types
within which districts have been analyzed are as follows: (1) City, (2) Suburb, (3) Town, and (4)
Rural. The table in Appendix K provides the formal definitions of each locale types. Table 3.1
summarizes the data sources for the key variables used in this analysis.
To facilitate comparisons between Nevada and other states, averages across districts for each
of the variables listed below were calculated by locale group within each state. This meant that
for each variable of interest, we were actually making four distinct comparisons between
Nevada and each state, one for each locale type. For example, the average poverty across
districts in Nevada was calculated for the City, Suburb, Town, and Rural districts separately and
these were compared with similar locale‐specific district averages in other states.
The process of making these comparisons was automated. For each variable of interest, each of
the locale‐specific averages across states were sorted and ranked. Any states that fell within
seven positions in the rankings above or below Nevada were then identified as similar for that
variable/locale combination. To summarize all of these lists, a score was given to each state for
each variable of interest, which indicated the number of locales in which the state ranked
similar to (within seven rankings of) Nevada. These scores ranged from 0, meaning no locales in
the comparison state showed averages similar to Nevada, to 4, which indicated every locale
average was deemed similar. For example, Colorado received a score of 4 for the percent of ELL
students. This meant that Colorado had comparable average percentages of ELL students for

American Institutes for Research Study of New Funding Method for Nevada Public Schools—45
City, Suburban, Town, and Rural school districts compared with the same types of school
districts in Nevada. North Dakota, conversely, received a score of 0, which meant that none of
the locale‐specific averages for ELL students was similar between this state and Nevada.
Table 3.1. Data Sources Used to Identify Similar States
Dimension Analysis Variables Contributing Data Source
Student
Needs
Percent English Learners National Center for Education Statistics (NCES)
Common Core School and District Data Percent Special Education
Percent FRPL Eligible
Percent Poverty U.S. Census Small Income Area Poverty (SAIPE) Data
Remoteness
and Rurality
Student Density
National Center for Education Statistics (NCES)
Common Core School and District Data US Census Bureau—TIGER/Line® Shapefiles
Herfindahl Index69
National Center for Education Statistics (NCES)
Common Core School and District Data
Percent of Districts by Locale
Percent of Statewide
Enrollment by Locale
District Enrollment Size
Revenue
Sources
Percent of Revenue From
Local Sources
National Center for Education Statistics (NCES)
Common Core District Finance Data
Percent of Revenue From
State Sources
Percent of Revenue From
Federal Sources
Table 3.2 contains the results of this analysis. Each column in the table represents one of the
dimensions of student needs and scale of operations that were analyzed. For example, the first
column of the table indicates that Colorado, Delaware, Kansas, Montana, South Dakota, and
Wyoming were all deemed similar to Nevada in terms of the incidence of student poverty or
low‐income status. Although these results are interesting, they do not offer clear patterns of
states that are consistently similar to Nevada across all or even a majority of the student need
and regional characteristic dimensions considered.70
69 The Herfindahl Index is used to measure the within‐district concentration of the schooling market. The index ranges from 0 to 1, where lower values denote a lower market concentration where the proportion of districtwide enrollment is more evenly shared across schools, while higher values indicate that there is a more uneven distribution of enrollment share across schools in the district. 70 Although within categories of these dimensions, there are states that are similar across multiple dimensions (e.g., Colorado with respect to student needs, Florida with respect to regional characteristics, etc.).

American
Institutes for Research
Study of New
Funding Method for Nevada Public Schools—46
Table 3.2. States With Sim
ilar Within‐Locale Characteristics
Studen
t Needs
Scale of District Operations
Reven
ue Sources
Percent
Poverty or
FRPL Eligible
Percent
English
Learners
Percent
Special
Education
Studen
t Den
sity
Herfindahl
Index
Percent
of
Districts
by
Locale
Percent of
Statew
ide
Enrollm
ent
by Locale
District
Enrollm
ent
Size
Percent
of
Reven
ue
From
Local
Sources
Percent
of
Reven
ue
From
State
Sources
Percent of
Reven
ue
From
Federal
Sources
CO
AZ
CT
AK
SC
FL
FL
FL
CA
AL
AL
DE
CA
IA
FL
UT
MA
GA
GA
GA
KY
IN
KS
CO
LA
ID
WV
MD
MD
KY
KS
SC
KY
MT
KS
MO
MT
NJ
UT
LA
KY
WV
MT
SD
OR
ND
RI
VA
MD
LA
SD
WY
TX
NM
UT
NM
MI
TN
UT
WY
TN
OK
TX
UT
OR
WA
VA
SC
WV
TN
WV

American Institutes for Research Study of New Funding Method for Nevada Public Schools—47
Given these findings, the general methodology put forth above, although perfectly logical, must
be modified somewhat to accommodate the reality that Nevada is truly unique in terms of the
combinations of student needs, scale of district operations, and composition of revenue
sources. To this end, we have broadened our approach to identify the most effective practices
with respect to the differential funding of student needs (low‐income, English learners, and
special education) and remote/rural populations to encompass all states. Once those states
using the relatively most effective practices in each of these areas are identified (and the
practices simulated in the context of Nevada’s state funding system), we point out whether
they also happen to be similar to Nevada along this dimension.
IdentifyingCostAdjustmentsThe following section describes the analyses used to identify the funding practices thought to
be most effective across states, which are later used in the simulation model presented in
Chapter 4. Different methods were drawn upon to identify funding practices that could be
considered effective with respect to each of the cost factors. As different methods were
employed to identify effective practices for the various cost factors, the descriptions are
organized around each of these approaches as follows:
Table 3.3. Approaches Used to Identify Cost Factor Specific Funding Practices
Cost Factor Approach Used
Student Poverty
Scale and Student Density Empirical Analysis of Implicit Funding
Weights Across States
Special Education Geographic Differences in Labor Prices
Mainstream Education Finance Literature
English Learners Evaluation of Explicit Funding Weights
Used in Other States
IdentifyingStudentPovertyCostAdjustmentsTo identify which states employ more effective funding practices with regard to accounting for
the differential costs of students that are impoverished or being served in remote rural areas,
we relied on a statistical analysis that estimates the relationships between funding per‐pupil
and the student poverty and regional characteristic cost factors, respectively. It is important to
note that this approach provides estimates of the implicit funding weights or those
relationships between per‐pupil funding and cost factors that occur as an end result after a
state‐specific combination of multiple funding policies have interacted with one another. This is
in stark contrast to the evaluation of those explicit funding weights described in Chapter 2 that
represent the specific funding adjustments for various cost factors established by states as
individual components of their finance systems, the intended effects of which may not be
ultimately realized after they have been fully interacted with the other funding policies. With

American Institutes for Research Study of New Funding Method for Nevada Public Schools—48
this distinction in mind, the authors feel that the analysis of implicit funding weights is a
superior method to identify effective funding practices. In effect, this empirical approach
provides a measure of the net impact of the various features of a school funding formula.
The model we use to estimate implicit poverty funding weights closely follows that used in the
recent School Funding Fairness report by Baker, Sciarra, and Farrie (2010).71 Using a three‐year
panel of data on all school districts across the United States, we estimated state‐specific models
of the relationship between state and local revenues per pupil and various factors that
influence the costs of providing equal educational opportunity. Next, we use that model to
project whether each state’s school finance system tends, on average, to provide more
resources to school districts with higher concentrations of children in poverty than to districts
with fewer children in poverty. We identify states with progressive (more resources to higher
poverty districts) versus regressive (more resources in lower poverty districts) state school
finance systems.
Specifically, our model corrects for (controls for) differences in school district size and
population density to capture costs associated with sparsity and economies of scale, and we
control for competitive wage variation using the National Center for Education Statistics (NCES)
Comparable Wage Index (CWI). Although the main models make use of the district percent of
students eligible for FRPL reported in the NCES Common Core Data as the measure of student
poverty for each local public school district, we have also run models that employ the district
percent of students in poverty per the Small Area Income Area Estimates (SAIPE) generated by
the U.S. Census Bureau Poverty Rate.
State/Local Revenue per Pupil = f(Poverty, District Size, Student Density, Wages)
The most recent school funding fairness report, just released in June 2012, used data from
2006–07, 2007–08, and 2008–09. Here, we provide an update of the fairness profiles, including
data from 2007–08 through 2009–10 (recently released data).
The models were run separately for each state to obtain individual relationships between
state/local per‐pupil funding and district percent FRPL or state‐specific implicit poverty funding
weights. The similar set of state‐specific models was then run using the SAIPE poverty measure
instead of FRPL. After omitting the state‐specific estimates that did not prove to be statistically
significant using both models, those corresponding to the FRPL models were rank ordered.72
The largest 10 of these statistically significant estimates, representing the most progressive
relationship between per‐pupil funding and poverty, were selected as the most effective
practices across the states.
71 Baker, B. D., Sciarra, D. G., & Farrie, D. (2010). Is school funding fair? A national report card. Newark, NJ: Education Law Center. Retrieved from http://www.schoolfundingfairness.org/National_Report_Card_2010.pdf 72 “Statistically significant” implies that the estimated relationships were larger than would be expected by chance. The conventional 5 percent‐significance level was used to make these determinations.

Am
eric
an I
nsti
tute
s fo
r R
esea
rch
Stu
dy o
f N
ew F
undi
ng M
etho
d fo
r N
evad
a P
ublic
Sch
ools
—49

Am
eric
an I
nsti
tute
s fo
r R
esea
rch
Stu
dy o
f N
ew F
undi
ng M
etho
d fo
r N
evad
a P
ublic
Sch
ools
—50

American Institutes for Research Study of New Funding Method for Nevada Public Schools—51
The states associated with these most progressive funding/poverty relationships were as
follows: Minnesota, South Dakota, New Jersey, Arkansas, Ohio, Massachusetts, Indiana,
Kentucky, Utah, and Connecticut. Note that South Dakota also was identified as one of the
states whose incidence of students in poverty across its Urban, Suburban, Small Town, and
Rural districts was similar to that of Nevada.
Figure 3.3 illustrates the estimated relationships for these states as implicit funding weight
profiles. The horizontal axis denotes the district‐level percent of FRPL students while the
vertical axis represents the implicit poverty funding adjustment. The funding adjustment index
values reveal the difference in state/local per‐pupil funding that is expected from a district with
a specific percent of its students in poverty relative to a district serving no students in poverty.
For example, the vertical dotted line at 86 percent FRPL intersects the profile for Minnesota at
1.30, which says that in that state a district with 86 percent of its students in poverty is
expected to receive approximately 30 percent more state/local funding per‐pupil compared
with an otherwise similar district with 0 percent poverty. Figure 3.4 displays the average
profiles for the top‐3, middle‐4, and bottom‐3 of the 10 most progressive profiles.
To obtain the implicit poverty funding weight, one simply has to evaluate the profiles at 100
percent poverty. For instance, evaluating the Minnesota profile at 100 percent poverty yields
an index value of 1.34, which is how much more that state effectively funds an impoverished
student relative to one that is not in poverty. Table 3.4 includes the implicit poverty funding
weights associated with each of the estimated profiles presented in the two graphics. The
estimated weights presented in the table are used as effective practice to address student
poverty in the simulation presented in Chapter 4.
Table 3.4. States With the Most Progressive Implicit Poverty Weights
State State‐Specific Averages Minnesota 1.34
1.30 South Dakota 1.28
New Jersey 1.27
Arkansas 1.25
1.21 Ohio 1.25
Massachusetts 1.18
Indiana 1.17
Kentucky 1.17
1.15 Utah 1.16
Connecticut 1.13
IdentifyingScaleofOperationsCostAdjustmentsThe identification of particularly effective state practices that adjust funding to take into
account scale of district operations (district size in terms of enrollment and degree of
remoteness and rurality) uses results from the same models as those presented earlier for the

American Institutes for Research Study of New Funding Method for Nevada Public Schools—52
analysis of implicit poverty funding weights. Again, we have taken only the statistically
significant estimates from the state‐specific models and created scale/density profiles that can
be used to create implicit weighting indices showing how much more each state funds smaller
more remote districts relative to larger ones that are less remote.73 Although the estimates
used to generate the scale/density profiles are slightly more complicated than for poverty, the
profiles themselves are easily interpreted in a similar manner.74
Figures 3.5 and 3.6 show the results for the 10 states that exhibit the most aggressive
scale/density profiles (New York, New Mexico, Colorado, Arizona, Texas, Nebraska,
Massachusetts, Oregon, Kansas, and California) and averages of the top‐3, middle‐4, and
bottom‐3 of these, respectively. It should be noted that out of these 10, New Mexico was the
only state deemed similar to Nevada in terms of key scale characteristics (district enrollment
and student density). That is, the profiles are those with the steepest at lower categories of
enrollment. For example, in Figure 3.5 the dashed vertical line intersecting the implicit
scale/density profile for New York shows that the average district with under 100 students has
an implicit scale/index value of about 3.25, which suggests that such a district in that state
receives approximately 225 percent more state/local funding per pupil than an otherwise
similar district with 2,000 students or more (the reference enrollment category where the
implicit scale/index equals 1.00). Using these results, the research team calculated formulas to
generate smooth profiles that showed how relative funding varied by a continuous student
count enrollment measure, which are ultimately used in the simulation model presented in
Chapter 4.
73 The profiles for each state were created by predicting the enrollment category‐specific implicit scale/density funding weight value for the district with average density within each category. 74 The additional complexity exists because the model accounts for enrollment in terms of categorical indicators denoting enrollment ranges and interacts these dummy variables with a measure of student density.

Am
eric
an I
nsti
tute
s fo
r R
esea
rch
Stu
dy o
f N
ew F
undi
ng M
etho
d fo
r N
evad
a P
ublic
Sch
ools
—53

Am
eric
an I
nsti
tute
s fo
r R
esea
rch
Stu
dy o
f N
ew F
undi
ng M
etho
d fo
r N
evad
a P
ublic
Sch
ools
—54

American Institutes for Research Study of New Funding Method for Nevada Public Schools—55
IdentifyingSpecialEducationCostAdjustmentsTo identify special education funding adjustment weights that can be considered best practice
we draw on data from a national study previously conducted by AIR for the Office of Special
Education Programs (OSEP).75 Since the inception of the Education for All Handicapped Children
Act (EHA, and now commonly referred to as IDEA or IDEIA under its current reauthorization) in
1975 and even a few years before its inception, OSEP has conducted studies of special
education spending about once every 10 years. The last of these studies conducted was carried
out by AIR and produced a series of studies of the patterns of spending on special education
across the United States and estimated the variations in spending for serving various student
disability populations. A key product that came out of this work was the calculation of reliable
per‐pupil spending figures on students with various disabilities relative to per‐pupil spending
for the average regular education student (i.e., special education weights). These spending or
cost ratios for special education students have ranged from about 1.9 in the earliest study
(Rossmiller, Hale, & Frohreich, 1970) to 2.2 (Kakalik et al., 1981) to 2.3 (Moore, Strang,
Schwartz, & Braddock, 1988), and 1.9 (Chambers, Pérez, Harr, & Shkolnik, 2005).
Each of the OSEP studies also examined the relative per‐pupil spending on special education
students for each one of the 12 disability categories. The latest of these studies by Chambers et
al. (2005), which is referred to as the Special Education Expenditure Project (SEEP), developed
estimates of these spending ratios by student disability based on analysis of a nationwide
random sample of students with disabilities. Of all of the studies done, this was the largest and
most comprehensive data collection and gathering of information about individual students
from the most knowledgeable provider for that student. The data included detailed
delineations of services, the amount of time the student spent in each of those services, and
included the detailed resources devoted to providing both the regular and special education
services received for those students. We believe that this analysis represent a reasonable basis
and an objective source of data upon which to base a student weight and provides
comprehensive evidence of best practices currently used to serve these students across the
United States. A student weight is intended to reflect the relative cost of educating a student
with a disability relative to a regular education student. The spending on special education
students is based on services provided to those students as specified in their individualized
education program (IEP), which is required under the federal IDEA legislation to define the
specific special education services requirements for each child that is eligible. The IEP is a
document that is intended to use the input from educational professionals and parents, and it
specifies the goals for each individual student along with the services they believe are necessary
for the student to achieve those goals.
75See Chambers, J. G., Pérez, M., Harr, J. J., & Shkolnik, J. (2005). Special education spending estimates from 1969–2000. Journal of Special Education Leadership, 18(1), 5–13.

American Institutes for Research Study of New Funding Method for Nevada Public Schools—56
For the special education cost simulations in Nevada, we used the 12 estimated SEEP weights
corresponding to the disability categories recognized in the counts of special education
students in the state. These weights are presented in Table 3.5, which shows the relative
weights of students with disabilities using two alternative base weights: one shows the
spending or cost ratio compared with a regular education student while the other shows the
spending or cost ratio of a student with a disability compared with a special education student
who is classified as having a specific learning disability (SLD).
Table 3.5. Specific Disability Category Weights
Student Category
Special Education Weight Using General Education Student as Comparison Group
Special Education Weight Using Student With Specific Learning
Disability as Comparison Group
General Education Student Comparison group 1.0 n/a
Specific Learning Disability (SLD) 1.6 Comparison group 1.0
Speech/Language Impairment (SLI) 1.7 1.1
Emotional Disturbance (ED) 2.2 1.4
Mental Retardation (MR) 2.3 1.4
Orthopedic Impairment (OI) 2.3 1.4
Other Health Impairment (OHI) 2.0 1.3
Autism (AUT) 2.9 1.8
Hearing Impairment/Deafness (HI/D) 2.4 1.5
Multiple Disabilities (MD) 3.1 1.9
Traumatic Brain Injury (TBI) 2.5 1.6
Visual Impairment/Blindness (VI/B) 2.9 1.8
Preschool (PRE) 2 2.0 1.3
Average Special Education Student 1.9 1.2
Source: Appendix B‐1 of Special Education Expenditure Project (SEEP) Report 5, Total Expenditures
for Students With Disabilities, 1999–2000: Spending Variation by Disability (Chambers,
Pérez, & Shkolnik, 2003).
Chapter 4 details how the SEEP weights are used to simulate how special education funding
could be allocated to Nevada school districts.
IdentifyingEnglishLearnerCostAdjustmentsA similar statistical model as the one used to identify effective funding practices for poverty and
scale of operations was run in an attempt to uncover those practices that were most effective
with respect to addressing the funding need associated with ELLs. However, because of the
strong correlation between the incidence of students in poverty and ELLs (i.e., there is large

American Institutes for Research Study of New Funding Method for Nevada Public Schools—57
“overlap” in these populations such that English learners also tend to be from low‐income
families), it was simply not possible to disentangle the relationship between per‐pupil spending
and the percent of low‐income and ELL students. In turn, to identify the most effective ELL
funding practices, we reviewed the explicit funding weights presented in Chapter 2.
ExplicitELLFundingWeightsUsedbyStatesUsing the inventory of state finance systems provided in Figure 3.7 illustrates the explicit ELL
funding weights across all states as well as the average weight overall and for the largest,
middle, and bottom 5, respectively. As can be seen from the figure, the weights vary widely
ranging from 1.10 to 1.99, with an overall average of 1.39. The average of the top‐, middle‐, and
bottom‐5 are 1.53, 1.38, and 1.16, respectively. These figures are used in the simulation model
presented in Chapter 4 that allows the user to see how the adoption of these various weights
would play out in the context of the Nevada funding system.
ANoteonSuggestedAdjustmentsFromCostStudiesThere is a large and growing body of studies coming out of the mainstream education finance
literature that focuses on providing estimates of (1) the total cost of providing a sufficient
education across districts within a state and (2) how costs vary across districts according to the
three major cost factors (student needs, scale of operations, and geographic differences in
labor prices).76 These “costing‐out” studies often provide alternatives to the existing implicit
and explicit funding weights covered in this investigation that might be considered indicative of
“best practice,” as a key objective of this work is to identify the differential costs of providing an
equitable opportunity for all students to meet a set of concrete educational goals regardless of
their specific needs or characteristics of their district of residence. In contrast, it is unclear
whether any of the state‐specific explicit funding weights were designed to be aligned with
producing the state’s educational goals given the unique set of cost factors (student needs,
scale of operations, and geographic variations in staffing prices). Although a systematic review
of the suggested weights coming out of the costing‐out literature was beyond the scope of the
present study, the authors feel that it is most certainly a promising area of future research for
the state.
76 For a good overview of the main methods used in the costing‐out literature, refer to the report by Chambers and Levin titled Determining the Cost of Providing an Adequate Education for All Students (Washington, DC: National Education Association, 2009).

American
Institutes for Research
Study of New
Funding Method for Nevada Public Schools—58

American Institutes for Research Study of New Funding Method for Nevada Public Schools—59
IdentifyingDifferentialWageCostAdjustmentsIn the field of education finance, there is general recognition that districts located in different
geographic regions of a state face differential costs of recruiting and employing comparable
school personnel. Variations in the purchasing power of the educational dollar across local
districts largely result from factors that are beyond local control. In general these factors
include regional or district characteristics that affect the willingness of teachers and other
professional personnel to supply their services to school districts in different regions of the
state. Therefore, if a state is to provide equal access to similar educational resources in
different parts of the state, the school finance formula should account for these differential
costs of recruiting and employing school personnel.
To address this issue in the context of the current study, we have made use of the National
Center for Education Statistics (NCES) Comparable Wage Index (CWI), which was designed to
answer the following question:
How much more or less does it cost in different local school districts to recruit and
employ comparable teachers and other school personnel?
The CWI was originally developed by Lori Taylor and was published in Taylor and Fowler (2006)
for NCES.77 The CWI has been designed as an index of the labor market costs in various
geographic locations controlling for differences in personal and industry characteristics. Taylor
and Fowler (2006) describe the CWI as follows:
The basic premise of a comparable wage index is that all types of workers—including
teachers—demand higher wages in areas with a higher cost of living (e.g., San
Diego) or a lack of amenities (e.g., Detroit, which has a particularly high crime rate)
(Federal Bureau of Investigation 2003). Therefore, one should be able to measure
most of the uncontrollable variation in educator pay by observing variations in the
earnings of comparable workers who are not educators.78 The CWI reflects
systematic, regional variations in the salaries of college graduates who are not
educators. Provided that these non‐educators are similar to educators in terms of
age, educational background, and tastes for local amenities, the CWI can be used to
measure the uncontrollable component of variations in the wages paid to educators.
Intuitively, if accountants in the Atlanta metro area are paid 5 percent more than the
national average accounting wage, Atlanta engineers are paid 5 percent more than
the national average engineering wage, Atlanta nurses are paid 5 percent more than 77 The development of the CWI actually dates back to a more detailed analysis of the geographic cost of education index (GCEI) developed by Chambers (1998). Dr. Taylor’s CWI provided a more readily available and simplified and easily understood approach to measuring geographic differences in labor market costs than Chambers original GCEI. 78 See, for example, Rothstein and Smith (1997), Guthrie and Rothstein (1999), Goldhaber (1999), Alexander et al. (2000), Taylor et al. (2002), and Stoddard (2005).

American Institutes for Research Study of New Funding Method for Nevada Public Schools—60
the national average nursing wage, and so on, then the CWI predicts that Atlanta
teachers should also be paid 5 percent more than the national average teacher
wage.79
The index is designed to make use of those factors that affect labor supply to estimate
differential patterns of compensation of school personnel across local school districts. That is, it
predicts relative differences across labor markets in staff compensation rates using factors that
are solely associated with labor market conditions outside of the control of the districts
themselves and therefore represents the true differential costs of hiring and retaining staff
across different regions. Appendix L provides a more detailed description of how the CWI is
calculated.
Longitudinal analysis of the CWI shows that the geographic variation in the relative cost of labor
is quite steady over time. Indeed, an early study by Chambers (1998) of geographic costs
reports correlations well above 0.900 over time, and the CWI shows even higher correlations
over time, ranging from 0.952 to 0.998. For the purpose of the present study, Dr. Taylor has
recently provided us with an update through 2011 as she continually updates the index for her
own and other research purposes. Chapter 4 shows how the CWI is used as an alternative
adjustment for differential staffing costs to the implicit adjustments made in the current
Nevada funding system.
79 Documentation for the NCES Comparable Wage Index Data Files, May 2006, Lori L. Taylor Bush School of Government and Public Service, Texas A&M University, Mark C. Glander, K‐Force Government Solutions, William J. Fowler, Jr., Project Officer, National Center for Education Statistics, p. 3.

American Institutes for Research Study of New Funding Method for Nevada Public Schools—61
Chapter4—SimulationofAlternativePracticesinNevadaAs explained in the previous chapter, mainstream education finance literature contends that
there are three main types of factors that affect the cost of providing educational services and
therefore should be considered in constructing an equitable state school funding formula:
Student Needs (poverty, English language learners [ELLs], special education)
Scale of District Operations
Geographic Differences in Resource Prices
This chapter will address each one of these components in the context of the Nevada state
funding system. We first provide a brief description and assessment of how each cost factor is
(or is not) accounted for within the current Nevada Plan. Next, we show how the alternative
effective adjustments identified in the previous chapter can be incorporated into the current
system. Finally, we will introduce a simulation model developed by the research team that
calculates projected funding allocations across Nevada districts resulting from the application of
the various funding adjustments.
OurUnderstandingoftheDistributiveSchoolAccount(DSA)ModelWith the three types of cost factors in mind, we next describe how these elements are
currently treated by the current school funding formula in the state through the DSA Equity
Allocation Model. After careful examination of the DSA, we have concluded that the model
includes components that, by explicit design or otherwise, make funding adjustments for scale
of operations (district size and degree of remoteness) and geographic differences in resource
prices, but it contains no adjustments for pupil needs such as poverty or ELLs. However, special
education is handled outside of the DSA separately and will be discussed later in this chapter.
HowtheDSATreatsScaleandPrice
One of the key elements of the DSA Equity Allocation Model is a mechanism designed to
calculate the basic support ratio (BSR). The portion of the DSA that calculates the BSR
determines the staffing and operating expenditures for each district with
adjustments related to scale of operations (district size, student density, and
sparsity) and differential resource prices. From Chapter 1, the BSR is described as
follows:
[The BSR] is expressed as a ratio that represents the relative cost of a
district doing business in Nevada compared with the statewide average
cost. It takes into account certain economies of scale for districts to provide
like services. Staffing costs are determined by aggregating school
enrollments within attendance areas with allowable teacher staffing units
assigned by projecting the aggregated enrollments through a Teacher
Allotment Table maintained by the Nevada Department of Education (see

American Institutes for Research Study of New Funding Method for Nevada Public Schools—62
Appendix B). Once units are assigned to each attendance area, they are
aggregated within their respective districts. Operating costs are based on
prior year expenditures incrementally increased for inflation and additional
monies when the general fund allows. The basic support ratios for Nevada
districts are indexed to the mean, which is expressed as a 1.0. Ratios
ranged from 0.9621 (Clark) to 3.1398 (Esmeralda) for 2010–11.
In essence, the BSR attempts to, through a fairly involved series of calculations, account for
variations in the cost of providing educational services in different districts throughout the
state. In particular, it is designed to account for cost differences associated with the
diseconomies of small‐scale operations associated with differences in enrollment, density, and
sparsity of populations as well as differences in the costs of labor and nonlabor inputs faced by
the districts across the state of Nevada.
ApplaudingtheIntentionsoftheBSR
The BSR attempts to address variation in cost factors related to differential scale and staffing
prices across the 17 Nevada districts. The DSA does this by performing various calculations
related to average staff and expenditure levels based within groups of districts that operate on
similar scale and possibly with similar labor market conditions. The teacher allotment table
accounts for diseconomies of scale in smaller schools, allowing for increasing student‐to‐
teacher ratios as district size increase. The varying district salary and operating costs are
grouped together by type of locale, minimizing any one district’s ability to gain revenues by
inflating the costs used in the BSR calculations.
The BSR calculations also are intended to capture some of the factors underlying differences in
the labor markets and markets for other goods and services confronted by different types of
districts. That is, differences in labor and nonlabor spending result from differences in the
wages or prices a district must pay to attract comparable personnel or purchase similar supplies
and materials. Thus, to some degree, these differences in spending account for differences in
the cost of comparable goods and services in different locations.
It is important to note that the DSA assumes that the historical staffing and expenditures
represent a reasonable estimate of the differences in the true costs of providing educational
services, which may not be the case. As long as these historical staffing and spending patterns
are supported by local goals setting for schools and the ability of local communities to set their
own taxes, it is not unreasonable to suggest that differential spending reflect, to some degree,
the factors that impact their costs of doing business. However, these patterns of resource
allocation also, in part, reflect choices that may well go beyond the absolute minimum costs of
doing business.

American Institutes for Research Study of New Funding Method for Nevada Public Schools—63
PossibleCaveatsintheBSRCostAdjustments
Although the BSR intends to reflect educational cost differences in the scale of district
operations, the differences in labor and nonlabor expenditures in the BSR represent a
combination of factors—some outside the control of the district and some that are within the
control of the district. That is, differences in spending on labor and nonlabor reflect, in part,
choices that the individual districts have made to recruit and employ a more talented labor
force or to obtain better quality instructional materials. For example, districts with greater fiscal
capacity (property wealth) have a greater ability to pay and may choose to pay higher
compensation to attract a more talented staff of teachers and administrators. But it is
important to point out that the grouping districts in the calculation of average labor and
nonlabor spending by type/size of locality might mitigate some of these possible wealth‐effects.
IsolatingtheImpactofCurrentCostFactorAdjustmentsintheDSATo create a simulation model that would allow the incorporation of alternative effective
funding adjustments for individual cost factors, it was necessary to first construct measures of
the adjustments currently included in the DSA that reflect the current system used in Nevada
(i.e., to serve as a “baseline”). To this end, we used the DSA model to isolate the variations in
spending reflected in the BSR into its two components: one component isolates the impact of
scale (i.e., district size, student density, and sparsity) and another measures effect of wage‐level
differentials across districts. We refer to these as the Scale‐Only BSR and Average.
DSA Scale‐Only BSR Adjustment—The DSA Scale‐Only BSR Adjustment attempts to isolate the
impact of scale on educational spending. That is, it attempts to remove the variations in
spending associated with variations in the patterns of compensation across districts. We used
the DSA modules to recalculate the BSR by making the following adjustments:80
Replaced all of the district‐specific average calculations of the compensation of licensed
teacher staff and administrative staff with statewide averages.
Used an index of average compensation of teachers to adjust the per‐pupil spending
figures on classified personnel. In effect, this assumes that the variations in the average
compensation of classified personnel follow those of teachers.81
In effect, we have taken out of the BSR calculations the differences arising out of compensation
levels and left only those variations in labor and nonlabor spending that might be associated
with scale.
80 A more detailed description of the steps involved in calculating the DSA Scale‐Only Adjustment is contained in Chapter 4. 81 We have access to no data on actual average compensation levels for classified personnel, so we felt teacher salaries would be a reasonable and close approximation to be used for this purpose. This component could be made more accurate if we had actual average compensation levels by district for classified personnel.

American Institutes for Research Study of New Funding Method for Nevada Public Schools—64
DSA Wage Differential BSR Adjustment—Once we isolated the impact of scale, we then
divided the BSR for each district by the DSA Scale‐Only BSR Adjustment to obtain a measure of
the difference in the BSR associated with differences in compensation of teachers,
administrators, and classified staff across districts that we call the DSA Wage Differential BSR
Adjustment. We have decomposed the BSR into its two constituent components in such a way
that multiplying them together returns the original BSR:
Original BSR = DSA Scale‐Only BSR Adjustment x
DSA Wage Differential BSR Adjustment
Table 4.1 shows the values of the newly created DSA BSR Scale‐Only and Wage Differential
Adjustments as well as the product of the two, which by definition equals the Original BSR.
Table 4.1. DSA Scale‐Only Basic Support Ratio (BSR) Adjustment, DSA Wage Differential BSR Adjustment, and Original BSR
District A—DSA Scale‐Only BSR Adjustment
B—DSA Wage Differential BSR Adjustment
C—Original BSR
(A x B)
Clark 0.97 0.99 0.96
Washoe 1.01 0.99 1.00
Elko 1.13 1.06 1.20
Lyon 1.14 1.04 1.18
Carson City 1.10 1.04 1.14
Douglas 1.12 1.04 1.16
Nye 1.16 1.06 1.23
Churchill 1.12 1.04 1.16
Humboldt 1.13 1.06 1.20
White Pine 1.22 1.06 1.29
Lander 1.24 1.06 1.31
Lincoln 1.68 1.08 1.81
Pershing 1.55 1.08 1.67
Mineral 1.60 1.08 1.73
Storey 1.64 1.08 1.77
Eureka 2.04 1.23 2.50
Esmeralda 2.68 1.24 3.33
Figure 4.1 presents the data included in Table 4.1 in a bar chart that allows easier comparisons
across districts, which have been strategically sorted in descending order according to district
scale (enrollment). The illustration makes clear how the DSA Scale‐Only BSR increases as district
size becomes smaller.

American Institutes for Research Study of New Funding Method for Nevada Public Schools—65
For instance, the Scale‐Only BSR Adjustment for Esmeralda suggests that controlling for wage
differentials under the current funding system this district of 48 students receives 2.68 times

American Institutes for Research Study of New Funding Method for Nevada Public Schools—66
the amount of basic support per‐pupil funding received by the average‐sized district in the
state. At the other end of the spectrum, Clark being the largest school district with more than
300,000 students receives about 3 percent less per pupil than the average‐sized district in the
state (arguably because it does not have to endure the diseconomies of scale experienced by
the smaller districts). The relevant policy here is whether the Scale‐Only adjustments across the
districts appropriately reflect the true cost differentials associated with operating smaller
versus larger districts across the state.
The DSA Wage Differential BSR Adjustment can be interpreted in a similar fashion. Its value
ranges from 0.99 in Clark to 1.24 in Esmeralda. The interpretation here is that independent of
district size, Esmeralda is funded 24 percent higher on a per‐pupil basis compared with the
district attended by the average student. Clark, conversely, receives about 1 percent less per‐
pupil compared with the average attended district. Again, the relevant policy question here is
whether the effective wage differential funding adjustment included in the BSR represents the
true cost differences in hiring and retaining staff across the state’s districts.
SimulatingCostFactorAdjustmentsUsingtheFundingAdjustmentSimulator(FAS)With the decomposition of the BSR into the DSA Scale‐Only and Wage Differential BSR
Adjustments components, we now have a starting point (baseline) model of how the current
Nevada funding system separately addresses educational cost differences associated with
district scale of operations and geographic price differences. This will allow us to replace these
components with alternative adjustments and compare the district funding allocations under
each scenario. The following section does just that, beginning with evaluating alternatives to
the DSA Wage Differential BSR and Scale‐Only BSR Adjustments, followed by incorporating the
additional alternative funding adjustments for poverty and ELL identified in Chapter 3. To
facilitate this analysis, we introduce a simulation model that has been developed for this
purpose. Although the special education cost factor is accounted for in the state funding
system, this mechanism resides outside of the DSA Equity Allocation Model and therefore is not
covered in the simulation model. In turn, we have provided a separate analysis of incorporating
the alternative special education funding practice identified in Chapter 3.
IncorporatingtheComparableWageIndex(CWI)IntotheDSAWe can see from the earlier discussion that the current DSA treats differences in resource
prices through variations in the average compensation of teachers, administrators, and
classified personnel across districts (at least implicitly in the calculations). As suggested earlier,
the current approach to addressing price differences has some disadvantages in that it does not
isolate the true costs of labor but rather incorporates some differences that are within the
control of the school district by using average compensation levels to calculate the BSR. These
average compensation levels used in the DSA calculations involve choices that the districts

American Institutes for Research Study of New Funding Method for Nevada Public Schools—67
make that to some extent are impacted by the preferences and fiscal capacity (i.e., wealth) of
the district.
In Chapter 3, we introduced an alternative measure of resource price differentials that better
represented the true price‐level of hiring and retaining staff across various labor markets, the
CWI. To compare a CWI‐based funding adjustment against the DSA Wage Differential BSR
Adjustment implied in the current BSR, we need to embed the CWI into the DSA modules. We
can then use the DSA Scale‐Only BSR Adjustment for each district in conjunction with a BSR
calculated using the CWI instead of its native DSA Wage Differential BSR Adjustment to obtain
an implicit overall index of the differences educational costs. The approach we take is careful to
appropriately weight the CWI so that it is only applied to those portions of spending pertaining
to school personnel (i.e., teachers, administrators, and classified staff) and not nonpersonnel
(materials and supplies, books, etc.). The following describes how this is done.
CreatingtheScale‐Only/CWIBSRandCWIWageDifferentialBSRAdjustment
The Scale‐Only/CWI BSR uses the DSA Scale‐Only BSR Adjustment and adjusts for salary
differentials in different labor markets by applying the CWI using the following steps:
1. Re‐center the CWI. We re‐centered the CWI around the district serving the average
student in the state—that is CWI = 1.00 corresponds to the pupil‐weighted average of
the raw CWI for Nevada. Centering this index this way ensures that the index as applied
to Nevada school districts will be fiscally neutral.
2. Adjust Compensation Using the CWI. The classified staff expenditures, average teaching
and average administrative staff salaries calculated and used in the DSA Scale‐Only BSR
Adjustment are each multiplied by the district’s respective CWI.
3. Use CWI‐Adjusted Expenditure and Staff Data. The CWI adjusted figures for classified
staff expenditures and licensed teacher and administrative salaries are then used to
replace the original numbers in the Table 2 of the Staff Accounting sheet of DSA Module
1 and linked into the other modules to calculate the Scale‐Only/CWI BSR.
4. Calculate CWI Wage Differential BSR Adjustment. The CWI Wage Differential BSR
Adjustment is simply just the ratio of the Scale‐Only/CWI BSR to the DSA Scale‐Only BSR
Adjustment and can be interpreted as an implicit CWI index calculated for Nevada
districts within the context of the DSA Equity Allocation Model.
Although the DSA Wage Differential BSR Adjustment is the implicit price‐level adjustment
component of the original BSR, the CWI Wage Differential BSR Adjustment is simply an analog
adjustment that more directly takes into account geographic price differences derived from
applying the raw CWI to the DSA modules. It is quite informative to compare these two
approaches to addressing differential wage levels across districts. Table 4.2 shows the figures
behind the calculation of the CWI Wage Differential BSR Adjustment (column C), which simply

American Institutes for Research Study of New Funding Method for Nevada Public Schools—68
equals the Scale‐Only/CWI BSR Adjustment (column B) divided by the DSA Scale‐Only BSR
Adjustment (column A). Figure 4.2 illustrates both adjustments across all districts in the state.
Washoe and Clark are the only two districts for which the CWI Wage Differential BSR
Adjustment is higher than 1.00 (1.01), indicating that the wage level in these districts is higher
than in the district attended by the average student. This result is quite consistent with
previous literature, which shows that more urbanized areas tend to exhibit the highest labor
costs within a state. In smaller and more rural districts, the CWI Wage Differential drops below
1.00, denoting lower than average wage levels. For instance, the CWI differential for Lyon of
0.94 suggests that staffing costs are approximately 6 percent lower than the district attended
by the average student. Comparing the two adjustments shows that the original DSA Wage
Differential Adjustment is higher than the CWI Wage Differential Adjustment for all districts
other than Clark and Washoe, with the difference between the two adjustments becoming
quite large in the smallest districts (note that the districts in the table are ordered in terms of
enrollment from large to small). This finding shows that the way in which the current DSA Wage
Differential Adjustment allocates dollars is not representative of the true variation in staffing
costs across the state. In fact, the current adjustment directs proportionately more resources to
those districts that in actuality have lower than average labor costs.
Table 4.2. DSA Wage Differential Basic Support Ratio (BSR) Adjustment and CWI Wage Differential BSR Adjustment
District A—DSA Scale‐Only BSR Adjustment
B—Scale‐Only/CWI BSR
C—CWI Wage Differential BSR Adjustment
(B / A)
Clark 0.97 0.98 1.01
Washoe 1.01 1.02 1.01
Elko 1.13 1.02 0.90
Lyon 1.14 1.07 0.94
Carson City 1.10 1.04 0.94
Douglas 1.12 1.05 0.94
Nye 1.16 1.05 0.90
Churchill 1.12 1.05 0.94
Humboldt 1.13 1.02 0.90
White Pine 1.22 1.10 0.90
Lander 1.24 1.12 0.90
Lincoln 1.68 1.54 0.92
Pershing 1.55 1.42 0.92
Mineral 1.60 1.47 0.92
Storey 1.64 1.50 0.92
Eureka 2.04 1.81 0.89
Esmeralda 2.68 2.38 0.89

American Institutes for Research Study of New Funding Method for Nevada Public Schools—69

American Institutes for Research Study of New Funding Method for Nevada Public Schools—70
UsingtheNevadaFundingAdjustmentSimulator(FAS)To simulate how dollar allocations to districts differ when the CWI Wage Differential
Adjustment is put in place of the DSA Wage Differential Adjustment, we will make use of the
simulation model developed for this study, the Nevada FAS. The FAS allows the user to
implement up to four different alternative funding adjustments that control for the following
cost factors: differential resource prices (Price Level), student poverty (Free/Reduced‐Price
Lunch), English language learners (English Learners), and scale of operations (Scale/Density).
Figure 4.3 provides a snapshot of the FAS interface page. The first panel contains the user‐
selected simulation settings. The first row is simply a set of toggles that turn each of the four
possible cost factor adjustments “On” or “Off.” When a given cost factor adjustment is turned
to the “Off” position, indicating that it should not be applied, neutral values equal to 1.00
appear in the corresponding column under the Basic Support Ratio (BSR) Adjustments. When
set to “On,” the cost factor will be applied and numbers different from the neutral 1.00 will
appear under the corresponding Basic Support Ratio (BSR) Adjustment column. The top‐left cell
in the panel provides a summary of the funding adjustment settings that have been selected,
including indicators of whether an adjustment has been activated (toggled “On”), which specific
adjustments have been selected, and the student funding weight (applicable only for the
Free/Reduced‐Price Lunch and English Language Learner adjustments).
The second row in the simulation setting panel contains pull‐down menus that allow the user to
select specific adjustments for each cost factor. For the Price Level and Scale Density menus are
each prepopulated with DSA, which will apply the DSA Wage Differential BSR Adjustment and
DSA Scale‐Only BSR Adjustment, respectively. Using these two adjustments as depicted in the
snapshot will provide dollar allocations that replicate the current DSA Equity Allocation Model.
Each of the pull‐down menus in the second row also is populated with various alternative
funding adjustments identified in Chapter 3. For Price Level, this includes the CWI Wage
Differential BSR Adjustment (CWI) discussed earlier. The other funding adjustment categories
include state‐specific alternatives that were identified.
The following are descriptions of the columns in the lower panel of the snapshot:
Column A—The Original BSR from the most recent DSA Equity Allocation Model.
Column B—The Price Level funding adjustment that allows the user to select either the
DSA or CWI Wage Differential Adjustments (depending on which is chosen from the pull‐
down menu).
Columns C and D—The Free/Reduced‐Price Lunch and English Learner funding
adjustments that allow the user to select values corresponding to each of the state‐

American Institutes for Research Study of New Funding Method for Nevada Public Schools—71
specific (or average of state‐specific) funding practices identified in Chapter 3
(depending on which is chosen from the pull‐down menu).82
Column E—The Scale/Density funding adjustment that allows the user to select values
corresponding to either the DSA Scale‐Only Adjustment or the state‐specific/average of
state‐specific funding practices identified in Chapter 3 (depending on which is chosen
from the pull‐down menu).
Column F—The Raw Adjusted BSR is the combination of all of the separate adjustments
that were chosen and is calculated by simply multiplying each of the four individual
adjustments in columns B, C, D, and E together.
Column G—The Pupil‐Weighted Adjusted BSR takes the Raw Adjusted BSR from column
F and re‐centers these figures around their pupil‐weighted average. This is done to
ensure that the application of this new BSR is fiscally neutral (i.e., that the index strictly
redistributes the existing amount of available funding).
Column H—The Current Foundation Basic Support Per Pupil is the legislatively approved
total support level per pupil from the FY 2012 Basic Support Guarantee.83
Column I—The DSA Projected Per‐Pupil Funding is calculated by multiplying the Original
BSR (column A) by the Current Foundation Basic Support Per Pupil (column H), which
generates the district allocations in the current state funding system prior to any
adjustments made for wealth (DSA Module 8) or transportation (DSA Module 9).84
Column J—The FAS Projected Per‐Pupil Funding is calculated by multiplying the Pupil‐
Weighted Adjusted BSR (column G) by the Current Foundation Basic Support Per Pupil
(column H), which generates the simulated district allocations corresponding to the
funding adjustment choices made by the user.
Although not shown in the snapshot, the actual FAS also contains columns that calculate the
total dollars corresponding to the per‐pupil allocations in column I and J (Total DSA and FAS
Projected Funding), the district‐by‐district differences between these two figures, and the
amount of funding necessary to hold all districts harmless should their Total FAS Projected
Funding fall short of what the current DSA provides.
82 The menus of adjustment types for Free/Reduced Price Lunch, English Learners, and Scale/Density have been ordered in magnitude from most to least progressive. 83 The figure used in the FAS was taken from cell D10 of the InputOutput worksheet of most recent version of DSA Module 2 (DSA‐2‐Module.xls). 84 It is important to note that the intention of the model is to provide simulations of different funding adjustments accounting for cost factors related to geographic differences in resource price levels, poverty, English learners, and scale/density (excluding transportation) and does not address how the projected district allocations are shared between local and state burden, which are dealt with in DSA Modules 8 and 9.

American
Institutes for Research
Study of New
Funding Method for Nevada Public Schools—72
Figure 4.3. Snap
shot of Funding Adjustment Simulator (FAS) Set to Baselin
e M
odel
Simulation Setting Summary:
Price Level = On (DSA
) Free/Reduced‐Price Lunch = Off (MN ‐ W
eight = 1.38)
English Learner = Off (MD ‐ W
eight = 1.99)
Scale/D
ensity = On (DSA
)
Price Level
Free/Reduced
‐Price Lunch
English
Learner
Scale/
Density
Toggle (On/O
ff)
On
Off
Off
On
Select Adjustment Type from Pull‐Down M
enu
DSA
MN
MD
DSA
Basic Support Ratio (BSR
) Adjustments
District
A–O
riginal
BSR
B–P
rice
Level
C–Free/
Reduced‐
Price Lunch
D–English
Learner
E–Scale/
Density
F–Raw
Adjusted BSR
(B x C x D x E)
G–P
upil‐
Weighted
Adjusted
BSR
H–C
urrent
Foundation
Basic
Support
Per‐Pupil
I–DSA
Projected
Per‐Pupil
Funding
(A x H)
J–FA
S Projected
Per‐Pupil
Funding
(G x H)
Esmeralda
3.327
1.241
1.000
1.000
2.681
3.327
3.327
$ 5,263
$ 17,508
$ 17,508
Eureka
2.498
1.228
1.000
1.000
2.035
2.498
2.498
$ 5,263
$ 13,148
$ 13,148
Storey
1.768
1.079
1.000
1.000
1.638
1.769
1.768
$ 5,263
$ 9,308
$ 9,308
Mineral
1.726
1.079
1.000
1.000
1.599
1.726
1.726
$ 5,263
$ 9,084
$ 9,084
Pershing
1.667
1.078
1.000
1.000
1.545
1.667
1.667
$ 5,263
$ 8,771
$ 8,771
Lincoln
1.812
1.080
1.000
1.000
1.678
1.812
1.812
$ 5,263
$ 9,538
$ 9,538
Lander
1.313
1.061
1.000
1.000
1.237
1.313
1.313
$ 5,263
$ 6,909
$ 6,909
White Pine
1.291
1.061
1.000
1.000
1.217
1.291
1.291
$ 5,263
$ 6,796
$ 6,796
Humboldt
1.197
1.061
1.000
1.000
1.128
1.197
1.197
$ 5,263
$ 6,298
$ 6,298
Churchill
1.159
1.038
1.000
1.000
1.117
1.159
1.159
$ 5,263
$ 6,101
$ 6,101
Nye
1.230
1.061
1.000
1.000
1.159
1.230
1.230
$ 5,263
$ 6,472
$ 6,472
Douglas
1.163
1.038
1.000
1.000
1.120
1.163
1.163
$ 5,263
$ 6,120
$ 6,120
Carson City
1.144
1.038
1.000
1.000
1.102
1.144
1.144
$ 5,263
$ 6,023
$ 6,023
Lyon
1.181
1.038
1.000
1.000
1.138
1.182
1.181
$ 5,263
$ 6,218
$ 6,218
Elko
1.197
1.060
1.000
1.000
1.128
1.197
1.197
$ 5,263
$ 6,298
$ 6,298
Washoe
1.003
0.992
1.000
1.000
1.012
1.003
1.003
$ 5,263
$ 5,279
$ 5,279
Clark
0.963
0.992
1.000
1.000
0.971
0.963
0.963
$ 5,263
$ 5,068
$ 5,068

American
Institutes for Research
Study of New
Funding Method for Nevada Public Schools—73

American Institutes for Research Study of New Funding Method for Nevada P
The FAS also generates in real time a bar chart that compares the DSA and FAS projected per‐
pupil allocations and therefore allows the user to assess how their funding adjustment choices
changed the allocations relative to those currently in place. The user will note that the graphics
also include the simulation setting summary information directly under the chart legend. Figure
4.4 provides an example of the chart when the formula adjustments are set to a baseline model
where the FAS mimics the current DSA funding allocations (i.e., with the Price Level and
Scale/Density funding adjustments set to “DSA” and all other funding adjustments toggled to
“Off,” as in the snapshot in Figure 4.3).
SimulatingDifferentialWageCostAdjustmentsTo simulate the effect of implementing the CWI Wage Differential Adjustment developed
earlier, we have set the Price Level adjustment from “DSA” to “CWI” and left everything else
the same. Figure 4.5 shows the results of this exercise. Clearly, the replacement of the existing
DSA wage differential adjustment results in large differences between the existing DSA and
projected FAS funding projections. As explained earlier, the CWI will direct additional funding to
those districts with higher staffing costs associated with regional labor market conditions as
opposed to district ability and/or preference to offer higher salaries. Clark and Washoe are the
only two districts that would experience an increase in per‐pupil funding under this scenario (by
$106 and $111 per pupil, respectively). As the simulator was designed to generate fiscally
neutral allocations, the remaining districts have FAS projections that fall short of what they
receive under the current DSA (i.e., the FAS performs zero‐sum calculations so that the
reductions in revenues must be balanced against the increases in revenues across all of the
districts). For example, although Elko currently receives an allocation of $6,298 per pupil under
the current DSA, switching to the CWI adjustment results in a FAS per‐pupil projection of
$5,638 (representing a decrease of $660, or 9.3 percent). In terms of total dollars redistributed,
the FAS projection would result in increases to Clark and Washoe on the order of $39,653,142,
which would have to be made up by the reductions across the other districts. It follows that in
order to hold these other districts harmless (i.e., to ensure that no district would experience a
drop in funding), additional funding in this amount (equal to 1.8 percent of the FY 2012
legislatively approved statewide support level) would be required.
SimulatingStudentPovertyCostAdjustmentsAs an example of how implementing an effective poverty cost adjustment would redistribute
funding, we have chosen to use the most progressive of the state‐specific poverty funding
adjustments identified in Chapter 3. The poverty funding adjustment for Minnesota provided a
student weight of 1.34, which implies that funding for an impoverished student is about 34 percent
higher than for an otherwise similar student that is not in poverty. We apply this funding
adjustment to the original baseline model by setting the Free/Reduced Price Lunch toggle to “On”
and select as an adjustment type “MN.” Figure 4.6 shows the results of this simulation, which

American
Institutes for Research
Study of New
Funding Method for Nevada Public Schools—75

American
Institutes for Research
Study of New
Funding Method for Nevada Public Schools—76

American Institutes for Research Study of New Funding Method for Nevada Public Schools—77
suggests that the current system is inequitable in terms of how funding is distributed with
respect to student poverty. Here, Clark is projected to receive a modest funding increase of
about $55 per pupil while Washoe would expect a decrease of approximately $120 per pupil (if
they were not held harmless). Nye, Pershing, and Esmeralda would stand to gain $96, $329,
$569 per pupil, respectively, while the remaining districts would have per‐pupil decreases
ranging from $39 to $1,429. The poverty funding adjustment would have more severe effects
on the other districts and come with a hold‐harmless price tag of $17,562,616, or 0.8 percent of
the FY 2012 legislatively approved statewide support level).
SimulatingEnglishLearnerCostAdjustmentsFollowing the approach put forth earlier, we activate the English Learner funding adjustment by
setting the toggle to “On” and selecting the strongest adjustment, which in this case was
identified in Chapter 3 for Maryland (“MD”), where there is an explicit ELL weight of 1.99. The
results in Figure 4.7 suggest that the current funding system does not equitably distribute
funding with respect to the ELL needs of districts. The applied adjustment would result in
modest per‐pupil funding increases for Clark, Washoe, and Carson City (on the order of $59,
$32, and $39, respectively), a large increase for Esmeralda ($2,046), and decreases ranging
from $274 to $1,804 for the other districts. The cost of holding the other districts harmless is
even larger than was the case in the poverty scenario (because of the more generous weight
applied), standing at $20,472,021, or 0.9 percent of the FY 2012 legislatively approved
statewide support level.
SimulatingScaleofOperationsCostAdjustmentsWe next provide a scenario using the scale of operations (scale and student density) funding
adjustment. Here we replace the existing DSA scale/density funding adjustment with an
adjustment from the state identified with the most aggressive scale/density profile in Chapter
3, New York (adjustment type set to “NY”). The results in Figure 4.8 suggest that compared with
the state with the most aggressive practice with respect to funding rural remote districts, the
current DSA model, to a varying extent, provides somewhat greater resource differentials to
many of the midsized and smaller remote districts in Nevada. Under this scenario, all districts
except for Clark, White Pine, and Lander would be considered overfunded with the degree of
overfunding ranging from just $1 per‐pupil in Storey to $1,842 in Lincoln. The amount to hold
districts harmless in this case would be $39,724,694, or 1.8 percent of the FY 2012 legislatively
approved statewide support level.

American
Institutes for Research
Study of New
Funding Method for Nevada Public Schools—78

American
Institutes for Research
Study of New
Funding Method for Nevada Public Schools—79

American
Institutes for Research
Study of New
Funding Method for Nevada Public Schools—80

American
Institutes for Research
Study of New
Funding Method for Nevada Public Schools—81
Figure 4.10. Snap
shot of Funding Adjustment Simulator (FAS) Set to Combination of Progressive Funding Adjustments
Simulation Setting Summary:
Price Level = On (CWI)
Free/Reduced‐Price Lunch = On (MN ‐ W
eight = 1.38)
English Learner = On (MD ‐ W
eight = 1.99)
Scale/D
ensity = On (NY)
Price Level
Free/Reduced‐
Price Lunch
English
Learner
Scale/
Density
Toggle (On/O
ff)
On
On
On
On
Select Adjustment Type From Pull‐Down M
enu
CWI
MN
MD
NY
Basic Support Ratio (BSR
) Adjustments
District
A–O
riginal
BSR
B–P
rice
Level
C–Free/
Reduced‐
Price Lunch
D–English
Learner
E–Scale/
Density
F–Raw
Adjusted BSR
(B x C x D x E)
G–P
upil‐
Weighted
Adjusted
BSR
H–C
urrent
Foundation
Basic
Support
Per‐Pupil
I–DSA
Projected
Per‐Pupil
Funding
(A x H)
J–FA
S Projected
Per‐Pupil
Funding
(G x H)
K–FAS/DSA
Difference
(J–I)
Esmeralda
3.327
0.888
1.031
1.114
2.442
2.493
2.489
$ 5,263
$ 17,508
$ 13,100
$ (4,408)
Eureka
2.498
0.892
0.920
0.861
1.816
1.282
1.280
$ 5,263
$ 13,148
$ 6,736
$ (6,411)
Storey
1.768
0.916
0.846
0.861
1.636
1.092
1.090
$ 5,263
$ 9,308
$ 5,736
$ (3,571)
Mineral
1.726
0.917
0.984
0.861
1.557
1.209
1.207
$ 5,263
$ 9,084
$ 6,352
$ (2,731)
Pershing
1.667
0.917
1.036
0.934
1.461
1.297
1.295
$ 5,263
$ 8,771
$ 6,814
$ (1,958)
Lincoln
1.812
0.916
0.995
0.861
1.353
1.061
1.060
$ 5,263
$ 9,538
$ 5,577
$ (3,962)
Lander
1.313
0.902
0.928
0.949
1.318
1.048
1.047
$ 5,263
$ 6,909
$ 5,509
$ (1,401)
White Pine
1.291
0.902
0.955
0.884
1.258
0.958
0.957
$ 5,263
$ 6,796
$ 5,036
$ (1,760)
Humboldt
1.197
0.903
0.969
0.954
1.033
0.863
0.862
$ 5,263
$ 6,298
$ 4,535
$ (1,763)
Churchill
1.159
0.941
0.968
0.922
1.004
0.844
0.843
$ 5,263
$ 6,101
$ 4,434
$ (1,667)
Nye
1.230
0.903
1.014
0.929
0.994
0.846
0.845
$ 5,263
$ 6,472
$ 4,445
$ (2,027)
Douglas
1.163
0.941
0.955
0.902
0.994
0.806
0.805
$ 5,263
$ 6,120
$ 4,237
$ (1,883)
Carson City
1.144
0.941
0.992
1.004
0.994
0.933
0.931
$ 5,263
$ 6,023
$ 4,903
$ (1,120)
Lyon
1.181
0.941
0.966
0.915
0.994
0.828
0.826
$ 5,263
$ 6,218
$ 4,349
$ (1,869)
Elko
1.197
0.903
0.948
0.953
0.994
0.812
0.811
$ 5,263
$ 6,298
$ 4,266
$ (2,032)
Washoe
1.003
1.012
0.976
1.004
0.994
0.986
0.985
$ 5,263
$ 5,279
$ 5,183
$ (97)
Clark
0.963
1.012
1.010
1.009
0.994
1.026
1.024
$ 5,263
$ 5,068
$ 5,390
$ 321

American Institutes for Research Study of New Funding Method for Nevada Public Schools—82
SimulatingMultipleCostAdjustmentsAs a final demonstration, we combine all of the effective funding practices presented earlier
into a single simulation. This simulation represents the simultaneous application of the four
alternative funding practices described earlier:
Price Level Adjustment—CWI
Free/Reduced Price Lunch Adjustment—Minnesota (Weight = 1.38)
English Language Learner Adjustment—Maryland (Weight = 1.99)
Scale/Density Adjustment—New York
The results are graphed in Figure 4.9 and unsurprisingly show large differences between the
current DSA and projected FAS per‐pupil allocations. A modified screenshot of the FAS interface
for this simulation is provided in Figure 4.10, where the final column calculates the absolute
difference between the DSA and FAS Projected Per‐Pupil Funding across the districts. The
simulation clearly shows that implementation of this particular set of funding adjustments
would result in sizable funding decreases for many of the state’s districts.
ANoteontheIntentionoftheFASThe FAS has been developed to provide a flexible tool that can be used to evaluate the effects
of implementing a broad range of funding adjustments intended to increase the equity with
which educational resources are distributed to Nevada school districts. It is important to note
that the presentation of the simulation model serves as a beginning to a policy‐oriented
process of determining what constitutes appropriate adjustments for each cost factor in the
context of Nevada rather than offering an ultimate solution as to which adjustments should be
used. We feel that the development of the FAS provides a readily accessible tool to policy
makers in Nevada. The FAS will greatly facilitate policy discussion and help provide estimates of
the impact of selecting alternative funding adjustments that are both effective and palatable to
policy makers and stakeholders alike.
AnalysisofAlternativeSpecialEducationCostAdjustmentsA major consideration in any state’s funding practices is how to effectively finance its special
education needs. Currently, Nevada uses a unit‐based funding system, where each district is
assigned a specific number of units. The value of each special education unit is set at $39,768
for the 2012–13 school year. Based on this unit value, we have presented the number of units
along with the total dollars allocated to each of the 17 districts plus the state charter schools to
provide special education services for the 2012–13 school year (see Table 4.3).

American Institutes for Research Study of New Funding Method for Nevada Public Schools—83
Table 4.3. Allocation of Units and Revenues for Special Education Services
School Districts
Nevada Group
Allocated Special
Education Units,
2012–13
Allocated Amount, 2012–13
Average Students With Disabilities Per
Special Education Unit
Average Total Number of Students Per
Special Education
Unit
Total Enrollment (All Students)
Carson City 1 98.5 $ 3,917,148 9.4 78.6 7,741
Churchill 1 47 $ 1,869,096 12.2 83.3 3,917
Douglas 1 70 $ 2,783,760 11.3 89.6 6,273
Lyon 1 63 $ 2,505,384 17.4 130.6 8,228
Elko 2 84 $ 3,340,512 12.6 114.4 9,611
Humboldt 2 32 $ 1,272,576 15.4 107.3 3,434
Nye 2 58 $ 2,306,544 15.6 95.4 5,535
Lander 2 13 $ 516,984 9.2 85.4 1,110
White Pine 2 16 $ 636,288 12.1 86.3 1,380
Lincoln 3 18 $ 715,824 6.4 54.7 985
Mineral 3 8 $ 318,144 11.9 64.1 513
Pershing 3 16 $ 636,288 6.2 43.1 690
Storey 3 8 $ 318,144 7.8 51.0 408
Esmeralda 4 1 $ 39,768 3.0 64.0 64
Eureka 4 3 $ 119,304 8.0 84.0 252
Clark 5 1926 $ 76,593,168 17.2 162.7 313,301
Washoe 5 576 $ 22,906,368 14.7 112.4 64,740
State Charter Schools
11.5 $ 457,332 81.0 964.8 11,095
Totals 3,04985 $ 121,252,632 16.1 144.07 439,277
We have been unable to identify any formal documentation of how the number of units
assigned to each district is exactly determined. According to the information we have received
from various sources in the Nevada Department of Education, the number of units was
assigned historically and the growth of units has been adjusted over time to ensure compliance
with maintenance of effort requirements of IDEA.86
85 Unit Value =$39,768. The unit value is the dollar amount allotted to each special education unit. This is calculated as the total allocation for special education ($121,252,632) divided by the total number of special education units (3,049). 86 Special Education in Nevada, February 2009. For this information, we are relying heavily on conversations with Michael Alastuey, director of Public Policy at Applied Analysis and former deputy director at the Nevada State Budget Office.

American Institutes for Research Study of New Funding Method for Nevada Public Schools—84
Another complicating issue involves the treatment of gifted students within special education
funding in Nevada. As we proceed in this analysis, we will point out alternative ways of
analyzing the data. We first assume that special education funding allocations are focused only
on those students with disabilities. We will then see what impact results from including gifted
students as part of special education funding. Let’s begin with the focus on students with
disabilities only.
StudentsWithDisabilitiesOur understanding is that the special education unit itself is intended to represent an FTE
special education teacher and the unit value of $39,768 reflects the average salary and benefit
cost of a special education teacher.87 Given that the average compensation of a licensed
teacher in the state of Nevada is $57,312 (see DSA Module 5), a unit value of $39,768
represents a significant shortfall of revenue, even if the number of units assigned represents
some sort of equitable distribution of services or funds.
One source we consulted suggested that the number of units assigned to any given district was
originally based on total enrollment (special and non‐special education) combined while others
contended that the number of units is based on total count of students with disabilities.88
Based on the analysis of current allocations of units, the empirical evidence would cast doubt
that there is any rational or systematic process for the assignment of units to districts. Under
this current system, the number of students with disabilities per‐special education unit varies
greatly across districts from as low as 5 students in Lincoln County to a high of 19 in Lyon Count,
with a statewide average of 16 students per unit (see Table 4.3). The total number of students
per unit (using all students, special and non‐special education combined) varies from 43 to 162
(not including the charter schools).
Based on this analysis, we see two potential problems with the current approach to funding
special education.
1. Special education unit funding does not represent the average teacher compensation:
If the unit indeed is intended to represent the average compensation of a teacher, the
value of $39,768 represents a substantial underfunding of that unit. Moreover, because
the unit was, in theory, supposed to represent the value of a teacher, it provides no
support for other licensed non‐teaching personnel who might provide services to
students with disabilities, much less any support for instructional aides or non‐
87 Special Education in Nevada, February 2009. This information on the unit value was based on a phone conversation with Michael Alastuey, former deputy director at the Nevada State Budget. This unit method was developed in the 1980s and each distributed unit was approximately equivalent to the average salary and benefits of a licensed teacher. 88 That the assignment of units was based on total enrollment came from telephone conversations with Mike Alastuey, former Deputy Director at the Nevada State Budget.

American Institutes for Research Study of New Funding Method for Nevada Public Schools—85
personnel resources (e.g., specialized instructional materials, supplies, or technology)
that might be necessary to serve students with disabilities. The special education unit as
Nevada appears to use it has, at best, a vague link to the nature of the services received
by any given student with a disability.
2. The distribution of units appears to be inequitable: Regardless of how the number of
units is determined, the current method reveals an extremely disproportionate
distribution of special education units between districts based on the number of
students with disabilities per allotted unit.
Based on the data presented in the 2011 Statutes of Nevada, page 2141 (Chapter 370, AB 579),
we calculated a total of 3,049 special education units and $121 million in expenditures across
all districts and state charter schools in Nevada.
The goal of this project was to evaluate the current approach to school funding in Nevada and
offer alternative recommendations for improving the equity by which educational services are
funded. In the case of special education, it is treated outside of the DSA in an entirely separate
funding model. Part of the reason for treating special education separately is because of the
compliance oriented approach being used for supporting educational services for students with
disabilities under IDEIA (the Individuals with Disabilities Education Improvement Act, the most
recent reauthorization of IDEA). The state wants to be sure it can demonstrate its maintenance
of effort in funding special education services. For this reason, we have continued to maintain
the treatment of special education funding separate from the DSA.
That said, the inequity and apparent arbitrariness of the current system of funding need to be
addressed in any reform of funding of special education services. Moreover, we desire to
maintain the goals of reducing or minimizing any incentives for overidentification of students
with disabilities or for serving students with disabilities in more segregated placements (i.e.,
encouraging districts to place students in the least restrictive environment possible).
With these goals in mind, we propose three basic funding methods for the consideration of
policymakers in Nevada for reforming special education funding:
Fixed allocation per pupil: This fixed allocation per pupil, allocates an equal amount per
student eligible for special education services across all districts.
Weighted pupil funding: A weighted model allocates revenues to districts based on the
relative weights to each student that reflects the relative cost of providing educational
services. Under this model, we will propose that each student will be assigned a weight
corresponding to the relative cost of serving a student with that disability.
Census‐based funding: A census‐based approach allocates revenues to districts based
on the total enrollment (all students, special and non‐special education, combined). This

American Institutes for Research Study of New Funding Method for Nevada Public Schools—86
is the equivalent of assuming that there is a fixed (constant) incidence of special
education students across all districts.
For each method, we hold the total expenditures on special education at the same amount as
in the 2011 statutes, only redistributing the funds among districts.
Table 4.4 presents the results of each of these three alternative special education funding
distribution approaches compared with the current allocations of funds. Before going into a
discussion of the actual results and differences in the allocations resulting from these
alternative models, we will describe how we arrived at each of these numbers.

American
Institutes for Research
Study of New
Funding Method for Nevada Public Schools—87
Table 4.4. C
omparison of Allo
cations Betw
een the Current Nevada Special Education Funding Method and Alternative Funding Models:
Fixed W
eight, Pupil Weights, G
rouped Pupil Weights, and Census Based
Fixed‐W
eight Allo
cation
Pupil‐Weighted Allo
cation
(SLD
=1.0)
Pupil‐Weighted Allo
cation
Using Grouped Averages
(SLD
=1.0)
Census‐Based
Model
School
Districts
Nevada
Group
Allo
cated
Amount,
2012–13
Allo
cation
Based on Fixed
Per‐Pupil
Amount (All
Spec Ed
ucation
With Sam
e
Weight), FY
2013
Percent
Chan
ge
From
Original
Allo
cation
Allo
cation Based
on W
eighted
Pupil Allo
cation
(Separate
Weights by
Disab
ility
Category SEEP),
FY 2013
Percent
Chan
ge
From
Original
Allo
cation
Allo
cation
Based on
Group W
eight
and Group
Inciden
ce, FY
2013
Percent
Chan
ge
From
Original
Allo
cation
Census Based
Allo
cation ($
Allo
cated
Proportional
to Total
Enrollm
ent),
FY 2013
Percent
Chan
ge
From
Original
Allo
cation
Carson City
1
$ 3,917,148
$ 2,277,439
‐42%
$ 2,193,332
‐44%
$ 2,424,663
‐38%
$ 2,136,731
‐45%
Churchill
1
$ 1,869,096
$ 1,420,312
‐24%
$ 1,364,631
‐27%
$ 1,226,896
‐34%
$ 1,081,201
‐42%
Douglas
1
$ 2,783,760
$ 1,961,265
‐30%
$ 1,921,028
‐31%
$ 1,964,851
‐29%
$ 1,731,522
‐38%
Lyon
1
$ 2,505,384
$ 2,712,178
8%
$ 2,714,623
8%
$ 2,577,203
3%
$ 2,271,156
‐9%
Elko
2
$ 3,340,512
$ 2,613,374
‐22%
$ 2,482,478
‐26%
$ 2,990,213
‐10%
$ 2,652,902
‐21%
Humboldt
2
$ 1,272,576
$ 1,215,293
‐5%
$ 1,165,519
‐8%
$ 1,068,400
‐16%
$ 947,879
‐26%
Nye
2
$ 2,306,544
$ 2,240,387
‐3%
$ 2,154,987
‐7%
$ 1,722,071
‐25%
$ 1,527,813
‐34%
Lander
2
$ 516,984
$ 293,943
‐43%
$ 293,679
‐43%
$ 345,348
‐33%
$ 306,391
‐41%
White Pine
2
$ 636,288
$ 476,731
‐25%
$ 458,720
‐28%
$ 429,351
‐33%
$ 380,918
‐40%
Lincoln
3
$ 715,824
$ 284,062
‐60%
$ 268,548
‐62%
$ 332,129
‐54%
$ 271,887
‐62%
Mineral
3
$ 318,144
$ 234,660
‐26%
$ 225,150
‐29%
$ 172,977
‐46%
$ 141,602
‐55%
Pershing
3
$ 636,288
$ 244,541
‐62%
$ 234,995
‐63%
$ 232,659
‐63%
$ 190,459
‐70%
Storey
3
$ 318,144
$ 153,147
‐52%
$ 146,645
‐54%
$ 137,572
‐57%
$ 112,619
‐65%
Esmeralda
4
$ 39,768
$ 7,410
‐81%
$ 9,975
‐75%
$ 12,909
‐68%
$ 17,666
‐56%
Eureka
4
$ 119,304
$ 59,283
‐50%
$ 53,761
‐55%
$ 50,828
‐57%
$ 69,559
‐42%
Clark
5
$ 76,593,168
$ 81,832,188
7%
$ 82,834,275
8%
$ 85,568,178
12%
$ 86,479,763
13%
Washoe
5
$ 22,906,368
$ 20,924,280
‐9%
$ 20,415,570
‐11%
$ 17,681,667
‐23%
$ 17,870,035
‐22%
State
Charter
Schools
$ 457,332
$ 2,302,140
403%
$ 2,314,716
406%
$ 2,314,716
406%
$ 3,062,528
570%
Totals
$121,252,632
$121,252,632
0%
$121,252,632
0%
$121,252,632
0%
$121,252,632
0%

American Institutes for Research Study of New Funding Method for Nevada Public Schools—88
TheFixedAllocationperPupilTo determine the fixed allocation per pupil, we begin with the total dollars made available for
special education services for the 2012–13 school year of $121,252,632. By dividing this amount
by the total number of students with disabilities, we arrive at an average allocation of $2,470
per special education pupil. We then multiply this per pupil amount by the count of students
with disabilities in each district and/or state charter schools to determine the amount available
for each.
WeightedPupilFundingThe weighted pupil funding draws on data from a national study conducted by AIR for the
Office of Special Education Programs (OSEP).89 Specifically, the Special Education Expenditure
Project (SEEP), directed by Jay Chambers, resulted in a rich series of studies that provided
estimates of special education spending ratios by student disability based on analysis of a
nationwide random sample of students with disabilities. As mentioned in Chapter 3, this was
and still remains to be the largest and most comprehensive data collection and gathered
information about special education students from the most knowledgeable providers of
services supplied to each individual. Although we have already listed the special education
weights generated from this research in Chapter3, we summarize them again in Table 4.5:
Table 4.5. Specific Disability Category Weights
Student Category
Special Education Weight Using General Education Student as Comparison Group
Special Education Weight Using Student With Specific Learning
Disability as Comparison Group
General Education Student Comparison group 1.0 n/a
Specific Learning Disability (SLD) 1.6 Comparison group 1.0
Speech/Language Impairment (SLI) 1.7 1.1
Emotional Disturbance (ED) 2.2 1.4
Mental Retardation (MR) 2.3 1.4
Orthopedic Impairment (OI) 2.3 1.4
Other Health Impairment (OHI) 2.0 1.3
Autism (AUT) 2.9 1.8
Hearing Impairment/Deafness (HI/D) 2.4 1.5
Multiple Disabilities (MD) 3.1 1.9
Traumatic Brain Injury (TBI) 2.5 1.6
Visual Impairment/Blindness (VI/B) 2.9 1.8
Preschool (PRE) 2 2.0 1.3
Average Special Education Student 1.9 1.2
Source: Appendix B‐1 of Special Education Expenditure Project (SEEP) Report 5, Total Expenditures for Students with Disabilities, 1999–2000: Spending Variation by Disability (2003).
89 See Chambers et al. (2004).

American Institutes for Research Study of New Funding Method for Nevada Public Schools—89
Because special education is funded in Nevada outside of the DSA and the total dollars
allocated are intended to be focused on special education students only, we decided to use the
student weight based on SLD (i.e., using SLD as the comparison group) rather than the one that
compares special education with regular education students. We multiplied the SLD based
student weight by the proportion of students by disability category for each district and the
state charter schools. This calculation produces an overall average student weight for each
district/charter school. By dividing the total dollars made available by the Nevada legislature for
special education services ($121,252,632) by the statewide total weighted enrollment across all
districts and state charters, we determined that the average SLD students would be allocated
$2,470. Multiplying the weighted sum of students for each district and charter by this base
allocation provides, in effect, the weighted allocation of dollars (column 6 of Table 4.4).90
However, this approach treats each district separately in the determination of both the special
education identification rates and the classification of students by disability. A district that
identifies more students with disabilities receives greater funding, and a district that identifies
greater proportions of students who are classified in high‐cost disability categories will receive
greater funding. To mitigate these incentives somewhat, we also calculated the allocations
based on averages across groups of districts as was done in the calculations of the BSR in the
DSA Modules. That is, using the same groupings of districts as was done in the current DSA
Modules, we calculated group‐based average identification rates and group‐based average
proportions of students classified by disability. By using the group averages, we recognize some
of the variations in the identification and classification of special education students across
districts, but we assume that districts in the same size/density group are facing similar
circumstances and conditions that may impact the policies and determination of special
education services. By grouping the districts, it reduces the impact of any one district on its own
special education allocations, and the allocations of dollars are presented in column 8 of Table 4.4.
ACensus‐BasedApproachTo avoid creating any incentives for identifying or classifying special education students, a
number of states (9 out of the 50) use a census‐based approach to allocating dollars for special
education. This approach essentially allocates special education dollars to the district from the
state based entirely on the total enrollment (special and non‐special education combined) of
the district or charter school. In effect, this is equivalent to assuming that all districts have the
same identification and classification rate for special education students.
90 For example, Carson City’s mental retardation count is 17, which is multiplied by its SEEP weight of 2.3, and the same is done for the other disability categories for a weighted special education enrollment of 1,058 students. Carson City’s special education allocation is $2,193,332 (1,058 disability‐based weighted enrollment multiplied by $2,470 per weight pupil amount).

American Institutes for Research Study of New Funding Method for Nevada Public Schools—90
The census‐based approach also generally provides flexibility in how special education dollars
are used. It incentivizes districts to find ways to reduce the identification of special education
students through such service models as response to intervention (RTI) or early intervention
services. RTI attempts to identify learning deficits early and ameliorate the potential impact
through various instructional interventions or strategies. Using a census‐based system provides
funds to districts to support RTI and other early intervention or pre‐referral programs for
students who do not (yet) have an IEP. The report of the President’s Commission on Excellence
in Special Education suggested that, to some extent, the rate of special education identification
is due to inadequate school funding and the provision of quality programs being offered to
students sufficiently early to avoid the learning problems that eventually lead to identification
for special education services.91
Census‐BasedModelCombinedWithaCatastrophicAidProgramBecause census‐based models do not provide differential funding for variations in identification
or any other factors affecting the costs of special education services, they are often
accompanied by catastrophic aid programs or what are otherwise known as risk management
model or contingency fund. If Nevada does consider the implementation of a census‐based
approach to funding, we would also recommend the establishment of a contingency fund to
which districts can apply for money to help pay for the cost of educating extraordinarily high‐
cost special education students. This type of contingency fund serves as an insurance provision
to protect districts against extraordinarily high special education costs that may arise and be
particularly difficult for small districts to sustain. Because of the number of small districts in
Nevada, the establishment of this type of fund would be especially important.
As of 1999–2000, 31 states had such contingency funds for high‐cost students. To define what
constitutes a high‐cost student, most states establish a threshold per‐pupil cost based on a
multiple of the average cost of a regular education student, and these multiples range from 1.1
to 5.0. Kansas reimburses expenditures over a base of $25,000 per student (Parrish, Harr,
Anthony, Merickel, & Esra, 2003). The percentage of spending above this threshold covered by
states also varies from 65 percent to 80 percent.
The contingency fund should be designed to be used rarely, to be transparent and simple, and
to be low‐cost to administer. Districts would be eligible to apply for funds for students for
91 The introduction to the report to President Bush, states: “Of those with ‘specific learning disabilities,’ 80% are there simply because they haven’t learned how to read. Thus, many children identified for special education—up to 40%—are there because they weren’t taught to read. The reading difficulties may not be their only area of difficulty, but it’s the area that resulted in special education placement. Sadly, few children placed in special education close the achievement gap to a point where they can read and learn like their peers.” Excerpt taken from A New Era: Revitalizing Special Education for Children and Their Families, report of the President’s Commission on Excellence in Special Education (2002), available for download at http://www.ed.gov/inits/commissionsboards/whspecialeducation/index.html.

American Institutes for Research Study of New Funding Method for Nevada Public Schools—91
whom they can document costs of more than, for example, three times that of the average
pupil. There should be some district responsibility (e.g., copay) for the excess costs for these
high‐cost students; thus, the state could cover 75 percent of the cost above the threshold of
special education services for students who cost over three times the average per‐pupil cost for
a general education student.
Table 4.6 presents data that offer estimates of the potential costs of establishing a contingency
fund to support exceptionally high‐cost special education students in Nevada. Data used in this
table include the Basic Support Guarantee derived from the DSA Module 2, data from the
Nevada Department of Education, and estimates of costs and percentages of students under
the alternative high‐cost scenarios (1, 2, and 3). These high‐cost scenarios are based on data
originally collected as part of the SEEP referred to earlier, which was conducted by AIR for the
U.S. Office of Special Education Program.92 Scenario 1 classifies students as high cost if the cost
of serving them is at least four times the Basic Support Guarantee ($5,374) while Scenarios 2
and 3 classify as high cost only the top 1 percent and the top one half of 1 percent of students,
respectively, with respect to their cost of services. Under each of the three scenarios, we have
estimated the percentage of special education students, based on district data, that are likely to
be identified as high cost (e.g., severely and profoundly handicapped), and we have applied that
percentage to actual counts of special education students in Nevada in 2012–13 (49,088).
In row E, we also have estimated the cost thresholds for students to qualify as being high cost
under the two scenarios along with the average per‐pupil costs for qualifying students. We
have then calculated the excess cost for which the state would assume some responsibility for
reimbursement. We are using cost estimates originally produced under the SEEP study
conducted by AIR to come up with values for the cost thresholds and the average costs of the
special education students identified under the two scenarios (see footnotes to the exhibit for
further explanation).
We have then assumed the state would take responsibility for 75 percent of those excess costs
under the contingency fund program and have calculated the total cost based on the
percentages of students likely to be served. Based on these estimates, the costs of such a
program under Scenarios 1, 2, and 3 are $21.2 million, $6.7 million, and $4.1 million,
respectively. One can see that these estimates will vary with the choice of the criteria for
classifying students as high cost along with the choice of what percent of costs the state will
reimburse. Depending upon which scenario is selected, these figures represent a substantial
investment of education funds to serve these high cost students amounting to approximately $73.3
million under scenario 1, $25.4 million under scenario 2, and $15.7 million under scenario 3.
92 Data for this analysis draws on information published in the Journal of Special Education Leadership.

American Institutes for Research Study of New Funding Method for Nevada Public Schools—92
How large should a contingency fund be? Unfortunately, there is no straightforward answer to
this question. AIR was able to obtain estimates from two states, Connecticut and New
Hampshire, based on NCES data on total expenditures combined with data from (Parrish et al
2003) on the amounts set aside for these contingency funds. In both instances, the contingency
funds were significantly less than 1 percent of total K–12 spending. New Hampshire set aside 1
million for the contingency fund while spending a total of 1.6 billion on K–12 education.
Connecticut set aside $11.5 million while spending $6.2 billion on K–12 education.

American
Institutes for Research
Study of New
Funding Method for Nevada Public Schools—93
Table 4.6. Steps to Calculating a Special Education Contingency Fund to Support Exceptionally High‐Cost Students W
ith Disab
ilities (2012–1
3)
Row
Description
Scenario 1
Scenario 2
Scenario 3
Source/Explanation
A
High‐cost studen
t definition
4 x Base Cost
Top 1%
Top ½%
Scen
ario 1 equals four times base per‐pupil cost,
Scen
arios 2 and 3 equal costs of top one and one‐half
percent of special education studen
ts, respectively
B
Total number of special education studen
ts
49,088
49,088
49,088
NDE Research Bulletin, 2011–12
C
Percent classified as high cost (estimated)
5.70%
1.00%
0.50%
Cham
bers et al., Journal of Special Education Leadership
(2005)
D
Estimated
studen
ts classified as high cost
2,798
491
245
Equals B x C
E Base per‐pupil cost (Basic Support Guarantee)
$ 5,374
$ 5,374
$ 5,374
Defined
in DSA
Module 2 (compatibility m
ode)
F Estimated
cost reimbursem
ent threshold, above which
costs are partially reimbursed
from the contingency
fund
$21,496
$38,918
$47,177
Scen
ario 1 is four times the base sufficiency cost while for
Scen
arios 2 and 3 the thresholds have been estim
ated
a
G
Estimated
average cost of a special education studen
t falling above the threshold
$31,584
$57,183
$69,318
Estimates are based
on ratio of per‐pupil expen
ditures for
high‐cost special education studen
ts to gen
eral education
studen
ts (source: Figure 1 in
Cham
bers et al., Journal of
Special Education Leadership, 2005)b
H
Average excess cost per high‐cost special education
studen
t $10,088
$18,264
$22,140
Average cost over and above the cost reimbursem
ent
threshold, equal to G–Fb
I Percentage of this excess cost that state would pay
75%
75%
75%
Option for state responsibility for excess costs based
on a
survey of practices from m
ultiple states
J Total amount necessary for Contingency Fund
$21,169,789
$6,724,186
$4,075,574
Equals D x H x I
K
Estimated
total expen
diture allocated to high‐cost
studen
ts over and above the Basic Support Guarantee
$73,335,999
$25,431,889
$15,694,345
Equals D x (G–E)
a As a rough
estim
ate of the threshold values under scenarios 2 and 3, w
e applied the Scen
ario 1 ratio of the average high‐cost special education studen
t to cost reimbursemen
t threshold in
rows G and F,
respectively, or 1.47 (=$31,584/$21,496). The estim
ated cost reimbursem
ent thresholds for Scen
arios 2 and 3 are as follows: $38,918 (=$57,183/1.47) and $47,177 (=$69,318/1.47).
b The ratios presented in
the table below were applied to the projected
sufficient base per‐pupilcost to estim
ate the average cost per pupil of special education studen
ts qualifying as high cost under Scenarios
1, 2, and 3 in
the exhibit above. In each case, the ratio in
row C of the following table was applied to the $5,374 figure presented in
Row E of Table 4.6.
Scen
ario 1
Scen
ario 2
Scen
ario 3
A
Nationwide estimates of the cost of a special education
studen
t, SEEP
$40,553
$69,760
$84,564
B
Nationwide cost of a regular education studen
t, SEEP
$6,556
$6,556
$6,556
C
Ratio of A to B
6.19
10.64
12.90

American Institutes for Research Study of New Funding Method for Nevada Public Schools—94
TheImpactofAddingGiftedStudentsIn the previous analysis, we focused exclusively on students with disabilities. But it is our
understanding that Nevada treats gifted students as special education. The SEEP Study, upon
which the previous analysis was based, does not include gifted students in its analysis. There is
no prevailing literature of which we are aware that provides a solid estimate of the relative cost
or expenditure on gifted students. Nevertheless, we made some assumptions that would
permit us to include gifted students in the analysis for this report. For the sake of simplicity, we
made the assumption that the cost of a gifted student was between that of a regular student
and a student who was classified as SLD. An SLD student has a weight of 1.6 relative to a regular
education student, and therefore we are assuming for simplicity that a gifted student would
have a weight of 1.3 relative to a regular student. Entering this number into our special
education simulation model, this implies a weight of 0.81 (equal to 1.3/1.6) relative to an SLD
student. This weight was used to recalculate all of the figures presented in Table 4.5 to show
how the allocations under the different scenarios would change relative to the current
allocations. These revised allocations of special education funds including gifted counts of
students are displayed in Table 4.7.
It is important to note that adding gifted students to the analysis has no impact on the
simulation of the costs of implementing the census‐based approach since that is based on total
enrollment, special and non‐special education students combined.

American
Institutes for Research
Study of New
Funding Method for Nevada Public Schools—95
Table 4.7. C
omparison of Allo
cations Betw
een Current the Nevada Special Education Funding Method and Alternative Funding Models W
ith
Gifted Students In
cluded as Part of Special Education: Fixed W
eight, Pupil Weights, G
rouped Pupil Weights, and Census Baseda
Fixed‐W
eight Allo
cation
Pupil‐Weighted Allo
cation
(SLD
=1.0)
Pupil‐Weighted Allo
cation Using
Grouped
Averages (SLD
=1.0)
Census‐Based
Model
School
Districts
Nevada
Group
Allo
cated
Amount,
2012–13
Allo
cation
Based on
Fixed Per‐
Pupil Amount
Percent
Chan
ge
From
Original
Allo
cation
Allo
cation
Based on
Weighted
Pupil
Allo
cation
Percent
Chan
ge
From
Original
Allo
cation
Allo
cation Based
on Group W
eight
and Group
Inciden
ce
Percent
Chan
ge From
Original
Allo
cation
Census‐Based
Allo
cation ($
Allo
cated
Proportional to
Total
Enrollm
ent), FY
2013
Percent
Chan
ge
From
Original
Allo
cation
Carson City
1
$ 3,917,148
$ 3,395,115
‐13%
$ 3,008,731
‐23%
$ 2,619,002
‐33%
$ 2,136,731
‐45%
Churchill
1
$ 1,869,096
$ 1,374,066
‐26%
$ 1,338,074
‐28%
$ 1,325,233
‐29%
$ 1,081,201
‐42%
Douglas
1
$ 2,783,760
$ 1,951,215
‐30%
$ 1,918,672
‐31%
$ 2,122,336
‐24%
$ 1,731,522
‐38%
Lyon
1
$ 2,505,384
$ 2,532,472
1%
$ 2,584,863
3%
$ 2,783,768
11%
$ 2,271,156
‐9%
Elko
2
$ 3,340,512
$ 2,536,580
‐24%
$ 2,443,043
‐27%
$ 2,746,711
‐18%
$ 2,652,902
‐21%
Humboldt
2
$ 1,272,576
$ 1,010,524
‐21%
$ 1,024,043
‐20%
$ 981,397
‐23%
$ 947,879
‐26%
Nye
2
$ 2,306,544
$ 1,862,897
‐19%
$ 1,893,404
‐18%
$ 1,581,838
‐31%
$ 1,527,813
‐34%
Lander
2
$ 516,984
$ 244,415
‐53%
$ 258,031
‐50%
$ 317,225
‐39%
$ 306,391
‐41%
White Pine
2
$ 636,288
$ 396,405
‐38%
$ 403,038
‐37%
$ 394,388
‐38%
$ 380,918
‐40%
Lincoln
3
$ 715,824
$ 236,200
‐67%
$ 235,950
‐67%
$ 309,218
‐57%
$ 271,887
‐62%
Mineral
3
$ 318,144
$ 203,337
‐36%
$ 203,739
‐36%
$ 161,045
‐49%
$ 141,602
‐55%
Pershing
3
$ 636,288
$ 211,553
‐67%
$ 212,389
‐67%
$ 216,610
‐66%
$ 190,459
‐70%
Storey
3
$ 318,144
$ 174,582
‐45%
$ 162,877
‐49%
$ 128,082
‐60%
$ 112,619
‐65%
Esmeralda
4
$ 39,768
$ 6,162
‐85%
$ 8,764
‐78%
$ 11,342
‐71%
$ 17,666
‐56%
Eureka
4
$ 119,304
$ 49,294
‐59%
$ 47,236
‐60%
$ 44,658
‐63%
$ 69,559
‐42%
Clark
5
$ 76,593,168
$ 79,759,523
4%
$ 81,219,460
6%
$ 85,592,537
12%
$ 86,479,763
13%
Washoe
5
$ 22,906,368
$ 23,120,875
1%
$ 22,059,778
‐4%
$ 17,686,700
‐23%
$ 17,870,035
‐22%
State
Charter
Schools
$ 457,332
$ 2,187,415
378%
$ 2,230,540
388%
$ 2,230,540
388%
$ 3,062,528
570%
Totals
$121,252,632
$121,252,632
0%
$121,252,632
0%
$121,252,632
0%
$121,252,632
0%
a This table includes the total count of studen
ts with disabilities plus the count of gifted
studen
ts as part of the analysis.

American Institutes for Research Study of New Funding Method for Nevada Public Schools—96
Table 4.8. Analysis of Enrollment, Special Education Units and Percent Identified as Eligible for Special Education With and Without Gifted Student Counts
District
Counts of Gifted and
Talented Students
Total Special
Education Enrollment, Including Gifted
Allocated Special
Education Units,
2012–13
Average Students Per‐Unit, Including Gifted, 2012–13
Average Students With
Disabilities per Special Education
Unit
Percent Total
Enrollment Identified as Special Education (Including Gifted)
Percent of Total
Enrollment Identified as Special Education Students
Carson City 731 1,653 99 16.8 9.4 21.4% 11.9%
Churchill 94 669 47 14.2 12.2 17.1% 14.7%
Clark 5,704 38,833 1,926 20.2 17.2 12.4% 10.6%
Douglas 156 950 70 13.6 11.3 15.1% 12.7%
Elko 177 1,235 84 14.7 12.6 12.8% 11.0%
Esmeralda 0 3 1 3.0 3.0 4.7% 4.7%
Eureka 0 24 3 8.0 8.0 9.5% 9.5%
Humboldt 0 492 32 15.4 15.4 14.3% 14.3%
Lander 0 119 13 9.2 9.2 10.7% 10.7%
Lincoln 0 115 18 6.4 6.4 11.7% 11.7%
Lyon 135 1,233 63 19.6 17.4 15.0% 13.3%
Mineral 4 99 8 12.4 11.9 19.3% 18.5%
Nye 0 907 58 15.6 15.6 16.4% 16.4%
Pershing 4 103 16 6.4 6.2 14.9% 14.3%
Storey 23 85 8 10.6 7.8 20.8% 15.2%
Washoe 2,786 11,257 576 19.5 14.7 17.4% 13.1%
White Pine 0 193 16 12.1 12.1 14.0% 14.0%
State Charter Schools 133 1,065 12 92.6 81.0 9.6% 8.4%
Totals 9,947 59,035 3,049 19.4 16.1 13.4% 11.2%
Including gifted students as part of special education changes the landscape of the allocations
and the percent of students identified as eligible for special education services. Excluding gifted,
the average special education identification rate is 11.2 percent while with gifted included, the
average identification rate equals 13.4 percent. Carson City stands out with the highest
combined identification rate of 21.4 percent, almost half (44 percent) of which is accounted for
by gifted students. Seven of the 17 districts in Nevada report no gifted students at all.
It is also noteworthy that the range of variation in the total number of special education
students, including gifted, per unit allocation is still quite large. The average number of students
per special education unit excluding gifted is about 16 and, excluding the state charter schools,
ranges from 3 students per unit to more than 17 students. Including gifted, the average rises to
more than 19 and, excluding the state charter schools, ranges from 3 to 20 students.

American Institutes for Research Study of New Funding Method for Nevada Public Schools—97
AnalysisoftheSpecialEducationFundingOptionsThe analyses in Table 4.4 reveal that there are substantial reallocations of funds that result
from any of the options for funding special education. We have been careful to ensure that all
of the options were applied so that the impact would be fiscally neutral overall: that is, changes
in the allocations across districts basically add up to zero. It is a zero sum game in effect: the
total dollars remains at $121.3 million.
It is important for state policymakers to consider what they regard as the most equitable way
to allocate funds and recognize that any short‐term gains or losses in this process reflect the
fact that the state is moving from a less to a more equitable solution and resolving any over‐ or
underfunding that existed under the old system. That said, we also realize that sudden
adjustments of funding can have substantial impact on programs, services, and children and
cannot be done overnight, no matter how much better or preferable a new method for
allocating funds might be. The so‐called winners (losers) in moving from the old to a new
system are resulting only from the fact that these districts were underfunded (or overfunded)
under the old system.
Table 4.4 reveals that, regardless of which new option the state might adopt for funding special
education, Clark County Public Schools stands to gain significant amounts of absolute dollars
ranging from as low as a 7‐percent increase under a fixed‐weight allocation (with all students
with disabilities receiving equal weight) to a 13‐percent increase under a census‐based system
(with funds being allocated based on total enrollment—special and non‐special education
combined).
The State Charter schools also stand to gain substantial funds under almost any new option for
funding special education. Under the current regime, State Charter schools are receiving
roughly $460,000 in special education funding while under any of the new options, these
schools would receive anywhere from about $2.3 million to just more than $3.1 million.
Lyon Public Schools would gain funding under the first three options—the fixed‐weight or the
pupil‐weighted allocation with implemented with individual district or grouped rates of
identification (reflecting the overall percent of students identified as eligible for special
education services) and classification (reflecting the distribution of special education by
disabilities) of special education students.
The losses of funds among the remainder of the districts range from just under 10 percent to as
high as 80 percent and depend, to some degree, on which model is implemented.
Adding gifted students into the analysis of special education resulted in similar patterns of
change across districts. Clark County and Lyon Public Schools along with the State Charter
Schools gained funding under the same options they did before and the remaining districts lost

American Institutes for Research Study of New Funding Method for Nevada Public Schools—98
funding. However, the magnitudes of the changes, both positive and negative, tended to be
somewhat smaller, with some exceptions.
There is a range of costs for holding districts harmless if Nevada were to decide to implement
one of the four alternative funding models for special education immediately. By holding
districts harmless, no districts lose any funding to prevent dramatic losses of services. Tables
4.9 and 4.10 present the district‐by‐district and total state costs of implementing the
alternative models without and with gifted students included, respectively. In each case, the
fixed‐weight model was the least costly, amounting to $7.3 million and $5.1 million,
respectively, while the census‐based model was the most expensive at $12.5 million in both
cases. District‐by‐district amounts show the amounts that each district would lose in real terms.
Lyon, Clark, and the state charter schools would all gain revenues as suggested earlier with the
exception of the census‐based model, in which Lyon would join the remaining districts requiring
state revenues to hold them harmless.

American Institutes for Research Study of New Funding Method for Nevada Public Schools—99
Table 4.9. Analysis of the Cost of Implementing Alternative Special Education Funding Models Under a “Hold‐Harmless” Provision, Including Students With Disabilities Only
School Districts
Fixed‐Weight Allocation
Pupil‐Weighted Allocation (SLD=1.0)
Pupil‐Weighted Allocation Using
Grouped Averages (SLD=1.0)
Census‐Based Model
Carson City $ 1,639,709 $ 1,723,816 $ 1,492,485 $ 1,780,417
Churchill $ 448,784 $ 504,465 $ 642,200 $ 787,895
Douglas $ 822,495 $ 862,732 $ 818,909 $ 1,052,238
Lyon $ ‐ $ ‐ $ ‐ $ 234,228
Elko $ 727,138 $ 858,034 $ 350,299 $ 687,610
Humboldt $ 57,283 $ 107,057 $ 204,176 $ 324,697
Nye $ 66,157 $ 151,557 $ 584,473 $ 778,731
Lander $ 223,041 $ 223,305 $ 171,636 $ 210,593
White Pine $ 159,557 $ 177,568 $ 206,937 $ 255,370
Lincoln $ 431,762 $ 447,276 $ 383,695 $ 443,937
Mineral $ 83,484 $ 92,994 $ 145,167 $ 176,542
Pershing $ 391,747 $ 401,293 $ 403,629 $ 445,829
Storey $ 164,997 $ 171,499 $ 180,572 $ 205,525
Esmeralda $ 32,358 $ 29,793 $ 26,859 $ 22,102
Eureka $ 60,021 $ 65,543 $ 68,476 $ 49,745
Clark $ ‐ $ ‐ $ ‐ $ ‐
Washoe $ 1,982,088 $ 2,490,798 $ 5,224,701 $ 5,036,333
State Charter Schools
$ ‐ $ ‐ $ ‐ $ ‐
Totals $ 7,290,622 $ 8,307,730 $ 10,904,213 $ 12,491,791

American Institutes for Research Study of New Funding Method for Nevada Public Schools—100
Table 4.10. Analysis of the Cost of Implementing Alternative Special Education Funding Models Under a “Hold‐Harmless” Provision, Including Students With Disabilities and Gifted Students as Part of Special
Education
School Districts
Fixed‐Weight Allocation
Pupil‐Weighted Allocation (SLD=1.0)
Pupil‐Weighted Allocation Using Grouped Averages
(SLD=1.0)
Census‐Based Model
Carson City $ 522,033 $ 908,417 $ 1,298,146 $ 1,780,417
Churchill $ 495,030 $ 531,022 $ 543,863 $ 787,895
Douglas $ 832,545 $ 865,088 $ 661,424 $ 1,052,238
Lyon $ ‐ $ ‐ $ ‐ $ 234,228
Elko $ 803,932 $ 897,469 $ 593,801 $ 687,610
Humboldt $ 262,052 $ 248,533 $ 291,179 $ 324,697
Nye $ 443,647 $ 413,140 $ 724,706 $ 778,731
Lander $ 272,569 $ 258,953 $ 199,759 $ 210,593
White Pine $ 239,883 $ 233,250 $ 241,900 $ 255,370
Lincoln $ 479,624 $ 479,874 $ 406,606 $ 443,937
Mineral $ 114,807 $ 114,405 $ 157,099 $ 176,542
Pershing $ 424,735 $ 423,899 $ 419,678 $ 445,829
Storey $ 143,562 $ 155,267 $ 190,062 $ 205,525
Esmeralda $ 33,606 $ 31,004 $ 28,426 $ 22,102
Eureka $ 70,010 $ 72,068 $ 74,646 $ 49,745
Clark $ ‐ $ ‐ $ ‐ $ ‐
Washoe $ ‐ $ 846,590 $ 5,219,668 $ 5,036,333
State Charter Schools
$ ‐ $ ‐ $ ‐ $ ‐
Totals $ 5,138,034 $ 6,478,979 $ 11,050,962 $ 12,491,791

American Institutes for Research Study of New Funding Method for Nevada Public Schools—101
Chapter5—RecommendationsAfter a review of the various components of school funding in the state of Nevada, we focus
attention in this final chapter on all of our recommendations for reform and change. The
recommendations are divided into three sections: those focused on the Distributive School
Account, those focused on special education funding, and those that have more general
application to Nevada school funding reform.
DistributiveSchoolAccountDSAModelRecommendations
ModifyDSAAdjustmentsforScale/DensityandGeographicDifferencesinStaffingPricestoEnsureEquityAcrossDistrictsAs we have demonstrated earlier in this report, the process used by the DSA to calculate the
BSR attempts to adjust for two components of differences in educational costs (cost factors)
across districts:
Scale/Density—This component provides an estimate of the differences in educational
costs associated with differences in district size and density of student population
served.
Differences in Staffing Prices—This portion of the BSR captures differences in
educational costs associated with variations in the average compensation levels of
educators across districts.
The following section offers a series of recommendations stemming from our in‐depth
investigation of the DSA and touches on the various elements involved in calculating the BSR
that represent the current funding adjustments for differences in scale/density and
compensation across Nevada districts.
Recommendation1—ReviewandRevisetheTeacherAllotmentTablesandAttendanceAreasThe teacher allotment tables are a critical component of the DSA. These tables provide the
foundation for adjustments that account for the variation in the relative costs of services across
the districts corresponding to differences in size and sparsity. The teacher allotment tables
provide additional dollars to smaller districts to reflect the consolidation of courses and classes
that inevitably are associated with smaller districts in rural and more remote locations. It is our
understanding that the teacher allotment tables were last reviewed several years ago.
However, because of the critical role that these tables play in determining funding allocations
and guarantees in the current DSA, they need to be reviewed and possibly updated
approximately every five years.
To carry this analysis out, we recommend a panel be convened that would be charged with
examining existing school‐level data on enrollments and actual teacher allocations and
compare current pupil‐teacher ratios with those suggested by the teacher allotment tables.

American Institutes for Research Study of New Funding Method for Nevada Public Schools—102
This same panel could simultaneously review the structure and conceptual underpinnings on
which the attendance areas were built and the way in which the FTE allocations generated by
the teacher allotment tables are affected by the choice of attendance areas. This type of
analysis would help inform decisions by Nevada policymakers as to how the teacher allotment
tables or attendance areas might be modified to create appropriate funding adjustments. The
panel could seek out stakeholder input on how well the current funding adjustments meet the
needs of districts in remote rural regions of the state and may be compared with similar
adjustments in other states as we have done earlier in this report (e.g., the most aggressive
scale/density funding profiles such as New York—see the scale of operations cost adjustment
simulation in the section “Using the Nevada Funding Adjustment Simulator (FAS)” in Chapter 4).
As part of this investigation, one could ask whether the teacher allotment tables might be
better applied to school catchment areas rather than the larger attendance areas in which
schools of varying sizes are lumped together and when and under what circumstances more
aggregated school data might be permissible to use for this purpose.
In addition, while the attendance areas are being reviewed and possibly modified, the
definitions and procedures for determining these should be well documented. Although we
were able to obtain the data and the calculations underlying the attendance areas, we were not
able to obtain any documentation that described how schools were assigned to attendance areas.
Recommendation2—UpdatetheFTEStaffingandExpenditureDataUsedinDSACalculationsAs part of the many calculations involved in determining the BSR for each district, the DSA
makes use of data on administrative and teacher full‐time‐equivalent (FTE) staff to calculate
administrative to teacher ratios. The DSA then uses these ratios in conjunction with the
projected teacher FTE allotments to calculate administrative staffing needs. In addition, the
model uses per‐pupil expenditure on classified staff and operations to calculate the funding
necessary to support these functions. The research team found that the DSA currently uses
information dating as far back as 2004 to support these calculations that underlie the BSR. After
some investigation, including discussions with various individuals with ties to the Nevada
Department of Education, it appears likely that the use of 2004 figures in the current DSA are simply
those that were used the last time the model was modified by the DSA Evaluation Team in 2006.
The BSR is obviously a critical component to the determination of the amount of funding to be
made available to each district, and the data underlying these calculations need to be as
accurate as possible. Although we believe the basic conceptual framework on which the DSA
has been developed is well founded, it is vitally important that these data are reviewed and
updated on a periodic basis of roughly every three to five years. Note that modifying this
information on a more frequent basis is not warranted, as it could create a perverse incentive
for districts to distort their behavior, although this incentive is tempered by the district
groupings explained later (see “Recommendation 4—Reconsider the Way the DSA Groups

American Institutes for Research Study of New Funding Method for Nevada Public Schools—103
Districts for Calculations”). Although we do not believe that many of the relationships that are
utilized and measured within the DSA data and calculations change rapidly over time (e.g., from
year to year), it is important to update these as the configurations of enrollments and services
in each district may change in response to changes in local conditions over longer periods (e.g.,
five years). To this end, we strongly suggest that the administrative and teacher staffing data, as
well as the information on operational and classified staff expenditures used to populate the
DSA, be updated no less frequently than every five years.
Again, a key suggestion under this recommendation focuses on documenting the data elements
utilized within the DSA calculations. The idea here is that detailed documentation be drafted as
to what FTE staffing and expenditure data will be used to populate the DSA (including the year
and source of the information) as well as how these data are employed by the DSA (i.e., what
calculations are made using these pieces of data that enter the model). This should take the
form of an independent stand‐alone document that should greatly improve the procedures for
maintaining and updating the DSA model over time as well as provide a much greater degree of
transparency than is currently offered.
Recommendation3—ReplacetheImplicitWageDifferentialAdjustmentintheDSAWithaMoreObjectiveMeasureofGeographicLaborCostVariation,SuchastheComparableWageIndex(CWI)As described in Chapter 3, the CWI is intended to capture the variations in the market price of
hiring and retaining education staff across different geographic regions of Nevada. The CWI
provides an estimate of the wages of noneducation laborers who have comparable
characteristics and educational attainment while controlling for regional differences in the
composition of industries. Currently, the DSA attempts to capture these labor market
differences through what amounts to the model’s grouped average levels of compensation of
school personnel. Although the grouping of these averages reduces the ability of any given
district to impact the average on which its own funding is determined, the implicit average
compensation indices that help drive the BSRs in the current DSA at least partially reflect the
choices of districts regarding personnel rather than external factors affecting the supply of
labor and thus the market price of comparable staff. The CWI is explicitly designed to capture
the differences in the staffing prices derived from the supply side of the market and are
therefore outside the control of the districts. The findings presented in Chapter 4 show that the
implicit staffing price adjustments made by the DSA are greatly driven by the demand side of
the labor markets (district preferences), and these variations go beyond the patterns of
variations commonly associated with true differences in the cost of comparable labor across
districts (see the section “Incorporating the Comparable Wage Index (CWI) Into the DSA” in Chapter
4). For this reason, using the CWI or a similar type of measure would be a preferable way to capture
differences in the prices of educational resources in adjusting distributions of school funding to local
school districts.

American Institutes for Research Study of New Funding Method for Nevada Public Schools—104
Recommendation4—ReconsidertheWaytheDSAGroupsDistrictsforCalculationsWe believe that the grouping of districts for calculating certain staffing, expenditure, and staff
compensation averages seems to be conceptually reasonable. In effect, it groups districts by
what amounts to size and other characteristics of the attendance areas to capture some of the
systematic differences in staffing and spending that impact the costs of educational services in
different geographic regions of the state. As the state begins to review the teacher allotment
tables and the attendance areas within the DSA, we believe it would be useful to review the
criteria for grouping the districts for the calculations contained within the DSA. Table 5.1 shows
the variations in size and student density that exist across the 17 Nevada school districts. Our
view is that the types of differences in costs that the DSA attempts to capture in the BSR are
associated with differences in both size and student density. These two factors, size and
density, taken together impact the way districts organize and provide services to students living
in different communities. Distances between schools and sparsity of student populations may
also have significant impact on the configurations and costs of services and should be studied
and reviewed as part of the review of the teacher allotment tables and attendance areas.
Although the definitions of district groupings are explained within the DSA, we believe that
providing further information for the rationales and criteria underlying the organizing and
assignment of districts to the groupings as well as conducting further analyses of distances
between schools and between schools and the central offices would be useful in assessing the
validity of these assignments of districts to groups. Specifically, further investigation on the
appropriateness of the existing district groupings should be performed and include analyses of
staffing and expenditures on non‐personnel resources across districts in relation to their size,
density values, and other criteria such as distances between schools. The state policymakers
could then develop recommendations as to whether the assignments of districts to groupings
are appropriate and what impact alternative groupings would have on the DSA allocations.

American Institutes for Research Study of New Funding Method for Nevada Public Schools—105
Table 5.1. Enrollment and Student Density (Number of Students per Square Mile) in Nevada Districts
Districts Group Group Description Enrollment Density
Churchill 1 Centralized 4,206 0.85
Douglas 1 Centralized 6,591 9.29
Carson City 1 Centralized 7,761 53.65
Lyon 1 Centralized 8,765 4.38
Lander 2 Rural 1,136 0.21
White Pine 2 Rural 1,442 0.16
Humboldt 2 Rural 3,401 0.35
Nye 2 Rural 6,170 0.34
Elko 2 Rural 9,422 0.55
Storey 3 Small 447 1.70
Mineral 3 Small 571 0.15
Pershing 3 Small 719 0.12
Lincoln 3 Small 1,005 0.09
Esmeralda 4 Very Small 67 0.02
Eureka 4 Very Small 259 0.06
Clark 5 Large 64,838 10.29
Washoe 5 Large 307,059 38.91
IncorporateNewAdjustmentsforLow‐IncomeStudentsandEnglishLearnersIntotheDSAtoEnsureEquityAcrossDistricts
Recommendation5—EmbedthePupil‐WeightedAdjustmentsforLow‐IncomeandEnglishLearnerStudentsasWellasScale/DensityIntotheDSAThroughtheBSR
Nevada Is Not in Line With Most States on Need‐Based Funding. As mentioned in Chapter 2,
Nevada’s current funding system does not include funding adjustments for the additional costs
associated with serving low‐income students or English learners. Moreover, Nevada is generally
not in line with the rest of the country, being one of 14 states that does not adjust funding to
account for the needs of low‐income students and one of only 8 that does not account for the
additional cost of English learners. As low‐income students and English learners are widely
accepted in the mainstream education finance literature to be associated with higher
educational costs, it is our strong recommendation that funding adjustments be incorporated
into the current funding system to account for these student need cost factors.
There Are a Reasonable Range of Weights That Nevada Should Consider. The analysis in
Chapter 3 provided examples of the adjustments used in other states to account for the

American Institutes for Research Study of New Funding Method for Nevada Public Schools—106
additional costs associated with serving low‐income students, ELLs, and those students in
districts of varying sizes and degree of remoteness, which could be adopted by Nevada.
The Costs of Serving Low‐Income Students. For example, we observed that the top ten states
added anywhere from 13 to 34 percent more to state and local revenues for every low‐income
student over and above that provided to a non‐low‐income student (see Table 3.4). Currently,
Nevada relies entirely on Federal funding (e.g., through distributions of Title I dollars under the
current authorization of the Elementary Secondary Education Act, otherwise known as No Child
Left Behind) to provide additional dollars for low‐income students. Policymakers in the state of
Nevada need to decide whether they want to be among the leaders in providing equal
educational opportunities for low‐income students, and deciding to adjust the Basic Support
Guarantee somewhere in the range of the implicit low‐income weights of the top ten states
would be a step in that direction.
The Costs of ELL Programs. There is no rich literature of which we are aware describing a single
best approach to addressing the needs of ELL students. The range of options and their costs are
wide and represent a multitude of cost factors (e.g., numbers of languages represented among
student populations and the extent to which there is a critical mass of students whose primary
language is the same) and delivery systems (e.g., bilingual education, English as a second
language, or language immersion). Our recommendation is for the expert panel to recommend
the development of alternative models or creation of student‐level data systems that can track
the services students receive and the results. A student‐level data system that tracks services
can be used to estimate costs and linking such student level data to outcomes can help
policymakers learn about what is working in different parts of the state.
The Formulate Adjustment Simulator (FAS) Provides a Mechanism for Determining the Impact
of Alternative Weights. The FAS introduced in Chapter 4 and delivered with this report shows
explicitly how to incorporate these alternative adjustments. Specifically, the FAS was developed
to provide a flexible tool that can easily provide real‐time analysis of the effects of various
funding adjustments on projected funding to districts. It should be noted that the FAS is a strict
distributor of existing funding so that whatever combination of adjustments chosen for the
various cost factors, a fiscally neutral BSR is generated that represents an equitable allocation
of funding across districts that takes into account the main factors thought to impact
differences in educational costs. We strongly suggest that Nevada makes use of this tool both
to select and implement funding adjustments for low‐income students and English learners that
are palatable in terms of being both practical and politically acceptable.
Weights Should Be a Policy Judgment for Policymakers. Recommendations on what specific
weights should be adopted by the State of Nevada for low‐income or ELL students are beyond
the purview of the authors of this report. However, we can simply report what other states are
doing and offer some options for policymakers within the state to consider. Adding a low‐

American Institutes for Research Study of New Funding Method for Nevada Public Schools—107
income or ELL weight for Nevada would indicate a new commitment by policymakers to equal
educational opportunity for these categories of students. Next steps for the state of Nevada
should involve establishing its own panels of educators (e.g., teachers, curriculum specialists,
and program directors) and experts from across the state to assess available data and
determine what appropriate weights should be. These experts should be supported by the
development of data related to resource allocation and student outcomes from various sources
across the state and using these data to identify what works for various categories of students
served in different contexts. Decisions on what weights that should be established should be
based on continuous examination of available data related to understanding the factors that
lead to student success.
Policies Need to Be Established to Minimize Incentives for Overclassification. Key issues for an
expert panel to consider are options to minimize or eliminate incentives to overclassify
students based on targeted needs or disincentives associated with reclassification when a
student no longer meets the special need eligibility requirement. The expert panel would need
to set out objective criteria and standards to provide guidance to local decision makers on how
to classify or reclassify students to be eligible for additional services related to addressing
academic or language deficits. It is important that such criteria be well known and understood
by local educators to minimize errors in student classification for the determination of program
eligibility. One approach to reducing over‐classification of students with language deficits is to
establish a maximum period during which a student may be classified at a certain level of
English language proficiency. Students would be automatically reclassified into a lower need
category and become ineligible for additional funding. This would encourage districts to
monitor student progress carefully during their periods of eligibility to ensure they are
benefitting from the program and are prepared to receive general education services.
How Do You Count Students With Multiple Needs? Another critical issue relates to how you
count children who might fit into more than one need category for the purpose of funding. The
most common circumstances might include students who are English learners but who also are
from low‐income families. Similarly, a student with a disability could also be from a low‐income
family. In each instance, our experience suggests that most states count the student in both
categories. Students who satisfy the eligibility criteria of both categories generally have
additional educational needs over those who do not. The additional funding provides the
districts with flexibility on how to allocate resources to meet student needs. The focus of the
state in this case should be less on details of how children are being counted or classified and
more on whether they are learning.
What Options Are Available for Adjusting for Costs Related to District Scale? Through its
current DSA model, Nevada currently exhibits an aggressive adjustment for differences in
educational costs associated with the scale of operations. Analyses of the data in Chapters 3

American Institutes for Research Study of New Funding Method for Nevada Public Schools—108
and 4 show that Nevada currently does make a commitment that is larger than the 10 states
with the most aggressive funding profiles (see Figure 3.5) for scale of operations. For example,
drawing on data from Figures 4.3 and 4.10, the current DSA provides a scale‐related cost
adjustment of 2.76 (= 2.681/0.971) for Esmeralda, the smallest district in Nevada, relative to
Clark County, the largest district in Nevada, while the implicit New York State cost profile based
on scale of operations would have provided a cost adjustment of 2.46 (=2.442/0.994) for
Esmeralda versus Clark. In other words, a student in Esmeralda relative to a student in Clark
County would require somewhere between 146 to 176 percent more resources to adjust for
the diseconomies of small‐scale operations experienced in Esmeralda.
The final determination of what that scale adjustment should be is a policy decision for the
state legislature. We used the FAS to run a simulation using the California scale adjustment
profile (the 10th most aggressive scale profile) instead of the New York scale adjustment profile
just to illustrate the range of variations. Although the relative cost of Esmeralda versus Clark
County was 2.46 using the New York scale profile, the relative cost of these two districts using
the California profile was 1.51. In other words, the California scale profile would be associated
with a 51 percent differential cost compared with a 146 percent differential cost between
Esmeralda and Clark County. These comparisons show how aggressive the current Nevada Plan
scale parameters are relative to other states.
RecommendationsforFundingSpecialEducationThis section focuses on recommendations to improve the way Nevada currently funds special
education services.
DocumentingHowSpecialEducationIsFunded
Recommendation6—DocumenttheCurrentApproachtoFundingSpecialEducation
If Nevada decides to maintain its current approach to funding special education, it will need to
document fully and in detail the processes and procedures currently being used to allocate
special education units to districts and charter schools. We asked representatives of the Nevada
Department of Education (NVDOE) for documentation and little concrete information was
forthcoming. There seemed to be conflict among the NVDOE representatives as to whether the
original assignment of units was based on total enrollment (special and non‐special education
combined) or total enrollment of students identified as eligible for special education services
(whether we included or excluded gifted students). Our analysis also showed wide variations in
the number of special education pupils per unit across districts, regardless of whether or not
we included gifted students in the count. At the very least, this suggests a weak link between
special education student needs, even counted in the crudest of ways (i.e., with simple counts),
and unit allocation funding for special education services. Documentation of the procedures for
allocating special education units to districts should not only be made readily available but

American Institutes for Research Study of New Funding Method for Nevada Public Schools—109
should be based on a respectable assessment of the relative needs of students being served. If
the unit approach is to be retained, the unit values need to be more precisely defined in the
documentation, and the elements (e.g., average compensation levels of licensed special
education staff) included in determining these values should be calculated using updated data.
EstablishOneorMorePanelstoConsiderSpecialEducationFundingPolicyRecommendations
Recommendation7—ConsiderOneoftheFourSpecialEducationFundingOptions:FlatFunding,PupilWeightsbyDistrict,PupilWeightsbyGroupedAverageIdentificationandClassificationRates,andCensus‐BasedFundingFlat Funding and Pupil Weights. The state should consider one of the four options proposed by
AIR in the context of its policy objectives for serving special education students. Three of the
options provide simple approaches that maintain fiscal neutrality and explicitly acknowledge
the differential costs of serving students with disabilities based on an objective national source
of data. The pupil weights proposed in two pupil weight options should be updated through
careful study that could be undertaken by the state to examine how much is being spent on
special education services and how these expenditures are allocated among students by
disability or other need category. These objective data on student services could be used to
develop weights that are unique to Nevada and that reflect the differences in the service
models and organization of these special education services across the diverse groups of
districts within the state. Such analysis could follow the structure of the DSA model in which
staffing and expenditure data are grouped according to district size/density (i.e., the well‐
known five groupings of districts used in the DSA).
Census‐Based Approach. The fourth option that a state panel could study further is the viability
of employing a census‐based approach to special education funding combined with a
contingency fund to help support the costs of services for severely disabled children and who
require extraordinarily high‐cost services. Compared with the flat grant or weighted pupil
approach, the census‐based approach greatly reduces, if not eliminates, any incentives for
overidentifying children with disabilities and for inappropriately classifying them into high‐cost
disability categories. It also creates incentives for more inclusive approaches to serving students
with disabilities in the least restrictive environment and in finding creative ways through
funding flexibility to ameliorate learning deficits through RTI or pre‐referral services (i.e.,
services that occur prior to identification of a child as eligible for special education).
A Contingency or Risk Management Fund. A second part of a census‐based funding approach
involves the establishment of a contingency fund (a risk‐management fund, if you will) that
reduces the likelihood that one or a few high‐cost children with disabilities could cause
excessive financial strain or even bankruptcy on small districts that may be less able to absorb
such costs. An example of how this might look is presented in Chapter 4 (see the section

American Institutes for Research Study of New Funding Method for Nevada Public Schools—110
“Census‐Based Model Combined With a Catastrophic Aid Program”). The panel we recommend
would explore ways of setting aside state or federal funds that may be used to support these
contingency programs and determine how evaluating specific high‐cost students would be
conducted by districts, what the eligibility guidelines are for applying for additional support
from the contingency fund, and the amount of funding districts would receive for educating
students with various high‐cost disabilities.
Maintenance of Effort. The expert panel should also explore possible combinations of these
four options if it is deemed appropriate and assessing the cost implications for each of these for
the maintenance‐of‐effort (MOE) requirements imposed by the federal IDEA law. All of these
options for a new funding model for special education may have implications for the MOE
provisions of the federal law governing special education funding. There are exceptions to the
MOE provisions that involve tracking of student as well as faculty populations at the local level.
Legitimate reductions in identification rates of children and voluntary retirements or
departures of more for less experienced staff are two possibilities.93 Hold‐harmless provisions
can also provide protection for local districts against MOE violations, but this will require
additional funding from the state to support such provisions.
Recommendation8—SeparateFundingforGiftedStudentsWe recommend that funding for gifted and special education students be separated to follow
the federal IDEIA law supporting funding for students with disabilities. This division of the
funding approach between gifted and students with disabilities would follow the existing
federal law, which is primarily focused on the latter category of students. Moreover, this
approach would permit analysis and funding priorities to differentiate between these diverse
groups of students. The variation in the identification of gifted students across districts found in
Chapter 4 (see the section “The Impact of Adding Gifted Students”) also suggests quite varied
approaches to defining what constitutes a gifted student. It would seem more productive to
provide districts with the flexibility to identify gifted students in a way that reflects the diversity
and unique talents that exist in almost any student population. Giftedness can reveal itself in a
multitude of ways, and currently there is no literature of which we are aware that provides any
solid data on what the additional costs are to educate a gifted child.
Recommendation9—IntegrationofSpecialEducationIntotheDSARather than treating special education funding as a separate revenue stream, special education
could be integrated into the DSA model in the same manner as we have suggested for low‐
income and English learner students. This could make use of district‐by‐district or grouped
weights using as a starting point the weights presented from the SEEP study. Eventually,
Nevada’s own weights could be developed via the proposed project in Recommendation 2. An
93 For more exceptions to MOE, visit http://www.asha.org/advocacy/federal/EffortReqsIDEA2004FAQs/

American Institutes for Research Study of New Funding Method for Nevada Public Schools—111
appropriate set of weights could be built into the FAS model described earlier in this report, and
the funding set aside for special education could be integrated into the Basic Support
Guarantee funding per pupil.
Recommendation10—AssessingtheCostsofServingStudentsWithDisabilitiesFurther work on special education should be done to obtain an estimate of how much districts
are spending to educate students with disabilities and/or gifted students. The importance of
this is to assess the extent to which federal, state, and local funds are providing even minimally
sufficient funds to support services and to ascertain the patterns of variation in resources to
serve students with varying disabilities. Such data could support developing more accurate
weights for various categories of students and how these weights may vary across larger and
smaller districts within the state.
GeneralRecommendations
Recommendation11—CreateIncentivestoPromoteStudentAttendance
The weighted pupil enrollment in the current Nevada Plan is determined by a single count day
at the end of September. We recommend that Nevada policymakers consider some alternatives
to the current “single count day” approach to determining the enrollment on which school
funding allocations are based.
One option would be to establish multiple days through the course of the school year for
counting students. This would allow the state to adjust funding through the course of the year
to reflect changes in enrollment over time. As indicated in Chapter 2, many states count
enrollments at multiple points during the school year. For example, New Mexico counts
children on the 40th, 80th, and 120th day of the year based on when each district begins its
own school year. Later count days in the year can be used as the basis for projecting
enrollments for the coming year and for adjusting initial distributions of funds for changing
enrollments.
Another option would be to move toward counting students on the basis of average daily
attendance (ADA), which is another alternative used by a number of states as indicated in
Chapter 2. By basing funding on ADA, you create an incentive for districts to find ways of
maintaining and or increasing enrollments—the notion being students cannot learn if they are
not in school. The other benefit to an ADA system is that it tracks enrollment more closely and
would permit the state to make adjustments to fiscal distributions more frequently during the
school year.
Recommendation12—HoldDistrictsHarmlessandPhaseinChangesSlowlyOverTime
In all of the recommendations for the DSA and Special Education Funding, we have offered
some new directions for the State of Nevada. Changes in the way funds are distributed even if

American Institutes for Research Study of New Funding Method for Nevada Public Schools—112
applied in a way that is fiscally neutral for the state has significant implications for individual
districts. Under the current system of school funding, some districts are receiving more and
some less funding than they might get under a more equitable arrangement. For those
currently receiving more (less) funding, improvements in equity involve a leveling down (up) of
resources.
Such changes in resources cannot be made overnight and they have implications for existing
programs and students. With this in mind, we strongly recommend using a phase‐in of any
selected funding alternative over a three to five‐year period. A phase‐in period provides local
decision makers with an opportunity to carry out any changes (additions or losses) in resources
in a thoughtful manner to reduce the severity of the impact on existing programs and students
being served. Although losses of resources are of most concern here, even increases in
resources take time to allow for appropriate planning on how to use existing resources most
effectively and how to minimize the impact on current student populations.
One way to accomplish this phasing in of change is to hold districts that incur losses under the
new funding regime harmless and only provide increases to those districts that gain under the
new formula. This will require that additional investments in education be concentrated in
those districts that are currently under funded. In our analyses in Chapter 4, we have provided
hold‐harmless cost estimates in each case associated with alternative approaches to funding.
The Funding Adjustment Simulator (FAS), which we have provided the state, also calculates
hold‐harmless amounts for any option that the state might choose while using the simulator.
With all of this in mind, we offer a word of warning that for the state to move toward a more
equitable system of school finance, it will require that policymakers set a realistic and firm time
schedule for implementation of the new funding policies. Otherwise, there is no guarantee that
the new recommendations will ever be achieved. Hold‐harmless provisions are intended as
temporary and not permanent fixes.
Recommendation13—ReviewHowCategoricalFundingMightBeUsedMoreFlexibly
Many states, including California, are seriously considering the implementation of new
weighted student funding formulas that focus on directing resources equitably to local school
districts to capture differences in the factors affecting educational costs. While improving the
equity by which funds are distributed to district, this approach also increases the flexibility of
how these funds are used in contrast to the approach implied by categorical funding, which
tends to be targeted to specific student populations. Tied to this greater flexibility also is
greater accountability for results. Rather than focusing efforts on the compliance mentality that
emphasizes tracking exactly how dollars are targeted to specific student populations, the
accountability focuses on outcomes broken down into more detailed categories of student
need. We therefore recommend that a panel be convened to review how existing categorical

American Institutes for Research Study of New Funding Method for Nevada Public Schools—113
funding might be used more flexibly with greater accountability in place tied to improvement in
outcomes for specific subpopulations of students. The suggested review could lead to a
consolidation of some categorical funding that might be subsumed within the Basic Support
Guarantee, providing greater flexibility on how this funding is used linked to stronger
accountability for achieving results.

American Institutes for Research Study of New Funding Method for Nevada Public Schools—114
References
Alexander, C. D., Gronberg, T., Jansen, D., Keller, H., Taylor, L., & Treisman, P. U. (2000). A study
of uncontrollable variations in the costs of Texas public education (Summary report
prepared for the 77th Texas Legislature). Austin: Charles A. Dana Center, University of
Texas at Austin. Retrieved from http://www.utdanacenter.org
Augenblick, J., Silverstein, J., Brown, A. R., Rose, D., DeCesare, D., & Anderson, A. B. (2006).
Estimating the cost of an adequate education in Nevada. Denver, CO: Augenblick,
Palaich and Associates, Inc.
Baker, B. D. (2005). The emerging shape of educational adequacy: From theoretical
assumptions to empirical evidence. Journal of Education Finance, 30(3), 277–305.
Baker, B. D., Green, P., & Richards, C. E. (2008). Financing education systems. Upper Saddle
River, NJ: Pearson.
Baker, B. D., Sciarra, D. G., & Farrie, D. (2010). Is school funding fair? A national report card.
Newark, NJ: Education Law Center. Retrieved from
http://www.schoolfundingfairness.org/National_Report_Card_2010.pdf
Bennett, R. A. (2003). An analysis of Nevada’s public school funding system. Unpublished Ed.D.
dissertation, University of Nevada, Las Vegas.
Bittman, D. T. (2003). A history of public school finance and educational trends within the state
of Nevada: Summary and conclusions. Unpublished Ph.D. dissertation, University of
Nevada, Las Vegas.
Brimley, V., Verstegen, D. A., & Garfield, R. (2012). Financing education in a climate of change.
New York: Pearson.
Chambers, J. G. (1998). Geographic variations in public schools costs (NCES 98‐04 Working
Paper). Washington, DC: Department of Education, National Center for Education
Statistics.
Chambers, J. G., & Levin, J. D. (2009). Determining the cost of providing an adequate education
for all students. Washington, DC: National Education Association.
Chambers, J. G., Pérez, M., Harr, J. J., & Shkolnik, J. (2005). Special education spending
estimates from 1969–2000. Journal of Special Education Leadership, 18(1), 5–13.
Chambers, J. G., Pérez, M., & Shkolnik, J. (2003). Total expenditures for students with
disabilities, 1999–2000: Spending variation by disability. Palo Alto, CA: American

American Institutes for Research Study of New Funding Method for Nevada Public Schools—115
Institutes for Research. Retrieved from
http://csef.air.org/publications/seep/national/final_seep_report_5.pdf
Chambers, J. G., Pérez, M., & Socias, M. (2004). Explaining variations in expenditures for
students with disabilities: Comparing the roles of the IDEA disability categories and the
ABILITIES index. Manuscript submitted for publication.
Duncombe, W., & Yinger, J. (2008). Measurement of cost differentials. In E. Fiske & H. F. Ladd
(Eds.), Handbook of research in education finance and policy (pp. 239–256). New York:
Routledge.
Goldhaber, D. (1999). An alternative measure of inflation in teacher salaries. In William Fowler,
Jr. (Ed.), Selected papers in school finance 1997–99 (pp. 29–54). Washington, DC: NCES.
Retrieved from http://nces.ed.gov/pubs2001/2001378_1.pdf
Grider, A., & Verstegen, D. A. (2000). Legislation, litigation and rural & small schools: A survey of the states. Journal of Education Finance, 26(1), 103–120.
Guthrie, J. W., & Rothstein, R. (1999). Enabling “adequacy” to achieve reality: Translating
adequacy into state school finance distribution arrangements. In H. F. Ladd, R. Chalk, &
J. S. Hansen (Eds.), Equity and adequacy in education finance: Issues and perspectives
(pp. 209–259). Washington, DC: National Academy Press.
Jordan, K. F., & Lyons, T. S. (1990). Financing Education in an Era of Change. Bloomington, IN:
Phi Delta Kappa.
Kakalik, J. S., Furry, W. S., Thomas, M. A., & Carney, M. F. (1981). The cost of special education.
Santa Monica, CA: Rand.
McClurkin, W. D. (1954). Public education in Nevada: A survey report. Nashville, TN: George
Peabody College for Teachers, Division of Survey and Field Services.
Moore, M. T., Strang, E. W., Schwartz, M., & Braddock, M. (1988). Patterns in special education
service delivery and cost. Washington, DC: Decision Resources Corporation.
National Education Association. (2011). Rankings & estimates. Washington, DC: NEA Research.
Nevada State Department of Education. (2007). A guide to No Child Left Behind & adequate
yearly progress analyses in Nevada. Carson City, NV: Author. Retrieved from
http://nde.doe.nv.gov/APAC.htm
Nevada State Department of Education Administrative and Fiscal Services. (2011).The Nevada
plan: Nevada revised statutes (NRS) 387.121: Guaranteed per pupil level of educational
financial support. Las Vegas, NV: Author.

American Institutes for Research Study of New Funding Method for Nevada Public Schools—116
Nevada State Department of Education. (2012). State and local revenue sources in Nevada.
Carson City, NV: Author.
Nevada State Legislative Counsel Bureau, Fiscal Analysis Division. (2011). The Nevada plan for
school Finance: An overview [Legislative session]. Carson NV: Nevada State Legislative
Counsel Bureau.
Odden, A. R., & Picus, L. O. (2008). School finance: A policy perspective (4th ed.). New York:
McGraw‐Hill.
Parrish, T. B., Harr, J., Anthony, J., Merickel, A., & Esra, P. (2003). State special education finance
systems, 1999‐2000, Part I. Palo Alto, CA: American Institutes for Research, Center for
Special Education Finance.
Parrish, T. B., & Shambaugh, L. (2009). Analysis of special education funding in Nevada.
Washington, DC: American Institute of Research.
Parrish, T. B., & Verstegen, D. A. (1994). Fiscal provisions of the Individuals with Disabilities
Education Act: Policy issues and alternatives (Policy Paper No. 3). Palo Alto, CA:
American Institutes for Research, Center for Special Education Finance.
Rossmiller, R. A., Hale, J. A., & Frohreich, L. E. (1970). Educational programs for exceptional
children: Resource configurations and costs (Special Study No. 2). Madison: University of
Wisconsin, National Education Finance Project.
Rothstein, R., & Smith, J. R. (1997). Adjusting Oregon education expenditures for regional cost
differences: A feasibility study. Sacramento, CA: Management Analysis & Planning
Associates.
Ruggles, S., Sobek, M., Alexander, T., Fitch, C., Goeken, R., Hall, P., King, M., & Ronnander, C.
(2004). Integrated public use microdata series: Version 3.0 [machine‐readable database].
Minneapolis: Minnesota Population Center.
Ryan, C. (2011, March 14). School district seeks study on actual cost of educating students. Las
Vegas Sun. Retrieved from http://www.lasvegassun.com/news/2011/mar/14/school‐
district‐seeks‐study‐actual‐cost‐educating‐/
Stetler, B. F. (1959). Biennial report of the superintendent of public instruction of the state of
Nevada. Appendix to Journal of Senate and State Assembly. Carson City, NV.
Stoddard, C. (2005). Adjusting teacher salaries for the cost of living: The effect on salary
comparisons and policy conclusions. Economics of Education Review, 24(3), 323–339.
Takahashi, P. (2012, August 6).With pink slips looming, arbitration victory is bittersweet for
teachers union. Las Vegas Sun. Retrieved from

American Institutes for Research Study of New Funding Method for Nevada Public Schools—117
http://www.lasvegassun.com/news/2012/may/02/school‐district‐says‐teacher‐layoffs‐
way‐after‐arb/
Taylor, L. L., Alexander, C., Gronberg, T., Jansen, D., & Keller, H. (2002). Updating the Texas cost
of education index. The Journal of Education Finance, 28(2), 267–284.
Taylor, L., L. & Fowler, W. (2006). A comparable wage approach to geographic cost adjustment
(NCES 2006‐321). Washington, DC: U.S. Department of Education, Institute of Education
Sciences, National Center for Education Statistics. Retrieved from
http://nces.ed.gov/pubs2006/2006321.pdf
Taylor, L. L., Glander, M. C., & Fowler, W. J. (2006). Documentation for the NCES comparable
wage index data files (EFSC 2006‐865). Washington, DC: Department of Education,
Institute of Education Sciences, National Center for Education Statistics. Retrieved from
http://nces.ed.gov/pubs2006/2006865.pdf
U.S. Department of Education Office of Special Education and Rehabilitative Services. (2002). A
New Era: Revitalizing Special Education for Children and Their Families. Washington, DC:
Author.
Verstegen, D. A. (1994). Fiscal provisions of the Individuals with Disabilities Education Act:
Historical overview (Policy Paper No. 2). Palo Alto, CA: American Institutes for Research,
Center for Special Education Finance.
Verstegen, D. A. (1998). Judicial analysis during the new wave of school finance litigation: The new
adequacy in education. Journal of Education Finance, 24(1), 51–68.
Verstegen, D. A. (2002). Financing adequacy: Towards new models of education finance that
support standards‐based reform. Journal of Education Finance, 27(3), 749–781.
Verstegen, D. A. (2004). Towards a theory of adequacy: The continuing saga of equal educational
opportunity in the context of state constitutional challenges to school finance systems.
Saint Louis University Public Law Review, 33(2), 499–530.
Verstegen, D. A. (2011). Public education finance systems in the United States and funding
policies for populations with special educational needs. Education Policy Analysis
Archives, 19(21).
Verstegen, D. A. (2011). A quick glance at school finance: A 50‐state survey of school finance
policies and programs. Vol. I: State by state descriptions. Vol. II: Finance formulae and
cost differentials. Retrieved from www.schoolfinances.info

American Institutes for Research Study of New Funding Method for Nevada Public Schools—118
Verstegen, D. A. (2012). A quick glance at school finance: A 50‐state survey of school finance
policies and programs. Vol. I: State by state descriptions. Vol. II: Finance formulae and
cost differentials. Retrieved from http://education.unlv.edu/centers/ceps/study/
Verstegen, D. A., & Jordan, T. S. (2009). A fifty‐state survey of school finance policies and
programs: An overview. Journal of Education Finance, 34(3), 212–230.
Verstegen, D. A., & Knoeppel, R. C. (in press). Statehouse to schoolhouse: Finance
apportionment systems across the United States. Journal of Education Finance.
Verstegen, D. A., & Knoeppel, R. C. (2011, May). Financing education into the next decade: A 50‐
state survey of finance policies and programs. Paper presented at the National
Education Finance Conference, Tampa, FL.
Wisconsin Legislative Fiscal Bureau. (2007, January). State aid to school districts (Informational
Paper 27). Madison, WI: Author.

American Institutes for Research Study of New Funding Method for Nevada Public Schools—119
Appendixes
AppendixA—DistrictGroupingsintheDistributiveSchoolAccount(DSA)Model
Table A.1. District Groupings From the DSA
School District Group Group
Description
Carson City 1 Centralized
Churchill 1 Centralized
Douglas 1 Centralized
Lyon 1 Centralized
Elko 2 Rural
Humboldt 2 Rural
Nye 2 Rural
Lander 2 Small
White Pine 2 Small
Lincoln 3 Small
Mineral 3 Small
Pershing 3 Small
Storey 3 Small
Esmeralda 4 Very Small
Eureka 4 Very Small
Clark 5 Large
Washoe 5 Large

American Institutes for Research Study of New Funding Method for Nevada Public Schools—120
AppendixB—TeacherAllotmentTableinDistributiveSchoolAccount(DSA)Model
ELEMENTARY Attendance Areas SECONDARY Attendance Areas
Enrollment Ranges
Factor: 0>136 Divisor:
136>300,000
Enrollment Ranges
Factor: 0>136 Divisor:
136>300,000
Greater Than
or Equal
to
Less Than
or Equal
to
Teacher Allotments
NumberAAs in
Range
Greater Than
or Equal
to
Less Than
or Equal
to
Teacher Allotments
NumberAAs in
Range
0 0.3 -
0.40 12 1.0 7 -
0.000010.0001 -
13 27 2.0 10 0.001 45 5.0 3
28 44 4.0 7 46 65 6.0 3
45 65 6.0 2 66 104 9.0 2
66 88 8.0 4 105 145 11.0 8
89 135 9.0 9 146 190 13.0 2
136 189 15.00 6 191 260 14.00 2
190 230 16.00 2 261 450 15.00 3
231 999 17.00 14 451 999 17.00 11
1,000 2,999 18.25 9 1,000 2,799 19.00 10
3,000 9,999 18.25 2 2,800 9,999 19.50 2
10,000 50,000 18.25 1 10,000 50,000 20.25 1
50,001 300,000 18.50 1 50,001 300,000 21.50 1

American Institutes for Research Study of New Funding Method for Nevada Public Schools—121
AppendixC—StateandLocalRevenueSourcesinNevada
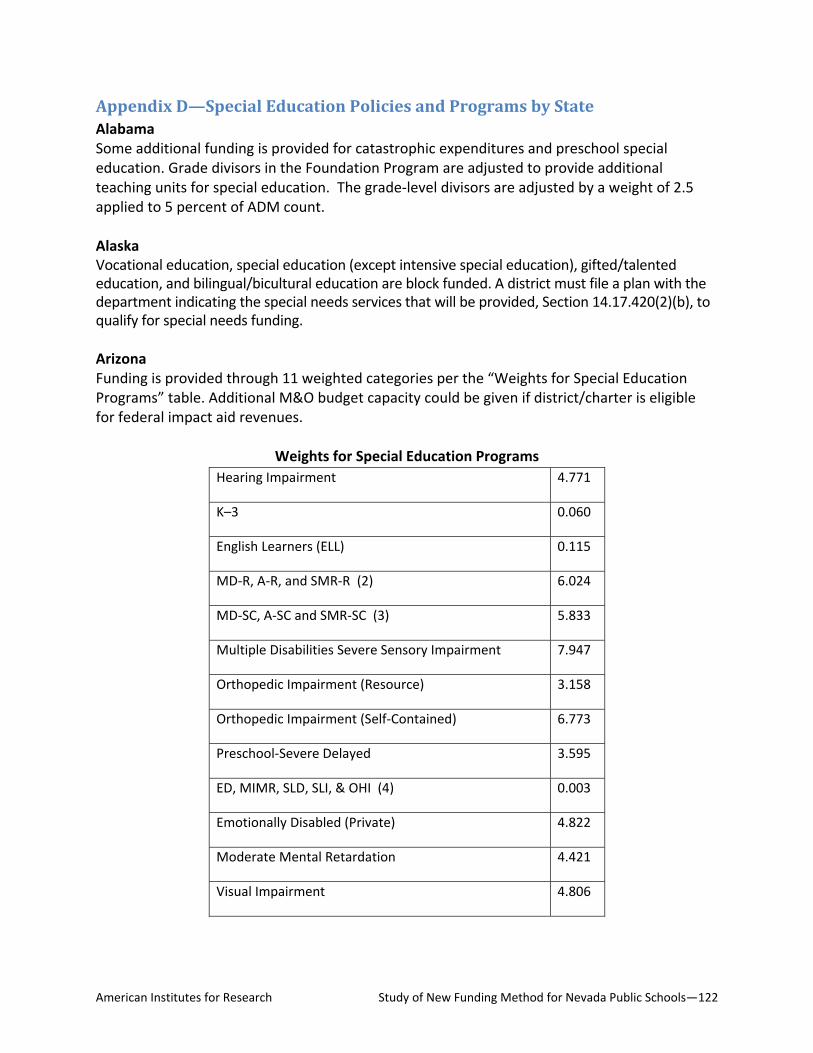
American Institutes for Research Study of New Funding Method for Nevada Public Schools—122
AppendixD—SpecialEducationPoliciesandProgramsbyStateAlabama Some additional funding is provided for catastrophic expenditures and preschool special education. Grade divisors in the Foundation Program are adjusted to provide additional teaching units for special education. The grade‐level divisors are adjusted by a weight of 2.5 applied to 5 percent of ADM count. Alaska Vocational education, special education (except intensive special education), gifted/talented education, and bilingual/bicultural education are block funded. A district must file a plan with the department indicating the special needs services that will be provided, Section 14.17.420(2)(b), to qualify for special needs funding. Arizona Funding is provided through 11 weighted categories per the “Weights for Special Education Programs” table. Additional M&O budget capacity could be given if district/charter is eligible for federal impact aid revenues.
Weights for Special Education Programs
Hearing Impairment 4.771
K–3 0.060
English Learners (ELL) 0.115
MD‐R, A‐R, and SMR‐R (2) 6.024
MD‐SC, A‐SC and SMR‐SC (3) 5.833
Multiple Disabilities Severe Sensory Impairment 7.947
Orthopedic Impairment (Resource) 3.158
Orthopedic Impairment (Self‐Contained) 6.773
Preschool‐Severe Delayed 3.595
ED, MIMR, SLD, SLI, & OHI (4) 0.003
Emotionally Disabled (Private) 4.822
Moderate Mental Retardation 4.421
Visual Impairment 4.806

American Institutes for Research Study of New Funding Method for Nevada Public Schools—123
Arkansas In 2004, the Arkansas General Assembly reformulated public school funding at the direction of the Arkansas Supreme Court to devise a funding system to assure school “adequacy.” Although Arkansas Special Education funding based on weighted averages had been abolished in the mid‐1990s, this approach was actually reconsidered during the discussions of school funding adequacy for special populations, including students with disabilities, ELLs, students in Alternative Learning Environments, and high‐poverty students. Ultimately, the funding adequacy needs of these special populations were addressed through categorical funding systems providing state aid in addition to that provided through the basic Foundation Formula. For special education, the General Assembly increased the funding levels of existing state line‐item appropriations to reimburse districts for specific types of excess costs associated with providing services. These include annual targeted Catastrophic Occurrences aid for individual high‐cost/high‐need students, reimbursement for residentially placed students, and reimbursement for students with disabilities receiving extended school year services. California California provides $3.1 billion in state funding for special education programs for individuals with exceptional needs. The special education funding model apportions state aid to local educational agencies (LEAs based on their ADA; the per‐ADA funding rates are recomputed annually). The funding model is based on the assumption that, over reasonably large geographic areas, the incidence of disabilities is relatively uniformly distributed. The model also provides funding adjustments to compensate for those areas in which there are concentrations of special education students with high‐cost, low‐incidence disabilities. Funding for special education may be apportioned directly to an LEA or to the administrative unit of the special education local plan area (SELPA) with which it is affiliated. Entitlements are calculated by multiplying the SELPA’s base funding rate by the prior‐year funded K–12 ADA for each school district, county office of education, and charter school in the SELPA). Funding is adjusted for changes in ADA. Colorado Special Education (Article 20 of Title 22, CRS) The State Exceptional Children's Act (ECEA) outlines administrative unit (school districts and boards of cooperative educational services) responsibilities for providing special education programs for children with disabilities. The Act recognizes the need to provide educational opportunities to all children and the benefits of providing a continuum of services in the least restrictive environment. In budget year 2010–11, Colorado administrative units will serve approximately 83,000 students with disabilities, or about 10 percent of the total pupil enrollment. Administrative units will provide services to children between the ages of 3 and 21 who, by reason of one or more of the following conditions, are unable to receive reasonable benefit from general education: long‐term physical impairment or illness, significant limited intellectual capacity,

American Institutes for Research Study of New Funding Method for Nevada Public Schools—124
significant identifiable emotional disorder, specific learning disability, or speech or language impairment. State ECEA funding of special education programs for children with disabilities is $127.4 million for budget year 2010–11.
Five hundred thousand dollars is available to administrative units specifically for costs incurred for children with disabilities who live in eligible facilities within their boundaries, and for whom (a) parental rights have been relinquished by the parents; (b) parental rights have been terminated by the court; (c) parents are incarcerated; (d) parents cannot be located; (e) parents reside out of state, but the Department of Human Services has placed the children within the boundaries of the administrative unit; or (f) the children are legally emancipated.
Four million dollars will be available for grants to administrative units for reimbursement of high costs incurred in providing special education services in the preceding school year. High costs are defined as the costs incurred by an administrative unit above a threshold amount.
The remaining amount will be distributed as follows:
Administrative units will receive $1,250 for each child reported by the administrative unit on December 1 of the previous year.
Administrative units will receive up to an additional $6,000 for each child reported on its previous December 1 count with the following disabilities: vision disability, hearing disability, deaf‐blind, significant identifiable emotional disability, autism, traumatic brain injury, multiple disabilities, and significant limited intellectual capacity. This amount will be prorated based on the amount of the remaining appropriation.
State ECEA moneys can be used to pay for the salaries of special education instructional and support personnel, purchased services (including tuition payments to other administrative units and eligible facilities), supplies, and equipment.
In budget year 2010–11, the total special education costs will equal roughly $825 million. State funding covers roughly 15.4 percent of special education costs; federal funding covers an additional 28.3 percent of these costs; and local sources of funding cover the remaining 56.3 percent of the costs. Connecticut
Since 1995–96, the state’s primary contribution to general special education is through the
Education Cost Sharing (ECS) formula described under Description of Formula. The ECS
foundation reflects the cost of regular education and general education. In addition, the
students used in the ECS grant determination include both regular education and special
education.

American Institutes for Research Study of New Funding Method for Nevada Public Schools—125
The state also supports extraordinary special education costs through its Excess Costs grant,
which funds 100 percent of student‐based special education costs in excess of established
thresholds. For children affected by state agencies, for example, foster students and judicial
placements, the state pays in excess of the district’s prior year average cost per student
(including regular and special education). For all other special education placements, the state
pays 100 percent of the costs in excess of 4.5 times the prior year’s average cost per student
(including regular and special education). These grants may be proportionately reduced to stay
within the legislatively approved appropriation.
Delaware
Funding is provided through instructional units. Units for 12 categories are provided, ranging in
size from 4 pupils per unit to 15 pupils per unit.
The state is phasing in a needs‐based funding system for special education students. Funding is
based on three categories: basic, intensive, and complex, with unit sizes of 8.4, 6.0, and 2.6.
Florida
In Florida, services for Exceptional Student Education (ESE) students (students identified as
gifted and students identified as disabled) are funded through the FEFP. Exceptional education
services for most students are funded through the ESE Guaranteed Allocation. For those ESE
students requiring the most intensive services, funding is weighted by cost factors in
accordance with level of need. Please see Section 1011.62 (1)(e), F.S., for an outline of the
funding model for ESE programs. Approximately 88 percent of the total expenditures for
students with disabilities are funded through state and local programs.
Since July 1, 2000, approximately 95 percent of ESE students have generated base funding at
the same level as nondisabled students. These students are reported under basic programs 111
(Grades PK–3 basic with ESE services), 112 (Grades 4–8 basic with ESE services), or 113 (Grades
9–12 basic with ESE services). These programs have the same cost factors as basic programs
101, 102, and 103. A portion of funding for students in these programs is generated by
multiplying the base student allocation by the program cost factor. For 2010–11, the base
student allocation is $3,623.76. The approximate base weighted funding amounts generated by
students in basic programs for 2010–11 are as follows:

American Institutes for Research Study of New Funding Method for Nevada Public Schools—126
To fund exceptional education and related services (including therapies) for these students, an
Exceptional Student Education Guaranteed Allocation was established by the Legislature in
addition to the basic funding. The guaranteed allocation is a fixed amount provided each
district. For the current school year (2010–11), the ESE Guaranteed Allocation appropriation is
$980,571,070.
For the remaining 5 percent of students with disabilities (those with the most intense needs),
funding is determined using a matrix of services. Consistent with the services identified on the
individual educational program (IEP), matrices are completed by checking all the services that
will be provided to the student. Students with the two highest matrix ratings (254 and 255)
generate base weighted funding as follows:
Support Level 4 (254) $12,766.51 ($3,623.76 x 3.523)
Support Level 5 (255) $17,883.26 ($3,623.76 x 4.935)
The ESE matrix of services consists of five support levels and five domains: curriculum and
learning environment, social/emotional behavior, independent functioning, health care, and
communication. See “Use of the Exceptional Student Education Matrix of Services” at
http://fldoe.org/ese/pdf/matrixnu.pdf/.
Grades PK–3 Basic $3,946.27 ($3,623.76 x 1.089)
Grades 4–8 Basic $3,623.76 ($3,623.76 x 1.000)
Grades 9–12 Basic $3,736.10 ($3,623.76 x 1.031)

American Institutes for Research Study of New Funding Method for Nevada Public Schools—127
Georgia
Funding is provided through foundation program for six weighted categories for special
education. The weights range from 2.3960 to 5.8253, depending on the type of disability and
service and program provided to the pupil.
Special Education Category Weight
Category I 2.3960
Category II 2.8189
Category III 3.5193
Category IV 5.8253
Category V 2.4597
Hawaii
State funding for special education increased dramatically between fiscal year (FY) 2000 and FY
2008, primarily because of a federal court decree. Hawaii’s public school system also receives
federal funding for special education as part of the Individuals with Disabilities Education
Improvement Act (IDEIA) of 2004.
State funding within the statewide school district is weighted per student, based on a
comprehensive special education database. This database tracks every special education
student, school‐by‐school, with information from each student’s IEP. The relative intensity of
specially designed instruction for each student is then weighted according to the following
categories, identifying the number of hours per week of special instruction or supports needed:
Intermittent support
Targeted support
Sustained support
Intensive support
The information is compiled in the special education database, and state resources are
allocated school‐by‐school based on the weighted calculations. The functionality of this

American Institutes for Research Study of New Funding Method for Nevada Public Schools—128
database has been looked upon by other school districts as a state‐of‐the‐art implementation
of technology to track special education needs and weighted resource allocation, particularly
for the size of the Hawaii statewide public school district, which ranks as one of the top 10
largest school districts in the nation.
Idaho
The foundation program provided salaries and benefits (employer obligations for retirement
and FICA) of ancillary personnel (special education teachers, psychologists, psychological
examiners, therapists, and social workers) through an instructional staff allowance ratio of 0.1
per support unit.
Pupil Weights for Special Education Programs
The state formula shifts 6 percent of K–6 ADA and 5.5 percent of 7–12 ADA to exceptional child
ADA, which generally provides school districts and charter schools with additional support units.
Computation of Exceptional Education Support Units
Average Daily
Attendance
Attendance Divisor Minimum Units Allowed
14 or more 14.5 1 or more as computed
12–13.99 – 1
8–11.99 – .75
4–7.99 – .5
1–3.99 – .25
Illinois
There are six state grants for funding special education. These are as follows:

American Institutes for Research Study of New Funding Method for Nevada Public Schools—129
Funding for Children Requiring Special Education Services—85 percent of funding based on
district ADA and 15 percent based on low‐income counts reported in General State Aid.
Special Education—Personnel Reimbursement: Grants are calculated at $9,000 per full‐time
professional certified worker and $3,500 per full‐time noncertified worker.
Special Education—Private Tuition: Prior year costs are reimbursed based on the difference
between $4,500 and a district’s per‐capita tuition costs per pupil in excess of $4,500 plus a
second per‐capita tuition charge.
Special Education—Summer School: Provides grants based on multiple formulas to assure
educational services through the summer.
Special Education—Transportation: Described above under Transportation.
Special Education—Orphanage: Reimburses districts for the cost of special education services
to children residing in state‐owned facilities and with foster families. Any costs not covered by
the current year appropriation must be covered by future years’ appropriations.
Indiana
Does not apply.
Iowa
Three levels of additional pupil FTE weighting, 0.72, 1.21, or 2.74, are available for students
with IEPs. Which additional weighting applies to the student is determined by the level of
services required on the IEP for special education instructional staff or supplemental aids and
other services in the areas of required curriculum modification, specially designed instruction,
amount of school personnel support and least restrictive environment (LRE) efforts, and
amount of supplementary aid or assistance necessary, including assistive technology,
instructional associates, or specialized transportation.
Kansas
State provides 80 percent of special education transportation costs: $25,850 ($26,500 in 2007–
08) estimated in categorical aid per instructional unit is also provided. That amount is paid on

American Institutes for Research Study of New Funding Method for Nevada Public Schools—130
all certificated education teachers while paraprofessionals are paid .4 or $10,340 (10,600 in
2007–08) per full‐time paraprofessional.
Kentucky
Special Education is funded through an Exceptional Child Add‐on to Kentucky’s base funding
mechanism. The base funding formula is determined based on the district’s average daily
attendance multiplied by a guaranteed amount per child established by the Kentucky General
Assembly in the State’s biennial budget. The Exceptional Child Add‐on also uses this guaranteed
amount per child. Kentucky’s formula assigns one of three weights to each of the disability
categories. Students with a Speech Language disability only have a weight of 0.24; disability
categories of Orthopedically Impaired, Other Health Impaired, Specific Learning Disability,
Developmentally Delayed and Mild Mental Disability have a weight of 1.17; and disability
categories of Hearing Impaired, Visually Impaired, Emotional Behavior Disability, Deaf Blind,
Multiple Disabilities, Autism, Traumatic Brain Injury, and Functional Mental Disability have a
weight of 2.35. The total count of students for each of these weight categories are summed and
that categories total of children ages 5 through 20 is multiplied by its weight as noted above.
The product of each category’s assigned weight multiplied by its child count is then multiplied
by the guaranteed base amount in the biennial budget. When these three products are
combined, that is the amount of the district’s Exceptional Child Add‐on funds.
Louisiana
Add‐on weights—based on student characteristics recognizing the extra cost of instruction for
certain categories of students or classes.
Special Education Students
Other Exceptionalities (150 percent)
Gifted and Talented (60 percent)

American Institutes for Research Study of New Funding Method for Nevada Public Schools—131
Maine
The state subsidizes 100 percent of approved Essential Programs and Services special education
costs for all nonminimum subsidy‐receiving school districts.
Maryland
A funding level per special education student is calculated by taking 74 percent of the per‐pupil
amount established in the Foundation Program. The FY 2011 funding level is $264 million.
Nonpublic placement is a program by which the state shares in the cost of placing students with
disabilities in nonpublic special education schools when no program is available for them in the
public schools. The state pays 70 percent of the cost of students placed over 300 percent of the
excess cost of Special Education students.
Massachusetts
The Chapter 70 foundation budget includes an assumed special education percentage of
enrollment and the corresponding costs are factored into the aid calculations. A separate
“circuit breaker” program reimburses districts for 40 percent of special education instructional
costs in excess of four times the prior year’s state average foundation budget—$38,636 in FY
2011.
Pupil Weights for Special Education Programs
In‐district: The foundation budget includes an assumed full‐time equivalent (FTE) special
education enrollment of 3.75 percent of total nonvocational enrollment, 4.75 percent of
vocational enrollment. For each assumed FTE, the special education in‐district foundation
budget rate is $23,098.
Out‐of‐district: The foundation budget includes an assumed full‐time equivalent special
education enrollment of 1 percent of total nonvocational enrollment. For each assumed FTE,
the special education out‐of‐district foundation budget rate is $24,128.

American Institutes for Research Study of New Funding Method for Nevada Public Schools—132
Michigan
A long‐standing Michigan court case (known as Durant) regarding special education cost
reimbursement was settled in 1997. It requires that the state reimburses special education
instructional costs at a rate of 28.6138 percent and special education transportation costs at a
rate of 70.4165 percent. The foundation payments (described earlier) for special education
pupils go toward meeting this obligation.
Minnesota
Special education aid through FY 2007 was based on expenditures in the second prior year
(base year). State special education aid for FY 2007 was based on expenditures in FY 2005.
Beginning in FY 2008, special education aid is based on expenditures in the current year. State
special education aid for FY 2008 is based on expenditures in FY 2008.
Several additional changes to the special education formulas took place in FY 2008. Transition
Disabled Aid, which equaled $8.8 million in FY 2007, was rolled into special education aid in FY
2008. Transition programs for students with disabilities provides for transitional career and
technical (vocational) experiences/programs that provide career exploration, healthy work
attitudes, specific career and academic knowledge, and job skills for students with disabilities.
Transition programs for students with disabilities serves students who meet state disability
eligibility criteria and who have IEPs that include work‐based learning and require extra
interventions not provided in regular work‐based learning programs.
Lastly, FY 2008 is the first year that districts receive Bus Depreciation Aid for busses purchased
after 7/1/05 and used for the majority of the time providing special transportation services.
The special education Initial Aid equals the sum of the following amounts computed using base
year data:
Salary—68 percent of the salary of each essential staff providing direct instructional and related
services to students (special education, transition disabled, and alternative delivery of
specialized instructional services programs)
Contracted Services—52 percent of the amount of a contract for instruction and services that
are supplemental to a district’s education program for students with disabilities. Fifty‐two
percent of the difference between the amount of the contract and the general education

American Institutes for Research Study of New Funding Method for Nevada Public Schools—133
revenue of the district for that pupil for the fraction of the school day the student receives
services that are provided in place of services of the district’s program (both special education,
transition disabled, and alternative delivery of specialized instructional services programs). For
transition disabled programs only, 52 percent of the cost of vocational evaluation.
Supplies and Equipment
Special education and alternative delivery of specialized instructional services programs—47
percent of the cost of supplies and equipment not to exceed an average of $47 per student
with a disability.
Transition disabled programs—47 percent of the cost of supplies not to exceed an average of
$47 per student with a disability. Forty‐seven percent of the cost of equipment.
Travel—For transition disabled programs only, 47 percent of the costs of necessary travel
between instructional sites by transition program teachers.
Bus Depreciation—100 percent of the cost of regular busses over 8 years and type III busses
over 5 years that are used the majority of time providing special transportation services.
Transportation—100 percent of the cost of special transportation services.
A school district’s special education aid equals its initial special education aid computed as per
the formula above times the ratio of the state total special education aid to the state total
initial special education aid plus aid adjustments for serving nonresident special education
students.
The state total special education revenue for FY 2008 through FY 2011 is set in state law. For FY
2008, FY 2009, FY 2010, and FY 2011, it is $694.1 million, $719.5 million, $735.7 million, and
$787.6 million, respectively. The state total special education aid for FY 2012 and later fiscal
years, the state total special education aid equals:
The state total special education aid for the preceding fiscal year, times
The program growth factor, times
The greater of one, or the ratio of the state total Average Daily Membership (ADM) for the
current fiscal year to the state total ADM for the preceding fiscal year.

American Institutes for Research Study of New Funding Method for Nevada Public Schools—134
The program growth factor is 1.046 for FY 2012 and later fiscal years.
The link to Minnesota’s special education formula is:
https://www.revisor.leg.state.mn.us/statutes/?id=125A.76
Special Education Excess Cost Aid:
For FY 2008 and later years, a district excess cost aid equals 75 percent of the difference
between the district's unreimbursed special education cost and 4.36 percent of the district's
general education revenue.
The state total excess cost aid equals $110.6 million in FY 2008, and $110.9 million in FY 2009,
$110.8 in FY 2010 and $110.9 in FY 2011. For FY 2012 and later years, the state total excess cost
aid equals:
The state total special education excess cost aid for the preceding fiscal year times
The program growth factor times
The greater of one, or the ratio of the state total ADM for the current fiscal year to the state
total ADM for the preceding fiscal year.
The program growth factor is 1.02 for FY 2012 and later years.
A school district’s special education excess cost aid equals its initial special education excess cost aid computed as per the formula above times the ratio of the state total special education excess cost aid to the state total initial special education excess cost aid. The link to Minnesota’s special education excess cost formula is as follows: https://www.revisor.leg.state.mn.us/statutes/?id=125A.79 Mississippi Funding is based on agency approval of the teacher units and certification and experience of the approved teacher. Five separate offices in the department have a role in the application in program approval criteria and allocation of special education teacher units.

American Institutes for Research Study of New Funding Method for Nevada Public Schools—135
Missouri State Special Education aid is now included in the Basic State Aid to districts. When a district's count of students with an IEP exceeds the state threshold, currently at 13.7 percent of the district's ADA, the excess is weighted at .75 and added to the district's ADA calculation in the overall weighted average daily attendance. Montana Included in the BASE aid program (see Description of Formula). Block grants are based on number of pupil units and require a $1 for $3 local match. Additional reimbursement (40 percent for unusually high special education costs are provided to eligible districts). Nebraska Special Receipts Allowance includes district specific special education, state ward, and accelerated or differentiated curriculum program receipts from the most recently available complete data year. Nevada Allocations of special education funding vary widely among school district based primarily on needs and applications. Funding support is set in terms of number of regular and discretionary units, with each unit valued at $39,768 for 2011. Students per unit range from a low of 47.6 in Pershing County School District to a high of 155.4 students per unit in Clark County School District. New Hampshire See Description of the Formula. Also, Catastrophic Aid for high‐cost students. The state pays 100 percent of cost above 10 times the state average current expenditure per pupil, and 80 percent of the cost between 3.5 and 10 percent the state average. New Jersey Through the new funding formula, the state has adopted a census‐based method of funding for special education. This approach bases the aid allocation on each district’s total enrollment. Using this method, special education needs are projected by multiplying the excess cost of educating special education students by the statewide average classification rate, which is then multiplied by the district’s total enrollment. Two thirds of this cost is included in the district’s adequacy budget, where it is funded through equalization aid. One third of this cost is provided as categorical aid to the district (regardless of district wealth). This ensures that all districts receive some amount of special education aid. In determining the actual “excess” cost for special education, the Department used audited expenditure data from fiscal year 2006. The term “excess cost” refers to the costs in addition to the base cost for education for all pupils. In addition to allocating the costs for special education expenditure lines, a portion of the general education budget was also attributed to special education to account for the special education costs for students that are mainstreamed for at least some portion of the day. This adjustment was based on the percentage of time special

American Institutes for Research Study of New Funding Method for Nevada Public Schools—136
education students spent in regular classrooms according to the data collected from districts pursuant to federal reporting requirements. New Mexico State aid is provided through five weighted categories included in the foundation program. Pupil Weights for Special Education Programs
Special education students are funded under the basic program units with additional weightings
as follows:
Categories Weight
Class A Programs: specially trained
teacher
travels from class to class or school to
school to assist teachers, students and
gifted on a part‐time basis.*
.7
Class B Programs: specially trained
teacher
operates a resource room and assists
gifted.*
.7
Class C Programs: special classroom
instruction for moderately handicapped
and gifted.
1.0
Class D Programs: full‐time special
classroom instruction for severely
handicapped students and aged 3‐
and 4‐year‐old handicapped.
2.0
* Weighted classroom units.

American Institutes for Research Study of New Funding Method for Nevada Public Schools—137
Special education also is funded for related services ancillary to providing special education, the
number of full‐time‐equivalent certified or licensed ancillary service and diagnostic service
personnel multiplied by the cost differential factor 25.0.
New York
Foundation Aid is paid for general education and special education students with students with
disabilities receiving additional weightings as specified in the following table.
Pupil Weights for Foundation Aid
Category Weight
Pupils with handicapped conditions in special class 60% or more or the school
day in either public school or BOCES Program.
1.41
Pupils with handicapping conditions in special class 20% or more of the school
week or receiving consultant teacher services a minimum of 2 hours per week.
1.41
Students moving from a restricted placement into a general education setting. .50
A High‐Cost Excess Cost formula provides wealth‐equalized aid, in addition to Foundation Aid,
for students in very high‐cost programs in districts or BOCES. A Private Excess Cost formula
provides equalized reimbursement for tuition expenses above a basic contribution for public
students placed in state‐operated or private schools for students with disabilities.
North Carolina
State‐allocated aid for handicapped students on the lesser of April first headcount or 12.5
percent of total ADM.

American Institutes for Research Study of New Funding Method for Nevada Public Schools—138
North Dakota
Special education funding is provided through a factor in the main funding formula based on
the total number of students in average daily membership. There also are factors for preschool
students on IEPs and extended‐year special education programs. These factors generate
approximately 70 percent of the special education funding provided by the state. The
remainder of the funding is set aside at the state level to reimburse school districts with
extremely high‐cost special education students. Where students are placed by external
agencies for purposes other than education, districts are reimbursed for allowable costs
exceeding the state average cost per pupil. Educational placements are reimbursed for
allowable costs exceeding four times the state average cost per pupil. Transportation and
equipment are not included in allowable costs.
Ohio
Special education: included in the EBM using a weighted student count based on disability
category.
Oklahoma
The State Aid formula currently has 12 Weighted Pupil Categories related to Special Education.
Pupil Weights for Special Education Programs
Categories Weight
Vision Impaired 3.80
Learning Disabilities 0.40
Hearing Impaired 2.90
Mentally Retarded: (Educable Mentally Handicapped
and Trainable Mentally Handicapped)
1.30
Emotionally disturbed 2.50

American Institutes for Research Study of New Funding Method for Nevada Public Schools—139
Multiple handicapped 2.40
Physically handicapped 1.20
Speech Impaired 0.05
Deaf and Blind 3.80
Special Education summer program 1.20
Autism 2.40
Traumatic Brain Injury 2.40
Oregon
Two types of funding are provided in addition to the general education funding for special
education students. An additional weight of 1.0 is identified for special education students and
the “High‐Cost Disability Grant” for disabled students whose annual IEP costs exceed $30,000.
Please see the High‐Cost Disability Grant description earlier.
Pennsylvania
Special Education Funding for School Districts
Each school district receives the amount it received for the 2008–09 school year.
Contingency Fund
A special education contingency fund allocation equal to 1 percent of the special education
appropriation is available to school districts.
CORE Services Funding to Intermediate Units
An amount equal to 5 percent of the special education appropriation is provided to
intermediate units to maintain core services.

American Institutes for Research Study of New Funding Method for Nevada Public Schools—140
Institutionalized Children’s Program
Funding is provided to intermediate units to maintain the Institutionalized Children's Program.
Rhode Island
Does not apply.
South Carolina
Handicapped children are weighted according to the following specific classifications contained in
the foundation program.
Pupil Weights for Special Education Programs
Categories Weights
Educable mentally handicapped 1.74
Learning disabilities 1.74
Trainable mentally handicapped 2.04
Emotionally handicapped 2.04
Orthopedically handicapped 2.04
Visually handicapped 2.57
Hearing handicapped 2.57
Speech handicapped 1.90
Homebound pupils 2.10
Autism 2.57

American Institutes for Research Study of New Funding Method for Nevada Public Schools—141
South Dakota
Special education aid calculation is similar to the general education aid formula in that the
student counts utilized within the funding formula are based on both fall enrollment and
December child count. Based on the counts and primary student disabilities reported, a
district’s total “need” or total state‐local funding is determined. The state‐local share of these
district need is based on the local property valuation. The local share is calculated using a tax
levy of $1.20/$1,000 of assessed valuation (AV). A district is authorized by SD statute to utilize a
maximum levy of $1.40/$1,000 AV for their special education fund. Funding for special
education may be limited when levying less than $1.20/1000 AV or if the district is determined
to have an ending fund balance that exceeds a statutorily defined limit.
South Dakota districts can also apply to an extraordinary cost fund for additional funding for
special education students with costly needs. Applications are reviewed by committee and may
not necessarily be approved. In recent years, the fund has distributed approximately $4.5
million in additional aid to districts based on need.
Tennessee
Supported by a 75 percent state share, identified and served special education students receive
additional weighting in the Classroom Component of the BEP formula. The weights were based
on the caseload allocations as follows:
Option 1 91
Option 2 73
Option 3 46
Option 4 25
Option 5 15
Option 6 2
Option 7 10
Option 8 6
Option 9 0
Option 10 10

American Institutes for Research Study of New Funding Method for Nevada Public Schools—142
Texas
For the portion of the day students are served in approved programs, the adjusted allotment is
multiplied by a weight varying from 1.7 to 5.0, depending on the instructional arrangement
used. Additional funding equal to the adjusted basic allotment multiplied by 1.1 is also provided
for students who are served in a mainstream instructional arrangement. A special education
student who resides in a care and treatment facility and who receives his or her instruction on a
local school district campus in a district other than the district in which the student’s parent or
guardian resides is eligible for a funding weight of 4.0, if the student does not reside in a state
supported living center. If a similarly situated special education student resides in a state
supported living center, the student is eligible for a funding weight of 2.8.
Pupil Weights for Special Education Programs
Category Weight
Homebound 5.0
Hospital class 3.0
Speech therapy 5.0
Resource room 3.0
Self‐contained, mild and moderate, regular campus 3.0
Self‐contained, severe, regular campus 3.0
Off home campus 2.7
Non‐public day school 1.7
Vocational adjustment class 2.3
(Above categories based on FTEs)
Mainstream students (Based on ADA) 1.1
Utah
A foundation program provides weighted categories for children with disabilities.

American Institutes for Research Study of New Funding Method for Nevada Public Schools—143
Purpose: To provide educational services for students with disabilities as required by federal
and state law. Example: Special Ed personnel, texts, supplies. Formula: Per WPU, which is the
greater of the average of Special Education (Self‐Contained and Resource) ADM over the
previous five years (which establishes the “foundation” below, which the current year WPU can
never fall) or prior year Special Education ADM plus weighted growth in Special Education ADM.
Weighted growth is determined by multiplying Special Education ADM from two years prior by
the percentage difference between Special Education ADM two years prior and Special
Education ADM for the year prior to that, subject to two constraints: the Special Education
ADM values used in calculating the difference cannot exceed the “prevalence” limit of 12.18
percent of total district ADM for their respective years; and if this measure of growth in Special
Education exceeds current year growth in Fall Enrollment, growth in Special Education is set
equal to growth in Fall Enrollment. Finally, growth is multiplied by a factor of 1.53. This weight
is intended to account for the additional cost of educating a special education student; it is not,
however, based specifically on an empirical analysis of the cost of special education relative to
“regular” education in Utah. Law: 53A‐15‐301, 302, 303, 303.5, 304, 305, 53A‐17a‐111; R277‐
750. Contact: Sandra Cox. Data: Membership audit report (September 1); Fall Enrollment audit
report (November 1). Below is a description of the Special Education Add On, Extended Year for
the Severely Disabled, Preschool, Self‐Contained, and State Programs in Utah.
SPECIAL EDUCATION—EXTENDED YEAR FOR SEVERELY DISABLED
To provide a longer school year for those students with disabilities whose regression over
school breaks is so severe that an inordinate amount of time is necessary to recoup previous
learning. Formula: Per WPU, this is derived from aggregate hours of extended year educational
service. Law: 53A‐17a‐112; R277‐750, 751. Contact: Karl Wilson. Data: Special survey
administered by Sandra Cox (September 1; revised survey for summer 2004 due October 15).
SPECIAL EDUCATION—PRESCHOOL
To provide preschool educational services for children with disabilities from ages 3 through 5 as
required by federal law. Formula: Per WPU, this equals special education preschool enrollment
(aged 3 through 5, excluding 5‐year‐old special education students enrolled in kindergarten) as
of December 1 multiplied by 1.46. Overall state growth in this program cannot exceed 8
percent annually, so funds remaining after the allocation have equaled the growth limit are

American Institutes for Research Study of New Funding Method for Nevada Public Schools—144
prorated among districts experiencing growth in excess of eight percent. Law: 53A‐17a‐112;
R277‐750. Contact: Sandra Cox. Data: Clearinghouse file (December 15)—S2 record.
SPECIAL EDUCATION—SELF‐CONTAINED
To compensate for the higher cost of providing more extensive educational services to students
who are in a self‐contained setting (enrolled in special education for 180 minutes or more each
day). Unlike resource students, self‐contained students do not generate a “regular” WPU.
Formula: Per WPU, this equals Self‐Contained ADM from two years prior. Law: 53A‐17a‐111;
R277‐750. Contact: Sandra Cox . Data: Membership audit report (September 1).
SPECIAL EDUCATION—STATE PROGRAMS
To support districts and charter schools in serving special education students whose extensive
needs cost the district more than $15,000 per student. Formula: 100 percent through RFP
process. If the total amount approved exceeds the appropriation, grants are prorated.
Distribution: One lump sum upon approval by State Director of Special Education. Law: 53A‐
17a‐112; R277‐750.
Pupil Weights for Special Education Programs
Students with disabilities are funded with a base plus growth dollar amount averaging ADM
over the prior five years. Below is a description of the Special Education Add On, Extended Year
for the Severely Disabled, Preschool, Self‐Contained, and State Programs in Utah.

American Institutes for Research Study of New Funding Method for Nevada Public Schools—145
Vermont
On average, 60 percent of the costs of special education are reimbursed for each district. There
are several pieces to the system. Basically it operates like insurance, districts submit detailed
expenditure reports (claims) indicating how much was spent on special education each year.
Approved student costs above $50,000 are reimbursed at 90 percent. Most other allowed
special education costs are reimbursed at a rate that varies each year between 56 and 58
percent.
Virginia
Funding for special education provides for the state share of salary costs of instructional
positions generated based on staffing standards for special education. (The Virginia legislature
identifies 14 categories of disability, each with a maximum allowable student to teacher ratio.
The number of students in each division who fall into each of the 14 categories determines the
number of teachers for which the state will share the funding costs.) Each special education
student is counted in her respective school and up to three disabilities per student may be
recognized for calculating instructional positions for funding. Once the number of funded
teachers is determined, it is multiplied by the state‐specified salary to determine the total
salary cost, which is funded on a per‐pupil basis. The additional per‐pupil special education
funds are shared between the state and local school divisions according to a school division’s
Composite Index of local ability to pay.
Washington
The special education formula provides funding for students ages 0–5 at 115 percent of the
basic education amount per student. Funding is provided for students age K–21 at 93.09
percent of the basic education funding amount. A district will receive funding based upon
reported number of age K–21 special education students up to a maximum level of 12.7
percent of the reported basic education population. In addition a safety net process is in place
to award additional funding for districts with students costing above 2.3 of the state average
prior year APPE.

American Institutes for Research Study of New Funding Method for Nevada Public Schools—146
West Virginia
An allowance is provided for advanced placement at 1.0 percent of the state average per pupil
state aid times the number of students enrolled in advanced placement, dual credit, and
international baccalaureate programs.
Although not a part of the Public School Support Program, a provision is included in WVC §18‐
20‐5 that requires the State to make an appropriation to the Department of Education to be
distributed to the county boards in accordance with State Board Policy to support children with
high acuity needs that exceed the capacity of the school district to provide with available funds.
Each county board is required to apply to the State Superintendent for receipt of this funding in
a manner set forth by the State Superintendent that assesses and takes into account varying
acuity levels of the exceptional students.
Wisconsin
Special education is funded by a combination of state, local, and federal monies. State
categorical aids assist with the costs of providing special education and related services. This
includes reimbursement for teachers and teacher aides, physical and occupational therapists,
speech/language therapists, special education directors, school psychologists, social workers,
school nurses, school counselors, and special transportation. Staff must hold appropriate
licensure to be eligible for reimbursement.
School districts, cooperative educational service agencies, county children with disabilities
education boards, and 2r charter schools that operate programs for children with disabilities
are reimbursed for special education costs in the year after costs are incurred. Funds are
appropriated through the state budget process. Recipient agencies must complete the Special
Education Fiscal Report program, PI‐1505‐SE.
There are 11 major areas of state aid to school districts, CCDEBs, and CESAs that provide
programs for Special Education children:
Early childhood
Other health impaired or orthopedically impaired

American Institutes for Research Study of New Funding Method for Nevada Public Schools—147
Cognitively disabled
Hearing impairment
Visual disability
Speech and language disability
Emotional disturbance
Learning disability
School age parents
Homebound instruction
Cross categorical
Wyoming
The state reimburses 100 percent of a school district’s approved special education costs.

American Institutes for Research Study of New Funding Method for Nevada Public Schools—148
AppendixE—Low‐Income/At‐RiskPoliciesandProgramsbyState
Alabama Funding for at‐risk students are calculated based on the number of free and reduced‐price applications and the number of students scoring at lower levels of required tests. Funds are also provided for additional education services for high school students failing portions of the high school graduation exam. Alaska Does not apply. Arizona Does not apply. Arkansas Does not apply. California Economic Impact Aid (EIA) is a state categorical program that provides supplemental funds, kindergarten through Grade 12, to support the following: (1) additional programs and services for English learners (ELs) and (2) compensatory education services for educationally disadvantaged students. Funding is allocated based on a district per pupil rate times the sum of: 1 Prior year English Learner count, 2 Current year Title I Formula child count, and 3 Weighted Concentration Factor. Colorado The following is the list of programs under Colorado Revised Statutes, which are classified as Compensatory Education. The Revised Statutes are available at: http://www2.michie.com/colorado/lpext.dll?f=templates&fn=fs‐main.htm&2.0 Art. 20. Education of Exceptional Children, 22‐20‐101 to 22‐20‐117. Art. 23. Education of Migrant Children, 22‐23‐101 to 22‐23‐107. Art. 24. English Language Proficiency Act, 22‐24‐101 to 22‐24‐106. Art. 25. Colorado Comprehensive Health Education Act, 22‐25‐101 to 22‐25‐ 110. Art. 26. Gifted and Talented Students, 22‐26‐101 to 22‐26‐108. Art. 27.5. Before‐ and After‐School Dropout Prevention Programs, 22‐27.5‐101 to 22‐27.5‐106. Art. 28. Colorado Preschool Program Act, 22‐28‐101 to 22‐28‐113. Art. 29. Character Education, 22‐29‐101 to 22‐29‐106.
Connecticut Does not apply.

American Institutes for Research Study of New Funding Method for Nevada Public Schools—149
Delaware Academic Excellence instruction units are provided on the basis of one unit per 250 pupils enrolled and funds are also provided for extra time for students at risk of not meeting state standard in core content areas. Florida There is no comparable program existing at this time. Georgia A weight of 1.3136 is provided for students in remedial education programs; a weight of 1.5938 is provided for students in alternative education programs. Hawaii More than 50 percent of Hawaii public school students require more educational resources,
including at least 31 percent economically disadvantaged; 3 percent with English language
difficulties; 5 percent special education; and 13 percent with multiple special needs.
Within the Hawaii statewide school district, the weighted student formula allocates state
funding to schools for economically disadvantaged students, based on the federal free and
reduced‐price lunch classifications, that are similarly used for federal Title I grants. The
economically disadvantaged weight is 0.10 per student at this time.
Idaho
Does not apply.
Illinois
Grants for low‐income students have been a part of the GSA formula since FY 1999. Grants are
based on a district’s concentration ratio of low‐income students. This ratio is the three‐year
average of students in the district who received services through Medicaid or Food Stamps
divided by the Average Daily Attendance of the most recent school year. In FY 2011, the district
concentration ratio (DCR) is calculated as the average number of students receiving Medicaid or
Food Stamps in FYs 2007, 2008, and 2009 divided by the 2009–10 ADA.
Districts with a DCR < 15 percent receive a flat grant of $355 per pupil.

American Institutes for Research Study of New Funding Method for Nevada Public Schools—150
Districts with a DCR > 15 percent receive per pupil grants based on the following curvilinear
formula: [2,700 X (DCR) 2 + 294.25] X 3 year average.
Indiana
Does not apply.
Iowa
Formula supplementary weighting is provided for at‐risk programs and alternative schools and
is determined partially on the percentage of pupils enrolled in Grades 1–6 eligible for free and
reduced‐price meals in a school district and partially on the budget enrollment of the school
district. In addition, spending authorization for returning dropout and dropout prevention
programs is funded on the basis of 25 percent or more from the combined district cost of the
school district and up to 75 percent through modified allowable growth approved by the School
Budget Review Committee. Modified allowable growth is an increase in budget authority,
requested by the district, and is funded with balance on hand or a local property tax levy.
Kansas
Funding for At‐Risk Students
Additional funding is provided for at‐risk students. \The formula is based on the number of
students qualifying for free meals with the additional weight set at 0.456 for 2011. In addition,
additional funds are available for high‐density, medium density, and nonproficient at‐risk
students. High Density Weighting: Districts in which their students on free meals exceed 50
percent of their total enrollment, or a density of 212.1 student per square mile and a free lunch
percentage of at least 35.1 percent and above also use the 0.10 factor per at‐risk student.
Medium Density: Districts with enrollments of at least 40 percent but less than 50 percent use a
factor of 0.06 for each at‐risk student. A small amount is also given to schools based on the
students not on free meals who are nonproficient on state assessment tests. Students not
eligible for free meals but who score below proficient in reading or mathematics on the state
assessments are weighted 0.0465.

American Institutes for Research Study of New Funding Method for Nevada Public Schools—151
Kentucky
Discontinued for all practical purposes in 1990.
Louisiana
Does not apply. We do have additional funding for At‐Risk Students:
Add‐on weights—based on student characteristics recognizing the extra cost of instruction for
certain categories of students or classes.
At‐Risk Students (22 percent): Students who have limited English proficiency who are not
contained in the at‐risk weight based on the free and reduced‐price lunch criteria are added to
the At‐Risk
At‐Risk Students are those students receiving free and reduced‐price lunch.
Maine
The state provides additional subsidies for all children eligible for free or reduced‐price lunches
in each LEA based on a 1.15 pupil weighting.
Maryland
A funding level per student who is eligible for free and reduced‐price meals (FRPM) is
calculated by taking 97 percent of the per‐pupil amount established in the Foundation
Program. The FY 2011 funding level is approximately $1 billion.
Massachusetts
Each low‐income pupil generates an extra increment of $2,561 to $3,167 in foundation budget
dollars.

American Institutes for Research Study of New Funding Method for Nevada Public Schools—152
Michigan
In 2011, the Michigan legislature appropriated approximately $309 million for compensatory
education (At‐Risk). The Formula is 11.5 percent of the district’s per‐pupil foundation allowance
times the number of free school meals claimed by the district. The appropriation is capped at
$309 million.
Minnesota
Compensatory education revenue is included in the general education revenue program.
Funding is based on building‐level concentration of students eligible for free and reduced‐
priced lunches as of October 1 of the previous fiscal year. Students eligible for reduced‐price
lunches are weighted at 0.5 and students eligible for free lunches are weighted at 1.0. If the
adjusted free and reduced‐price lunch count is at least 80 percent of the building’s enrollment,
the compensatory revenue equals $2,825 times the adjusted free and reduced‐price lunch
count. The rate per adjusted count decreases proportionately as the concentration of eligible
students decreases (e.g., one half of this amount for a school with an adjusted eligible count
equal to 40 percent of building enrollment).
Pupil Weights for Compensatory Education
Definition of
Category Weight
Free and Reduced‐
Price Lunch
Variable weighting 0.0 to 0.6, depending on concentration of free and
reduced‐price lunch–eligible pupils in the building. Applies only to
compensatory revenue calculation
Mississippi
MAEP has an at‐risk component that is based on 5 percent of the Base Student Cost times the
number of free lunch participants on October 31 of the previous year.

American Institutes for Research Study of New Funding Method for Nevada Public Schools—153
Missouri
State aid for students at‐risk of completing their K–12 education is included in the Basic State Aid
to districts. When a district's count of students eligible for free or reduced‐price lunch exceeds
the state threshold, currently at 32 percent of the district's ADA, the excess is weighted at .25
and added to the district's ADA calculation in the overall weighted average daily attendance.
Montana
Does not apply.
Nebraska
Poverty Allowance is calculated by taking the lesser of the maximum poverty allowance
designated by the district or by the calculated amount based on the number of low‐income
students (progressive percentages between .05 and .30 multiplied by students qualified for free
lunches/milk or low‐income children under 19 years of age living in a household having an
annual adjusted gross income equal to or less than the maximum household income that would
allow a student from a family of four people to be a free lunch or free milk student, whichever
is greater).
Nevada
Does not apply.
New Hampshire
No response provided.
New Jersey
The following three categories of aid are based on measures of district and student wealth. For
aid purposes, low‐income (“at‐risk”) counts are based on the number of students eligible for
the federal free and reduced‐priced lunch programs.

American Institutes for Research Study of New Funding Method for Nevada Public Schools—154
At‐Risk Equalization Aid
Aid for low‐income students is primarily provided through equalization aid. As noted earlier,
low‐income students generate an additional weight (ranging from 0.47 to 0.57) when
determining the adequacy budget. In districts with a low‐income concentration lower than 20
percent, each at‐risk student receives a weight of 0.47. This weight gradually increases as the
at‐risk concentration increases to a maximum weight of 0.57 for districts with an at‐risk
concentration greater than or equal to 60 percent.
At‐Risk Security Aid
As described in the ”Security Aid” section earlier, each at‐risk student generates an additional
categorical allocation for a district, where the per‐pupil amount received increases with the
district’s at‐risk concentration. In FY 2011, the maximum security aid per pupil was $412 per at‐
risk student in a district with an at‐risk concentration of at least 40 percent.
Preschool
The SFRA includes full state funding for all at‐risk 3‐ and 4‐year‐olds to attend full‐day preschool
programs in every district. In districts with the DFG designations “A” or “B” or those in “CD”
districts that also have an at‐risk concentration of at least 40 percent, funding is intended for all
resident 3‐ and 4‐year‐olds, regardless of income.[1] In all other districts, funding is intended for
all at‐risk resident 3‐ and 4‐year‐olds.
Because of recent budgetary constraints, the state’s plan to expand the preschool program as
defined in the SFRA was not realized in FY 2011. Although some amount of Preschool
Education Aid (PEA) was provided to each district that received early childhood aid under the
previous funding law, the SFRA calculation was only applied to about 20 percent of those
receiving aid. Other districts’ aid allocations were based on prior year aid allocations, with
some adjustments.
[1] District Factor Groups (DFGs) are based on a socioeconomic index of each school district’s community characteristics. The index is grouped into the following eight categories, listed from lowest to highest: A, B, CD, DE, FG, GH, I, J). For more information about the DFGs and the factors that are used to calculate the index, please go to the following website: http://www.state.nj.us/education/finance/sf/dfg.shtml

American Institutes for Research Study of New Funding Method for Nevada Public Schools—155
New Mexico
Does not apply.
New York
See pupil need index in Description of Formula.
North Carolina
North Carolina has two categories of funding specifically for remediation and students at risk of
failing. These categories are as follows:
At‐risk Student Services/Alternative Schools—This funding allocates one School Safety Officer
per High School and the remaining funds are allocated 50 percent based on ADM and 50
percent based on poverty with a minimum of two teachers and two instructional support
positions.
Disadvantaged Student Supplemental Funding
Distribute resources based on a prescribed delivery option … reduction of class size.
Step 1: Use the average statewide (K–12) teacher‐to‐student classroom teacher allotment for
the Fundable Disadvantaged Population, which is 1:21.
Step 2: The targeted allotment ratios for the Fundable Disadvantaged Population are as follows:
If low wealth percent (per low wealth supplemental funding formula) is > or equal to 90
percent, one teacher per 20.5 students:
If low wealth % is > 80% but < 90%, one teacher per 20 students
If low wealth % is < 80%, one teacher per 19.5 students
If an LEA received DSSF funds in FY 2005–06, one teacher per 16 students. These 16 LEAs will
not receive less funding than they received in FY 2005–06.

American Institutes for Research Study of New Funding Method for Nevada Public Schools—156
Step 3: Convert the teaching positions to dollars by using the state average teacher salary
(including benefits).
North Dakota
Does not apply.
Ohio
An index is applied to several components to adjust the district amount based on demographic
characteristics of resident population.
Oklahoma
Pupils who qualify and participate in a free and reduced‐price lunch program: 0.25.
Oregon
Oregon funds students in Pregnant and Parenting Programs at a weight of 1.0, students in
poverty at .25, neglected and delinquent students at .25, and students in foster care at .25 in
addition to the students’ general education ADM.
Pennsylvania
There is a Poverty Supplement in the Basic Education Funding formula. It is described earlier.
Rhode Island
Does not apply.

American Institutes for Research Study of New Funding Method for Nevada Public Schools—157
South Carolina
State appropriated $136,163,204 for 2010–11.
Pupil Weights for Compensatory Education
Definition of Category Weight
Grades 1–12 pupils who fail to meet statewide
standards in reading, writing, and mathematics or who
do not meet first‐grade readiness test standards
0.26 Compensatory
0.114 Remediation
South Dakota
Does not apply.
Tennessee
Funding is generated in the Classroom Component of the BEP with a state share of 75%. Based
on 1:15 class size reduction for Grades K–12, estimated at $509.46 per identified at‐risk ADM.
Funded at 100 percent at‐risk.
Texas
Funding is provided for 20 percent of the adjusted allotment per pupil eligible to receive free or
reduced‐price lunches under the National School Lunch Program (NSLP). A funding weight of
2.41 is applied to each full‐time equivalent student who is pregnant and is receiving
compensatory education services. School districts and charter schools that do not participate in
the NSLP may participate in an alternative reporting program to deliver compensatory
education funding for income eligible students.

American Institutes for Research Study of New Funding Method for Nevada Public Schools—158
Pupil Weights for Compensatory Education
Definition of Category Weight
Pupils who qualify and participate in a free
or reduced‐price lunch program (per ADA)
0.25
Pupils who are pregnant (per FTE) 2.41
Utah
Does not apply.
Vermont
Part of the student count weighting system provides an additional 25 percent for students from
families receiving food stamps. Also, certain costs for students who need support services but
are not eligible for special education are covered by the special education reimbursement
system.
Pupil Weights for Compensatory Education
Students aged 6–17 from families receiving food stamps are given an additional weight of 25
percent.
Students for whom English is not the pupil’s primary language are given an additional 20
percent weight.
Virginia
At‐Risk Program
State payments for at‐risk students are disbursed to school divisions based on the estimated
number of federal free lunch participants in each division to support programs for students who
are educationally at‐risk. Funding is provided as a percentage add‐on to Basic Aid to support the

American Institutes for Research Study of New Funding Method for Nevada Public Schools—159
additional costs of educating at‐risk students. A local match based on the district’s Composite
Index of local ability to pay is required.
Washington
A learning assistance program is available to students identified as deficient in basic skills.
Allocations are based on the number of students in Grades K–12 qualifying for free and
reduced‐price lunch (FRPL). Districts with a percentage over 40 percent FRPL or over 20 percent
qualifying for English language services receive an additional amount based upon their
percentage over 40 percent. The funding rate is $282.13 per FRPL student.
West Virginia
No specific funds are provided for compensatory education.
Wisconsin
Does not apply.
Wyoming
Compensatory Education now falls under other programs such as extended day, tutorial system for
Saturday school, and a Summer School program, which are grant programs outside of the block grant.

American Institutes for Research Study of New Funding Method for Nevada Public Schools—160
AppendixF—WeightsforLow‐Income/At‐RiskStudentsbyState
Table F.1. States Using a Form of Pupil Weighting for Low‐Income Education/At Risk Students
State Eligible Weight
Alabama F&RL + low test scores
California Per Pupil Rate (ELL + #Title I + Weighted Concentration Factor)
Georgia Students in remedial education programs 1.3136 Students in alternative education programs 1.5938
Hawaii F&RL 0.10 per pupil
Indiana F&RL 0.4974 Adjusted
Iowa F&RL grades 1‐6 + Budget Enrollment ≥25% Combined District Cost + <75% Modified Allowable Growth
Kansas Free Meals 0.456
High Density = Free Meals >50% ENR or 0.10
212.1 stdt/sq miles & FL≥35.1%
Med Density = Free Meals 40–50% 0.06
Low test scores ≠ Free Meals 0.0465
Kentucky FL 0.15
Louisiana F&RL 0.22
Maine F&RL 1.15
Maryland F&RM 0.97
Massachusetts Per low‐income pupil $2,561 to $3,167
Michigan Free Meals 0.115
Minnesota F&RL Variable weighting 0.0–0.6, depending on concentration of F&RL‐eligible pupils in the building. Applies only to compensatory revenue calculation
Mississippi FL 0.05
Missouri F&RL > 32% 0.25
Nebraska Low Income (0.05–0.30*F&RL/Milk) or Poverty Allowance <19 years w/household income ≤F&RL Family of Four Average

American Institutes for Research Study of New Funding Method for Nevada Public Schools—161
New Hampshire F&RL <12% $431 (wgt 0.13) F&RL 12%–23.99% $863 (wgt 0.25) F&RL 24%–35.99% $1725 (wgt 0.5) F&RL 36%–47.99% $2588 (wgt 0.75) F&RL ≥48% $3450 (wgt 1.0)
New Jersey F&RL <20%–≥60% + Wealth 0.47–0.57
North Carolina Students at risk of failing & disadvantaged ‐‐‐Low Wealth >80% & <90% ‐‐Low Wealth <80% ‐‐DSSF(=2005–06)
1 Teacher/20 pupils
1 Teacher/19.5 pupils
1 Teacher/16 pupils
Oklahoma Those who qualify and participate in F&RL
0.25
Oregon Students in Pregnant & Parenting Programs 1.0 Students in poverty 0.25 Neglected and delinquent students 0.25 Students in foster care 0.25
South Carolina Grades 1–12 pupils who fail to meet statewide standards in reading, writing, and mathematics or who do not meet first‐grade readiness standards
0.26 Compensatory
0.114 Remediation
readiness test standards
Texas F&RL 0.20 Pupils who are pregnant (per FTE) 2.41
Vermont Students aged 6–17 from families receiving food stamps
0.25
Washington F&RL >40% $282.13/ pupil
Note: F&RL = federal free and reduced‐price lunch; F&RM= free and reduced‐price meals;
DSSF= disadvantaged student supplemental funding.

American Institutes for Research Study of New Funding Method for Nevada Public Schools—162
AppendixG—EnglishLearnerPoliciesandProgramsbyState Alabama State allocations for ESL students are provided according to the ESL student count in the prior year. Alaska Bilingual/bicultural education is block funded in the foundation program. Arizona Weight included in basic state aid calculations to provide additional funds. In FY 2011, the weight is 0.115. Arkansas 6‐20‐2305 School funding: (3)(A) Beginning with the 2007–08 school year, funding for students who are identified as English‐language learners shall be $293 for each identified English‐language learner. (B) Funding for English‐language learners shall be distributed to school districts for students who have been identified as not proficient in the English language based upon a state‐approved English proficiency assessment instrument. California California does not provide funding specifically for bilingual education but does provide more than $50 million for instructional support and coordination of services for students enrolled in Grades 4–8 and identified as English learners. In addition, districts may use compensatory education funding (see earlier to address needs of English learners). Colorado
See “Compensatory Education.”
Connecticut
Each district is entitled to receive a portion of the total amount appropriated according to the
ratio of the number of eligible pupils in the district as compared with the total number of
eligible pupils in the state. Grant eligibility is limited to districts with schools containing 20 or
more students with the same dominant language other than English. Those English language
learners who are eligible under the Bilingual grant are included in the Education Cost Sharing
(ECS) formula described under Description of Formula.

American Institutes for Research Study of New Funding Method for Nevada Public Schools—163
Delaware
LEP no longer funded as separate program; now collapsed into State Fiscal Stabilization Funds.
Florida
English for Speakers of Other Languages (ESOL) programs are funded with a program weight of
1.147.
Georgia The formula includes a weight of 2.5337 for students in the ESOL program. Hawaii Within the Hawaii statewide school district, state funding for the English Language Learners (ELL) program is included as part of the weighted student formula, and is allocated to schools that have those populations of students, based on a weight of 0.2373 per ELL student at this time. Idaho The state distributed $5.29 million based on the number of Limited‐English Proficient (LEP) students (approximately $290 per student) and $750 thousand in grants to school districts whose LEP students failed to meet adequate yearly progress in mathematics or reading. Illinois The Bilingual Education grant program reimburses current year costs for programs that provide five or more class periods of bilingual / English as a Second Language instruction per week. Grants are determined by the size of the student population, amount and intensity of instruction, and the availability of appropriated funds. Indiana Does not apply. Iowa Students identified as limited English proficient are assigned an additional pupil FTE weighting of .22. The supplementary weighting may be assigned for up to four years. A school district may apply to the School Budget Review Committee for an adjustment to budget authority for the cost to continue providing the program beyond the four years of weighting. Kansas State aid is weighted at 0.395 per eligible pupil, based on the full‐time equivalency enrollment of bilingual students receiving services.

American Institutes for Research Study of New Funding Method for Nevada Public Schools—164
Kentucky Bilingual Education no longer applies. The new laws under No Child Left Behind Act of 2001 are as follows: Title III: Language Instruction for Limited English Proficient (LEP and Immigrant Students) Students with limited English proficiency come with diverse histories, traditions, and varied educational experiences. The term limited English proficient used in the state is defined in Title IX of the No Child Left Behind Act under the General Provisions Part A, Section 9101. Definition. The term immigrant children and youth is defined as specified in Part C, General Provisions, Section 3301.
Louisiana Any local school system employing a Foreign Language Associate shall receive a supplemental allocation from BESE of $20,000 per teacher not to exceed a total of 300 teachers in the program. During FY 2010–11, there are 260 foreign language associate teachers within the 69 school districts. First‐year Foreign Association Teachers receive an installation incentive of an additional $6,000; second‐ and third‐year teachers receive a retention incentive of an additional $4,000. Maine The state provides additional subsidies for all ESL children base on weightings 1.525–1.70, depending upon the number of eligible children in each LEA. Maryland A funding level per LEP student is calculated by taking 99 percent of the per pupil amount
established in the Foundation Program. The FY 2011 funding level is $151 million.
Massachusetts Each limited‐English pupil generates an extra increment of between $590 and $2,153 in foundation budget dollars. Michigan The current year state appropriation for Bilingual Education is $2.8 million. The funds are paid out on a per‐pupil basis and are to be used solely for the instruction of pupils with limited English‐speaking ability. Eligible programs include instruction in speaking, reading, writing, and the comprehension of English. Minnesota Revenue for limited English proficiency (LEP) programs is included in the general education revenue program. Students who have generated five or more ADM in Minnesota public schools before the start of the current school year are not eligible to be counted for LEP revenue calculations. Students in Grades 4–12 who were enrolled in a Minnesota public school when the

American Institutes for Research Study of New Funding Method for Nevada Public Schools—165
Test of Emerging Academic English (TEAE) was administered during the prior year are not eligible unless they scored below the state cutoff score on the TEAE. For districts with at least one but fewer than 20 eligible LEP students, funding is based on 20 students. Basic LEP revenue equals $700 times the eligible LEP average daily membership served. Districts where the concentration of LEP students is 11.5 percent or greater receive an additional $250 per eligible LEP student. In districts where the concentration is lower, the concentration allowance is reduced proportionately (e.g., $125 in a district with a 5.75 percent concentration). Mississippi Does not apply.
Missouri Effective in 2006–07, state money is now included in the Basic State Aid to districts. When a district’s count of Limited English Proficient students exceeds the state threshold, currently at 0.90 percent of the district’s ADA, the excess is weighted at .60 and added to the district’s ADA calculation in the overall weighted average daily attendance. Montana The state does not fund a bilingual education program. Nebraska Limited English Proficiency (LEP)‐Allowance is calculated by taking the lesser of the maximum LEP allowance designated by the school district or a calculation based on the number of LEP students. Nevada Does not apply. New Hampshire See Description of the Formula. New Jersey Aid for LEP students is provided through equalization aid. Students that are enrolled in qualifying programs are given an additional weight when determining the adequacy budget. For a student who is LEP, but not low income, the weight is 0.5 (in addition to the base cost and grade‐level weights). For a student who is both LEP and low income, the weight is 0.125 (reduced to account for duplicative resources provided through the at‐risk weight). New Mexico Full‐time equivalent pupils weighted .5 in state aid formula.

American Institutes for Research Study of New Funding Method for Nevada Public Schools—166
New York See pupil need index in Description of Formula. In addition, there is a separate Bilingual Education grant of $12.5 million. North Carolina The state funds a supplemental allotment for Limited English Proficient Students. Eligible LEAs/charter schools must have at least 20 students with limited English proficiency (based on a three‐year weighted average headcount), or at least 2.5 percent of the ADM of the LEA/charter school. Funding is provided for up to 10.6 percent of ADM. FORMULA: Calculate 3‐Year Average Headcount
Most current years available weighted twice (50%)
Two previous years weighted once (25%) Base Allocation Each eligible LEA/charter school receives the minimum of one teacher assistant position.
50% of the funds (after calculating the base) will be distributed based on the concentration of limited English proficient students within the LEA.
50% of the funds (after calculating the base) will be distributed based on the weighted three‐year average headcount.
North Dakota Funding for students with limited English skills is provided through factors in the main funding formula. Factors are based on assessment level. Ohio Funding in the Evidence Based Model is provided for limited English proficient students based on a 100:1 student : teacher ratio, adjusted for the wealth of the district. Oklahoma Weighted in the equalizing formula at 0.25. Oregon Students served in programs for ELLs are eligible to receive weighting of .50 in addition to the students’ general education ADM. Pennsylvania There is an English language Learner Supplement in the Basic Education Funding formula. It is described earlier. Rhode Island

American Institutes for Research Study of New Funding Method for Nevada Public Schools—167
The Student Language Assistance Investment fund targets state resources to assist students who require additional language educational services. Distribution is based on a district’s proportion of limited English proficiency students. Funding under this program is approximately $31.7 million. South Carolina No state appropriation. South Dakota Does not apply. Tennessee Receives a 70 percent state share with funding generated from the Instructional Component of the BEP. ELL Teachers—1 per 30 identified and served ELL students ELL Translators—1 per 300 identified and served ELL students Texas State aid is 10 percent of the adjusted allotment per pupil enrolled in a bilingual or special language program. Utah The state distributes block grant funds to school districts and charter schools in three categories:
Interventions for Student Success Block Grant—$15,000,000
Family Literacy Centers—$1,764,000
The Interventions for Student Success Block Grant is to improve academic performance of students who do not meet performance standards as determined by Utah Performance Assessment System for Students (U‐PASS) test results. Interventions must be consistent with a district or charter plan approved by the local school board and the plan must specify intended results. For example, remedial classes, supplies, texts, personnel. Funds are distributed 71 percent proportional to the number of Basic Program WPUs; 6 percent distributed equally among all districts and charters; and 23 percent proportional to the number of ELLs. Vermont English language learning students are weighted an additional 20 percent in the pupil count formula. Virginia English as a Second Language (ESL) State SOQ funds are provided to support school divisions providing the necessary educational services to children not having English as their primary language. The funding supports the salary and benefits cost of instructional positions at a standard of 17 positions per 1,000 ESL

American Institutes for Research Study of New Funding Method for Nevada Public Schools—168
students. This cost is shared between the state and local school divisions according to a division’s Composite Index of local ability to pay and contributes toward the required local effort. Washington A transitional bilingual program provides funds to school districts to implement bilingual education programs. Allocations are based upon the headcount of pupils served in the program. The funding rate for the 2001–11 school year is $885.91 per pupil. West Virginia The PSSP includes a provision that provides supplemental funding for programs for limited English proficient students where the cost of the program in a particular district exceeds the district’s capacity to provide the program with the funds that the district has available. The statute does not require any specific amount of funding to be appropriated, but any funds so appropriated in any year must be distributed to the various districts in a manner that takes into account the varying proficiency levels of the students and the capacity of the district to deliver the needed programs. Districts are required to apply for the funds that are available in accordance with the provisions contained in State Board policy. Wisconsin Bilingual/Bicultural Education Aid is funded as a categorical aid; brief information is contained in the Categorical Aid chart. Wyoming The funding model provides a 1.0 teacher FTE position for every 100 ELL students.

American Institutes for Research Study of New Funding Method for Nevada Public Schools—169
AppendixH—WeightsforEnglishLanguageLearners(ELL)StudentsbyState
Table H.1. States Using a Form of Pupil Weighting for English Language Learner
State Eligible Weight
Alabama Based on prior year ESL allocations
Alaska Bilingual/bicultural education Block funded
Arizona Weight included in basic state aid calculations 0.115
Arkansas State aid appropriated for identified ELLs $293 per pupil
California Funding provided for instructional support and coordination of services for students enrolled in Grades 4–8 identified as English learners
Total $50,000,000
Connecticut Eligible pupils in district / eligible pupils in state. Limited to districts with schools containing 20 or more students with same dominant language other than English
Florida English for Speakers of Other Languages program 1.147
Georgia Students in ESOL program 2.5337
Hawaii Funding per ELL student 0.2373
Idaho $5.29 million statewide for Limited‐English Proficient students $290 per pupil Grants to districts whose LEP students failed to meet adequate yearly progress in mathematics or reading.
$750,000
Illinois ELL/Bilingual Students Reimbursable
Indiana Complexity Index includes LEP factor N/A
Iowa Additional pupil FTE weight for LEP students 0.22
Kansas Additional funding for full‐time bilingual students 0.395 per pupil
Kentucky Limited English Proficient 0.96
Louisiana BESE supplemental allocation per Foreign Language Associate teacher, not to exceed 300 teachers in the program
$20,000 per teacher
Maine Additional subsidies for all ESL children, based upon number of eligible children in each LEA
1.525‐1.70
Maryland Funding level per LEP student 99% of per pupil amount established in the Foundation Program
Massachusetts Extra increment of foundation budget dollars for limited‐English pupils
$590–$2,153 per pupil
Michigan Funds are distributed on a per LEP student Total $2,800,000

American Institutes for Research Study of New Funding Method for Nevada Public Schools—170
Minnesota LEP $700 per pupil LEP > 11.5% Additional $250 per
pupil LEP <11.5% Pro rata reduction
(earlier) For districts with less than 20 LEP, funding is based on 20 students
Missouri If a district's ELL > state threshold 0.60
Nebraska Adjustment for limited English proficiency students N/A
New Hampshire Students with a ELL $675 per pupil
New Jersey LEP students LEP & low‐income students
0.5 0.125
New Mexico Full‐time equivalent pupils 0.50
New York Bilingual Education Grant See Need Index for ELL
1.25 million
North Carolina Eligible LEAs/charter schools must have > 20 students with limited English proficiency or > 2.5% of the ADM of the LEA/charter school. Funding provided for < 10.6% of ADM.
North Dakota LEP students wgt N/A
Oklahoma Weighted in the equalizing formula 0.25
Oregon Students served in programs for ELL 0.50
Rhode Island Distribution is based on a district’s proportion of limited English Proficiency students
Total $31,700,000
Tennessee Funding is generated in the Instructional Component of the Basic Education Program
Texas Pupils enrolled in Bilingual or Special Language Program 0.10
Utah ELL & Bilingual students
Vermont English Learning students 0.20
Washington Bilingual education program funds are based on the headcount of pupils served
$885.91 per pupil
West Virginia LEP students LEP & low‐income students
Grant varies
Wisconsin
Bilingual/Bicultural Education Aid is funded as categorical aid

American Institutes for Research Study of New Funding Method for Nevada Public Schools—171
AppendixI—Density/SparsityofSmallSchoolsbyState Alabama Does not apply. Alaska The formula is weighted in favor of the small, isolated sites. Arizona Districts with fewer than 600 average daily memberships (ADM) are considered small and receive special weightings. If they are also isolated, they receive additional weightings. In addition, if they have fewer than a 100 student count, they are eligible to budget for a small schools adjustment. This small schools adjustment is paid directly from the local tax payer through the primary property tax. Arkansas 6‐20‐601 Qualifications for receiving isolated funding: (a) As used in this section, “isolated
school district” means a school district that meets any four of the following five criteria:
(1) There is a distance of 12 miles or more by hard‐surfaced highway from the high school of
the district to the nearest adjacent high school in an adjoining district; (2) The density ratio of
transported students is less than 3 students per square mile of area; (3) The total area of the
district is 95 sq. mi. or greater; (4) Less than 50% of bus route miles is on hard‐surfaced roads;
and (5) There are geographic barriers such as lakes, rivers, and mountain ranges which would
impede travel to schools that otherwise would be appropriate for consolidation, cooperative
programs, and shared services. (b) An isolated school district shall be eligible to receive isolated
funding if: (1) The district’s budget is prepared by the local district with Department of
Education approval; (2) The district has an ADM of less than 350; and (3) The district meets the
minimum standards for accreditation of public schools prescribed by law and regulation. (c) Any
school district designated as an isolated school district for the 1996‐1997 fiscal year that used
geographic barriers as one (1) of the 4 criteria necessary to receive isolated funding shall be
allowed to continue to use geographic barriers as a criterion for future allocations of isolated
funding. (2) There shall be 2 categories of isolated funding: (A) Category I isolated funding shall
be provided to all school districts that qualify under this section; and (B) Category II isolated
funding shall be further provided to those school districts that qualify under this section and
have an ADM density ratio of less than 1.2 students per square mile and shall be calculated at
50% of Category I funding.
6‐20‐603 Continued support of isolated school districts: (a) Upon the effective date of
consolidation, annexation, or reorganization, the districts listed in statute… shall become

American Institutes for Research Study of New Funding Method for Nevada Public Schools—172
isolated school areas for the sole purpose of receiving isolated funding and shall have a per
student isolated funding amount as provided in legislation. (b) Each school year, state financial
aid in the form of isolated funding shall be provided to school districts containing an isolated
school area in an amount equal to the prior‐year three‐quarter ADM of the isolated school area
multiplied by the per student isolated funding amount for the isolated school areas as set forth
under column “C” of subsection (a) of this section. (c) A school district may not receive isolated
funding under this section for an isolated school area if the prior year three‐quarter ADM of the
isolated school area exceeds 350. (d) A school district receiving isolated funding for an isolated
school area shall expend the funds solely for the operation, maintenance, and support of the
isolated school area. (e) A school district or isolated school area that may qualify under other
law to receive additional state aid because its ADM is less than 350 shall not be eligible to
receive funding under this section except that a district qualifying under other law for such aid
and qualifying for funds under this section may elect to receive funds under this section in lieu
of aid under the other law. (i) (1) Except as provided under § 6‐20‐604(g), a school district
eligible to receive isolated funding under this section shall continue to receive partial funding
even if all or part of an isolated school is closed. (2) If all or part of an isolated school in a school
district is closed, the school district shall receive funding based on the prior year's three‐quarter
ADM of the isolated school or the part of the isolated school that remains open.
6‐20‐604 Additional funding: (b) A school district shall receive special needs funding if the
school district meets the requirements of subsections (c), (d) or (e) of this section, and if:
(1) The school district was consolidated or annexed or received an annexed school under § 6‐
13‐1601 et seq.; (2) The local board of directors by majority vote determines that the isolated
school is so isolated that to combine its operation to 1 district campus would be impractical or
unwise; and (3) The isolated school or district: (A) Filed an affidavit of isolated school status
with the state board during the consolidation or annexation process and the facts of the
affidavit are verified by the state board or its designee, to meet the requirements of § 6‐20‐601;
(B) Filed an affidavit of isolated school status with the state board after the consolidation or
annexation process or August 12, 2005, and the facts of the affidavit are verified by the state
board or its designee to meet the requirements of § 6‐20‐601; or (C) Filed an affidavit of
isolated school status with the state board after the consolidation or annexation process or
August 12, 2005, and the facts of the affidavit are verified by the state board or its designee to
meet the requirements of § 6‐20‐601 but for the ADM requirements 350 students or fewer.
(f) A school district shall receive an amount equal to 5% of the foundation funding received by
the school district under § 6‐20‐2305(a)(2) based on the three‐quarter ADM of the school
district if the school district has a: (1) Three‐quarter ADM of less than 500 students; and
(2) Density ratio of 2 students or less per square mile. (g) A school district eligible for special
needs funding under this section shall continue to be eligible to receive isolated school funding

American Institutes for Research Study of New Funding Method for Nevada Public Schools—173
provided under § 6‐20‐603 but shall only receive funding under one (1) of the categories
established under subsections (c)‐(f) of this section. (h) (1) This section is contingent on the
appropriation and availability of funding for its purposes. (2) (A) Undistributed funds under this
section and § 6‐20‐603 allocated to a school district that is no longer eligible to receive the
funding shall be distributed on an equal basis per school district to each remaining school
district that is eligible to receive funds under subsections (c)‐(e) of this section. (B) Funds
distributed under subdivision (h)(2)(A) of this section shall be used by the school district only
for transportation costs of the isolated schools in the school district.
California
For small school districts, California provides an optional alternative general purpose funding
entitlement for necessary small schools. For an elementary school district that consists of a
single school with less than 97 ADA and for each qualifying necessary small elementary school
in a school district with less than 2,501 ADA, necessary small‐school amounts are computed on
the basis of either the school’s ADA or the number of full‐time teachers, whichever provides the
lesser amount. For a high school district that consists of a single school or a single high school
maintained by a unified school district with less than 287 ADA and for each qualifying necessary
small high school in a district with less than 2,501 ADA, necessary small‐school amounts are
computed on the basis of either the school’s ADA or the number of full‐time‐equivalent (FTE)
certificated employees providing services in grades nine through 12, whichever provides the
lesser amount. If the ADA is under 20 and the number of FTE certificated employees is less than
four, however, the amount is computed on the number of FTE certificated employees.
Colorado
Does not apply.
Connecticut
There are no adjustments for population density or sparsity.
Delaware
Does not apply.

American Institutes for Research Study of New Funding Method for Nevada Public Schools—174
Florida The FEFP recognizes the relatively higher operating cost of smaller districts due to sparse student population through a statutory formula in which the variable factor is a sparsity index. This index is computed by dividing the FTE of the district by the number of permanent senior high school centers (not exceeding three). By Appropriations Act proviso, participation is limited to districts of 20,000 or fewer FTE. Each eligible district’s allocation is subject to an adjustment for relative wealth of the district. This adjustment is based on the per FTE value of the maximum discretionary levy in the district relative to the state average. If the district value per FTE exceeds the state average, then the sparsity entitlement is negatively adjusted by an amount equal to the district’s FTE multiplied by the per FTE amount by which the district’s maximum discretionary value per FTE exceeds the state average. However, no district shall have a sparsity wealth adjustment that would cause the district’s total potential funds per FTE to be less than the state average. This supplement is limited to $35,754,378 statewide for the 2010–11 fiscal year. Georgia No additional funds are allotted to sparsely populated areas except as might occur in the pupil transportation. Hawaii Within the statewide school district, the weighted student formula includes a factor to adjust state funding for small schools. Enrollment thresholds are established upper bounds for elementary, middle, and high schools. An allocation based on a “sliding scale formula” is calculated for schools that have student counts that are below the enrollment thresholds. The total amount of funds needed for the sliding scale adjustment are reduced from the total WSF funds available, requiring no additional state funding, only a reallocation of existing funding. The enrollment ranges and sliding scale formula (*) are as follows:
* Where “X” is equal to a school’s enrollment.
Elementary schools 0–300 students ‐0.0010 X + 0.030
Middle schools 0–450 students ‐0.0010 X + 0.045
High schools 0–750 students ‐0.0006 X + 0.045
Grades K–8 schools 0–450 students ‐0.0010 X + 0.045
Grades K–12 schools 0–750 students ‐0.0006 X + 0.045
Grades 7–12 schools 0–750 students ‐0.0006 X + 0.045

American Institutes for Research Study of New Funding Method for Nevada Public Schools—175
Idaho
Support Unit allotments vary according to educational level and school district size. Generally,
smaller school districts and charter schools will receive more funding per ADA than larger
school districts and charter schools. School districts with fewer than 40 support units receive an
additional 0.5 FTE of instructional staff and an additional 0.5 FTE of administrative staff. School
districts with less than 20 support units receive an additional 0.5 FTE of instructional staff.
Remote and necessary schools may petition state board of education for special consideration.
Illinois Does not apply. Indiana Small schools grant applies to school corporations and does not apply to charter schools. For schools with an ADM of less than 1,700, the formula allows a $192 per ADM for complexity index over 1.2 and $91 per ADM for complexity index above 1.1 and less than 1.2. If a school corporation has an ADM of fewer than 1,700 and a complexity index greater than 1.1 and fewer than 1.2, the school receives the lesser of: 1,700 minus the 2009–10 or 2010–11 ADM or $91, multiplied by the 2009–10 (for 2010) or the 2010–11 ADM (for 2011). If a school corporation has an ADM of fewer than 1,700 and a complexity index of greater than 1.2, the school receives the lesser of: 1,700 minus the 2009–10 ADM (for 2010) or 2010–11 (for 2011) or $192 multiplied by the 2009–10 (for 2010) or the 2010–11 ADM for 2011. Iowa The state does not have a factor for density/sparsity within the formula but does have additional funding for districts that share teachers and programs. Additional pupil FTE is provided for .48 of the time that pupils attend classes in another school district, attend classes taught by a teacher jointly employed by two or more school districts, or attend classes taught by a teacher who is employed by another school district. The weighting for sharing whole grades is .1. There is also supplementary weighting of .1 provided for a school district that establishes a regional academy to which two or more other districts send high school students. The total amount or supplementary weighting provided for a regional academy cannot exceed the equivalent of 30 additional pupils and is guaranteed a minimum of 15 additional pupils. There is also supplementary weighting of .05 for providing or utilizing courses over the Iowa Communications Network (ICN), and there is supplementary weighting for resident students who attend classes in a community college—.46 for arts and science courses and .70 for career and technical courses. Kansas It is a linear transition formula ranging from 100 students up to 1,622 students. The low enrollment weight of districts having enrollments of 100 or fewer is $3,993.42 per pupil. Each

American Institutes for Research Study of New Funding Method for Nevada Public Schools—176
change of one pupil changes the low enrollment weight down or up inversely to the enrollment change. High enrollments, above 1,622, are weighted an additional 0.03504 times the BSAPP. Kentucky Does not apply. Louisiana Add‐on weights—based on student characteristics recognizing the extra cost of instruction for certain categories of students or classes. Economy of Scale up to 20 percent (for districts with fewer than 7,500 students). Maine Additional state subsidies are provided to geographically isolated districts, small administrative units, and island schools. Maryland Does not apply. Massachusetts Does not apply. Michigan For districts with a pupil count of fewer than 1,550 and 4.5 or fewer pupils per square mile, Michigan uses a three‐year‐average pupil count in the calculation of their state school aid if it benefits the district. This softens the fiscal impact that declining enrollment has on these mostly rural districts. Also, Michigan has a small amount of categorical funding for small, geographically isolated districts. Several of these are island districts not accessible by a bridge. Minnesota Districts with secondary schools having fewer than 400 pupils in Grades 7–12, or elementary schools having fewer than 140 pupils in Grades K–6, located in isolated areas receive sparsity revenue in the general education formula. The amount of revenue for secondary pupils varies as a function of the number of pupils, the distance to the nearest high school, and the attendance area. The amount of revenue for elementary pupils varies as a function of the number of pupils enrolled in schools located 19 or more miles from the nearest elementary school. Mississippi Does not apply. Missouri There is no specific adjustment for density/sparsity of small schools. However, districts are paid on the greater of the second preceding year’s Weighted Average Daily Attendance, the first preceding year's Weighted Average Daily Attendance, or an estimate of the current year’s

American Institutes for Research Study of New Funding Method for Nevada Public Schools—177
Weighted Average Daily Attendance. This provision helps districts with declining student counts as well as those with increasing student counts.
There is a small school grant for districts with an average daily attendance, including summer school, no greater than 350. The $15 million appropriation is distributed in two parts. One part of $10 million is distributed equally per average daily attendance for the eligible districts. The second part of $5 million is distributed on a tax‐rate weighted average daily attendance basis to the eligible small districts with a tax rate for general school purposes equal to or greater than the state performance levy of $3.43. Montana There is no specific mechanism for funding small schools or adjusting for sparseness. The basic entitlement is applied at the same rate to budgets for any size of district, so smaller schools receive proportionally more relevant to their size. Nebraska The only time sparsity is included in the formula is when calculating the local choice adjustment. This adjustment does not apply to sparse or very sparsely populated school districts. Nevada Guarantee is based on number of school district attendance areas in which educational services must be provided due to distances involved. This constitutes adjustment for rural and urban area characteristics. New Hampshire Does not apply. New Jersey Does not apply.
New Mexico Schools with fewer than 200 elementary and junior high school pupils, districts with fewer than 200 or 400 senior high school pupils, districts with 10,000 ADM, but fewer than 4,000 ADM per high school, and districts with fewer than 4,000 total ADM all qualify for additional aid. New York Sparsity is a factor in calculating the Pupil Need Index. Sparsity is considered a factor in school districts operating Grades K–12 with fewer than 25 pupils per square mile. This sparsity factor is not exclusive to “small schools”; enrollment does not specifically affect a district’s eligibility for such aid. Sparsity also potentially affects the Transportation Aid ratio of a school district. School districts’ enrollment from the year prior to the base year is subtracted from 21 and then that difference is divided by 317.88. The minimum is 0. This sparsity factor is added to the district’s

American Institutes for Research Study of New Funding Method for Nevada Public Schools—178
selected sharing ratio to determine the State Sharing Ratio for Transportation Aid for each school district. North Carolina A special allotment is paid for isolated school populations. North Dakota Elementary schools that serve fewer than 50 students, at least 15 percent of whom would need to travel more than 15 miles to attend another school have their weighting factor increased by 25 percent. High schools that serve fewer than 35 students, at least 15 percent of whom would need to travel more than 15 miles to attend another school, have their weighting factor increased by 25 percent. Ohio Exceptions and minimums in the evidence‐based model (EBM) component calculations for small school districts (those with fewer than 418 students). Oklahoma Density factor is accounted for in transportation supplement. School district size of 529 or less is weighted in the State Aid formula with the Small School District Weight. Oregon Students in a qualified small school receive an extra weight based on grade level, average grade
size, and distance to the nearest school. The weight is based on the size of each school, not the
size of the district. To qualify as a small elementary school, the school must have been in the
same location since 1995 and qualified as a small school in 1995 (elementary) and in 2009 (high
school). Elementary schools also must be remote – more than 8 miles from the nearest school.
If small high schools become larger than the allowable size as the result of a merger, the new,
larger school receives the combined weight for four years following the merger.
Pennsylvania There is no specific subsidy component for density/sparsity of small schools. Rhode Island Does not apply. South Carolina No state appropriation. South Dakota The small school adjustment, effective for the 2007‐08 school year, is the successor to a “small school factor” that was in place previously. The “small school factor” used a formula to add

American Institutes for Research Study of New Funding Method for Nevada Public Schools—179
additional “phantom” students to a district’s average daily membership, with the smallest districts receiving funds for up to 20 percent more students. Starting in 2007‐08, South Dakota uses a “small school adjustment” that provides an additional $847 per student for districts with enrollments of fewer than 200. Districts with enrollments between 200 and 600 receive “small school adjustment funds” based on the number of students in the system, calculated using a straight‐line formula. South Dakota also has a “sparsity” factor that provides additional funding to small, isolated school districts. Districts must meet several criteria to qualify, for example, the district must have less than 0.5 students per square mile, and have land area in excess of 400 square miles and the district’s high school must be further than 15 miles away from another public school district attendance center. The formula adds up to $123,750 per year for the state’s most isolated schools. Tennessee Does not apply. Texas The basic allotment is increased by a percent proportional to the difference between a district’s ADA and 1,600 ADA. The percent increase is greater for districts having more than 300 square miles. Districts having below 130 ADA use a minimum ADA depending on actual ADA, grades taught, and the distance to the nearest school. The state also provides a midsized school district adjustment that is applicable to school districts with between 1,600 and 5,000 ADA. Since 2009–10, this adjustment is applicable to districts that are subject to the recapture of local tax revenue. Utah Additional WPUs are provided for Necessarily Existent Small Schools—up to 7,649 Weighted Pupil Units ($19,711,473 in FY 2010–11). The additional WPUs are provided for necessary, existent, small schools below 160 ADM for elementary schools (including kindergarten at a weighting of 0.55 per ADM); or below 300 ADM for one‐ or two‐year secondary schools; or below 450 ADM for three‐year secondary schools; or below 550 ADM for four‐year secondary schools; or below 600 ADM for six‐year secondary schools. See Necessarily Existent Small Schools description and Administrative Rule R277‐445 on the Utah State Office of Education website. Vermont Categorical grants are paid to schools in school districts with average grade sizes of 20 students or smaller. The smaller the average grade size the larger the grant. This helps to lower the remaining spending per pupil and thus the district’s homestead tax rate. Virginia

American Institutes for Research Study of New Funding Method for Nevada Public Schools—180
The Appropriation Act specifies that a minimum number of instructional positions will be maintained on a divisionwide basis, regardless of the school division’s population. This includes a minimum of 51 professional instructional and aide positions, one gifted professional instructional position, and six occupational and special education professional instructional and aide positions per 1,000 students included in the ADM. Washington Additional instructional units of 7.2 are provided per 1,000 (K–3) students in the basic education formula for those districts that can demonstrate that they have hired additional teachers in these grades. West Virginia Districts are divided into the following four groups based on student net enrollment per square mile:
Sparse – Less than 5 students per sq. mile
Low – 5 to less than 10 students per sq. mile
Medium – 10 to less than 20 students per sq. mile, and
High – 20 or more students per sq. mile
These groupings are utilized in calculating the allowances for salaries and transportation in order to provide more funding for the rural districts. Wisconsin The state’s 2007–09 biennial budget enacted this categorical aid program. The statutory provision for this aid program is found in s. 115.436, Wis. Stats. Districts that have 725 or fewer members, whose membership is less than 10 members per square mile of district’s geographic area and have at least 20 percent of its membership qualify for free or reduced‐price lunch under the National School Lunch program will receive $300 per pupil. The 2010–11 appropriation for Sparsity Aid is $14.9 million.

American Institutes for Research Study of New Funding Method for Nevada Public Schools—181
Wyoming School adjustments: For all schools with 49 or fewer ADM, resource with one assistant principal position plus one FTE teacher position for every seven students for all staff; For all schools within a district comprised of less than 243 total K–12 ADM and notwithstanding all other teacher resources, resource each school with a minimum of 1.0 core teacher at every grade with reported ADM, plus 20 percent of core teachers for elementary specialist teachers and 33 percent of core teachers for middle and high school specialist teachers; Minimum of 6.0 teachers for elementary schools greater than 49 ADM; Minimum of 8.0 teachers for middle schools with greater than 49 ADM; Minimum of 10.0 teachers for high schools with greater than 49 ADM. *For K–6 school, resource as elementary school; *For a 5–8 or 6/7–9 school, resource as a middle school; *For a K–7, K‐8 or K–9 school, resource K–5 teachers as elementary school and remaining teachers as middle school, and resource all other staff resources at the highest grade prototype; *For K–12 school, resource K–5 teachers as elementary, 6–8 teachers as middle school, 9–12 as high school, and resource all other staff resources at the highest grade prototype; *For 6/7–12 school, resource 6–8 teachers as middle school and 9–12 teachers as high school, and resource all other staff resources at the highest grade prototype.

American Institutes for Research Study of New Funding Method for Nevada Public Schools—182
AppendixJ—GiftedandTalentedPoliciesandProgramsbyState Alabama Does not apply. Alaska Gifted/Talented education is block funded in the foundation program. Arizona There is no special equalization formula increase dependent upon the gifted and talented school enrollments. Arkansas 6‐20‐2208: (c) Each school district shall expend state and local revenues on gifted and talented programs in an amount equal to 0.15 of the foundation funding amount of $6,023 for fiscal year 2010–11 multiplied by 5 percent of the school district’s ADM for the previous year only on gifted and talented programs in accordance with rules promulgated by the state board. California California provides about $44 million for gifted and talented education programs. However, LEAs that receive the funds may use them for any educational purpose. Funding is based on each LEA’s proportionate share of gifted and talented education programs funding in 2008–09. Colorado See ”Compensatory Education.”
Connecticut
Does not apply.
Delaware
Program now collapsed into academic excellence units.
Florida
Please see the response for “Special Education.”

American Institutes for Research Study of New Funding Method for Nevada Public Schools—183
Georgia
A weight of 1.6686 is provided for students in programs for the gifted.
Hawaii
In past years, the Hawaii state public school system funding included a categorical program for
gifted and talented education. With the implementation of the weighted student formula
effective beginning fiscal/school year 2006–07, the categorical program for gifted and talented
education was folded into the amounts subject to weights. In past years, because of the
subjectivity of defining gifted and talented students across the state, the gifted and talented
characteristic is had not been previously weighted. However, the 2010 Committee on Weights
recommended, and the Board of Education approved, the additional of a weight for gifted and
talented (G/T students, effective SY 2011–2012). Because identification of G/T students is still
largely subjective, the Committee on Weight’s recommended that an estimate of 3 percent of a
school’s total population be used to determine the number of potentially G/T students at any
given school. This equates to a weight of 0.0265 at this time .
Idaho The ADA of gifted and talented students is included in the elementary and secondary ADA, which earns Support Units. A portion is shifted to the ADA of the Exceptional Child Program and earns Support Units. The state also distributed $500 thousand based on total enrollment and the number of identified G/T students, to be used for teacher in‐service. The state distributed an additional $500 thousand based on Grade 12 enrollment to be used to train teachers to provide advanced learning opportunities for students. Illinois Does not apply. Indiana Program encourages school corporations to develop high‐ability programs. The Gifted and Talented Education program includes allocating technical assistance funds to local schools for high‐ability students, and organizing and developing a state infrastructure of resources and communication for high‐ability programs (2007). Iowa A portion of the district cost per pupil in the foundation formula is earmarked for the gifted and talented program. Fifty‐five dollars per pupil is incorporated in the regular program cost for 2010–11 to fund 75 percent of the gifted and talented program budget. The local district must provide the remaining 25 percent of the budget, or just over $18 per pupil for 2010–11.

American Institutes for Research Study of New Funding Method for Nevada Public Schools—184
Kansas Does not apply. Paid under the special education reimbursement schedule. Kentucky Entitlement/Formula Driven/Flow‐Through Grant Award
A. Criteria for Recipient Eligibility
704 KAR 3:285 Section 9 (4) requires districts to employ properly certified personnel to administer and teach in the program, submit an annual local district gifted education year‐end report, submit a summative evaluation of the program and student progress, and to comply with all sections of 704 KAR 3:285. Grant awards are based on funding units reflecting district population at the end of the year preceding the prior year. For 2010–11, funding was reduced, resulting in a 1.4 percent cut to all districts.
B. General Purpose or Intended Use of Funds Seventy‐five (75) percent of a district’s gifted education allocation is used to employ properly certified personnel for direct services to students who are identified as processing demonstrated or potential ability to perform at an exceptionally high level in general intellectual aptitude, specific academic aptitude, creative or divergent thinking, psychosocial or leadership skills, or in visual or performing arts. Additional uses of state funds for gifted education may include consultation services, counseling services, differentiated study experiences, professional development focused on the needs and services for gifted and talented students, instructional resources to assist teachers in differentiating services, or other appropriate resource services as specified in 704 KAR 3:285, Programs for the Gifted and Talented.
C. Application Process Submission of a local district’s Comprehensive Improvement Plan with approved budget and a local district year‐end report (Infinite Campus), summative evaluation and year‐end MUNIS expenditure report are considered application for continued funding.
D. Recipient Reporting Requirements Each local district must submit an end‐of‐year summative evaluation report, quarterly MUNIS expenditure reports and update student data in Infinite Campus. Louisiana Add‐on weights—based on student characteristics recognizing the extra cost of instruction for certain categories of students or classes.

American Institutes for Research Study of New Funding Method for Nevada Public Schools—185
Gifted and Talented (60 percent) Maine The state subsidizes approved EPS gifted and talented costs.
Maryland Funding provides support to two initiatives: The Maryland Summer Centers for Gifted and Talented Students, and expenses for Maryland participants in the world‐level competition of DestiNation ImagiNation. The Maryland Summer Centers Program provides unique summer enrichment opportunities for gifted and talented students in the areas of the sciences, humanities and social sciences, the arts, engineering, mathematics, creative writing, and technology. All programs funded must adhere to accepted tenets of gifted and talented education program design, service delivery, and evaluation, and must support Achievement Matters Most goals; the National Association for Gifted Children (NAGC) Program Standards; and Maryland’s Learning Goals. The DestiNation ImagiNation grant provides for the expenses of Maryland state‐level winners who compete at the world finals level (2007). Massachusetts Does not apply. Michigan No state funds are currently appropriated in this category.
Minnesota Gifted and talented revenue is included in the general education revenue program. A district’s gifted and talented revenue equals $12 per weighted ADM. It must be used only to identify gifted and talented students, provide educational programs for gifted and talented students, or provide staff development for teachers to best meet the needs of gifted and talented students. Mississippi Teacher units are added for each approved program gifted and talented students; the funding amount is based on the certification and experience of each teacher. Missouri Expenditures for gifted education were included in the calculation of the state adequacy target. There is no targeted state aid for Gifted Education. The state adequacy target is multiplied by the district’s total weighted average daily attendance. The law was modified to include a penalty for reduction in gifted programs at the local level, effective 7‐13‐2009:

American Institutes for Research Study of New Funding Method for Nevada Public Schools—186
If a school district experiences a decrease in its gifted program enrollment of more than 20 percent from its 2005–06 gifted enrollment in any years governed by this subsection, an amount equal to the product of the percent reduction in the district’s gifted program enrollment multiplied by the funds generated by the district’s gifted program in 2005–06 school year shall be subtracted from the district’s current year payment amount. Montana Legislature provided $246,982 for a state grant distribution to school districts for Gifted and Talented programs in 2010–11. Nebraska Does not apply. Nevada Does not apply. New Hampshire Does not apply. New Jersey Resources for gifted and talented students are included in the state’s model district that is used
to calculate each district’s adequacy budget. Although there is no additional aid category, it
should be assumed that the costs for gifted and talented students are included in districts’
adequacy budgets, which are funded through equalization aid.
New Mexico See “Special Education.” New York Gifted and Talented Aid was consolidated into Flex Aid in 2005–06, and Flex Aid has subsequently been consolidated into Foundation Aid. North Carolina State allocates funding based on 4 percent of total Average Daily membership per LEA. North Dakota $800,000 is appropriated for the 2009–11 biennium for gifted and talented programs. Ohio A component of the EBM contains funding for gifted education in the following four areas: coordinators, intervention specialists, identification, and professional development.

American Institutes for Research Study of New Funding Method for Nevada Public Schools—187
Oklahoma Weighted in the equalizing formula at 0.34. Oregon Does not apply. Pennsylvania Gifted students are classified as part of exceptional students and are included in special education funding. Rhode Island Does not apply. South Carolina For 2010–11 the state appropriated $26,628,246. South Dakota Does not apply.
Tennessee Gifted and Talented students, identified and served under the special education umbrella, are offered accelerated grade levels and course content when indicated. In addition, secondary students may apply as juniors and seniors for consideration to attend the state funded Governor’s Schools held during the summer at institutions of higher education in Tennessee. Texas Gifted and talented students generate additional funding equivalent to 12 percent of the adjusted basic allotment. Eligibility for this funding is limited to a maximum of 5 percent of students in ADA. Utah A categorical appropriation is provided for gifted and talented students; for 2010–11 the amount is $1,903,454. Each school district and charter school receives its share of funds in the proportion of its number or WPUs for Grades K–12 and necessarily existent small schools. Vermont No special provisions in the funding system. Virginia State provides additional payment through the Standards of Quality (SOQ) Program for Gifted Education to support the cost of one instructional position per 1,000 students in ADM. This cost is shared between the state and local school divisions according to a division’s Composite Index

American Institutes for Research Study of New Funding Method for Nevada Public Schools—188
of local ability to pay. Because gifted and talented funding is an SOQ account, its local match contributes toward the division’s required local effort. Washington A program for highly capable students is funded in an amount equal to 2.314 percent of the school district enrollment multiplied by $400.32. West Virginia Gifted and talented students are not specifically funded through the funding formula. Wisconsin Gifted and Talented Education is funded as a categorical aid; brief information is contained in
the Categorical Aid chart.
Wyoming The funding model provides $29.19 per ADM for gifted and talented.

American Institutes for Research Study of New Funding Method for Nevada Public Schools—189
AppendixK—NationalCenterforEducationStatistics(NCES)LocaleDefinitions
Locale Definition
City
Large Territory inside an urbanized area and inside a principal city with population of 250,000 or more
Midsize Territory inside an urbanized area and inside a principal city with population less than 250,000 and greater than or equal to 100,000
Small Territory inside an urbanized area and inside a principal city with population less than 100,000
Suburb
Large Territory outside a principal city and inside an urbanized area with population of 250,000 or more
Midsize Territory outside a principal city and inside an urbanized area with population less than 250,000 and greater than or equal to 100,000
Small Territory outside a principal city and inside an urbanized area with population less than 100,000
Town
Fringe Territory inside an urban cluster that is less than or equal to 10 miles from an urbanized area
Distant Territory inside an urban cluster that is more than 10 miles and less than or equal to 35 miles from an urbanized area
Remote Territory inside an urban cluster that is more than 35 miles from an urbanized area
Rural
Fringe Census‐defined rural territory that is less than or equal to 5 miles from an urbanized area, as well as rural territory that is less than or equal to 2.5 miles from an urban cluster
Distant Census‐defined rural territory that is more than 5 miles but less than or equal to 25 miles from an urbanized area, as well as rural territory that is more than 2.5 miles but less than or equal to 10 miles from an urban cluster
Remote Census‐defined rural territory that is more than 25 miles from an urbanized area and also is more than 10 miles from an urban cluster
Source: Office of Management and Budget. (2000). Standards for defining metropolitan and micropolitan statistical areas—Notice. Federal Register, 65, no. 249.

American Institutes for Research Study of New Funding Method for Nevada Public Schools—190
AppendixL—DescriptionoftheNCESComparableWageIndex(CWI)
The CWI measure used in this study is based on an analysis updating and extending Taylor and
Fowler’s 2006 analysis of the Comparable Wage Index (CWI). The CWI measures the prevailing
wage for college graduates in 800 U.S. labor markets. The baseline estimates (for 1999) come
from a regression analysis of the individual earnings data from the 2000 U.S. Census. Taylor and
Fowler(2006) used data from the Bureau of Labor Statistics’ Occupational Employment Survey
(OES) to extend the baseline estimates of the CWI and provide annual index values for 1997
through 2005.
The 800 labor markets used to estimate the CWI are based on “place‐of‐work areas” as defined
by the Census Bureau for the 2000 Census. Census place‐of‐work areas are geographic regions
designed to contain at least 100,000 persons. The place‐of‐work areas do not cross state
boundaries and generally follow the boundaries of county groups, single counties, or Census‐
defined places (Ruggles et al., 2003). Counties in sparsely populated parts of a state are
clustered together into a single Census place‐of‐work area. Each labor market in the CWI is
either a single place‐of‐work area or a cluster of the place‐of‐work areas that comprise a
metropolitan area. Whenever possible, Taylor and Fowler (2006) aggregated place‐of‐work
areas in metropolitan areas to correspond to Core Based Statistical Areas (CBSAs). Place‐of‐
work areas that straddled more than one CBSA were treated as separate labor markets. After
the aggregation, there were 800 CBSAs or place‐of‐work areas in the 2000 Census and thus 800
labor markets for analysis.
The index predicts annual wage and salary earnings for college graduates across 800 U.S. labor
markets using a model including age, age squared, the amount of time worked, and a series of
indicator variables for gender, race, educational attainment, occupation, and industry. In
addition, the estimation includes an indicator variable for each labor market area. This analysis
uses the same definition of labor markets as in Taylor and Fowler’s original 2006 CWI and again
incorporates random effects by state.

American Institutes for Research Study of New Funding Method for Nevada Public Schools—191
AppendixM—DescriptionofBasicSupportRatio(BSR)Calculations
The following provides a summary of some of the details on how the BSR calculations are
applied. The BSR is determined using previously audited or released data on historical salaries
and expenditure costs in each district. The districts are clustered into groups based on their
enrollment and locality (arguably to group districts facing similar operating cost structures), and
a pupil‐weighted average for each group’s salary and expenditure costs is calculated.94
Rather than using district‐by‐district averages, the BSR is calculated using average
compensation levels and operating expenditures for each of the five groupings of districts from
the very small (i.e., Esmeralda and Eureka) to the very largest (Clark and Washoe) of districts in
the state. Projected weighted student enrollments, licensed teaching and administrative staff
salaries and benefits, teacher‐to‐administrative ratios are contained in DSA 1 (the Student
Enrollment and Staffing Module). The assigned number of teachers per district is contained in
the Teacher Allotment Table, which links FTE teacher allotments to enrollment size groupings
referred to as Attendance Areas. These Attendants Areas are geographic locations within which
schools are treated the same in terms of the assignment of teachers and are intended to
capture differences in the required number of teachers for various sized schools. The data from
these two modules are input into DSA 5 (the Licensed Staff Allotment and Expense Module) to
calculate the group average‐weighted teacher and administrator salaries, which are used to
determine each district’s total salary and benefits costs, based on weighted enrollments. The
transportation and operational costs from DSA 4 (Expenditure Data Module) and the classified
staff and benefits costs from DSA 1 are input through DSA 6 (the Other Operating Expense
Module) to calculate group average operational expenses, which are used to determine total
operational costs based on weighted enrollments. The total salary costs from DSA 5 and total
operational costs from DSA 6 are then plugged through DSA 7 (Basic Support Level Ratio
Module) to determine district total per pupil expenditures. The BSR is calculated by dividing
each district’s per pupil expenditures by the state average per pupil expenditures to achieve the
relative ratio.
94 Throughout our discussion of the DSA and cost adjustments, we will refer to pupil‐weighted averages, which means that each unit within the average is weighted by the number of pupils in that unit. The reason we do this is to ensure equity allocations are based on pupils as the unit of analysis. It treats or weights each pupil equally in any calculations that are made.