study of elastomeric bearings for superelevated u-beam bridges
TRANSCRIPT

Texas Tech University | Lubbock, Texas 79409P 806.742.3503 | F 806.742.4168
Study of Elastomeric Bearings for Superelevated U-Beam Bridges
Authors: Charles D. Newhouse, Scott A. Bole, W.R. Burkett, Phillip T. Nash, Mostafa El-Shami
Performed in Cooperation with the Texas Department of Transportation and the Federal Highway Administration
Research Project 0-5834Research Report 0-5834-1 http://www.techmrt.ttu.edu/reports.php
Study of Elastomeric Bearings for Superelevated U
-Beam Bridges
Report No. 0-5834-1

Notice
The United States Government and the State of Texas do not endorse products or manufacturers. Trade or manufacturers’ names appear herein solely because they are considered essential to the object of this report.

Technical Report Documentation Page
1. Report No.:
FHWA/TX -09-5834-1
2. Government Accession No.:
3. Recipient‟s Catalog No.:
4. Title and Subtitle:
Study of Elastomeric Bearings for Superelevated U-Beam Bridges
5. Report Date:
October 2009
6. Performing Organization Code:
7. Author(s):
Charles D. Newhouse, Scott A. Bole, W. R. Burkett, Phillip T. Nash,
Mostafa El-Shami
8. Performing Organization
Report No. 0-5834-1
9. Performing Organization Name and Address:
Texas Tech University
College of Engineering
10. Work Unit No. (TRAIS):
Box 41023
Lubbock, Texas 79409-1023
11. Contract or Grant No. :
Project 0-5834
12. Sponsoring Agency Name and Address
Texas Department of Transportation
Research and Technology Implementation Office
P. O. Box 5080
Austin, TX 78763-5080
13. Type of Report and Period
Cover: Technical Report
09/2007 – 08/2009
14. Sponsoring Agency Code:
15. Supplementary Notes:
Project performed in cooperation with the Texas Department of Transportation and the Federal Highway
Administration
16. Abstract:
The primary objective of this research was to determine the best way to consider the effects of transverse
superelevation on uniform-height steel-reinforced elastomeric bearing pads for U-Beam bridges. Existing TxDOT
design provisions did not specifically account for the effects of the transverse superelevation. A nationwide survey
of Departments of Transportation (DOTs) revealed that the country was nearly evenly split on whether or not
superstructure elements such as U-Beams should be placed on a transverse superelevation. Specific modifications
to the AASHTO Method “A” design of elastomeric bearing equations were developed to account for the transverse
superelevation. The proposed modifications were evaluated over typical U-Beam span/spacing combinations for
both the U-40 and U-54 sections. The ability of the proposed modifications to predict actual behavior was
evaluated by inspecting existing bridges and performing full-scale laboratory testing. Both the field inspections and
the laboratory testing validated the need for the proposed revisions. These proposed revisions have been submitted
as suggested revisions to the TxDOT LRFD Bridge Design Manual. The feasibility of electronic monitoring in-situ
bearings that have experienced significant transverse deflections was investigated. The bulging on the sides of the
bearings made monitoring unreliable. Instead, a method to manually record pertinent information during the
routine bridge inspection is recommended.
17. Key Words; superelevation, transverse, transverse
slope, u-beam, elastomeric bearing
18. Distribution Statement
No restrictions. This document is available to the
public through the National Technical Information
Service, Springfield, VA 22161, www.ntis.gov
19. Security Classif. (of this report)
Unclassified
20. Security Classif. (of this page)
Unclassified
21. No. of Pages
22. Price
Form DOT F 1700.7 (8-72)

0-5834-1 ii

iii
Study of Elastomeric Bearings for Superelevated U-Beam Bridges
by
Charles D. Newhouse, Scott Bole, W.R. Burkett,
Phillip T. Nash, Mostafa El-Shami
Report Number
0-5834-1
Conducted for
Texas Department of Transportation
in cooperation with the
U.S. Department of Transportation
Federal Highway Administration
by the
Center for Multidisciplinary Research in Transportation

0-5834-1 iv
AUTHOR’S DISCLAIMER
The contents of this report reflect the views of the authors who are responsible for the facts and
the accuracy of the data presented herein. The contents do not necessarily reflect the official
view of policies of the Texas Department of Transportation or the Federal Highway
Administration. This report does not constitute a standard, specification, or regulation.
PATENT DISCLAIMER
There was no invention or discovery conceived or first actually reduced to practice in the course
of or under this contract, including any art, method, process, machine, manufacture, design or
composition of matter, or any new useful improvement thereof, or any variety of plant which is
or may be patentable under the patent laws of the United States of America or any foreign
country.
ENGINEERING DISCLAIMER
Not intended for construction, bidding, or permit purposes.
TRADE NAMES AND MANUFACTURERS’ NAMES
The United States Government and the State of Texas do not endorse products or manufacturers.
Trade or manufacturers‟ names appear herein solely because they are considered essential to the
object of this report.

v
ACKNOWLEDGEMENTS
Researchers are grateful for the opportunity to thank the project monitoring committee for this research
project, including Project Director John Holt of the TxDOT Bridge Division, as well as Jeff Cotham,
Amy Eskridge, Dacio Marin, and Keith Ramsey, also from the TxDOT Bridge Division, and Walter
Fisher III, TxDOT Dallas District Office. Much thanks is also due to Frank Wyatt and Doug Haynes of
the Texas Tech University Department of Civil and Environmental Engineering for their assistance in the
laboratory testing, and to Adam Davidson for his assistance in laboratory testing as well.

0-5834-1 vi
Prepared in cooperation with the Texas Department of Transportation and the U.S. Department of
Transportation, Federal Highway Administration.

vii
Table of Contents
Technical Documentation Page .................................................................................... i
Title Page ...................................................................................................................... iii
Disclaimers ................................................................................................................... iv
Acknowledgements ....................................................................................................... v
Table of Contents .......................................................................................................... vi
List of Figures ............................................................................................................... x
List of Tables ................................................................................................................ xiii
1. Introduction ......................................................................................................... 1
1.1 General ................................................................................................................. 1
1.2 Research Objectives ............................................................................................. 3
1.2.1 Research Objective No. 1 ..................................................................... 3
1.2.2 Research Objective No. 2 ..................................................................... 4
1.3 Report Organization ............................................................................................. 5
2. Background .......................................................................................................... 6
2.1 Literature Review................................................................................................. 6
2.1.1 History of the Texas U-Beam ............................................................... 7
2.1.2 Background of Elastomeric Bearing ..................................................... 7
2.1.3 AASHTO Bearing Design Requirements ............................................. 9
2.1.4 TxDOT Bearing Design Requirements ................................................. 10
2.1.5 Triaxial or Multi-Axial Behavior Studies of Elastomeric Bearings ..... 11
2.1.6 Full Scale Testing Completed on Elastomeric Bearings....................... 15
2.1.7 Performance of Elastomeric Bearings at Low Temperatures ............... 16
2.1.8 Previous Finite Element Analysis Studies ............................................ 17
2.1.9 National Cooperative Highway Research Program Report 596 ........... 19
2.1.10 Conclusions ......................................................................................... 23
2.2 DOT Questionnaire Survey.................................................................................. 24
2.2.1 Question No. 1 ...................................................................................... 24
2.2.2 Question No. 2 ...................................................................................... 26
2.2.3 Question No. 3 ...................................................................................... 26
2.2.4 Question No. 4 ...................................................................................... 28
2.3 Pontis Element No. 310 – Elastomeric Bearing................................................... 28
3. AASHTO Design Provisions ............................................................................... 34
3.1 Current Design Provisions ................................................................................... 34
3.2 Theory of the Proposed Modifications to Current Provisions ............................. 36
3.3 Limits Considered ................................................................................................ 38
3.4 Design Example with Proposed Modifications.................................................... 40
3.4.1 Discussion of Design Example ............................................................. 48
3.5 Summary of Design States ................................................................................... 48
3.5.1 Discussion of Summarized Design States............................................. 65
4. Observations and Testing .................................................................................... 66
4.1 Overview of Tests Performed .............................................................................. 66
4.2 Wichita Falls Bridge Inspection........................................................................... 66

0-5834-1 viii
4.2.1 Documentation of the Inspection .......................................................... 67
4.2.2 Comparison of Predicted Values .......................................................... 71
4.2.3 Summary of Wichita Falls Inspection ................................................... 71
4.3 US 82 Bos-W Ramp Overpass at East 4th
Street in Lubbock, TX Field Test ...... 72
4.3.1 Testing Program Overview ................................................................... 73
4.3.2 Testing Performed ................................................................................. 77
4.3.3 Results – Visual Observations .............................................................. 77
4.3.4 Results – Strain Gage Readings ............................................................ 78
4.3.5 Summary of US 82 Bos-W Ramp Overpass Tests ............................... 80
4.4 Laboratory Testing ............................................................................................... 81
4.4.1 Testing Program .................................................................................... 81
4.4.1.1 Design of Experimental Apparatus .................................................... 81
4.4.1.2 Test Frame ......................................................................................... 81
4.4.1.3 Concrete Blocks ................................................................................. 81
4.4.1.4 Hydraulic Cylinders ........................................................................... 84
4.4.1.5 Bearings ............................................................................................. 84
4.4.1.6 Strain Gages....................................................................................... 85
4.4.1.7 Pressure Gages .................................................................................. 86
4.4.1.8 Linear Displacement Gages ............................................................... 87
4.4.1.9 Vishay Micro-Measurements System 5000 Data Recorder ............... 87
4.4.1.10 Test Matrix and Procedure .............................................................. 89
4.4.1.11 Simulation of Forces ........................................................................ 90
4.4.1.12 Data Recorded ................................................................................. 91
4.4.2 Single Pad Test Results ......................................................................... 92
4.4.3 Dual Pad Test Results ........................................................................... 98
4.4.4 Summary of Observations..................................................................... 98
4.5 Finite Element Modeling .....................................................................................104
4.5.1 Description of the Finite Element Model..............................................104
4.5.2 Comparison of FEA to Laboratory Testing ..........................................106
4.5.3 Summary of Observations.....................................................................110
5. Comparison of Testing/Observations to Modified Design Provisions ............111
5.1 Combination of Transverse and Longitudinal Displacement ..............................111
5.2 Prediction of Transverse and Longitudinal Deflections ......................................126
5.2.1 Analysis of Transverse Angles Observed .............................................126
5.2.2 Analysis of Longitudinal Angles Observed ..........................................130
5.2.3 Regression Analysis of Laboratory Results ..........................................139
5.2.4 Summary of Transverse and Longitudinal Displacements ...................144
5.3 Prediction of Uplift and/or Slipping ....................................................................144
5.3.1 Measurement of Slip .............................................................................144
5.3.2 Analysis of Slip Data ............................................................................147
5.3.3 Regression Analysis for Slip .................................................................154
5.3.4 Measurement of Uplift ..........................................................................159
5.3.5 Analysis of Uplift ..................................................................................160
5.3.6 Prediction of Uplift ...............................................................................163
5.3.7 Summary of Uplift and Slip ..................................................................164
5.4 Prediction of Damage ..........................................................................................164
5.4.1 Reporting of Observed Damage to Bearings ........................................164
5.4.2 Categorization of Observed Damage ....................................................165
ix
5.4.3 Analysis of Damage ..............................................................................168
5.4.4 Summary of Damage Analysis .............................................................171
5.5 Finite Element Analysis .......................................................................................171
6. Conclusions and Recommendations ..................................................................176
6.1 Research Objective No. 1 (New Design) .............................................................176
6.2 Research Objective No. 2 (Existing Bearings) ....................................................178
References ............................................................................................................................. 181

0-5834-1 x
List of Figures
1.1 Typical Transverse Displacement on a Standard U-Beam Bearing ................ 2
2.1 Transverse Component of the Reaction ......................................................... 6
2.2 Typical TxDOT U-Beam, from Detail UBND (TxDOT 2006) ...................... 8
2.3 Typical Plan of an Elastomeric Bearing ......................................................... 9
2.4 Inclined Compression Test (AASHTO M-251, Appendix A) ........................ 16
2.5 Final Questionnaire Survey ............................................................................. 25
2.6 Responses to Question No. 1 .......................................................................... 26
2.7 Responses to Question No. 2 .......................................................................... 27
2.8 Responses to Question No. 3 .......................................................................... 27
2.9 Responses to Question No. 4 .......................................................................... 28
3.1 Transverse Component PΘ for Delta1 Displacement ..................................... 38
3.2 Geometric Displacement Delta2 Caused by YbottΘ=Delta2 ......................... 38
3.3 Single and Double Bearing Plan Configurations ............................................ 39
3.4 Dead and Live Loads ...................................................................................... 44
3.5 Bearing Pad Properties .................................................................................... 45
3.6 Delta1 and Delta2 Displacements ................................................................... 46
3.7 Single Pad Configuration Checks ................................................................... 47
3.8 Single Pad Configuration Checks (Continued) ............................................... 48
4.1 Protractor Used to Measure Transverse Angles.............................................. 68
4.2 Elevation of Bearing A ................................................................................... 69
4.3 Close-Up of Bearing C.................................................................................... 69
4.4 Section thru Shear Key for Alignment „C‟ ..................................................... 70
4.5 Plan for US 82 BOS W Ramp......................................................................... 74
4.6 Erection Sheet for US 82 BOS W Ramp ........................................................ 75
4.7 Rosette Strain Gage (left) and Bondable Terminal (right) .............................. 76
4.8 Fully Gaged Single Bearing ............................................................................ 76
4.9 Change in Strain for the Precision Resistor .................................................... 78
4.10 Change in Strain for Vertical Gages on Double Bearings .............................. 79
4.11 Change in Strain for Horizontal Gages on Double Bearings .......................... 80
4.12 Elevation View of Testing Frame ................................................................... 82
4.13 Elevation View of Longitudinal Rams ........................................................... 82
4.14 Application of Transverse Load...................................................................... 83
4.15 Standard Single and Double Bearings ............................................................ 84
4.16 Double Bearing Strain Gage Placement ......................................................... 85
4.17 Single Bearing Strain Gage Placement ........................................................... 85
4.18 Strain Gage Placement on Transverse Placement ........................................... 85
4.19 Strain Gage Installed, 32 in. by 9 in. Bearing ................................................. 86
4.20 Cable Extension Displacement Sensor – Transverse Direction ...................... 87
4.21 Cable Extension Displacement Sensors – Longitudinal Direction ................. 88
4.22 Vishay Model 5000 ......................................................................................... 88
4.23 Wiring for Vishay Model 5000 ....................................................................... 89
4.24 Example of Manual Data Recording Sheet ..................................................... 93
4.25 ANSYS SOLID186 Element .......................................................................... 105
4.26 ANSYS Model of Bearing, Transverse Face .................................................. 106
4.27 Pad Model with Rigid Extreme Layers ........................................................... 106
4.28 Strain Profile in Z-Direction, Rear Transverse Face, 6% Superelevation,

xi
Double Pad Configuration ............................................................................. 108
4.29 Strain Profile in Z-Direction, Front Transverse Face, 6% Superelevation,
Double Pad Configuration ............................................................................. 108
4.30 Strain Profile in z-direction, Front Longitudinal Face, 6% Superelevation,
Double Pad Configuration ............................................................................. 109
4.31 Strain Profile in z-direction, Rear Transverse Face, 6% Superelevation,
Double Pad Configuration ............................................................................. 109
5.1 Cycle 1 Transverse Results for 4% Test ........................................................ 112
5.2 Cycle 1 Longitudinal Results for 4% Test ..................................................... 113
5.3 Transverse Results for All 14 Cycles............................................................. 114
5.4 Longitudinal Results for all 14 Cycles........................................................... 114
5.5 Transverse Ratios versus Cycles .................................................................... 115
5.6 Longitudinal Ratios versus Cycles................................................................. 115
5.7 Single Pad Longitudinal Results for 0% Test ................................................ 116
5.8 Single Pad Transverse Results for 2% Test ................................................... 117
5.9 Single Pad Longitudinal Results for 2% Test ................................................ 117
5.10 Single Pad Transverse Results for 4% Test ................................................... 118
5.11 Single Pad Longitudinal Results for 4% Test ................................................ 118
5.12 Single Pad Transverse Results for 6% Test ................................................... 119
5.13 Single Pad Longitudinal Results for 6% Test ................................................ 119
5.14 Single Pad Transverse Results for 8% Test ................................................... 120
5.15 Single Pad Longitudinal Results for 8% Test ................................................ 120
5.16 Double Pad Longitudinal Results for 0% Test .............................................. 121
5.17 Double Pad Transverse Results for 2% Test.................................................. 122
5.18 Double Pad Longitudinal Results for 2% Test .............................................. 122
5.19 Double Pad Transverse Results for 4% Test.................................................. 123
5.20 Double Pad Longitudinal Results for 4% Test .............................................. 123
5.21 Double Pad Transverse Results for 6% Test.................................................. 124
5.22 Double Pad Longitudinal Results for 6% Test .............................................. 124
5.23 Double Pad Transverse Results for 8% Test.................................................. 125
5.24 Double Pad Transverse Results for 8% Test.................................................. 125
5.25 Summary of Transverse Displacement, Single Bearing Configuration ......... 126
5.26 Summary of Transverse Displacement, Double Bearing Configuration ....... 127
5.27 Summary of Transverse Displacement, 2% Single Pad Configuration ......... 128
5.28 Summary of Transverse Displacement, 4% Single Pad Configuration ......... 128
5.29 Summary of Transverse Displacement, 6% Single Pad Configuration ......... 129
5.30 Summary of Transverse Displacement, 8% Single Pad Configuration ......... 129
5.31 Summary of Transverse Displacement, 2% Double Pad Configuration ........ 131
5.32 Summary of Transverse Displacement, 4% Double Pad Configuration ........ 131
5.33 Summary of Transverse Displacement, 6% Double Pad Configuration ........ 132
5.34 Summary of Transverse Displacement, 8% Double Pad Configuration ........ 132
5.35 Summary of Longitudinal Displacement, Single Pad Configuration ............ 133
5.36 Summary of Longitudinal Displacement, Double Pad Configuration ........... 133
5.37 Summary of Longitudinal Displacement, 0% Single Pad Configuration ...... 134
5.38 Summary of Longitudinal Displacement, 2% Single Pad Configuration ...... 134
5.39 Summary of Longitudinal Displacement, 4% Single Pad Configuration ...... 135
5.40 Summary of Longitudinal Displacement, 6% Single Pad Configuration ...... 135
5.41 Summary of Longitudinal Displacement, 8% Single Pad Configuration ...... 136

0-5834-1 xii
5.42 Summary of Longitudinal Displacement, 0% Double Pad Configuration .... 136
5.43 Summary of Longitudinal Displacement, 2% Double Pad Configuration .... 137
5.44 Summary of Longitudinal Displacement, 4% Double Pad Configuration .... 137
5.45 Summary of Longitudinal Displacement, 6% Double Pad Configuration .... 138
5.46 Summary of Longitudinal Displacement, 8% Double Pad Configuration .... 138
5.47 Regression Summary for Model 7, Transverse Angle ................................... 140
5.48 Regression Summary for Model 11, Transverse Angle ................................. 141
5.49 Regression Summary for Model 5, Longitudinal Angle ................................ 142
5.50 Regression Summary for Model 7, Longitudinal Angle ................................ 143
5.51 Illustration of Slip, Transverse Front ............................................................. 145
5.52 Illustration of Slip, Transverse Back ............................................................. 146
5.53 Slip Measurement Locations.......................................................................... 146
5.54 Bearing Corner Undergoing Curling ............................................................. 147
5.55 Summary of Slip Results, 6% Transverse Slope, Double Pad Configuration 148
5.56 Summary of Slip Results, 8% Transverse Slope, Double Pad Configuration 148
5.57 Summary of Slip Results, 2% Transverse Slope, Single Pad Configuration . 149
5.58 Summary of Slip Results, 4% Transverse Slope, Single Pad Configuration . 149
5.59 Summary of Slip Results, 6% Transverse Slope, Single Pad Configuration . 150
5.60 Summary of Slip Results, 8% Transverse Slope, Single Pad Configuration . 150
5.61 Summary of Slip Results, Single Bearing Configuration .............................. 152
5.62 Summary of Slip Results, Double Bearing Configuration............................. 152
5.63 Regression Summary for Model 2 ................................................................. 156
5.64 Regression Summary for Model 4 ................................................................. 157
5.65 Regression Summary for Model 6 ................................................................. 158
5.66 Regression Summary for Model 7 ................................................................. 158
5.67 Example of Observed Transverse Top Uplift ................................................ 160
5.68 Uplift Summary, Test Series S6A .................................................................. 161
5.69 Uplift Summary, Test Series S8A .................................................................. 162
5.70 Uplift Data for Test Series D4A .................................................................... 162
5.71 Uplift Summary, Test Series D6A ................................................................. 163
5.72 Uplift Summary, Test Series D8A ................................................................. 163
5.73 Hairline Surface Cracks on Elastomeric Bearing .......................................... 166
5.74 Heavy Surface Cracking on an Elastomeric Bearing ..................................... 166
5.75 Tension Debonding at Shims ......................................................................... 167
5.76 Delamination of Elastomer ............................................................................ 168
5.77 Exposure of Shims ......................................................................................... 168
5.78 Strains in Z-direction (Transverse Face), 0% Single Pad Configuration ....... 172
5.79 Strains in Z-direction (Transverse Face), 4% Single Pad Configuration ...... 173
5.80 Strain in Z-direction (Transverse Face), 8% Single Pad Configuration ........ 173
5.81 Strain in Z-direction (Transverse Face), 0% Double Pad Configuration ....... 174
5.82 Strains in Z-direction (Transverse Face), 4% Double Pad Configuration ..... 174
5.83 Strains in Z-direction (Transverse Face), 8% Double Pad Configuration ..... 175

xiii
List of Tables
2.1 Comparison of AASHTO Methods B, A and TxDOT Modified ................... 12
2.2 List of State Element Data (Pontis) Documents ............................................. 30
2.3 Condition State No. 1 for Element No. 310 .................................................... 31
2.4 Condition State No. 2 for Element No. 310 .................................................... 32
2.5 Condition State No. 3 for Element No. 310 .................................................... 33
3.1 Standard TxDOT U-Beam Sheets ................................................................... 35
3.2 U-Beam Recommended Spacings for LRFD .................................................. 40
3.3 Design Limit State Abbreviations ................................................................... 50
3.4 U40 with 0% Transverse Slope....................................................................... 51
3.5 U40 with 2% Transverse Superelevation ........................................................ 52
3.6 U40 with 4% Transverse Superelevation ........................................................ 53
3.7 U40 with 6% Transverse Superelevation ........................................................ 54
3.8 U40 with 8% Transverse Superelevation ........................................................ 54
3.9 U54 with 0% Transverse Slope....................................................................... 56
3.10 U54 with 2% Transverse Superelevation ........................................................ 58
3.11 U54 with 4% Transverse Superelevation ........................................................ 60
3.12 U54 with 6% Transverse Superelevation ........................................................ 62
3.13 U54 with 8% Transverse Superelevation ........................................................ 64
4.1 Location of Bearings Inspected ...................................................................... 67
4.2 Summary of Wichita Falls Inspection Data .................................................... 68
4.3 Predicted Transverse Deflections for Select Locations .................................. 71
4.4 Tests Performed for US 82 Bos-W Ramp Overpass ....................................... 77
4.5 Laboratory Test Matrix ................................................................................... 90
4.6 Summary of Testing Procedure ...................................................................... 91
4.7 Single Pad Displacement and Damage Recorded: 0% and 2% Slopes ........... 94
4.8 Single Pad Displacement and Damage Recorded: 4%, 6% and 8% Slopes ... 95
4.9 Single Pad Displacement Forces Applied: 0% and 2% Slopes ....................... 96
4.10 Single Pad Displacement Forces Applies: 4%, 6% and 8% Slopes ................ 97
4.11 Double Pad Displacement and Damage Recorded: 0% and 2% Slopes ......... 100
4.12 Double Pad Displacement and Damage Recorded: 4%, 6% and 8% Slopes .. 101
4.13 Double Pad Displacement Forces Applied: 0% and 2% Slopes ..................... 102
4.14 Double Pad Displacement Forces Applied: 4%, 6% and 8% Slopes .............. 103
4.15 Comparison of Wichita Falls Bridge Data to Laboratory Data ...................... 104
4.16 Comparison of Lubbock Bridge Data to Laboratory Data.............................. 104
4.17 Angular Deformations in Pads at 390 kip Vertical Load ................................ 107
5.1 Predictor Variables used in Regression Analysis ........................................... 139
5.2 Slip Summary for Test Series, 390 Kip Load ................................................. 153
5.3 Summary of Slip Details, 390 Kip Load ......................................................... 154
5.4 Raw Summary of Damage by Test Series ..................................................... 169
5.5 Percentage Based Summary of Damage by Test Series ................................. 170
5.6 Progressive Damage Summary by Test Series ............................................... 170
6.1 Recommended Revisions to “Elements” Field Inspection and
Coding Manual – Element No. 310 ................................................................ 180

0-5834-1 xiv

0-5834 1
1. INTRODUCTION
1.1. General
The Bridge Division of the Texas Department of Transportation (TxDOT) developed the
current Texas U-beam sections in the mid-1980’s as an aesthetic alternative to conventional I-
shaped girders. Although the improved aesthetics resulted in a “modest increase in cost” over
other superstructure alternatives, the Bridge Division still has a desire to use the Texas U-beam
sections. (TxDOT 2001)
As standard practice, the Bridge Division requires that the Texas U-beam sections be
supported by three steel-reinforced elastomeric bearings, one larger bearing at one end and two
smaller bearings at the other end. The Bridge Division designed standard bearings for most
span/beam arrangements in order to ensure consistency and to reduce both design and fabrication
errors. When the Texas U-beam sections are used on relatively flat grades (longitudinally) and
negligible superelevation (transversely) the standard bearings typically perform well. However,
as the transverse superelevation increases, a noticeable transverse displacement is induced into
the bearings.
Figure 1.1 shows a typical U-beam bridge in Wichita Falls, Texas built with a transverse
slope of up to 6.0%. The pier caps were designed to be parallel with the roadway surface, thus
allowing the use of uniform-height standard steel-reinforced elastomeric bearing pads. The top
sketch shows two U54 sections placed parallel to the 6.0% slope of the deck. The bottom photo
shows an 18º transverse displacement in the steel-reinforced elastomeric bearing. This
displacement is caused primarily by the gravity component of the end reaction parallel to the
bearing seat.
Transverse displacements of this magnitude are not uncommon. A displacement of this
magnitude by itself would most likely not be considered problematic. However, once this
displacement is considered in conjunction with the longitudinal displacement, whether it is
acceptable or not is not nearly as clear. The overall aim of this research project was to clarify the
role of the transverse displacements in the steel-reinforced elastomeric bearings used for the
Texas U-beam sections.

0-5834 2
Figure 1.1 – Typical Transverse Displacement on a Standard U-Beam Bearing

0-5834 3
1.2. Research Objectives
The original Research Project Statement provided the following concise description of the
problem: (Holt 2006)
Elastomeric bearings supporting superelevated U-beams have substantial transverse shear
deformation, due to the dead load of the structure. Calculated shear deformation, in the
transverse direction, for superelevated U-beams can easily approach the AASHTO-
specified limits for the elastomer thickness used in TxDOT’s standard U-beam bearings.
These bearings are normally designed to accommodate thermally-induced shear
deformation, which is usually greatest in the direction of the long axis of the bridge.
Research is needed to determine if there is a need to account for the above as well as
transverse shear deformations in bearing design and, if so, how.
Two primary research objectives were developed based on the above Research Project
Statement, the Texas Tech University Center for Multidisciplinary Research in Transportation’s
(TechMRT) response, results of a questionnaire survey sent to all 49 states and the District of
Columbia, and meetings/conversations with representatives from the Bridge Division of TxDOT.
1.2.1. Research Objective No. 1
The first objective was to determine if there was a need to consider the transverse
superelevation in design, and if so, how it should be considered.
Superficially, this may seem a simple objective to fulfill. However, some bridge
designers argue that superelevation has to always be considered while others argue that the
commonly used transverse superelevation values (even up to about 8%) are low enough to be
ignored in design. Strict adherence to the former group often leads to an analysis that concludes
that standard size bearings are not acceptable to be used on any significant transverse slope. The
latter group, however, often contends that regardless of transverse superelevation, as long as the
bearing is designed for the combination of vertical load and longitudinal deformations, there is
no need to consider transverse superelevation.
A second issue complicating this objective is the way steel-reinforced elastomeric
bearings are viewed by different bridge designers. Some view the bearings as crucial elements

0-5834 4
that, if not properly designed, may cause significant problems with the long-term performance of
the superstructure. Others view the bearings as nearly indestructible and therefore not needing
sophisticated design. The relatively low cost of the bearings in relation to the overall bridge is
often used as justification for not worrying about their performance. However, if the labor and
cost to the traveling public due to a bridge closure is considered, the cost needed to replace a
bearing becomes significant.
A third complicating factor arises from the fact that the overall width of a Texas U-beam
section and its relatively wide (1’-3 ¾”) top flanges make it difficult to place a U-beam section
level when the roadway is superelevated transversely. If a U-beam section were placed level no
transverse force would be generated. However, placing a section level would require a
significant “haunch” or “build-up” on the up-slope side to account for the roadway slope.
Forming and placing concrete for such a large haunch would be difficult and is generally not
recommended by TxDOT designers.
A fourth complicating factor is the use of tapered bearing pads. The width of the
standard single bearing is 32 in. If such a pad were to be tapered at an 8% superelevation, the
taper required would be over 2.5 in. Such an excessive taper often makes this option unfeasible.
1.2.2. Research Objective No. 2
The second objective was to determine if there was a need to address existing U-beam
bridges that have already been constructed on a significant transverse superelevation using
standard steel-reinforced elastomeric bearing pads. If a need was determined, then
recommendations for inspecting and documenting the condition were to be developed.
Bridge contractors have reported to TxDOT that when a U-beam is initially set on a
bridge designed with a transverse superelevation, the bearings immediately deform transversely
downhill. This can lead to difficulty aligning adjacent spans and matching formwork at the ends
of a span. To alleviate this problem, shear keys are sometimes designed to resist this movement.
Inspections were performed to identify the potential concerns associated with the existing
condition.

0-5834 5
1.3. Report Organization
This report is divided into six chapters. Chapter 2 provides a more in-depth background
of the problem starting with the Literature Review section which presents research primarily
relevant to the topic of transverse displacements. A significant amount of literature has been
written concerning the behavior of elastomeric bearings subjected to temperature extremes.
Although this topic was considered throughout the project, it was not the primary variable to be
considered. The results of a questionnaire survey sent to all 49 states and the District of
Columbia are then presented. The chapter concludes with the current element data or Pontis
coding for elastomeric bearing pads.
Chapter 3 presents the American Association of Transportation Officials (AASHTO)
current recommended design provisions. The TxDOT modifications to these design provisions
are then detailed and presented. Once the current method of design is established, a method to
specifically include the influence of the transverse superelevation is presented. The
ramifications of this proposed modification on current TxDOT practice are then presented.
Chapter 4 presents the results of the field and laboratory testing performed for the project.
The results of an inspection on a set of bridges in Wichita Falls, Texas are presented as an
example of the recording needed to establish a baseline inspection. The bearings for a second U-
beam bridge in Lubbock, Texas were instrumented and monitored throughout the construction
process. The resulting changes in the strains in the bearings throughout the construction process
are presented in this chapter. Based on the currently used load and span arrangements presented
in Chapter 3, a testing schedule was developed to test both the single and double bearing
configurations throughout the anticipated range of load and deformations (both transverse and
longitudinal) . The bearings were purchased, strain gages were applied, and the bearings were
tested in the Structures and Materials Laboratory at Texas Tech. The results of the laboratory
testing are presented. Lastly, results of Finite Element Modeling are presented.
Chapter 5 compares the predicted behavior to the observed behavior. Based on this
comparison, the ability of the proposed AASHTO modifications are evaluated. This evaluation
leads to the Conclusions and Recommendations provided in Chapter 6.

0-5834 6
2. BACKGROUND
2.1. Literature Review
The TxDOT U-beams work well in practice when little or no transverse superelevation or
cross slope exists. Difficulties may occur when the U-beam section is used on a roadway with a
significant transverse superelevation or cross slope. When this occurs, the beam develops a
transverse component to its dead load as shown in Figure 2.1. This transverse component, when
transferred to the bearing pad may cause the pad to shear transversely. Also, a transverse
moment may be introduced due to the vertical load acting a distance over from the centerline of
the bearing.
Figure 2.1– Transverse Component of the Reaction
The transverse shear depicted in Figure 2.1 may or may not be significant by itself.
However, since the bearing is required to allow the U-beam to move longitudinally to
accommodate thermal movements, longitudinal stresses and strains in addition to the transverse
stresses and strains will be introduced into the bearing. The combination of transverse shear and
moment, longitudinal shear and moment, and vertical compression may need to be considered as
a worst-case triaxial state of loading.
This literature review narrowly focuses on this triaxial state of loading. The following
areas were investigated: the history of the U-beam’s use within the Texas Department of
Transportation, background data on elastomeric bearings, national requirements on the use of
elastomeric bearings including allowable stresses and strains, TxDOT design standards for
elastomeric bearings, reports done for TxDOT or other agencies on elastomeric bearings, current

0-5834 7
projects accounting for the triaxial loading of elastomeric bearings, projects that have completed
full-scale testing of elastomeric bearings, and relevant articles on the finite elemental analysis of
elastomeric bearings.
2.1.1. History of the Texas U-beam
The Bridge Division of the Texas Department of Transportation initially developed the
current Texas U-beam sections in the mid 1980s. The first bridge constructed with the current
U-beam section was finished in 1993 (TxDOT, 2001). The U-section offers district designers an
aesthetic alternative to the typical I-shaped girders. Many districts use the more aesthetic section
despite the alternative’s modest cost increase over the standard prestressed I-beams.
U-beams are tub shaped with a web section that slopes inward. As shown in Figure 2.1,
this inward slope adds to the aesthetics, providing the sense that the superstructure is thinner than
its I-beam counterparts. Standard depths for the U-beams are 40 in. and 54 in., allowing for
maximum span lengths of 105 ft and 120 ft respectively. A typical U-beam section is shown in
Figure 2.2. While TxDOT (2007) indicates that individual U-beams are more expensive than
individual I- sections, U-beams may add economy to the overall system by generally requiring
fewer beams. TxDOT indicates that the U-beam sections provide a clean, aesthetically pleasing
appearance when used in practice. In 2004, the “pre-topped” U-beam debuted. This
modification of the standard U-beam contains a 7-inch slab cast by the fabricator. This allows
the contractor to rapidly construct the bridge deck on top of the beams, allowing for more
economy during construction with the U-beams.
Standard details for the TxDOT U-beam sections exist allowing for the placement of the
U-beam at various skew-angles and various superelevations. Skew-angles are allowed up to 45
degrees while superelevations currently are allowed up to 8% (TxDOT, 2006.) A list of the most
pertinent standard details is included in section 3.1.
2.1.2. Background on Elastomeric Bearings
Du Pont, in 1959, created one of the first design provisions for elastomeric bearings
entitled “Design of Neoprene Bearing Pads.”(Du Pont - Elastomer Chemical Department April
1959) Du Pont’s procedures detailed in the provisions were adopted as the basis for many design

0-5834 8
Figure 2.2 – Typical TxDOT U-beam, From Detail UBND (TxDOT, 2006)
procedures used today. Elastomeric bearings have proven to be a reliable and economical
exterior application used in a variety of manners, especially in bridges. The bearing capacity for
early Dupont bearings was 800 psi with compressive strains allowed up to 15%. Early on,
stability was ensured by limiting the smallest plan dimension of a bearing to a minimum of 5
times the bearings thickness. Bearing slip was believed to not occur as long as the shear stress
did not exceed one-fifth of the compressive stress (English et al., 1994). While the design
criteria for bearings has changed over time due to a better understanding of bearing behavior, the
Dupont standards are still regarded as one of the bases for today’s codes.
Elastomeric bearings can be plain or reinforced and can be manufactured from natural
rubber or a synthetic material (neoprene is the most common elastomer). The purpose of the
elastomeric bearing is to transfer the vertical loads from bridge beams to the substructure while
accommodating horizontal (usually longitudinal) movement of the beams due to thermal effects
in addition to allowing for prestressing, creep, and shrinkage of the superstructure (Abe,
Yoshida, and Fujino, 2004).
Bearings typically undergo three types of loading: axial compression resulting from the
transfer of loads from the superstructure to the substructure, rotation from the displacement of

0-5834 9
the beams due to their loads, and longitudinal shear displacement due to the thermal effects on
the beams themselves (English et al., 1994). When a beam is superelevated transversely, a
second shear displacement (in the transverse X direction) and moment in the transverse direction
(about the Z axis) may develop as shown in Figure 2.3. In Figure 2.3, W is the dimension of the
bearing perpendicular to the girder’s length while L is the dimension parallel to the girder’s
length.
Figure 2.3 – Typical Plan of an Elastomeric Bearing
Elastomeric bearings can fail in various ways. According to English et al. (1994),
bearings fail from fatigue, stability, delamination, yield/rupture, or serviceability issues. The
TxDOT report by English et al. details the different failure methods and identifies the key issue
to be slippage. Fatigue can be accounted for, delamination is not a critical failure mode, and
stability can be considered during design to ensure that buckling/instability does not occur.
Historically, slippage has been the most common failure method for TxDOT bridges.
Slippage occurs when the effect of the horizontal forces developed from the thermal
influence on a beam exceeds the coefficient of friction between the beam and the bearing pad or
the pad and the top of the bearing seat (Heymsfield et al., 2001). Slippage is commonly referred
to as walking and was noted to have occurred in both Louisiana and Texas. In Texas, slippage
appears to be limited to natural rubber bearings with span lengths greater than 100 feet and
girders that are subject to extreme thermal effects (Muscarella and Yura, 1995). Muscarella and
Yura found no evidence of walking with neoprene bearings.
2.1.3. AASHTO Bearing Design Requirements
The AASHTO LRFD process requires the designer to consider the three-dimensional
effects of translational moments and rotations in the design of the bearing. Both instantaneous

0-5834 10
and long-term effects should be considered throughout the design. Depending on the complexity
of the situation governing the bearing’s use, the effects of curvature, skew, rotations and support
restraints should be included in the design process. The girder’s material properties including
the type of material and prestressing effects should also be considered. Current design
provisions for bearings originate from the Allowable Stress Design service load conditions
instead of factored loads. As such, the load factor for the design of bearings is usually taken as
one. In addition, an allowance exists for the overstressing of the bearing during the construction
process. The design of bearings has become more detailed with the release of the more recent
editions of the AASHTO LRFD Bridge Design Specifications.
AASHTO bearing design allows for the use of two methods: Method A and Method B.
Method A is a more conservative approach and generally results in a lower bearing capacity.
Method B requires additional testing of bearings and quality control for the materials. While it
may yield a more economical design from a material standpoint, bearings are typically not a high
initial percentage cost in bridge design.
2.1.4. TxDOT Bearing Design Requirements
The provisions for design of the steel-reinforced elastomeric bearings are provided in the
TxDOT LRFD Bridge Design Manual. (TxDOT, LRFD Bridge Design Manual 2007) TxDOT
currently requires that the design of the bearings follow Design Method A, with TxDOT
modifications using the AASHTO LRFD Bridge Design Specifications (3rd
Edition). Additional
specific details of the bearing design and the TxDOT modifications to AASHTO are presented in
Section 3.1 of this document.
For typical design situations, TxDOT requires three bearings to support each U-beam
section. Two smaller bearings are used on one end of the beam and one larger bearing is used on
the other end. The standard size for each of the smaller bearings is a plan size of 1’-4” by 9” and
a total thickness of 2.5 in. including 5 steel shims. The standard size for each of the larger
bearings is a plan size of 2’-8” by 9” and a total thickness of 2.5 in. including 5 steel shims. Six
standard sheets released in a TxDOT memorandum dated July 27, 2006 have been created to
show details of the bearings and the U-beams. These standard sheets are available on-line and
are included in section 3.1 and Appendix 3-1 of this report. (TxDOT, TxDOT Expressway
British Standards (English) 2009)

0-5834 11
The standard bearing sheet UBEB dated July 2006 contains a note to “See Bearing Pad
Taper Report sheet for Fabricator’s Report of Bearing Pad Taper.” These provisions can be used
to address longitudinal slope. However, there are no specific provisions on the sheet or
elsewhere to address transverse slope.
According to the TxDOT LRFD Bridge Design Manual, tapered bearings are allowed as
long as the slope of the taper is does not exceed 5.5%. Muscarella and Yura (1995) showed that
tapered bearings have been in use in Texas prior to the AASHTO prohibition of tapered bearings
in 1992. No serious issues have arisen from the use of tapered bearings in Texas and TxDOT
maintains that it is easier to facilitate span end elevation differences with tapered bearings versus
the contractor determining an alternate method to account for the differences. According to
Hamzeh, Tassoulas, and Becker (1998), research has shown that there is no evidence that tapered
bearings (less than 4% slope) perform any less successful than flat bearings. The results of their
finite element study support this conclusion.
Considering lift-off, Muscarella and Yura (1995) report that “zero lift-off” limits the
ability of the bearing to reach its full capacity and is an overly conservative approach to bearing
design. Rotational capacity is a function of the axial stiffness of the bearing. Research
conducted by the aforementioned authors at the University of Texas indicates that 20% lift-off is
not detrimental to the performance of the bearing. As such, the TxDOT LRFD Bridge design
manual allows the rotational capacity to be based on 20% lift-off.
General provisions require the use of 50 durometer hardness with a shear modulus
between 95 and 175 psi. A summary of pertinent design criteria is shown in Table 2.1. This
summary is provided so that the reader can get a sense of the differences in the methods and is
not intended to be used for design since variables are not defined. Specific design provisions
related to proposed changes to the AASHTO standards are included in Chapter 3 of this report.
2.1.5. Triaxial or Multi-Axial Behavior Studies of Elastomeric Bearings
Little research appears to have been conducted on the behavior of elastomeric bearings
under a triaxial load. Abe, Yoshida, and Fujino (2004) conducted a study about the experimental
application of loads. In their 2004 article, they set out with the following research objectives:

0-5834 12
Table 2.1 – Comparison of AASHTO Methods B, A and TxDOT Modified
Parameter AASHTO Method B AASHTO Method A TxDOT LRFD Modified
Tapered Bearings Not Allowed Not Allowed
Taper OK, slope not to
exceed 5.5%. If slope
exceeds 5.5%, use a
beveled sole plate to
accommodate the slope
Cover Layers≤ 0.7 internal layer
thickness
≤ 0.7 internal layer
thickness
0.25-thick outer layers. If
using 0.25-inch thick inner
layers, disregard AASHTO
requirement in Article
14.7.6.1
Shear Modulus (G) 80 psi ≤ G ≤ 175 ksi 80 psi ≤ G ≤ 175 ksi 95 psi ≤ G ≤ 175 ksi
Hardness
SpecificationNone 50 to 60 durometer 50 durometer
Elastomer Material
SpecificationNone None neoprene
Thermal Effects
DT determined
through Article
14.7.5.2
DT = 70o
Compressive
Stress Limit,
bearing subjected
to shear
deformation
Θs ≤ 1.66 GS ≤ 1.6 ksiΘs ≤ 1.00 GS ≤ 1.0 ksi for
steel reinforced bearing
Θs ≤ 1.2 GS ≤ 1.2 ksi (DL
only); Θs ≤ 1.5 GS ≤ 1.5
ksi (Total Load)
Compressive
Stress Limit,
bearing fixed
against shear
deformation
Θs ≤ 2.00 GS ≤ 1.75
ksi
Increase 10% of above
limits
Θs ≤ 1.2 GS ≤ 1.2 ksi (DL
only); Θs ≤ 1.5 GS ≤ 1.5
ksi (Total Load)
Shear
Deformationhrt ≥ 2.0 Δs hrt ≥ 2.0 Δs hrt ≥ 2.0 Δs
Rotation, Steel
Reinforced
Bearing
Θs > 1.00 GS (Θs/n)
(B/hri)2 and
Θs < 1.875 GS [1-
0.2(Θs/n) (B/hri)2]
Θs ≥ 0.50 GS (Θs/n)
(B/hri)2 and
Θs≥0.5GS(W/hri)2(Θsz/n)
δ ≥ (ΘLL+0.005) (0.8L) / 2
Lift-off None None≤ 20% Longitudinal
Dimension of Bearing
StabilityCumbersome, See
Article 14.7.5.3.6
hrt ≤ minimum (L/3, W/3,
or D/4)
hrt ≤ minimum (L/3, W/3, or
D/4)

0-5834 13
1) Understanding the restoring force characteristics of laminated rubber bearings in large
and small amplitude and construct a database of multi-axial loading conditions, which is
useful to the designers.
2) The development of an accurate mathematical model, which is universal to these
laminated rubber bearings for multi-axial loading conditions.
The above objectives were presented in two separate articles in the Journal of Structural
Engineering in August 2004. The first objective is discussed below while the second objective is
discussed under the finite element section of this chapter.
Past experiments on properties of bearings were conducted with single direction applied
shear under constant vertical load. While the research conducted was satisfactory, the research
was limited in application to “unidirectional horizontal deformation with large amplitude.”
Previous research did not allow for good models of multi-directional shear (biaxial or triaxial
conditions). Also, most early models for bearings did not include the hardening behavior
exhibited by the elastomer under large deformations. Mozkah (1990) experimented with Teflon
friction bearings under triaxial loads and proposed a model for the bearing. However, Mozkah
focused only on the Teflon bearings and did not investigate the effects of triaxial loading on
natural rubber or neoprene laminated bearings.
Abe, Yoshida, and Fujino (2004) subjected both natural rubber and neoprene bearings to
four types of loading. During the pre-loading portion of their experiment, bearings were loaded
independently in each horizontal direction to the expected maximum shear displacement under a
vertical load. The objective of the pre-loading phase was to eliminate any virgin effects on the
bearing. It was suggested that uniform results during further tests could be achieved if the
bearings were independently loaded and unloaded in order to stabilize the hysteric loops in the
shear strain versus load diagrams. Results from this testing indicated that elastomers tend to
exhibit isotropic behavior after undergoing an initial deformation in a single direction.
Next, the trio investigated the effects of low amplitude cyclic deformations. The loading
was intended to simulate loads resulting from traffic loads on a bridge with load deformations of
0.5% to 20% used. Thermal strains were also introduced to simulate the cyclic loading with the
effect of thermal expansion/contraction of the girders. The goal of this portion was to investigate

0-5834 14
the stiffness and damping of each bearing. The results suggest that the shear strain for natural
rubber bearings is only slightly affected by the axial stress on the bearing.
Biaxial loading consisted of cyclic deformations under a constant vertical load to obtain
the basic behaviors of bearings. This section of the report concentrates on determining
properties of bearings so that the triaxial loading can be better understood. The shape of the
hysteric loops shows the non-linear properties of the elastomer in that some hardening does
occur.
Finally, triaxial loading was conducted for the bearings. To conduct this, bidirectional
horizontal displacement paths were followed while the bearing was subjected to a constant axial
compressive force. An important conclusion in the report was that there is a coupling effect in
the two horizontal shear directions.
While this article is one of the few articles discussing triaxial loading of bearings, the
basis of the article seems to apply more toward the use of bearings for earthquake loading rather
than focusing on natural rubber bearings used in bridge applications. Nonetheless, the finite
element model discussed in the companion paper is a good reference. It is also important to note
that TxDOT requires the use of neoprene elastomeric bearings rather than natural rubber
bearings.
Research by Yura et al. (2001) briefly mentioned triaxial limit states for elastomeric
bearings. It was reported that the triaxial stress should not exceed six times the shear modulus as
it leads to an instability as a result of cavitation. The susceptibility of caving is related to the
elastomer’s material property (i.e. Young’s Modulus) rather than the strength of the rubber.
The yielding of the laminate material was also discussed. Yura et al. (2001) suggest that
yielding occurs when the Von Mises Stress limit is reached and that the limit state is reached
when the Von Mises Stress represented in the following exceeds the yield limit of the elastomer:
Equation 2.1
where σ represents stress and the subscripts represent the three principal directions.

0-5834 15
2.1.6. Full-Scale Testing Completed on Elastomeric Bearings
Topkaya and Yura (2002) investigated a unique way to determine the shear modulus of
an elastomeric bearing. The shear modulus, according to Topkaya and Yura, is the most
important material property that designers need. In 1997, AASHTO approved two methods to
determine the shear modulus of elastomeric bearings. One method consisted of full-scale testing
while the other used smaller test pieces.
The small sample quad shear test (ASTM D-4014) consisted of loading four smaller test
pieces in shear up to fifty percent strain. Quad Shear tests are performed without a companion
compressive load. The shear modulus is calculated based on the shear stress at 25% strain.
Research tends to indicate that the shear modulus obtained from this test is significantly higher
than that predicted from full-scale testing.
In a typical full-scale test (AASHTO 1996, 1997), two full-size bearings are sandwiched
between three plates. Bearings are subjected to a compressive load which is held constant, then
subjected to a shearing force in addition to the compressive force. The shear modulus is usually
defined by the secant definition which relates the shear modulus to the slope of the line
originating at the origin of a displacement versus load graph. If the shear force is applied
independently in both directions, the shear modulus is taken as the slope of the line between the
points on the graph at a strain of ± 50%. The secant definition of the shear modulus accounts for
the non-linearity of the elastomer. These full-scale tests are more costly than the Quad Shear
Tests and require an extensive apparatus to load the bearings in both compression and shear.
The inclined shear test proposed by the authors is an alternative test similar to the full-
scale test mentioned above. The primary difference is that the plates the bearings are
sandwiched between are sloped rather than flat. This allows for the bearings to be loaded in
both compression and shear at the same time using only a compressive load shown in Figure 2.4.
The shear modulus can be calculated based on the equation:
Equation 2.2
where G is the Shear Modulus, hrt is the total elastomer thickness of the bearing, s is the slope of
the plates, W is the measured compressive force, and Ds is the measured horizontal movement of

0-5834 16
Figure 2.4 – Inclined Compression Test (From AASHTO M-251, Appendix A)
bearing. A 1:20 slope is recommended as it appears to give the best results except for bearings
with a high stiffness.
The authors concluded that the inclined test can accurately determine the shear modulus
of steel-reinforced laminated elastomeric bearings and is a good alternative to the Quad-Shear
test. The shear modulus at 50% strain was recommended for use as the bearing’s shear modulus
since this is generally accepted as the upper limit of shear strain. The inclined compression test
has its limitations as it does not yield favorable results for natural rubber bearings. Nonetheless,
the inclined compression test is an acceptable test method for determining shear modulus
according to AASHTO M251 (AASHTO, 2006).
2.1.7. Performance of Elastomeric Bearings at Low Temperatures
Yakut and Yura (2002) investigated the performance of elastomeric bearings at low
temperatures. They identified two types of stiffening that occur when bearings are subjected to
cold temperatures. Instantaneous thermal stiffening associated with the change in temperature
and crystallization of the elastomer which occurs if the low temperature is experienced over an
extended time period. Research showed that crystallization is more of a concern than the
instantaneous thermal stiffening. Stiffening is a concern because as a bearing stiffens, more
shear force for a given movement is transferred to the substructure. In addition, the shear force
may exceed the static friction limit and the bearing may slip. Yakut and Yura (2002)
investigated the effect of temperature and time as parameters that influenced bearing response.

0-5834 17
Final results answered some of the questions. According to the authors, cyclic loadings
(both traffic and thermal) have little or no effect of the shear modulus. A bearing’s creep rate is
higher at low temperatures, but the overall effect was less than at warm temperatures. The
loading rate was also found to be important. The authors recommended decreasing shear
modulus for design by 30% for rubber and 20% for natural rubber to account for the load rate.
To account for low temperature effects, bearings are rejected if the Gcold/G > 4 where
Gcold is the shear modulus of the bearing at the specified low temperature and G is the shear
modulus for the bearing at room temperature (Yura, Yakut, Becker, and Collingwood, 2001).
AASHTO (2006) states that G shall be taken as the shear modulus of the bearing at 73 degrees
Fahrenheit.
2.1.8. Previous Finite Element Analysis Studies
Hermann, Ramaswamy, and Hamidi (1989) provided one of the earliest finite element
analysis of elastomeric bearings. Finite element analysis can be an economical means to predict
the overall response characteristics of interest for bearings. Items of interest included axial force
versus axial deflection and moment curvature of the bearing surface. Two computer codes, a 2-d
and 3-d analysis, were developed. Because of the extensive execution time required for the 3-d
analysis, it is recommended for research only. The 2-d analysis, which has a shorter execution
time, is more appropriate for design. While little data about the modeling techniques can be
deciphered, the research showed that finite element analysis can be a useful tool for conducting
studies on design parameters of bearings. Finite element analysis can be a good means to predict
overall bearing response and internal stresses in the elastomeric and reinforcement layers. One
additional result is the desire to consider limiting the height of the bearing to prevent
buckling/instability as can be seen in current design standards today published by both TxDOT
and AASHTO.
Yazdani, Eddy, and Cai (2000) conducted a study on the behavior of bearings loaded by
AASHTO precast Type III and IV girders. The bearings were modeled as eight noded cube
linear elements using ANSYS 5.4 software. Individual spring stiffness values were calculated
using the appropriate tributary area. The sum of the spring stiffness for each portion of the
bearing was equal to the total stiffness of the bearing from the 1996 AASHTO Standards. The
general trend in an early application of finite element analysis was that the results of the finite

0-5834 18
element analysis predicted higher responses than shown in field tests. The conclusion was that
skew angle may have an impact on bearing stiffness as well as the fact that bridges may be
“stiffer in practice than theoretical analysis may suggest.” Nonetheless, the finite element
analysis and field tests validated the AASHTO specifications.
Similarly, Green, Yazdani, Spainhour, and Chi (2001) conducted a study to utilize finite
element analysis to model the Florida bulb tee 78 girder and investigate the loading response
under established boundary conditions. The software used to conduct the finite element analysis
was ANSYS Version 5.5, University High Option. The girders were modeled as well as the
bearing pads. COMBIN14 spring elements from ANSYS were used to model the bearing pads.
The spring elements accounted for the non-linear behavior of the elastomer. Each pad was
broken into 9 sections as developed in the paper with appropriate spring constants for the
bearings obtained through AASHTO values. Type V bearing pads (50 durometer with G
between 0.655 MPa and 6.895 MPa) with the dimensions of 254 mm by 610 mm were tested at
skew angles of 15, 30, 45 and 60 degrees. The results indicated that an increased deflection
(strain) of the bearing pad occurred with increased skew angles. As the skew angle increased,
bearing pads with higher a shear modulus were needed to keep the deflections and stresses
within limits. In contrast, bearings with lower skew angles have been found to be more
susceptible to “lift-off.”
Abe, Youshida and Fujino (2004) developed a finite element model based on their
research discussed earlier in the triaxial stress portion of this literature review. It was used to
model the “bidirectional behaviors of the bearings under a constant vertical load” which is
defined as a triaxial loading state. The finite element model used by the authors was based upon
a three-dimensional constitutive law of the Ozdemir model and the modeling of the elastomer as
a nonlinear viscoelastic material. After further development of this model, the authors developed
their finite element based on an elastoplastic model of the material. This model was used to
predict the restoring forces of the bearings used as seismic isolation bearings. While this is not
directly related to the use of elastomeric bridge bearings, the assumptions about the material may
prove useful.
Hamzeh, Tassoulas, and Becker (1998) took earlier non-linear finite element modeling
based on the work of Herman (1995) and others and modified the homogenized continuum
model used at the time. Hamzeh et al. (1998) worked with a p-version finite element model

0-5834 19
where they accounted for the material non-linearities and geometric non-linearities result from
large deformations and large strains. Elastomeric bearings are subjected to large deformations
and strain. The elastomer was modeled as an incompressible, hyperelastic material. The use of
virtual work and Lagrange multipliers enforced the incompressible boundary condition of the
elastomer. Finally, J2 flow theory with isotropic hardening was used to model the steel
reinforcement as a bilinear, elastoplastic material. The authors concluded that this finite element
is a good fit for the behavior of elastomeric bearings and that tapered bearings do not exhibit
unusual behavior for slopes up to four percent when compared to the behavior of flat bearings.
The finite element model is discussed in detail in TxDOT Research Report Number 1304-5
(Hamzeh, Tassoulas, and Becker, 1998).
2.1.9. National Cooperative Highway Research Program Report 596
National Cooperative Highway Research Program (NCHRP) Report 596, Rotation Limits
for Elastomeric Bearings, contains information pertaining to the calculation of stresses within a
bearing. The publication, released in 2008, provides several suggested updates to the American
Association of State Highway Transportation Officials (AASHTO) design methods for
elastomeric bearings. As indicated previously, elastomeric bearings are the bearings of choice
for bridge designers due to their ability to accommodate the loads and rotations transferred
between the superstructure and the substructure while allowing for the required movements and
rotations.
Stanton et al. (2008) described the failure modes for steel-reinforced elastomeric
bearings. The first mode identified was tension debonding at the ends of the shims. This occurs
when the tensile forces in the elastomer cause the elastomer to separate from its bond with the
steel shim. Debonding is seen where the smaller, individual bulges of the elastomer combine to
form a single, larger bulge. Upon further loading or more cyclic repetitions, tension debonding
may lead to shear delamination which is the continuation of the tension debonding inward along
the length of the shim. Shear delamination is accompanied by cracking in the elastomer along
the same level as the shim/elastomer interface. Finally, internal rupture or failure of the steel
shims can occur under large loads. Internal rupture is believed to be limited to cases where the
bearings are attached to steel bonding plates.

0-5834 20
NCHRP Report 596 (2008) also described the implications of the different failure modes
for steel-reinforced elastomeric bearings. In general, it is believed that tension debonding has no
discernable impact on the bearing’s performance. However, as tension debonding is described as
the first sign of the progressive failure modes, it is an important phenomenon to note. On the
other hand, shear delamination can cause serious consequences. Shear delamination could lead
to the elastomer walking out from between the bearing’s shims. While this situation will not
likely result in a catastrophic failure, it is a serviceability failure from which the economic
impacts associated with the solution would be significant. The final failure method is internal
rupture. Internal rupture is the yielding or fracture of one or more steel shims within the
elastomeric bearing. It is difficult to distinguish between tension debonding and delamination
without destructively cutting into the bearing. Considering this fact, the authors of the NCHRP
report associate the failure of a bearing with the onset of tension debonding.
Currently the design standards for bearings come from the AASHTO Bridge Design
Manual. Two methods are available to complete the design. Most states choose to use Method
A (Stanton et al., 2008). The standards work well for designing the bearings; however, a few
concerns exist. One concern is that Method A and Method B do not require the same checks for
a design to be acceptable. In some cases, a bearing meeting design requirements under Method
B will fail under the provisions of Method A. The other problem is with the “no lift-off”
provision in the design procedures. According to the authors of NCHRP 596 (2008), the original
reason to include the no lift-off provision in the standard was to prevent internal rupture of the
bearing. However, this provision may cause elastomeric bearings to be too thick and thus
unstable, requiring the use of mechanical bearings when an elastomeric bearing would perform
acceptably.
While not allowing lift-off was the original intent of the AASSTO design standards,
many states chose to modify or ignore the provision (Statnton, et al., 2008). While experience
and current bearing performance does not show any severe failures from lift-off, the true effects
remain unknown. As such Stanton et al., through research conducted at the University of
Washington, set out to see if a more universal design provision could be created to better allow
for lift-off and to determine the true effects of lift-off on bearing performance.
Stanton et al.’s (2008) research consisted of testing elastomeric bearings of multiple sizes
under various combinations of static and cyclic axial loads and rotations. A specific case under

0-5834 21
investigation was the low axial load associated with a high rotation that was thought to cause lift-
off failures according to the current AASHTO design standards. Testing was conducted and
bearings were inspected with any resulting damage documented. In addition, a finite element
analysis was conducted in order to find a sufficient model to predict what might occur. Stanton
et al. (2008) believe that measurement of strains within the bearing or on the edges of the bearing
with conventional strain gages is nearly impossible due to the magnitudes of the strains present
and the stress concentrations present at the edges of the elastomer. Furthermore, the presence of
the strain gages would alter the strain field present within the elastomer. A final complication is
the lack of uniformity of the strain throughout the bearing. Finally, hand calculations are very
tedious due to the non-linearity of the material properties of the elastomer.
The finite element model was created with the aid of the MSC.Marc 2003r2 program by
MSC software. A two-dimensional analysis was conducted using large deformation plane strain
in a LaGrange setting. The material modeled was non-linear, elastic, nearly incompressible with
the Bulk Modulus, K, estimated from Holownia’s paper, “The effect of various types of carbon
black on elastic constants of elastomers,” published in Plastics and Rubber: Materials and
Applications in August of 1980. The reasonable analysis range for Stanton’s research at the
University of Washington was 0 < /GS < 2 and 0 < y < 0.006. While conducting the finite
element analysis, local mesh distortion inhibited the ability to calculate shear strain at the very
end of the shim. This shear strain was extrapolated from the value ¼ inch from the shim’s end.
Testing completed consisted of bearings with various dimensions with the most common
bearing size used being 22-in. by 9-in. This bearing size was deemed by the researchers to be the
most typical bridge bearing used in practice today (Stanton et al., 2008). Testing and finite
element analysis completed included both bearings with and without a bonded sole plate. Testing
consisted of various loads and rotations and various cycles of each. Large shear strains
associated with rotation, axial load, and shear deformation resulted in tensile debonding,
followed by shear delamination, and in some test cases, yielding or fracture of the shim occurred.
In general, the tests verified that the principle of superposition of strains is valid for the analysis
of bearings. While this simplified analysis is not technically accurate, comparison between hand
computations and finite element analysis resulted in a difference of less than 7.5 percent.
Furthermore, the researchers found that non-linear effects lessen as the shape factor increases
and become negligible for bearings with shape factors greater than twelve. For bearings with a

0-5834 22
bonded sole plate, hydrostatic tension stresses that occur within the vicinity of the edge of the
shim agreed closely with hand predictions.
From the finite element analysis, a few important concepts have been noted. Stanton and
the other authors note that bearings with a higher durometer and a higher shape factor tend to
perform better under loads. In addition, they also noted that bearings with a high shape factor do
not perform particularly well under high rotations. Next, Stanton and his colleagues concluded
that the approximate linear theory proposed by Gent and others in previous studies seems to
match well with the finite element analysis. Evidence suggests that repeated cyclic loads result
in more damage to the bearing. Lastly, for bearings with a bonded sole plate, hydrostatic tension
stresses that occur within the vicinity of the edge of the shim agreed closely with hand
predictions.
The effects of axial rotation and axial force are influenced by lift-off of a bearing. In the
unloaded region of the bearing where lift-off occurs, the shear strain is small and constant
throughout. In contrast, the remaining loaded region of the bearing undergoes a dramatic
increase in shear strain with the redistribution of axial load. This change is considered a non-
linear effect since the dimensions of the loaded area change with the onset and propagation of
lift-off (Stanton et al., 2008).
The design procedure proposed in NCHRP Report 596 focuses on peak shear strains.
The authors postulate that the compression shear and rotations each cause shear strains if applied
individually and that these strains can be additive. The maximum strains will typically occur
near the edge of the shims. The proposed procedure uses service loads instead of factored loads.
The new design procedure proposes changes to both Method A and Method B of the
AASHTO design procedure. Two additional provisions are recommended for Method A.
Stanton et al. (2008) recommend that Method A not apply in cases where an external bond plate
is used or if S2/n is greater than 16. The latter provision is aimed at avoiding excessive shear
strain at edges with large rotation. For Method B, Stanton et al. (2008) recommend the removal
of the no lift-off provision for bearings (except in the case of the bonded external plate where
hydrostatic tension must be investigated). Instead, they recommend that the strains from cyclic
loads be multiplied by an amplification factor of 2 to account for their effects on bearing
damage. Finally, the authors propose to delete the absolute axial stress provision but keep the

0-5834 23
limit in terms of GS as a final check. The author’s models are provided in Chapter 3 of their
report.
NCHRP Report 596 concludes that steel-reinforced elastomeric bearings are robust and
can sustain visible damage while still carrying the required vertical load to prevent catastrophic
failure. The report clarifies that tension debonding has no adverse effect on performance of
bearing; however, it is the precursor to delamination and as such has been used to determine if a
serviceability failure has occurred. Shim edges that are rounded or burred perform better than
those that are orthogonal (Stanton et al., 2008).
The authors recommend that the effect of creep of the elastomer should be investigated
and considered in design if deemed necessary. Lastly, while the testing in their report consisted
primarily of applying axial loads and rotations to the bearing, the authors concluded that shear
deformation up to 30% did not significantly reduce the number of cycles required for failure.
2.1.10. Conclusions
This literature review provides the background information regarding uniform height
steel-reinforced elastomeric bearings used for Texas U-beam sections placed on a cross slope
matching the superelevation of the bridge. The history of the Texas U-beam, behavior of
elastomeric bearings, design criteria from both AASHTO and TxDOT including recent suggested
changes, and previous finite element models is provided. From this information, the following
conclusions exist:
1. Elastomeric bearings continue to be successful elements for transmitting forces from the
superstructure of a bridge to its substructure while allowing for required deflections and rotations
of the girders.
2. Some, but not much, information exists pertaining to the triaxial state of stress in an
elastomeric bearing. Much of the information that does exist pertains to natural rubber bearings.
TxDOT currently specifies the use of neoprene bearings.
3. Placing the TxDOT U-beam on a superelevated (or cross) slope may load an elastomeric
bearing in a triaxial state introducing a force and rotation in the transverse direction. Further

0-5834 24
investigation into the state of stress of a triaxially loaded bearing is needed to determine the full
extent of the effects of this loading.
4. Finite Element Analysis exists as a tool for an economical analysis of the state of stress in
elastomeric bearings. A finite element model for the state of stress in a triaxially loaded
neoprene bearing may prove to aid in the design of the bearings. The model would need to be
validated with experimental results.
5. Damage to elastomeric bearings is progressive. Tension debonding and delamination are hard
to distinguish without destructive investigations. Thus, tension debonding is the more
conservative representation of the onset of a serviceability failure.
2.2. DOT Questionnaire Survey
A single page questionnaire survey was sent to all 49 states (excluding Texas) plus the
District of Columbia, for a total of 50 questionnaire surveys. The final version of the
questionnaire survey is shown in Figure 2.5. The response rate for the survey was good, with
80% of the surveys returned. The only departments of transportation that did not return the
survey were:
California, Connecticut, District of Columbia, Georgia, Indiana, Iowa, Kentucky,
Massachusetts, New Hampshire, and Vermont.
The full responses to the survey are provided in Appendix 2.1. Although the survey did
not provide specific answers to the two research objectives, the information provided did prove
useful. A summary of the responses to the four questions asked follows.
2.2.1. Question No. 1
The first question was: “Does your state use a precast, prestressed U or Tub section
similar to the Texas U40 U-Beam shown Above?” As shown in Figure 2.6, 8 out of 40 states
(20%) indicated “Yes” they do use a similar section. The remaining 32 responses indicated that

0-5834 25
Figure 2.5 – Final Questionnaire Survey

0-5834 26
Figure 2.6 – Responses to Question No. 1
they do not use a similar section. Although California did not respond, it is known that U-
sections are used in their state. However, the U-sections used in California are often made
integral with the pier for seismic reasons. Therefore, California would not experience the same
concerns caused by transverse slope.
2.2.2. Question No. 2
The second question was: “Do you know of any other states that use a section similar to
the one shown (Please List)?” Seven states (17.5%) responded yes as shown in Figure 2.7. The
states that were indicated were: California, Colorado, Florida, Louisiana, Oregon, and
Washington. Thirty-one states (77.5%) indicated they did not know of any states that use a
similar section. Two states (5%) indicated they possibly knew of a state that used a similar
section. The West Virginia Department of Transportation indicated that Tennessee may have
used a similar section in the 1980’s. The Wisconsin Department of Transportation indicated that
it is possible that Indiana may have used a similar section at one time.
2.2.3. Question No. 3
The third question was: “Does your state allow beam sections to be placed on a slope
matching the slope of the roadway as shown?” The responses were evenly split as shown in
Figure 2.8. Twenty (50%) responded “Yes” and 19 (47.5%) responded “No”. One responded
“Not applicable”. The Florida Department of Transportation indicated they do allow for sections
to be placed on a slope matching the roadway, but only for slopes less than 2%. For greater
0 10 20 30 40
Other, 0
No, 32
Yes, 8
Does your state use a U or Tub section?

0-5834 27
Figure 2.7 – Responses to Question No. 2
Figure 2.8 – Responses to Question No. 3
slopes, a tapered steel sole plate is used. The Montana Department of Transportation indicated
that only certain sections are allowed to be placed on a slope. The South Carolina Department of
Transportation indicated that they do allow U-beam sections to be placed on a matching slope.
The Wyoming Department of Transportation indicated that only Precast I-sections are allowed to
be placed on a matching slope.
The question was intended to address the slope of the roadway in the transverse
(perpendicular to traffic) direction. The picture was provided to clarify this. Unfortunately, it is
possible that some of the respondents assumed that the question asked about matching the slope
in either the transverse or the longitudinal direction.
A follow-up conversation with the Florida Department of Transportation addressed the
2% limit for transverse slopes. It was indicated that the 2% limit for transverse slopes came from
the rule-of-thumb 2% limit for longitudinal slopes which has historically worked well.
0 10 20 30 40
Other, 2
No, 31
Yes, 7
Do you know of other states that use a U or Tub section?
0 5 10 15 20
Other, 1
No, 19
Yes, 20
Do you allow sections to be placed on a slope?

0-5834 28
2.2.4. Question No. 4
The fourth question was: “Does your state use uniform height elastomeric bearing pads to
support members placed on a slope matching the slope of the roadway?” The response to the
fourth question was identical to the response of the third question, as shown in Figure 2.9.
Twenty (50%) of the states indicated “Yes”, 19 states (47.5%) indicated “No”, and one state (2.5
%) indicated not applicable. The Colorado Department of Transportation indicated that most
spans were designed simple and made continuous with only a leveling pad required. The
Pennsylvania Department of Transportation indicated that only prestressed concrete adjacent box
beams are placed parallel to the roadway. The South Carolina Department of Transportation
indicated that “Yes” was for precast deck beam units.
Figure 2.9 – Responses to Question No. 4
2.3. Pontis Element No. 310 – Elastomeric Bearing
One of the two most commonly performed bridge inspections is the Pontis Bridge
Inspection, or the Element Data inspection. Derived from the Latin word for bridge, Pontis
inspections allow the bridge inspector to collect more specific data on individual members,
called elements, of a bridge. Pontis inspections were first performed as early as 1989(National
Cooperative Highway Research Program 2009). Currently, the Texas DOT requires bridge
inspectors to collect element level data in accordance with the TxDOT “Elements” Field
Inspection and Coding Manual.(Texas Department of Transportation 2001)
Elastomeric Bearings are coded as element number 310. When an inspector performs an
Elements Field Inspection (or Pontis Inspection), he or she inspects each bearing and assigns one
of three condition states to the bearing. Although the FHWA provides guidelines on what
0 5 10 15 20
Other, 1
No, 19
Yes, 20
Do you use uniform height elast. bearings for sections on a slope?

0-5834 29
constitutes each condition state, state departments of transportation have taken the FHWA
guidelines and produced more specific state guidelines in an attempt to clarify what condition
state a particular element should be coded. For most elements, including element number 310
elastomeric bearings, the Texas Department of Transportation has adopted the FHWA condition
states. The recommended condition states for element number 310 from eight states including
Texas were investigated. Table 2.2 shows the state, the document that provides the condition
states, and the web address for each document.
Table 2.3 shows the wording used for the Condition State No. 1 for each state. The basic
wording provided by the FHWA is provided at the top of the table. If the wording is the same
for a given state, “Basic Wording” is indicated. The Feasible Actions column shows the
recommended action if the element is coded in this category. DN stands for do nothing. As can
be noted from the table, some states add a significant amount of descriptive material to classify
the condition of the element. Of particular importance for this study is the wording related to the
allowable vertical slope and the bulging of the bearing, neither of which is captured by the basic
wording.
Table 2.4 shows Condition State No. 2 and Table 2.5 shows Condition State No. 3. It
appears that the wording in Condition State No. 3 for Texas is incorrect – this is why it has been
lined out. Several states have adopted slope limitations for the bearings. Although these slopes
are most likely intended for slope of the bearing in the longitudinal direction the information is
useful for considering a slope limitation for the transverse direction. The maximum allowable
slope for Condition State No. 1 is 30 degrees while the maximum allowable slope for Condition
State No. 2 is 45 degrees.

0-5834 30
Table 2.2 – List of State Element Data (Pontis) Documents
State Document Name Web Address
Texas
Texas DOT, "Elements" Field Inspection
and Coding Manual - for the TxDOT
Bridge Management System, Rev. 9-14-
2001
http://onlinemanuals.txdot.gov/txd
otmanuals/ins/field_inspection_m
anual.pdf
ColoradoColorado DOT, "Pontis Bridge Inspection
Coding Guide", Revised October 1998
http://www.dot.state.co.us/Bridge/
Pontis/pontiscovers.pdf
Idaho
Idaho Transportation Department, "Idaho
Bridge Inspection Coding Guide - U.S.
Customary Units", Revised Edition
January 2004
http://itd.idaho.gov/bridge/inspecti
on/BridgeInspectionCodingManual
MichiganMichigan DOT, "Pontis Bridge Inspection
Manual", 2007
http://www.michigan.gov/docume
nts/mdot/MDOT_PontisManual_2
007_195365_7.pdf
MinnesotaMinnesota DOT, "Bridge Inspection
Manual - Version 1.7", April 2008
http://www.dot.state.mn.us/bridge
/manuals/inspection/Bridge%20In
spection%20Manual%20(Version
%201.7%20-
%20Apr%202008).pdf
New JerseyNew Jersey DOT, "Pontis Coding Guide
Manual", 2003
http://www.state.nj.us/transportati
on/eng/structeval/pdf/PontisCodin
gGuide.pdf
OregonOregon DOT, "Bridge Inspection Coding
Guide", 2009
ftp://ftp.odot.state.or.us/Bridge/Co
ding_Guide_Chittrat/2009_Coding
_Guide/ODOT_CodingGuide2009
_BridgeWeb.pdf
VirginiaVirginia DOT, "Element Data Collection
Manual"
http://virginiadot.org/business/res
ources/PONTIS_Element_Data_
Collection_Manual_Modified_by_V
DOT.pdf

0-5834 31
Table 2.3 – Condition State No. 1 for Element No. 310
DOT Description Feasible Actions
Basic WordingThe element shows little or no deterioration. Shear
deformations are correct for existing temperatures.N/A
Texas Basic Wording. None
Colorado Basic Wording. DN
Idaho Basic Wording. None
Michigan "Good". Basic Wording None
Minnesota
Elastomeric expansion bearing is in good condition
and is functioning as intended. The bearing pad is
properly positioned - deformation and orientation is
appropriate for the current temperature. The
elastomeric covering may have superficial
deterioration (the steel reinforcement layers are not
exposed). Pintle plates, restraints, or anchor bolts
(if present) are sound, properly positioned, and
functioning as intended. The bearing seat is in
good condition (there is no loss of bearing area).
None
New Jersey
Basic Wording. *The vertical slope is equal to or
less than 30 degrees. *The slope information is for
guidance only.
Do Nothing.
Oregon
Basic Wording. As a rule of thumb, the maximum
allowable shear deformation is 1/2 the height of the
bearing pad dimension. (1/4 H each side of the
vertical plane). Bulging is considered a noteworthy
deficiency, and excessive bulging is considered to
be more than 15% of "H".
Do Nothing.
Virginia
The element shows little or no deterioration and
has minimal debris and corrosion. The coating
system, if present, is sound and functioning as
intended. Vertical and horizontal alignments are
within limits. For elastomeric bearings the vertical
slope is 0 - 30 degrees. Bearing support is sound.
There is no cracking of support members. Any
lubricating system is functioning properly. The
supported member is stable under traffic.
None

0-5834 32
Table 2.4 – Condition State No. 2 for Element No. 310
DOT Description Feasible Actions
Basic Wording
Minor cracking, splitting or other deterioration may
be present. Shear deformation may be slightly
excessive. Strength and/or serviceability are not
affected.
N/A
Texas Basic Wording. None
Colorado Basic Wording.1) DN
2) Reset Bearings
Idaho Basic Wording. None
Michigan "Fair". Basic Wording. None
Minnesota
Elastomeric expansion bearing has moderate
deterioration - bearing function may be slightly
impared. Bearing pad deformation may be near
design limits (25% of the pad thickness), or the
orientation may be inappropriate for the current
temperature (resetting may be recommended).
The pad may have bulged, deformed laterally, or
moved slightly out of position. The elastomeric
covering may have split or torn (steel reinforcement
layers may be exposed). Pintle plates, restraints,
or anchor bolts (if present) may have moderate
deteriortation, slight binding, or may be slightly out
of position. The bearing seat may have moderate
deteriortation (there may be a slight loss of bearing
area).
None
New Jersey
Basic Wording. *The vertical slope is greater than
30 degrees but less than 45 degrees. *The slope
information is for guidance only.
1) Do Nothing.
2) Reset Bearings
Oregon
Basic Wording. As a rule of thumb, the maximum
total allowable shear deformation is 1/2 the height
of the bearing pad dimension. (1/4 H each side of
the vertical plane). Bulging is considered a
noteworthy deficiency, and excessive bulging is
considered to be more than 15% of "H".
1) Do Nothing.
2) Reset Bearings
Virginia
Basic Wording. Strength and/or the ability of this
element to function as intended are not affected
(the vertical slope is 30 - 45 degrees).
None

0-5834 33
Table 2.5 – Condition State No. 3 for Element No. 310 imminent
DOT Description Feasible Actions
Basic Wording
Advanced deterioration. Shear deformations may
be excessive. Top and bottom surfaces may no
longer be parallel. Loss of bearing support is
imminent.
N/A
Texas
Advanced corrosion of joint armor. There may be
large spalls at the joint edges or adjacent to armor.
Armor anchors are loose.
None.
Colorado Basic Wording.
1) DN
2) Reset Bearings
3) Replace unit & reset
girders
Idaho Basic Wording. None.
Michigan "Poor/Serious". Basic Wording. Replace Element
Minnesota
Elastomeric expansion bearing has severe
deterioration - resetting or replacement may be
required. Bearing pad deformation may be beyond
the design limites (25% of the pad thickness) - the
pad may [be] severely bulged or significantly out of
position. Bearing seat may have severe
deterioration (there may be significant loss of
bearing area) - supplemental supports or load
restrictions may be warranted.
None.
New JerseyBasic Wording. The vertical slope is greater than
45 degrees.
1) Do Nothing
2) Reset Bearings
3) Replace unit & reset
girders
Oregon
Basic Wording. As a rule of thumb, the maximum
total allowable shear deformation is 1/2 the height
of the bearing pad dimension. (1/4 H each side of
the vertical plane). Bulging is considered a
noteworthy deficiency, and excessive bulging is
considered to be more than 15% of "H".
1) Do Nothing
2) Reset Bearings
3) Replace unit / reset
girder
Virginia
Shear deformations may be excessive. Top and
bottom surfaces may no longer be parallel. Loss of
bearing may be imminent. (The vertical slope is
greater than 45 degrees.)
None.

0-5834 34
3. AASHTO DESIGN PROVISIONS
3.1. Current Design Provisions
The TxDOT LRFD Bridge Design Manual (TxDOT, LRFD Bridge Design Manual 2007)
outlines TxDOT’s approach for the design of steel-reinforced elastomeric bearings in Section 2
of Chapter 5. The “Materials” section requires the use of 50-durometer neoprene, a shear
modulus range of 95 to 175 psi (the least favorable value for the design check), steel shim
thickness of 0.105 in., and prohibits the use of adhesives between bearings and other
components. While no limitation exists on the shape factor in the AASHTO standards, TxDOT
sets a target value for the shape factor between 10 and 12 in order to take advantage of the
bearing’s compressive capacity.
The “Geometric Constraint” section allows for the use of tapered bearings as long as the
taper does not exceed 0.055 ft/ft. Additional taper requirements are given, but these provisions
are usually used for I-beam sections instead of U-beam sections. The standard drawings are also
referenced in the section and reproduced in Table 3.1. These standard drawings are available on-
line and are included in Appendix 3-1. (TxDOT, TxDOT Expressway British Standards
(English) 2009)
Table 3.1 - Standard TxDOT U-beam Sheets
Standard Sheet Name Description
- Index Sheet of U-Beams
UBD Prestressed Concrete U-Beam Details
UBEB Elastomeric Bearing and Bearing Seat Details
UBMS Miscellaneous Slab Details
UBND Prestressed Concrete U-Beam (Design Data)
UBTS Thickened Slab End Details
MEBR(U) Minimum Erection and Bracing Requirements
The “Structural Analysis” section states that a temperature change of 70 degrees
Fahrenheit should be used for a conservative estimate of thermal movement after erection (in one
direction). It also indicates that shrinkage, creep, and elastic shortening should not be considered
when determining maximum movement. It is indicated that infrequent slip will accommodate

0-5834 35
these movements. The impact allowance, IM, should not be used when checking compressive
stress. Appropriate shear live load distribution, modified for skew, should be used. The lightest
predicted DL should be used when checking against slip. Load combination Service I should be
used for all gravity loads.
The “Design Criteria” section gives the following additional criteria, reproduced
verbatim from the manual:
Design Criteria
Follow Design Method A in AASHTO LRFD Bridge Design Specifications, Article 14.7.6,
with the following exceptions:
DL compressive stress limit is the lesser of 1.20 ksi and 1.2 GS.
Total compressive stress limit is the lesser of 1.50 ksi and 1.5 GS. This limit can be
exceeded up to 15% at the engineer’s discretion.
For rotation check, disregard AASHTO LRFD Bridge Design Specifications, Article
14.7.6.3.5. Rotation is acceptable if the total compressive deflection equals or exceeds
, where L is the pad length defined in AASHTO LRFD Bridge Design
Specifications, and Θ is the total rotation. Estimate compressive deflection using
AASHTO LRFD Bridge Design Specifications, Figure C14.7.5.3.3-1.
Calculate total rotation for dead and live load plus 0.005 radians for construction
uncertainties as required by AASHTO LRFD Bridge Design Specifications, Article
14.4.2.1. Take maximum live load rotation as 4* Δ/(span length), where Δ is midspan LL
deflection.
Account for pad taper when checking against slip as required by AASHTO LRFD Bridge
Design Specifications, Article14.7.6.4, as follows: Δs ≤(0.2 – Gr)×DLxhrt ⁄(GxA) ,
where Gr = beam grade in ft./ft.
You may use hrt instead of total pad height when checking stability as required in
AASHTO LRFD Bridge Design Specifications, Article 14.7.6.3.6.
In addition to the manuals and specifications listed above, the TxDOT Bridge Detailing
Manual (TxDOT, Bridge Detailing Manual 2001) includes requirements for design and detailing.

0-5834 36
Requirements for bearing seat detailing are located in Chapter 6, Section 9. TxDOT has created
a “Recommended Beam Spacing Table” which provides recommended span lengths, overhangs,
and beam spacings for U-40 and U-54 beams (TxDOT, Superstructure Design Information
2009). The table shows recommendations for U-40 beams to range from a span of 75 ft with an
overhang of 6’-9” and a maximum spacing of 16’-7” to a span of 105 ft with an overhang of 5’-
0” and a maximum spacing of 7’-6”. For U-54 beams, the table shows recommendations from a
span of 75 ft with an overhang of 6’-9” and a maximum spacing of 16’-7” to a span of 120 ft
with an overhang of 5’-0” and a maximum spacing of 10’-3”. A copy of this table is provided in
Section 3.3 of this document.
A “Design Example for Elastomeric Bearings for Prestressed Concrete Beams” is
provided on the TxDOT website (TxDOT, Texas Darment of Transportation: Other Design
Information 2006). This example demonstrates how the TxDOT modifications should be applied
for bearing design. Since the example is pertinent to this project, it is included in Appendix 3.2.
3.2. Theory of the Proposed Modifications to Current Provisions
The current design provisions as outlined in the above section do not contain specific
provisions for consideration of the transverse slope. Therefore, it was necessary to develop a
way to incorporate the transverse slope into the AASHTO design equations. This was
complicated by the fact that some designers believe that steel-reinforced elastomeric bearings
should never be allowed to resist a transverse shear, and thus, the check should never have to be
made. Nonetheless, a force-equilibrium approach was used to determine the loading due to the
transverse slope.
In order to incorporate the transverse slope into the AASHTO LRFD design equations,
the end reaction of the U-beam was first considered in equilibrium. As shown in Figure 3.1, the
end reaction P acts straight down. This reaction can be considered equal to the vector resultant
of the two component vectors parallel and perpendicular to the bearing seat. For a transverse
slope equal to Θ, and assuming small angle theory where the tangent of a small angle is
approximately equal to the angle (in radians), the transverse component is equal to the reaction P
times the transverse slope, Θ. This transverse force, PΘ, is then used to determine a transverse
displacement at the top of the bearing using conventional displacement analysis. This
displacement has been named Delta1.

0-5834 37
Figure 3.1 - Transverse Component PΘ for Delta1 Displacement
Next, since the U-beam sections are so large, the geometry of the section could cause the
end reaction P acting through the centroid of the combined U-beam and deck section to act off-
center of the bearing. This lead to the consideration of a second displacement called Delta2. As
shown in Figure 3.2, the second horizontal displacement is determined by first calculating the
perpendicular distance from the bottom of the U-beam section to the centroid of the combined U-
beam and slab section, Ybottom. This centroid is dependent on the U-section, the 2 in. haunch, and
the width of the slab. The horizontal distance, Delta2, is then determined by multiplying the
Ybottom by the transverse slope Θ in radians.
Figure 3.2 - Geometric Displacement Delta2 caused by YbottΘ=Delta2
Once the two displacements, Delta1 and Delta2, are determined a transverse moment can
be calculated by multiplying the end reaction, P, by the sum of both displacements Delta1 and
Delta2. In a way, this is similar to the consideration of the P-delta effect in column design.

0-5834 38
The standard bearing arrangement (shown in Figure 3.3) for U-beams requires a single
bearing on one end and two smaller bearings at the other end. The plan size of the single bearing
is 2’-8” by 9” while each of the two double bearings are exactly half as big, 1’-4” by 9”. Since
the heights are the same, and the plan area of the single bearing is equal to the combined plan
area of the two double bearings, the transverse deflection Delta1 is theoretically the same for
each.
Figure 3.3 - Single and Double Bearing Plan Configurations
However, since the double bearings are spaced out with at least 11 in. between the inside
edges of the bearings (as shown in Figure 3.3 for a situation with no skew), the resisting
transverse moment of inertia for the double bearing configuration is higher than the resisting
transverse moment of inertia for the single bearing configuration. The moment of inertia, I, for
the single bearing configuration is 24,576 in4 while the moment of inertia for the double bearing
configuration is 58, 632 in4. The resulting section moduli for the single and double pad
configurations are 1,536 in3 and 2,727 in
3, respectively. Theoretically, since the double bearing
configuration has a transverse moment of inertia approximately 2.4 times higher than the single
bearing configuration and a section modulus approximately 1.8 times higher than the single
bearing configuration, the double bearing should be able to resist the transverse moment better
than the single bearing.
3.3. Limits Considered
These proposed revisions were considered for the range of span and U-beam spacings
normally used in Texas. This range, shown in Table 3.2, was taken from the “Recommended

0-5834 39
Table 3.2 - U-beam Recommended Spacings for LRFD

0-5834 40
Beam Spacing” table in the Superstructure Design Recommendation section of the TxDOT
website. (TxDOT, Superstructure Design Information 2009)
3.4. Design Example with Proposed Modifications
For the following example and the summary tables shown in Section 3.5, design
provisions for Prestressed Concrete U-Beams (Types U40 and U54) were obtained from Section
6 of Chapter 3 of the TxDOT LRFD Bridge Design Manual (TxDOT, LRFD Bridge Design
Manual 2007). Requirements to determine the distribution factor for shear, called DFV, were
obtained from the TxDOT spreadsheet “LRFD Distribution Factors” located on the
Superstructure Design section of the TxDOT website (TxDOT, Superstructure Design 2009).
Design live load was determined using standard HL-93 loading which consists of the sum
of the HS20-44 truck and a lane load of 0.64 klf. No impact factor was used in the analysis.
Design dead loads were determined from several sources. Beam properties were taken
from the standard TxDOT drawing UBD dated July 2006 (TxDOT, TxDOT Expressway British
Standards (English) 2009). A self-weight of 1.021 klf was used for the example. A haunch of
0.066 klf was determined by assuming a standard 2 in. haunch over the top flange widths of 1’-3
¾”. The minimum value for the end block (2.65 kips) was determined assuming a 1’-6” block
and the maximum value (3.53 kips) was determined assuming a 2’-0” block. The minimum value
for the interior diaphragm (0.88 kips) was calculated from the standard drawing and the
maximum value for the interior diaphragm (2 kips) was taken from Section 6 of the TxDOT
LRFD Bridge Design manual (TxDOT, LRFD Bridge Design Manual 2007). An 8 in. thick slab
was assumed, which at a unit weight of 0.15 kcf, produces a slab weight of 0.1 times the beam
spacing in feet. Both maximum and minimum dead loads were used in the applicable checks
(i.e. minimum dead load was used in the anchorage slip check).
Properties for the standard bearings, as shown previously in Figure 3.3, were obtained
from the standard U-beam bearing sheet, UBEB, dated July 2006 (TxDOT, TxDOT Expressway
British Standards (English) 2009). On one end of a U-beam, a single bearing sized 32 in. wide
by 9 in. long is used. On the other end of the beam, two bearings each 16 in. wide by 9 in. long
are used. These bearings are located 13 ½ in. each from the longitudinal center line. The standard
bearing for both types has a ¼ in. top and bottom pad thickness, 4 interior layers at 3/8 in. thick,

0-5834 41
and five steel shims at 0.105 in. thick. The one-pad type has a shape factor, S, equal to 9.37 and
the two-pad type has a shape factor equal to 7.68.
Using the above assumptions, all applicable limit states were checked using the
additional moment caused by the transverse slope (the moment caused by the proposed Delta1
and Delta2 displacements). The only limit state that was not affected by the additional transverse
moment was the Stability check. The remaining five limit states, Compressive Stress, Shear
Strain, Anchorage Slip, Compressive Deflection, and Rotation were all modified to include the
effect of the transverse moment. For each limit state, the ratio of the actual state to the allowable
was determined. Therefore a ratio below 1.0 indicates the particular state is OK. If the ratio is
above 1.0 it indicates that the check has failed.
The calculations that consider the proposed changes have been performed in both Excel
and Mathcad. Since Excel calculations can be difficult to follow, a partial example follows in
Mathcad. In addition to the Mathcad example, Excel tabulated results for the typical span
arrangements are provided.
The following example shows the calculations for an interior U40 beam with an effective
span length of 73.5 ft and a U-beam spacing of 16.5 ft. The effective span length from Centerline
to Centerline of bearing of 73.5 ft was determined from Table 3.2 which shows the span length
from Centerline to Centerline of bent. The spacing was rounded down 2 in. for simplicity. The
example assumes a longitudinal slope of 2% and a transverse slope of 3%. The interior DFV
was determined to be 1.394 using the TxDOT spreadsheet “LRFD Distribution Factors”
(TxDOT, Superstructure Design 2009).
First, the dead and live loads are determined as shown in Figure 3.4. Next, the bearing
pad properties for both the single and double pad configurations are calculated as shown in
Figure 3.5. The third step shows the calculation of the Delta1 and Delta2 displacements and the
resulting transverse moment, MT, in Figure 3.6. Again, this proposed moment, MT, is not
explicitly required by LRFD design procedures. The proposed moment is based on the two
displacements, Delta1 and Delta2. The validity of including this moment will be discussed in
later sections of this report.
Figure 3.7 shows the first four checks. All checks show the resulting ratio of the actual
state divided by the allowable state. The “Compressive Stress Check” includes the moment
terms for the transverse moment, MT, for the actual stress equations, fact. The “Shear Strain

0-5834 42
Check” assumes that the U-beams will be in a four-span continuous unit. Therefore the effective
length for expansion is two times a span (or half of the unit length). To account for the
transverse displacement, the total effective displacement, ΔsEff, was determined by calculating
the vector resultant of the transverse and longitudinal displacements. This increases the
displacement from the 0.74 in. to 0.79 in. The “Anchorage Slip Check” determines an effective
slope, Θeffective, as the vector resultant of the transverse and longitudinal slopes. This increases
the slope from 3.0% to 3.6%. For this case, the ratio is calculated to be 1.17. This indicates that
the state has been exceeded by 17%. No modifications have been made to the “Stability Check”
– it is shown merely for completeness.
Figure 3.8 shows the final two checks and the resulting maximum ratio for the single pad
configuration. Equations for the two specific shape factors (S=9.37 for the single pad
configuration and S=7.68 for the double pad configuration) were determined from Figure
C14.7.5.3.3-1 in the AASHTO LRFD Bridge Design Specifications “Compressive Deflection
Check” (AASHTO 2006 with Interims). This allows for the strain to be determined from a
calculation using the actual stress, fact. The best-fit curve equations for the two shape factors are:
Eq. 3.1
Eq. 3.2
where fact is the compressive stress in units of ksi.
The transverse dead load and the transverse live load moments, MTDL and MTLL, are
included in the “Rotation Check”. These terms decrease the stress caused by the vertical load on
one side of the bearing which decreases the allowable strain. Finally, the maximum ratio for all
six cases is determined to be 1.17. This ratio is the controlling ratio for the single pad
configuration. The sample calculation for the double pad configuration is not shown. But, as
expected, the double pad configuration performs better, with a maximum ratio of 0.88.

0-5834 43
Figure 3.4 - Dead and Live Loads
Dead and Live Loads
General Information
span 73.5ft spa 16.5 ft DFV 1.394
Dead Loads
wself 1.021 klf wrail 0.11 klf wbolster 0.066 klf
wslab 0.1kip
ft2
spa wslab 1.65 klf
wovermin 0 klf wovermax 0.023kip
ft2
spa wovermax 0.38 klf
pebmin 2.65 kip pebmax 3.53kip
pintdiamin 0.88kip pintdiamax 2kip
RDminspan
2wself wrail wbolster wslab wovermin pebmin pintdiamin
RDmin 108.157kip
RDmaxspan
2wself wrail wbolster wslab wovermax pebmax pintdiamax
RDmax 124.104kip
Live Loads
RL1 32kip 32kipspan 14ft
span8kip
span 28ft
spanRL1 62.857kip
RL2 0.64klfspan
2RL2 23.52 kip
RLL DFV RL1 RL2 RLL 120.41kip

0-5834 44
Figure 3.5 - Bearing Pad Properties
Bearing Properties
hs 0.105 in hro 0.25 in nro 2 hrto hro nro
hrto 0.5 in hri 0.375 in nri 4 hrti hri nri
hrti 1.5 in hrt hrto hrti hrt 2 in T hrt nro nri 1 hs
T 2.525 in d2 13.5in
One Pad Properties
W1 32in L1 9in A1 W1 L1 A1 288in2
A1b W1 L1 2 hri A1b 30.75 in2
S1
A1
A1bS1 9.366
IT1
L1 W13
12IT1 24576in
4ST1
IT1
W1
2
ST1 1536in3
Two Pad Properties
W2 16in L2 9in A2 W2 L2 A2 144in2
A2b W2 L2 2 hri A2b 18.75 in2
S2
A2
A2bS2 7.68
IT2 2L2 W2
3
122 L2 W2 d2
2IT2 58632in
4
ST2
IT2
d2
W2
2
ST2 2727in3

0-5834 45
Figure 3.6 - Delta1 and Delta2 Displacements
Transverse Loads
Delta1 Displacement
T 0.03 L 0.02 Glow 0.095ksi Ghigh 0.175ksi
PD RDmax PD 124.104kip PLL RLL PLL 120.41kip
Delta1D
PD T hrt
Glow A1Delta1D 0.27 in
Delta1LL
PLL T hrt
Glow A1Delta1LL 0.26 in
Delta2 Displacement
Ybott 34.80in Delta2 Ybott T Delta2 1.044 in
MTDL Delta1D Delta2 PD MTDL 163.34kip in
MTLL Delta1LL Delta2 PLL MTLL 157.503kip in
MT MTDL MTLL MT 320.843kip in

0-5834 46
Figure 3.7 – Single Pad Configuration Checks
One Pad Checks
Compressive Stress Check
fall min 1.2ksi 1.2 Glow S1 fall 1.068 ksi
fact
PD
A1
MTDL
ST1fact 0.537 ksi Ratio
1
fact
fallRatio
10.50
fall min 1.5ksi 1.5 Glow S1 fall 1.335 ksi
fact
PD PLL
A1
MTDL MTLL
ST1fact 1.058 ksi Ratio
2
fact
fallRatio
20.79
Shear Strain Check
0.000006 DeltaT 70 Span 73.5ft
s1 DeltaT Span 2 s1 0.741 in Delta1D 0.272 in
sEff s12
Delta1D2
sEff 0.789 in
hrt 2 inRatio
3
2 sEff
hrtRatio
30.79
Anchorage Slip Check
p 0.9 effective 0.036 Limit 0.2effective T
2L
2
1
2
s2
Limit effective p RDmin hrt
Ghigh A1s2 0.633 in
Ratio4
s1
s2Ratio
41.17
Stability Check
hrtall minL1
3
W1
3hrtall 3 in Ratio
5
hrt
hrtallRatio
50.67

0-5834 47
Figure 3.8 - Single Pad Configuration Checks (Cont.)
One Pad Checks (Continued)
Compressive Deflection Check
S1 9.366 fact 1.058 ksi fact0.726
ksi2
fact2 5.194
ksifact fact 4.682
creep 0.25
act 1 creep( )fact
100hri act 0.022 in
all 0.07 hri all 0.026 in
Ratio6
act
allRatio
60.836
Rotation Check
fmin
PD PLL
A1
MTDL MTLL
ST1fmin 0.64 ksi
fmin 3.027 2all
fmin hrt
100 2all 0.061 in
LLestSpan
800 LLest 1.103 in LLest
4 LLest
span LLest 0.005
CT 0.005
2actLLest CT 0.8 L2
2 2act 0.036 in
Ratio7
2act
2allRatio
70.595
Ratio
0
0.5
0.79
0.79
1.17
0.67
0.84
0.59
max Ratio( ) 1.17

0-5834 48
3.4.1. Discussion of Design Example
Considering the proposed Delta1 and Delta2 displacements and the resulting transverse
moment, MT, resulted in a worst case ratio of 1.17 with the Anchorage Slip check as the
controlling case. Eliminating the transverse slope of 3% reduces the ratio to 1.07. Eliminating
both the transverse slope of 3% and the longitudinal slope of 2% reduces the ratio to 0.96, which
is less than 1, indicating that all design states meet design criteria.
It was expected that the standard bearings should meet design criteria when both the
transverse and longitudinal slopes are zero. In general, this was found to be the case. To
illustrate the influence of the transverse slope, Excel charts were created for the typical span and
spacing for both U-40 and U-54 beams. These charts are shown in the following section.
3.5. Summary of Design States
The six design states were considered for both U-40 and U-54 sections over the typically
used ranges of span length and spacings considering the effect of the transverse superelevation.
The transverse superelevation is shown for values of 0%, 2%, 4%, 6%, and 8%. The first five
tables, Tables 3.4 through 3.8, show the values for the U-40 sections while the next five tables,
Tables 3.9 through 3.13, show the values for the U-54 sections.
Within each table, the longitudinal and transverse slopes are kept constant (i.e. 0% for the
first table) but the number of spans changes from 2 to 3 to 4. The number of spans indicates the
type of span unit. It was assumed that a 2 span unit would have an effective length for expansion
of 1 span, a 3 span unit would have an effective length of expansion of 1.5 spans, and a 4 span
unit would have an effective length of expansion of 2 spans. The tables are presented in this
manner so that the effect of span length could easily be seen.
For a given span unit, the top portion shows the highest ratio for all six of the limit states.
Ratios less than or equal to 1.0 are shown in green, ratios greater than 1.0 but less than or equal
to 1.25 are shown in yellow, and ratios above 1.25 are shown in red. The bottom portion shows
which of the limit states controls (has the highest ratio). The limit states are shown abbreviated
using the abbreviations in Table 3.3.

0-5834 49
Table 3.3 - Design Limit State Abbreviations
Design Limit State Name Abbreviation
Compressive Stress Check Comp
Shear Strain Check SS
Anchorage Slip Check Slip
Stability Check Stab
Compressive Deflection Check C Def
Rotation Check Rot

0-5834 50
Table 3.4 - U40 with 0% Transverse Slope
Interior Beams Long. Slope 0 Trans. Slope 0 Spans 2
Span, ft 16.5 16 14.5 14 13.5 12.5 12 11.5 11 10.5 10 9.5 9 8.5 8 7.5
73.5 0.50 0.71 0.67 0.67 0.68
78.5 0.81 0.74 0.67 0.67 0.67
83.5 0.82 0.75 0.68 0.67 0.68
88.5 0.76 0.69 0.67 0.70
93.5 0.69 0.67
98.5 0.67 0.70
103.5 0.70
Spacing, ft
Interior Beams Long. Slope 0 Trans. Slope 0 Spans 2
Span, ft 16.5 16 14.5 14 13.5 12.5 12 11.5 11 10.5 10 9.5 9 8.5 8 7.5
73.5 Comp Comp Stab Stab Rot
78.5 Comp Comp C Def Stab Stab
83.5 Comp Comp C Def Stab Slip
88.5 Comp C Def Stab Slip
93.5 C Def Stab
98.5 Stab Slip
103.5 Slip
Spacing, ft
Interior Beams Long. Slope 0 Trans. Slope 0 Spans 3
Span, ft 16.5 16 14.5 14 13.5 12.5 12 11.5 11 10.5 10 9.5 9 8.5 8 7.5
73.5 0.78 0.77 0.83 0.90 0.99
78.5 0.81 0.77 0.83 0.91 0.99
83.5 0.82 0.79 0.85 0.93 1.02
88.5 0.81 0.87 0.95 1.04
93.5 0.89 0.97
98.5 0.95 1.05
103.5 1.05
Spacing, ft
Interior Beams Long. Slope 0 Trans. Slope 0 Spans 3
Span, ft 16.5 16 14.5 14 13.5 12.5 12 11.5 11 10.5 10 9.5 9 8.5 8 7.5
73.5 Comp Slip Slip Slip Slip
78.5 Comp Slip Slip Slip Slip
83.5 Comp Slip Slip Slip Slip
88.5 Slip Slip Slip Slip
93.5 Slip Slip
98.5 Slip Slip
103.5 Slip
Spacing, ft
Interior Beams Long. Slope 0 Trans. Slope 0 Spans 4
Span, ft 16.5 16 14.5 14 13.5 12.5 12 11.5 11 10.5 10 9.5 9 8.5 8 7.5
73.5 0.96 1.03 1.11 1.20 1.32
78.5 0.96 1.03 1.11 1.21 1.32
83.5 0.98 1.05 1.14 1.24 1.36
88.5 1.07 1.16 1.27 1.39
93.5 1.19 1.30
98.5 1.27 1.40
103.5 1.40
Spacing, ft
Interior Beams Long. Slope 0 Trans. Slope 0 Spans 4
Span, ft 16.5 16 14.5 14 13.5 12.5 12 11.5 11 10.5 10 9.5 9 8.5 8 7.5
73.5 Slip Slip Slip Slip Slip
78.5 Slip Slip Slip Slip Slip
83.5 Slip Slip Slip Slip Slip
88.5 Slip Slip Slip Slip
93.5 Slip Slip
98.5 Slip Slip
103.5 Slip
Spacing, ft

0-5834 51
Table 3.5 - U40 with 2% Transverse Superelevation
Interior Beams Long. Slope 0 Trans. Slope 0.02 Spans 2
Span, ft 16.5 16 14.5 14 13.5 12.5 12 11.5 11 10.5 10 9.5 9 8.5 8 7.5
73.5 0.85 0.77 0.70 0.70 0.78
78.5 0.88 0.81 0.73 0.67 0.75
83.5 0.90 0.82 0.74 0.69 0.75
88.5 0.83 0.74 0.70 0.77
93.5 0.75 0.72
98.5 0.71 0.78
103.5 0.78
Spacing, ft
Interior Beams Long. Slope 0 Trans. Slope 0.02 Spans 2
Span, ft 16.5 16 14.5 14 13.5 12.5 12 11.5 11 10.5 10 9.5 9 8.5 8 7.5
73.5 Comp Comp C Def Rot Rot
78.5 Comp Comp Com Rot Rot
83.5 Comp Comp Com Slip Slip
88.5 Comp Comp Slip Slip
93.5 Comp Slip
98.5 Comp Slip
103.5 Slip
Spacing, ft
Interior Beams Long. Slope 0 Trans. Slope 0.02 Spans 3
Span, ft 16.5 16 14.5 14 13.5 12.5 12 11.5 11 10.5 10 9.5 9 8.5 8 7.5
73.5 0.85 0.86 0.92 1.00 1.10
78.5 0.88 0.86 0.93 1.01 1.10
83.5 0.90 0.88 0.95 1.03 1.13
88.5 0.90 0.97 1.06 1.16
93.5 0.99 1.08
98.5 1.06 1.17
103.5 1.17
Spacing, ft
Interior Beams Long. Slope 0 Trans. Slope 0.02 Spans 3
Span, ft 16.5 16 14.5 14 13.5 12.5 12 11.5 11 10.5 10 9.5 9 8.5 8 7.5
73.5 Comp Slip Slip Slip Slip
78.5 Comp Slip Slip Slip Slip
83.5 Comp Slip Slip Slip Slip
88.5 Slip Slip Slip Slip
93.5 Slip Slip
98.5 Slip Slip
103.5 Slip
Spacing, ft
Interior Beams Long. Slope 0 Trans. Slope 0.02 Spans 4
Span, ft 16.5 16 14.5 14 13.5 12.5 12 11.5 11 10.5 10 9.5 9 8.5 8 7.5
73.5 1.07 1.14 1.23 1.34 1.46
78.5 1.07 1.15 1.24 1.34 1.47
83.5 1.09 1.17 1.26 1.37 1.51
88.5 1.19 1.29 1.41 1.55
93.5 1.32 1.44
98.5 1.41 1.55
103.5 1.56
Spacing, ft
Interior Beams Long. Slope 0 Trans. Slope 0.02 Spans 4
Span, ft 16.5 16 14.5 14 13.5 12.5 12 11.5 11 10.5 10 9.5 9 8.5 8 7.5
73.5 Slip Slip Slip Slip Slip
78.5 Slip Slip Slip Slip Slip
83.5 Slip Slip Slip Slip Slip
88.5 Slip Slip Slip Slip
93.5 Slip Slip
98.5 Slip Slip
103.5 Slip
Spacing, ft

0-5834 52
Table 3.6 - U40 with 4% Transverse Superelevation
Interior Beams Long. Slope 0 Trans. Slope 0.04 Spans 2
Span, ft 16.5 16 14.5 14 13.5 12.5 12 11.5 11 10.5 10 9.5 9 8.5 8 7.5
73.5 0.92 0.84 0.76 0.83 0.91
78.5 0.96 0.87 0.78 0.80 0.88
83.5 0.98 0.89 0.79 0.79 0.87
88.5 0.90 0.80 0.79 0.87
93.5 0.81 0.81
98.5 0.80 0.87
103.5 0.88
Spacing, ft
Interior Beams Long. Slope 0 Trans. Slope 0.04 Spans 2
Span, ft 16.5 16 14.5 14 13.5 12.5 12 11.5 11 10.5 10 9.5 9 8.5 8 7.5
73.5 Comp Comp Rot Rot Rot
78.5 Comp Comp Comp Rot Rot
83.5 Comp Comp Comp Rot Rot
88.5 Comp Comp Slip Slip
93.5 Comp Slip
98.5 Slip Slip
103.5 Slip
Spacing, ft
Interior Beams Long. Slope 0 Trans. Slope 0.04 Spans 3
Span, ft 16.5 16 14.5 14 13.5 12.5 12 11.5 11 10.5 10 9.5 9 8.5 8 7.5
73.5 0.92 0.96 1.04 1.13 1.23
78.5 0.96 0.97 1.04 1.13 1.24
83.5 0.98 0.99 1.07 1.16 1.27
88.5 1.01 1.09 1.19 1.31
93.5 1.12 1.22
98.5 1.19 1.31
103.5 1.31
Spacing, ft
Interior Beams Long. Slope 0 Trans. Slope 0.04 Spans 3
Span, ft 16.5 16 14.5 14 13.5 12.5 12 11.5 11 10.5 10 9.5 9 8.5 8 7.5
73.5 Comp Slip Slip Slip Slip
78.5 Comp Slip Slip Slip Slip
83.5 Comp Slip Slip Slip Slip
88.5 Slip Slip Slip Slip
93.5 Slip Slip
98.5 Slip Slip
103.5 Slip
Spacing, ft
Interior Beams Long. Slope 0 Trans. Slope 0.04 Spans 4
Span, ft 16.5 16 14.5 14 13.5 12.5 12 11.5 11 10.5 10 9.5 9 8.5 8 7.5
73.5 1.20 1.29 1.39 1.51 1.65
78.5 1.20 1.29 1.39 1.51 1.65
83.5 1.22 1.32 1.42 1.55 1.69
88.5 1.34 1.45 1.58 1.74
93.5 1.49 1.62
98.5 1.59 1.75
103.5 1.75
Spacing, ft
Interior Beams Long. Slope 0 Trans. Slope 0.04 Spans 4
Span, ft 16.5 16 14.5 14 13.5 12.5 12 11.5 11 10.5 10 9.5 9 8.5 8 7.5
73.5 Slip Slip Slip Slip Slip
78.5 Slip Slip Slip Slip Slip
83.5 Slip Slip Slip Slip Slip
88.5 Slip Slip Slip Slip
93.5 Slip Slip
98.5 Slip Slip
103.5 Slip
Spacing, ft

0-5834 53
Table 3.7 - U40 with 6% Transverse Superelevation
Interior Beams Long. Slope 0 Trans. Slope 0.06 Spans 2
Span, ft 16.5 16 14.5 14 13.5 12.5 12 11.5 11 10.5 10 9.5 9 8.5 8 7.5
73.5 0.99 0.90 0.95 1.02 1.11
78.5 1.03 0.94 0.92 0.99 1.07
83.5 1.05 0.95 0.91 0.97 1.06
88.5 0.97 0.90 0.96 1.05
93.5 0.89 0.95
98.5 0.91 1.00
103.5 1.00
Spacing, ft
Interior Beams Long. Slope 0 Trans. Slope 0.06 Spans 2
Span, ft 16.5 16 14.5 14 13.5 12.5 12 11.5 11 10.5 10 9.5 9 8.5 8 7.5
73.5 Comp Rot Rot Rot Rot
78.5 Comp Comp Rot Rot Rot
83.5 Comp Comp Rot Rot Rot
88.5 Comp Rot Rot Rot
93.5 Rot Rot
98.5 Rot Slip
103.5 Slip
Spacing, ft
Interior Beams Long. Slope 0 Trans. Slope 0.06 Spans 3
Span, ft 16.5 16 14.5 14 13.5 12.5 12 11.5 11 10.5 10 9.5 9 8.5 8 7.5
73.5 1.03 1.10 1.19 1.29 1.41
78.5 1.03 1.10 1.19 1.29 1.42
83.5 1.05 1.13 1.22 1.33 1.45
88.5 1.15 1.25 1.36 1.49
93.5 1.27 1.39
98.5 1.36 1.50
103.5 1.50
Spacing, ft
Interior Beams Long. Slope 0 Trans. Slope 0.06 Spans 3
Span, ft 16.5 16 14.5 14 13.5 12.5 12 11.5 11 10.5 10 9.5 9 8.5 8 7.5
73.5 Slip Slip Slip Slip Slip
78.5 Comp Slip Slip Slip Slip
83.5 Comp Slip Slip Slip Slip
88.5 Slip Slip Slip Slip
93.5 Slip Slip
98.5 Slip Slip
103.5 Slip
Spacing, ft
Interior Beams Long. Slope 0 Trans. Slope 0.06 Spans 4
Span, ft 16.5 16 14.5 14 13.5 12.5 12 11.5 11 10.5 10 9.5 9 8.5 8 7.5
73.5 1.37 1.47 1.59 1.72 1.88
78.5 1.37 1.47 1.59 1.73 1.89
83.5 1.40 1.50 1.62 1.77 1.94
88.5 1.53 1.66 1.81 1.99
93.5 1.70 1.86
98.5 1.82 2.00
103.5 2.00
Spacing, ft
Interior Beams Long. Slope 0 Trans. Slope 0.06 Spans 4
Span, ft 16.5 16 14.5 14 13.5 12.5 12 11.5 11 10.5 10 9.5 9 8.5 8 7.5
73.5 Slip Slip Slip Slip Slip
78.5 Slip Slip Slip Slip Slip
83.5 Slip Slip Slip Slip Slip
88.5 Slip Slip Slip Slip
93.5 Slip Slip
98.5 Slip Slip
103.5 Slip
Spacing, ft

0-5834 54
Table 3.8 - U40 with 8% Transverse Superelevation
Interior Beams Long. Slope 0 Trans. Slope 0.08 Spans 2
Span, ft 16.5 16 14.5 14 13.5 12.5 12 11.5 11 10.5 10 9.5 9 8.5 8 7.5
73.5 1.24 1.26 1.30 1.35 1.42
78.5 1.21 1.23 1.26 1.31 1.37
83.5 1.19 1.21 1.24 1.29 1.35
88.5 1.19 1.22 1.27 1.34
93.5 1.20 1.25
98.5 1.21 1.27
103.5 1.24
Spacing, ft
Interior Beams Long. Slope 0 Trans. Slope 0.08 Spans 2
Span, ft 16.5 16 14.5 14 13.5 12.5 12 11.5 11 10.5 10 9.5 9 8.5 8 7.5
73.5 Rot Rot Rot Rot Rot
78.5 Rot Rot Rot Rot Rot
83.5 Rot Rot Rot Rot Rot
88.5 Rot Rot Rot Rot
93.5 Rot Rot
98.5 Rot Rot
103.5 Rot
Spacing, ft
Interior Beams Long. Slope 0 Trans. Slope 0.08 Spans 3
Span, ft 16.5 16 14.5 14 13.5 12.5 12 11.5 11 10.5 10 9.5 9 8.5 8 7.5
73.5 1.24 1.29 1.39 1.51 1.65
78.5 1.21 1.29 1.39 1.51 1.65
83.5 1.22 1.32 1.42 1.55 1.69
88.5 1.34 1.45 1.58 1.74
93.5 1.49 1.62
98.5 1.59 1.75
103.5 1.75
Spacing, ft
Interior Beams Long. Slope 0 Trans. Slope 0.08 Spans 3
Span, ft 16.5 16 14.5 14 13.5 12.5 12 11.5 11 10.5 10 9.5 9 8.5 8 7.5
73.5 Rot Slip Slip Slip Slip
78.5 Rot Slip Slip Slip Slip
83.5 Slip Slip Slip Slip Slip
88.5 Slip Slip Slip Slip
93.5 Slip Slip
98.5 Slip Slip
103.5 Slip
Spacing, ft
Interior Beams Long. Slope 0 Trans. Slope 0.08 Spans 4
Span, ft 16.5 16 14.5 14 13.5 12.5 12 11.5 11 10.5 10 9.5 9 8.5 8 7.5
73.5 1.60 1.71 1.85 2.01 2.19
78.5 1.60 1.72 1.85 2.01 2.20
83.5 1.63 1.75 1.90 2.06 2.26
88.5 1.79 1.94 2.11 2.32
93.5 1.98 2.17
98.5 2.12 2.33
103.5 2.33
Spacing, ft
Interior Beams Long. Slope 0 Trans. Slope 0.08 Spans 4
Span, ft 16.5 16 14.5 14 13.5 12.5 12 11.5 11 10.5 10 9.5 9 8.5 8 7.5
73.5 Slip Slip Slip Slip Slip
78.5 Slip Slip Slip Slip Slip
83.5 Slip Slip Slip Slip Slip
88.5 Slip Slip Slip Slip
93.5 Slip Slip
98.5 Slip Slip
103.5 Slip
Spacing, ft

0-5834 55
Table 3.9 - U54 with 0% Transverse Slope
Interior Beams Long. Slope 0 Trans. Slope 0 Spans 2
Span, ft 16.5 16 14.5 14 13.5 12.5 12 11.5 11 10.5 10 9.5 9 8.5
73.5 0.81 0.75 0.77 0.83 0.90
78.5 0.85 0.78 0.78 0.84 0.91
83.5 0.88 0.81 0.78 0.84 0.91
88.5 0.91 0.84 0.78 0.84 0.91
93.5 0.95 0.87 0.79 0.84 0.92
98.5 0.98 0.90 0.82 0.85 0.92
103.5 0.91 0.83 0.86
108.5 0.85 0.87
113.5 0.87
118.5 0.90
Spacing, ft
Interior Beams Long. Slope 0 Trans. Slope 0 Spans 2
Span, ft 16.5 16 14.5 14 13.5 12.5 12 11.5 11 10.5 10 9.5 9 8.5
73.5 Comp Comp Slip Slip Slip
78.5 Comp Comp Slip Slip Slip
83.5 Comp Comp Slip Slip Slip
88.5 Comp Comp Slip Slip Slip
93.5 Comp Comp Comp Slip Slip
98.5 Comp Comp Comp Slip Slip
103.5 Comp Comp Slip
108.5 Comp Slip
113.5 Slip
118.5 SS
Spacing, ft
Interior Beams Long. Slope 0 Trans. Slope 0 Spans 3
Span, ft 16.5 16 14.5 14 13.5 12.5 12 11.5 11 10.5 10 9.5 9 8.5
73.5 0.81 0.75 0.77 0.83 0.90
78.5 0.85 0.78 0.78 0.84 0.91
83.5 0.88 0.81 0.78 0.84 0.91
88.5 0.91 0.84 0.78 0.84 0.91
93.5 0.95 0.87 0.79 0.84 0.92
98.5 0.98 0.90 0.82 0.85 0.92
103.5 0.91 0.83 0.86
108.5 0.85 0.87
113.5 0.87
118.5 0.90
Spacing, ft
Interior Beams Long. Slope 0 Trans. Slope 0 Spans 3
Span, ft 16.5 16 14.5 14 13.5 12.5 12 11.5 11 10.5 10 9.5 9 8.5
73.5 Comp Comp Slip Slip Slip
78.5 Comp Comp Slip Slip Slip
83.5 Comp Comp Slip Slip Slip
88.5 Comp Comp Slip Slip Slip
93.5 Comp Comp Comp Slip Slip
98.5 Comp Comp Comp Slip Slip
103.5 Comp Comp Slip
108.5 Comp Slip
113.5 Slip
118.5 SS
Spacing, ft

0-5834 56
Interior Beams Long. Slope 0 Trans. Slope 0 Spans 4
Span, ft 16.5 16 14.5 14 13.5 12.5 12 11.5 11 10.5 10 9.5 9 8.5
73.5 0.90 0.96 1.03 1.11 1.21
78.5 0.90 0.96 1.03 1.12 1.21
83.5 0.90 0.97 1.04 1.12 1.22
88.5 0.91 0.97 1.04 1.12 1.22
93.5 0.95 0.97 1.04 1.13 1.22
98.5 0.99 0.99 1.04 1.13 1.23
103.5 1.04 1.07 1.15
108.5 1.09 1.16
113.5 1.16
118.5 1.19
Spacing, ft
Interior Beams Long. Slope 0 Trans. Slope 0 Spans 4
Span, ft 16.5 16 14.5 14 13.5 12.5 12 11.5 11 10.5 10 9.5 9 8.5
73.5 Slip Slip Slip Slip Slip
78.5 Slip Slip Slip Slip Slip
83.5 Slip Slip Slip Slip Slip
88.5 Comp Slip Slip Slip Slip
93.5 Comp Slip Slip Slip Slip
98.5 SS SS Slip Slip Slip
103.5 SS Slip Slip
108.5 SS Slip
113.5 Slip
118.5 SS
Spacing, ft

0-5834 57
Table 3.10 - U54 with 2% Transverse Superelevation
Interior Beams Long. Slope 0 Trans. Slope 0.02 Spans 2
Span, ft 16.5 16 14.5 14 13.5 12.5 12 11.5 11 10.5 10 9.5 9 8.5
73.5 0.91 0.83 0.86 0.93 1.01
78.5 0.95 0.86 0.86 0.93 1.01
83.5 0.98 0.90 0.86 0.93 1.01
88.5 1.02 0.93 0.87 0.94 1.02
93.5 1.06 0.97 0.88 0.94 1.02
98.5 1.10 1.00 0.91 0.94 1.02
103.5 1.01 0.92 0.96
108.5 0.95 0.96
113.5 0.96
118.5 0.97
Spacing, ft
Interior Beams Long. Slope 0 Trans. Slope 0.02 Spans 2
Span, ft 16.5 16 14.5 14 13.5 12.5 12 11.5 11 10.5 10 9.5 9 8.5
73.5 Comp Comp Slip Slip Slip
78.5 Comp Comp Slip Slip Slip
83.5 Comp Comp Slip Slip Slip
88.5 Comp Comp Slip Slip Slip
93.5 Comp Comp Comp Slip Slip
98.5 Comp Comp Comp Slip Slip
103.5 Comp Comp Slip
108.5 Comp Slip
113.5 Slip
118.5 Slip
Spacing, ft
Interior Beams Long. Slope 0 Trans. Slope 0.02 Spans 3
Span, ft 16.5 16 14.5 14 13.5 12.5 12 11.5 11 10.5 10 9.5 9 8.5
73.5 0.91 0.83 0.86 0.93 1.01
78.5 0.95 0.86 0.86 0.93 1.01
83.5 0.98 0.90 0.86 0.93 1.01
88.5 1.02 0.93 0.87 0.94 1.02
93.5 1.06 0.97 0.88 0.94 1.02
98.5 1.10 1.00 0.91 0.94 1.02
103.5 1.01 0.92 0.96
108.5 0.95 0.96
113.5 0.96
118.5 0.97
Spacing, ft
Interior Beams Long. Slope 0 Trans. Slope 0.02 Spans 3
Span, ft 16.5 16 14.5 14 13.5 12.5 12 11.5 11 10.5 10 9.5 9 8.5
73.5 Comp Comp Slip Slip Slip
78.5 Comp Comp Slip Slip Slip
83.5 Comp Comp Slip Slip Slip
88.5 Comp Comp Slip Slip Slip
93.5 Comp Comp Comp Slip Slip
98.5 Comp Comp Comp Slip Slip
103.5 Comp Comp Slip
108.5 Comp Slip
113.5 Slip
118.5 Slip
Spacing, ft

0-5834 58
Interior Beams Long. Slope 0 Trans. Slope 0.02 Spans 4
Span, ft 16.5 16 14.5 14 13.5 12.5 12 11.5 11 10.5 10 9.5 9 8.5
73.5 1.00 1.07 1.14 1.23 1.34
78.5 1.00 1.07 1.15 1.24 1.35
83.5 1.00 1.07 1.15 1.24 1.35
88.5 1.02 1.08 1.15 1.25 1.35
93.5 1.06 1.08 1.16 1.25 1.36
98.5 1.10 1.08 1.16 1.25 1.36
103.5 1.10 1.18 1.28
108.5 1.19 1.28
113.5 1.29
118.5 1.29
Spacing, ft
Interior Beams Long. Slope 0 Trans. Slope 0.02 Spans 4
Span, ft 16.5 16 14.5 14 13.5 12.5 12 11.5 11 10.5 10 9.5 9 8.5
73.5 Slip Slip Slip Slip Slip
78.5 Slip Slip Slip Slip Slip
83.5 Slip Slip Slip Slip Slip
88.5 Comp Slip Slip Slip Slip
93.5 Comp Slip Slip Slip Slip
98.5 Comp Slip Slip Slip Slip
103.5 Slip Slip Slip
108.5 Slip Slip
113.5 Slip
118.5 Slip
Spacing, ft

0-5834 59
Table 3.11 - U54 with 4% Transverse Superelevation
Interior Beams Long. Slope 0 Trans. Slope 0.04 Spans 2
Span, ft 16.5 16 14.5 14 13.5 12.5 12 11.5 11 10.5 10 9.5 9 8.5
73.5 1.00 0.91 0.97 1.04 1.13
78.5 1.04 0.95 0.97 1.05 1.14
83.5 1.09 0.99 0.97 1.05 1.14
88.5 1.13 1.03 0.97 1.05 1.14
93.5 1.17 1.07 0.98 1.05 1.15
98.5 1.21 1.11 1.00 1.06 1.15
103.5 1.12 1.01 1.08
108.5 1.04 1.08
113.5 1.09
118.5 1.09
Spacing, ft
Interior Beams Long. Slope 0 Trans. Slope 0.04 Spans 2
Span, ft 16.5 16 14.5 14 13.5 12.5 12 11.5 11 10.5 10 9.5 9 8.5
73.5 Comp Comp Slip Slip Slip
78.5 Comp Comp Slip Slip Slip
83.5 Comp Comp Slip Slip Slip
88.5 Comp Comp Slip Slip Slip
93.5 Comp Comp Slip Slip Slip
98.5 Comp Comp Comp Slip Slip
103.5 Comp Comp Slip
108.5 Comp Slip
113.5 Slip
118.5 Slip
Spacing, ft
Interior Beams Long. Slope 0 Trans. Slope 0.04 Spans 3
Span, ft 16.5 16 14.5 14 13.5 12.5 12 11.5 11 10.5 10 9.5 9 8.5
73.5 1.00 0.91 0.97 1.04 1.13
78.5 1.04 0.95 0.97 1.05 1.14
83.5 1.09 0.99 0.97 1.05 1.14
88.5 1.13 1.03 0.97 1.05 1.14
93.5 1.17 1.07 0.98 1.05 1.15
98.5 1.21 1.11 1.00 1.06 1.15
103.5 1.12 1.01 1.08
108.5 1.04 1.08
113.5 1.09
118.5 1.09
Spacing, ft
Interior Beams Long. Slope 0 Trans. Slope 0.04 Spans 3
Span, ft 16.5 16 14.5 14 13.5 12.5 12 11.5 11 10.5 10 9.5 9 8.5
73.5 Comp Comp Slip Slip Slip
78.5 Comp Comp Slip Slip Slip
83.5 Comp Comp Slip Slip Slip
88.5 Comp Comp Slip Slip Slip
93.5 Comp Comp Slip Slip Slip
98.5 Comp Comp Comp Slip Slip
103.5 Comp Comp Slip
108.5 Comp Slip
113.5 Slip
118.5 Slip
Spacing, ft

0-5834 60
Interior Beams Long. Slope 0 Trans. Slope 0.04 Spans 4
Span, ft 16.5 16 14.5 14 13.5 12.5 12 11.5 11 10.5 10 9.5 9 8.5
73.5 1.12 1.20 1.29 1.39 1.51
78.5 1.13 1.20 1.29 1.39 1.51
83.5 1.13 1.21 1.30 1.40 1.52
88.5 1.13 1.21 1.30 1.40 1.52
93.5 1.17 1.21 1.30 1.41 1.53
98.5 1.21 1.22 1.31 1.41 1.53
103.5 1.24 1.33 1.44
108.5 1.33 1.44
113.5 1.45
118.5 1.45
Spacing, ft
Interior Beams Long. Slope 0 Trans. Slope 0.04 Spans 4
Span, ft 16.5 16 14.5 14 13.5 12.5 12 11.5 11 10.5 10 9.5 9 8.5
73.5 Slip Slip Slip Slip Slip
78.5 Slip Slip Slip Slip Slip
83.5 Slip Slip Slip Slip Slip
88.5 Slip Slip Slip Slip Slip
93.5 Comp Slip Slip Slip Slip
98.5 Comp Slip Slip Slip Slip
103.5 Slip Slip Slip
108.5 Slip Slip
113.5 Slip
118.5 Slip
Spacing, ft
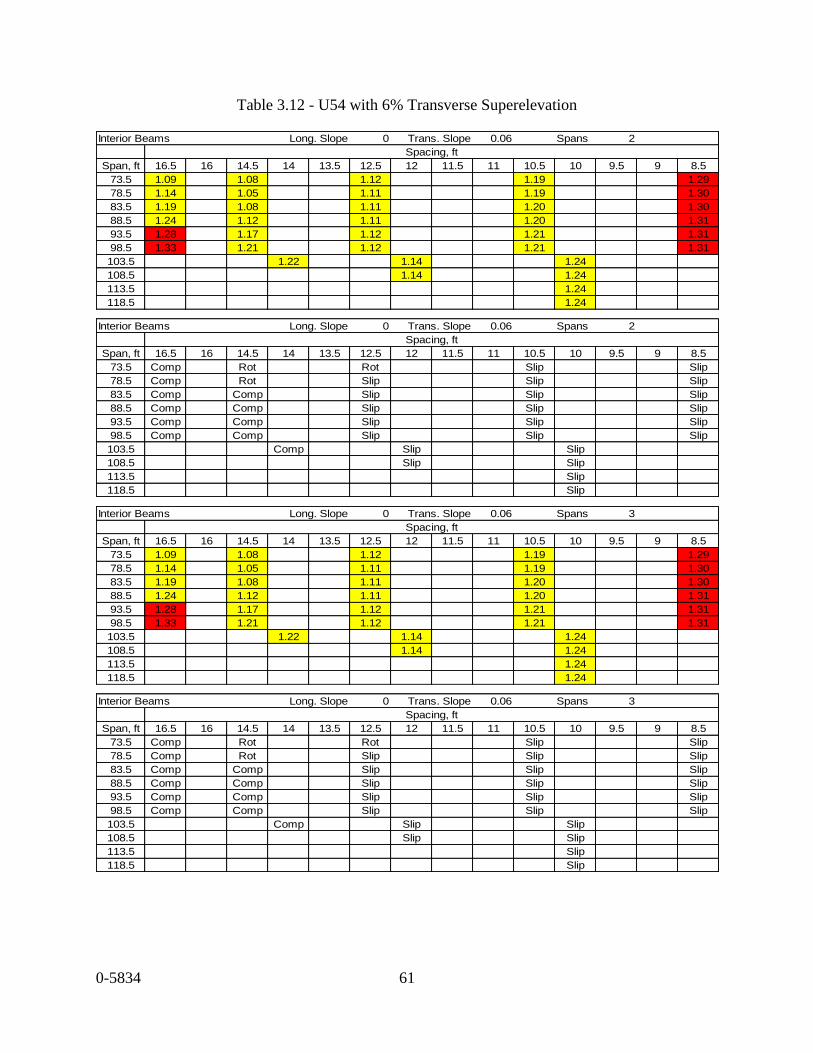
0-5834 61
Table 3.12 - U54 with 6% Transverse Superelevation
Interior Beams Long. Slope 0 Trans. Slope 0.06 Spans 2
Span, ft 16.5 16 14.5 14 13.5 12.5 12 11.5 11 10.5 10 9.5 9 8.5
73.5 1.09 1.08 1.12 1.19 1.29
78.5 1.14 1.05 1.11 1.19 1.30
83.5 1.19 1.08 1.11 1.20 1.30
88.5 1.24 1.12 1.11 1.20 1.31
93.5 1.28 1.17 1.12 1.21 1.31
98.5 1.33 1.21 1.12 1.21 1.31
103.5 1.22 1.14 1.24
108.5 1.14 1.24
113.5 1.24
118.5 1.24
Spacing, ft
Interior Beams Long. Slope 0 Trans. Slope 0.06 Spans 2
Span, ft 16.5 16 14.5 14 13.5 12.5 12 11.5 11 10.5 10 9.5 9 8.5
73.5 Comp Rot Rot Slip Slip
78.5 Comp Rot Slip Slip Slip
83.5 Comp Comp Slip Slip Slip
88.5 Comp Comp Slip Slip Slip
93.5 Comp Comp Slip Slip Slip
98.5 Comp Comp Slip Slip Slip
103.5 Comp Slip Slip
108.5 Slip Slip
113.5 Slip
118.5 Slip
Spacing, ft
Interior Beams Long. Slope 0 Trans. Slope 0.06 Spans 3
Span, ft 16.5 16 14.5 14 13.5 12.5 12 11.5 11 10.5 10 9.5 9 8.5
73.5 1.09 1.08 1.12 1.19 1.29
78.5 1.14 1.05 1.11 1.19 1.30
83.5 1.19 1.08 1.11 1.20 1.30
88.5 1.24 1.12 1.11 1.20 1.31
93.5 1.28 1.17 1.12 1.21 1.31
98.5 1.33 1.21 1.12 1.21 1.31
103.5 1.22 1.14 1.24
108.5 1.14 1.24
113.5 1.24
118.5 1.24
Spacing, ft
Interior Beams Long. Slope 0 Trans. Slope 0.06 Spans 3
Span, ft 16.5 16 14.5 14 13.5 12.5 12 11.5 11 10.5 10 9.5 9 8.5
73.5 Comp Rot Rot Slip Slip
78.5 Comp Rot Slip Slip Slip
83.5 Comp Comp Slip Slip Slip
88.5 Comp Comp Slip Slip Slip
93.5 Comp Comp Slip Slip Slip
98.5 Comp Comp Slip Slip Slip
103.5 Comp Slip Slip
108.5 Slip Slip
113.5 Slip
118.5 Slip
Spacing, ft

0-5834 62
Interior Beams Long. Slope 0 Trans. Slope 0.06 Spans 4
Span, ft 16.5 16 14.5 14 13.5 12.5 12 11.5 11 10.5 10 9.5 9 8.5
73.5 1.28 1.37 1.47 1.59 1.72
78.5 1.29 1.38 1.48 1.59 1.73
83.5 1.29 1.38 1.48 1.60 1.74
88.5 1.29 1.38 1.48 1.60 1.74
93.5 1.30 1.39 1.49 1.61 1.75
98.5 1.33 1.39 1.49 1.61 1.75
103.5 1.42 1.52 1.65
108.5 1.53 1.65
113.5 1.65
118.5 1.66
Spacing, ft
Interior Beams Long. Slope 0 Trans. Slope 0.06 Spans 4
Span, ft 16.5 16 14.5 14 13.5 12.5 12 11.5 11 10.5 10 9.5 9 8.5
73.5 Slip Slip Slip Slip Slip
78.5 Slip Slip Slip Slip Slip
83.5 Slip Slip Slip Slip Slip
88.5 Slip Slip Slip Slip Slip
93.5 Slip Slip Slip Slip Slip
98.5 Comp Slip Slip Slip Slip
103.5 Slip Slip Slip
108.5 Slip Slip
113.5 Slip
118.5 Slip
Spacing, ft

0-5834 63
Table 3.13 - U54 with 8% Transverse Superelevation
Interior Beams Long. Slope 0 Trans. Slope 0.08 Spans 2
Span, ft 16.5 16 14.5 14 13.5 12.5 12 11.5 11 10.5 10 9.5 9 8.5
73.5 2.10 1.99 1.92 1.88 1.87
78.5 2.09 1.97 1.88 1.84 1.82
83.5 2.08 1.95 1.85 1.80 1.78
88.5 2.08 1.93 1.83 1.76 1.74
93.5 2.08 1.92 1.81 1.74 1.70
98.5 2.09 1.91 1.79 1.71 1.67
103.5 1.87 1.75 1.67
108.5 1.74 1.65
113.5 1.64
118.5 1.62
Spacing, ft
Interior Beams Long. Slope 0 Trans. Slope 0.08 Spans 2
Span, ft 16.5 16 14.5 14 13.5 12.5 12 11.5 11 10.5 10 9.5 9 8.5
73.5 Rot Rot Rot Rot Rot
78.5 Rot Rot Rot Rot Rot
83.5 Rot Rot Rot Rot Rot
88.5 Rot Rot Rot Rot Rot
93.5 Rot Rot Rot Rot Rot
98.5 Rot Rot Rot Rot Rot
103.5 Rot Rot Rot
108.5 Rot Rot
113.5 Rot
118.5 Rot
Spacing, ft
Interior Beams Long. Slope 0 Trans. Slope 0.08 Spans 3
Span, ft 16.5 16 14.5 14 13.5 12.5 12 11.5 11 10.5 10 9.5 9 8.5
73.5 2.10 1.99 1.92 1.88 1.87
78.5 2.09 1.97 1.88 1.84 1.82
83.5 2.08 1.95 1.85 1.80 1.78
88.5 2.08 1.93 1.83 1.76 1.74
93.5 2.08 1.92 1.81 1.74 1.70
98.5 2.09 1.91 1.79 1.71 1.67
103.5 1.87 1.75 1.67
108.5 1.74 1.65
113.5 1.64
118.5 1.62
Spacing, ft
Interior Beams Long. Slope 0 Trans. Slope 0.08 Spans 3
Span, ft 16.5 16 14.5 14 13.5 12.5 12 11.5 11 10.5 10 9.5 9 8.5
73.5 Rot Rot Rot Rot Rot
78.5 Rot Rot Rot Rot Rot
83.5 Rot Rot Rot Rot Rot
88.5 Rot Rot Rot Rot Rot
93.5 Rot Rot Rot Rot Rot
98.5 Rot Rot Rot Rot Rot
103.5 Rot Rot Rot
108.5 Rot Rot
113.5 Rot
118.5 Rot
Spacing, ft

0-5834 64
Interior Beams Long. Slope 0 Trans. Slope 0.08 Spans 4
Span, ft 16.5 16 14.5 14 13.5 12.5 12 11.5 11 10.5 10 9.5 9 8.5
73.5 2.10 1.99 1.92 1.88 2.01
78.5 2.09 1.97 1.88 1.86 2.02
83.5 2.08 1.95 1.85 1.86 2.03
88.5 2.08 1.93 1.83 1.87 2.03
93.5 2.08 1.92 1.81 1.88 2.04
98.5 2.09 1.91 1.79 1.88 2.04
103.5 1.87 1.78 1.92
108.5 1.78 1.93
113.5 1.93
118.5 1.93
Spacing, ft
Interior Beams Long. Slope 0 Trans. Slope 0.08 Spans 4
Span, ft 16.5 16 14.5 14 13.5 12.5 12 11.5 11 10.5 10 9.5 9 8.5
73.5 Rot Rot Rot Rot Slip
78.5 Rot Rot Rot Slip Slip
83.5 Rot Rot Rot Slip Slip
88.5 Rot Rot Rot Slip Slip
93.5 Rot Rot Rot Slip Slip
98.5 Rot Rot Rot Slip Slip
103.5 Rot Slip Slip
108.5 Slip Slip
113.5 Slip
118.5 Slip
Spacing, ft

0-5834 65
3.5.1. Discussion of Summarized Design States
Tables 3.4 and 3.9 show that for longitudinal and transverse slopes of 0% and 2-span
units that all limit states are OK for the current TxDOT modified LRFD provisions for the
standard bearing for both the U-40 and U-54 members. This indicates that the standard bearing
is appropriate for this type of condition. In these two tables, as the number of spans in the unit
increases from 2 to 3 to 4, some limit states begin to produce ratios greater than 1.0. For both the
U-40 and U-54 members, the Anchorage Slip and Shear Strain checks produce limit state ratios
above 1.0.
Table 3.6 shows the results for the U-40 specimens with a transverse slope of 4%. For
this condition, all of the limit states are green for the 2-span units. For the 3-span units, only four
of the 24 limit states are red. For the 4-span units, 21 of the 24 limit states are red. Increasing
the transverse slope to 6%, as shown in Table 3.7, causes 8 out of the 24 limit states for the 2
span units to change from green to yellow. For the 3-span units, the number of red limit states
increases from four to 13. For the 4-span units, all 24 limit states become red. An overview of
the tables suggests that as the transverse slope increases from 4% to 6% causes a majority of the
limit states to begin to exceed 1.0.
Likewise, for the U-54 specimens, as the transverse slope increases above 4%, a majority
of the limit states begin to go above 1.0. At 2% transverse slope in Table 3.10, considering all
span arrangements (2-span, 3-span, and 4-span units) only 12 out of 111 states are red.
Increasing to 4% transverse slope in Table 3.11 causes the number of red limit states to increase
from 12 to 24. A further increase to 6% transverse slope as shown in Table 3.12 cause the
number of red limit states to increase from 24 to 53.
For an 8% transverse slope, Table 3.8 shows that for the U-40 beams, all span unit
arrangements, all 72 limit states are either yellow or red. Fifty-seven of the 72 total limit states
are red, the remaining 15 are yellow. For the U-54 beams at an 8% transverse slope, all 111 of
the limit states are red. This suggests that for both U-40 and U-54 beams, an 8% transverse slope
should not be considered.

0-5834 66
4. OBSERVATIONS AND TESTING
After inspecting both bridge systems in Wichita Falls and Lubbock, Texas, TechMRT
designed an experiment to investigate the effects of transverse superelevation on a uniform-
height steel-reinforced elastomeric bearing. The tests allowed for loads to be applied in vertical,
longitudinal, and transverse directions. This section details the tests performed, the procedures
used, and the results of the experiments.
4.1. Overview of Tests Performed
Two separate field test series, one laboratory test series, and one analytical test series
were performed to observe and confirm the effect transverse superelevation has on the
performance of the standard design steel-reinforced elastomeric bearings. First, select bearings
on two bridges with U-beams on a transverse superelevation in Wichita Falls, Texas were
inspected and documented. This successful Wichita Falls test series lead to an additional field
test in Lubbock, Texas. The Lubbock field test included instrumentation of bearings prior to
construction in an end span of the US 82 BOS-W Ramp Overpass at E-4th
Ramp. Finally, both
single and double bearing configurations were tested in the Structures Laboratory at Texas Tech
University. The laboratory results were compared to a finite element analysis developed to aid in
the research.
4.2. Wichita Falls Bridge Inspection
The purpose of this inspection was to inspect the bearings on two bridges with significant
transverse superelevations (5.3% and 6.0%). The bridges chosen were at the intersection of US
Highway 281/287 and US Highway 82 in Wichita Falls, Texas. Specifically, bearings were
inspected under the southbound Mainlanes of US Highway 281/287 (NBI No. 03243004309130)
and Alignment “C” connecting US 281/287 South to US 82 West (NBI No. 032430004401132).
The bridges were inspected on February 28, 2008. Additional information regarding the
inspection is documented in a memorandum sent to John Holt dated April 17, 2008, and is
included as Appendix 4-1 in this report.

0-5834 67
4.2.1. Documentation of the Inspection
Table 4.1 provides a summary of the bearings inspected. The first column shows the
bearing names. The second column indicates whether the bearing was a single 32 in. by 9 in.
Table 4.1 – Location of Bearings Inspected
bearing or a double 16 in. by 9 in. bearing. The third column shows where the bearings were
located; bearings A through D were located on the Mainlanes bridge while bearings E through O
were located on the Alignment “C” bridge. The fourth, fifth, and sixth columns show the bent,
span, and beam respectively. The seventh column shows whether the inspection was looking up
or back station. Finally, the last column distinguishes the double bearings.
Table 4.2 provides a summary of the data recorded for each bearing inspected. The third
column ―Trans. Slope‖ shows the measured transverse slope as a percent of the U-beam using a
digital level. The fourth column ―Down Side‖ indicates which side of the bearing is lower. The
fifth and sixth columns ―Trans. Angle‖ show the measured obtuse angle in degrees minus 90
degrees. The angles were measured using a clear plastic protractor with a radius of
approximately 2 in. (see Figure 4.1). The seventh and eighth columns show the approximate
height of the bearing at its left and right edges, respectively. The height shown is the ―X‖ value
Bearing
Name
Bearing
ConfigurationBridge Bent Span Beam
Station
DirectionNotes
A Single Elevated Mainlanes A3 2 1 Up -
B Single Elevated Mainlanes A4 3 2 Up -
C Single Elevated Mainlanes A4 3 4 Up -
D1 Double Elevated Mainlanes A4 4 4 Back To Left
D2 Double Elevated Mainlanes A4 4 4 Back To Right
E Single Alignment 'C' 10 9 1 Up -
F Single Alignment 'C' 10 9 2 Up -
G Double Alignment 'C' 9 9 1 Back To Left
H Double Alignment 'C' 9 9 1 Back To Right
I Double Alignment 'C' 9 9 2 Back To Left
J Double Alignment 'C' 9 9 2 Back To Right
K Single Alignment 'C' 9 8 1 Up -
L Double Alignment 'C' 8 8 1 Back To Left
M Double Alignment 'C' 8 8 1 Back To Right
N Double Alignment 'C' 7 7 1 Back To Right
O Double Alignment 'C' 7 7 1 Back To Left

0-5834 68
in the formula 2+X/32 in. Therefore, a value of 16 would indicate a bearing height of 2 16/32
in., or 2.5 in. The final column indicates whether or not there was lift-off noticed.
Table 4.2 – Summary Wichita Falls Inspection Data
Bearing
Bearing
Config.
Trans.
Slope, %
Down
side
Left
Trans.
Angle,
Degrees
Right
Trans.
Angle,
Degrees
Left
Height
(2+x/32
inches)
Right
Height
(2+x/32
inches)
Lift Off
Visible
A Single 5.8 Left 18 14 15 16 Y
B Single 3.7 Left 12 9 13 16 N
C Single 3 Left 20 20 17 12 Y
D1 Double 1 Right 10 10 12 12 N
D2 Double 1 Right 10 10 16 14 N
E Single 6.1 Left 15 10 14 18 N
F SIngle 5.2 Left 15 14 17 18 Y
G Double 6.4 Right 10 10 19 14 Y
H Double 6.4 Right 13 15 16 14 Y
I Double 5.3 Right 18 20 17 15 Y
J Double 5.3 Right 15 15 14 15 Y
K Single 6.6 Left 15 10 13 15 Y
L Double 6.2 Right 9 10 17 18 Y
M Double 6.2 Right 10 10 17 18 Y
N Double 5.3 Right 7 6 15 14 N
O Double 5.3 Right 6 9 16 18 N
Figure 4.1 – Protractor used to Measure Transverse Angles
Figure 4.2 shows an elevation view of a typical bearing, ―Bearing A‖, the first bearing in
Tables 1 and 2. Note the angled slope to the left and right ends of approximately 18 and 14

0-5834 69
degrees, respectively. Figure 4.3 shows a close-up of the left side of ―Bearing C‖ which displays
a measured transverse angle of 20 degrees. Note how the edge does display a double curvature
Figure 4.2 – Elevation of Bearing A
Figure 4.3 – Close-up of Bearing C
caused by the friction between the bearing surface and the U-beam to the top and the pier cap to
the bottom.

0-5834 70
In order to prevent the superstructure from translating downhill due to the superelevation,
the Alignment „C‟ bridge had shear keys detailed as shown in Figure 4.4. This detail was taken
from sheet 420 of the plans. On the up-slope side of the detail, the U-beam had pressed against
the shear key and had caused minor spalling on the key in some locations. On the down-slope
Figure 4.4 – Section thru Shear Key for Alignment ‗C‘
side of the detail, a slight gap was noticed in some places, indicating that the superstructure had
moved in the down-slope direction.
It was also noted that the entire superstructure was pivoting about the upslope edge of the
shear key in places. As large vehicles passed overhead, the superstructure would pivot about the
upslope edge of the shear key, causing the down-slope bearing to compress up and down. The
bearing could be heard to ―squeak‖ as the traffic went overhead. The magnitude of the
compression was enough to notice the sound even from the ground level.
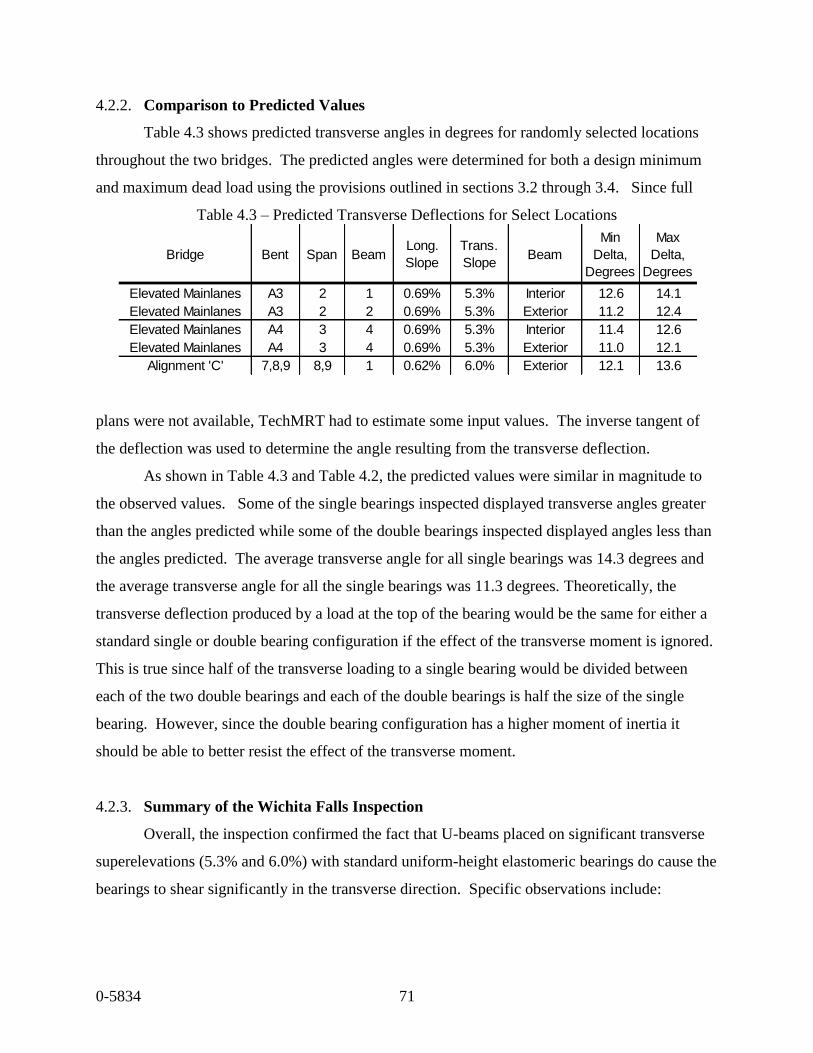
0-5834 71
4.2.2. Comparison to Predicted Values
Table 4.3 shows predicted transverse angles in degrees for randomly selected locations
throughout the two bridges. The predicted angles were determined for both a design minimum
and maximum dead load using the provisions outlined in sections 3.2 through 3.4. Since full
Table 4.3 – Predicted Transverse Deflections for Select Locations
plans were not available, TechMRT had to estimate some input values. The inverse tangent of
the deflection was used to determine the angle resulting from the transverse deflection.
As shown in Table 4.3 and Table 4.2, the predicted values were similar in magnitude to
the observed values. Some of the single bearings inspected displayed transverse angles greater
than the angles predicted while some of the double bearings inspected displayed angles less than
the angles predicted. The average transverse angle for all single bearings was 14.3 degrees and
the average transverse angle for all the single bearings was 11.3 degrees. Theoretically, the
transverse deflection produced by a load at the top of the bearing would be the same for either a
standard single or double bearing configuration if the effect of the transverse moment is ignored.
This is true since half of the transverse loading to a single bearing would be divided between
each of the two double bearings and each of the double bearings is half the size of the single
bearing. However, since the double bearing configuration has a higher moment of inertia it
should be able to better resist the effect of the transverse moment.
4.2.3. Summary of the Wichita Falls Inspection
Overall, the inspection confirmed the fact that U-beams placed on significant transverse
superelevations (5.3% and 6.0%) with standard uniform-height elastomeric bearings do cause the
bearings to shear significantly in the transverse direction. Specific observations include:
Bridge Bent Span BeamLong.
Slope
Trans.
SlopeBeam
Min
Delta,
Degrees
Max
Delta,
Degrees
Elevated Mainlanes A3 2 1 0.69% 5.3% Interior 12.6 14.1
Elevated Mainlanes A3 2 2 0.69% 5.3% Exterior 11.2 12.4
Elevated Mainlanes A4 3 4 0.69% 5.3% Interior 11.4 12.6
Elevated Mainlanes A4 3 4 0.69% 5.3% Exterior 11.0 12.1
Alignment 'C' 7,8,9 8,9 1 0.62% 6.0% Exterior 12.1 13.6

0-5834 72
1. The average transverse slope for the single bearings was 14.3° and the average transverse
slope for the double bearings was 11.3°, both in the down-slope direction.
2. All bearings inspected under U-beams with a significant transverse superelevation
displayed a transverse displacement. This supports the presence of the proposed
―Delta1‖ displacement.
3. Some bearings inspected under U-beams with a significant transverse superelevation
displayed evidence of a transverse moment, with uplift on the upslope side. This
supports the presence of the proposed ―Delta2‖ displacement.
4. Using a protractor cut to a 2 in. height worked well for measuring transverse slopes of the
bearings. The transverse slopes were generally not straight lines; however, the angle at
the top of the protractor where the measurement was made was usually in a straight line
portion of the profile.
5. Measuring the height of a bearing proved to be difficult because of the intentional
roughness of the bearing seats.
6. The presence of the shear key detail did not prevent the transverse displacement of the
top of the bearings. Also, damage did occur where the U-beams rested against the shear
keys. The unusual phenomena of the bridge superstructure pivoting about the shear key
could lead to premature damage to the bearing pads.
4.3. US 82 Bos-W Ramp Overpass at East 4th Street in Lubbock, Texas Field Test
The purpose of this field test was twofold : (1) to visually confirm the effect of transverse
superelevation on standard bearings and (2) to test the ability to perform long-term monitoring of
strains using strain gages. To accomplish these objectives, TechMRT, with the assistance of
personnel from TxDOT and Granite Construction, located a bridge that would be constructed
during the duration of the research project to observe the response of the bearings to transverse
superelevation throughout the construction process. TechMRT was given permission to place
strain gages on three bearings prior to the placement of the U-beams and was granted periodic
access to visually inspect and electronically monitor the change in strain in the bearings. In the
following section, data are presented from prior to placing the U-beams until after the placement
of the deck.

0-5834 73
4.3.1. Testing Program Overview
The US 82 Bos-W Ramp Overpass at E-4th Ramp at the location investigated was
constructed of three U-54 beams placed at a 3.8% transverse superelevation supporting a 38 foot
wide deck. The three bearings for the 87.59 ft long beam marked U54-1in Span 1 were gaged.
Figure 4.5 and Figure 4.6 show details of the bridge. Beam U54-1 was in Span 1 which
connected Bent 2 to Abutment 1 as traffic flowed over the bridge east to west. The Abutment 1
end of the beam (west side) was supported by two 9-in. by 16-in. elastomeric bearings and the
bottom of the U54 Section rested on the bearings. The Bent 2 end of the beam (east side) was
supported by a single 9-in. by 32-in. elastomeric bearing. The nominal thickness of the bearings
was 2 ½ in. The bearings were tapered to account for the beam‘s longitudinal slope. The upslope
side of the bearing was 2 ¾ in. thick while the down slope side of the bearing was 2 3/8 in. thick.
The U-beam was dapped at the east end in order to allow the bottom of the U54 section to lie at
the same elevation as the bottom of the bent cap. This dapped end detail made inspection of the
single bearing difficult.
Prior to placement of the U-beams, TechMRT obtained the three bearings for beam U54-
1 and placed a total of 14 rectangular rosette gages (42 individual gages) on the exterior front
and rear faces of the bearings; see Figure 4.7 and Figure 4.8. On the smaller bearings, a strain
rosette was placed near the corners of each bearing pad on both the front and rear faces. For the
large bearing pad, six gages were placed on the bearing, one at each of the 4 corners and one
near the center of the front and rear face of the bearing pad. See Appendix 4-2 for specific
information regarding the installation and location of the strain gages.
Since large strains were expected, a high-elongation polyimide backing was chosen for
the strain gages. The gages were also applied with an epoxy capable of withstanding high
strains. A bondable terminal was applied in order that 26 AWG 3-conductor cable could be
attached to each gage individually. An RJ45 connector was attached to the end of each
conductor cable. Each rosette was applied so that the number 1 gage was in the horizontal
direction, the number 2 gage was at a 45 degree angle, and the number 3 gage was in the vertical
direction. An electrically-neutral protective coating was applied to the gages for protection. The
coating system consisted of Vishay Micro-Measurements M-coat F-kit and an additional
protective rubber pad for physical protection. The RJ45 connectors were also protected by
placing them in a plastic bag.

0-5834 74
Figure 4.5 – Plan for US 82 BOS W Ramp

0-5834 75
Figure 4.6 – Erection Sheet for US 82 BOS W Ramp

0-5834 76
Figure 4.7 – Rosette Strain Gage (left) and Bondable Terminal (right)
Figure 4.8 – Fully Gaged Single Bearing
The strains were recorded with a Vishay P3 Strain Indicator and Recorder capable of
reading strains with an accuracy of 1 microstrain. The P3 has a range of +/- 30,000 microstrains
(or 3% strain) for the gage factor of 2.06 used. The P3 has four channels, three of which were
used for the three gages in each rosette. The fourth channel was used to record a precision
resistor wired so that it could be read as a quarter bridge, similar to the strain gages. The

0-5834 77
automatic balance on all four channels was turned off allowing actual strain readings. Any
change in the precision resistor over time would indicate that drift had occurred.
4.3.2. Testing Performed
On May 22, 2008, initial readings were taken for the three bearings in an unloaded state.
To accomplish this, TechMRT placed the three bearings on a slope matching the slope in the
field and recorded the three gages for each rosette and the precision resistor for each rosette. The
bearings were returned to the contractor for installation. The U-beam was placed on the bearing
the following day, May 23, 2008. The first set of data was recorded at approximately 10:00 AM.
All gages A through H were recorded for the double bearings; however, due to the dapped end
detail and the fact that a lift was not available, only gages L and O were recorded for the single
bearing. A visual inspection took place for the double bearings.
Five days later, on May 28, 2008, readings were recorded for all gages. Of the 42
individual gages installed, readings were obtained for 41 of the gages, an over 97% survival rate.
Additional readings were obtained as shown in Table 4.4.
Table 4.4 – Tests Performed for US 82 BOS-W Ramp Overpass
4.3.3. Results - Visual Observations
The procedure for the visual inspections of the bearings was similar to that used for the
Wichita Falls Inspection previously detailed. The initial inspection, Test No. 1, which took place
immediately after setting the U-beams, revealed transverse angles of 5, 5, 4, and 5 degrees for
the four sides of the double bearings. Using the proposed modified equations presented in
Section 3 that include the Delta1 and Delta2 effects, the predicted transverse angle was 4.39
Description of Test Test No. Date Days under loading, days
Zero Readings 0 Thursday, May 22, 2008 0
After Setting Beams 1 Friday, May 23, 2008 1
After Setting Beams 2 Wednesday, May 28, 2008 6
After Setting Beams 3 Friday, July 25, 2008 64
After Setting Beams 4 Tuesday, September 09, 2008 110
After Setting Beams and Deck 5 Thursday, September 25, 2009 126
After Setting Beams and Deck 6 Tuesday, October 28, 2008 159

0-5834 78
degrees. Therefore, the observed matched the predicted well. The calculations for the predicted
transverse angle are provided in Appendix 4-2 of this report.
4.3.4. Results - Strain Gage Readings
Even though a great deal of precaution was taken to ensure reliable readings, the long-
term strain data provided inconclusive results at best. A checklist was used to ensure that the
settings on the P3 strain indicator were set properly prior to each set of readings. Also, the
precision resistor was recorded on the fourth channel each time the three gages at each location
were recorded. For tests up to test number six which occurred at an age of 160 days, the
precision resistor varied only 17 microstrains, -6 to +11 microstrains. See Figure 4.9 for the
change in strain readings for the precision resistor for the double bearings. The results for the
single bearing were similar.
Figure 4.9 – Change in Strain for the Precision Resistor
A review of the change in strain for the vertical gages (the number 3 gages) shown in
Figure 4.10 is not easy to interpret. For the tests performed immediately after setting the beams
at days 1 and 6, some gages showed compressive strains (negative) while others showed tensile
strains (positive). This could be explained by the fact that transverse slope does cause the
-8
-6
-4
-2
0
2
4
6
8
10
12
0 20 40 60 80 100 120 140 160
Ch
an
ge in
resis
tor,
mic
rostr
ain
Age in days
A4 B4
C4 D4
E4 F4
G4 H4

0-5834 79
Figure 4.10 – Change in Strain for Vertical Gages on Double Bearings
centroid of the U-beams to shift and cause a transverse moment to be induced. However, it was
anticipated that the combination of the transverse moment and the vertical compressive load
would cause all of the gages to go into compression, with the down-slope gages in more
compression than the up-slope gages.
Between the day 6 and day 64 readings, all gages began to display significant
compressive strains. The behavior observed on the day 64 readings was closer to the originally
anticipated behavior. But, explaining why the readings changed so significantly during the time
between readings is difficult. If an error occurred in a setting on the P3, the error should have
been recorded in the resistor readings. Yet, the change in resistor values remained small.
As shown in Figure 4.11, the horizontal gages (the number 1 gages) acted similarly to the
vertical gages. Another interesting phenomenon took place when the deck was placed. As shown
in Figure 4.9, Figure 4.10Figure 4.11, the recorded changes in the resistor and the changes in
strain did not change much due to the placement of the deck. The deck was placed between days
126 and 159. As shown in Figure 4.9, the resistors varied a maximum of only 4 microstrains
from day 126 to 159. Likewise, the change in the gage readings for both the vertical and the
horizontal gages varied little from day 126 to 159.
-25000
-20000
-15000
-10000
-5000
0
5000
0 20 40 60 80 100 120 140 160
Ch
an
ge in
str
ain
, m
icro
str
ain
Age in days
A3 B3
C3 D3
E3 F3
G3 H3

0-5834 80
4.3.5. Summary of US 82 Bos-W Ramp Overpass Tests
The visual observations helped to confirm that it is appropriate to use the proposed
method outlined in Section 3 to predict transverse displacements.
The change in strain gage readings over time can most likely be attributed to the localized
behavior of the outer layer of the elastomer. It is possible that, over time, creep and bulging
effects caused the outer layer to bulge between the shim layers. A gage placed on the outer point
of the bulge should theoretically read tension while a gage placed on the inner point of the bulge
Figure 4.11 – Change in Strain for Horizontal Gages on Double Bearings
should theoretically read compression. This could help explain the behavior at later days. When
the U-beams were initially set, it is possible that the center portion of the bearings carried the
load and the edges were essentially unloaded for a time until creep effects allowed load
redistribution.
It is also possible that the data are bad. Either the gages failed or the P3 Strain Indicator
was set incorrectly. Failed gages typically provide ―offscale‖ readings or readings that vary
greatly (drift). Compared to each other, the readings were consistent and do not appear to result
from failed gages. A failed P3 strain indicator would have given different readings for the
precision resistor. But the resistor readings remained consistent throughout the testing with little
variability.
-25000
-20000
-15000
-10000
-5000
0
5000
0 20 40 60 80 100 120 140 160
Ch
an
ge in
str
ain
, m
icro
str
ain
Age in days
A1 B1
C1 D1
E1 F1
G1 H1

0-5834 81
4.4. Laboratory Testing
4.4.1. Testing Program
The following section provides details on the designed tests, the equipment used to conduct
the experiments, the test matrix developed to simulate varying conditions, and an overview of the
testing procedure. Discussion of the results follows in Chapter 5 of this report.
4.4.1.1. Design of Experimental Apparatus
The goal of the laboratory testing was to determine the significance of transverse
superelevation on the performance of uniform-height steel-reinforced elastomeric bearings. U-
beams are heavier than typical I-beam sections on a per-foot basis. This causes the transverse
component of the end reaction to have the potential to adversely affect the standard bearings
either by itself or in combination with vertical and longitudinal actions. TechMRT designed and
constructed a test frame that would allow the bearings to be loaded in the vertical, transverse, and
longitudinal directions simultaneously. The test frame allowed for the testing of bearings with a
vertical load up to 390 kips combined with a transverse load to model superelevation varying
from zero to eight percent and a longitudinal load to model design thermal expansion/contraction
for the maximum span lengths anticipated.
4.4.1.2. Test Frame
The test frame was composed of three separate smaller frames as shown in Figure 4.12 on
the following page, allowing for the bearing to be loaded in three directions simultaneously.
The vertical load was applied by the larger orange RAM shown. The longitudinal forces were
applied through the use of the smaller, yellow RAMS visible in Figure 4.13. The transverse
force in the other principle direction was applied with a RAM identical to the horizontal RAMS
shown in Figure 4.14. All parts of the framing system were anchored to the floor using 2.5-inch
diameter anchor bolts at each corner of their respective base plates.
4.4.1.3. Concrete Blocks
The triaxial loading was applied to the test bearings using a system of three concrete
blocks. The concrete blocks had dimensions of 48 in. by 28 in. by 24 in. and are displayed in
Figure 4.12 and Figure 4.13. The vertical force, simulating the vertical component of the gravity

0-5834 82
Figure 4.12 – Elevation View of Testing Frame
Figure 4.13 – Elevation View of Longitudinal Rams
loads, was applied downward to the top block, while the transverse and longitudinal forces were
applied in their respective directions to the center blocks. The transverse force simulated the
horizontal force resulting from the transverse superelevation while the longitudinal force
simulated the temperature effects of expansion/contraction of the U-beam. Bearings placed
between the top block and the center block were the test bearings while the bearings placed
between the center block and the bottom block were a dummy set of bearings used to allow the

0-5834 83
Figure 4.14 – Application of Transverse Load
center block to move freely. Identical bearings were used as the dummy bearings to allow for a
symmetric loading condition.
It is important to realize that only the center block was free to move. The bottom block
did not move due to friction between the block and concrete floor. The top block was held in
place by three angle members preventing it from moving in the longitudinal direction. Wood
blocks prevented transverse displacement of the concrete blocks.
4.4.1.4. Hydraulic Cylinders
Four hydraulic cylinders were used to apply the loads to the concrete blocks and
subsequently to the bearings. The vertical cylinder was a Power Team RD 500 Series Model B
hydraulic cylinder. The Power Team cylinder could produce a maximum load of 1,000 kips and
was loaded using a Power Team No. 9504 air compressor. The compressive RAM is shown in
Figure 4.12 (large, vertically oriented cylinder). The other three cylinders were EnerPac RCH-
603 hydraulic cylinders. A single EnerPac cylinder is capable of producing a maximum load of
120 kips. One cylinder was used to apply the transverse force(see Figure 4.14), while two
cylinders were used to supply the longitudinal force as shown in Figure 4.13. These three
cylinders were loaded using two EnerPac P-80 hand pumps, one for the transverse RAM and one
that controlled both of the longitudinal RAMS. Each load was applied sequentially and

0-5834 84
individually. First, the vertical force was applied, followed by the transverse force and then the
longitudinal force.
4.4.1.5. Bearings
The elastomeric bearings used in this test were supplied by Dynamic Rubber. The
bearings were fabricated as standard bearings from TxDOT Sheet ―UBEB – Elastomeric Bearing
and Bearing Seat Details – Prestr Conc U-Beams‖ dated July 2006 and provided in Appendix 3-
1. Figure 4.15 shows both the smaller double bearings (16-in. by 9-in. by 2.5-in.) and the larger
Figure 4.15 – Standard Single and Double Bearings
single bearings (32-in. by 9-in. by 2.5-in.). All bearings were placed in the recommended
positions per TxDOT sheet UBEB. All bearings were reinforced with five layers of 0.105-in.
thick steel shims.
4.4.1.6. Strain Gages
One double bearings and each single bearing used for each test were fitted with ten
rectangular rosette strain gages (Vishay Micro-Measurement EP-08-125RA-120). These strain
gages were chosen because they had the capability of reading the largest strain values (+/- 10%)
in addition to the reasons explained in section 4.3.1 of this report. The gages were affixed to the
bearings according to manufacturer specifications using a high-elongation epoxy. The placement
of the gages on each bearing is shown in Figure 4.16 through Figure 4.18 for the single bearing

0-5834 85
Figure 4.16 – Double Bearing Strain Gage Placement
Figure 4.17 – Single Bearing Strain Gage Placement
Figure 4.18 – Strain Gage Placement on Transverse Faces

0-5834 86
and double bearing configurations, respectively. Figure 4.19 shows the gages installed on the
smaller bearing. Note that each of the three individual gages in the rosette was attached to a
bondable terminal with a 34 gage red wire.
Figure 4.19 – Strain Gage Installed, 32-in. by 9-in. Bearing
The strain gage data was recorded with the aid of a Vishay Micro-Measurements System
5000. The strain gages were attached to the bearings in order to get an idea of the strain profile
across the faces of the bearing. Originally, strain gages 7-10 in Figure 4.18 were placed on the
opposite face of the bearing for the first test (Test Series D2A); however, the location was
changed since most of these gages detached due to excessive bulging on the face of the bearing.
4.4.1.7. Pressure Gages
All forces were applied to the center concrete block in the transverse and longitudinal
directions via RAMS as indicated in Section 0. The force was obtained by converting the
pressure applied to the RAM (in psi) into its corresponding force (in kips) by multiplying the
pressure by the effective cylinder area. The pressures at each RAM were obtained through two
separate methods. The first was an Enerpac pressure gage connected to the hydraulic line
immediately after the hand pump and the second was a Stellar Technology (ST-7500G-111)
pressure transducer connected to the hydraulic line shortly after the connection for the pressure
gage. Both the gage and the pressure transducer gave consistent readings before the first test was

0-5834 87
conducted so the transducer was used as the primary indicator of the pressure in the hydraulic
lines. The Enerpac pressure gages were used as a backup device in the event of a transducer
failure. Periodically throughout the experiment, simple checks were completed to ensure that the
transducers and pressure gages were reading the same and no disparities were noticed.
4.4.1.8. Linear Displacement Gages
Linear displacement of the center block in the longitudinal and transverse directions was
monitored via three Vishay Micro-Measurements cable extension displacement sensors, Model
CDS-10, see Figure 4.20 and Figure 4.21. One sensor was used to measure the transverse
displacement of the center block while two sensors were used to measure the longitudinal
displacement of the center block at the center point of the double bearings.
Figure 4.20 – Cable Extension Displacement Sensor – Transverse Direction
4.4.1.9. Vishay Micro-Measurements System 5000 Data Recorder
All of the data from the linear displacement gages, strain gages, and pressure transducers
was recorded using the Vishay Micro-Measurements System 5000 Data Recorder shown in
Figure 4.22. Each strain gage and linear displacement gage was attached to the System 5000
through a quarter bridge connection with a strain gage card while the pressure transducers were
attached to the System 5000 via a full bridge connection across a high level card. These
connections are illustrated in Figure 4.23. The accompanying Strain Smart software allowed for

0-5834 88
Figure 4.21 – Cable Extension Displacement Sensors – Longitudinal Direction
Figure 4.22 – Vishay Model 5000

0-5834 89
Figure 4.23 – Wiring for Vishay Model 5000
easy display and instantaneous recording of the data during each test as well as facilitating the
exportation of the time history of the data for further analysis.
4.4.1.10. Test Matrix and Procedure
TechMRT originally intended to test each bearing under the worst case vertical load
scenario based on a U-54 beam with maximum span length and maximum beam spacing. This
vertical load was determined to be 390 kips. The thought was that this load case would produce
the largest transverse force with varying superelevations and was thus the design case for the
bearings. However, after analyzing the effects of the first test series, D2A, TechMRT decided
that smaller loads associated with shorter span lengths, the U-40 beam, or smaller beam spacing
may need to be investigated. Thus, a single test for each bearing configuration with vertical
loads of 150 kips, 210 kips, 270 kips, and 330 kips were run. The entire test matrix is shown in
Table 4.5. The first three columns of this table provide information about the test series
including the assigned test series name, bearing pad configuration and superelevation. The
fourth column shows the order in which the individual test series were run. The last columns
show the number of test runs performed at each vertical load increment within the test series.

0-5834 90
Table 4.5 – Laboratory Test Matrix
Tests were conducted on both the single bearing and double bearing configurations with
vertical loads ranging from 150 kips to 390 kips and superelevations of 0%, 2%, 4%, 6%, and
8%. Ten tests were performed with a vertical load of 390 kips to show that the procedure and
subsequent results were repeatable. The 390 kip vertical load tests are designated test cycles one
through ten while the 330 kip, 270 kip, 210 kip, and 150 kip vertical load tests are designated test
cycles eleven, twelve, thirteen, and fourteen, respectively. Since TechMRT observed evidence
of serviceability failures of the bearings with superelevations of 6% and 8% after a few tests at
the 390 kip load, the tests at this level were halted after 4 cycles in each of these cases. This will
be explained in greater detail in the Chapter 5 of this report.
4.4.1.11. Simulation of Forces
The testing procedure is shown in Table 4.6. Three forces were simultaneously applied
to the bearings in order to conduct the designed experiment. First, a vertical force was applied to
induce the vertical load on the bearing. While the vertical force remained, a transverse force
simulating the horizontal force caused by the superelevation was applied. Next, while both the
vertical and the transverse loads were maintained, a longitudinal force simulating the effect of
the temperature (expansion/contraction) of the beam was applied.
Test Series
Bearing
Configuration
Superelevation,
percentage
Order of
Completion 1-10 11 12 13 14
D0A Double 0 4 390 330 270 210 150
D2A Double 2 1 390 330 270 210 150
D4A Double 4 2 390 330 270 210 150
D6A Double 6 3 390 330 270 210 150
D8A Double 8 5 390 330 270 210 150
S0A Single 0 10 390 330 270 210 150
S2A Single 2 9 390 330 270 210 150
S4A Single 4 8 390 330 270 210 150
S6A Single 6 7 390 330 270 210 150
S8A Single 8 6 390 330 270 210 150
Compressive Load in Kips Applied by Test Number

0-5834 91
Table 4.6 – Summary of Testing Procedure
To apply the transverse force, the idea of superelevating the concrete blocks was
investigated. However, TechMRT determined that this idea was not cost effective. Instead of
inclining the blocks, the expected deflection at the top corner of the bearing was calculated and
the center block was moved this distance to simulate the transverse movement resulting from the
superelevation of the bearing.
The same method was applied with the application of the longitudinal force to the
bearings. TechMRT determined that the maximum displacement would be 1.20 in. for the
maximum span length, so the center block was pushed in the longitudinal direction until it had
moved 1.20 in.
4.4.1.12. Data Recorded
The goal of the laboratory tests was to systematically apply the three forces to the test
bearings while recording pertinent information about the behavior of the bearing as the test runs
were conducted. The time history of the applied forces versus the displacement of the bearing
and the corresponding strains were measured continuously at one second intervals via the Vishay
System 5000. Other data was recorded manually during the experiment. An example of the data
sheet used to manually record additional data is shown in Figure 4.24 (for the 2% simulation).
This is illustrated by the fact that the transverse forces were recorded when the transverse delta
reached 0, 0.15, 0.3, and 0.45 inches. The transverse delta increments varied with the
superelevation; however, data was recorded in the same manner. First, the incremental forces
required to cause fixed displacements were obtained as the transverse and longitudinal forces
Step Action Manual Data Recorded
1 Turn On System 5000
2 Start Recording Using Strain Smart
3 Apply Vertical Load to desired amount (1000 psi = 100 kips)
4 Measure Initial Bearing Angles Transverse and Longitudinal Angles
5 Measure Initial Slip based on Reference Lines Measure transverse and longitudinal slip versus reference lines
6 Apply Transverse Load Measure Transverse Force and slip at pre-determined deflection points
7 Measure Bearing Angles Transverse and Longitudinal Angles
8 Measure Slip based on Reference Lines Measure transverse and longitudinal slip versus reference lines
9 Apply Longitudinal Loads Measure Longitudinal Force and slip at pre-determined deflection points
10 Measure Bearing Angles Transverse and Longitudinal Angles
11 Measure Slip based on Reference Lines Measure transverse and longitudinal slip versus reference lines
12 Release Longitudinal Load
13 Measure Bearing Angles Transverse and Longitudinal Angles
14 Measure Slip based on Reference Lines Measure transverse and longitudinal slip versus reference lines
15 Release Transverse Load
16 Measure Bearing Angles Transverse and Longitudinal Angles
17 Measure Slip based on Reference Lines Measure transverse and longitudinal slip versus reference lines
18 Release Vertical Load
19 Measure Bearing Angles Transverse and Longitudinal Angles
20 Measure Slip based on Reference Lines Measure transverse and longitudinal slip versus reference lines

0-5834 92
were applied. Second, the transverse and longitudinal angles of the displaced bearings were
obtained. Finally, the bearings were inspected for damage or other noticeable conditions once
the full vertical, transverse, and longitudinal loads were applied.
4.4.2. Single Pad Test Results
As indicated in section 4.4.1, TechMRT recorded a large amount of data for each test run
conducted. Data recorded included the transverse and longitudinal shear displacements, slip of
the bearing, lift-off, forces required to simulate the transverse and longitudinal loads, and any
damage noted while inspecting the bearings. Table 4.7 and Table 4.8 summarize the
displacement for each test run. The first three columns of these tables identify the test series,
superelevation, and test run of the experiment. Columns four through seven provide the
transverse and longitudinal angles recorded once the full tri-axial loading state was reached.
Columns eight through ten list the bearing slip measured. Columns 11 through 14 show the
bearing lift-off recorded while the last column lists any damage noted for each test run. Table
4.9 and Table 4.10 summarize the forces required to simulate the loading conditions for each test
run of the single pad configuration. The first column provides the test series while the second
and third columns provide the test run number and corresponding compressive force applied.
The fourth column lists the measured transverse force applied to achieve the simulated
superelevation while the last two columns provide the measured longitudinal forces applied to
the center block.

0-5834 93
Figure 4.24 – Example of Manual Data Recording Sheet

0-5834 94
Table 4.7—Single Pad Displacement and Damage Recorded: 0% and 2% Slopes
Longitduinal
Test
Series
Transverse
Slope (%)
Test
Run Left Right Front Back Front Back Top Bottom Top Bottom Damage Noted
S0A 0 1 0 0 14 14 0 0 0 0 0 1.8 0.4 None
S0A 0 2 0 0 15 15 0 0 0 0 0 1.7 0.4 None
S0A 0 3 0 0 15 14 0 0 0 0 0 1.8 0.5 None
S0A 0 4 0 0 15 14 0 0 0 0 0 1.9 0.4 Hairline Cracking
S0A 0 5 0 0 16 15 0 0 0 0 0 1.9 0.4 Hairline Cracking
S0A 0 6 0 0 16 15 0 0 0 0 0 1.9 0.4 Hairline Cracking
S0A 0 7 0 0 16 15 0 0 0 0 0 1.9 0.4 Hairline Cracking
S0A 0 8 0 0 17 16 0 0 0 0 0 1.9 0.4 Hairline Cracking
S0A 0 9 0 0 16 15 0 0 0 0 0 1.7 0.4 Hairline Cracking
S0A 0 10 0 0 16 16 0 0 0 0 0 1.8 0.4 Hairline Cracking
S0A 0 11 0 0 5 5 0 0 0 0 0 2.5 1 Hairline Cracking
S0A 0 12 0 0 10 10 0 0 0 0 0 2.3 0.5 Hairline Cracking
S0A 0 13 0 0 12 14 0 0 0 0 0 2 0.5 Hairline Cracking
S0A 0 14 0 0 13 13 0 0 0 0 0 1.8 0.4 Hairline Cracking
S2A 2 1 5 5 13 12 0 0 0 0 0 0 0.5 None
S2A 2 2 4 5 13 12 0 0 0 0 0 0 0 None
S2A 2 3 4 5 13 12 0 0 0 0 0.3 0 0.7 None
S2A 2 4 5 5 13 12 0 0 0 0 0.3 0 0.7 None
S2A 2 5 5 5 13 12 0 0 0 0 0.3 0 0.6 None
S2A 2 6 5 5 15 13 0 0 0 0 0.3 0 0.7 Hairline Cracking
S2A 2 7 5 4 15 13 0 0 0 0 0.3 0 0.6 Hairline Cracking
S2A 2 8 5 5 15 12 0 0 0 0 0.3 0 0.6 Hairline Cracking
S2A 2 9 5 5 12 8 0 0 0 0 0.3 0 0.6 Hairline Cracking
S2A 2 10 4 4 12 10 0 0 0 0 0.3 0 0.6 Hairline Cracking
S2A 2 11 3 3 10 9 0 0 0 0 0.5 0 1 Hairline Cracking
S2A 2 12 3 4 10 10 0 0 0 0 0.4 0 0.9 Hairline Cracking
S2A 2 13 5 5 10 11 0 0 0 0 0.3 0 1 Hairline Cracking
S2A 2 14 4 5 10 11 0 0 0 0 0.3 0 0.7 Hairline Cracking
Lift - Off (inches)Slip (inches)
Transverse Longitudinal
Transverse
Angles
(Degrees)
Longitudinal
Angle
(Degrees) Transverse

0-5834 95
Table 4.8—Single Pad Displacement and Damage Recorded: 4%, 6% and 8% Slopes
Longitduinal
Test
Series
Transverse
Slope (%)
Test
Run Left Right Front Back Front Back Top Bottom Top Bottom Damage Noted
S4A 4 1 10 8 12 14 0 0 0 1.2 0.5 0 0.6 None
S4A 4 2 8 8 13 13 0 0 0 0.9 0.5 0 0.6 None
S4A 4 3 8 8 14 13 0 0 0 0.9 0.4 0 0.5 Hairline Cracking
S4A 4 4 10 10 12 12 0 0 0 0.9 0.5 0 0.4 Hairline Cracking
S4A 4 5 9 8 13 11 0 0 0 0.8 0.5 0 0.5 Hairline Cracking
S4A 4 6 8 8 15 12 0 0 0 1 0.5 0 0.6 Hairline Cracking
S4A 4 7 8 7 12 10 0 0 0 0.7 0.4 0 0.4 Hairline Cracking
S4A 4 8 8 10 16 15 0 0 0 0.7 0.4 0 0.6 Heavy Cracking
S4A 4 9 10 11 18 16 0 0 0 0.7 0.4 0 0.6 Heavy Cracking
S4A 4 10 10 10 18 17 0 0 0 0.8 0.4 0 0.5 Heavy Cracking
S4A 4 11 5 5 10 10 0 0 0 1.2 0.5 0 0.9 Heavy Cracking
S4A 4 12 6 5 11 10 0 0 0 1 0.5 0 0.9 Heavy Cracking
S4A 4 13 7 5 10 12 0 0 0 0.8 0.5 0 0.6 Heavy Cracking
S4A 4 14 9 7 12 12 0 0 0 0.7 0.4 0 0.4 Heavy Cracking
S6A 6 1 14 14 14 17 0 0 0.2 0.6 0.4 0 0 Hairline Cracking
S6A 6 2 15 12 14 18 0.9 0.7 0.4 0.3 0.4 0.4 0 Hairline Cracking
S6A 6 3 15 13 15 18 0.4 0.5 0.3 1 0.3 0 0 Heavy Cracking
S6A 6 4 15 13 15 17 0.3 0.3 0.2 0.7 0.4 1 0 Heavy Cracking
S6A 6 11 7 5 14 13 0.4 0.3 0.2 1.6 0.4 1 0 Heavy Cracking
S6A 6 12 13 10 18 16 0.2 0.2 0.2 1 0.5 0.7 0 Heavy Cracking
S6A 6 13 14 10 18 18 0.3 0.2 0.3 1 0.4 1.2 0 Tension Debonding
S6A 6 14 15 13 18 17 0.1 0.2 0.3 0.6 0.4 0.9 0 Tension Debonding
S8A 8 1 22 21 15 21 0.6 0.7 N/A N/A N/A N/A N/A N/A
S8A 8 2 21 20 15 21 1.3 1.3 0.6 0.3 0.5 0 0 Heavy Cracking
S8A 8 3 25 23 15 24 1.3 1.3 0.5 0.2 0.4 0.5 0 Tension Debonding
S8A 8 4 25 24 15 23 0.8 0.8 0.2 0.3 0.5 0.5 0 Tension Debonding
S8A 8 11 5 8 14 14 1 1.1 0.3 1 0.3 0.5 0 Tension Debonding
S8A 8 12 14 12 15 16 1 1.1 0.1 1 0.4 0.5 0 Tension Debonding
S8A 8 13 16 14 15 16 1 1 0.3 0.4 0.5 0.5 0 Tension Debonding
S8A 8 14 20 18 15 18 1.1 1.1 0.2 0.4 0.4 0.5 0 Delamination
Lift - Off (inches)
Transverse Transverse Longitudinal
Slip (inches)Transverse
Angles
(Degrees)
Longitudinal
Angle
(Degrees)

0-5834 96
Table 4.9—Single Pad Displacement Forces Applied: 0% and 2% Slopes
Test Series Test Run
Compressive
Force (Kips)
Transverse
Force (Kips) East Ram West Ram
S0A 1 390 0.0 14.7 14.8
S0A 2 390 0.0 14.9 14.9
S0A 3 390 0.0 14.6 14.7
S0A 4 390 0.0 14.7 14.3
S0A 5 390 0.0 14.3 14.7
S0A 6 390 0.0 15.3 15.3
S0A 7 390 0.0 14.6 14.7
S0A 8 390 0.0 14.2 14.7
S0A 9 390 0.0 14.1 14.4
S0A 10 390 0.0 14.6 14.5
S0A 11 150 0.0 12.5 12.6
S0A 12 210 0.0 14.3 14.5
S0A 13 270 0.0 15.2 15.0
S0A 14 330 0.0 14.8 14.9
S2A 1 390 18.1 14.5 14.4
S2A 2 390 17.4 14.0 14.4
S2A 3 390 17.0 13.7 13.9
S2A 4 390 17.4 14.0 14.1
S2A 5 390 17.3 14.2 14.4
S2A 6 390 17.6 14.7 14.4
S2A 7 390 17.3 14.3 14.4
S2A 8 390 19.0 14.8 14.8
S2A 9 390 17.9 13.8 13.8
S2A 10 390 17.8 13.3 13.5
S2A 11 150 16.9 13.0 13.2
S2A 12 210 16.9 14.2 14.2
S2A 13 270 17.1 14.3 14.3
S2A 14 330 17.4 14.0 14.2
Longitudinal Force (Kips)

0-5834 97
Table 4.10—Single Pad Displacement Forces Applied: 4%, 6% and 8% Slopes
Test Series Test Run
Compressive
Force (Kips)
Transverse
Force (Kips) East Ram West Ram
S4A 1 390 29.2 14.5 14.3
S4A 2 390 30.0 14.1 14.3
S4A 3 390 29.7 14.7 14.7
S4A 4 390 31.6 13.9 14.0
S4A 5 390 30.6 13.7 13.7
S4A 6 390 31.7 13.9 14.1
S4A 7 390 31.2 13.6 13.5
S4A 8 390 29.9 14.8 14.8
S4A 9 390 29.6 15.1 15.2
S4A 10 390 30.1 15.0 15.1
S4A 11 150 27.7 14.0 14.0
S4A 12 210 29.2 15.0 14.9
S4A 13 270 28.5 15.0 14.9
S4A 14 330 29.8 14.8 14.8
S6A 1 390 33.3 16.3 16.1
S6A 2 390 32.1 15.6 15.5
S6A 3 390 33.7 16.8 16.6
S6A 4 390 35.3 16.8 16.7
S6A 11 150 29.8 15.6 15.5
S6A 12 210 30.3 17.3 17.1
S6A 13 270 32.2 16.4 16.5
S6A 14 330 33.5 16.0 14.3
S8A 1 390 55.6 17.7 17.8
S8A 2 390 53.1 17.4 17.5
S8A 3 390 53.5 18.2 18.1
S8A 4 390 55.2 18.0 17.9
S8A 11 150 41.4 15.1 15.2
S8A 12 210 45.1 15.9 15.8
S8A 13 270 49.5 17.0 17.2
S8A 14 330 53.7 18.6 18.3
Longitudinal Force (Kips)
0-5834 98
4.4.3. Dual Pad Test Results
The same information was recorded for the double pad configuration as with the single
pad configuration. . Table 4.11 and Table 4.12 summarize the displacements observed during
each test run in the same format indicated in section 4.4.2. Table 4.13 and Table 4.14 summarize
the forces required to simulate the loading conditions for each test run of the single pad
configuration similar to the organization of Table 4.9 and Table 4.10.
4.4.4. Summary of Observations
Detailed analysis of the data is explained in Chapter 5 of the report, but a few trends are
discussed here. In general, an increased superelevation for both pad configurations resulted in
higher transverse forces applied to the bearing. A trend appears to exist that shows the lighter
vertical load applied required less transverse force to produce the desired transverse deflection.
The amount of damage observed appears to increase as well as the severity of the damage
observed as the superelevation increased. Additionally, transverse slip increased with increased
superelevation.
Table 4.15 compares the transverse angles observed at Wichita Falls versus those
observed in the lab. The first four columns of this table provide identification and summary
information for the bearings. The next two columns provide the transverse angles observed for
each inspected bearing. Columns seven and eight provide the average angle observed in the
laboratory testing for the given superelevation listed in column three. The average angles were
interpolated from the average angles for each superelevation and bearing pad configuration
tested in the laboratory. The final two columns provide the minimum angle and maximum angle
seen at the respective superelevations. For these angles, interpolation between lab tested
superelevations did not seem appropriate. As such, TechMRT provided the maximum and
minimum transverse angles for the laboratory data closest to the actual superelevation observed
in the field. The lab predicted angles are presented a little differently here. In this case, rather
than saying left or right transverse angles, the columns are titled uphill and downhill angles to
avoid confusion when comparing the numbers. The downhill angle of the Wichita Falls bearings
can be determined by looking at the fourth column of Table 4.15. Table 4.16 provides the same
comparison for the Lubbock bridge inspection to the laboratory data.

0-5834 99
The laboratory data tends to mirror the results observed in the field at Wichita Falls,
Texas. The average lab angles seem to agree with the numbers observed in the field. For the
laboratory data, 9 out of 16 field observations are very similar to the results of the lab data. The
laboratory data provided in columns seven and eight are averages so they may not be exact
matches. In general, the field angles tend to fall within the maximum and minimum ranges of
the angles seen in the laboratory experiment. This is true for 15 of the 16 Wichita Falls field
measurements.
The Lubbock bridge data does not provide as good a fit. The observed angles on the
US82 overpass are lower than those observed in the lab. A plausible explanation may be that the
data from the Lubbock bridge was recorded shortly after the bridge deck was constructed.
Therefore, there was insufficient time for the effect of creep to fully occur.

0-5834 100
Table 4.11—Double Pad Displacement and Damage Recorded: 0% and 2% Slopes
Longitduinal
Test
Series
Transverse
Slope (%)
Test
Run Left Right Front Back Front Back Top Bottom Top Bottom Damage Noted
D0A 0 1 -2 -1 19 17 0 0 0.1 0 0 0 0 None
D0A 0 2 3 0 22 18 0 0 0.2 0 0 0 0 Hairline Cracking
D0A 0 3 3 0 22 18 0 0 0.2 0 0 0 0 Hairline Cracking
D0A 0 4 3 0 22 18 0 0 0.2 0 0 0 0 Hairline Cracking
D0A 0 5 2 1 22 19 0 0 0.2 0 0 0 0 Hairline Cracking
D0A 0 6 4 0 21 17 0 0 0.2 0 0 0 0 Hairline Cracking
D0A 0 7 0 3 19 17 0 0 0.2 0 0 0 0 Hairline Cracking
D0A 0 8 3 1 22 18 0 0 0.3 0 0 0 0 Hairline Cracking
D0A 0 9 3 2 21 18 0 0 0.2 0 0 0 0 Hairline Cracking
D0A 0 10 4 2 21 19 0 0 0.2 0 0 0 0 Hairline Cracking
D0A 0 14 4 0 21 18 0 0.1 0.3 0 0 0 0 None
D0A 0 13 5 2 21 18 0 0 0.4 0 0 0 0 None
D0A 0 12 3 -1 21 18 0 0 0.2 0 0 0 0 None
D0A 0 11 1 0 22 20 0 0 0.2 0 0 0 0 None
D2A 2 1 12 -- 25 -- 0 0.1 0.2 0 0 0 0 Hairline Cracking
D2A 2 2 11 -- 22 -- 0.1 0.1 0.2 0 0 0 0 Hairline Cracking
D2A 2 3 10 9 19 20 0.1 0.1 0.2 0 0 0 0 Hairline Cracking
D2A 2 4 9 12 19 17 0 0 0.1 0 0 0 0 Hairline Cracking
D2A 2 5 9 11 20 20 0.1 0.1 0.1 0 0 0 0 Hairline Cracking
D2A 2 6 6 6 20 23 0 0.1 0.1 0 0 0 0 Hairline Cracking
D2A 2 7 6 7 21 22 0 0.1 0.1 0 0 0 0 Hairline Cracking
D2A 2 8 6 6 20 22 0.1 0 0.1 0 0 0 0 Hairline Cracking
D2A 2 9 6 6 22 25 0 0 0.1 0 0 0 0 Hairline Cracking
D2A 2 10 6 6 20 25 0 0.1 0 0 0 0 0 Hairline Cracking
D2A 2 14 9 8 18 19 0.1 0.1 0.3 0 0 0 0 None
D2A 2 13 7 8 14 14 0.1 0.1 0.3 0 0 0 0 None
D2A 2 12 5 6 18 15 0.1 0.1 0.2 0 0 0 0 None
D2A 2 11 5 6 22 14 0.1 0.1 0.2 0 0 0 0 None
Transverse
Angles
(Degrees)
Longitudinal
Angle
(Degrees)
Slip (inches) Lift - Off (inches)
Transverse Transverse Longitudinal

0-5834 101
Table 4.12—Double Pad Displacement and Damage Recorded: 4%, 6% and 8% Slopes
Longitduinal
Test
Series
Transverse
Slope (%)
Test
Run Left Right Front Back Front Back Top Bottom Top Bottom Damage Noted
D4A 4 1 14 16 16 19 0.2 0.2 0.1 0 0 0 0 Hairline Cracking
D4A 4 2 15 16 18 16 0.1 0.1 0 0 0 0 0 Hairline Cracking
D4A 4 3 15 16 19 18 0.2 0.2 0.1 0 0 0 0 Hairline Cracking
D4A 4 4 15 16 20 21 0.2 0.2 0.2 0 0 0 0 Hairline Cracking
D4A 4 5 15 16 17 17 0.2 0.2 0.2 0 0 0 0 Hairline Cracking
D4A 4 6 17 19 19 23 0.2 0.2 0.1 0 0 0 0 Hairline Cracking
D4A 4 7 15 15 20 22 0.2 0.3 0.1 0 0 0 0 Hairline Cracking
D4A 4 8 16 15 20 21 0.2 0.2 0.3 0 0 0 0 Delamination
D4A 4 9 15 15 19 19 0.2 0.3 0.2 0 0 0 0 Delamination
D4A 4 10 15 15 19 21 0.2 0.3 0.1 0 0 0 0 Delamination
D4A 4 14 14 13 21 19 0.2 0.3 0.2 0 0 0 0 None
D4A 4 13 14 13 16 16 0.1 0.2 0.2 0 0 0 0 None
D4A 4 12 13 14 16 16 0.2 0.2 0.1 0 0 0 0 None
D4A 4 11 14 13 16 18 0.2 0.2 0.1 0 0 0 0 Hairline Cracking
D6A 6 1 15 12 17 14 0.3 0.3 0.2 0.2 0 0 0 Hairline Cracking
D6A 6 2 12 10 16 14 0.3 0.3 0.1 0.3 0 0 0 Heavy Cracking
D6A 6 3 15 12 16 14 0.4 0.3 0.1 0.3 0 0 0 Heavy Cracking
D6A 6 4 14 12 18 17 0.3 0.3 0 0.3 0 0 0 Delamination
D6A 6 14 15 18 17 12 0.3 0.3 0.2 0.2 0 0 0 None
D6A 6 13 16 15 18 15 0.3 0.3 0.2 0.2 0 0 0 None
D6A 6 12 12 13 18 14 0.3 0.3 0.2 0.2 0 0 0 None
D6A 6 11 14 13 16 14 0.3 0.3 0.1 0.4 0 0 0 Hairline Cracking
D8A 8 1 -- -- -- -- 0.4 0.4 0.1 0.5 0 0 0 Delamination
D8A 8 2 11 9 15 14 0.4 0.5 0.1 0.5 0 0 0 Delamination
D8A 8 3 11 10 10 16 0.3 0.4 0.1 0.6 0 0 0 Delamination
D8A 8 4 15 15 18 19 0.5 0.4 0.1 0.5 0 0 0 Delamination
D8A 8 14 11 10 15 13 0.4 0.4 0.1 0.1 0 0 0 None
D8A 8 13 13 14 12 11 0.4 0.5 0.1 0.2 0.3 0 0 None
D8A 8 12 13 13 12 12 0.3 0.3 0.1 0.3 0 0 0 Tension Debonding
D8A 8 11 9 9 12 11 0.1 0.1 0.1 0.5 0 0 0 Tension Debonding
Transverse
Angles
(Degrees)
Longitudinal
Angle
(Degrees)
Slip (inches) Lift - Off (inches)
Transverse Transverse Longitudinal

0-5834 102
Table 4.13—Double Pad Displacement Forces Applied: 0% and 2% Slopes
Test Series Test Run
Compressive
Force (Kips)
Transverse
Force (Kips) East Ram West Ram
D0A 1 390 0.0 0.0 0.0
D0A 2 390 0.0 0.0 0.0
D0A 3 390 0.0 0.0 0.0
D0A 4 390 0.0 0.0 0.0
D0A 5 390 0.0 0.0 0.0
D0A 6 390 0.0 0.0 0.0
D0A 7 390 0.0 0.0 0.0
D0A 8 390 0.0 0.0 0.0
D0A 9 390 0.0 0.0 0.0
D0A 10 390 0.0 0.0 0.0
D0A 11 150 0.0 0.0 0.0
D0A 12 210 0.0 0.0 0.0
D0A 13 270 0.0 0.0 0.0
D0A 14 330 0.0 0.0 0.0
D2A 1 390 0.0 0.0 0.0
D2A 2 390 23.9 0.0 0.0
D2A 3 390 0.0 0.0 0.0
D2A 4 390 21.9 0.0 0.0
D2A 5 390 21.9 0.0 0.0
D2A 6 390 0.0 0.0 0.0
D2A 7 390 20.9 0.0 0.0
D2A 8 390 20.9 0.0 0.0
D2A 9 390 20.9 0.0 0.0
D2A 10 390 20.9 0.0 0.0
D2A 11 150 0.0 0.0 0.0
D2A 12 210 0.0 0.0 0.0
D2A 13 270 0.0 0.0 0.0
D2A 14 330 0.0 0.0 0.0
Longitudinal Force (Kips)

0-5834 103
Table 4.14—Double Pad Displacement Forces Applied: 4%, 6% and 8% Slopes
Test Series Test Run
Compressive
Force (Kips)
Transverse
Force (Kips) East Ram West Ram
D4A 1 390 38.7 19.5 19.6
D4A 2 390 36.3 18.6 18.7
D4A 3 390 39.1 19.1 19.2
D4A 4 390 39.2 19.1 19.1
D4A 5 390 39.7 19.0 19.2
D4A 6 390 40.3 19.2 19.5
D4A 7 390 38.9 19.6 19.6
D4A 8 390 39.8 19.0 19.1
D4A 9 390 39.0 19.5 19.5
D4A 10 390 40.7 19.4 19.5
D4A 11 150 34.8 18.5 18.5
D4A 12 210 34.9 17.7 17.7
D4A 13 270 34.9 18.2 18.4
D4A 14 330 35.6 18.5 18.5
D6A 1 390 44.8 18.2 18.2
D6A 2 390 41.9 18.2 18.3
D6A 3 390 44.6 19.2 19.3
D6A 4 390 44.2 18.1 18.1
D6A 11 150 44.9 19.0 18.9
D6A 12 210 43.0 18.3 18.3
D6A 13 270 41.6 17.2 17.2
D6A 14 330 40.2 16.3 16.1
D8A 1 390 48.2 0* 0*
D8A 2 390 59.6 17.9 18.2
D8A 3 390 53.8 16.3 16.4
D8A 4 390 56.3 17.3 17.3
D8A 11 150 42.6 15.4 15.5
D8A 12 210 48.6 16.1 16.1
D8A 13 270 66.3 15.5 15.5
D8A 14 330 46.5 16.4 16.4
*Note Longitudinal Force Not Applied Due to Equipment Problems
Longitudinal Force (Kips)

0-5834 104
Table 4.15—Comparison of Wichita Falls Bridge Data to Laboratory Data
Table 4.16—Comparison of Lubbock Bridge Data to Laboratory Data
4.5. Finite Element Modeling
TechMRT also developed a finite element model (FEM) for both the single and double
bearing pad configurations described earlier in this chapter. These models were used to run a
series of finite element analyses with conditions matching several of the experimental tests
conditions so that comparisons could be made in an attempt to validate the FEMs, allowing for
the possibility of future parametric studies to be conducted, if warranted.
4.5.1. Description of the Finite Element Model
The bearing pads were modeled using the finite element software, ANSYS, using one of
its standard elements, ―SOLID186.‖ The SOLID186 element is a 3-dimensional, 20-node, solid
brick element that exhibits quadratic displacement behavior as shown in Figure 4.25. Each node
Bearing
Bearing
Configuration
Trans. Slope,
Percent Down side
Left Trans.
Angle, Degrees
Right Trans. Angle,
Degrees
Avg
Downhill
Angle
(Degrees)
Avg Uphill
Angle
(Degrees)
Max Angle
Observed
(Degrees)
Min Angle
Observed
(Degrees)
A Single 5.8 Left 18 14 14.2 12.6 15 5
B Single 3.7 Left 12 9 8.3 8.2 11 5
C Single 3 Left 20 20 4.5 4.4 11 5
D1 Double 1 Right 10 10 5.2 4.3 12 5
D2 Double 1 Right 10 10 5.2 4.3 12 5
E Single 6.1 Left 15 10 15.2 13.5 18 15
F SIngle 5.2 Left 15 14 12.4 11.3 15 5
G Double 6.4 Right 10 10 13.6 12.6 15 5
H Double 6.4 Right 13 15 13.6 12.6 18 9
I Double 5.3 Right 18 20 2.1 2.0 18 9
J Double 5.3 Right 15 15 2.1 2.0 18 9
K Single 6.6 Left 15 10 17.3 15.7 15 5
L Double 6.2 Right 9 10 13.8 12.8 18 9
M Double 6.2 Right 10 10 13.8 12.8 18 9
N Double 5.3 Right 7 6 14.4 14.0 18 9
O Double 5.3 Right 6 9 14.4 14.0 18 9
Observed Angles Lab Observed Angles
Bearing
Configuration
Trans. Slope,
Percent Down side
Left Trans.
Angle, Degrees
Right Trans. Angle,
Degrees
Avg
Downhill
Angle
(Degrees)
Avg Uphill
Angle
(Degrees)
Max Angle
Observed
(Degrees)
Min Angle
Observed
(Degrees)
Double 3.8 Left 8 9 14.5 15.1 19 13
Double 3.8 Left 9 8 14.5 15.1 19 13
Observed Angles Lab Observed Angles
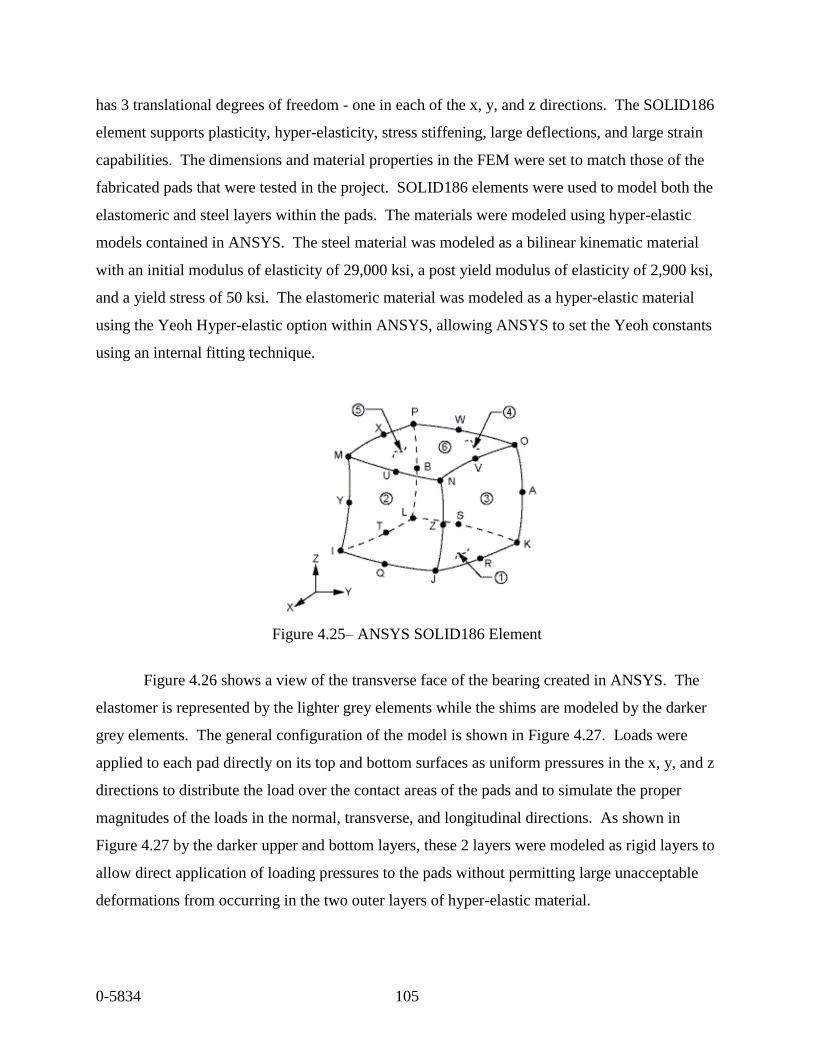
0-5834 105
has 3 translational degrees of freedom - one in each of the x, y, and z directions. The SOLID186
element supports plasticity, hyper-elasticity, stress stiffening, large deflections, and large strain
capabilities. The dimensions and material properties in the FEM were set to match those of the
fabricated pads that were tested in the project. SOLID186 elements were used to model both the
elastomeric and steel layers within the pads. The materials were modeled using hyper-elastic
models contained in ANSYS. The steel material was modeled as a bilinear kinematic material
with an initial modulus of elasticity of 29,000 ksi, a post yield modulus of elasticity of 2,900 ksi,
and a yield stress of 50 ksi. The elastomeric material was modeled as a hyper-elastic material
using the Yeoh Hyper-elastic option within ANSYS, allowing ANSYS to set the Yeoh constants
using an internal fitting technique.
Figure 4.25– ANSYS SOLID186 Element
Figure 4.26 shows a view of the transverse face of the bearing created in ANSYS. The
elastomer is represented by the lighter grey elements while the shims are modeled by the darker
grey elements. The general configuration of the model is shown in Figure 4.27. Loads were
applied to each pad directly on its top and bottom surfaces as uniform pressures in the x, y, and z
directions to distribute the load over the contact areas of the pads and to simulate the proper
magnitudes of the loads in the normal, transverse, and longitudinal directions. As shown in
Figure 4.27 by the darker upper and bottom layers, these 2 layers were modeled as rigid layers to
allow direct application of loading pressures to the pads without permitting large unacceptable
deformations from occurring in the two outer layers of hyper-elastic material.

0-5834 106
Figure 4.26—ANSYS Model of Bearing, Transverse Face
Figure 4.27--Pad Model with Rigid Extreme Layers
Ten FE analyses are compared to experimental results in the next section. The FE
analyses consider only the maximum vertical load on the pad of 390 kips and the five transverse
slopes (values of slope set to 0, 2, 4, 6, and 8%) for both the single and double bearing pad
configurations, totaling ten FE analyses. Loads were not applied in step one but were applied in
a stepwise fashion from zero to their maximum in the order of vertical load, followed by
transverse load, and finally the longitudinal load. Only the analytical results from the fully
loaded pads are reported. The non-linear geometry function of ANSYS was utilized during the
FE analyses associated with this project.
4.5.2. Comparison of FEA to Laboratory Testing
Magnitudes of angular deformation from a vertical axis were measured and calculated in
degrees in the transverse and longitudinal directions of the pads at the maximum specified
loading. Due to the non-linearity of the shear deformations in the pads, the angular deformations
vary through the depth of the pad and along the length of the pad in each direction. Therefore,

0-5834 107
maximum and minimum values of angular deformations were determined in each of the
transverse and longitudinal directions of the pads and are used for comparison of the FEA results
to the laboratory results. Table 4.17 summarizes the angular deformations (maximum and
minimum values) that occur in the ten load cases for both FEA and experimental results.
Table 4.17– Angular Deformations in Pads at 390 kip Vertical Load
The finite element analysis displayed the same trend as the laboratory results shown by
the strain profiles in Figure 4.28 through Figure 4.31. Figure 4.28 through Figure 4.31 show the
strain profile for the double pad configuration at 6% superelevation. Note that the bearing is in
compression with respect to the vertical direction except for localized areas of tension
along the shims. As will be discussed in section 5.4 of this report, a larger superelevation results
in a larger area of localized tension and tends to mirror the damage results analyzed. As the
value of the tensile strain increases, debonding and delamination occur when the stress in the
localized area exceeds that of the bond between the elastomer and the steel reinforcement.
Bearing
Configuration
Transverse
Slope
Max / Min
Transverse
Angle
Experimental
(Degrees)
Max / Min
Transverse
Angle FEA
(Degrees)
Max / Min
Longitudinal
Angle
Experimental
(Degrees)
Max / Min
Longitudinal
Angle FEA
(Degrees)
Single 0% 0 / 0 0 / 0 17 / 14 18 / 12
Single 2% 5 / 4 11 / 8 15 / 8 16 / 11
Single 4% 11 / 7 17 / 12 18 / 10 16 / 11
Single 6% 15 / 12 20 / 13 18 / 14 18 / 12
Single 8% 25 / 20 26 / 22 24 / 15 19 / 14
Double 0% 4 / -2 0 / 0 22 / 17 21 / 18
Double 2% 12 / 6 16 / 10 25 / 17 15 / 11
Double 4% 19 / 14 20 / 18 23 / 16 20 / 14
Double 6% 15 / 10 24 / 16 18 / 14 22 / 14
Double 8% 15 / 9 27 /20 19 / 10 20 / 12

0-5834 108
Figure 4.28--Strain Profile in z-direction, Rear Transverse Face, 6% Superelevation
Double Pad Configuration
Figure 4.29-- Strain Profile in z-direction, Front Transverse Face, 6% Superelevation
Double Pad Configuration

0-5834 109
Figure 4.30-- Strain Profile in z-direction, Front Longitudinal Face, 6% Superelevation
Double Pad Configuration
Figure 4.31-- Strain Profile in z-direction, Rear Transverse Face, 6% Superelevation
Double Pad Configuration

0-5834 110
4.5.3. Summary of Observations
By comparing the measured and calculated values of the transverse and longitudinal
angular deformations shown in Table 4.17 for the various load conditions, reasonable correlation
is seen between similar conditions. Approximately half of the conditions have values that are
within 25% of each other and approximately three out of four of the conditions have
experimental and analytical results that are within 50% of each other. If the average value of the
maximum and minimum values are considered, again over half of the FEA results are within
25% of the experimental values. Given the roughness of the measured experimental numbers
and the roughness of the FE model, there is reasonable correlation between the experimental
values and FEA values, indicating there is potential in the use of FE modeling for this
application.

0-5834 111
5. COMPARISON OF TESTING/OBSERVATIONS TO MODIFIED
DESIGN PROVISIONS
This chapter provides an analysis of the transverse and longitudinal displacements, bearing
slip, uplift data, damage prediction, and finite element analysis. The first research objective was
to determine if there was a need to consider the transverse superelevation in bearing design, and
if so, how it should be considered. Specifically, TechMRT attempted to determine what level of
transverse superelevation of the bearings was detrimental to the serviceability of the bearing.
5.1. Combination of Transverse and Longitudinal Displacement
The horizontal loads were applied using displacement control. The pressure in the ram
required to push the bearing the given displacement horizontally was recorded and multiplied by
the ram area to give the load in kips required to push the bearing the given displacement. After
the full horizontal displacement was reached, the longitudinal displacement was induced.
Likewise, the pressure in the ram required to push the bearing the given displacement was
recorded and converted to a load by multiplying by the area of the ram.
The theoretical load required to push the bearing the given displacement was then
calculated and compared to the actual load observed. The equation governing the displacement
of the elastomeric material was:
Equation 5.1
where Δ is the displacement (either transverse or longitudinal), F is the force applied to the
bearing, hrt is the total height of the elastomer, G is the shear modulus, and A is the plan area of
the elastomeric bearing. For the following results, an average shear modulus value of 0.115 ksi
was used. The plan area for the standard single bearing is 288 in2 and the plan area for each of
the double bearings is exactly half, 144 in2.
The results for the single bearing tests with a modeled 4% transverse slope are presented
as an example. Figure 5.1 shows the load in kips on the vertical axis plotted versus the
increasing displacement on the horizontal axis for the first load cycle. The ―predicted‖ line is the

0-5834 112
Figure 5.1 – Cycle 1 Transverse Results for 4% Test
load predicted using the deflection equation with the assumptions noted above. The ―observed‖
line is the actual load observed that was required to push the bearing the given displacement. As
Figure 5.1 shows, there is good agreement between the two.
For low displacements, the observed loads were slightly higher than the predicted loads.
Figure 5.2 shows the same two ―predicted‖ versus ―observed‖ loads for the longitudinal
displacement for the first cycle. The longitudinal displacement was induced after the transverse
displacement was induced and held in place. As shown in the figure, the deflection equation
predicted the displacement well for the low longitudinal displacements but predicted that a
higher load than observed would be required for the higher displacements.
To incorporate the data for all cycles in one chart, the ratio of the observed to the
predicted value was determined as:
Equation 5.2
4.00
6.00
8.00
10.00
12.00
14.00
16.00
0.3 0.4 0.5 0.6 0.7 0.8 0.9 1
Lo
ad
, kip
s
Displacement, in.
4% Transverse Cycle 1
Transverse Predicted
Transverse Observed

0-5834 113
Figure 5.2 – Cycle 1 Longitudinal Results for 4% Test
This ratio is plotted for all 14 test cycles in Figure 5.3. The cycles with the full 390 kip
vertical load are shown with solid lines and the cycles with the reduced vertical loading are
shown with dashed lines. In general, the ratios are above 1.0 for most cycles and transverse
displacements.
Since the ratio is over the predicted load required for the given displacement, a ratio
greater than 1.0 indicates that more force was required to deflect the bearing than predicted by
the deflection equation. This can be thought of as a conservative condition. When the ratio
drops below 1.0, the condition can be considered speculative. More deflection will occur for a
given load.
Figure 5.4 shows the ratios for the longitudinal displacements. In general, the ratios start
above 1.0 for low displacements, then drop below 1.0 as the longitudinal displacements go above
0.3 in.
Ten tests were performed with the total compressive vertical load of 390 kips, followed
by four tests with less vertical load. Figure 5.5 shows the ratio plotted versus the test number for
all 14 of the transverse tests. This figure shows the results for the single pad configuration with
0
5
10
15
20
25
0 0.2 0.4 0.6 0.8 1 1.2 1.4
Lo
ad
, kip
s
Displacement, in.
4% Longitudinal Cycle 1
Longitudinal Predicted
Longitudinal Observed

0-5834 114
Figure 5.3 – Transverse Results for all 14 Cycles
Figure 5.4 – Longitudinal Results for all 14 Cycles
0.90
0.95
1.00
1.05
1.10
1.15
1.20
1.25
1.30
1.35
1.40
0.4 0.5 0.6 0.7 0.8 0.9
Rati
o o
f A
ctu
al to
Pre
idic
ted
Lo
ad
Trans. Displacement, in.
4% Trans., Trans. Results A Cycle 1
Cycle 2
Cycle 3
Cycle 4
Cycle 5
Cycle 6
Cycle 7
Cycle 8
Cycle 9
Cycle 10
Cycle 11
Cycle 12
Cycle 13
Cycle 14
0.60
0.70
0.80
0.90
1.00
1.10
1.20
1.30
1.40
0 0.2 0.4 0.6 0.8 1 1.2 1.4
Rati
o o
f A
ctu
al to
Pre
dic
ted
Longitudinal Displacement, in.
4% Trans. Slope, Long. Results A Cycle 1
Cycle 2
Cycle 3
Cycle 4
Cycle 5
Cycle 6
Cycle 7
Cycle 8
Cycle 9
Cycle 10
Cycle 11
Cycle 12
Cycle 13
Cycle 14

0-5834 115
Figure 5.5 – Transverse Ratios versus Cycles
Figure 5.6 – Longitudinal Ratios versus Cycles
0.80
0.90
1.00
1.10
1.20
1.30
1.40
0 2 4 6 8 10 12 14
Rati
o o
f A
ctu
al to
Pre
dic
ted
Lo
ad
Test Number
4% Trans. Slope, Trans. Results B
0.45 in.
0.60 in.
0.75 in.
0.90 in.
0.40
0.50
0.60
0.70
0.80
0.90
1.00
1.10
1.20
1.30
1.40
0 2 4 6 8 10 12 14
Rati
o o
f A
ctu
al to
Pre
dic
ted
Lo
ad
Test No.
4% Trans. Slope, Long. Results B
0.20 in.
0.40 in.
0.60 in.
0.80 in.
1.00 in.
1.20 in.

0-5834 116
4% superelevation. No definite trend was noticed in this limited number of tests. Figure 5.6
shows the same results for the longitudinal tests. Again, no definite trend was noticed.
Figure 5.7 through Figure 5.24 show the ratio plotted versus the test number for all 14 of
the tests performed. Each figure provides the ratios versus the transverse or longitudinal
displacements for each bearing pad configuration and superelevation tested.
The results for the single pad tests are shown first. For only transverse loading, the ratios
stay conservative (above 1.0) for transverse slopes of approximately 4.0% or less. However,
when the longitudinal loading is applied in conjunction with the transverse loading, the ratios
drop below 1.0 for longitudinal displacements as low as approximately 0.35 in. This indicates
that single pads that experience both a transverse and longitudinal force exert more force to the
superstructure than predicted with the conventional equations when the longitudinal
displacement exceeds approximately 0.35 in.
Figure 5.7 – Single Pad Long. Results for 0% Test
0.60
0.70
0.80
0.90
1.00
1.10
1.20
1.30
1.40
1.50
0.1 0.3 0.5 0.7 0.9 1.1 1.3
Rati
o o
f A
ctu
al to
Pre
dic
ted
Longitudinal Displacement, in.
0% Trans. Slope, Long. Results Cycle 1 Cycle 2
Cycle 3 Cycle 4
Cycle 5 Cycle 6
Cycle 7 Cycle 8
Cycle 9 Cycle 10
Cycle 11 Cycle 12
Cycle 13 Cycle 14

0-5834 117
Figure 5.8 – Single Pad Transverse Results for 2% Test
Figure 5.9 – Single Pad Long. Results for 2% Test
0.60
0.80
1.00
1.20
1.40
1.60
1.80
0.1 0.15 0.2 0.25 0.3 0.35 0.4 0.45 0.5
Rati
o o
f A
ctu
al to
Pre
idic
ted
Lo
ad
Trans. Displacement, in.
2% Trans., Trans. Results
Cycle 1 Cycle 2
Cycle 3 Cycle 4
Cycle 5 Cycle 6
Cycle 7 Cycle 8
Cycle 9 Cycle 10
Cycle 11 Cycle 12
Cycle 13 Cycle 14
0.60
0.70
0.80
0.90
1.00
1.10
1.20
1.30
1.40
1.50
0.1 0.3 0.5 0.7 0.9 1.1 1.3
Rati
o o
f A
ctu
al to
Pre
dic
ted
Longitudinal Displacement, in.
2% Trans. Slope, Long. Results
Cycle 1 Cycle 2
Cycle 3 Cycle 4
Cycle 5 Cycle 6
Cycle 7 Cycle 8
Cycle 9 Cycle 10
Cycle 11 Cycle 12
Cycle 13 Cycle 14

0-5834 118
Figure 5.10 – Single Pad Trans. Results for 4% Test
Figure 5.11- Single Pad Long. Results for 4% Test
0.60
0.80
1.00
1.20
1.40
1.60
1.80
0.4 0.5 0.6 0.7 0.8 0.9
Rati
o o
f A
ctu
al to
Pre
idic
ted
Lo
ad
Trans. Displacement, in.
4% Trans., Trans. Results A
Cycle 1 Cycle 2
Cycle 3 Cycle 4
Cycle 5 Cycle 6
Cycle 7 Cycle 8
Cycle 9 Cycle 10
Cycle 11 Cycle 12
Cycle 13 Cycle 14
0.60
0.70
0.80
0.90
1.00
1.10
1.20
1.30
1.40
1.50
0.1 0.3 0.5 0.7 0.9 1.1 1.3
Rati
o o
f A
ctu
al to
Pre
dic
ted
Longitudinal Displacement, in.
4% Trans. Slope, Long. Results
Cycle 1 Cycle 2
Cycle 3 Cycle 4
Cycle 5 Cycle 6
Cycle 7 Cycle 8
Cycle 9 Cycle 10
Cycle 11 Cycle 12
Cycle 13 Cycle 14

0-5834 119
Figure 5.12 – Single Pad Trans. Results for 6% Test
Figure 5.13 – Single Pad Long. Results for 6% Test
0.60
0.80
1.00
1.20
1.40
1.60
1.80
0.4 0.5 0.6 0.7 0.8 0.9 1 1.1 1.2 1.3 1.4
Rati
o o
f A
ctu
al to
Pre
idic
ted
Lo
ad
Trans. Displacement, in.
6% Trans., Trans. Results
Cycle 1 Cycle 2
Cycle 3 Cycle 4
Cycle 11 Cycle 12
Cycle 13 Cycle 14
0.60
0.70
0.80
0.90
1.00
1.10
1.20
1.30
1.40
1.50
0.1 0.3 0.5 0.7 0.9 1.1 1.3
Rati
o o
f A
ctu
al to
Pre
dic
ted
Longitudinal Displacement, in.
6% Trans. Slope, Long. Results
Cycle 1 Cycle 2
Cycle 3 Cycle 4
Cycle 11 Cycle 12
Cycle 13 Cycle 14
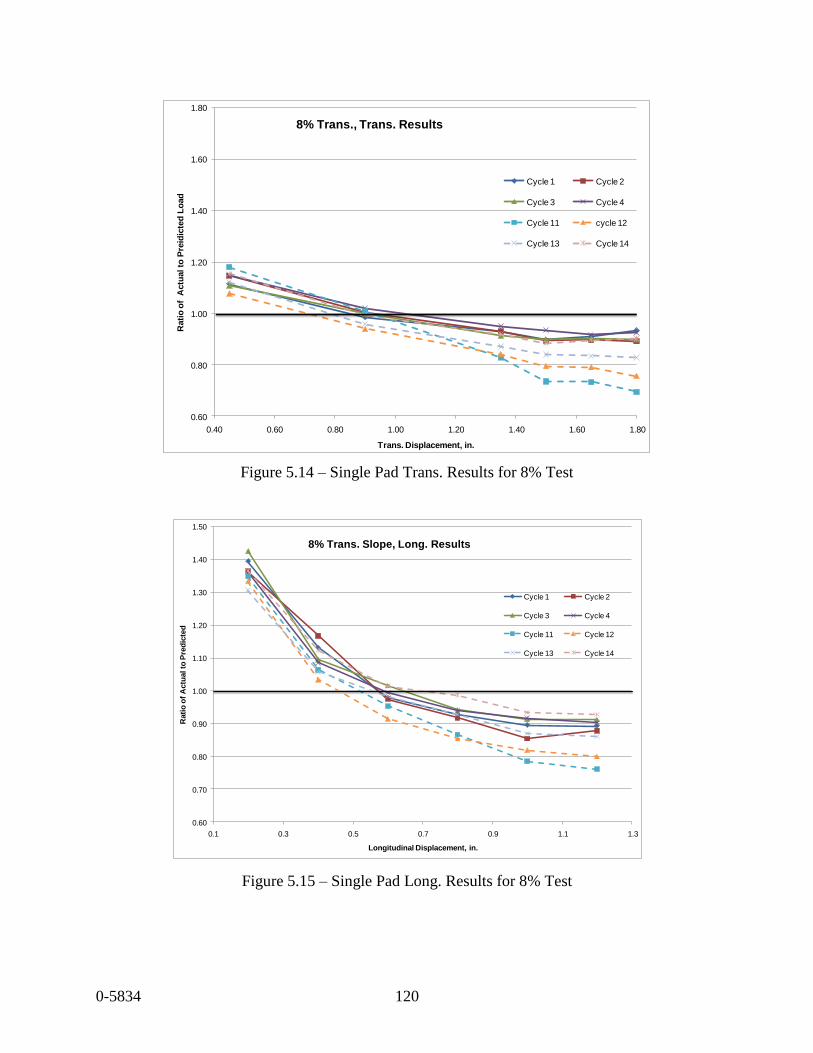
0-5834 120
Figure 5.14 – Single Pad Trans. Results for 8% Test
Figure 5.15 – Single Pad Long. Results for 8% Test
0.60
0.80
1.00
1.20
1.40
1.60
1.80
0.40 0.60 0.80 1.00 1.20 1.40 1.60 1.80
Rati
o o
f A
ctu
al to
Pre
idic
ted
Lo
ad
Trans. Displacement, in.
8% Trans., Trans. Results
Cycle 1 Cycle 2
Cycle 3 Cycle 4
Cycle 11 cycle 12
Cycle 13 Cycle 14
0.60
0.70
0.80
0.90
1.00
1.10
1.20
1.30
1.40
1.50
0.1 0.3 0.5 0.7 0.9 1.1 1.3
Rati
o o
f A
ctu
al to
Pre
dic
ted
Longitudinal Displacement, in.
8% Trans. Slope, Long. Results
Cycle 1 Cycle 2
Cycle 3 Cycle 4
Cycle 11 Cycle 12
Cycle 13 Cycle 14

0-5834 121
Results for the double pad tests are shown next. For only transverse loading, the ratios
stay conservative (above 1.0) for transverse slopes of approximately 6.0% or less. This is
slightly better than the single pad results. Since the double pads have a higher resistance to
bending in the transverse direction, this was not unexpected. When the longitudinal loading is
applied in conjunction with the transverse loading, the ratios drop below 1.0 for longitudinal
displacements of approximately 0.70 in. (approximately twice the limit for the single pads) This
indicates that double pads that experience both a transverse and longitudinal force exert more
force to the superstructure than predicted with the conventional equations when the longitudinal
displacement exceeds approximately 0.70 in.
Figure 5.16 – Double Pad Long. Results for 0% Test
0.60
0.70
0.80
0.90
1.00
1.10
1.20
1.30
1.40
1.50
1.60
0.1 0.3 0.5 0.7 0.9 1.1 1.3
Rati
o o
f A
ctu
al to
Pre
dic
ted
Longitudinal Displacement, in.
0% Trans. Slope, Long. Results
Cycle 1 Cycle 2
Cycle 3 Cycle 4
Cycle 5 Cycle 6
Cycle 7 Cycle 8
Cycle 9 Cycle 10
Cycle 11 Cycle 12
Cycle 13 Cycle 14

0-5834 122
Figure 5.17 – Double Pad Trans. Results for 2% Test
Figure 5.18 – Double Pad Long. Results for 2% Test
0.50
1.00
1.50
2.00
2.50
3.00
3.50
0 0.05 0.1 0.15 0.2 0.25 0.3 0.35 0.4 0.45 0.5
Rati
o o
f A
ctu
al to
Pre
idic
ted
Lo
ad
Trans. Displacement, in.
2% Trans., Trans. Results
Cycle 1 Cycle 2
Cycle 3 Cycle 6
Cycle 11 Cycle 12
Cycle 13 Cycle 14
0.60
0.80
1.00
1.20
1.40
1.60
1.80
0.1 0.3 0.5 0.7 0.9 1.1 1.3
Rati
o o
f A
ctu
al to
Pre
dic
ted
Longitudinal Displacement, in.
2% Trans. Slope, Long. Results
Cycle 1 Cycle 2
Cycle 3 Cycle 4
Cycle 5 Cycle 6
Cycle 7 Cycle 8
Cycle 9 Cycle 10
Cycle 11 Cycle 12
Cycle 13 Cycle 14

0-5834 123
Figure 5.19 – Double Pad Trans. Results for 4% Test
Figure 5.20 – Double Pad Long. Results for 4% Test
0.60
0.80
1.00
1.20
1.40
1.60
1.80
2.00
2.20
2.40
0.05 0.15 0.25 0.35 0.45 0.55 0.65 0.75 0.85 0.95
Rati
o o
f A
ctu
al to
Pre
idic
ted
Lo
ad
Trans. Displacement, in.
4% Trans., Trans. Results
Cycle 1 Cycle 2
Cycle 3 Cycle 4
Cycle 5 Cycle 6
Cycle 7 Cycle 8
Cycle 9 Cycle 10
Cycle 11 Cycle 12
Cycle 13 Cycle 14
0.60
0.80
1.00
1.20
1.40
1.60
1.80
2.00
0.1 0.3 0.5 0.7 0.9 1.1 1.3
Rati
o o
f A
ctu
al to
Pre
dic
ted
Longitudinal Displacement, in.
4% Trans. Slope, Long. Results
Cycle 1 Cycle 2
Cycle 3 Cycle 4
Cycle 5 Cycle 6
Cycle 7 Cycle 8
Cycle 9 Cycle 10
Cycle 11 Cycle 12
Cycle 13 Cycle 14

0-5834 124
Figure 5.21 – Double Pad Trans. Results for 6% Test
Figure 5.22 – Double Pad Long. Results for 6% Test
0.60
0.80
1.00
1.20
1.40
1.60
1.80
0.1 0.3 0.5 0.7 0.9 1.1 1.3
Rati
o o
f A
ctu
al to
Pre
idic
ted
Lo
ad
Trans. Displacement, in.
6% Trans., Trans. Results
Cycle 1 Cycle 2
Cycle 3 Cycle 4
Cycle 11 Cycle 12
Cycle 13 Cycle 14
0.60
0.80
1.00
1.20
1.40
1.60
1.80
2.00
2.20
2.40
0.1 0.3 0.5 0.7 0.9 1.1 1.3
Rati
o o
f A
ctu
al to
Pre
dic
ted
Longitudinal Displacement, in.
6% Trans. Slope, Long. Results
Cycle 1 Cycle 2
Cycle 3 Cycle 4
Cycle 11 Cycle 12
Cycle 13 Cycle 14

0-5834 125
Figure 5.23 – Double Pad Results for 8% Test
Figure 5.24 – Double Pad Long. Results for 8% Test
0.60
0.70
0.80
0.90
1.00
1.10
1.20
1.30
1.40
0.40 0.60 0.80 1.00 1.20 1.40 1.60
Rati
o o
f A
ctu
al to
Pre
idic
ted
Lo
ad
Trans. Displacement, in.
8% Trans., Trans. Results
Cycle 1 Cycle 2
Cycle 3 Cycle 4
Cycle 11 Cycle 12
Cycle 13 Cycle 14
0.60
0.80
1.00
1.20
1.40
1.60
1.80
2.00
0.1 0.3 0.5 0.7 0.9 1.1 1.3
Rati
o o
f A
ctu
al to
Pre
dic
ted
Longitudinal Displacement, in.
8% Trans. Slope, Long. Results
Cycle 2 Cycle 3
Cycle 4 Cycle 11
Cycle 12 Cycle 13
Cycle 14

0-5834 126
5.2. Prediction of Transverse and Longitudinal Deflections
The analysis of transverse and longitudinal deflections in section 5.1 focused mainly on
the forces required to cause the deflections. This section will present a discussion of the
observed shear strains in the longitudinal and transverse directions and a prediction of the shear
strains in their respective direction. This analysis was based on the laboratory observation of the
displaced angles in the transverse and longitudinal directions. The raw data upon which the
analyses are based is provided in Section 4.4. TechMRT used Statistical Analysis Software
(SAS®), Version 9.2, to aid in the regression calculations.
5.2.1. Analysis of Transverse Angles Observed
The first observation with respect to the transverse displacement is that the average
transverse angle witnessed increased with an increase in superelevation. These trends are
illustrated in Figure 5.25 and Figure 5.26. In addition to the average displacements, a prediction
line resulting from linear regression analysis appears in each figure that will be discussed later in
this section.
Figure 5.25—Summary of Transverse Displacement, Single Bearing Configuration
(5.0)
0.0
5.0
10.0
15.0
20.0
25.0
0 1 2 3 4 5 6 7 8
An
gle
(D
egr
ee
s)
Superelevation (%)
Average Angle Displacement Versus Superelevation--Single Bearing Configuration, 390 K Load
Average Transverse Angle, Left
Average Transverse Angle, Right
Linear (Regression Prediction)

0-5834 127
Figure 5.26—Summary of Transverse Displacement, Double Bearing Configuration
This pattern makes sense in that for an increased superelevation, one would expect an
increase in the transverse angle observed. This increase continued throughout for each
incremental increase in superelevation for the single pad configuration. The increase in the
resulting transverse angle with an incremental increase in superelevation is not as apparent with
the double pad configuration, but it does exist. The incremental increase in the transverse with
an increase in superelevation appears to reach a point of diminishing returns for the double
bearing configuration. This trend will be explained later in this section when discussing the
regression analysis.
Figure 5.27 through Figure 5.30 show the observed change in transverse angle after the
application of all the forces to the bearing pads for each test run of the single pad configuration at
each respective superelevation. Test runs one through ten use a total vertical load of 390 kips,
while test runs 11 through 14 use a total vertical load of 150 kips, 210 kips, 270 kips, and 330
kips, respectively. From the patterns illustrated in Figure 5.27 through Figure 5.30, the vertical
load applied also appears to effect the resulting transverse displacement. Thus for the single pad
configuration, there appears to be an increase in the transverse angle observed with an increase in
the total vertical load applied.
0.0
2.0
4.0
6.0
8.0
10.0
12.0
14.0
16.0
18.0
20.0
0 1 2 3 4 5 6 7 8
An
gle
(D
egr
ee
s)
Superelevation (%)
Average Angle Displacement Versus Superelevation--Double Bearing Configuration, 390 K Load
Average Transverse Angle, Left
Average Transverse Angle, Right
Linear (Regression Prediction)

0-5834 128
Figure 5.27--Summary of Transverse Displacement, 2% Single Pad Configuration
Figure 5.28--Summary of Transverse Displacement, 4% Single Pad Configuration
-4
-2
0
2
4
6
8
10
12
14
16
0 1 2 3 4 5 6 7 8 9 10 11 12 13 14
An
gle
(D
egr
ee
s)
Test Series
Single Bearing Configuration, 2% Superelevation
Transverse Angle, Left
Transverse Angle, Right
-5
0
5
10
15
20
0 1 2 3 4 5 6 7 8 9 10 11 12 13 14
An
gle
(D
egr
ee
s)
Test Run
Single Bearing Configuration, 4% Superelevation
Transverse Angle with, Left
Transverse Angle, Right

0-5834 129
Figure 5.29--Summary of Transverse Displacement, 6% Single Pad Configuration
Figure 5.30--Summary of Transverse Displacement, 8% Single Pad Configuration
Figure 5.31 through Figure 5.34 show the observed change in transverse angle after the
application of all forces to the double bearing pads for each test run at each respective
superelevation. The vertical loads for each test run match those of the single pad configuration
discussed earlier. The trend for the effect of the vertical load on the observed transverse angle is
0
2
4
6
8
10
12
14
16
0 1 2 3 4 5 6 7 8 9 10 11 12 13 14
An
gle
(D
egr
ee
s)
Test Series
Single Bearing Configuration, 6% Superelevation
Transverse Angle, Left
Transverse Angle, Right
0
5
10
15
20
25
30
0 1 2 3 4 5 6 7 8 9 10 11 12 13 14
An
gle
(D
egr
ee
s)
Test Series
Single Bearing Configuration, 8% Superelevation
Transverse Angle, Left
Transverse Angle, Right

0-5834 130
not as visible for the double pad configuration as it was with the single pad configuration. A
trend is believed to exist but is not visually apparent, and will be discussed in section 5.2.3 of
this chapter.
5.2.2. Analysis of Longitudinal Angles Observed
Figure 5.35 and Figure 5.36 display the average change in the longitudinal angle
observed after the application of all forces to the bearing pads. In addition to the average change
in angles, a prediction line resulting from linear regression analysis appears in each figure that
will be discussed in the regression section of this chapter. An interesting trend develops for the
longitudinal angles in that the longitudinal angle increases with an increase in superelevation for
the single pad, yet decreases for an increase in superelevation for the double pad configuration.
Figure 5.37 through Figure 5.41 show the observed change in the longitudinal angle after
the application of the all the forces to the bearing pads for each single pad test run at each
respective superelevation. Test runs one through ten use a total vertical load of 390 kips while
test runs 11 through 14 use a total vertical load of 150 kips, 210 kips, 270 kips, and 330 kips,
respectively. As with the transverse angles observed, there appears to be a trend for the
longitudinal angle observed with a respective increase in the vertical load applied. The trend
does not appear to be as strong for the longitudinal angle as it did with the transverse angles.
Figure 5.42 through Figure 5.46 show the observed change in the longitudinal angle after
the application of all forces to the double bearing pads for each test run at each respective
superelevation. The vertical loads for each test run match those of the single pad configuration
discussed earlier. Similar to that of the transverse angle case, no significant trend appears for the
longitudinal angles observed for the double pad configuration within each superelevation.

0-5834 131
Figure 5.31--Summary of Transverse Displacement, 2% Double Pad Configuration
Figure 5.32--Summary of Transverse Displacement, 4% Double Pad Configuration
0
5
10
15
20
25
0 1 2 3 4 5 6 7 8 9 10 11 12 13 14
An
gle
(D
egr
ee
s)
Test Series
Double Bearing Configuration, 2% Superelevation
Transverse Angle, Left
Transverse Angle, Right
0
5
10
15
20
25
0 1 2 3 4 5 6 7 8 9 10 11 12 13 14
An
gle
(D
egr
ee
s)
Test Run
Double Bearing Configuration, 4% Superelevation
Transverse Angle, Left
Transverse Angle, Right

0-5834 132
Figure 5.33--Summary of Transverse Displacement, 6% Double Pad Configuration
Figure 5.34--Summary of Transverse Displacement, 8% Double Pad Configuration
0
5
10
15
20
25
0 1 2 3 4 5 6 7 8 9 10 11 12 13 14
An
gle
(D
egr
ee
s)
Test Series
Double Bearing Configuration, 6% Superelevation
Transverse Angle, Left
Transverse Angle, Right
0
5
10
15
20
25
0 1 2 3 4 5 6 7 8 9 10 11 12 13 14
An
gle
(D
egr
ee
s)
Test Series
Double Bearing Configuration, 8% Superelevation
Transverse Angle, Left
Transverse Angle, Right

0-5834 133
Figure 5.35--Summary of Longitudinal Displacement, Single Pad Configuration
Figure 5.36--Summary of Longitudinal Displacement, Double Pad Configuration
0.0
5.0
10.0
15.0
20.0
25.0
0 1 2 3 4 5 6 7 8
An
gle
(D
egr
ee
s)
Superelevation (%)
Average Angle Displacement Versus Superelevation--Single Bearing Configuration, 390 K Load
Average Longitudinal Angle, Front
Average Longitudinal Angle, Back
Linear (Regression)
0.0
5.0
10.0
15.0
20.0
25.0
0 1 2 3 4 5 6 7 8
An
gle
(D
egr
ee
s)
Superelevation (%)
Average Angle Displacement Versus Superelevation--Double Bearing Configuration, 390 K Load
Average Longitudinal Angle, Front
Average Longitudinal Angle, Back
Linear (Regression)

0-5834 134
Figure 5.37--Summary of Longitudinal Displacement, 0% Single Pad Configuration
Figure 5.38--Summary of Longitudinal Displacement, 2% Single Pad Configuration
-4
-2
0
2
4
6
8
10
12
14
16
0 1 2 3 4 5 6 7 8 9 10 11 12 13 14
An
gle
(D
egr
ee
s)
Test Series
Single Bearing Configuration, 0% Superelevation
Max Longitudinal Angle, Front
Max Longitudinal Angle, Back
-4
-2
0
2
4
6
8
10
12
14
16
0 1 2 3 4 5 6 7 8 9 10 11 12 13 14
An
gle
(D
egr
ee
s)
Test Series
Single Bearing Configuration, 2% Superelevation
Max Longitudinal Angle, Front
Max Longitudinal Angle, Back

0-5834 135
Figure 5.39--Summary of Longitudinal Displacement, 4% Single Pad Configuration
Figure 5.40--Summary of Longitudinal Displacement, 6% Single Pad Configuration
-5
0
5
10
15
20
0 1 2 3 4 5 6 7 8 9 10 11 12 13 14
An
gle
(D
egr
ee
s)
Test Run
Single Bearing Configuration, 4% Superelevation
Max Longitudinal Angle, Front
Max Longitudinal Angle,Back
0
2
4
6
8
10
12
14
16
18
20
0 1 2 3 4 5 6 7 8 9 10 11 12 13 14
An
gle
(D
egr
ee
s)
Test Series
Single Bearing Configuration, 6% Superelevation
Max Longitudinal Angle, Front
Max Longitudinal Angle, Back

0-5834 136
Figure 5.41--Summary of Longitudinal Displacement, 8% Single Pad Configuration
Figure 5.42--Summary of Longitudinal Displacement, 0% Double Pad Configuration
0
5
10
15
20
25
30
0 1 2 3 4 5 6 7 8 9 10 11 12 13 14
An
gle
(D
egr
ee
s)
Test Series
Single Bearing Configuration, 8% Superelevation
Max Longitudinal Angle, Front
Max Longitudinal Angle, Back
0
5
10
15
20
25
0 1 2 3 4 5 6 7 8 9 10 11 12 13 14
An
gle
(D
egr
ee
s)
Test Series
Double Bearing Configuration, 0% Superelevation
Max Longitudinal Angle, Front
Max Longitudinal Angle, Back

0-5834 137
Figure 5.43--Summary of Longitudinal Displacement, 2% Double Pad Configuration
Figure 5.44--Summary of Longitudinal Displacement, 4% Double Pad Configuration
0
5
10
15
20
25
0 1 2 3 4 5 6 7 8 9 10 11 12 13 14
An
gle
(D
egr
ee
s)
Test Series
Double Bearing Configuration, 2% Superelevation
Max Longitudinal Angle, Front
Max Longitudinal Angle, Back
0
5
10
15
20
25
0 1 2 3 4 5 6 7 8 9 10 11 12 13 14
An
gle
(D
egr
ee
s)
Test Run
Double Bearing Configuration, 4% Superelevation
Max Longitudinal Angle, Front
Max Longitudinal Angle,Back

0-5834 138
Figure 5.45--Summary of Longitudinal Displacement, 6% Double Pad Configuration
Figure 5.46--Summary of Longitudinal Displacement, 8% Double Pad Configuration
0
5
10
15
20
25
0 1 2 3 4 5 6 7 8 9 10 11 12 13 14
An
gle
(D
egr
ee
s)
Test Series
Double Bearing Configuration, 6% Superelevation
Max Longitudinal Angle, Front
Max Longitudinal Angle, Back
0
5
10
15
20
25
0 1 2 3 4 5 6 7 8 9 10 11 12 13 14
An
gle
(D
egr
ee
s)
Test Series
Double Bearing Configuration, 8% Superelevation
Max Longitudinal Angle, Front
Max Longitudinal Angle, Back

0-5834 139
5.2.3. Regression Analysis of Laboratory Results
TechMRT conducted a regression analysis in order to determine if a prediction model for
the transverse and longitudinal displacements could be developed. Table 5.1 shows the predictor
variables used in the regression models analyzed. Initially, it was thought that separate models
would need to be developed for the single pad and double pad configurations. With the addition
of an indicator variable to account for the bearing pad configuration, this idea was decided
against in favor of a single model that predicts the displacements. Two models were developed:
first for the transverse displacement, Y1 in degrees, and second for the longitudinal
displacement, Y2 in degrees.
Table 5.1—Predictor Variables used in Regression Analysis
To begin the analysis, a stepwise procedure was used to determine which variable
combinations best explain the observed data. Once the variables were identified, models were
run to determine which model provided the best fit. TechMRT used the adjusted R-square value
for each model to determine which model was the best. Statistically speaking, the R-square
value for a specific model will generally increase when additional variables are added to the
model. The adjusted R-square value takes into account the number of variables in the model,
thus providing a better decision criterion to determine the best model. Ultimately, the best
prediction model would be the simplest model having the highest adjusted R-square value.
Predictor
Variable Description
X1 The Transverse Superelevation of the beam, expressed as a percent.
X2An Indicator Value to describe the bearing configuration, 0 for a single bearing
and 1 for a double bearing
X3 Total Vertical Load Applied to Bearing Configuration in Kips
X12The interaction of both the transverse superelevation and bearing configuration
(X1 times X2)
X13The interaction of both the transverse superelevation and total vertical load (X1
times X3)
X1sq Square of the Transverse Superelevation

0-5834 140
It became apparent from the stepwise analysis that predictor variables representing the
superelevation of the beam and the bearing pad configuration provide a good starting point for
the prediction model of both the transverse and longitudinal displacements. This makes sense as
it mirrors the results discussed in the previous section. From here, eleven models for the
transverse displacement were run containing different combinations of additional variables
beyond the two initial variables. The best models based upon the adjusted R-square value and
the results of the regression analysis are shown in Figure 5.47 and Figure 5.48.
Figure 5.47– Regression Summary for Model 7, Transverse Angle
The two models are very similar. Both models incorporate the superelevation of the
bearing, the bearing pad configuration, and the interaction of these two variables. Model 7
incorporates the vertical load applied while Model 11 incorporates the interaction of the
Model: 7 Variable: Y1
Source
Degrees
of
Freedom
Sum of
Squares
Mean
Square F-Value Pr > F
Model 4 6351.02535 1587.756 176.13 <.0001
Error 223 2010.22026 9.01444
Corrected
Total 227 8361.24561
0.7596
0.7553
Variable
Degrees
of
Freedom
Parameter
Estimate
Standard
Error t-Value Pr > |t|
Intercept 1 -4.90711 0.97775 -5.02 <.0001
X1 1 2.2331 0.10446 21.38 <.0001
X2 1 4.27978 0.63841 6.7 <.0001
X3 1 0.01358 0.00246 5.52 <.0001
x12 2 -0.61591 0.14909 -4.13 <.0001
Comparative Regression Models
Analysis of Variance
R-Square:
Adjusted R-Square:
Parameter Estimates
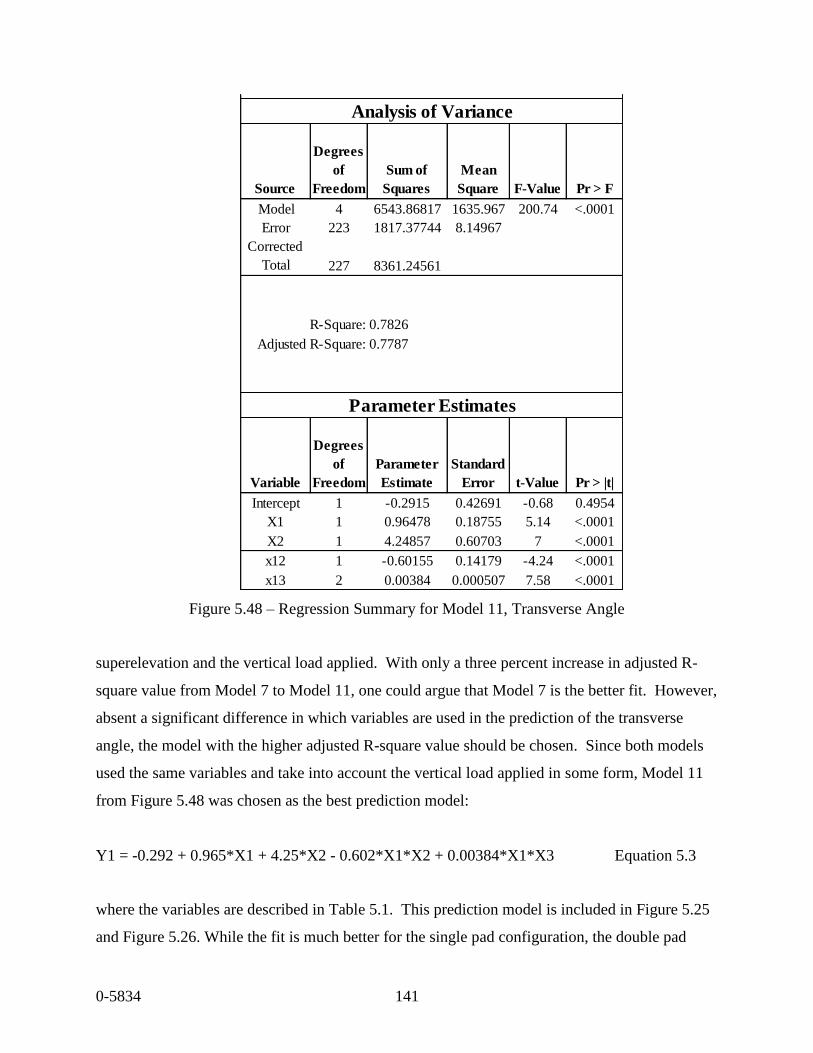
0-5834 141
Figure 5.48 – Regression Summary for Model 11, Transverse Angle
superelevation and the vertical load applied. With only a three percent increase in adjusted R-
square value from Model 7 to Model 11, one could argue that Model 7 is the better fit. However,
absent a significant difference in which variables are used in the prediction of the transverse
angle, the model with the higher adjusted R-square value should be chosen. Since both models
used the same variables and take into account the vertical load applied in some form, Model 11
from Figure 5.48 was chosen as the best prediction model:
Y1 = -0.292 + 0.965*X1 + 4.25*X2 - 0.602*X1*X2 + 0.00384*X1*X3 Equation 5.3
where the variables are described in Table 5.1. This prediction model is included in Figure 5.25
and Figure 5.26. While the fit is much better for the single pad configuration, the double pad
Model: 11 Variable: Y1
Source
Degrees
of
Freedom
Sum of
Squares
Mean
Square F-Value Pr > F
Model 4 6543.86817 1635.967 200.74 <.0001
Error 223 1817.37744 8.14967
Corrected
Total 227 8361.24561
0.7826
0.7787
Variable
Degrees
of
Freedom
Parameter
Estimate
Standard
Error t-Value Pr > |t|
Intercept 1 -0.2915 0.42691 -0.68 0.4954
X1 1 0.96478 0.18755 5.14 <.0001
X2 1 4.24857 0.60703 7 <.0001
x12 1 -0.60155 0.14179 -4.24 <.0001
x13 2 0.00384 0.000507 7.58 <.0001
Comparative Regression Models
Analysis of Variance
R-Square:
Adjusted R-Square:
Parameter Estimates

0-5834 142
configuration fit is acceptable. With an adjusted R-square value approaching 0.8, this model is
fairly good in predicting the transverse displacement considering the variability in the data. If
the R-square value had not been so high, separate prediction models would have been justified
for each pad configuration rather than one a single model that accounts for the pad
configurations.
For the longitudinal angles observed, the same analysis used for the transverse angle was
conducted to determine the best model. Again, the stepwise procedure yielded the same starting
point of using the superelevation of the bearing and pad configuration as the base model to start
with. From there, twelve different models were analyzed. The best two models, based on the
adjusted R-square criteria, were for Models 5 and 7. These models are highlighted in Figure
5.49 and Figure 5.50, respectively.
Figure 5.49– Regression Summary for Model 5, Longitudinal Angle
Model: 5 Variable: Y2
Source
Degrees
of
Freedom
Sum of
Squares
Mean
Square F-Value Pr > F
Model 3 1637.91092 545.9703 76.83 <.0001
Error 224 1591.80838 7.10629
Corrected
Total 227 3229.7193
0.5071
0.5005
Variable
Degrees
of
Freedom
Parameter
Estimate
Standard
Error t-Value Pr > |t|
Intercept 1 12.29029 0.39801 30.88 <.0001
X1 1 0.47787 0.09224 5.18 <.0001
X2 1 8.30411 0.56683 14.65 <.0001
x12 1 -1.22941 0.13237 -9.29 <.0001
R-Square:
Adjusted R-Square:
Parameter Estimates
Comparative Regression Models
Analysis of Variance

0-5834 143
Figure 5.50– Regression Summary for Model 7, Longitudinal Angle
The prediction models shown in Figure 5.49 and Figure 5.50 contain the predictor
variables of the bearing‘s superelevation, pad configuration, and the interaction of these two
effects. The difference is that Model 7 also utilizes the total vertical load applied in accounting
for the prediction of the longitudinal angle observed. Remember that slight trends accounting for
the total vertical load did appear in the figures in the previous section. This fact combined with a
significantly higher adjusted R-square value (a nearly 20% increase) led TechMRT to chose
Model 7 as the best prediction model for the longitudinal displacement. The model is shown in
Equation 5.4. This prediction model is also included in Figure 5.35 and Figure 5.36 and appears
to fit very well.
Model: 7 Variable: Y2
Source
Degrees
of
Freedom
Sum of
Squares
Mean
Square F-Value Pr > F
Model 4 1938.86292 484.7157 83.74 <.0001
Error 223 1290.85638 5.78859
Corrected
Total 227 3229.7193
0.6003
0.5932
Variable
Degrees
of
Freedom
Parameter
Estimate
Standard
Error t-Value Pr > |t|
Intercept 1 7.2696 0.78351 9.28 <.0001
X1 1 0.54122 0.08371 6.47 <.0001
X2 1 8.30073 0.51158 16.23 <.0001
X3 1 0.01421 0.00197 7.21 <.0001
x12 2 -1.21939 0.11947 -10.21 <.0001
R-Square:
Adjusted R-Square:
Parameter Estimates
Comparative Regression Models
Analysis of Variance

0-5834 144
Y2 = 7.27 + 0.541*X1 + 8.30*X2 + 0.0142*X3 – 1.22*X1*X2 Equation 5.4
where the variables are described in Table 5.1.
5.2.4. Summary of Transverse and Longitudinal Displacements
In summary, both the transverse and longitudinal displacements of the bearing pads are
affected by the bearing‘s superelevation and pad configuration, along with the interaction of
these two variables. Both displacements are also affected by the total vertical load applied to the
bearing; however, they differ in the way the load affects the displacement. For the transverse
displacement, the total vertical load applied interacts with the superelevation to account for the
angle displaced while just the total vertical load itself accounts for the longitudinal angle‘s
displacement. The prediction equations for the transverse and longitudinal displacements are
provided in Equation 5.3 and Equation 5.4, respectively.
5.3. Prediction of Uplift and/or Slipping
Each bearing was tested under identical conditions for the first ten test runs consisting of
a 390 kip vertical load. Test runs 11, 12, 13, and 14 had 150 kip, 210 kip, 270 kip, and 330 kip
vertical loads respectively. The superelevations of 0%, 2%, 4%, 6%, and 8% were evaluated for
both the single bearing and double bearing conditions. In addition to the forces required to cause
the transverse and longitudinal displacements expected, any slip of the bearing with respect to
the center block was measured. This slip represents the movement of the bearing with respect to
the beam that is transferring its load to the pier via the elastomeric bearing. In essence, this is a
measurement of the walking of the elastomeric bearing with respect to the beam.
5.3.1. Measurement of Slip
Slip measurements were taken for each test run at various points during the tests to
determine if a pattern existed in the resulting slip. Slip was measured at each superelevation of
0%, 2%, 4%, 6%, and 8% for each test run until the maximum transverse slope for each test
series was reached. For example, if the test run being conducted was to see a maximum
superelevation of 6%, slip was measured at the 0%, 2%, 4%, and 6% transverse superelevation
points respectively.

0-5834 145
Slip was measured with a ruler. Bearings were placed on the concrete blocks according
to TxDOT provisions. The bearing positions were lined with a black, permanent marker in order
to place the bearings in the same position at the start of each test series. Measuring slip consisted
of recording the linear change of position of the bearing with respect to the reference lines for the
original placement of the bearing. An illustration of bearing slip is shown in Figure 5.51 and
Figure 5.52. The reference lines show the original placement of the bearing.
Figure 5.51 – Illustration of Slip, Transverse Front
Slip measurements were obtained at three different locations for each test run as shown in
Figure 5.53. Two transverse measurements were obtained at the front and back of the bearing
with reference to the line heading into the photo. One longitudinal measurement was obtained at
the back of the bearing with respect to the line parallel to the photograph. The three slip
measurements were labeled the transverse front, transverse back, and longitudinal slips. The
transverse front measurement recorded the transverse displacement of the bearing measured at
the corner opposite of where the transverse force was applied, and on the side of the bearing
where the longitudinal force was applied to the bearing. The transverse back slip measurement
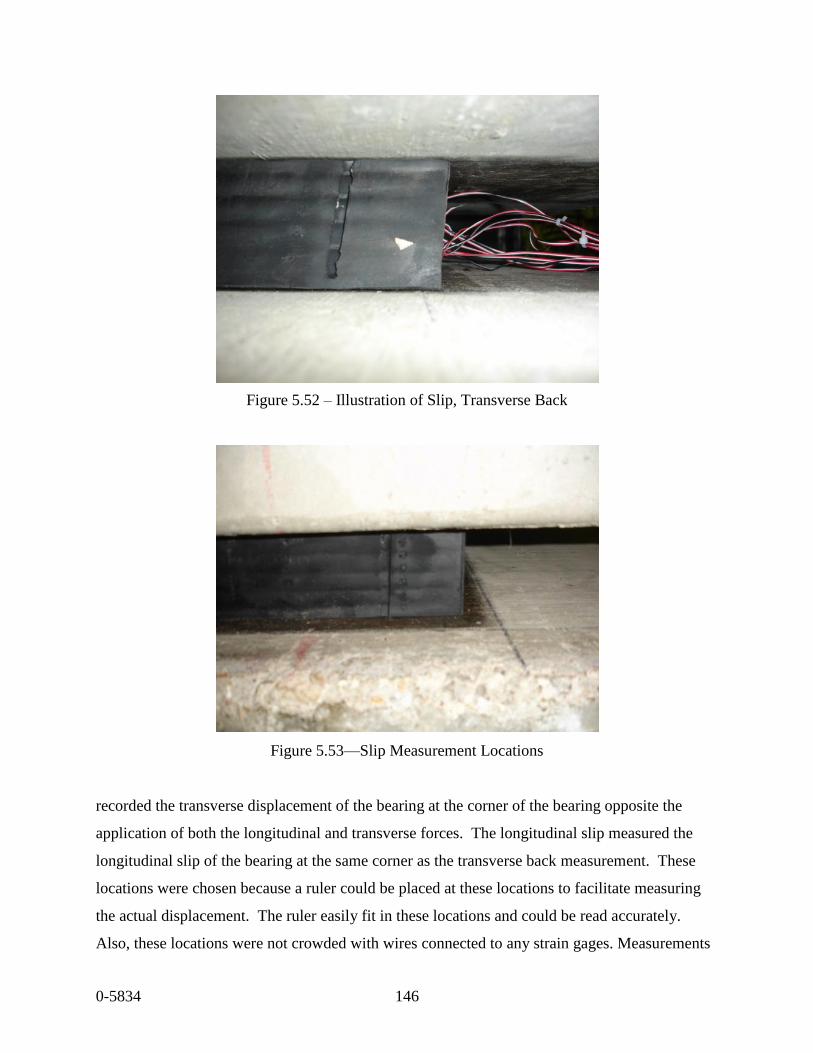
0-5834 146
Figure 5.52 – Illustration of Slip, Transverse Back
Figure 5.53—Slip Measurement Locations
recorded the transverse displacement of the bearing at the corner of the bearing opposite the
application of both the longitudinal and transverse forces. The longitudinal slip measured the
longitudinal slip of the bearing at the same corner as the transverse back measurement. These
locations were chosen because a ruler could be placed at these locations to facilitate measuring
the actual displacement. The ruler easily fit in these locations and could be read accurately.
Also, these locations were not crowded with wires connected to any strain gages. Measurements

0-5834 147
taken from areas with wires present might have interfered with the ability to obtain accurate,
consistent measurements.
It was difficult to determine when slipping first occurred during each test. When loaded,
the corners of the bearings began to ‗curl‘ which looked very similar to movement of the
bearing. Figure 5.54 below shows the curling action. The curl is easily noticeable on the bottom
right corner of the bearing in the picture. The difference between slip and curl was difficult to
define. Thus, TechMRT defined slip as a displacement of at least 0.25 inches, and at this point
the curling action leads way to a measurable slip. Trying to differentiate between curling and
slip prior to this limit proved too difficult and would not provide beneficial information to the
project.
Figure 5.54 – Bearing Corner Undergoing Curling
5.3.2. Analysis of Slip Data
The investigation into the slip behavior of the bearings started with determining if the
vertical load on a bearing at a specific transverse slope had an effect on the resulting slip. The
results revealed that slip occurs without consideration of the total vertical load applied to the
bearing. As shown in Figure 5.55 through Figure 5.60, little variation exists between the test
runs. Tests runs one through ten represent a 390 kip load and test runs 11, 12, 13, and 14
represent the application of a 150 kip, 210 kip, 270 kip, and 330 kip loads respectively. For

0-5834 148
example, Figure 5.56 shows that while the slip did vary some for each test run, no pattern or
trend exists for the 8% transverse slope, double bearing configuration shown in this figure. In
addition, Figure 5.57 through Figure 5.60 show that the same trendless pattern exists for the
single bearing configuration.
Figure 5.55 – Summary of Slip Results for 6% Transverse Slope, Double Pad Configuration
Figure 5.56 – Summary of Slip Results for 8% Transverse Slope, Double Pad Configuration
00.10.20.30.40.50.60.70.80.9
1
1 2 3 4 11 12 13 14
Slip
(in
)
Test Run
Slip Summary for D6A
Transverse Front
Longitudinal
Transverse Back
00.10.20.30.40.50.60.70.80.9
11.11.21.31.4
1 2 3 4 11 12 13 14
Slip
(in
)
Test Run
Slip Summary for D8A
Transverse Front
Longitudinal
Transverse Back

0-5834 149
Figure 5.57 – Summary of Slip Results for 2% Transverse Slope, Single Pad Configuration
Figure 5.58– Summary of Slip Results for 4% Transverse Slope, Single Pad Configuration
0
0.1
0.2
0.3
0.4
0.5
1 2 3 4 5 6 7 8 9 10 11 12 13 14
Slip
(in
)
Test Run
Slip Summary for S2A
Transverse Front
Longitudinal
Transverse Back
0
0.1
0.2
0.3
0.4
0.5
1 2 3 4 5 6 7 8 9 10 11 12 13 14
Slip
(in
)
Test Run
Slip Summary for S4A
Transverse Front
Longitudinal
Transverse Back

0-5834 150
Figure 5.59 – Summary of Slip Results for 6% Transverse Slope, Single Pad Configuration
Figure 5.60 – Summary of Slip Results for 8% Transverse Slope, Single Pad Configuration
The fact that the data does not show a trend in the amount of slip that occurs based on the
vertical load applied does not seem to fit intuitively. Researchers originally thought more slip
would occur when a lower vertical load was applied to the bearings. Since the friction force
generated by the vertical load is less when a smaller normal force is applied, it would seem
logical that the slip potential would be greater when subjected to the transverse force resulting
from the superelevation. However, this is not the case because the transverse force required to
0
0.1
0.2
0.3
0.4
0.5
1 2 3 4 11 12 13 14
Slip
(in
)
Test Run
Slip Summary for S6A
Transverse Front
Longitudinal
Transverse Back
00.05
0.10.15
0.20.25
0.30.35
0.40.45
0.5
1 2 3 4 11 12 13 14
Slip
(in
)
Test Run
Slip Summary for S8A
Transverse Front
Longitudinal
Transverse Back

0-5834 151
simulate the transverse slope does show a decreasing trend with a lighter vertical load. Thus,
since less transverse force is applied when the vertical load is lighter, the slip remains fairly
constant regardless of the applied vertical load. Variations in the slip must occur due to some
other unknown conditions.
While the amount of slip does not appear to vary due to the vertical load within a specific
transverse slope, the same cannot be said when comparing the slip of a bearing under identical
loads with different superelevations. These results are summarized in Figure 5.61and Figure
5.62. These charts illustrate that there is definitely an increase in slip with an increase in
transverse slope. For the single pad configuration, the pattern is readily apparent. For the double
pad configuration, slip appears to start only after the slope exceeds 4%. However, this most
likely is not the case. Slip became apparent to the test observers during the 6% superelevation
series of the double pad configuration. While the bearings were inspected while conducting the
2% and 4% superelevation tests with the double bearing configuration, it was not readily
apparent to the testers that slip might be of concern. Slip, if it did occur, was likely less than
0.25 in. at this point and not necessarily noticed. Slip was measured, rather than just observed,
for all subsequent double bearing tests.
The difference between curling and slip, as mentioned earlier in this section, was the next
item investigated. Slips less than 0.25 in. are difficult to distinguish from edge curling. For this
reason, a line representing 0.25 in. is shown on all graphs. When considering this threshold, slip
becomes apparent and very likely at transverse superelevations greater than 4%. Again, while
slip was not recorded for the double bearing configurations of 2% and 4% superelevation, the
slip that occurred, if any, was small (i.e., 0.25 in. or less) otherwise the movement of the bearings
would have been noticed.
For the 0%, 2%, and 4% test runs, ten tests were conducted at the 390 Kip load resulting
in 20 transverse slip observations and 10 longitudinal slip observations. For the six percent and
eight percent transverse slopes, 4 tests were conducted at the 390 kip vertical load, resulting in 8
transverse and 4 longitudinal slip observations, respectively.

0-5834 152
Figure 5.61– Summary of Slip Results, Single Bearing Configuration
Figure 5.62 – Summary of Slip Results, Double Bearing Configuration
0
0.25
0.5
0.75
1
1.25
1.5
0 2 4 6 8
Slip (in)
Transverse Slope (%)
Slip Versus Transverse Slope for Double Bearing Configuration
Transverse Back
Transverse Front
0
0.1
0.2
0.3
0.4
0.5
0.6
0 2 4 6 8
Slip (in)
Transverse Slope (8%)
Slip Versus Transverse Slope for
Single Bearing Configuration
Transverse Front
Transverse Back

0-5834 153
Table 5.2 shows a summary of the percentage of locations where slip was found during
each test run. The first column identifies the specific superelevation. The second and third
columns provide the percent of test runs within the single pad test series where slip in the
transverse and longitudinal slip was noticed. The last two columns provide the same slip
percentages for the double pad configuration test series. The table was created by using the 0.25-
in. threshold to qualify as slip occurring.
Table 5.2 – Slip Summary for Test Series, 390 Kip Load
Table 5.2 reinforces the idea that transverse slip is a limited occurrence at transverse
superelevations equal to or below 4% percent. Additionally, a significant increase in the
likelihood of transverse slip clearly occurs as the superelevation is increased from 4% to 6%.
The results for longitudinal slip are less clear. While interpreting the data recorded, longitudinal
slip does not appear to occur for the single bearing configuration. Longitudinal slip does appear
to be more likely for the double bearing configuration, especially when the superelevations
exceed 4%. The most likely explanation for the difference comes from the difference in the pad
configurations. The longitudinal forces were applied as shown in Figure 4.13. With the double
pad configuration, the longitudinal forces were applied at the centroid of each of the smaller
bearings whereas this is not the case with the single pad configuration. While the contact area
for the two pad configurations is the same, the single pad configuration has a single, larger
bearing resisting movement versus two, smaller bearings each resisting the movement applied at
their respective centroids. Thus, the difference in slip between bearing pad configurations could
be a result of the individual bearing pad configurations. The single pad configuration is better at
resisting the tendency to slip and results in smaller displacements.
Transverse
Slope
Percent
Transverse Slip
Percent
Longitudinal Slip
Percent
Transverse Slip
Percent
Longitudinal Slip
0% 0% 10% 0% 0%
2% 0% 0% 0% 0%
4% 15% 10% 0% 0%
6% 100% 0% 75% 50%
8% 100% 0% 100% 75%
Single Bearing Configuration Double Bearing Configuration

0-5834 154
What effect, if any, the bearing configuration had on the amount of slip observed was
investigated. As previously indicated, the transverse slope appears to have an effect on the
amount of transverse slip observed for each test run. Table 5.3 shows the average values for
transverse and longitudinal displacement observed. The first column identifies the
superelevation of the test series. Columns two and three display the average transverse and
longitudinal slip observed for the single pad test series while the fourth and fifth columns
provide the same information for the double pad test series. When presented in this manner, the
data again show that as the transverse slope increases, so does the average amount of transverse
slip. Slip for the double pad configuration, when observed, is larger than that of the single pad
configuration. As with the likelihood of slip, no definitive conclusion can be drawn for the
longitudinal slip prediction. The single bearing configuration shows no discernable pattern of
behavior with respect to longitudinal slip while the double bearing configuration tends to show
that the amount of longitudinal slip tends to increase with an increase in transverse slope.
Table 5.3 – Summary of Slip Details, 390 Kip Load
In summary, transverse slip appears to increase as the superelevation of the U-beam is increased.
Prediction of longitudinal slip does not appear to be possible with the data from this experiment.
The observed data indicates that transverse slip is most likely to occur at superelevations greater
than 4%.
5.3.3. Regression Analysis for Slip
TechMRT conducted a linear regression analysis for the prediction of a bearing‘s
transverse slip using the dependent variables of bearing configuration and superelevation. For
Transverse
Slope
Average
Transverse Slip
(in)
Average
Longitudinal Slip
(in)
Average
Transverse Slip
(in)
Average
Longitudinal Slip
(in)
0% 0% 20% 0% 0%
2% 6% 12% 0% 0%
4% 21% 14% 0% 0%
6% 31% 10% 39% 28%
8% 41% 10% 101% 43%
Single Bearing Configuration Double Bearing Configuration

0-5834 155
the initial regression analysis, only first order terms for each predictor variable were used.
Based upon the slip data presented in the previous section, this seemed like the most reasonable
place to start. The observed slip, in inches, was modeled as the dependent variable, Y. The
predictor variables used are shown in Table 5.1. The regression analysis was conducted with the
aid of Statistical Analysis Software, version 9.2.
In order to find the best model that could predict the outcome of the dependent variable,
five multiple regression models were initially considered. These models were:
Model 1: Use of Superelevation and Bearing Configuration to predict slip
Model 2: Use of Superelevation only to predict slip
Model 3: Use of Bearing Configuration only to predict slip
Model 4: Use of Superelevation, Bearing Configuration, and the interaction of
Superelevation and Bearing Configuration to predict slip.
Model 5: Use of Superelevation and the interaction of the Superelevation and Bearing
Configuration.
From these five models, the two models that seemed to fit the best were the second and
fourth models. As with the earlier regression analysis discussed, the best models were done by
looking at the adjusted R-square value and determining if a significant increase in the adjusted
R-square value occurred with the addition of additional predictor variables. Summaries of the
regression analysis are shown in Figure 5.63 and Figure 5.64 for Models 2 and 4 respectively.
The regression equations for each model are as follows:
For Model 2: Y = -0.089 + 0.077*X1 Equation 5.5
For Model 4: Y = -0.158 + 0.100*X1 + 0.139*X2 – 0.0463*X1*X2 Equation 5.6
In Equations 5.5 and 5.6, Y is the slip, in inches, predicted. X1 is the superelevation of the
bearing, expressed in percent, and X2 is an indicator value for the bearing pad configuration (X2
is input as zero for a single pad configurations and one for a double pad configuration).
For a corresponding superelevation of zero percent, the linear fit for both models would
predict a slip in the opposite direction of the applied load. This is impossible and lends itself to
the belief that the model shown is really appropriate for superelevations between 2% and 8%.
This is acceptable since the lab data suggests that transverse slip can be considered negligible at
superelevations below 2%.

0-5834 156
Further investigation leads to the conclusion that Model 4 is the better of the two models.
The reason for this is that the adjusted R-square value for Model 4 is greater than that for Model
2. Model 2 predicts the slip based on the superelevation alone, yet a better fit is obtained if the
bearing configuration and the interaction term for X1 and X2 in Model 4 are added to the
regression model. The interpretation of this phenomenon is that the predicted slip depends on
superelevation of the bearing, the bearing pad configuration, and the interaction of the two terms.
Removal of the interaction term between the transverse superelevation and bearing configuration
detracts from the fit of the model and yields an adjusted R-square value less than that of the full
model.
After completing the initial analysis and looking at the scatter plot of slip versus
transverse superelevation, TechMRT decided to investigate the possibility that the slip observed
may exhibit a higher order relationship to a bearing‘s corresponding superelevation. Thus, two
more models were analyzed to determine if they may provide a better explanation. The scatter
plot of slip versus transverse slope showed a trend that the slip may be related to the square of
the transverse superelevation. Model 6 was created to determine if the square of the bearing‘s
transverse superelevation would result in a better prediction of the resulting slip.
Figure 5.63 – Regression Summary for Model 2
Model: 2
Source
Degrees
of
Freedom
Sum of
Squares
Mean
Square F-Value Pr > F
Model 1 5.81563 5.81563 177.96 <0.0001
Error 150 4.902 0.03268
Corrected
Total 151 10.71763
0.5426
0.5396
Variable
Degrees
of
Freedom
Parameter
Estimate
Standard
Error t-Value Pr > |t|
Intercept 1 -0.00868 0.0229 -3.87 0.0002
X1 1 0.07689 0.00576 13.34 <0.0001
Comparative Regression Models
Analysis of Variance
Parameter Estimates
Adjusted R-Square:
R-Square:

0-5834 157
Figure 5.64 – Regression Summary for Model 4
Model 4 was also edited and rerun as Model 7. Here, TechMRT checked into whether
using the square of the bearing‘s superelevation provides a better explanation for slip in
conjunction with the other variables in Model 4. A similar approach was taken during the earlier
regression analysis for the displacement prediction; however, the square of the superelevation
detracted from prediction models fit and was discarded. As demonstrated in Figure 5.65 and
Figure 5.66, the adjusted R-square value for Model 7 is the highest and thus provides the best
explanation for the slip of a bearing. As such, Model 7 provides the best prediction model for
the slip that will occur. The resulting model is:
Y = -0.0721 + 0.0139*X12 + 0.144*X2 – 0.0481*X1*X2 Equation 5.7
Another important discussion is whether the magnitude of the vertical load affects the amount of
slip that occurs. When analyzed as part of the regression models, the magnitude of the vertical
load does not seem to be a significant factor in explaining the slip behavior observed. If a
Model: 4
Source
Degrees
of
Freedom
Sum of
Squares
Mean
Square F-Value Pr > F
Model 3 6.34393 2.11464 71.56 <0.0001
Error 148 4.3737 0.02955
Corrected
Total 151 10.71763
0.5919
0.5836
Variable
Degrees
of
Freedom
Parameter
Estimate
Standard
Error t-Value Pr > |t|
Intercept 1 -0.15809 0.0308 -5.13 <.0001
X1 1 0.10006 0.00775 12.91 <.0001
X2 1 0.13883 0.04356 3.19 0.0018
X12 1 -0.04634 0.01096 -4.23 <.0001
Comparative Regression Models
Analysis of Variance
R-Square:
Adjusted R-Square:
Parameter Estimates

0-5834 158
Figure 5.65 – Regression Summary for Model 6
Figure 5.66 – Regression Summary for Model 7
Model: 6
Source
Degrees
of
Freedom
Sum of
Squares
Mean
Square F-Value Pr > F
Model 1 7.14471 7.14471 299.95 <.0001
Error 150 3.57292 0.02382
Corrected
Total 151 10.71763
0.6666
0.6644
Variable
Degrees
of
Freedom
Parameter
Estimate
Standard
Error t-Value Pr > |t|
Intercept 1 -0.02732 0.01603 -1.7 0.0903
X1sq 1 0.01098 0.000634 17.32 <.0001
Comparative Regression Models
Analysis of Variance
R-Square:
Adjusted R-Square:
Parameter Estimates
Model: 7
Source
Degrees
of
Freedom
Sum of
Squares
Mean
Square F-Value Pr > F
Model 3 7.77536 2.59179 130.37 <.0001
Error 148 2.94227 0.01988
Corrected
Total 151 10.71763
0.7255
0.7199
Variable
Degrees
of
Freedom
Parameter
Estimate
Standard
Error t-Value Pr > |t|
Intercept 1 -0.07211 0.0203 -3.55 0.0005
X1sq 1 0.0139 0.000777 17.88 <.0001
X2 1 0.14406 0.03467 4.16 <.0001
X12 1 -0.04805 0.00853 -5.63 <.0001
Comparative Regression Models
Analysis of Variance
R-Square:
Adjusted R-Square:
Parameter Estimates

0-5834 159
variable, X3, representing the vertical load applied to the bearing in kips, is added to the model,
the adjusted R-square value decreases (to a value of 0.706). In addition, the alpha level for the
X3 variable was 0.840, which is not significant. When these two factors are considered, there is
no reason to believe that the vertical load applied has a significant effect on the slip observed.
In summary, the best prediction model takes into account a bearing‘s transverse
superelevation, the bearing pad configuration, and the interaction of the two variables. The
model in Equation 5.7 provides the best prediction model for the slip that occurs based on the
adjusted R-square criteria. While the addition of the applied vertical load to the model does
improve the adjusted R-square value, the increase is not significant.
5.3.4. Measurement of Uplift
Uplift, also called ―liftoff,‖ occurs when a bearing is loaded eccentrically, either by a load
not acting through the centroid of the bearing or by an applied moment or rotation. Uplift has
been a concern in the past for the load combination of low vertical loads applied with a high
rotation. Previous editions of the AASHTO design considerations for bearings did not allow for
any liftoff. Stanton et al. (2008) recently concluded through research that uplift may not be a
problem for bearings and recommend the removal of the ―no lift-off‖ clause. As such,
TechMRT investigated whether uplift was present as a result of the triaxial loading state
introduced by superelevating the beams and if any patterns emerged in the uplift behavior.
TechMRT measured uplift with a ruler and recorded the data on the Laboratory Bearing
Hard Copy Data Information Sheet seen in Figure 4.24. Data from four areas were recorded and
labeled as transverse top, transverse bottom, longitudinal top, and longitudinal bottom liftoff. As
shown in Figures 4.12 and 4.13, the beam is represented by the center block and the bearing seat
is represented by the top block of the loading apparatus. As such the transverse top and
longitudinal top measurements represent any uplift that occurs between the bearing and the
bearing seat in their respective directions. By the same manner, the longitudinal and transverse
bottom measurements represent any uplift that occurs between the bearing and the beam the
bearing supports. An example of observed uplift can be seen in Figure 5.67. The transverse top
liftoff occurring between the bearing and simulated bearing seat at the upper right corner of the
bearing is noticeable. In addition, one can see that no liftoff occurs between the bearing and the

0-5834 160
Figure 5.67 – Example of Observed Transverse Top Uplift
simulated beam in this photograph. A ruler was used to measure the uplift to the nearest tenth of
an inch.
5.3.5. Analysis of Uplift
Analysis of the uplift measurements yielded interesting results. No real trends in uplift
exist for uplift occurring in the longitudinal direction; however, a trend does exist in the
transverse direction. The transverse bottom uplift recorded, when observed, was small. The
measurements are on the order of 0.3 to 0.5 inches. However, TechMRT believes that this uplift
is more the result of the curling action discussed earlier rather than true uplift. As such, the
transverse bottom uplift will not be analyzed.
Trends do exist with analysis of the data for the case of transverse top uplift. Figure 5.68
through Figure 5.72 show a summary of the liftoff observed for each test run. It is important to
note that transverse uplift was not observed for superelevations less than 4%. In addition, no
uplift was observed for the single bearing configuration at the 4% superelevation.
An interesting trend can be seen in the aforementioned figures. Considering the single
bearing configuration, it appears that as the magnitude of the applied vertical load is increased
the resulting uplift also increases. In addition, the magnitude of the uplift seems to be
proportionally related to the superelevation of the bearing. However, the opposite appears to be
true for the double bearing configuration. For the double bearing configuration, the uplift tends

0-5834 161
to be inversely proportional to the magnitude of the applied vertical load as well as inversely
proportional to the superelevation of the bearings.
At first, it seemed counterintuitive to see that the trends for the different bearing
configurations to be opposite each other. Looking at Figure 5.68 and Figure 5.69, one may
notice that the magnitude of the uplift that occurred with the single pad configuration tended to
increase with a corresponding increase in superelevation. The reverse is true for the double
bearing configuration. Keep in mind that slip was higher for the double bearing configuration.
TechMRT believes that uplift tends to be lower as the superelevation is increased as a result of
the slip occurring at higher superelevations. The slip that occurs tends to re-center the
application of the loads and reduces the uplift that occurs.
As far as comparing the magnitudes of uplift for the single pad configuration to that of
the double pad, it is important to remember that the double pad configuration has the same
contact area as the single pad configuration. However, in the double pad configuration, the two
smaller bearings are placed further out beneath the supported beam. This creates a support
system that is more likely to be stable when subject to moment or rotation than that of the single
bearing configuration. This is believed to be the reason that uplift, when it occurs for both
bearing configurations at a specified superelevation, is smaller for the double bearings when
compared to the magnitude for the single bearings.
Figure 5.68—Uplift Summary, Test Series S6A
0
0.1
0.2
0.3
0.4
0.5
1 2 3 4 11 12 13 14
Lift
off
(in
che
s)
Test Run
Transverse Liftoff Vs Test Run, 6% Superelevation, Single Bearing

0-5834 162
Figure 5.69—Uplift Summary, Test Series S8A
Figure 5.70—Uplift Data for Test Series D4A
0
0.1
0.2
0.3
0.4
0.5
0.6
0.7
1 2 3 4 11 12 13 14
Lift
off
(in
che
s)
Test Run
Transverse Liftoff Vs Test Run, 8% Superelevation, Single Bearing
0
0.2
0.4
0.6
0.8
1
1.2
1.4
1 2 3 4 5 6 7 8 9 10 11 12 13 14
Lift
off
(in
che
s)
Test Run
Transverse Liftoff Vs Test Run, 4% Superelevation, Double Bearing

0-5834 163
Figure 5.71—Uplift Summary, Test Series D6A
Figure 5.72—Uplift Summary, Test Series D8A
5.3.6. Prediction of Uplift
Prediction of uplift proves to be more difficult than that of a bearing‘s slip or transverse
displacement. Uplift seems to be affected by many factors including the bearing pad
configuration, the magnitude of the load applied, the superelevation of the bearing, and whether
or not slip occurs while loading the bearing. Due to the intricacies involved in the resulting
uplift behavior, TechMRT does not feel that a sufficient model can be developed at this time.
0
0.5
1
1.5
2
1 2 3 4 11 12 13 14
Lift
off
(in
che
s)
Test Run
Transverse Liftoff Vs Test Run, 6% Superelevation, Double Bearing
0
0.2
0.4
0.6
0.8
1
1.2
1 2 3 4 11 12 13 14
Lift
off
(in
che
s)
Test Run
Transverse Liftoff Vs Test Run, 8% Superelevation, Double Bearing

0-5834 164
5.3.7. Summary of Uplift and Slip
Slip was found to be related to the square of the superelevation of the bearing and the
interaction of the bearing configuration with the corresponding superelevation. The relationship
is shown in Equation 5.4. Uplift appears more complicated to predict. For this reason, a
prediction for uplift is not feasible at this time. The amount of slip occurring appears to affect
the amount of uplift that occurs among other factors and more information needs to be
investigated in order to make a good prediction.
5.4. Prediction of Damage
TechMRT‘s original intent while conducting the experiment was to investigate the effect
that the superelevation of a U-beam has on the bearings upon which they are placed. TechMRT
noticed that a certain amount of shear strain was permanently applied in the case where the
bearings are superelevated along with the bearing seat. The permanent shear strain was
noticeable while inspecting the bridges in both Wichita Falls and Lubbock. The shear strain was
large enough that one could measure the strain with a ruler.
In a sense, TechMRT designed an experiment that would allow for the simulation of
superelevation while also allowing for inspection of the bearings throughout each test run. One
item documented during the experiment was if any damage to the bearing was readily apparent.
The following section of this report will provide details on the summary of the damage noted and
whether or not any trends can be identified to predict.
5.4.1. Reporting of Observed Damage to Bearings
Each elastomeric bearing was inspected for damage after all loads were applied during
each test run. The thought behind waiting until all loads were applied stems from observing a
worst case scenario where the superelevated beam sees the maximum dead and traffic loads
while having undergone longitudinal deflections due to the thermal effects. The inspection
consisted of visually checking the bearing to search for any signs of cracking, debonding,
delamination, or rupture of the shims. Each bearing was inspected on all four sides with the aid
of a flashlight. In cases where damage was present, photographs were obtained to catalog the
damage. Any damage present was recorded on the Laboratory Bearing Hard Copy Data
Information Sheet seen in Figure 4.24.
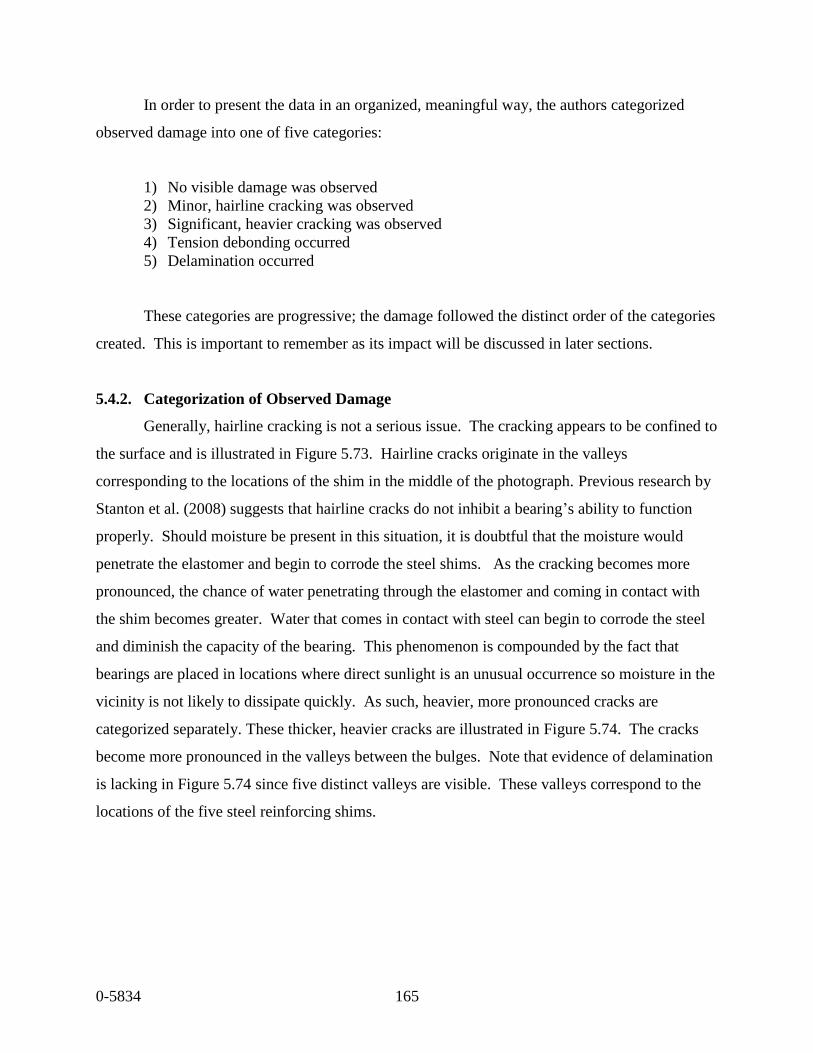
0-5834 165
In order to present the data in an organized, meaningful way, the authors categorized
observed damage into one of five categories:
1) No visible damage was observed
2) Minor, hairline cracking was observed
3) Significant, heavier cracking was observed
4) Tension debonding occurred
5) Delamination occurred
These categories are progressive; the damage followed the distinct order of the categories
created. This is important to remember as its impact will be discussed in later sections.
5.4.2. Categorization of Observed Damage
Generally, hairline cracking is not a serious issue. The cracking appears to be confined to
the surface and is illustrated in Figure 5.73. Hairline cracks originate in the valleys
corresponding to the locations of the shim in the middle of the photograph. Previous research by
Stanton et al. (2008) suggests that hairline cracks do not inhibit a bearing‘s ability to function
properly. Should moisture be present in this situation, it is doubtful that the moisture would
penetrate the elastomer and begin to corrode the steel shims. As the cracking becomes more
pronounced, the chance of water penetrating through the elastomer and coming in contact with
the shim becomes greater. Water that comes in contact with steel can begin to corrode the steel
and diminish the capacity of the bearing. This phenomenon is compounded by the fact that
bearings are placed in locations where direct sunlight is an unusual occurrence so moisture in the
vicinity is not likely to dissipate quickly. As such, heavier, more pronounced cracks are
categorized separately. These thicker, heavier cracks are illustrated in Figure 5.74. The cracks
become more pronounced in the valleys between the bulges. Note that evidence of delamination
is lacking in Figure 5.74 since five distinct valleys are visible. These valleys correspond to the
locations of the five steel reinforcing shims.

0-5834 166
Figure 5.73 – Hairline Surface Cracks on Elastomeric Bearing
Figure 5.74 – Heavy Surface Cracking on an Elastomeric Bearing
The next stage of failure observed was tension debonding. Tension debonding occurs
when the elastomer separates from the bearing at the end of the shims. The obvious sign of this
phenomenon is when two or more smaller bulges present on a loaded bearing combine to form a
larger, single bulge. Debonding is illustrated in Figure 5.75. In this photo, the proof that
debonding occurred is noticeable in the areas near both fingertips where only three distinct
valleys remain on the surface of the bearing. The debonding is more pronounced adjacent to the

0-5834 167
Figure 5.75 – Tension Debonding at Shims
finger at the bottom of the photograph. Since the elastomer is no longer in contact with the shim,
the formation of an additional valley in the profile of the bearing no longer exists.
If the load is increased further after debonding occurs, this can lead to delamination.
Delamination is considered the continuation of the debonding down the length of the shim.
Figure 5.76 displays a bearing that has likely experienced delamination. The phenomenon can
be seen along the top shim as identified by the paperclip. The elastomer here has completely
separated from the shim and would continue along its length into the bearing under more severe
loading or increased cyclic loading. Typically, it is hard to distinguish between tension
debonding and delamination without taking apart the bearing. However, the technicians did
notice the penetration of shims through the elastomer as shown on the right side of the
photograph in Figure 5.77. This phenomenon was, for the most part, limited to the indentions in
the bearing used to remove it from the mold when cast. This area has less elastomer providing
cover for the shims. Shim penetration is categorized as delamination since this is the result of
the elastomer debonding along the shim. Tension debonding and delamination are serviceability
issues for the bearing. While the elastomeric bearings will continue to sustain the loads and will
not result in a catastrophic failure, the bearing is no longer performing its intended capacity.
Further cyclic loading may cause more delamination and in extreme cases the elastomer may
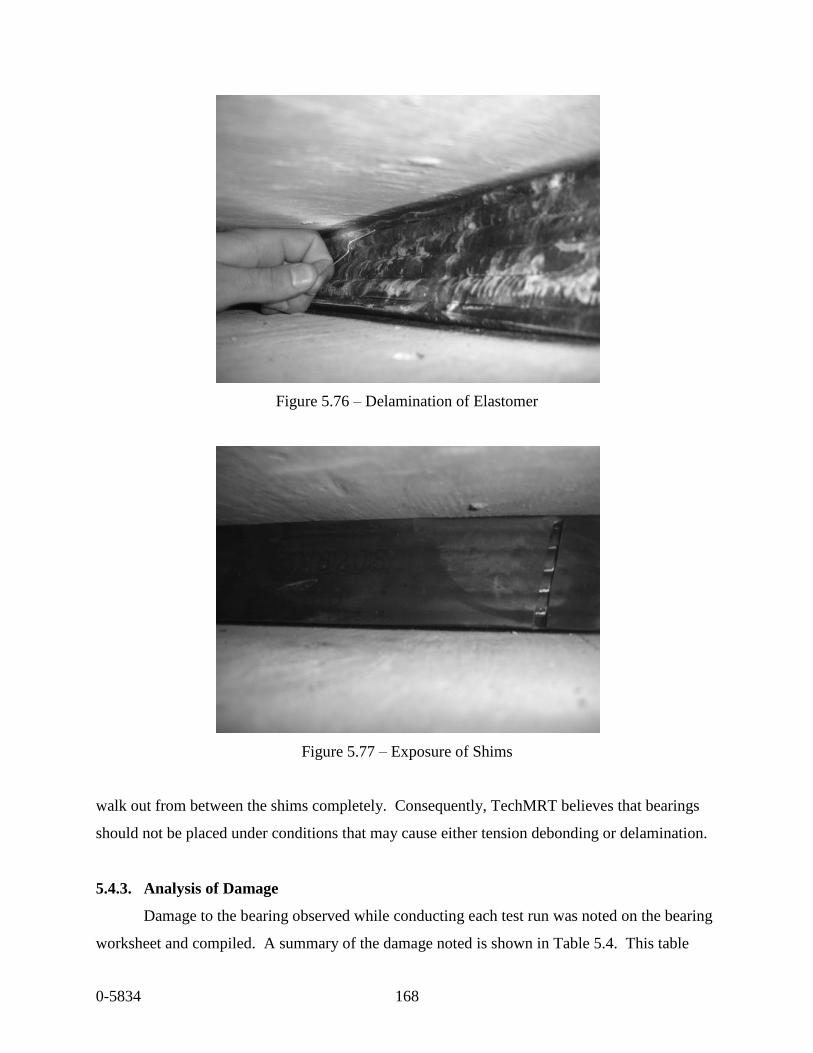
0-5834 168
Figure 5.76 – Delamination of Elastomer
Figure 5.77 – Exposure of Shims
walk out from between the shims completely. Consequently, TechMRT believes that bearings
should not be placed under conditions that may cause either tension debonding or delamination.
5.4.3. Analysis of Damage
Damage to the bearing observed while conducting each test run was noted on the bearing
worksheet and compiled. A summary of the damage noted is shown in Table 5.4. This table

0-5834 169
Table 5.4 – Raw Summary of Damage by Test Series
summarizes the total number of test runs where each level of damage observed was present. The
first two columns designate the pad configuration and superelevation of the test series while the
remaining five columns list the number of test runs where each category of damage was
observed.
Table 5.5summarizes the same information, but provides the percentages of each test
series for each level of damage in the last five columns of the table instead of the raw number of
observations. The raw data is important, but the data in Table 5.5 presents a clearer picture
pertaining to the behavior of the bearing. The first topic of discussion is that damage or wear of
bearings is going to happen when the bearings are placed on a transverse superelevation. These
tests show that hairline cracking is almost a certainty. Heavy cracking does not appear to be an
issue at small transverse superelevations. The first occurrence of heavy cracking for both
bearing configurations occurs at 4% superelevation. As the amount of superelevation is
increased beyond 4%, more significant damage is noticed. Tension debonding and delamination
begin to occur. Tension debonding is prevalent at 6% superelevation and delamination becomes
apparent at 8% superelevation. The results follow the same trend regardless of the bearing pad
configuration. From this data, it can be predicted that a serviceability failure would be much
more likely at higher superelevations.
It is important to remember that damage is a progressive phenomenon. Once damage
occurs, the bearing cannot repair itself. Thus, it is also important to look at the time history of
Configuration Superelevation
No
Damage
Hairline
Cracking
Heavy
Cracking
Tension
Debonding Delamination
Double 0% 1 11 0 0 0
Double 2% 3 9 0 0 0
Double 4% 0 12 7 0 0
Double 6% 0 8 6 2 0
Double 8% 0 8 8 7 2
Single 0% 3 9 0 0 0
Single 2% 2 10 0 0 0
Single 4% 1 11 3 3 3
Single 6% 3 5 3 1 1
Single 8% 2 6 6 6 4
Number of Test Runs With Noticeable Damage

0-5834 170
Table 5.5 – Percentage Based Summary of Damage by Test Series
the damage noted in Table 5.6. The first two columns show the pad configuration and
superelevation of the bearings. The next five columns show the number of test runs conducted
within each test series before each level of damage was observed. The data suggests that as the
superelevation of the bearing seat is increased, the numbers of runs required before each damage
level is observed is reduced. Thus, as the superelevation of a bearing is increased, the time to
significant damage is reduced. This time can be thought of as requiring less loading cycles.
Table 5.6 reinforces the idea that superelevation is not a significant concern for bearings that
have a superelevation of 4% or less.
Table 5.6 – Progressive Damage Summary by Test Series
Configuration Superelevation
No
Damage
Hairline
Cracking
Heavy
Cracking
tension
debonding delamination
Double 0% 8% 92% 0% 0% 0%
Double 2% 25% 75% 0% 0% 0%
Double 4% 0% 100% 58% 0% 0%
Double 6% 0% 100% 75% 25% 0%
Double 8% 0% 100% 100% 88% 25%
Single 0% 25% 75% 0% 0% 0%
Single 2% 17% 83% 0% 0% 0%
Single 4% 8% 92% 25% 25% 25%
Single 6% 38% 63% 38% 13% 13%
Single 8% 25% 75% 75% 75% 50%
Percentage of Test Runs With Noticeable Damage
Configuration Superelevation
Hairline
Cracking
Heavy
Cracking
tension
debonding Delamination
Double 0% 3 N/A N/A N/A
Double 2% 6 N/A N/A N/A
Double 4% 3 8 N/A N/A
Double 6% 1 3 6 N/A
Double 8% 1 1 3 8
Single 0% 6 N/A N/A N/A
Single 2% 5 N/A N/A N/A
Single 4% 4 12 12 12
Single 6% 3 5 8 8
Single 8% 3 3 3 5
Number of Test Runs Until First Sign of Damage

0-5834 171
5.4.4. Summary of Damage Analysis
Analysis of the bearing damage information provided throughout the experiment lends
itself to two conclusions. First, the data in Table 5.4 through Table 5.6 reinforce the damage
principles discussed in NCHRP Report 596 (Stanton et al., 2008). This is because once a bearing
has experienced damage of some sort the damage will remain throughout the life of a bearing.
With the addition of more loading cycles, the severity of the damage observed increases. The
other conclusion is that placing bearings at a superelevation of 6% or greater seems to be an
unconservative practice when considering the potential for damage. While some would say that
allowing a bearing to be loaded in the transverse direction at any level is not wise, analysis of the
data resulting from this experiment suggest that small superelevations do not reduce the
serviceability of the bearing significantly. It appears that moderation is the key with transverse
loads. When combining the results of the damage analysis with that of the slip behavior,
bearings placed at an elevation of 6% or greater tend to result in more damage and higher slip
displacements. These issues lead to questions about the serviceability of elastomeric bearings
subjected to transverse superelevations equal to or greater than 6%.
5.5. Finite Element Analysis
As mentioned in Section 4.5, TechMRT conducted a finite element analysis for each
bearing pad configuration at the same superelevations that were tested in the laboratory. The
resulting angular displacements shown in Section 4.5 do appear to match well with the
laboratory data illustrating that finite element analysis of the bearing pads can be an effective
research tool.
When looking at the results of the finite element analysis, the damage noticed during the
laboratory can be explained through investigating the shear strains within the elastomeric
bearing. Figure 5.78 through Figure 5.83 illustrate the strain profile within the elastomeric
bearing along one of the transverse faces of the bearing. The transverse face in these figures is
the face opposite the application of the transverse forces. Within each figure, the strain patterns
are similar. The strain illustrated is the strain in the vertical, or z-direction. The strain occurring
within the bearing is generally compressive in nature, except for localized areas of tension near
the extreme top and bottom elements of the pad and areas along the shims.

0-5834 172
Notice as the superelevation increases for each bearing pad configuration the size of the
area undergoing the localized tension effects increases and the magnitude of the tension strains
increases. As the local tensile strains increase, damage to the elastomer occurred. This started
out as hairline cracks in the elastomer and proceed through the range of damage discussed in
section 5.4. Debonding occurred when the tensile force exceeded that of the bonding forces
between the elastomer and the shims at the edges of the bearing, and delamination occurred as
this phenomenon continued down the length of the shims. Each level of damage observed in the
laboratory generally occurred along the top and bottom shims first, then appeared along adjacent
shims toward the centerline of the bearing. This behavioral pattern is explained through the
strain patterns illustrated in Figure 5.78 through Figure 5.83. While these figures show the strain
profiles for one transverse face, similar patterns exist on the other faces.
Figure 5.78--Strains in Z-direction (Transverse Face), 0% Single Pad Configuration

0-5834 173
Figure 5.79--Strain in Z-direction (Transverse Face) 4% Single Pad Configuration
Figure 5.80--Strain in Z-direction (Transverse Face), 8% Single Pad Configuration

0-5834 174
Figure 5.81--Strain in Z-direction (Transverse Face), 0% Double Pad Configuration
Figure 5.82--Strain in Z-direction (Transverse Face), 4% Double Pad Configuration

0-5834 175
Figure 5.83--Strain in Z-direction (Transverse Face), 8% Double Pad Configuration

0-5834 176
6. Conclusions and Recommendations
6.1. Research Objective No. 1 (New Design)
The first research objective was to determine if there was a need to consider the
transverse superelevation in design, and if so, how it should be considered. In response to this
objective, the following conclusions and recommendations are offered:
1. The transverse slope should be considered in new designs. A method utilizing two terms, the
Delta1 and Delta2 terms, has been proposed in Section 3.2 that considers the effect of the
transverse slope on the five applicable AASHTO Method “A” Elastomeric Bearing Design
limit states. In order to incorporate the terms into TxDOT design provisions, modifications
to the TxDOT LRFD Bridge Design Manual have been suggested. These provisions were
submitted as Product P1 and are included in Appendix 6-1 “Product P1-Modifications to the
LRFD Design of U-Beam Bearings”.
2. Field observations confirmed the presence of both the Delta1 and Delta2 deflections. The
deflections were observed in bearings immediately after the placement of the U-beams and in
bearings exposed to loading for several years.
3. Tables 3.4 through 3.13 were developed using the proposed modifications to the LRFD
Design of U-Beam Bearings in order to show the impact of the proposed modifications to the
normally designed span/spacing arrangements. In general, many of the design provisions
exceed one or more of the allowable limit states when the transverse slope exceeds 4%. The
tables also show the influence of the effective length required for thermal expansion and/or
contraction. These tables, combined with the laboratory results, indicate that using
transverse slopes greater than 4% have the potential for detrimental effects. Therefore,
unless provisions are designed to mitigate the effects of the transverse slope, uniform-height
steel-reinforced elastomeric bearings for U-beams should not be used for transverse slopes
exceeding 4%.

0-5834 177
4. A review of the existing literature revealed that some, but not much, information exists on
the triaxial state of stress/strain in steel-reinforced elastomeric bearings. Much of the
information that does exist pertains to natural rubber bearings which are not used in Texas.
5. The existing literature indicates that damage to elastomeric bearings is progressive. Results
of the laboratory tests confirm this assessment.
6. Results of a nationwide survey indicate that eight states, in addition to Texas, currently use a
U or Tub shaped section. The country is divided nearly evenly in response to the question
“Does your state allow beam sections to be placed on a slope matching the slope of the
roadway …?”, with twenty (50%) responding “Yes” and 19 (47.5%) responding “No”. The
response to “Does your state use uniform height elastomeric bearing pads to support
members placed on a slope matching the slope of the roadway?” was identical, with twenty
(50%) responding “Yes” and 19 (47.5%) responding “No”. One state, Florida, indicated that
the transverse slope was limited to 2%. This limit most likely evolved from the rule-of-
thumb 2% limit for longitudinal slopes which has historically worked well.
7. Theoretically, the double bearing arrangement should perform slightly better than the single
bearing arrangement when required to resist a transverse moment. The resisting moment of
inertia in the transverse direction is 2.4 times larger for the double bearing than the single
bearing and the resisting section modulus in the transverse direction is 1.8 times larger.
8. Considering the combination of transverse and longitudinal deflections, the double bearing
arrangement performed better in laboratory tests by allowing for nearly twice as much
longitudinal displacement (for a given ratio of observed to predicted load) as compared to the
single pad arrangement. Therefore, designers should consider placing the double pad
arrangement on the end of the U-beam expected to undergo the highest longitudinal
displacement.
9. The laboratory tests revealed that significant slip tended to occur for transverse slopes of 6%
and higher.

0-5834 178
10. Dapped beam configurations may impact the ability to inspect and/or monitor the
performance of elastomeric bearings subjected to transverse slopes. This end condition
prevents TxDOT from being able to inspect the bearings to determine the conditions of the
bearings. TechMRT recommends that dapped beams should be avoided if possible for the
cases when U-beams and their bearings are superelevated transversely.
11. A finite element analysis method has been developed that matches the laboratory results well
and can be used for future research.
6.2. Research Objective No. 2 (Existing Bearings)
The second research objective was to determine if there was a need to address existing U-
beam bridges that have already been constructed on a significant transverse superelevation using
standard steel-reinforced elastomeric bearing pads. If a need was determined, then
recommendations for inspecting and documenting the condition were to be developed.
1. Electronic monitoring of existing steel-reinforced elastomeric bearings for U-beams is not
recommended. Strain gages applied to the exterior of the bearings, although capable of
undergoing high strains while remaining attached, provide information that is not useful
because of localized bulging of the bearings on the sides between the internal shim plates.
2. In lieu of electronic monitoring, TechMRT recommends that existing bearings be monitored
as a part of the routine inspection program. The following four items should be recorded:
a. The transverse angles on the front right and left faces of a bearing can be easily and
accurately measured to the nearest degree by using a transparent two-inch-tall
protractor as shown in Figure 4.1.
b. The longitudinal angles on the front of the bearing should be measured. Obtaining
accurate readings for the longitudinal angles is often difficult, especially if the
bearing is further back on the bearing seat. The inspector should use a flashlight and
small, 2 inch standard 30-60-90 and 45-45-90 triangles to aid in the inspection. If a
reading with the protractor is impossible, the triangles can be used to determine the
approximate longitudinal angle (i.e. less than 30º or between 30º and 45º).

0-5834 179
c. The transverse and longitudinal slopes of the U-beam can be obtained by using a
digital level.
d. Any visible damage including: cracking, tension debonding, or delamination.
3. TxDOT occasionally uses shear keys to limit or prevent the transverse displacement caused
when a transverse slope exists. Limited observations and discussions with contractors have
lead to the conclusion that shear keys perform only marginally well. Since a U-beam placed
on a transverse slope instantaneously deflects the bearing as the U-beam is placed, it is
difficult for U-beams to be placed in a way that does not cause some transverse deflection in
the bearings. Also, limited inspections revealed that the up-slope side of a shear key is
usually in full contact with localized spalling along the contact surface. A gap usually exists
on the down-slope side of a shear key. The unusual phenomena observed where the
superstructure pivoted about the shear key causing the bearing furthest from the pivot point
to be dynamically compressed enough to be heard from the ground in one inspection was an
alarming and unwanted side effect of using a shear key.
4. It is recommended that the wording in the TxDOT “Elements” Field and Coding Manual be
revised in order to provide the inspector with more specific guidance on how to code
Element No. 310 Elastomeric Bearings. (Texas Department of Transportation 2001) First,
the wording for Condition State No. 3 which appears to be incorrectly copied from a different
element, needs the basic wording corrected. Second, a sentence should be considered for
each condition state that provides numeric guidance on the slope of the bearing. Third,
although TxDOT does not consider Feasible Actions in the “Elements” Field and Coding
Manual, three feasible actions are suggested. These recommendations are shown in Table
6.1.

0-5834 180
Table 6.1 – Recommended Revisions to “Elements” Field Inspection and Coding Manual –
Element No. 310
Condition Description Feasible Actions
1
The element shows little or no deterioration. Shear
deformations are correct for existing temperatures.
The vertical slope is less than or equal to 10
degrees in the transverse direction and 30
degrees in the longitudinal direction.
1. Do Nothing
2
Mnior cracking, splitting or other deterioration may
be present. Shear deformation may be slightly
excessive. Strength and/or serviceability are not
affected. The vertical slope is between 10 and
20 degrees in the transverse direction and 30
and/or 45 degrees in the longitudinal direction.
1. Do Nothing
2. Monitor Bearing
3
Advanced deterioration, debonding and/or
delamination. Shear deformations may be
excessive. Top and bottom surfaces may no
longer be parallel. Loss of bearing support is
imminent. The vertical slope is greater than or
equal to 20 degrees in the transvere direction
and/or 45 degrees in the longitudinal direction.
1. Do Nothing
2. Monitor Bearing
3. Reset/Replace
Bearing

0-5834 181
References
Abe, Masato, Yoshia, Junji, and Fujino, Yozo, (2004). “Multiaxial Behavior of Laminiated Rubber Bearings and Their Modeling I: Experimental Study,” Journal of Structural Engineering, Vol. 130, No. 8, pp 1119-1132.
Abe, Masato, Yoshia, Junji, and Fujino, Yozo, (2004). “Multiaxial Behavior of Laminiated Rubber Bearings and Their Modeling II: Modeling,” Journal of Structural Engineering. Vol. 130, No. 8, pp 1133-1144.
American Association of State Highway Officials (2007). AASHTO LRFD Bridge Design Specifications, 4th Edition. Customary U.S. Units. Washington D.C.
American Association of State Highway Officials (2006). LRFD Bridge Design Specifications, 3rd Edition with Interims. Washington D.C.
Arditzoglou, Y.J., Yura, J.A., and Haines, A.H., (1995). “Research Report No. 1304-2: Test Methods for Elastomeric Bearings on Bridges,” Texas Department of Transportation.
Chen, R. and Yura, J., (1995). “Research Report No. 1304-4: Wax Build-up on the Surfaces of Natural Rubber Bridge Bearings,” Texas Department of Transportation.
Cox, Randy, Homann, David, Eskridge, Amy, Hyzak, Michael, Freeby, Gregg, Wolf, Lloyd, Merrill, Brian, and Holt, John (2007). “Concrete Bridges in Texas,” Aspire, Vol. 1, No. 2, pp 43 – 45.
Doody, Micheal E. and Noonan, James E., (1999). “Long-Term Performance of Elastomeric Bridge Bearings,” Transportation Research Record, No. 1688, pp 139-146.
English, B.A., Klingner, R.E., and Yura, J.A. (1994). “Research Report No. 1304-1: Elastomeric Bearings: Background Information and Filed Study,” Texas Department of Transportation.
Green, Tanya, Yazdani, Nur, Spainhour, Lisa, and Cai, Chun S., (2001). “Effect of Bearing Stiffness and Skew Angle on Performance of Precast Concrete Bridge,” Transportation Research Record, No. 1770, pp 27-33.
Hamzeh, O., Tassoulas, J.L., and Becker, E.B., (1995). “Research Report No. 1304-5: Analysis of Elastomeric Bridge Bearings,” Texas Department of Transportation.
Hamzeh, O., Tassoulas, J.L., and Becker, E.B., (1998). “Behavior of Elastomeric Bridge Bearings: Computational Results,” Journal of Bridge Engineering, Vol. 3, No. 3, pp 140 – 146.
Heymsfield, Ernest, McDonald, Jamie, and Avent, Richard R., (2001). “Neoprene Bearing Pad Slippage at Louisiana Bridges,” Journal of Bridge Engineering, Vol. 6, No. 1, pp 30 - 36.
Herrmann, Leonard R., Ramaswamy, Ananth, and Hamidi, Ramin, (1989). “Analytical Parameter Study for Class of Elastomeric Bearings,” Journal of Structural Engineering. Vol. 115, No. 10, pp 2415 – 2434.

0-5834 182
Holt, John (June 8th, 2006). "Study of Elastomeric Bearings for Superelevated U-Beam Bridges." TxDOT (RTI).
Holt, John and Medlock, Ronald (2004). “Standardized Concrete Bridges in Texas,” Proceedings from 2004 Concrete Bridge Conference, Charlotte North Carolina.
McDonald, Jamie, Heymsfield, Ernest, and Avent, Richard R., (2000). “Slippage of Neoprene Bridge Bearings,” Journal of Bridge Engineering, Vol. 5, No. 3, pp 216 – 223.
Mozkah, A., Constantinou, C., and Reiaborn, A. (1990). “Teflon Bearings in Base Isolation I: testing.” Journal of Structural Engineering. Vol. 116, No. 2, pp 438 – 454.
Muscarella, J.V. and Yura, J.A., (1995). “Research Report No. 1304-3: An Experimental Study of Elastomeric Bridge Bearings with Design Recommendations,” Texas Department of Transportation.
Stanton, John F., Roeder, Charles W., Mackenzie-Helnwein, Peter, White, Christopher, Kuester, Colin and Craig, Brianne (2008). National Cooperative Highway Research Program Report 596: Rotation Limits for Elastomeric Bearings. Transportation Research Board, Washington D.C.
Texas Department of Transporation, (2006). “Design Example for Elastomeric Bearings for Prestressed Concrete Beams,” http://www.dot.state.tx.us/services/bridge/ex_other.htm.
Texas Department of Transportation, (2006). LRFD Bridge Design Manual, Texas Department of Transporation.
Texas Department of Transportation, (2007). Superstructure Design Recommendations, http://www.dot.state.tx.us/publications/bridge/span_tables_ubeams.pdf.
TxDOT Expressway, (2006). Bridge Standards, “Standard UBEB: Elastomeric Bearing and Bearing Seat Details,” http://www.dot.state.tx.us/insdtdot/orgchart/cmd/cserve/standard/bridge-e.htm
TxDOT. TxDOT Expressway British Standards (English). 2009. http://www.dot.state.tx.us/insdtdot/orgchart/cmd/cserve/standard/bridge-e.htm (accessed 2009). —. Bridge Design Manual. 2001. —. "Bridge Detailing Manual." August 2001. —. "LRFD Bridge Design Manual." April 1, 2007. —. Superstructure Design. 2009. http://www.txdot.gov/business/contractors_consultants/bridge/super_design.htm (accessed 2009). —. Superstructure Design Information. 2009. http://www.txdot.gov/business/contractors_consultants/bridge/super_design.htm (accessed 2009). —. Texas Darment of Transportation: Other Design Information. 2006. http://www.txdot.gov/business/contractors_consultants/bridge/other_design.htm (accessed 2009).

0-5834 183
Topkaya, Cem, and Yura, Joseph A., (2002). “Test Method for Determining the Shear Modulus of Elastomeric Bearings,” Journal of Structural Engineering, Vol. 128, No. 6.
Yakut, Ahmet, and Yura, Joseph A., (2002). “Evaluation of Low-Temperature Test Methods for Elastomeric Bridge Bearings,” Journal of Bridge Engineering, Vol. 7, No. 1, pp 50 - 56.
Yakut, Ahmet, and Yura, Joseph A., (2002). “Paramaters Influencing Performance of Elastomeric Bearings at Low Temperatures,” Journal of Structural Engineering, Vol. 128 No. 8, pp 986 – 994.
Yakut, Ahmet, and Yura, Joseph A., (2002). “Evaluation of Elastomeric Bearing Performance at Low Temperature,” Journal of Structural Engineering, Vol. 128 No. 8, pp 986 – 994.
Yazdani, Nur, Eddy, Scott., and Cai, Chun S., (2000). “Effect of Bearing Pads on Precast Prestressed Concrete Bridges,” Journal of Bridge Engineering, Vol. 5, No. 3, pp 224 – 232.
Yazdani, Nur, Eddy, Scott M., and Cai, Chun S., (2000). “Validation of AASHTO Bearing Stiffness for Standard Precast Concrete Bridge Girders,” ACI Structural Journal, Vol. 97, No. 3, pp 436 – 442.
Yura, J., Kumar, A., Yakut, A., Topkaya, C., Becker, E. and Collingwood, J., (2001). NCHRP Report 449: Elastomeric Bridge Bearings: Recommended Test Methods. Washington D.C.: National Academy Press.

Appendix 2-1
Responses to Questionnaire Survey

1. Does your state
us a precast,
prestressed U …?
2. Do you know of
any other states
...?
3. Does your state
allow … a slope
matching the
roadway ...?
4. Does your state
use uniform height
elastomeric pads
...?
5. If there is someone in your office
that is familiar … please provide
their contact information.
1409 Coliseum Boulevard Fred Conway
P. O. Box 303050 [email protected]
Montgomery, AL 36130 334-242-6007
3132 Channel Drive Elmer E. Marx
P. O. Box 12500 [email protected]
Juneau, AK 99519 907-465-6941
205 South 17th Avenue
Mail Drop 613E
Phoenix, AZ 85007
P. O. Box 2261 501-569-2000
Little Rock, AR 72203
P. O. Box 942873 916-227-7000
Sacramento, CA 94273-0001
Jamal I. Elkaiss
4201 E. Arkansas Avenue [email protected]
Denver, CO 80222 303-757-9486
2800 Berlin Turnpike 860-594-2000
Newington, CT 06131-7546
602-712-7391
- - -
Connecticut DOT
- - - -
Yes, Most
designed simple
span made
continuous; only
leveling pad is
req'd
California Department of Transportation
-
Arkansas Department of Transportation
No No
State and Address
No No Yes
Alaska Department of Transportation
NoWashington,
OregonYes
Yes
Alabama Department of Transportation
Yes
No No
Arizona Department of Transportation
No No No No
Colorado Department of Transportation
YesCalifornia, Florida,
WashingtonYes

1. Does your state
us a precast,
prestressed U …?
2. Do you know of
any other states
...?
3. Does your state
allow … a slope
matching the
roadway ...?
4. Does your state
use uniform height
elastomeric pads
...?
5. If there is someone in your office
that is familiar … please provide
their contact information.
P. O. Box 778 302-760-2299
Dover, DE 19903
Frank D. Reeves Municipal Center
2000 14th Street NW, 6th Floor
Washington, DC 20009
Andre Pavlov
605 Suwannee Street [email protected]
Tallahassee, FL 32399-0450 850-414-4293
Georgia Department of Transportation
No. 2 Capitol Square SW 404-363-7512
Atlanta, GA 30334
Aliiamoku Building Paul Santo
869 Punchbowl Street [email protected]
Honolulu, HI 96813 808-692-7611
3311 W. State Street
P. O. Box 7129
Boise, ID 83707-1129
Thomas Domagalski
2300 S. Dirksen Parkway thomas.domagalski@
Springfield, IL 62764 illionois.gov 217-785-2913
No No No No
Idaho Transportation Department
No No Yes Yes
Illinois Department of Transportation
202-673-6813
Hawaii Department of Transportation
No No No
No - We don't
place member on
slope. Bearings
are horiz. But may
match slope of
bridge in long.
direction
Florida Department of Transportation
Yes No
Yes - slopes <
.02, then use
tapered steel sole
plates
Yes
District of Columbia Dot
- - - -
Delaware Department of Transportation
- - - -
State and Address
No No No No

1. Does your state
us a precast,
prestressed U …?
2. Do you know of
any other states
...?
3. Does your state
allow … a slope
matching the
roadway ...?
4. Does your state
use uniform height
elastomeric pads
...?
5. If there is someone in your office
that is familiar … please provide
their contact information.
100 N. Senate Avenue
Room IGCN 755
Indianapolis, IN 46204
800 Lincoln Way 515-239-1564
Ames, IA 50010
D.D. Eisenhower State Office Bldg.
700 S.W. Harrison Street
Topeka, KS 66603-3754
200 Mero Street 502-564-4560
Frankfort, KY 40622
Paul Fossier
P. O. Box 94245 [email protected]
Baton Rouge, LA 70804-9245 225-374-1323
Child Street Leanne Timberlake
16 State House Station [email protected]
Augusta, ME 04333-0016 207-624-3422
7201 Corporate Center Drive
Hanover, MD 21076
The Executive Office of Trans.
10 Park Plaza, Ste. 3170
Boston, MA 02116
317-232-5474
617-973-7800
785-296-3761
-
Iowa Department of Transportation
-
Maryland Department of Transportation
Kansas Department of Transportation
State and Address
No No No NA
Maine Department of Transportation
No No Yes Yes
Kentucky Transportation Cabinet
- - -
No No No Yes
Indiana Department of Transportation
- - - -
- - -
Yes - 2 projects
so farYes - Texas Yes Yes
Louisiana Department of Transportation
Massachusetts Highway Department
- - - -

1. Does your state
us a precast,
prestressed U …?
2. Do you know of
any other states
...?
3. Does your state
allow … a slope
matching the
roadway ...?
4. Does your state
use uniform height
elastomeric pads
...?
5. If there is someone in your office
that is familiar … please provide
their contact information.
State Transporation Building Steve Beck
P. O. Box 30050 [email protected]
Lansing, MI 48909
Transportation Building Manjula Louis
395 John Ireland Boulevard 631-366-4487
St. Paul, MN 55155
401 North West Street
Jackson, MS 39201
Central Office
P. O. Box 270
Jefferson City, MO 65102-0270
2701 Prospect Avenue Kent Barnes
P. O. Box 201001 [email protected]
Helena, MT 59620-1001 406-444-6260
Fouad Jaber:
P. O. Box 94759 [email protected]
Lincoln, NE 68509-4759 402-479-3967
Mark Elicegui
1263 South Stewart Street [email protected]
Carson City, NV 89712 775-888-7540
John O. Morton Building Mark Richardson
7 Hazen Drive 603-271-2551
Concord, NH 03302-0483
No
Mississippi Department of Transportation
No
No Yes Yes
Minnesota Department of Transportation
New Hampshire DOT
- - - -
Yes No No No
Missouri Department of Transportation
No No Yes Yes
No No No
Michigan Department of Transportation
No No No
No NoYes - Certain
types of sectionsNo
Nebraska Department of Roads
Montana Department of Transportation
NoColorado,
WashingtonYes Yes
Nevada Department of Transportation
State and Address
No

1. Does your state
us a precast,
prestressed U …?
2. Do you know of
any other states
...?
3. Does your state
allow … a slope
matching the
roadway ...?
4. Does your state
use uniform height
elastomeric pads
...?
5. If there is someone in your office
that is familiar … please provide
their contact information.
P. O. Box 600
Trenton, NJ 08625-0600
Jimmy D. Camp
1120 Cerrillos Road [email protected]
Santa Fe, NM 87504-1149 505-827-5532
Arthur Yannotti
50 Wolf Road [email protected]
Albany, NY 12232-0203 518-457-4453
1503 Mail Service Center
Raleigh, NC 27699-1503
Larry Schwartz
608 East Boulevard Avenue [email protected]
Bismarck, ND 58505-0700 701-328-4446
Tim Keller
1980 W. Broad Street [email protected]
Columbus, OH 43223 614-446-2463
Jack Schmiedel
200 N. E. 21st Street [email protected]
Oklahoma City, OK 73105 405-521-6488
Bruce Johnson / Bruce.V.Johnson
355 Capitol Street. N.E. @odot.state.tx.od.us
Salem, OR 97301-3871 503-986-3344
Bridge Quality Assurance Division Patti Kiehl
P. O. Box 3560 [email protected]
Harrisburg, PA 17105-3560 717-772-0586
Oregon Department of Transportation
Yes WashingtonNo - Beam seats
are levelNA
Pennsylvania DOT
No No Yes
Yes - only
prestressed
concrete adjacent
box beams are
placed parallel to
roadway
No No Yes No
No No No No
North Dakota DOT
Oklahoma Department of Transportation
yes No No -
Ohio Department of Transportation
No No Yes No
No No No No
North Carolina DOT
Yes No No Yes
New York Department of Transportation
No No NA NA
New Mexico DOT
New Jersey DOT
State and Address

1. Does your state
us a precast,
prestressed U …?
2. Do you know of
any other states
...?
3. Does your state
allow … a slope
matching the
roadway ...?
4. Does your state
use uniform height
elastomeric pads
...?
5. If there is someone in your office
that is familiar … please provide
their contact information.
Michael L. Savella
Two Capitol Hill [email protected]
Providence, RI 02903 401-222-2053 X. 4080
P. O. Box 191
Columbia, SC 29202-0191
Becker-Hansen Building
700 E. Broadway Avenue
Pierre, SD 57501
James K. Polk Building
Ste. 700
Nashville, TN 37243-0349
4501 South 2700 West Ray Cook
Mail Stop 141200 [email protected]
Salt Lake City, UT 84114-1200 801-964-4466
Wm. Michael Hedges
One National Life Drive [email protected]
Montpelier, VT 05633-5001 802-828-2621
Struc. & Bridge Division, Room 1011 Julius Volgyi, Jr.
1401 E. Broad Street [email protected]
Richmond, VA 23219 814-786-7537
Bijan Khaleghi
P. O. Box 47300 [email protected]
Olympia, WA 98504-7300 360-705-7181
Washington State DOT
Yes Yes - Colorado Yes Yes
Vermont Agency of Transportation
- - - -
South Carolina DOT
No No
yes - precast
Ubeams placed
on slope
yes - For precast
deck beam units
Rhode Island DOT
No No Yes Yes
State and Address
Virginia Department of Transportation
No No No No
Utah Department of Transportation
No No No No
Tennessee Department of Transportation
NoYes -Washington
StateYes Yes
South Dakota Department of Transportation
No No No No

1. Does your state
us a precast,
prestressed U …?
2. Do you know of
any other states
...?
3. Does your state
allow … a slope
matching the
roadway ...?
4. Does your state
use uniform height
elastomeric pads
...?
5. If there is someone in your office
that is familiar … please provide
their contact information.
Building 5 Jim Shook
1900 Kenawha Boulevard E. [email protected]
Charleston, WV 25305
Hill Farms State Transportation Bldg.
P. O. Box 7910
Madison, WI 53707-7910
5300 Bishop Boulevard Gregg Fredrick
Cheyenne, WY 82009-3340
Wyoming Department of Transportation
No NoYes - Precast I
SectionsYes
Wisconsin Department of Transportation
No Indiana Maybe No No
West Virginia DOT
NoYes - Tennessee
(did in the '80's)Yes Yes
State and Address

Appendix 3-1
Standard Texas U-beam Sheets

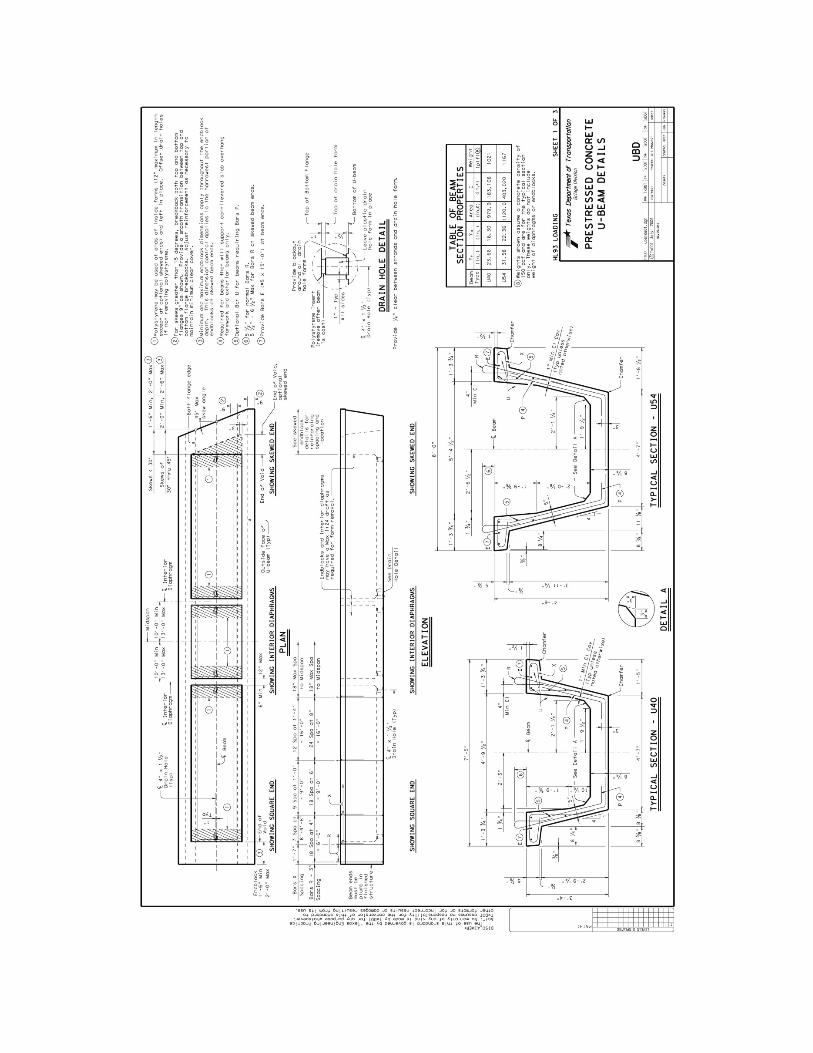


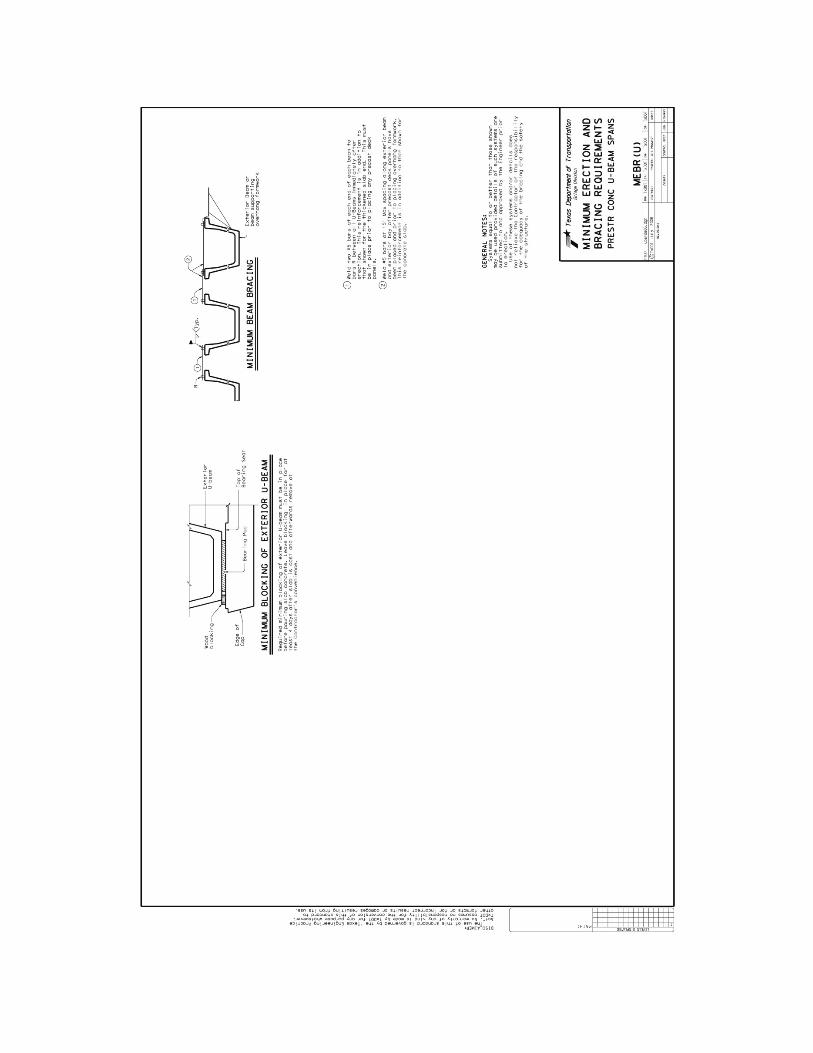

Appendix 3-2
TxDOT Design Example for Elastomeric Bearings for Prestressed Concrete Beams

County: Any CSJ: Any Design: BRG Date: 12/2006
Hwy: Any Ck Dsn: BRG Date: 12/2006
Design: Bridge Bearing Pad Design Example
Design based on AASHTO LRFD Bridge Design Specifications - 3rd Ed. - 2006 Interims and TxDOTLRFD Bridge Design Manual and Standards
The usual starting place for "designing" elastomeric bearings is an analysis of the standard padconfigurations for applicability to the superstructure geometry. In particular, the pads must satisfy sliprequirements for the designed unit length. Other factors such as compressive stress, stability, rotation,and bearing seat geometry are accounted for in the standard pad design and therefore do not need tobe checked as long as the standard pad is not altered.
The intention of the original design for the bearings represented on the IBEB Standard sheet was tomake the pads usable for all simple spans, all two span units, and a large number of three span units.Due to all the conditions that can reduce the dead load on the end bearings (narrow beam spacing,short end span, severe beam slope) and thereby increase the chance for slip, good engineeringjudgement dictates checking the standard pad for suitability on any continuous unit with three or morespans.
For purposes of illustrating TxDOT's design method, the example below will examine all therequirements, even though for a standard pad a slip check alone will usually suffice if the unit is under400' in length. In general, designers should be more conservative on stability (both construction andfinal) and slip, and liberal on compressive allowables.
The design example will consider the first span of 60ft with prestressed concrete beams (Type C) and aT501 rail.
NoSpans 4=UnitLength 60ft 80ft+ 80ft+ 70ft+=
Span 60ft=
BeamSpacing 8ft=
SlabThickness 8in=
BeamWeight 0.516k
ft beam⋅=
RailWeight 0.326k
ft rail⋅=
BeamSlope 1.03%= (Max Beam Slope From RDS)Skew 30deg=
Although the skew is shown in this design example and would affect the pad area, it is not used in anyof the below calculations since the area reduction of no more than 10%, due to clipped pads, is not aconcern. For further explanation see Appendix A on pg. 8.
Unit Information: (4-Span Prestressed Concrete I-Beam Unit)
UnitWeightConcrete 150lb
ft3=
UnitLength 290 ft=
1 of 12

(Check Standard Pad forTy C Beam (Ref. IBEBStandard))
Bearing Pad Information:
The minimum overall thickness for abearing pad should be at least 1 1/2" ofelastomer (i.e., excluding plate thickness)to help the bearing compensate for beamand bearing seat build-up non parallelism,and/or surface irregularities. Certaincases where the designer needs toaccommodate tight constructionclearance limitations, match existingprofile grades using existing caps, etc.,may also be sufficient reason to violatethis general rule of thumb for minimumelastomer thickness.
Elastomer = 50 Durometer Neoprene (50 Durometer Neoprene isstandard, but for beams ona severe grade andhorizontal displacement 60or 70 Durometer Neoprenemay be desired. Foradditional information seereport 1304-3.)
hs 0.105in=
hro = Individual thickness of theouter (top and bottom) layers ofelastomer
hro 0.25in=
nro = Number of the outer layers ofelastomer
nro 2=
hrto = Total thickness of the outerlayers of elastomer
hrto hro nro⋅=
hrto 0.5 in=
hri = Individual thickness of theinterior layers of elastomer
hri 0.25in=
nri = Number of the interior layersof elastomer
nri 6=
hrti = Total thickness of the interiorlayers of elastomer
hrti hri nri⋅=
hrti 1.5 in=
hrt = Total thickness of the layersof elastomer
hrt hrto hrti+=
hrt 2 in=
TotalPadHeight hrt nro nri+ 1−( ) hs⋅+=
TotalPadHeight 2.735 in=
hs = Elastomer reinforcement;Grade 36, 12 gauge steel plates;
2 of 12

(Refer to Appendix B onpg.11,Table B-1 or IBEBStandard for pad size)
LengthPad 7in=
WidthPad 16in= (Width is Parallel to bridgelong axis)
PlanAreaPad LengthPad WidthPad⋅=
PlanAreaPad 112 in2=
For additional information on tapers, overall geometry and general information see Appendix Astarting on pg. 8.
Shape Factor: (LRFD 14.7.5.1)
Ab = The area of perimeter free to bulge for an individual layer ofelastomer
(The target shape factorrange is 10.0 to 12.0, toutilize the compressivecapacity. If the shape factoris below 10.0 the capacitydecreases, and if the shapefactor is above 12.0 it doesnot supply any extra capacitydue to the 1.2ksi cap on thecompressive capacity. )
Ab LengthPad WidthPad+( ) 2⋅ hri⋅=
Ab 11.5 in2=
SPlanAreaPad
Ab=
S 9.739=
Loads: (TxDOT Design Manual)Overlay is not considered inbearing pad design since thelightest dead load isconservative for slip, thetypical controlling factor, andcompressive allowables havea large factor of safety.
Dead Load:
BeamDL BeamWeightSpan
2⋅=
BeamDL 15.48 k=
SlabDL UnitWeightConcrete SlabThickness⋅ BeamSpacing⋅Span
2⋅=
SlabDL 24 k=
Distribute rail load to amaximum of 3 outer beams.RailDL RailWeight
Span2
⋅1
3beams⋅=
RailDL 3.26 k=
TotalDL BeamDL SlabDL+ RailDL+=
TotalDL 42.74 k=
3 of 12

Live Load:
-No impact loading is considered when calculating compressive stress (LRFD C14.7.5.3.2;TxDOT Design Manual)
RxTruck 32k 32kSpan 14ft−
Span⎛⎜⎝
⎞⎠
⋅+ 8kSpan 28ft−
Span⎛⎜⎝
⎞⎠
⋅+= (LRFD 3.6.1.2.2)
RxTruck 60.8 k=
RxLane 0.64k
ft lane⋅
Span2
⋅= (LRFD 3.6.1.2.4)
RxLane 19.2k
lane= (The Live Load Reactions are
assumed to be the Shear LiveLoad Distribution Factormultiplied by the Lane LoadReaction. The Shear Live LoadDistribution Factor wascalculated using the "LRFD LiveLoad Distribution Factors"Spreadsheet)
LLDFShear 0.814=
BearingLiveLoad RxTruck RxLane+( ) LLDFShear⋅=
BearingLiveLoad 65.12 k=
Compressive Stress Check: (Service Limit) (LRFD 14.7.6.3.2)
Shear Modulus: (LRFD 14.7.5.2; Use TxDOTcriteria for shear modulusfrom Design Manual)G73 95psi= at 73oF
G0 175psi= at 0oF
There is a range of values for the shear modulus (95psi-130psi) that you may actually receive from thefabricator when you specify 50 Durometer. After the research for Report 1304-3, TxDOT decided to useYura's suggested value of 95psi since it is conservative.
(LRFD 14.7.6; TxDOT DesignManual)Allowable Stress :
S 9.739= (Calculated on pg. 8)
MaxStressDL is the smaller of:
1.2 ksi
1.2ksi x (G73) x (S) = 1.11ksi
MaxStressDL 1.11 ksi=
GS = Total compressive load stress
Gs is the smaller of:
1.5 ksi
GS 1.39 ksi=
The 1200 psi dead loadstress maximum should notbe exceeded by more than5%, and only if the shapefactor permits. For furtherexplanation see Appendix Aon pg.9.
1.5ksi x (G73) x (S) = 1.39ksi
The 1500 psi limit, is not anabsolute max, and overagesof up to 15% above this limitare not cause to resize thepad. For further explanationsee Appendix A on pg.9.
4 of 12

Actual Stress:
Dead Load Stress:
σDLTotalDL
PlanAreaPad=
σDL 0.382 ksi=
MaxStressDL is greater than σDL therefore OK.
Total Load Stress:
σTLBearingLiveLoad TotalDL+
PlanAreaPad=
σTL 0.963 ksi=
GS is greater than σΤL therefore OK.
Shear Check (Strain): (Service Limit) (LRFD 14.7.6.3.4)
∆s = max. total shear deformation of the elastomer at service limit state
CoefThermalExpanConcrete 0.000006in
in degF⋅= (LRFD 5.4.2.2)
(TxDOT Desgin Manual - use∆T=70degF)∆s CoefThermalExpanConcrete
UnitLength2
⋅ 70⋅ degF=
∆s 0.731 in=
Current AASHTO specifications suggest a 50% maximum shear strain limit. Therefore, the padelastomer material (steel plate thickness not included) total thickness must be twice the expectedthermal movement at the bearing.
hrt 2 in= (calculated on pg. 2)
2∆s 1.462 in=
hrt is greater than 2∆s therefore OK.
(LRFD 14.7.6.4; UseTxDOT Design Manual)Anchorage Check (Slip): (Strength Limit)
γpmin = Minimum permanent load factor (LRFD 3.4.1-2)
γpmin 0.9=
FactoredTotalDL γpmin TotalDL⋅=
∆sallow0.2 BeamSlope−( )FactoredTotalDLhrt
G0 PlanAreaPad⋅=
∆sallow is greater than ∆s therefore OK.
If the slip check were to fail, increasing the height of the bearing pad is the typical solution. F ormore solutions for slip check failure refer to Appendix A on pg.10.
TxDOT uses the shear modulus "G0" (modulus at 0 deg F) for the slip check because the pad is stifferat colder temperatures and therefore produces larger shear forces when the beam contracts thermally.
∆sallow 0.745 in=
5 of 12

(LRFD 14.7.6.3.6; Accordingto the LRFD Design Manualit is acceptable to use hrtinstead of the total padheight.)
Stability:
hrt 2 in=
hrtallow is the smaller of:
LengthPad3
2.333 in=
hrtAllow 2.333 in=
hrtAllow is greater than hrt therefore OK.
(TxDOT DesignManual-"estimatecompressive deflection usingAASHTO LRFD BridgeDesign Specifications, FigureC14.7.5.3.3-1.)
Compressive Deflection: (Service Limit)
Compressive deflection is usually not a concern from a functionalitystandpoint since the 4% to 5% range of deflection that most of TxDOT'sstandard pads undergo, yields a hardly noticeable 3/32" verticalcompression. For further explanation refer to Appendix A on pg.10.
(Use S and σTL toget εi from FigureC14.7.5.3.3-1, whichcan be found inAppendix C onpg.12, Figure C-1.)
σTL 0.963 ksi=ε i 4.4%=
(εi=4% for shapefactors approaching10.0)
S 9.74=
δ = Σειhi = Σδi (LRFD 14.7.5.3.3-1)
hri 0.25 in= (Calculated on pg. 2)
Since all layers in the bearing pad are the same thickness and shape, εi is the same for everylayer and therefore the below equations are true.
δi ε i hri⋅= δi 0.011 in=
hrt 2 in=
δ ε i hrt⋅= δ 0.088 in=
δiwithCreep 1.25 δi⋅= δiwithCreep 0.0138 in= (LRFD Table 14.7.5.2-1)
0.07hri is greater than δiwithCreep therefore OK. (LRFD 14.7.6.3.3)
WidthPad3
5.333 in=
0.07hri 0.018 in=
6 of 12

(Use TxDOT Design Manual)Rotation: (Service Limit)
AASHTO has strict guidelines for rotation that TxDOT does not adhere to. AASHTO seeks to preventany amount of lift off, a requirement that TxDOT does not support. Most TxDOT reinforced elastomericbearing pads are used under prestressed concrete beams that rotate little (less than 0.005 radians) andimpart a fairly heavy dead load on a relatively narrow (9" max) pad, making uplift due to rotation animprobable event. The research for Report 1304-3 has shown rotations close to 0.030 radians can beaccommodated by our standard pads with less than 20% lift off, and even with that amount of lift off thepad will function normally. We regularly encounter cases in construction where it is noted that the pad isnot in contact with a bearing surface for a considerable portion of the pad area (usually due toconstruction tolerances, mis-matches in surface slopes, etc.) with no apparent detriment to the bearingperformance in final service.
Non-Composite I-Beam Properties:
E 5000ksi=
I 82602in4=
q BeamWeightRailWeight
3+ SlabThickness BeamSpacing⋅ UnitWeightConcrete⋅+= (Weight of the
superstructure)q 1.425
kft
=
θDLq Span3
⋅
24 E⋅ I⋅=
θDL 0.0045 rad=
(Camber FromPSTRS14/PGSuper output)
camber 2in=
θcamber4 camber⋅
Span=
θDL 0 rad=
(For the LL Midspandeflection usePSTRS14/PGSuper orassume Span/800 to beconservative)
∆LLSpan800
=
θLL4 ∆LL⋅
Span=
θLL 0.005 rad=(0.005 radians is added toaccount for constructionuncertainties) (TxDOTDesign Manual)
θTotal θLL θDL+ 0.005rad+=
θTotal 0.01 rad=
θTotal 0.8 LengthPad⋅( )⋅
20.028 in= (TxDOT Design Manual)
δ 0.088 in= (Calculated on pg. 6)
θcamber 0.011 rad=
(Assuming camber isthe result of uniformmoment caused byprestressing)
θcamber is greater than θDL therefore:
δ is greater than θTotal 0.8 LengthPad⋅( )⋅
2 therefore OK.
7 of 12

Appendix A
Unit Information:
Skew:
In general, the clipped pad areas do not decrease by more than approximately 10%. The pad plandimensions were increased when more severe clips were needed. The 10% reduction for clips orthe area for dowel holes is not a concern for the following reasons:
1.) TxDOT is extremely conservative (greater than a factor of 10 for compressive failure) oncompressive allowables, thus increasing slip prevention.
2.) Shape factor controlled D.L. compressive allowables vary minimally from the assumptions inthe standards due to the altered perimeter to area ratios when clipped.
3.) Compressive deflections are usually around 3/32" for standard pads.
Bearing Pad Information:
Bearing Pad Taper:
Taper is usually not specified by the designer for TxDOT jobs. The fabricators typically extract thisinformation from the contract plans by calculating the beam slope from bearing seat elevations onthe bridge "Bearing Seat Elevations and Quantities" sheet. The fabricator then determines whichload application "platten" satisfies the slope tolerance specifications and can be used in the padvulcanization process. The standard pads listed on the IBEB sheet will deflect around 4% onaverage, or about 5/32" for the 2" of elastomer in them, which typically is sufficient toaccommodate a slope mis-match from fabrication or construction sources. (5/32" in 9" isequivalent to a slope of 1.74%.)
Design Recommendations:
1.) For beams on grades of between 1 and 3%, taper the pads accordingly. The top layer onlyshall be tapered. (all shims parallel)
2.) For beams on grades of between 3 and 6%, taper the top two layers, limiting the top layerthickness to 3/8" at the thick end. (all shims parallel except top shim)
3.) Beams on grades greater than 6% will require special consideration (ie, span restraints,pad restraints, higher durometer elastomer, custom shim placement, etc.; see Report 1304-3,Chapter 8 for conclusions concerning heavily tapered pads). 6% beam slope is the upper limitthat TxDOT will design tapered pads for without special precautions, such as locking the "low"end of the unit in place and forcing the structure to expand uphill.
8 of 12

Bearing Seat Geometry:
For custom applications, the designer needs to be aware of the specified minimum cap edge andbeam edge distances. The centerline of bearing is a nominal distance and the pads will functionsatisfactorily if placed off center from it as long as the load is not placed close to a cap edge toinduce spalling or overlapping a beam chamfer edge to pinch the elastomer and induce a "walking"phenomena on the cap surface. When checking the required edge distances for custom designs,also take note of the beam end clearance values listed on the standard. Beam end clearancevalues vary with cap type and are increased on cap types such as inverted tee interior bents,where field experience with construction/fabrication errors and resulting beam end trimming hasdictated the need for more room.
General:
Continue to "round" layer thicknesses to 1/8" increments within shape factor constraints. Padwidth (transverse to beam longitudinal axis) for custom designs should not be less thanapproximately 3/4 of the bottom beam flange width without a more thorough analysis. TxDOTcurrently has some exceptions to this guideline - round pads, pads for smaller beams, etc - buthave had feedback that in general there have been no construction related stability problems withthese particular pads. A general rule of thumb is to design the width of the pad so that the c.g. willalways fall within the middle third of the pad. If construction tolerances, i.e. horizontal beamsweep, variance from plumb, out of level bearing seats and so on, can vary the c.g. a four inchtotal width, then the pad should be at least 12" wide.
Bearing Pad Material:
TxDOT currently prohibits the use of "Polyisoprene" (Natural Rubber) for the manufacture ofbearing pads. This is due to a slip problem experienced in the late 1980's and early 1990's thatwas caused by a "blooming" of paraffin wax used in the formulation to the surface of the pad. Thiswax can be used in "Polychloroprene" (Neoprene) but is usually present in much smaller amountsthan in natural rubber, and as yet there have been no documented cases of neoprene-associatedslip due to a wax bloom in Texas.
Compressive Stress and Deflection Checks:
Compressive Stress Allowables:
The Live Load check is intended to keep the maximum stresses within a reasonable "range"; it isbelieved that the temporary nature of a live load has little effect on long term serviceability of thebearing. Thus, the 1500 psi limit, is not an absolute max and overages of up to 15% above thislimit are not cause to resize the pad. Reinforced elastomeric bearing pads in the configurationsthat TxDOT uses have failed in laboratory compression tests at stresses of between 15,000 and20,000 psi and therefore have large factors of safety against compressive failure. Of greaterconcern is the loading that the pad sees on a permanent basis, such as under dead load, theconsequent side face bulging, and how well the pad functions in combination with cycles ofthermally-induced shear strain. For this reason the 1200 psi dead load stress maximum shouldnot be exceeded by more than 5% and only if the shape factor permits. Unlike AASHTOrequirements for Method A or Method B, TxDOT design practice places no additional requirementon materials testing when using these compressive allowables. Instead, material quality isinsured via prequalification of fabricators, the elastomer formulation and 100% load testing ofpads produced for TxDOT.
9 of 12

Compressive Deflection:
Compressive deflection is usually not a concern from a functionality standpoint, since the 4% to5% range of deflection that most TxDOT standard pads undergo yields a hardly noticeable 3/32"vertical compression. Severely tapered pads can deflect up to 60% more (close to 5/32" total),but still not enough to induce a "bump" at the end of a bridge. This information becomes usefulwhen determining if a pad can absorb construction mis-matches and/or to check rotation ability.Creep will add as much as 25% more deflection, but this is not a concern as it will add amaximum 3/16" total deflection.
Anchorage Check (Slip):
Slip failure solutions:
Typically slip problems are controlled by increasing the pad thickness. In some cases this maynot be desirable from an economic standpoint (fabricator re-tooling) or if the resulting heightviolates stability criteria. Alternative solutions might include the following:
1) Increasing the beam spacing to increase bearing dead load if the beams can handlethe additional load.
2) Increasing the end span length if feasible.
3) Reducing the number of spans in the unit if the resulting increase in cost of deckjoints does not offset the cost of custom pads. (Standard pads cost approximately$65 to $100 each, custom pads cost almost double the amount of standard ones.Both items usually represent, a very small percentage of overall bridge cost andtherefore, the decision on which item to purchase is not critical.)
4) As a last resort, decrease the pad plan area to increase slip resistance. The leastexpensive way to do this is to pick a standard pad for the next smallest beam on theIBEB sheet. For a Type "C" beam case that does not work, try a pad from the table for"B" beams or "A" beams. If none of the standard pads solve the problem, design newpad plan dimensions. This requires the fabricator to order new forms or shim theinsides of existing forms, so a large volume job is preferable for this option. Whenreducing the plan area, do so by decreasing the pad length to preserve pad stability.Construction stability of the beam on the bearing prior to construction bracinginstallation may be a concern when calculating the pad length reduction. There havebeen no reports of construction instability associated with relatively narrow pad widthssuch as that for an AASHTO Type IV beam when using the 15" diameter round pad.Another rule of thumb is to make the pad wide enough so that the center of gravity willnever fall outside of the middle third of the pad. This calculation would be based on thedesigner's estimate of how out of plumb the beam may tilt in the field due to bearingseat construction tolerances, beam mis-fabrication, beam "warping", and etc. In theabsence of a more refined approach, experience with the existing pad geometries isprobably the best guide.
10 of 12

Appendix B
Table B-1. Elastomeric Bearing Data from the IBEB Standard
11 of 12

Appendix C
Figure C-1. Stress-Strain Curves from AASHTO LRFD
12 of 12

Appendix 4-1
Bearing Condition Sheets for Wichita Falls Inspection and Protractor

Bearing Condition Sheet
Mark: Date: Temp: 57oF
Plan: Looking:
Skew: Joint:
Beam Slopes
Transverse: Down to the:
Longitudinal: Down to the:
Bearing Seat: Down to the:
Heights: (The total height is 2 and X/32 inches)
Front
Back
Transverse Slopes (degrees from bearing seat)
Front
Back
Longitudinal Slopes (degrees from bearing seat)
FrontBack
Uplift Minor Uplift for about 1/2 in.
Left Right
A
371
0
Left
20-Feb-08
Upstation
5.80%
No Joint
Right
Upstation (Left)
15
Left
1.80%
6.60%
16
Left
N/A
104
Left Right
N/A
108
0.50
Left
None Visible
92
Right
92

Bearing Condition Sheet
Mark: Date: Temp: 58oF
Plan: Looking:
Skew: Joint:
Beam Slopes
Transverse: Down to the:
Longitudinal: Down to the:
Bearing Seat: Down to the:
Heights: (The total height is 2 and X/32 inches)
Front
Back
Transverse Slopes (degrees from bearing seat)
Front
Back
Longitudinal Slopes (degrees from bearing seat)
FrontBack
Uplift
Left RightNone Visible None Visible
Left Right
Left Right
102 99
N/A N/A
3.70% Left
0.10% Upstation
Left Right
4.10% Left
13 16
B 20-Feb-08
371

Bearing Condition Sheet
Mark: Date: Temp: 58oF
Plan: Looking:
Skew: Joint:
Beam Slopes
Transverse: Down to the:
Longitudinal: Down to the:
Bearing Seat: Down to the:
Heights: (The total height is 2 and X/32 inches)
Front
Back
Transverse Slopes (degrees from bearing seat)
Front
Back
Longitudinal Slopes (degrees from bearing seat)
FrontBack
Uplift Minor uplift for 1/2 in
Front RightNone Visible 0.50
Left Right
Left Right
110 110
N/A N/A
3.00% Left
0.40% Upstation
Left Right
2.40% Left
17 12
C 20-Feb-08
371

Bearing Condition Sheet - Bearing D1
Mark: Date: Temp: 65oF
Plan: Looking:
Skew: Joint:
Beam Slopes
Transverse: Down to the:
Longitudinal: Down to the:
Bearing Seat: Down to the:
Heights: (The total height is 2 and X/32 inches)
Front
Back
Transverse Slopes (degrees from bearing seat)
Front
Back
Longitudinal Slopes (degrees from bearing seat)
FrontBack
Uplift
Left RightNone Visible None Visibile
Left Right
Left Right
100 100
N/A N/A
1.00% Right
0.80% Downstation
Left Right
1.00% Right
12 12
D1 20-Feb-08
371

Bearing Condition Sheet
Mark: Date: Temp: 65oF
Plan: Looking:
Skew: Joint:
Beam Slopes
Transverse: Down to the:
Longitudinal: Down to the:
Bearing Seat: Down to the:
Heights: (The total height is 2 and X/32 inches)
Front `
Back
Transverse Slopes (degrees from bearing seat)
Front
Back
Longitudinal Slopes (degrees from bearing seat)
FrontBack
Uplift
Left RightNone Visible None Visibile
Left Right
Left Right
100 100
N/A N/A
1.00% Right
0.80% Downstation
Left Right
0.70% Right
16 14
D2 20-Feb-08
371

Bearing Condition Sheet
Mark: Date: Temp: 65oF
Plan: Looking:
Skew: Joint:
Beam Slopes
Transverse: Down to the:
Longitudinal: Down to the:
Bearing Seat: Down to the:
Heights: (The total height is 2 and X/32 inches)
Front `
Back
Transverse Slopes (degrees from bearing seat)
Front
Back
Longitudinal Slopes (degrees from bearing seat)
FrontBack
Uplift Good amount for 1.25"
Left RightNone Visible None Visibile
Left Right
Left Right
1.25
105 100
N/A N/A
6.10% Left
0.10% Upstation
Left Right
6.00% Left
14 18
E 20-Feb-08
371
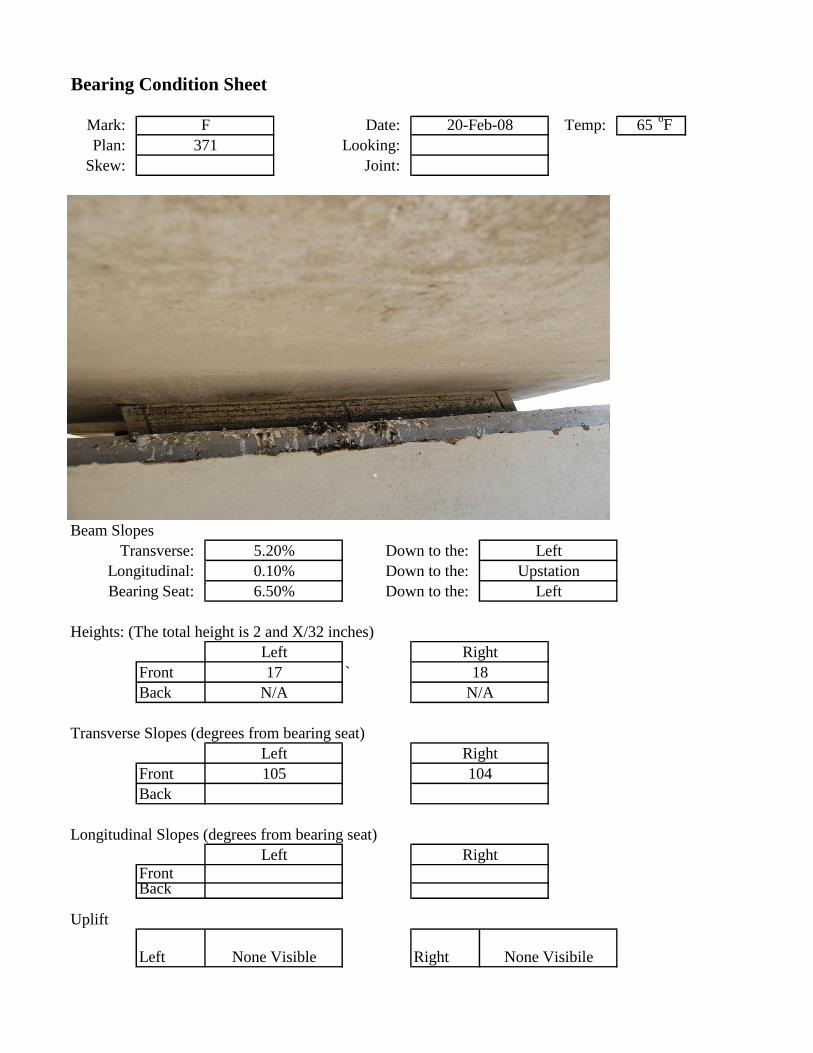
Bearing Condition Sheet
Mark: Date: Temp: 65oF
Plan: Looking:
Skew: Joint:
Beam Slopes
Transverse: Down to the:
Longitudinal: Down to the:
Bearing Seat: Down to the:
Heights: (The total height is 2 and X/32 inches)
Front `
Back
Transverse Slopes (degrees from bearing seat)
Front
Back
Longitudinal Slopes (degrees from bearing seat)
FrontBack
Uplift
Left RightNone Visible None Visibile
Left Right
Left Right
105 104
N/A N/A
5.20% Left
0.10% Upstation
Left Right
6.50% Left
17 18
F 20-Feb-08
371

Bearing Condition Sheet
Mark: Date: Temp: 75oF
Plan: Looking:
Skew: Joint:
Beam Slopes
Transverse: Down to the:
Longitudinal: Down to the:
Bearing Seat: Down to the:
Heights: (The total height is 2 and X/32 inches)
Front `
Back
Transverse Slopes (degrees from bearing seat)
Front
Back
Longitudinal Slopes (degrees from bearing seat)
FrontBack
Uplift
Left RightYes None Visibile
Left Right
Left Right
100 100
N/A N/A
6.40% Right
1.20% DownStation
Left Right
4.70% Right
19 14
G (G1) 20-Feb-08
185

Bearing Condition Sheet
Mark: Date: Temp: 75oF
Plan: Looking:
Skew: Joint:
Beam Slopes
Transverse: Down to the:
Longitudinal: Down to the:
Bearing Seat: Down to the:
Heights: (The total height is 2 and X/32 inches)
Front `
Back
Transverse Slopes (degrees from bearing seat)
Front
Back
Longitudinal Slopes (degrees from bearing seat)
FrontBack
Uplift
Left RightYes Crunched
Left Right
Left Right
103 105
N/A N/A
6.40% Right
1.20% DownStation
Left Right
4.70% Right
16 14
H (G2) 20-Feb-08
185

Bearing Condition Sheet
Mark: Date: Temp: 76oF
Plan: Looking:
Skew: Joint:
Beam Slopes
Transverse: Down to the:
Longitudinal: Down to the:
Bearing Seat: Down to the:
Heights: (The total height is 2 and X/32 inches)
Front `
Back
Transverse Slopes (degrees from bearing seat)
Front
Back
Longitudinal Slopes (degrees from bearing seat)
FrontBack
Uplift
Left RightLittle at corner None Visibile
Left Right
Left Right
108 110
N/A N/A
5.30% Right
1.10% DownStation
Left Right
5.80% Right
17 15
I 20-Feb-08
185

Bearing Condition Sheet
Mark: Date: Temp: 76oF
Plan: Looking:
Skew: Joint:
Beam Slopes
Transverse: Down to the:
Longitudinal: Down to the:
Bearing Seat: Down to the:
Heights: (The total height is 2 and X/32 inches)
Front `
Back
Transverse Slopes (degrees from bearing seat)
Front
Back
Longitudinal Slopes (degrees from bearing seat)
FrontBack
Uplift
Left RightLittle None Visibile
Left Right
Left Right
105 105
N/A N/A
5.30% Right
1.10% DownStation
Left Right
5.80% Right
14 15
I 20-Feb-08
185

Bearing Condition Sheet
Mark: Date: Temp: 66oF
Plan: Looking:
Skew: Joint:
Beam Slopes
Transverse: Down to the:
Longitudinal: Down to the:
Bearing Seat: Down to the:
Heights: (The total height is 2 and X/32 inches)
Front `
Back
Transverse Slopes (degrees from bearing seat)
Front
Back
Longitudinal Slopes (degrees from bearing seat)
FrontBack
Uplift
Left Right
Crushed Lower Left
Corner None Visibile
Left Right
Left Right
105 100
N/A N/A
6.60% Left
0.40% Upstation
Left Right
6.60% Left
13 15
K 20-Feb-08
185

Bearing Condition Sheet
Mark: Date: Temp: 66oF
Plan: Looking:
Skew: Joint:
Beam Slopes
Transverse: Down to the:
Longitudinal: Down to the:
Bearing Seat: Down to the:
Heights: (The total height is 2 and X/32 inches)
Front `
Back
Transverse Slopes (degrees from bearing seat)
Front
Back
Longitudinal Slopes (degrees from bearing seat)
FrontBack
Uplift
Front RightNone Visibile 4.25"
N/A N/A
Left Right
Left Right
99 100
6.20% Right
1.20% Downstation
17 18
5.90% Right
Left Right
L 20-Feb-08
185

Bearing Condition Sheet
Mark: Date: Temp: 65oF
Plan: Looking:
Skew: Joint:
Beam Slopes
Transverse: Down to the:
Longitudinal: Down to the:
Bearing Seat: Down to the:
Heights: (The total height is 2 and X/32 inches)
Front `
Back
Transverse Slopes (degrees from bearing seat)
Front
Back
Longitudinal Slopes (degrees from bearing seat)
FrontBack
Uplift
Left Right1.5"
Crushed upper
Right Corner
Left Right
Left Right
100 100
N/A N/A
6.20% Right
1.20% Downstation
Left Right
7.00% Right
17 18
M 20-Feb-08
185

Bearing Condition Sheet
Mark: Date: Temp: 65oF
Plan: Looking:
Skew: Joint:
Beam Slopes
Transverse: Down to the:
Longitudinal: Down to the:
Bearing Seat: Down to the:
Heights: (The total height is 2 and X/32 inches)
Front
Back
Transverse Slopes (degrees from bearing seat)
Front
Back
Longitudinal Slopes (degrees from bearing seat)
FrontBack
Uplift
Left RightNone Visible None Visible
Left Right
Left Right
97 96
N/A N/A
5.30% Right
1.00% South
Left Right
4.90% Right
15 14
N 20-Feb-08
185

Bearing Condition Sheet
Mark: Date: Temp: 65oF
Plan: Looking:
Skew: Joint:
Beam Slopes
Transverse: Down to the:
Longitudinal: Down to the:
Bearing Seat: Down to the:
Heights: (The total height is 2 and X/32 inches)
Front
Back
Transverse Slopes (degrees from bearing seat)
Front
Back
Longitudinal Slopes (degrees from bearing seat)
FrontBack
Uplift
Front RightNone Visible None Visible
Left Right
Left Right
96 99
N/A N/A
5.30% Right
1.00% South
Left Right
5.40% Right
16 16
O 20-Feb-08
185


Appendix 4-2
Additional Strain Gage Information

Strain Gages
Name: SR-4 General Purpose Strain Gages, GF=2.06
Manufacturer: Vishay Micro-Measurements
Part Number: EP-08-125RA-120
Cellophane Tape
Name: M-Line Accessories Cellophane Tape
Manufacturer: Vishay Micro-Measurements
Part Number: PCT-2A 6599, Control #0002
Terminals
Name: M-Line Bondable Terminals
Manufacturer: Vishay Micro-Measurements
Part Number: CPF-75C
Strain Gage and Terminal Bonding Material
Name: M-Bond AE 10 Adhesive Kit
Manufacturer: Vishay Micro-Measurements
Part Number: F015578, Control #000800
Wire Connecting Strain Gage to Terminal
Name: 34 Gage Red ETP Single Conductor Wire
Manufacturer: Vishay Micro-Measurements
Part Number: 134-AQP6484
Wire Connecting Strain Gage to Terminal
Name: 34 Gage Red ETP Single Conductor Wire
Manufacturer: Vishay Micro-Measurements
Part Number: 134-AQP6484
Soldering Station
Name: Temperature Controlled Soldering Station
Manufacturer: Tenma
Part Number: Model #21-7935
Solder
Name: M-Line 6619 Solder
Manufacturer: Vishay Mircro-Measurements
Part Number: 361A-20R-25, Control #144
Material List for Strain Gage Application

Wire Connecting Terminal to P3
Name: 26 AWG 3 Conductor Wire
Manufacturer: Vishay Micro-Measurements
Part Number: 326-DFV
Strain Gage Recorder
Name: P3 Strain Indicator and Recorder
Manufacturer: Vishay Micro-Measurements
Part Number: P3
Rubber Protective Covering
Name: Strain Gage Protective Covering
Manufacturer: Vishay Micro-Measurements
Part Number: M-coat F Kit, 6692, Control #0647
Keystone Jacks
Name: Cat 5E keystone Jack T568 A/B Ivory
Manufacturer: Cat 5E
Part Number: NKJ-5107
Material List for Strain Gage Application (Cont.)

Plan Location of Strain Gages – US 82 BOS-W Ramp Overpass
Note: All Gages are on the Faces (edges) of the bearings
Strain Gage Rosette Pattern Numbering – US 82 BOS-W Ramp Overpass

Calculations for Prediction of Transverse Angle – US 82 BOS-W Overpass Ramp
Dead Loads
General Information
span 87.59ft spa 12.25 ft DFV 1.175
Dead Loads
wself 1.167 klf wrail 0.0 klf wbolster 0.0 klf
wslab 0.0kip
ft2
spa wslab 0 klf
wovermin 0 klf wovermax 0.0kip
ft2
spa wovermax 0 klf
pebmin 4.06 kip pebmax 5.41kip
pintdiamin 1.35kip pintdiamax 3kip
RDminspan
2wself wrail wbolster wslab wovermin pebmin pintdiamin
RDmin 56.519 kip
RDmaxspan
2wself wrail wbolster wslab wovermax pebmax pintdiamax
RDmax 59.519 kip
Note: Per the contractor, ac tual beam weight was estimated at 139.5 kips. The crane
measured weight was less, approximately 140 kips less the lifting equipment (7 or 17 kips).
RDmin139.5kip
2RDmin 69.75 kip
RDmax139.5
2kip RDmax 69.75 kip

Calculations for Prediction of Transverse Angle – US 82 BOS-W Overpass Ramp (Cont.)
Bearing Propertie s
hs 0.105 in hro 0.25 in nro 2 hrto hro nro
hrto 0.5 in hri 0.375 in nri 4 hrti hri nri
hrti 1.5 in hrt hrto hrti hrt 2 in T hrt nro nri 1 hs
T 2.525 in d2 13.5in
One Pad Properties
W1 32in L1 9in A1 W1 L1 A1 288 in2
A1b W1 L1 2 hri A1b 30.75 in2
S1
A1
A1b
S1 9.366
IT1
L1 W13
12IT1 24576 in
4ST1
IT1
W1
2
ST1 1536 in3
Two Pad Properties
W2 16in L2 9in A2 W2 L2 A2 144 in2
A2b W2 L2 2 hri A2b 18.75 in2
S2
A2
A2b
S2 7.68
IT2 2L2 W2
3
122 L2 W2 d2
2IT2 58632 in
4
ST2
IT2
d2
W2
2
ST2 2727 in3

Calculations for Prediction of Transverse Angle – US 82 BOS-W Overpass Ramp (Cont.)
Transverse Loads
Delta1 Displacement
T 0.038 L 0.0 Glow 0.095ksi Ghigh 0.175ksi
PD RDmax PD 69.75 kip PLL RLL PLL 0 kip
Delta1D
PD T hrt
Glow A1
Delta1D 0.19 in
Delta1LL
PLL T hrt
Glow A1
Delta1LL 0 in
Delta2 Displacement
Ybott 22.36in Delta2 Ybott T Delta2 0.85 in
MTDL Delta1D Delta2 PD MTDL 72.779 kip in
MTLL Delta1LL Delta2 PLL MTLL 0 kip in
MT MTDL MTLL MT 72.779 kip in
Angle Predicted
D atanDelta1D
T D180
4.388

Appendix 6-1
Product P1 - Modifications to the LRFD Design of U-Beam Bearings

Chapter 3 – Superstructure Design Section 6 - Prestressed Concrete U Beams (Types
U40 and U54)
LRFD Bridge Design 3-11 TxDOT 08/2009
Section 6
Prestressed Concrete U Beams (Types U40 and U54)
Materials
Use Class H concrete with a minimum f’ci = 4.0 ksi and f’c = 5.0 ksi.
Design beams for 0.5-in, low-relaxation strands. You may use 0.6-in, low-relaxation strands for
unusual cases but should check its availability with fabricators.
Use prestressing strand with a specified tensile strength, fpu, of 270 ksi.
You need not increase section properties of the beam to account for the transformed area of
strands or mild steel.
Geometric Constraints
The maximum skew angle for U-beam bridges is 45 degrees.
The maximum allowable transverse slope for U-beam bridges using standard uniform-height
steel-reinforced elastomeric bearings is 4 percent.
Structural Analysis
Beam designs must meet the following requirements:
Include the overlay at the discretion of the designer or if the bridge will receive the overlay
immediately after construction. Recognize that including the overlay in the design of U beams can
significantly limit their ability to span longer span lengths.
Distribute 2/3 of the rail dead load to the exterior beam and 1/3 of the rail dead load to the adja-
cent interior beam applied to the composite cross section.
Each U beam has two interior diaphragms at a maximum average thickness of 13 in. They are
located as close as 10 ft. from midspan of the beam. Account for each diaphragm as a 2-kip load
for U40 beams and as a 3-kip load for U54 beams applied to the non-composite cross section.
Use section properties given on the standard drawings.
Composite section properties may be calculated assuming the beam and slab to have the same
modulus of elasticity (for beams with f’c < 8.5 ksi). Do not include haunch concrete placed on top
of the beam when determining section properties. Section properties based on final beam and slab
modulus of elasticity may also be used.

Chapter 3 – Superstructure Design Section 6 - Prestressed Concrete U Beams (Types
U40 and U54)
LRFD Bridge Design 3-11 TxDOT 08/2009
Live load distribution factors must conform to AASHTO LRFD Bridge Design Specifications,
Article 4.6.2.2.2 for flexural moment and Article 4.6.2.2.3 for shear, except for exterior beam
design. For exterior beam design, use a distribution factor
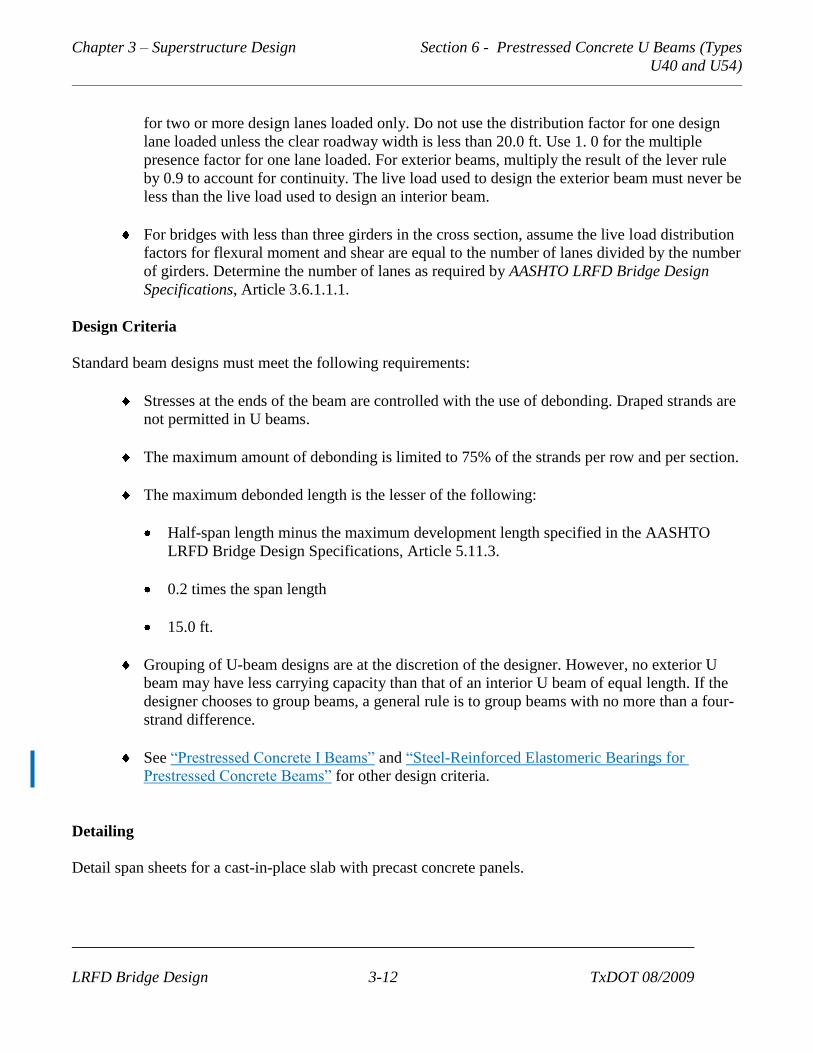
Chapter 3 – Superstructure Design Section 6 - Prestressed Concrete U Beams (Types
U40 and U54)
LRFD Bridge Design 3-12 TxDOT 08/2009
for two or more design lanes loaded only. Do not use the distribution factor for one design
lane loaded unless the clear roadway width is less than 20.0 ft. Use 1. 0 for the multiple
presence factor for one lane loaded. For exterior beams, multiply the result of the lever rule
by 0.9 to account for continuity. The live load used to design the exterior beam must never be
less than the live load used to design an interior beam.
For bridges with less than three girders in the cross section, assume the live load distribution
factors for flexural moment and shear are equal to the number of lanes divided by the number
of girders. Determine the number of lanes as required by AASHTO LRFD Bridge Design
Specifications, Article 3.6.1.1.1.
Design Criteria
Standard beam designs must meet the following requirements:
Stresses at the ends of the beam are controlled with the use of debonding. Draped strands are
not permitted in U beams.
The maximum amount of debonding is limited to 75% of the strands per row and per section.
The maximum debonded length is the lesser of the following:
Half-span length minus the maximum development length specified in the AASHTO
LRFD Bridge Design Specifications, Article 5.11.3.
0.2 times the span length
15.0 ft.
Grouping of U-beam designs are at the discretion of the designer. However, no exterior U
beam may have less carrying capacity than that of an interior U beam of equal length. If the
designer chooses to group beams, a general rule is to group beams with no more than a four-
strand difference.
See “Prestressed Concrete I Beams” and “Steel-Reinforced Elastomeric Bearings for
Prestressed Concrete Beams” for other design criteria.
Detailing
Detail span sheets for a cast-in-place slab with precast concrete panels.

Chapter 5 – Other Designs Section 2 – Steel Reinforced Elastomeric Bearings
for Prestressed Concrete Beams
LRFD Bridge Design 5-3 TxDOT 08/2009
Section 2
Steel-Reinforced Elastomeric Bearings for Prestressed Concrete Beams
Materials
Use 50-durometer neoprene for steel-reinforced elastomeric bearings.
Use a shear modulus range of 95 to 175 psi for design, using the least favorable value for the
design check.
Make steel shims 0.105 in. thick.
Do not use adhesives between bearings and other components.
Geometric Constraints
See standard drawings available at http ://www.dot. state.tx.us/insdtdot/orgchartlcmd/cserve/stan-
dard/bridge-e.htm for standard pad details.
You may use tapered bearings if the taper does not exceed 0.055 ft./ft. For beams on steeper
grades, use a beveled steel sole plate field-welded (1/4-in, fillet) to a 1/2-in, steel plate embedded
in and anchored to beams with headed stud anchors. Use a minimum of four 1/2-in.-by-3-in. stud
anchors with studs located between strands and reinforcement. The minimum thickness of sole
plate should be 1.5 in. of steel between weld and elastomer. The sole plate should extend at least 1
in. beyond the beam flange. Sole plates should not be vulcanized to the bearing to allow slip to
occur at the beam/bearing interface.
Use 1/4-in, exterior pad layers. If using 1/4-in, interior pad layers, disregard the requirements in
the AASHTO LRFD Bridge Design Specifications, Article 14.7.6.1, specifying exterior layers no
thicker than 70% of internal layers.
Structural Analysis
Assume a temperature change of 70 degrees Fahrenheit after erection when calculating thermal
movement in one direction (not total). This provides a conservative estimate of thermal movement
after erection in most regions of Texas based on the minimum and maximum temperature contour
maps in the AASHTO LRFD Bridge Design Specifications, Article 3.12.2.2.1 (the panhandle region
is the most extreme case with Tmin at 10 degrees F and Tmax at 115 degrees F).
Do not include shrinkage, creep, and elastic shortening when determining maximum movement,
which will be accommodated through infrequent slip.

Chapter 5 – Other Designs Section 2 – Steel Reinforced Elastomeric Bearings
for Prestressed Concrete Beams
LRFD Bridge Design 5-4 TxDOT 08/2009
Do not apply IM to live load when checking compressive stress (see AASHTO LRFD Bridge Design
Specifications, Commentary C 14.7.5.3.2).
Use appropriate shear live load distribution, modified for skew.
Use the critical DL condition (the lightest predicted DL) when checking against slip as required by
AASHTO LRFD Bridge Design Specifications, Article 14.7.6.4.
Use Load Combination Service I for all gravity loads.
For the design of steel-reinforced elastomeric bearings for U-beam bridges placed on a transverse
slope, the effect of the transverse slope shall be considered by including:
The transverse displacement, Delta1, caused by the horizontal component of the end
reaction;
The distance from the centerline of the bearing and the center of gravity of the composite U-
beam and deck section, Delta2, determined as the product of the transverse slope and the
perpendicular distance from the bottom of the composite U-beam and deck section to its
center of gravity;
The transverse moment, Mt, determined by the product of the end reaction and the sum of
the Delta1 and Delta2 distances for the Compressive Stress, Compressive Deflection, and
the Rotation checks;
The effective displacement, Δs,Eff, determined as the square root of the sum of the Delta1
and the thermal expansion displacements for the Shear Strain check;
The effective slope, ΘEff, determined as the square root of the sum of the transverse and
longitudinal slopes for the Anchorage Slip check.
Design Criteria
Follow Design Method A in AASHTO LRFD Bridge Design Specifications, Article 14.7.6, with the
following exceptions:
DL compressive stress limit is the lesser of 1.20 ksi and 1.2 GS.
Total compressive stress limit is the lesser of 1.50 ksi and 1.5 GS. This limit can be exceeded up
to 15% at the engineer’s discretion.
For rotation check, disregard AASHTO LRFD Bridge Design Specifications, Article 14.7.6.3.5.
Rotation is acceptable if the total compressive deflection equals or exceeds , where L is
the pad length defined in AASHTO LRFD Bridge Design Specifications, and Θ is the total
rotation. Estimate compressive deflection using AASHTO LRFD Bridge Design Specifications,
Figure C14.7.5.3.3-l.

Chapter 5 – Other Designs Section 2 – Steel Reinforced Elastomeric Bearings
for Prestressed Concrete Beams
LRFD Bridge Design 5-4 TxDOT 08/2009
Calculate total rotation for dead and live load plus 0.005 radians for construction uncertainties
as required by AASHTO LRFD Bridge Design Specifications, Article 14.4.2.1. Take maximum
live load rotation as 4* Δ /(span length), where Δ is midspan LL deflection.
Account for pad taper when checking against slip as required by AASHTO LRFD Bridge Design
Specifications, Article 14.7.6.4, as follows: Δs ≤ (0.2 — Gr) x DLxhrt/(GxA), where Gr = beam
grade in ft./ft.
You may use hrt instead of total pad height when checking stability as required in AASHTO
LRFD Bridge Design Specifications, Article 14.7.6.3.6.
Detailing
Use standard drawing IBEB for guidance on detailing custom bearing pad designs.