study of future demand for radio spectrum in canada 2011...
TRANSCRIPT

Study of Future Demand for Radio Spectrum in Canada 2011 - 2015
Dawood Khan Spectrum 2020 - Ottawa June 19 2012

We Leverage Global ICT Expertise to Deliver Leading-edge Consulting & Advisory Services
• Wireless & Broadband Advisory and Consulting services • Carrier, Vendor, and Technology independent • A highly experienced team of experts from around the world
• Our clients: • World’s leading operators • Municipalities, governments, and public safety organizations • Verticals such as financial services, retail and healthcare
• Unique Methodology Addresses: • Disruptive and converging telecom technologies • Strategic business problems • Emerging market trends and business models
Our innovative Business Model employs the latest technologies and work practices to bring together leading global experts in a cost effective manner

We help our Clients Achieve and Sustain Leadership through Innovation

OBJECTIVES: • Forecast future radio spectrum
demand in 52 MHz to 38 GHz from 2011 - 2015
• Supplements the Radio Spectrum Inventory Report 2011 – 2015
• Covers 15 Service Categories • Partnered with PA Consulting to
leverage UK Demand Study experience
The spectrum demand report is NOT meant to dictate government
policy nor assess the situation of any specific stakeholder.
Spectrum Demand Study – The Most Elaborate Study of its Kind Globally !
Industry Canada Wireless Services
High Value Services
1. Cellular 2. Fixed Wireless Access (FWA) 3. Backhaul Microwave Facilities 4. Broadcasting 5. Satellite
Other Services
6. Land-Mobile 7. Public Safety 8. Amateur Radio 9. Aeronautical 10. Maritime 11. Military 12. Radiodetermination 13. Space Science 14. Consumer Devices, & 15. Medical Devices

Wireless is Enabling such Rapid Change in Society that 5 Years can be an Infinite Amount of Time for Some Sectors !
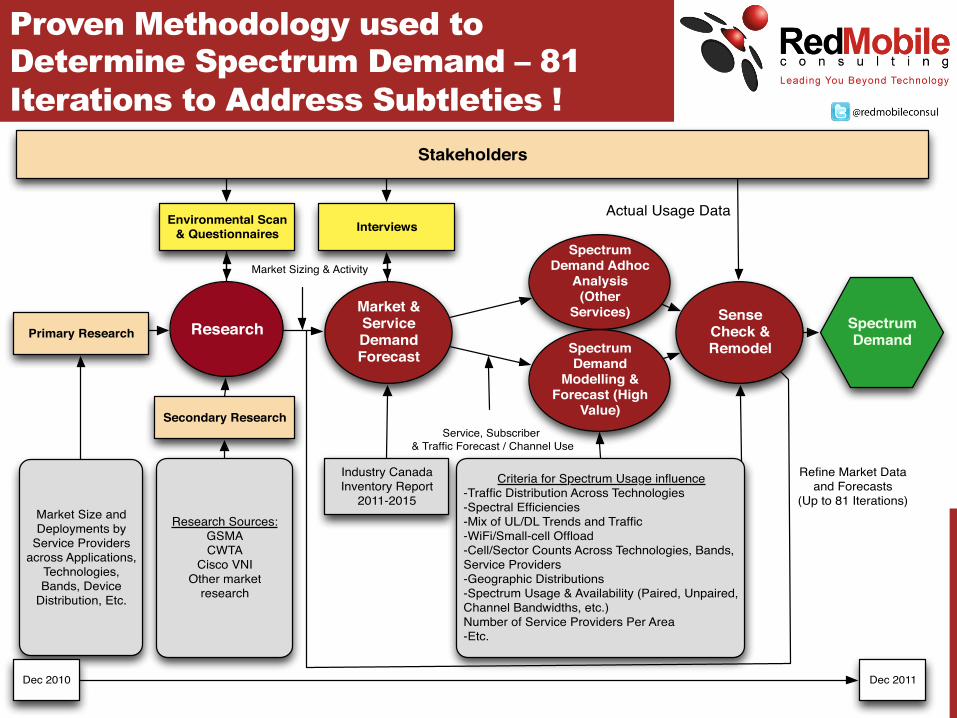
Proven Methodology used to Determine Spectrum Demand – 81 Iterations to Address Subtleties !
Primary Research
Secondary Research
Research
Environmental Scan & Questionnaires
Market & Service Demand Forecast
Industry Canada Inventory Report
2011-2015
Spectrum Demand
Modelling & Forecast (High
Value)
Research Sources:GSMACWTA
Cisco VNIOther market
research
Criteria for Spectrum Usage influence-Traffic Distribution Across Technologies-Spectral Efficiencies-Mix of UL/DL Trends and Traffic-WiFi/Small-cell Offload-Cell/Sector Counts Across Technologies, Bands, Service Providers-Geographic Distributions-Spectrum Usage & Availability (Paired, Unpaired, Channel Bandwidths, etc.)Number of Service Providers Per Area-Etc.
Sense Check & Remodel
Actual Usage Data
Refine Market Data and Forecasts
(Up to 81 Iterations)
Stakeholders
Market Sizing & Activity
Service, Subscriber & Traffic Forecast / Channel Use
Spectrum Demand Adhoc
Analysis (Other
Services)Spectrum Demand
Dec 2011Dec 2010
Interviews
Market Size and Deployments by
Service Providers across Applications,
Technologies, Bands, Device
Distribution, Etc.
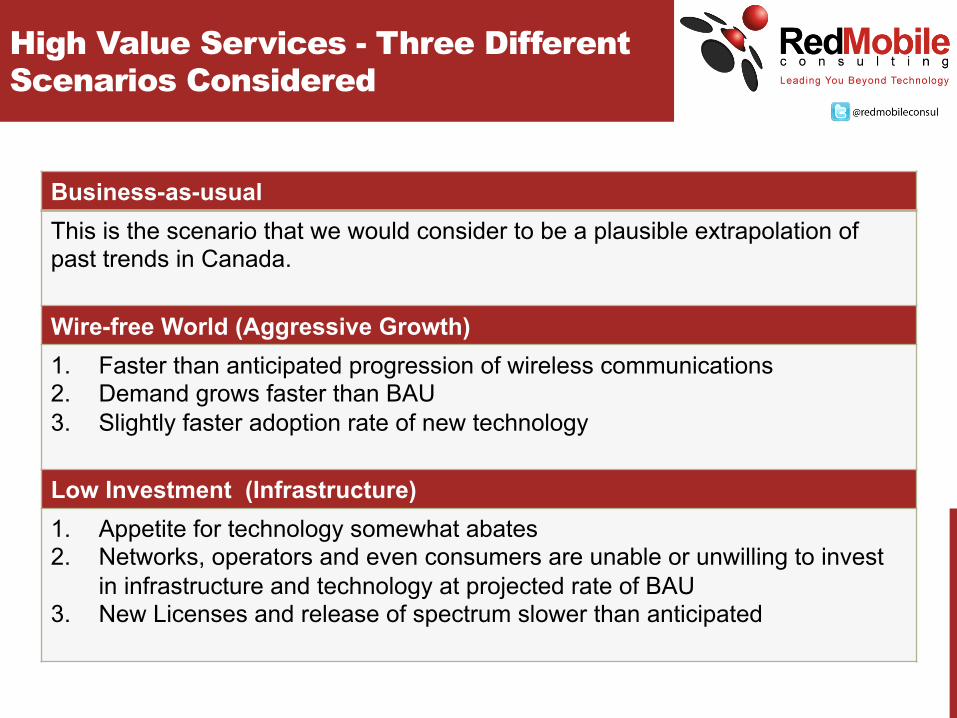
High Value Services - Three Different Scenarios Considered
Business-as-usual This is the scenario that we would consider to be a plausible extrapolation of past trends in Canada. Wire-free World (Aggressive Growth) 1. Faster than anticipated progression of wireless communications 2. Demand grows faster than BAU 3. Slightly faster adoption rate of new technology Low Investment (Infrastructure) 1. Appetite for technology somewhat abates 2. Networks, operators and even consumers are unable or unwilling to invest
in infrastructure and technology at projected rate of BAU 3. New Licenses and release of spectrum slower than anticipated
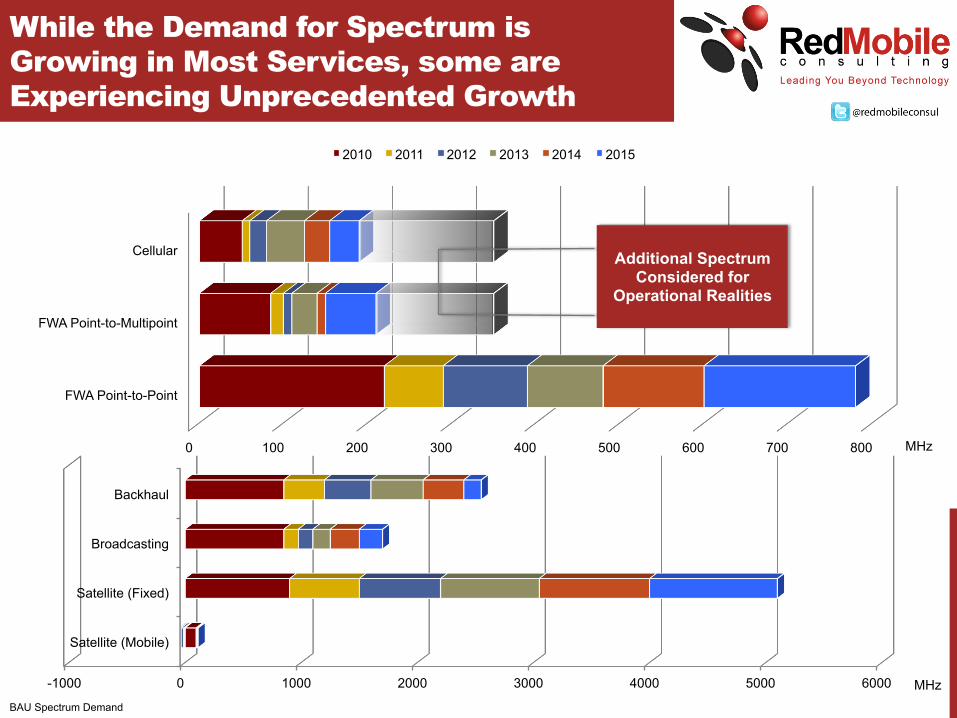
0 100 200 300 400 500 600 700 800
FWA Point-to-Point
FWA Point-to-Multipoint
Cellular
2010 2011 2012 2013 2014 2015
While the Demand for Spectrum is Growing in Most Services, some are Experiencing Unprecedented Growth
-1000 0 1000 2000 3000 4000 5000 6000
Satellite (Mobile)
Satellite (Fixed)
Broadcasting
Backhaul
Additional Spectrum Considered for
Operational Realities
BAU Spectrum Demand
MHz
MHz

Traffic Demand Driven by Insatiable Appetite for the Coolest Devices & most Engaging User-Experience
0
2000
4000
6000
8000
2005 2006 2007 2008 2009 2010 2011 2012 2013 2014 2015
MB
/Mo
Monthly Data Traffic of Other Device Types
(A) Entry Smartphones (B) High-end Smartphones [C] Highest Capacity Mobile BB (dongles, tablets, etc.)
0
10000
20000
30000
2005 2006 2007 2008 2009 2010 2011 2012 2013 2014 2015
MB
/Mo
Monthly Data Traffic of Fixed Mobile Substitution
0
5000000
10000000
15000000
20000000
25000000
30000000
35000000
40000000
Num
ber o
f Mob
ile S
ubsc
riber
s
Mobile Subscribers by Device Type
(C2) No. of Mobile HC BB Laptops, Dongles, etc. (C1) No. of Mobile HC BB Tablets & similar devices (B) No. of high-end Smartphones (A) No. of entry Smartphones Non-Broadband Devices
Over 60% of mobile devices will be broadband-enabled by 2015
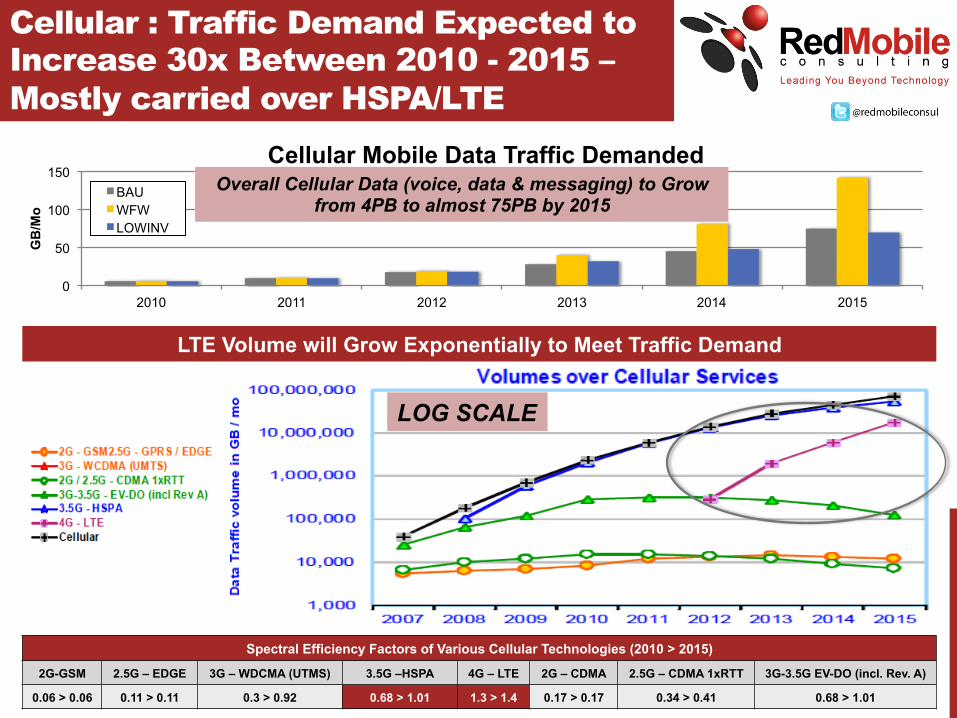
0
50
100
150
2010 2011 2012 2013 2014 2015
GB
/Mo
Cellular Mobile Data Traffic Demanded BAU WFW LOWINV
LTE Volume will Grow Exponentially to Meet Traffic Demand
Cellular : Traffic Demand Expected to Increase 30x Between 2010 - 2015 – Mostly carried over HSPA/LTE
Spectral Efficiency Factors of Various Cellular Technologies (2010 > 2015)
2G-GSM 2.5G – EDGE 3G – WDCMA (UTMS) 3.5G –HSPA 4G – LTE 2G – CDMA 2.5G – CDMA 1xRTT 3G-3.5G EV-DO (incl. Rev. A)
0.06 > 0.06 0.11 > 0.11 0.3 > 0.92 0.68 > 1.01 1.3 > 1.4 0.17 > 0.17 0.34 > 0.41 0.68 > 1.01
Overall Cellular Data (voice, data & messaging) to Grow from 4PB to almost 75PB by 2015
LOG SCALE

Cellular Spectrum Demand with Operational Realities is 300-500 MHz
Low Investment
Operational Considerations include allowance for channel widths, timing of growth in traffic, and headroom for operators to transition to new technologies, etc.
Business as Usual Wire-Free World
1. Just for busy hour traffic (and acceptable QoS) 2. After applying min channel widths 3. After applying timing rules, as well as min channel widths

FWA: P2M Spectrum Demand Grows to 350 MHz; P2P Grows to 800 MHz
0
20
40
60
80
100
2010 2011 2012 2013 2014 2015
GB
/Mo
FWA P2M Offered Traffic/Sub BAU WFW LOW INV
Demand for FWA Spectrum P2M
Services in the 2500 MHz Band
FWA Application using Fixed WiMAX and LTE/HSPA used in P2M
analysis. Mobile Application using LTE/HSPA accounted for in Cellular Services
0
200
400
600
800
1000
1200
1400
2010 2011 2012 2013 2014 2015
MH
z
FWA P2P Spectrum Demand

0
50
100
150
200
2010 2011 2012 2013 2014 2015
GB
/Mon
th
Backhaul Microwave Traffic Demand
BAU
WFW
LOW INV
0
500
1000
1500
2000
2500
3000
3500
4000
2010 2011 2012 2013 2014 2015
MH
z
Backhaul Microwave: Demand Driven by Growth in FWA and Cellular Traffic
Microwave Backhaul Spectrum – Division and Demand Forecast
Spectrum Demand to Increase from 800 MHz to
2500 MHz

OTA TV Radio Digital TV over Satellite
OTA and Radio Spectrum Congested, DTV over Satellite to Drive Spectrum Demand Growth
0
500
1000
1500
2000
2500
3000
2010 2011 2012 2013 2014 2015
MH
z
Broadcasting Spectrum Demand
BAU
WFW
LOW INV
Broadcasting: Spectrum Demand will Almost Double - Driven by DTV over Satellite (Broadcasting Satellite)
Spectrum Demand to Increase from 900 MHz
to 1700 MHz
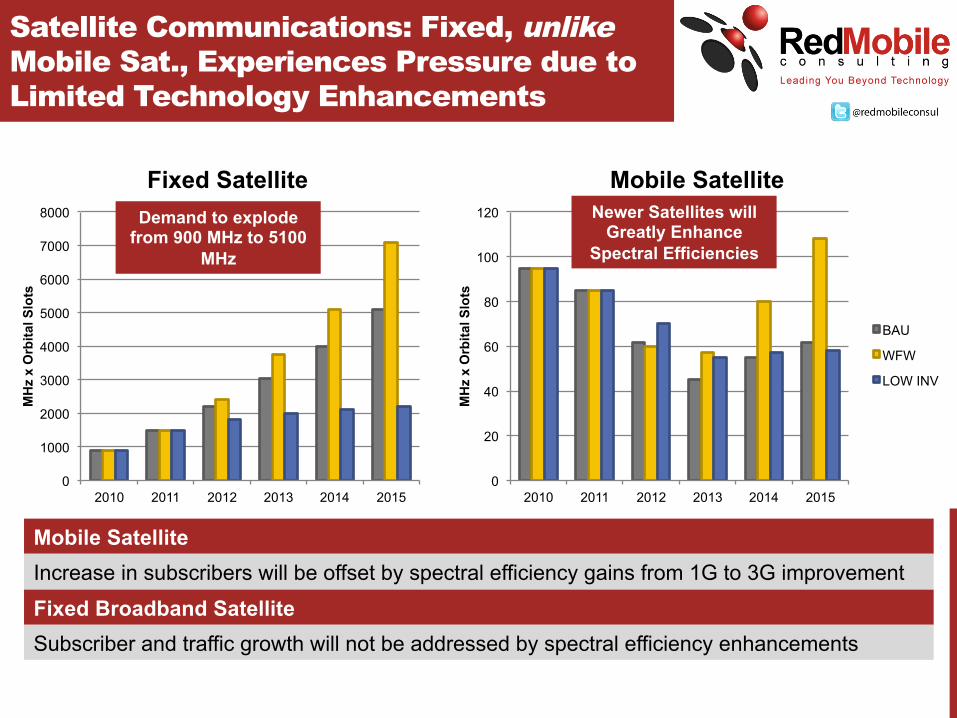
Satellite Communications: Fixed, unlike Mobile Sat., Experiences Pressure due to Limited Technology Enhancements
0
20
40
60
80
100
120
2010 2011 2012 2013 2014 2015
MH
z x
Orb
ital S
lots
Mobile Satellite
BAU
WFW
LOW INV
0
1000
2000
3000
4000
5000
6000
7000
8000
2010 2011 2012 2013 2014 2015
MH
z x
Orb
ital S
lots
Fixed Satellite
Mobile Satellite Increase in subscribers will be offset by spectral efficiency gains from 1G to 3G improvement
Fixed Broadband Satellite Subscriber and traffic growth will not be addressed by spectral efficiency enhancements
Demand to explode from 900 MHz to 5100
MHz
Newer Satellites will Greatly Enhance
Spectral Efficiencies

Land-Mobile Services
Public Safety Services
Amateur Radio
Aeronautical Services
Maritime Services
Military
Radio Determination Services
Space Science Communication
Consumer Devices
Medical Devices
Other Services: Adhoc Analysis Shows Varying Degrees of Spectrum Congestion
Adhoc Analysis - Some Areas of Interest
Congested or Approaching Congestion: • LMR & PS: UHF, VHF, and 800 MHz bands • Aero: UHF, VHF, & SHF bands (ITU/ICAO, 10+ year) • Consumer: Localized congestion in 900, 2400 MHz
Areas Expected/Starting to Exhibit Pressure: • Amateur: 144-148/430-450 MHz bands • Military: AMT Services (NATO, NORAD commitments) • Space: 2 GHz band (Ops); 5 & 8 MHz band (Earth Exp)

Insights & Questions
8901 Woodbine Avenue , Suite 210 Markham, Ontario L3R 9Y4
Canada
www.redmobileco.com
Contact Dawood Khan:
Tel: 905-479-0080 x 112
Please Arrange a Private Consultation to Discuss Important Insights & Potential
Impact to your Organization

Additional Information
http://www.itu.int/ITU-R/index.asp?category=study-groups&rlink=rcpm-wrc-15-studies&lang=en#{5B6B8397-2479-4D7F-B68D-6F107AD3C305}

ITU WRC 15 – Agenda Item 1.1 “…to consider additional spectrum allocations to the mobile service on a primary basis and identification of additional frequency bands for International Mobile Telecommunications (IMT) and related regulatory provisions, to facilitate the development of terrestrial mobile broadband applications, in accordance with Resolution 233 (WRC-12)”
Places Canada in a Global Leadership position for its contribution to International commitments - ITU, CITEL, etc.
The Spectrum Demand Study: Positioning Canada as a Global Leader
http://www.itu.int/ITU-R/index.asp?category=study-groups&rlink=rcpm-wrc-15-studies&lang=en#{5B6B8397-2479-4D7F-B68D-6F107AD3C305}
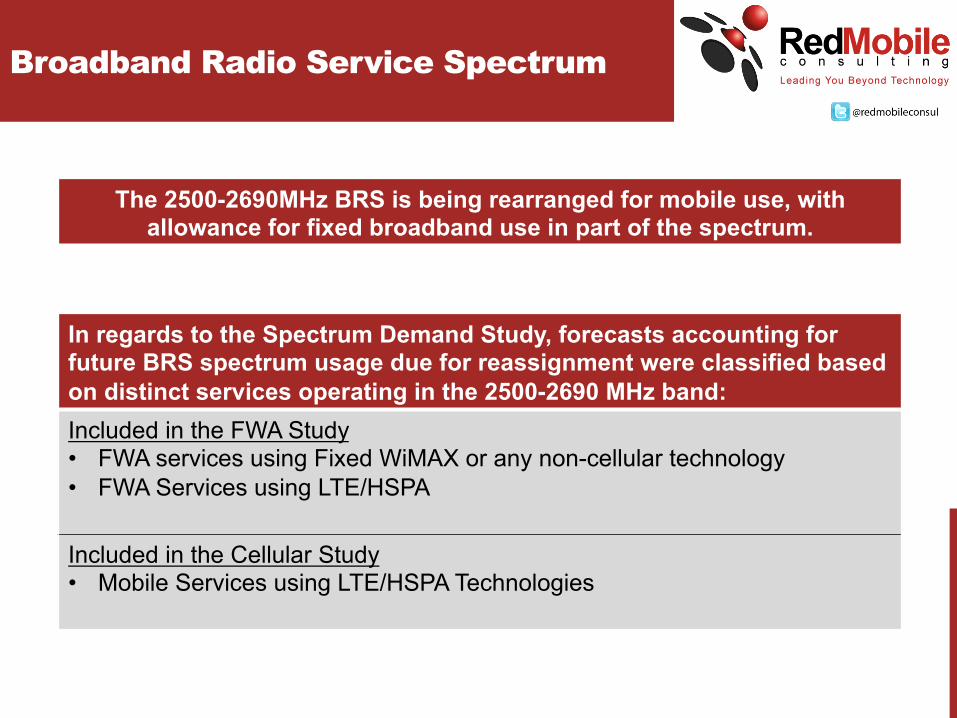
Broadband Radio Service Spectrum
The 2500-2690MHz BRS is being rearranged for mobile use, with allowance for fixed broadband use in part of the spectrum.
In regards to the Spectrum Demand Study, forecasts accounting for future BRS spectrum usage due for reassignment were classified based on distinct services operating in the 2500-2690 MHz band: Included in the FWA Study • FWA services using Fixed WiMAX or any non-cellular technology • FWA Services using LTE/HSPA Included in the Cellular Study • Mobile Services using LTE/HSPA Technologies
Land-Mobile Services
Public Safety Services
Amateur Radio
Aeronautical Services
Maritime Services
Military
Radio Determination Services
Space Science Communication
Consumer Devices
Medical Devices
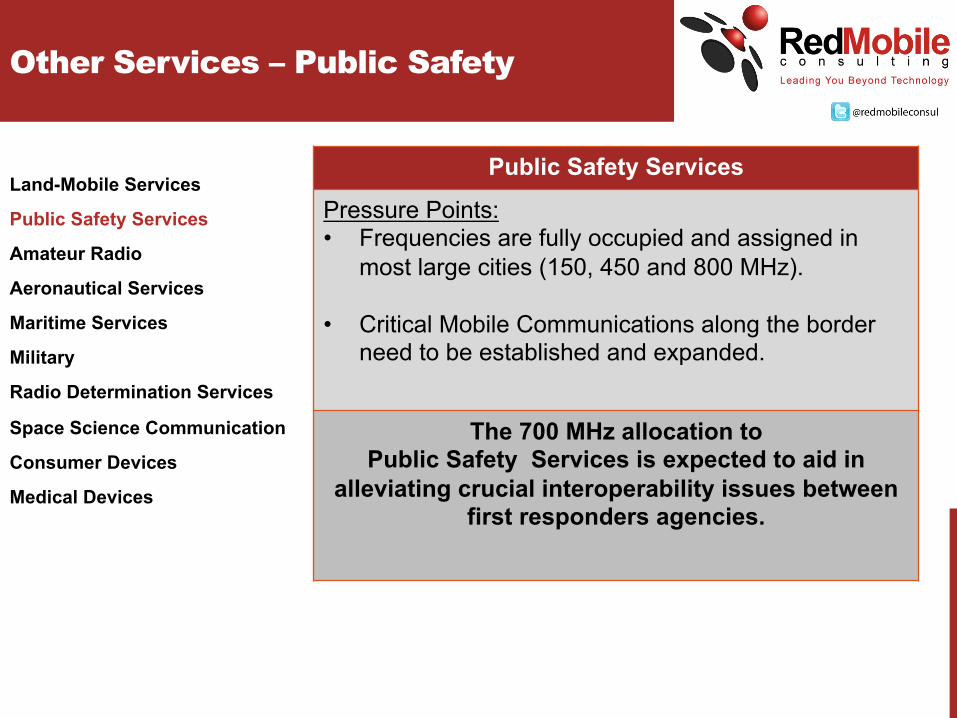
Other Services – Public Safety
Public Safety Services
Pressure Points: • Frequencies are fully occupied and assigned in
most large cities (150, 450 and 800 MHz). • Critical Mobile Communications along the border
need to be established and expanded.
The 700 MHz allocation to Public Safety Services is expected to aid in
alleviating crucial interoperability issues between first responders agencies.
Pressure Points
Land-Mobile Services
Public Safety Services
Amateur Radio
Aeronautical Services
Maritime Services
Military
Radio Determination Services
Space Science Communication
Consumer Devices
Medical Devices
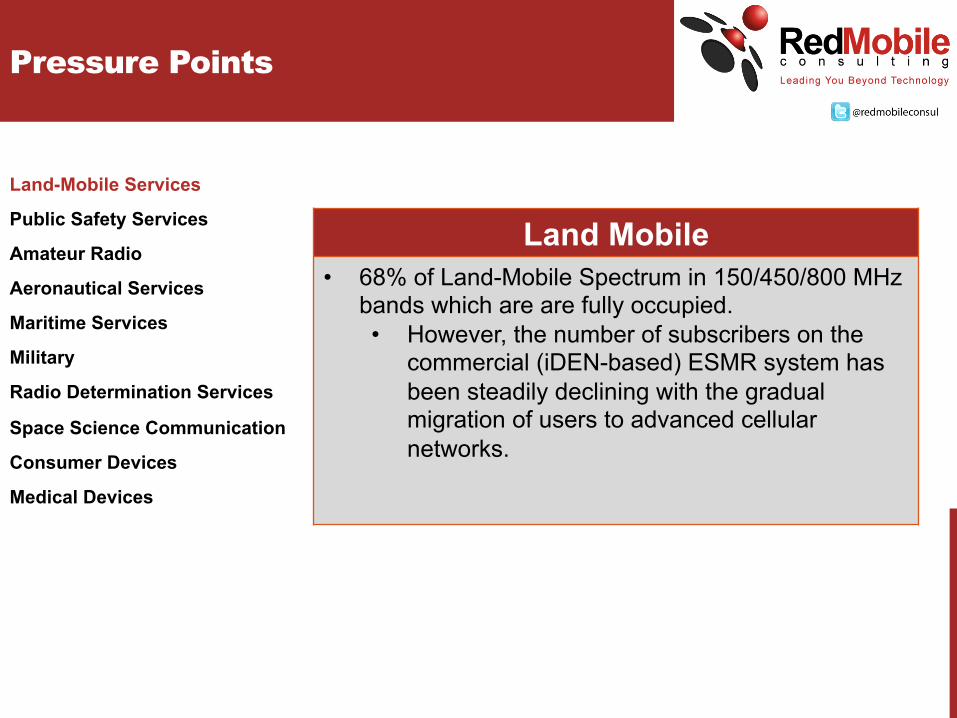
Land Mobile • 68% of Land-Mobile Spectrum in 150/450/800 MHz
bands which are are fully occupied. • However, the number of subscribers on the
commercial (iDEN-based) ESMR system has been steadily declining with the gradual migration of users to advanced cellular networks.
Land-Mobile Services
Public Safety Services
Amateur Radio
Aeronautical Services
Maritime Services
Military
Radio Determination Services
Space Science Communication
Consumer Devices
Medical Devices
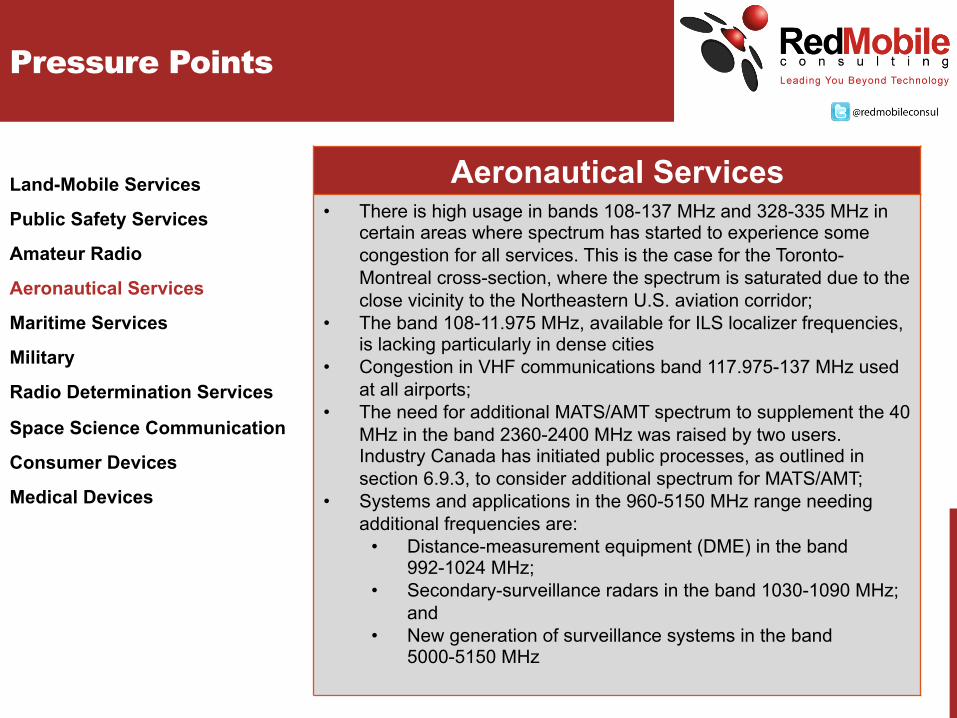
Aeronautical Services • There is high usage in bands 108-137 MHz and 328-335 MHz in
certain areas where spectrum has started to experience some congestion for all services. This is the case for the Toronto-Montreal cross-section, where the spectrum is saturated due to the close vicinity to the Northeastern U.S. aviation corridor;
• The band 108-11.975 MHz, available for ILS localizer frequencies, is lacking particularly in dense cities
• Congestion in VHF communications band 117.975-137 MHz used at all airports;
• The need for additional MATS/AMT spectrum to supplement the 40 MHz in the band 2360-2400 MHz was raised by two users. Industry Canada has initiated public processes, as outlined in section 6.9.3, to consider additional spectrum for MATS/AMT;
• Systems and applications in the 960-5150 MHz range needing additional frequencies are:
• Distance-measurement equipment (DME) in the band 992-1024 MHz;
• Secondary-surveillance radars in the band 1030-1090 MHz; and
• New generation of surveillance systems in the band 5000-5150 MHz
Pressure Points
Land-Mobile Services
Public Safety Services
Amateur Radio
Aeronautical Services
Maritime Services
Military
Radio Determination Services
Space Science Communication
Consumer Devices
Medical Devices
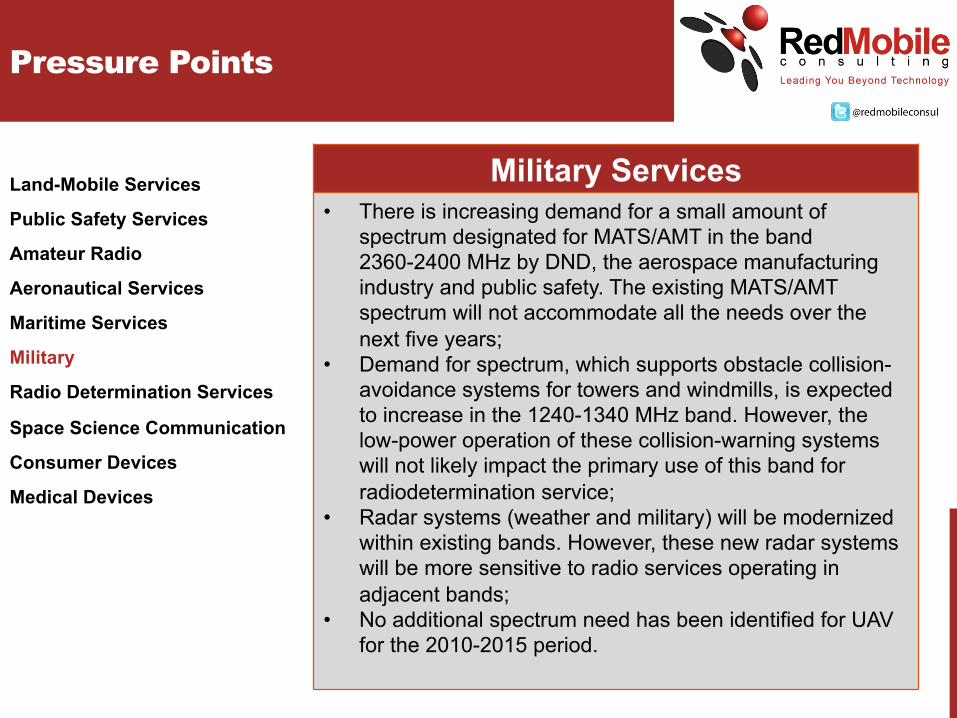
Military Services • There is increasing demand for a small amount of
spectrum designated for MATS/AMT in the band 2360-2400 MHz by DND, the aerospace manufacturing industry and public safety. The existing MATS/AMT spectrum will not accommodate all the needs over the next five years;
• Demand for spectrum, which supports obstacle collision-avoidance systems for towers and windmills, is expected to increase in the 1240-1340 MHz band. However, the low-power operation of these collision-warning systems will not likely impact the primary use of this band for radiodetermination service;
• Radar systems (weather and military) will be modernized within existing bands. However, these new radar systems will be more sensitive to radio services operating in adjacent bands;
• No additional spectrum need has been identified for UAV for the 2010-2015 period.
Pressure Points
Land-Mobile Services
Public Safety Services
Amateur Radio
Aeronautical Services
Maritime Services
Military
Radio Determination Services
Space Science Communication
Consumer Devices
Medical Devices
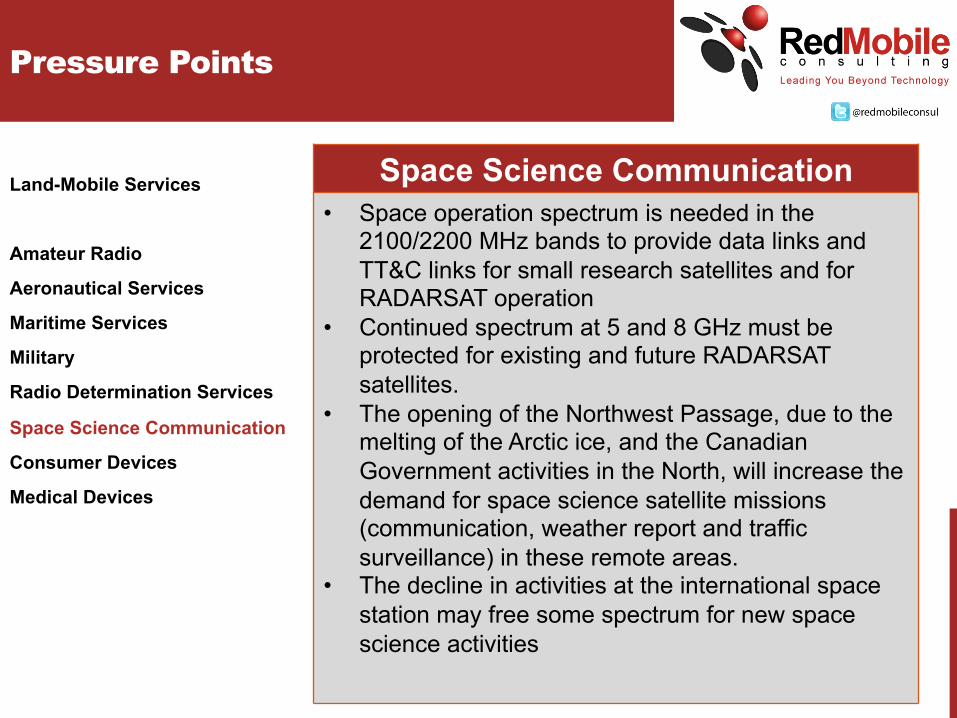
Space Science Communication • Space operation spectrum is needed in the
2100/2200 MHz bands to provide data links and TT&C links for small research satellites and for RADARSAT operation
• Continued spectrum at 5 and 8 GHz must be protected for existing and future RADARSAT satellites.
• The opening of the Northwest Passage, due to the melting of the Arctic ice, and the Canadian Government activities in the North, will increase the demand for space science satellite missions (communication, weather report and traffic surveillance) in these remote areas.
• The decline in activities at the international space station may free some spectrum for new space science activities
Pressure Points

Land-Mobile Services
Public Safety Services
Amateur Radio
Aeronautical Services
Maritime Services
Military
Radio Determination Services
Space Science Communication
Consumer Devices
Medical Devices
Consumer Devices • The greatest number of consumer devices use the
900 & 2400 MHz bands • 2400 & 5800 MHz bands are being used for Wi-Fi
systems and embedded chips in consumer devices • Congesting occurs at Wi-Fi hotspots established in
areas of high congregation (conference centres, airport, etc.).
Pressure Points