study of landfill microbial communities using landfill gas and landfill … · 2007-06-05 · the...
TRANSCRIPT

The Study of Landfill Microbial Communities Using Landfill Gas and Landfill Gas
Condensate
A Thesis
Submitted to the Faculty
of
Drexel University
by
Mijin Kim
in partial fulfillment of the
requirements for the degree
of
Doctor of Philosophy
May 2003
© Copyright 2003 Mijin Kim. All Rights Reserved.
ii
Dedications
To my parents
for their love and support
iii
Acknowledgments
I would like to thank my committee members, Drs. Anandan, Barry, Gealt,
Huang, Kilham, and Oelkers for their support to finish this work. I am especially grateful
to Dr. Kilham for her help and encouragement. I also thank Dr. Gealt for his generosity in
allowing me uses his equipment. Also, I want to express my appreciation to Dr. Spotila
who taught me the quantification technique of hybridization results.
I thank Vorasan who taught me basic, but important lab skills and who was patient
with me whenever I asked questions. Also, I would like to acknowledge the assistance of
the Burlington County (New Jersey) Office of Waste Management and undergraduate
students, Akili Lynn, Rebecca Trejo, and Bob Pieczarka, for their help in gas collection.
I appreciate the faculty, staff and graduate students in the Environmental Science,
Engineering, and Policy Program and the Department of Bioscience and Biotechnology
for their support throughout the course of my time at Drexel University.
I am grateful for the financial support provided by the�Environmental Research
and Education Foundation as well as the teaching assistantships provided by the
Environmental Science, Engineering, and Policy Program at Drexel University.
Finally, I wish to acknowledge my parents and my two brothers for their endless
support, love, inspiration and encouragement. Also, my best friend, Young who has been
essential to the completion of this work.
iv
Table of Contents
List of Tables ..................................................................................................................... vi
List of Figures ................................................................................................................... vii
Abstract .............................................................................................................................. ix
1. Introduction....................................................................................................................1
2. Background ....................................................................................................................3
2.1 Sanitary Landfills.....................................................................................................3
2.1.1. Overview of Sanitary Landfills....................................................................3
2.1.2. Landfill Gas Management............................................................................6
2.1.3. Landfill Gas Condensate Management ......................................................11
2.1.4. Landfill Leachate Management .................................................................11
2.2. Biological and Chemical Changes in the Landfill ................................................14
2.2.1 The Process of Decomposition ..................................................................14
2.2.2 Microbial Succession .................................................................................18
2.3 Molecular Approaches for the Study of Microbial Communities .........................21�
2.3.1 Quantitative Slot-blot Hybridization..........................................................21
2.3.2 Polymerase Chain Reaction (PCR)............................................................27
2.4 Growth of Pure Cultures of Anaerobic Organisms...............................................30
2.5 Cell Collection from Landfill Gas ........................................................................32
3. Materials and Methods.................................................................................................36
3.1 Sampling Site and Collection Methods..................................................................36
3.1.1 Collection of Waste Samples ....................................................................36
3.1.2 Cell Collection from Landfill Gas .............................................................38
v
3.1.3 Cell Collection from Landfill Gas Condensate..........................................42
3.2 Growth of Pure Cultures ........................................................................................44
3.3 Nucleic Acid Extraction.........................................................................................47
3.3.1 Nucleic Acid Extraction from Pure Cultures .............................................47
3.3.2 Nucleic Acid Extraction from Landfill Gas Condensates..........................48
3.3.3 Nucleic Acid Extraction from Landfill Gas...............................................48
3.3.4 Nucleic Acid Extraction form Landfill Wastes .........................................49
3.4 rRNA Quantification by Slot-blot Hybridization ..................................................50
3.5 Polymerase Chain Reaction (PCR) Amplifications...............................................54
4. Results..........................................................................................................................56
4.1 Isolation of Nucleic Acids from Landfill Gas, Gas Condensate, and Waste.........56 4.2 Results of PCR Amplification ...............................................................................60 4.3 Quantification of Domains by Slot-blot Hybridization .........................................67
5. Discussion ....................................................................................................................76
6. Conclusions..................................................................................................................88
7. Future Work .................................................................................................................90 List of References ..............................................................................................................91 Appendix A: Using Landfill Gas to Study Solid Waste Microbial Communities...........107 Appendix B: Media for Methanogens..............................................................................111 Vita...................................................................................................................................115

vi
List of Tables
1. Oligo Probes and PCR Primers Used in This Study....................................................51
2. PCR Amplification Results of DNA Extracted from Landfill Samples ......................60
3. PCR Amplification Results of Landfill Waste Samples at Each Depth ......................64
4. Relative Abundance of Target Groups in the Landfill Samples ..................................73
vii
List of Figures
1. Section view through a typical solid waste sanitary landfill..........................................5 2. Typical gas vents used in the surface a landfill for the passive control of landfill gas......................................................................................................................9 3. Typical vertical gas extraction well and wellhead assembly .......................................10 4. Composite liner system................................................................................................12 5. Overall process of anaerobic decomposition of biological polymers ..........................16 6. Generalized phases in the generation of landfill gases ................................................19 7. Illustration of nucleic acid hybridization, which is the basis for gene probe detection.......................................................................................................................23 8. Culture tubes for anaerobic growth medium ...............................................................32 9. Mechanisms of collection utilized in bioaerosol sampling..........................................35 10. Map of commercial sanitary landfills which are currently operating in New Jersey
State..............................................................................................................................37 11. Filtration apparatus to collect cells from landfill gas well head, before attachment
of filters to pumps or application of heat tape and insulation......................................40 12. Gas collection process to collect cells from landfill gas well, showing pumps,
insulation and heating controller..................................................................................41 13. The scheme of filtration process to concentrate cells from landfill gas condensate....................................................................................................................43 14. Apparatus for dispensing anaerobic media with gassing cannula ...............................46 15. Ethidium bromide-stained 1.5% agarose gels of nucleic acid extracts from landfill gas and gas condensate....................................................................................57 16. Profile of in situ excavated waste temperature versus depth at four well sites............58 17. Ethidium bromide-stained 1.5% agarose gels for nucleic acid extracts from landfill wastes ..............................................................................................................59
viii
18. Ethidium bromide-stained 1.5% agarose gel of PCR amplification of DNA from
landfill gas with Bacteria-specific primers..................................................................61 19. Ethidium bromide-stained 1.5% agarose gels of PCR amplification of DNA from
landfill gas condensate with primers............................................................................62 20. Agarose gels showing PCR amplification of DNA from landfill waste samples with Bacteria-specific primers.....................................................................................65 21. Agarose gels showing PCR amplification of DNA from landfill waste samples with Archaea-specific primers .....................................................................................66 22. Agarose gel showing PCR amplification of DNA from landfill waste samples with Methanogen-specific primers ..............................................................................67 23. Slot-blot community analysis of rRNA from pure cultures, landfill gas, gas
condensate and wastes with four different probes .......................................................69 24. Examples of standard curves used to estimate the relative abundance of Bacteria in a gas sample (Well No. 33)......................................................................................70 25. Examples of standard curves used to estimate the relative abundance of Archaea in a gas condensate sample ..........................................................................................71 26. Examples of standard curves used to estimate the relative abundance of Eucarya in a waste sample (Well No. 45)..................................................................................72 27. Three domains (Bacteria: EUB338; Archaea: ARC915; Eucarya: EUK516)
composition in the landfill gas, gas condensates, and wastes......................................74 28. Three domains (Bacteria: EUB338; Archaea: ARC915; Eucarya: EUK516)
composition in the landfill gas, gas condensates, and wastes at different sampling sites ..............................................................................................................................75
ix
Abstract The Study of Landfill Microbial Communities Using Landfill Gas and Landfill Gas
Condensate Mijin Kim
R. Christopher Barry, Ph.D.
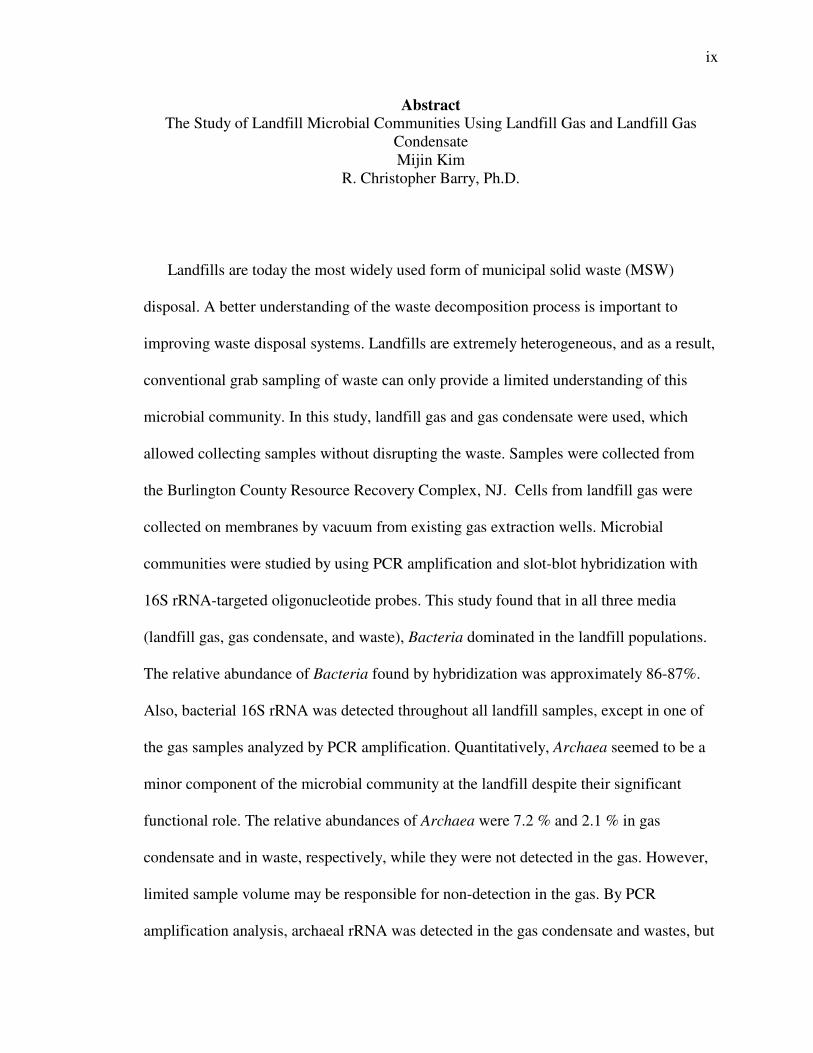
Landfills are today the most widely used form of municipal solid waste (MSW)
disposal. A better understanding of the waste decomposition process is important to
improving waste disposal systems. Landfills are extremely heterogeneous, and as a result,
conventional grab sampling of waste can only provide a limited understanding of this
microbial community. In this study, landfill gas and gas condensate were used, which
allowed collecting samples without disrupting the waste. Samples were collected from
the Burlington County Resource Recovery Complex, NJ. Cells from landfill gas were
collected on membranes by vacuum from existing gas extraction wells. Microbial
communities were studied by using PCR amplification and slot-blot hybridization with
16S rRNA-targeted oligonucleotide probes. This study found that in all three media
(landfill gas, gas condensate, and waste), Bacteria dominated in the landfill populations.
The relative abundance of Bacteria found by hybridization was approximately 86-87%.
Also, bacterial 16S rRNA was detected throughout all landfill samples, except in one of
the gas samples analyzed by PCR amplification. Quantitatively, Archaea seemed to be a
minor component of the microbial community at the landfill despite their significant
functional role. The relative abundances of Archaea were 7.2 % and 2.1 % in gas
condensate and in waste, respectively, while they were not detected in the gas. However,
limited sample volume may be responsible for non-detection in the gas. By PCR
amplification analysis, archaeal rRNA was detected in the gas condensate and wastes, but
x
not in the gas. Methanogens were identified only in the landfill gas condensate and in one
waste sample. Eucaryotic rRNA was only detected in landfill wastes, where their relative
abundance was 13%. A literature review suggested that no prior study has investigated
the landfill microbial communities by using landfill gas or gas condensates. The present
study suggests that gas and gas condensates could provide representative samples from
the landfill environment. The results from this study should provide a foundation for
study of the microbial ecology in landfills.

1
1. Introduction
Landfills are the most commonly used method for municipal solid waste (MSW)
disposal, and so a better understanding of this system is important to improving
municipal solid waste management. However, little study has been done on landfill
microbiology, in large part because of the sampling difficulties involved. First, landfills
are extremely heterogeneous anaerobic environments, and it is thus difficult to evaluate
whole processes from individual samples unless very large amounts of waste are
collected. Second, because some of the solid wastes in landfills are potentially hazardous,
special precautions and training are required for excavation and drilling. Additionally,
regulatory obstacles to disruption of landfills are also significant.
In landfills, the organic portion of waste is broken down by anaerobic
microorganisms generating significant amounts of gases, mostly carbon dioxide (CO2)
and methane (CH4 ; USEPA, 1995; Kortegast and Ampurch, 1997; Tchobanoglous, et al.,
1993; WSDE, 1987). At most large landfills, gas is actively pumped from gas wells at
meter-per-second velocities. A previous study (Barry and Kim, 2000) showed that
particles of solid waste biofilms and other microbial aggregations come to the surface
with the gas. This result suggested that the microbial communities in the solid waste
environment might be reflected in the gas stream.
The diversity of microbial communities in the natural environment is difficult to
understand with culture-based techniques alone. However, the recent development of
molecular techniques, such as PCR amplification and hybridization with phylogenetic
probes, can overcome the limitation of culture dependent methods. In this study,
2
microorganisms were collected from landfill gas (LFG) and landfill gas condensate
(LFGC), which is the liquid formed from water vapor in landfill gas when it cools.
Landfill wastes were also collected at the same sampling sites for comparison. Then
microbial populations from landfill samples were identified and quantified by using PCR
amplification and slot-blot hybridization.
A literature review suggested that no prior study has investigated the landfill
microbial communities by using landfill gas or gas condensates. This study describes a
way of studying landfill microbial communities using landfill gas and landfill gas
condensate, which allows collecting many numbers of samples without disrupting the
waste. Comparisons between landfill waste and landfill gas microbial communities were
made by using culture-independent methods. This study provides a foundation of the
microbial ecology involved in landfill waste degradation.
3
2. Background
2.1 Sanitary Landfills 2.1.1 Overview of Sanitary Landfills
The term “sanitary landfill” refers to an engineered facility for the disposal of
municipal solid waste designed and operated to minimize public health and
environmental impacts (Tchobanoglous, et al., 1993). In the United States during the year
2000, approximately 128.3 million tons (55% by weight) of MSW were landfilled, while
69.9 millions tons (30% by weight) were recovered and 33.7 million tons (15% by
weight) were combusted. The recovery has been substantially increased over last few
decades: recovery was 6.4% in 1960 (U.S. Environmental Protection Agency, 2002).
However, the types of wastes that can be recycled or composted are limited. Combustion
is generally more expensive than landfilling, and air emissions from combustion, such as
nitrogen oxides (NOx), sulfur dioxide (SO2), carbon monoxide (CO), particulate matter
(PM), dioxins and furans pose a significant environmental concern. In addition, ash
residues from solid waste combustors require proper management, and these ashes are in
fact often landfilled (Hickman, 1999). The number of landfills in the United States is
steadily decreasing-from 8,000 in 1988 to 1,967 in 2000. The overall capacity, however,
has remained relatively constant, because new landfills are usually much larger than in
the past (U.S. Environmental Protection Agency, 2002). In general, economics and
current trends suggest that disposal of solid waste in landfills will remain an important
management strategy in the future.
Construction and operation of landfills is generally straightforward, despite the
complexity of the natural processes involved in waste decomposition. Before wastes are
4
deposited in the ground, a site is often excavated to allow more waste to be deposited on
a given plot of land. The lowest component of a landfill is the liner system, which
includes drains and impermeable barriers designed to minimize the migration of leachate
to groundwater. As solid waste is deposited in the landfill, waste is compacted and
covered daily. The total amount of waste a site can receive is determined by the area of
the plot and by the maximum slope of the sides of the landfill that still ensure slope
stability. Once waste has reached the final design level of the landfill, a final cover is
applied. The goals of the final cover are to minimize rainfall and snowfall infiltration, to
limit the uncontrolled release of landfill gases, to suppress the proliferation of disease
vectors, to limit the risk of fire, and to provide suitable conditions for use of the site after
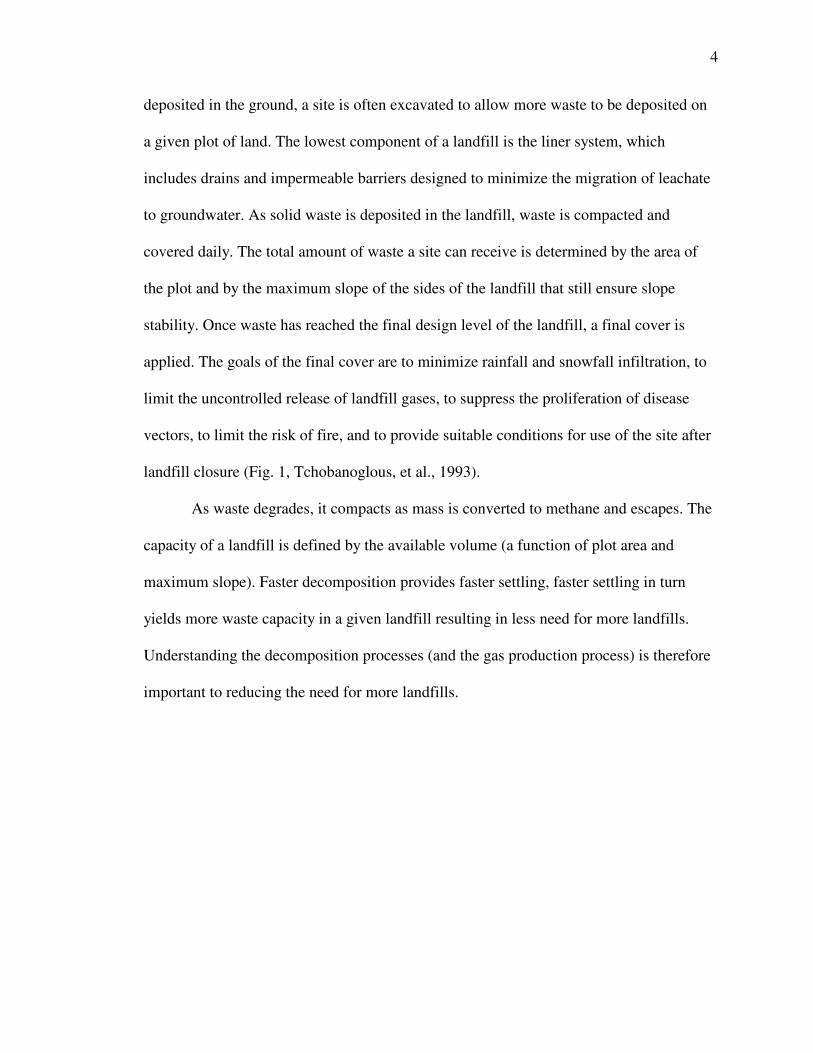
landfill closure (Fig. 1, Tchobanoglous, et al., 1993).
As waste degrades, it compacts as mass is converted to methane and escapes. The
capacity of a landfill is defined by the available volume (a function of plot area and
maximum slope). Faster decomposition provides faster settling, faster settling in turn
yields more waste capacity in a given landfill resulting in less need for more landfills.
Understanding the decomposition processes (and the gas production process) is therefore
important to reducing the need for more landfills.
5
Figure 1. Section view through a typical solid waste sanitary landfill. Bench is used to maintain the slope stability of the landfill, for the placement of surface water drainage channels, and for the location of landfill gas recovery piping. (After Tchobanoglous, et al., 1993)
Cell
Gas extraction well
Final cover system
Landfill liner system
Daily cover Compacted solid wastes
6 inch (15cm) intermediate cover
Bench (terrace)
6 inch (15cm) intermediate cover
Cell
Final cell
Gascollection
system
6
2.1.2 Landfill Gas Management
A solid waste landfill can be thought of as a biochemical reactor. Solid waste and
water are the major inputs, and landfill gas and leachate are the principal outputs. Landfill
gas is a product of the anaerobic biological decomposition of the organic fraction of
waste. Carbon dioxide (CO2) and methane (CH4) are the principal gases and represent
over 95% of landfill gas. Trace gases may include nitrogen, oxygen, hydrogen sulfide,
disulfides, mercaptans, and various volatile organic compounds (USEPA, 1995;
Kortegast and Ampurch, 1997; Tchobanoglous, et al., 1993; WSDE, 1987). Those trace
gases sometimes are described as non-methane organic compound (NMOCs).
Landfill gas must be controlled because of its potential explosiveness, and
because it induces vegetative stress that leads to the destruction of plants. Also, methane
and carbon dioxide are recognized as greenhouse gases that contribute to global warming.
Some trace gases can be toxic and therefore pose risks to public health. In the 1990s,
attention turned to landfill gas, primarily due to the impact of landfill gas on air quality
and global warming. This attention led the United States to regulate landfill gas such that
municipal solid waste landfills are now required to monitor and manage both landfill gas
migration and landfill gas surface emissions (USEPA, 1991; 1996). These regulations
require the implementation of planned and regularly scheduled landfill gas monitoring at
most municipal solid waste landfills. The landfill gas surface emission regulations
address all new municipal solid waste landfills through New Source Performance
Standards (NSPS), and regulate all existing municipal solid waste landfills with Emission
Guidelines (EGs). These regulations establish the maximum allowable emission level of
non-methane organic compounds (NMOCs). Also, these air emission regulations specify
7
the best demonstrated technology (BDT) that must be used to control releases. Finally,
these regulations specify quarterly air emission monitoring.
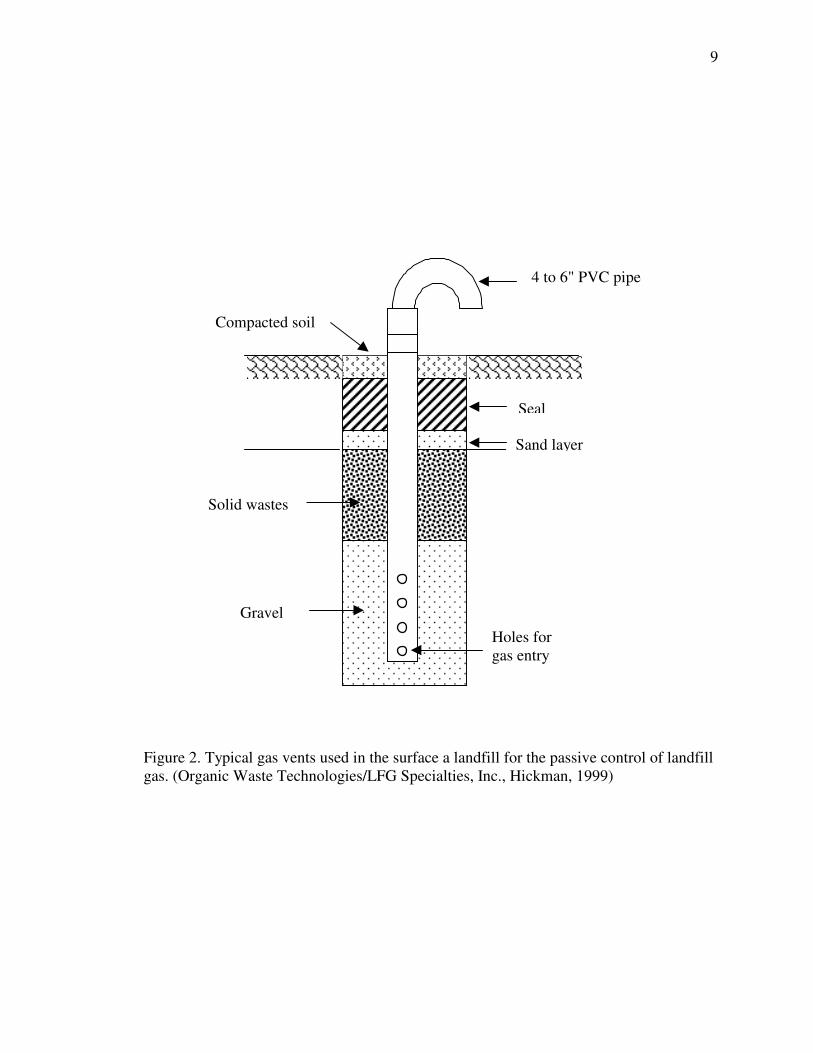
Two basic types of systems are used to control the migration and emission of
landfill gas: passive and active systems. In the passive gas control systems the pressure of
the gas that is generated in the landfill provides the driving force to move the gas through
the collection system (Fig. 2). Such passive systems are usually limited to smaller sites or
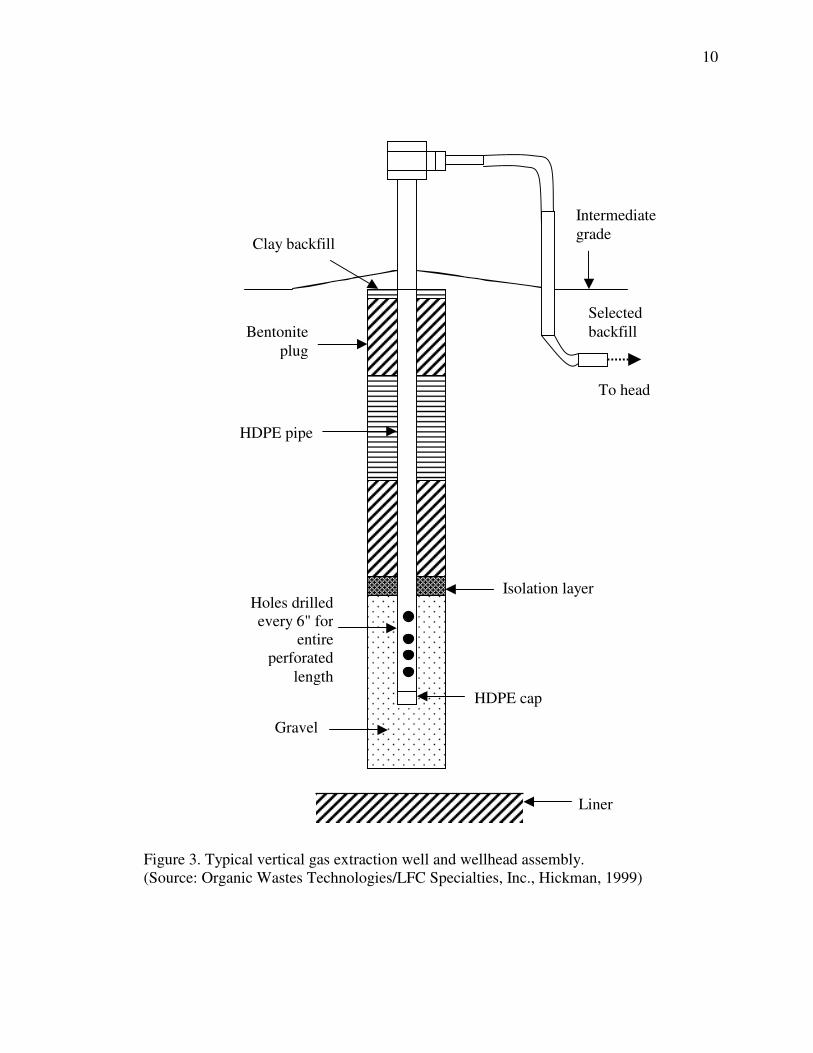
those producing little gas. In the active systems (Fig. 3), such as those at most large
landfills, a vacuum is applied to control the flow of the gas. The active systems typically
include a collection system and a processing system. The collection system provides a
means to collect the gas and transport it to the processing station. Processing stations,
broadly defined, are facilities which contain the equipment and technologies to manage
and dispose of the gas after it is collected (Hickman, 1999).
Recovered landfill gases are either flared, used for the recovery of energy, or
both. Flaring, or thermal destruction, is a common method of treatment for landfill gases.
In flaring, landfill gases are combusted in the presence of oxygen to create carbon
dioxide, sulfur dioxide, oxides of nitrogen, and other related gases. Modern flaring
facilities are designed to meet rigorous operation specifications to ensure effective
destruction of volatile organic compounds (VOCs) and other similar compounds that may
be present in the landfill gas (Tchobanoglous, 1993). On the other hand, because landfill
gas has a heating value in the range of 400 to 550 BTU/scf (14,904 – 20,492 kj/m3,
USEPA, 1995; Kortegast and Ampurch, 1997; Tchobanoglous, et al., 1993; and WSDE,
1987), it provides a potentially recoverable energy source (landfill gas-to-energy). In the
United States, landfill gas was used as a commercial energy source for the first time in
8
1975. To encourage and facilitate the development of environmentally and economically
sound landfill gas projects, the USEPA created the Landfill Methane Outreach Program
(LMOP) in 1999. LMOP is a part of the United States’ commitment to reduce greenhouse
gas emissions under the United Nations Framework Convention on Climate Change.
LMOP is a voluntary assistance and partnership program, which promotes landfill gas as
an important local energy resource. As a result, LMOP has more than 320 partners that
have signed voluntary agreements to work with EPA to develop cost-effective LFG
projects as of November 2002. LMOP estimates that more than 340 operational Landfill
Gas-to-Energy projects have been initiated in the United States. In addition, about 200
projects are currently under construction or under consideration. The LMOP also
estimates that the environmental benefits for these projects are equivalent to removing the
emissions of 12.7 million cars per year or powering 630,000 homes and heating 1.3
million homes per year (Bolton, 2003; USEPA, 2003).
9
Figure 2. Typical gas vents used in the surface a landfill for the passive control of landfill gas. (Organic Waste Technologies/LFG Specialties, Inc., Hickman, 1999)
Solid wastes
4 to 6" PVC pipe
Holes for gas entry
Gravel
Compacted soil
Sand layer
Seal
10
Liner
Figure 3. Typical vertical gas extraction well and wellhead assembly. (Source: Organic Wastes Technologies/LFC Specialties, Inc., Hickman, 1999)
Clay backfill
Intermediate grade
Selected backfill
Gravel
HDPE cap
HDPE pipe
Bentonite plug
Holes drilled every 6" for
entire perforated
length
Isolation layer
To head
11
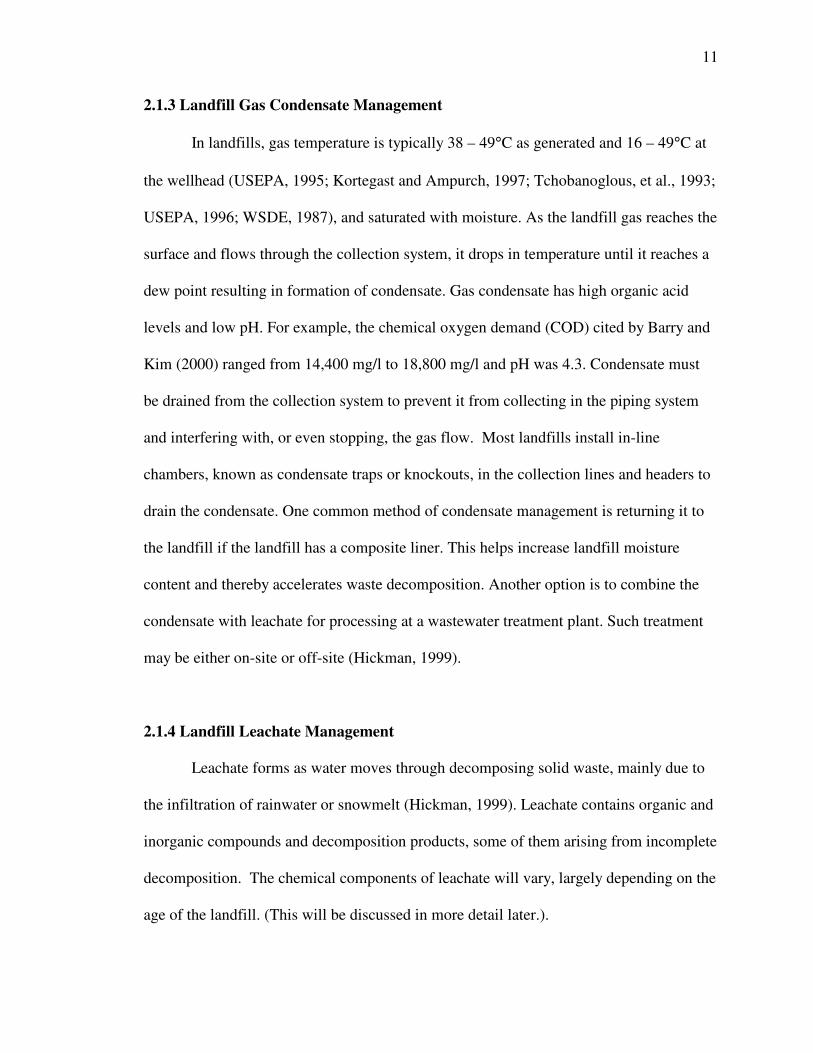
2.1.3 Landfill Gas Condensate Management
In landfills, gas temperature is typically 38 – 49°C as generated and 16 – 49°C at
the wellhead (USEPA, 1995; Kortegast and Ampurch, 1997; Tchobanoglous, et al., 1993;
USEPA, 1996; WSDE, 1987), and saturated with moisture. As the landfill gas reaches the
surface and flows through the collection system, it drops in temperature until it reaches a
dew point resulting in formation of condensate. Gas condensate has high organic acid
levels and low pH. For example, the chemical oxygen demand (COD) cited by Barry and
Kim (2000) ranged from 14,400 mg/l to 18,800 mg/l and pH was 4.3. Condensate must
be drained from the collection system to prevent it from collecting in the piping system
and interfering with, or even stopping, the gas flow. Most landfills install in-line
chambers, known as condensate traps or knockouts, in the collection lines and headers to
drain the condensate. One common method of condensate management is returning it to
the landfill if the landfill has a composite liner. This helps increase landfill moisture
content and thereby accelerates waste decomposition. Another option is to combine the
condensate with leachate for processing at a wastewater treatment plant. Such treatment
may be either on-site or off-site (Hickman, 1999).
2.1.4 Landfill Leachate Management
Leachate forms as water moves through decomposing solid waste, mainly due to
the infiltration of rainwater or snowmelt (Hickman, 1999). Leachate contains organic and
inorganic compounds and decomposition products, some of them arising from incomplete
decomposition. The chemical components of leachate will vary, largely depending on the
age of the landfill. (This will be discussed in more detail later.).
12
If leachate migrates away from a landfill, surface and groundwater contamination
may result. Consequently, control of leachate is needed to eliminate this possibility.
Landfill liners are now commonly used to prevent the movement of leachate and landfill
gases from landfill sites (Tchobanoglous, et al., 1993). Further, the USEPA has
established criteria that require the installation of a single composite liner, having both a
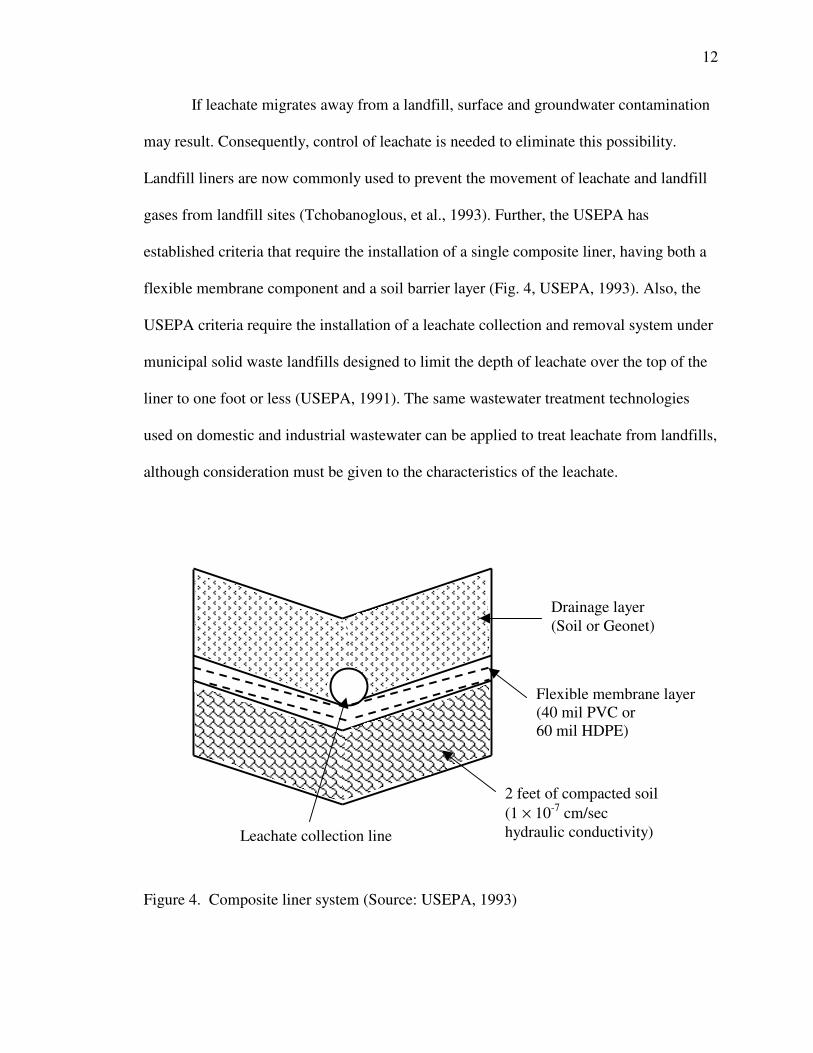
flexible membrane component and a soil barrier layer (Fig. 4, USEPA, 1993). Also, the
USEPA criteria require the installation of a leachate collection and removal system under
municipal solid waste landfills designed to limit the depth of leachate over the top of the
liner to one foot or less (USEPA, 1991). The same wastewater treatment technologies
used on domestic and industrial wastewater can be applied to treat leachate from landfills,
although consideration must be given to the characteristics of the leachate.
Figure 4. Composite liner system (Source: USEPA, 1993)
Drainage layer (Soil or Geonet)
Flexible membrane layer (40 mil PVC or 60 mil HDPE)
Leachate collection line
2 feet of compacted soil (1 × 10⁻⁷ cm/sec hydraulic conductivity)
13
Besides the above technical considerations, political issues play a large role in
solid waste management. For example, the Fresh Kills Landfill in Staten Island, NY, one
of the longest operating in the US and maybe the largest in the world, was closed in
January 2002 amid great controversy. Since the closing of Fresh Kills, all wastes from
New York City are exported to out-of-state landfills at a cost of more than $313 million a
year. Disposal costs for solid waste have grown from $44 per ton in 1997 to over $88 per
ton in 2001. To overcome this challenge, the city plans to utilize and upgrade the city’s
existing marine transfer station system. The waste will be containerized and compacted at
the transfer stations. Then the sealed containers can be barged to container ships, rail
facilities or trucks. The city expects that this plan will increase the flexibility and options
for disposal dramatically. In addition, the city has created a task force to re-evaluate its
recycling program and to ensure appropriate long-term strategies, which is to be fully
integrated into the solid waste management plan (The City of New York, Office of the
Mayor, Press Release, 2002).
Another political issue across the United States has been the conflict between
local governments and Federal government, and in particular the dispute over “Flow
Control Regulations”. In this case, local governments prevented out-of-state solid waste
processors from having access to the local solid waste market, as a way to assure that the
local government would have revenue to fund its solid waste management program. By
forcing waste haulers to use local facilities, revenue for operating the local facilities could
be assured. This guarantee of future revenue streams was then used to secure bond
funding to develop transfer stations, landfills, incinerators and other needed
infrastructure. However, the US Supreme Court overturned these regulations, because the
14
flow control ordinances were found to violate the Interstate Commerce Clause of the
United States Constitution. These decisions included the cases of C&A Carbone, Inc. v.
Town of Clarkstown, New York [11 US 383 (1994)] and Atlantic Coast Demolition &
Recycling, Inc. v. Board of Chosen Freeholders of Atlantic County, New Jersey [48 F. 3rd
701 (1995)]. As a consequence of these decisions, local and regional solid waste
management plans were left without funding. The stranded debt was estimated at $ 1.5
million in the town of Clarkstown, New York, and $ 1.65 billion in the State of New
Jersey. In New Jersey, the state government has been forced to intervene to prevent wide-
reaching financial default at the local level.
Also, the import and export of wastes to other states is another political issue.
Pennsylvania is the largest importer of solid wastes in the United States and the governor
suspended the development of new solid waste disposal capacity within the State.
Overall, it can be seen that both technical and political aspects are a concern in solid
waste management. Increased demand for landfill capacity fuels political debate. By
accelerating waste decomposition rates, more wastes can be placed into existing facilities.
This will help to relieve political stress. One outcome of the research presented here will
be a better understanding of waste decomposition, which will in turn help to reduce
demand for new landfill capacity and ease political tensions.
2.2 Biological and Chemical Changes in the Landfill 2.2.1 The Process of Decomposition Municipal solid waste (MSW) is typically classified according to material content,
such as paper, plastics, glass, etc. However, the overall organic component of MSW is a
more useful measure for biodegradation studies (Barlaz, 1997). The organic composition
15
of MSW contains 40 to 50% cellulose, 10 to 15% lignin, 12% hemicellulose, and 4%
protein (Booker and Ham, 1982). Cellulose and hemicellulose are readily biodegradable,
while lignin is recalcitrant under anaerobic conditions (Young and Frazer, 1987).
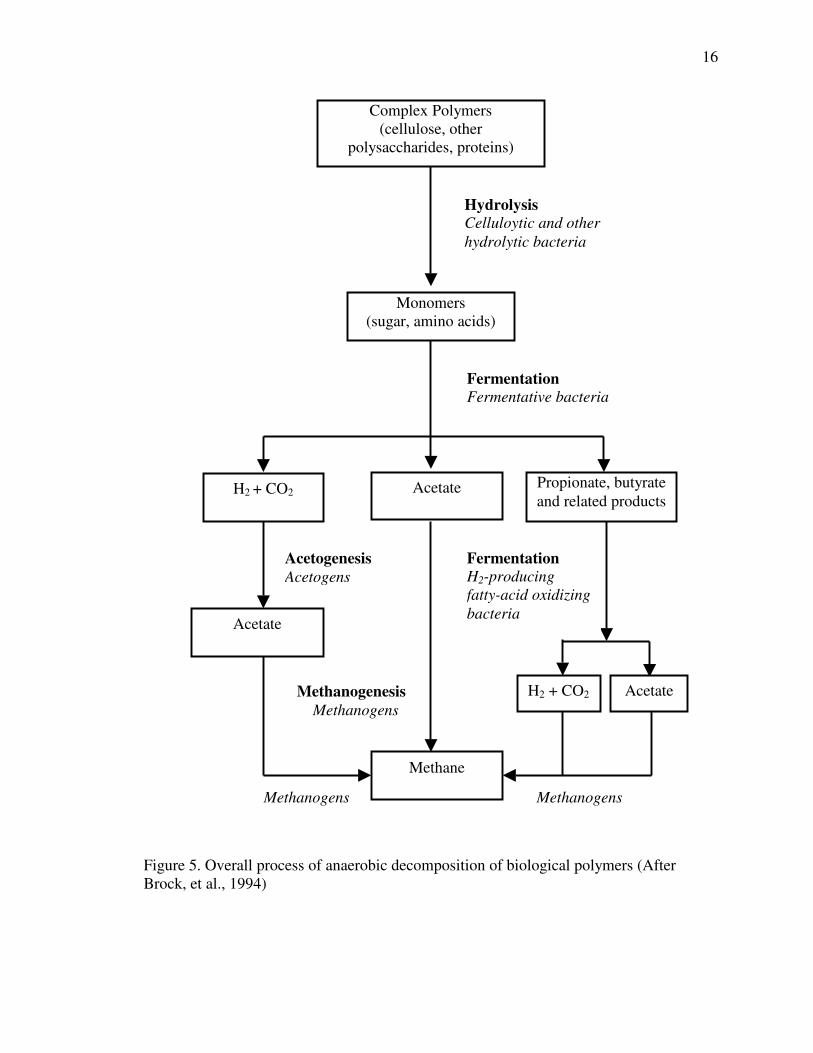
In the decomposition of the organic fraction of municipal solid waste, several trophic
groups of microorganisms work together to create a stable end product, methane (Fig. 5,
Brock, et al., 1994). Overall, a variety of different processes occur, with reactions taking
place both in series and in parallel.
The first class of reactions involves the hydrolysis of large-molecular-mass
compounds (carbohydrates, proteins, and fats) into soluble sugars, amino acids, long-
chain carboxylic acids, and glycerol. Polymers are not readily transported across
microbial cell membranes; thus, biological hydrolysis of polymers in waste is mediated
by extracellular enzymes produced by microorganisms present in landfills (Palmisano, et
al., 1993). Fermentative microorganisms then break down these hydrolysis products into
short-chain carboxylic acids, ammonia, carbon dioxide, hydrogen, and acetic acid.
In the next step, obligate proton-reducing acetogens oxidize fermentation products,
propionate and butyrate to acetate, carbon dioxide and hydrogen. This process is
thermodynamically favorable only at very low hydrogen concentrations (10-5 to 10-4 atm;
Zehnder, 1978). Therefore, the obligate proton-reducing acetogens work only in
syntrophic association with hydrogen scavengers such as methanogens or sulfate
reducers. Another reaction carried out by acetogens is the production of acetate from
carbon dioxide and hydrogen. This process, however, has not yet been observed in the
landfill environment (Barlaz, 1997).
16
Figure 5. Overall process of anaerobic decomposition of biological polymers (After Brock, et al., 1994)
Complex Polymers (cellulose, other
polysaccharides, proteins)
Monomers (sugar, amino acids)
Propionate, butyrate and related products
Fermentation Fermentative bacteria �
Hydrolysis Celluloytic and other hydrolytic bacteria
Acetate
Acetate
Methane
Methanogens
Acetogenesis Acetogens
Fermentation H2-producing fatty-acid oxidizing bacteria
Acetate H2 + CO2
H2 + CO2
Methanogens
Methanogenesis Methanogens
17
The final step in the decomposition process involves the conversion of complex
polymers into simpler end products, principally methane and carbon dioxide. The
organisms responsible for producing methane are referred to as methanogens. These are a
very diverse group of the Archaea (Woese, et al., 1990), and are oxygen-sensitive,
fastidious anaerobes. Despite the enormous phylogenetic diversity, as a group
methanogens can only use a small number of simple compounds, most of which contain
one carbon (Zinder, 1993). Most methanogens can grow on molecular hydrogen and CO2
as sole energy sources (Balch, et al., 1979; Jones, et al., 1987), except for a few obligate
methylotrophic and acetotrophic species (Müller, et al., 1993). However, most of the
methane produced in nature originates from acetate. Acetotrophs grow more slowly than
CO2-reducers, therefore, methane from acetate is not likely to predominate where the
residence time for organic matter is short (Ferry, 1993). Other substrates include formate,
methanol, methylated amines, and methylated sulfides (Barlaz, 1997). Because many
methanogens use only one or two substrates, methanogens are dependent on other
organisms for their substrates. Therefore, a food web of interacting groups of anaerobes
is required to convert most organic matter to methane as described earlier, in contrast to
aerobic ecosystems, where single organisms can usually effect the complete oxidation of
complex organic molecules to carbon dioxide (Zinder, 1993). As a consequence, the
relative amounts of methane produced in anaerobic systems can vary depending on the
presence of other metabolic groups of anaerobes and the environment (Ferry, 1993).
18
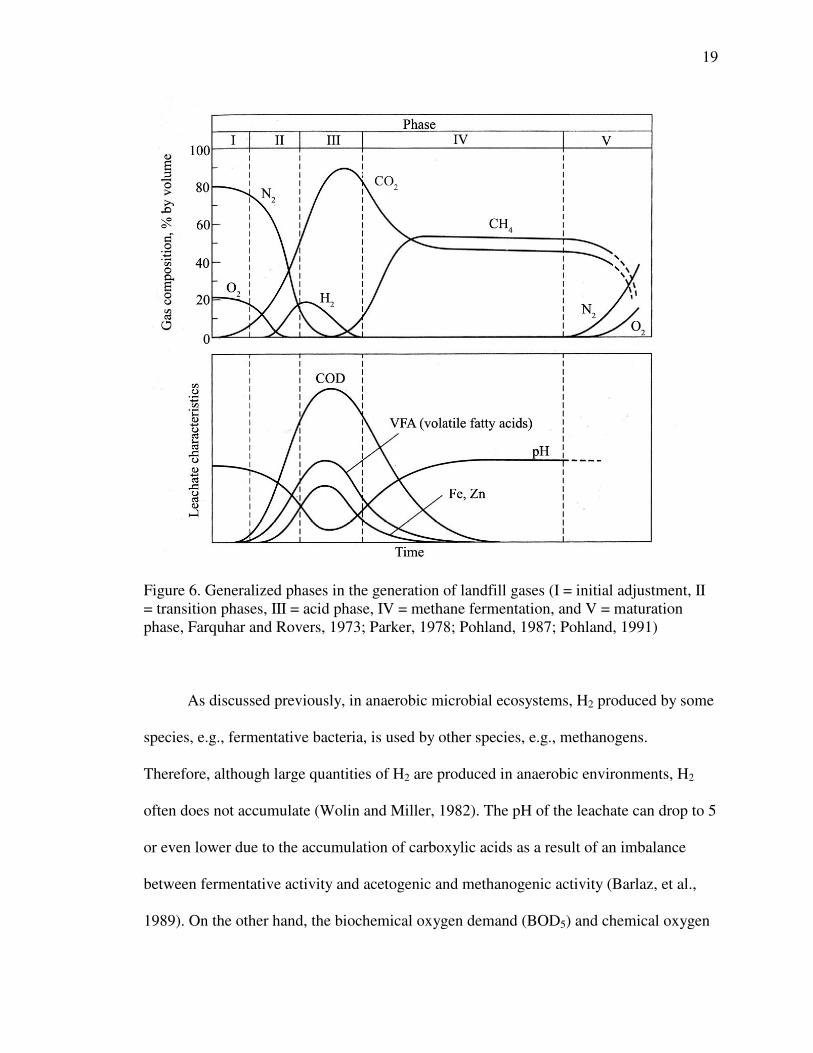
2.2.2 Microbial Succession
In the landfill, there is a process of microbial succession that takes place during the
first several years after placement of waste. The biological and chemical reactions in the
landfill are considered to establish themselves during five more or less sequential phases,
as illustrated in figure 6 (Farquhar and Rovers, 1973; Parker, 1978; Pohland, 1987;
Pohland, 1991). Phase I is the initial adjustment phase, where biological activity occurs
under aerobic conditions soon after waste is placed in the landfill. All of the microbial
groups that will subsequently play a role in waste decomposition are generally considered
to be present from the outset. The principal source of microorganisms is the soil
material, which is used as daily and final cover. Digested wastewater treatment plant
sludge, which is disposed of in many MSW landfills, and recycled leachate are other
sources of organisms (Tchobanoglous, et al., 1993).
In phase II, called the transition phase, the oxygen is consumed and anaerobic
conditions are established. As the landfill becomes anaerobic, nitrate and sulfate, which
can serve as electron acceptors in biological reactions, are frequently reduced to nitrogen
and hydrogen sulfide gases. In this phase, the pH of the leachate begins to decrease
because of the accumulation of organic acids and CO2 within the landfill as hydrolysis
and fermentation proceed.
In phase III, the acid phase, the microbial activity initiated in phase II accelerates
with increasing production of organic acids. The major gas produced in this phase is CO2,
while smaller amounts of H2 will also be released.
19
Figure 6. Generalized phases in the generation of landfill gases (I = initial adjustment, II = transition phases, III = acid phase, IV = methane fermentation, and V = maturation phase, Farquhar and Rovers, 1973; Parker, 1978; Pohland, 1987; Pohland, 1991)
As discussed previously, in anaerobic microbial ecosystems, H2 produced by some
species, e.g., fermentative bacteria, is used by other species, e.g., methanogens.
Therefore, although large quantities of H2 are produced in anaerobic environments, H2
often does not accumulate (Wolin and Miller, 1982). The pH of the leachate can drop to 5
or even lower due to the accumulation of carboxylic acids as a result of an imbalance
between fermentative activity and acetogenic and methanogenic activity (Barlaz, et al.,
1989). On the other hand, the biochemical oxygen demand (BOD5) and chemical oxygen
20
demand (COD) of the leachate will increase significantly because of the high organic
acid concentrations. Heavy metals can also increase in the leachate while pH is low as
well.
In Phase IV, the methane fermentation phase, the activity of methanogens
becomes predominant and methane production increases. Within the landfill, many
previous trends reverse. Leachate pH will increase, achieving a neutral range from 6.8 to
8, because organic acids are transformed to methane and CO2. Leachate concentrations of
BOD5 and COD, and conductivity measurements, will likewise decrease. Increased pH
contributes to lower heavy metal concentrations in the leachate because of lower
solubility. The system should be largely at steady state, with relatively stable gas and
leachate compositions. Presumably the microbial populations will remain largely stable
as well.
Over time, however, the rate of decomposition should slow down as readily-
degradable substrates are consumed. Eventually, this brings the beginning of phase V
(the maturation phase). The gas production rate will significantly decrease in this phase.
The leachate will often contain humic and fulvic acids, which are resistant to further
biological degradation (Tchobanoglous, et al., 1993).
In considering this conceptual framework, it is important to recognize that landfills
are created over periods of many years. Wastes deposited at one time are later covered
with more waste, creating a layered structure that may extend over many hectares and to
depths of several tens of meters. Thus, at any given time the different vertical and spatial
zones within the landfill may be experiencing different decomposition phases. Also,
many factors associated with the heterogeneity of the waste environment, such as the
21
moisture content, waste density, and the availability of nutrients, will affect the duration
and character of each phase. Microbial communities should likewise be expected to differ
throughout the structure.
2.3 Molecular Approaches for the Study of Microbial Communities
Only a small percentage of the microorganisms in the natural environment are
cultivable (Amann, et al., 1995), and this in turn has limited the ability of researchers to
study the general composition of microbial communities. Therefore, significant bias can
enter our understanding of microbial communities in the environment when using
cultivation-dependent methods. For this reason, culture independent methods, such as
molecular techniques, are important tools for examination of microorganisms in their
environment. Such techniques are hybridization with gene probes and polymerase chain
reaction (PCR) amplification which have made possible a very specific and sensitive
evaluation of the microbial world. In the present study, slot blot hybridization and PCR
amplification were used to describe the microbial community of the landfill. The details
of each technique are described below.
2.3.1 Quantitative Slot-blot Hybridization
Gene probes are small pieces of DNA known as oligonucleotides that can bind
(hybridize) to nucleotide sequences with homologous sequences in the target
microorganisms. With the use of gene probes, specific microbial populations can be
detected in environmental samples (Atlas and Bartha, 1997). In particular, the use of
rRNA-targeted oligonucleotide probes for hybridization has become a powerful tool for
22
describing the structure of microbial communities in many environments (Amann, et al.,
1995; Stahl, 1995). 16S rRNA-targeted specific oligonucleotide probes are the most
commonly used because rRNA is among the most conserved macromolecules in all living
systems (Atlas and Bartha, 1997). 16S rRNA contains large enough molecules (1500
nucleotides) to compare sequences, but small enough to handle for analysis. The “S”
stands for “Svedberg unit”, a measurement of the rate at which proteins settle during
centrifugation.
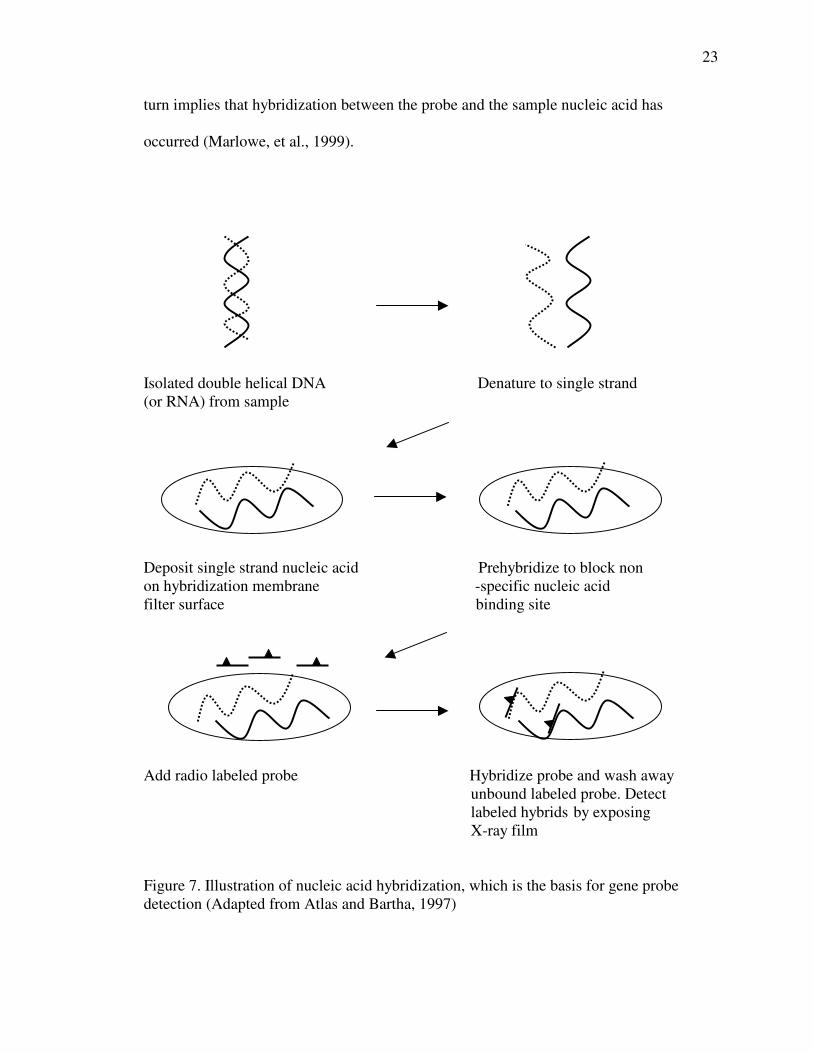
The basic protocols of hybridization were outlined by Atlas and Bartha (1998) and
are summarized here in figure 7. First, single-stranded (denatured) target nucleic acids are
attached to a membrane filter surface. Second, the filters are prehybridized to block
nonspecific nucleic acid binding sites. Third, labeled probe is added to the membrane
filters and the probe is allowed to hybridize. Probe is often labeled with radioactive
chemical. Because of their high specific activity, 32P-labeled nucleotides are routinely
used to label nucleic acids in cell-free system (Lodish, et al., 1995). In addition, several
nonradioactive alternatives are available. Such alternatives include probes labeled with
digoxigenin (DIG), biotin, or fluorescein, which can be incorporated into the sequence by
chemical synthesis (Marlowe, et al., 1999). After hybridization, excess unbound labeled
probe is washed off and the hybrid (target-probe) sequences are detected by exposure X-
ray film, a process called autoradiography. During autoradiography a photon of light,
beta particle, or gamma ray emitted by the filter activates silver bromide crystals on the
film. When the film is developed, the silver bromide is reduced to silver metal and forms
a visible grain or black spot on the film. This positive image indicates that the
radioactively-labeled probe annealed to the target nucleic acid on the filter, and this in
23
turn implies that hybridization between the probe and the sample nucleic acid has
occurred (Marlowe, et al., 1999).
Isolated double helical DNA Denature to single strand (or RNA) from sample
Deposit single strand nucleic acid Prehybridize to block non on hybridization membrane -specific nucleic acid filter surface binding site
Add radio labeled probe Hybridize probe and wash away unbound labeled probe. Detect labeled hybrids by exposing X-ray film
Figure 7. Illustration of nucleic acid hybridization, which is the basis for gene probe detection (Adapted from Atlas and Bartha, 1997)
24
Nucleic acids can simply be placed directly on the membrane surface, although
filtration manifolds have been designed to spot the samples in an evenly spaced manner
with a large number of samples. This makes it is easy to scan film for quantification.
Typically, deposits are made as thin lines or circles, referred to as “slot blots and “dot
blots”, respectively. Many types of manifold are commercially available, e.g., Minifold II
by Schleicher and Schuell, and Bio-dot SF by Bio-Rad.
Using slot-blot hybridization, a certain 16S rRNA associated with a particular
class of organism can be roughly quantified in comparison with the total amount of 16S
rRNA in a sample. In a common approach, rRNAs from pure cultures at different
concentrations are applied to the membranes, hybridized, and the signal intensity is
measured. The least-squares method is then applied to construct reference RNA standard
curves with RNA concentrations vs. signal intensity. The approximate amounts of each
specific group of organism in the sample can now be calculated from these standard
curves. Each amount is expressed as a percentage of the total amount of 16S rRNA that
hybridizes to a universal probe, i.e. one that is complementary to a region of virtually all
16S-like rRNAs so far characterized (Pace, et al., 1986). Also, universal probes serve to
normalize results obtained with probes targeting specific phylogenetic groups of
microorganisms (Zheng, et al., 1996).
There are several advantages of using rRNA as a target to detect microorganisms.
First, in active cells, rRNA molecules have a relatively high copy number per cell (103 –
105), and so the rRNA can often be detected without amplification (Amann, et al., 1995).
Second, huge sequence databases are currently available (Benson, et al., 1993; Rice, et
al., 1993; Maidak, et al., 1994). With this sequence information, it possible to design
25
probes for species-specific or more general identification (at genus or family level).
Furthermore, probes can be designed for non-culturable bacteria (Amann, et al., 1995).
Another advantage is that it becomes possible to monitor microbial activity change by
16S rRNA hybridization techniques. For examples, it has been demonstrated that a
correlation exists between RNA content and the growth rate of E. coli (Gausing, 1977),
Salmonella typhimurium (Kjelgaard and Kurland, 1963), Pseudomonas stutzeri (Kerkhof
and Ward, 1993), several marine isolates (Kemp, et al., 1993) and the sulfate reducing
strain PT2 (Poulsen, et al., 1993). This correlation between RNA content and cell activity
suggests that microbial activity can be monitored using hybridization with 16S rRNA
targeted probes, rather than cell numbers.
However, there are several limitations to the use of rRNA targeted probe
hybridization for quantification. First, the recovery of nucleic acids from the environment
is complicated due to the variety of different environments and organism types (Stahl,
1995). This can be a general problem with application of molecular techniques to
environmental samples. For example, the recovery of nucleic acids might be reduced by
degradation or adsorption to matrix material, such as clays. Also, the recovered nucleic
acids from an environmental sample could come from detritus or other sources, such as
humic acids, instead of intact bacteria. Therefore, it is often necessary to use extensive
purification steps for nucleic acid analyses for environmental samples. Even selection of
purification steps is often difficult due to the diversity of contaminants. Another
consideration is the degree to which recovered rRNA is representative of the total rRNA
pool. Microorganisms have different cell wall structures, and therefore a cell that has an
easy-to-break wall would be overestimated, while a cell that resists breakage would be
26
underestimated. Environmental samples are even more complicated. The mechanisms of
nucleic acid recovery from environmental samples are often poorly understood, so it is
difficult to predict whether all organisms are lysed with equal efficiency or what fraction
of the total nucleic acid is recovered. For example, Leff, et al. (1995) compared three
different published DNA extraction methods and then used them on stream sediments in
Aiken, SC. DNA yield varied with the different extraction methods, and one method was
recommended by the authors for PCR amplification while another was preferred for
Southern blots. Likewise, Niemi, et al. (2001) found that different lysis and purification
methods affect PCR-DGGE analysis results when applied to soil microbial communities.
Therefore, selection of appropriate lysis and purification methods must be based on
experimental goals, and direct comparison of results from different methods may not be
possible.
Another potential problem is the unclear relationship between the amount of
rRNA and the actual numbers of cells present, since the content of rRNA per cell differs
between species and with growth rate (Devereux, et al., 1996; Kemp, et al., 1993).
Relative rRNA abundance cannot directly predict cell number. Therefore, it is possible
that actual cell numbers of certain organisms are overestimated, while others are
underestimated. To estimate biomass, an independent method would be required. On the
other hand, the relative rRNA abundance should provide a reasonable measurement of
the relative physiological activity of a respective population because it is the product of
the number of detected cells and the average rRNA content (Wagner and Amann, 1997).
Another drawback is that the available database of sequences is still limited.
Probes designed based on available databases (known sequences), and their specificity

27
can only be evaluated against culturable reference organisms (Devereux, et al., 1992;
Manz, et al., 1992). Therefore, with existing probes, the diversity of populations from any
given environment would be underestimated. In addition, previously unknown
populations may not be detected (see, for example, Daims, et al., 1999). In the case of
unstudied environments, such as landfills, this limitation may be even more severe.
However, this limitation can be addressed with greater adequacy as existing sequence
databases grow more comprehensive, since this will provide refined information on the
true specificity of old probes and allow better design of new probes (Wagner and Amann,
1997).
2.3.2 Polymerase Chain Reaction (PCR)
Polymerase chain reaction (PCR), introduced by Saiki and colleagues in 1985, is
an enzymatic reaction that allows amplification of specific DNA regions through a
repetitive process. This process involves template denaturation, primer annealing, and the
extension of the annealed primers by DNA polymerase resulting in a duplication of the
starting target material. This process is repeated many times (usually 20 –30 cycles)
resulting in an exponential increase in the amount of target DNA. The amplification
product is visualized by agarose gel electrophoresis.
Although the PCR technique was originally used for genetic and clinical
purposes, this technique has been used to detect and monitor microorganisms in complex
environmental samples for a number of years (Bej, et al., 1991b; Steffan and Atlas,
1991). By exponentially amplifying a target sequence, PCR significantly increases the
probability of detecting rare sequences in mixtures of DNA. Numerous studies have
28
reported the detection of specific microorganisms in water, soils and sediments by PCR
amplification without the need for cell cultivation (Bej, et al., 1991a, 1991c; Pillai, et al.,
1991; Tsai and Olson, 1992a). Brauns, et al. (1991) detected a viable but nonculturable
organism, Vibrio vulnificus, from a microcosm.
The advantages of PCR include speed, simplicity, and an inherent sensitivity to
small amounts of DNA (Mullis and Faloona, 1987). However, there are some limitations
to the PCR method. Specifically, the size of the region that can be amplified is limited
and it is required that sequence information be known about the target. As a result, this
means PCR amplification is most useful for DNA, for which there is already partial
knowledge. Also, contamination results in false positives, therefore it is important to run
controls (without DNA template) along with samples. It is often much more difficult to
apply the PCR technique to environmental samples for these same reasons. Therefore, the
following limitations should be addressed. First, the amount of samples that can be
processed is limited because the PCR template is limited to only a few microliters.
However, this limitation can be overcome to some extent by innovative sample
processing. Second, the presence of PCR-inhibitory substances hinders the amplification
process, and therefore extensive purification steps are often required from environmental
samples. Also, samples must be subjected to PCR amplification by use of appropriately
designed primers. Even with these disadvantages, the PCR technique has allowed
environmental microbiologists to study important questions that were previously
impossible to address with culture-dependent methods.
In addition, DNA fingerprint methods are commonly used for community
structure study, such as denaturing gradient gel electrophoresis, DGGE (Gurtner et al.,
29
2000; Kozdrój and Elsas, 2001; Yang, et al., 2001) and restriction fragment length
polymorphism, RFLP (Sandaa, et al., 2001; Dunbar, et al., 1999; Sessitsch, et al., 2001).
Mostly, these methods are used in conjunction with PCR resulting in production of
certain banding patterns. In the DGGE method, the universal primers derived from
conserved 16S rDNA sequences are used to generate PCR amplification products of
nearly identical lengths, but with variable sequence composition. Then these PCR
amplification products are separated based on changes in the electrophoretic mobility of
different DNA fragments migrating in a gel containing a linearly increasing gradient of
DNA denaturants (urea/formaldehyde or temperature). Changes in fragment mobility are
results from partial melting of double-stranded DNA in discrete regions, the so-called
melting domain. Sequence variation within such domains changes their melting
behaviors, and different PCR amplification products stop migrating at different positions
in the denaturing gradient (Lerman, et al., 1984). DGGE analysis of PCR-amplified 16S
rDNA fragments provides a rapid method to characterize community population
structure. However, this method doesn’t provide direct information on identity of specific
microbial populations. More specific information of population composition can be
obtained by secondary analysis of the DGGE banding pattern via sequencing or
hybridization (Stahl, 1997).
In RFLP analysis, the amplified DNA using universal primers contains unique
sequences that can be cut into smaller fragments by restriction enzymes and the
fragments of DNA are usually separated by gel electrophoresis. The pattern of these
fragments produces a fingerprint of the bacterial communities. RFLP analysis is most
often used to identify specific bacterial isolates because the banding patterns produced by
30
RFLP couples with gene probe analysis are unambiguous. In contrast, PCR-generated
fingerprints can be difficult to reproduce and may contain “faint” or “ghost” bands,
making interpretation difficult (Burr and Pepper, 1997). However, the choice of
restriction enzymes used is usually empirical, and normally multiple enzymes must be
used (Marlowe, et al., 1999).
Even with limitations such as those described previously, molecular techniques
provide powerful tools over conventional culture dependent methods. Each method has
advantages and disadvantages, and therefore methods should be chosen dependent on
research interests. Combination of more than one method, even with culture dependent
methods, will often give more accurate information. In the present study, the PCR
method was used to analyze the diversity and distribution of microorganisms, and the
results from slot blot hybridization provided quantitative information about the microbial
community of the landfill.
2.4 Growth of Pure Cultures of Anaerobic Organisms
While this study sought to minimize the need to culture landfill organisms, it was
nonetheless necessary to verify the accuracy and performance of molecular techniques
with reference strains. As a result, it was necessary to apply anaerobic culture techniques
since they were used to grow the reference strains for this study. A brief review of
general methodology is presented here.
The most important requirement for growth of anaerobes is the maintenance of a
highly reduced anaerobic environment. To obtain such an anaerobic environment, the
primary tools are oxygen-free gases and materials that minimize the penetration of air
31
from outside the anaerobic container. Modern approaches to the laboratory culture of
obligately anaerobic microorganisms can be traced back to the work of Hungate (1950).
In Hungate’s methodology, medium is boiled to remove oxygen and an oxygen-free gas
mixture flows from a gassing cannula into the medium to exclude further introduction of
oxygen. However, these are not sufficient to remove all dissolved oxygen in the growth
medium. Therefore, a reducing agent is added to lower the redox potential (typically, a
mixture of cystein hydrochloride and sodium sulfide) and a redox-sensitive dye (e. g.,
resazurin) is supplied to indicate the oxidative state of the medium (Sowers and Noll,
1995).
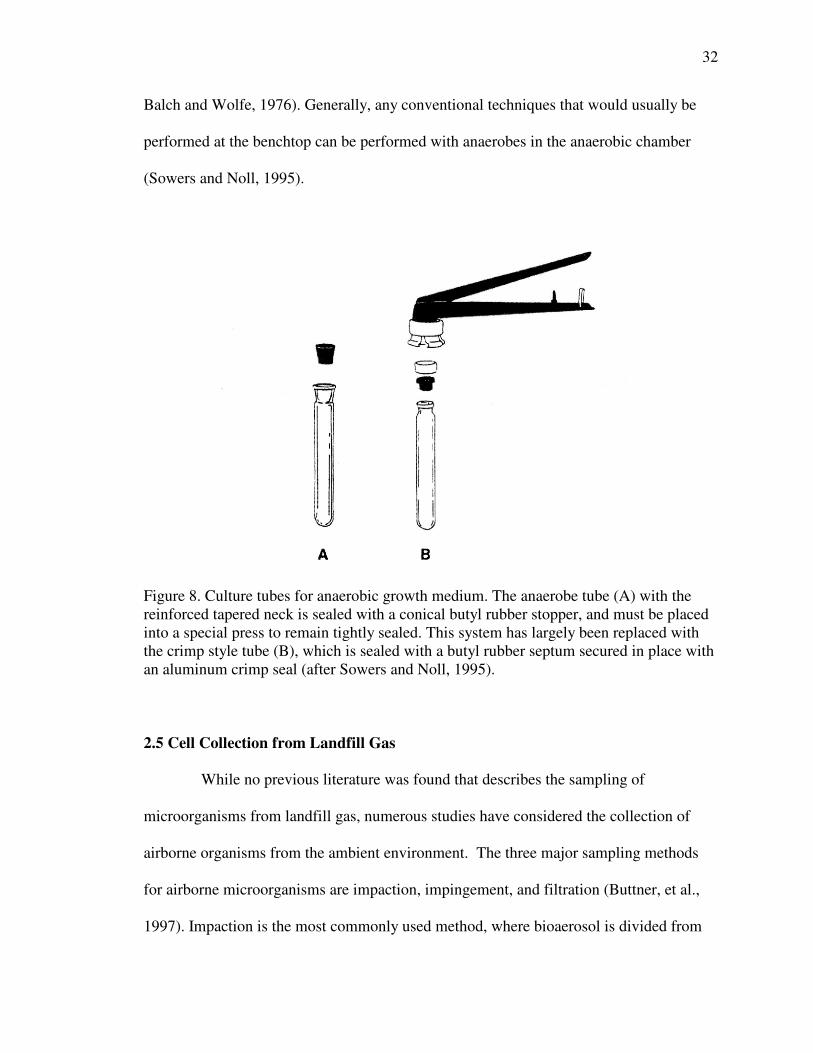
Moore (1966) improved on the original gassing cannula technique by introducing
a new anaerobic tube that had a reinforced tapered neck to minimize breaking when
sealing with a stopper (Fig. 8a). The tubes clamp with a tube press to secure the stopper
during autoclaving. Later, Miller and Wolin (1974) introduced further improvements by
developing an anaerobic tube that featured a neck like that found on serum bottles (Fig.
8b). The tube can be sealed with an exceptionally thick butyl rubber stopper, which
minimizes oxygen diffusion into the medium. The stoppers are then secured using
aluminum crimp seals, which prevent the stopper from popping out as a result of pressure
increases during methanogenesis or autoclaving. Since the thick rubber stopper can
endure multiple needle punctures, the anaerobic gas mixture can easily be exchanged in
the tube, and anaerobic cultures are simply inoculated and transferred by using a syringe
to minimize exposure to oxygen. During this same period, the Aranki-Freter anaerobic
glove box became commercially available, which provided a means of plating anaerobes
on standard petri dishes without the use of gassing cannula (Edwards and McBride, 1975;
32
Balch and Wolfe, 1976). Generally, any conventional techniques that would usually be
performed at the benchtop can be performed with anaerobes in the anaerobic chamber
(Sowers and Noll, 1995).
Figure 8. Culture tubes for anaerobic growth medium. The anaerobe tube (A) with the reinforced tapered neck is sealed with a conical butyl rubber stopper, and must be placed into a special press to remain tightly sealed. This system has largely been replaced with the crimp style tube (B), which is sealed with a butyl rubber septum secured in place with an aluminum crimp seal (after Sowers and Noll, 1995).
2.5 Cell Collection from Landfill Gas
While no previous literature was found that describes the sampling of
microorganisms from landfill gas, numerous studies have considered the collection of
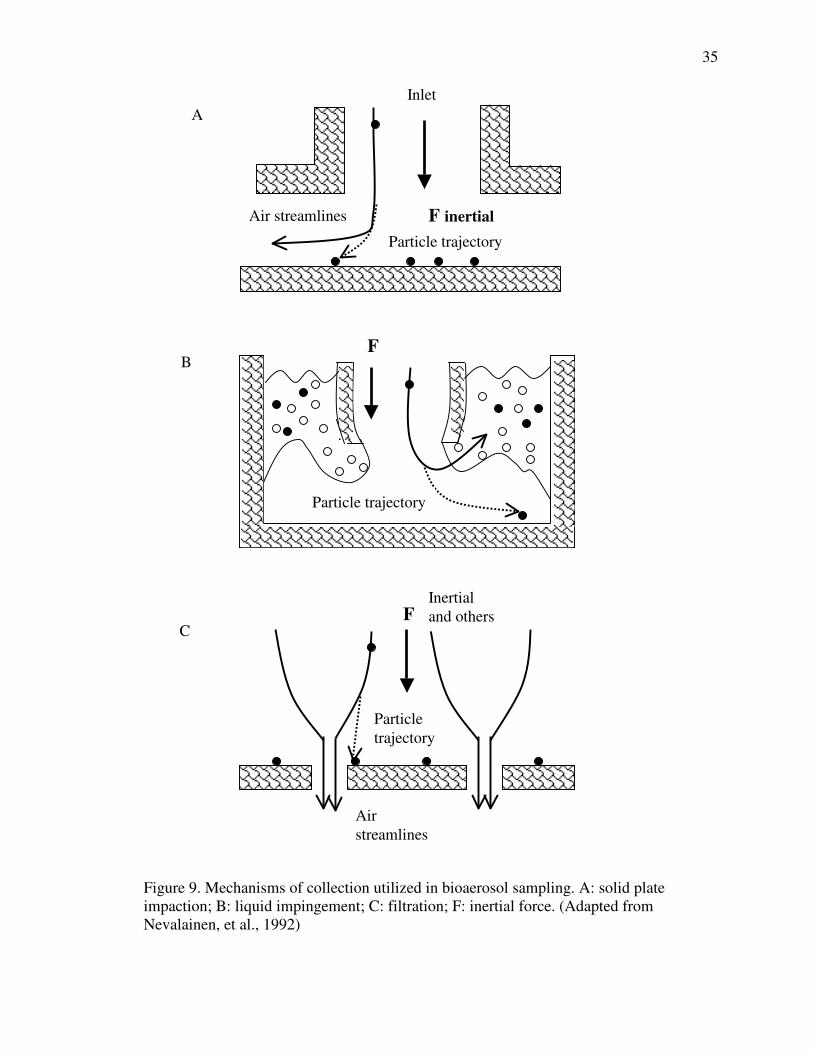
airborne organisms from the ambient environment. The three major sampling methods
for airborne microorganisms are impaction, impingement, and filtration (Buttner, et al.,
1997). Impaction is the most commonly used method, where bioaerosol is divided from
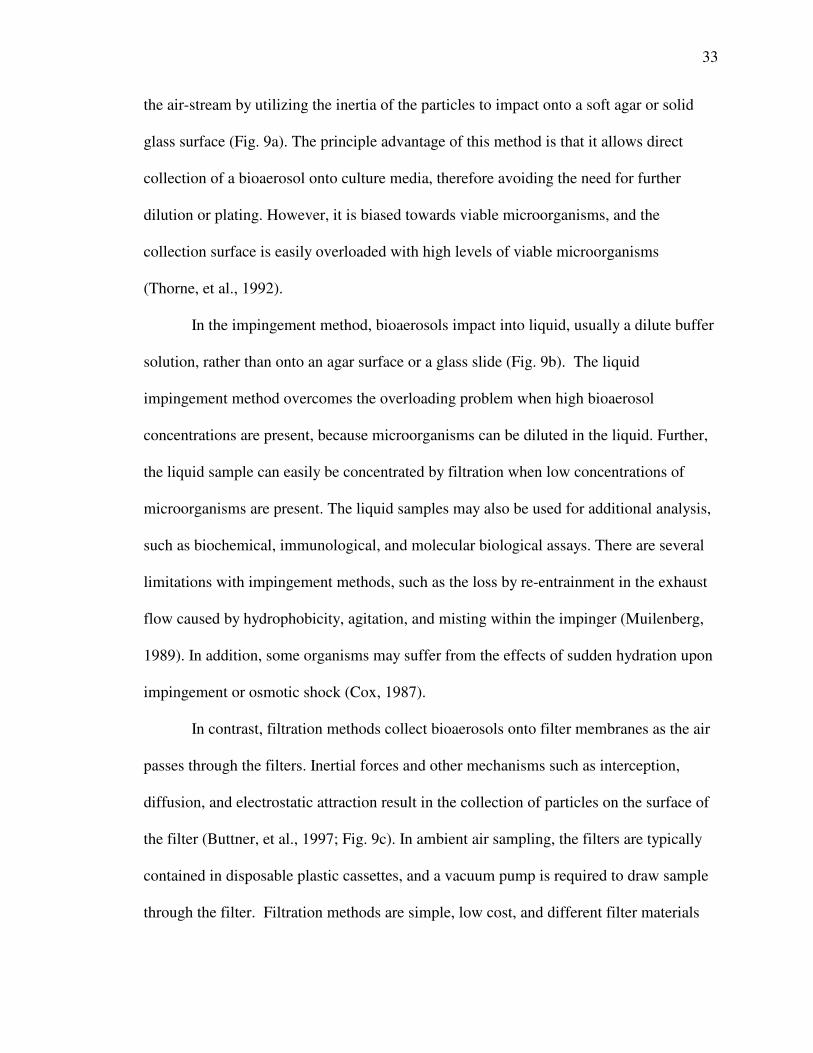
33
the air-stream by utilizing the inertia of the particles to impact onto a soft agar or solid
glass surface (Fig. 9a). The principle advantage of this method is that it allows direct
collection of a bioaerosol onto culture media, therefore avoiding the need for further
dilution or plating. However, it is biased towards viable microorganisms, and the
collection surface is easily overloaded with high levels of viable microorganisms
(Thorne, et al., 1992).
In the impingement method, bioaerosols impact into liquid, usually a dilute buffer
solution, rather than onto an agar surface or a glass slide (Fig. 9b). The liquid
impingement method overcomes the overloading problem when high bioaerosol
concentrations are present, because microorganisms can be diluted in the liquid. Further,
the liquid sample can easily be concentrated by filtration when low concentrations of
microorganisms are present. The liquid samples may also be used for additional analysis,
such as biochemical, immunological, and molecular biological assays. There are several
limitations with impingement methods, such as the loss by re-entrainment in the exhaust
flow caused by hydrophobicity, agitation, and misting within the impinger (Muilenberg,
1989). In addition, some organisms may suffer from the effects of sudden hydration upon
impingement or osmotic shock (Cox, 1987).
In contrast, filtration methods collect bioaerosols onto filter membranes as the air
passes through the filters. Inertial forces and other mechanisms such as interception,
diffusion, and electrostatic attraction result in the collection of particles on the surface of
the filter (Buttner, et al., 1997; Fig. 9c). In ambient air sampling, the filters are typically
contained in disposable plastic cassettes, and a vacuum pump is required to draw sample
through the filter. Filtration methods are simple, low cost, and different filter materials
34
are available depending on the nature of the cells and the sample analysis method.
Filtration methods can collect particles with almost 100% efficiency, down to particle
sizes of about 0.1µm (Chatigny, et al., 1989). However, some cells can be dehydrated
during sampling, resulting in loss of viability, damaging their biological activity and
making detection difficult (DeCosemo, et al., 1992; Nevalainen, et al., 1993). Another
potential limitation is the poor cell recovery from the filter surface. Despite these
limitations, filtration methods continue to be used because of their simplicity and their
ability to provide information on both viable and nonviable organisms (Palmgren, et al.,
1986).
There is no single sampling method suitable for all types of bioaerosols, nor are
standardized methods currently available for many situations. Therefore, it is often
difficult to make comparisons between different sampling methods. In addition, ambient
techniques cannot be directly applied to landfill gas sampling because of the high
(condensing) moisture concentrations, and the enclosed nature of landfill gas collection
systems. However, a study by Barry and Kim (2000) found that microorganisms from
landfill gas and gas condensate could be collected by using a filtration method. This
study is summarized in appendix A. In addition, numerous recent studies (Bartlett, et al.,
1997; Olsson, et al., 1998; Stärk, et al., 1998; Maher, et al., 2001) reported the application
of molecular techniques to the analysis of airborne microorganisms which were collected
through filtration methods. Nucleic acids were directly extracted from filters for
molecular analysis to avoid culturing. Consequently, for the present study, a filtration
method was chosen to collect cells from landfill gas, and nucleic acids were then directly
extracted from the filters prior to application of molecular techniques.
35
A
C
Figure 9. Mechanisms of collection utilized in bioaerosol sampling. A: solid plate impaction; B: liquid impingement; C: filtration; F: inertial force. (Adapted from Nevalainen, et al., 1992)
F inertial
F
F
Air streamlines�
Particle trajectory
Inertial and others
Particle trajectory
Particle trajectory
B
Inlet
Air streamlines
36
3. Materials and Methods
3.1 Sampling Site and Collection Methods
Samples for this study were collected from Burlington County Resource Recovery
Complex, Burlington County, NJ. It is an operating municipal sanitary landfill approved
by the New Jersey Department of Environmental Protection (DEP). Currently, fourteen
commercial sanitary landfills are operating in New Jersey (Fig. 10). Burlington County
landfill is located on the west side of the State near the town of Columbus. According to
state records, the types of wastes permitted in Burlington County landfill are municipal
waste (household, commercial and institutional), bulky wastes, construction and
demolition debris, vegetative waste, animal and food processing waste, dry industrial
waste, and waste material consisting of incinerator ash or ash containing waste.
3.1.1 Collection of Waste Samples
Landfill wastes were excavated to install gas wells as a part of ongoing
environmental activities at the site. A 36-inch (91.4 cm) diameter bucket auger was used
to drill the well holes. For this study, wastes were collected from four well sites between
August 21 and August 28, 2000. Two wells were chosen in the older part of the landfill,
where waste age was approximately 10 years (Wells No. 45 and 8A). Two other wells
(Wells No. 41 and 38) were sampled where waste age was approximately 2 – 3 years.
The depths of Wells No. 41 and 38 were both 90ft (27.4 m). Wells 45 and 8A had 60ft
(18. 3 m) and 46ft (14.0 m) depths, respectively.
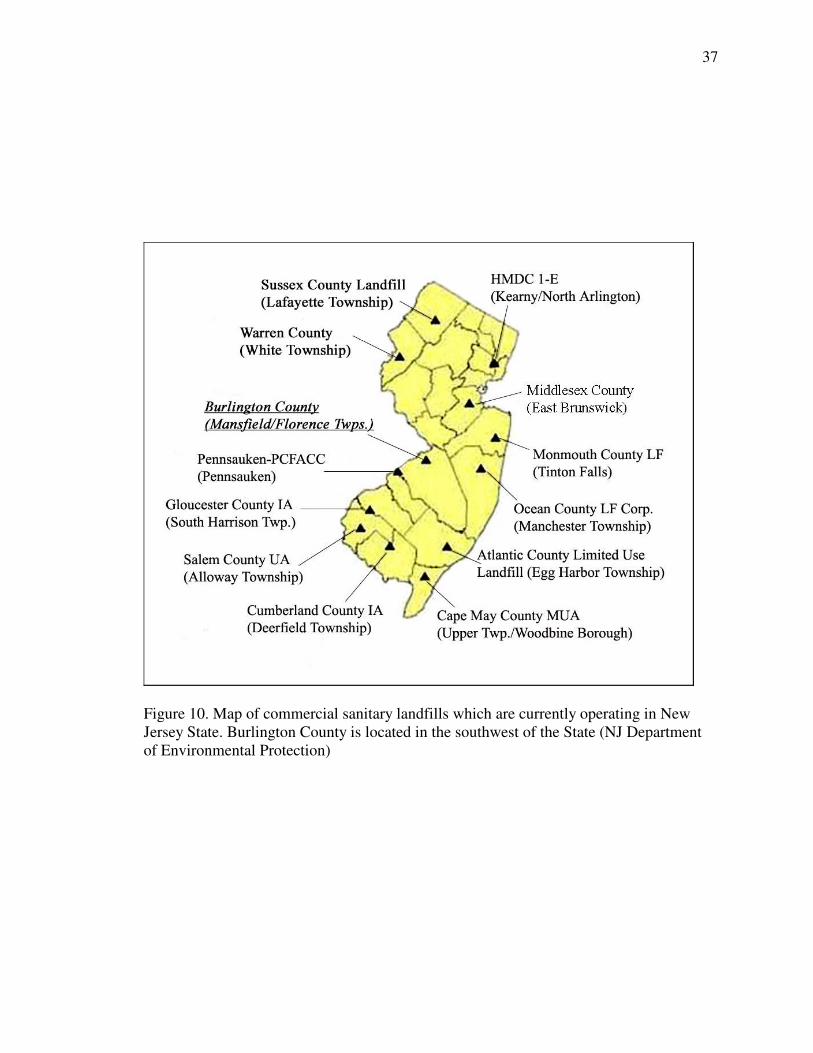
37
Figure 10. Map of commercial sanitary landfills which are currently operating in New Jersey State. Burlington County is located in the southwest of the State (NJ Department of Environmental Protection)
38
During the present study, excavated wastes were collected every 20 ft (6.1 m) and
placed in air tight glass mason jars with metal lids (Ball. Broomfield, CO), purged with
nitrogen gas and transported to the laboratory on ice. Immediately after arrival at the
laboratory, the waste samples were transferred to storage at -20°C until processed.
�
3.1.2 Cell Collection from Landfill Gas
Landfill gases were collected around 1 – 1.5 year after the gas extraction wells
were installed. Gas from areas containing older waste was collected at Wells 45 and 8A,
where wastes were collected previously. Landfill gas from relatively new sites (Wells 38
and 41), where wastes were collected previously, could not be sampled due to final cover
construction during the sampling period. Instead, gas from young waste was collected at
Wells 28 and 33. These wells were the nearest accessible wells from Wells 38 and 41
during the sampling period. Gas sampling was done approximately once a week between
the summer of 2001 and the spring of 2002.
Landfill gas was withdrawn from gas extraction wells by applying a vacuum
(dry rotary vane vacuum pump, EW-07055-60, having a nominal free-air capacity of 4.5
cfm (133 L/min), Cole-Parmer. Chicago, IL) to well heads. However, actual gas flow
rates through the filters were less than the nominal free-air flow rate of the pump due to
resistance in the filter, and so it is not known exactly what sample volume was passed
through each filter. The filter surfaces were overloaded with particles after approximately
three hours sampling period in many cases. Thus, in this study, sampling generally took
around three hours per filter.
39
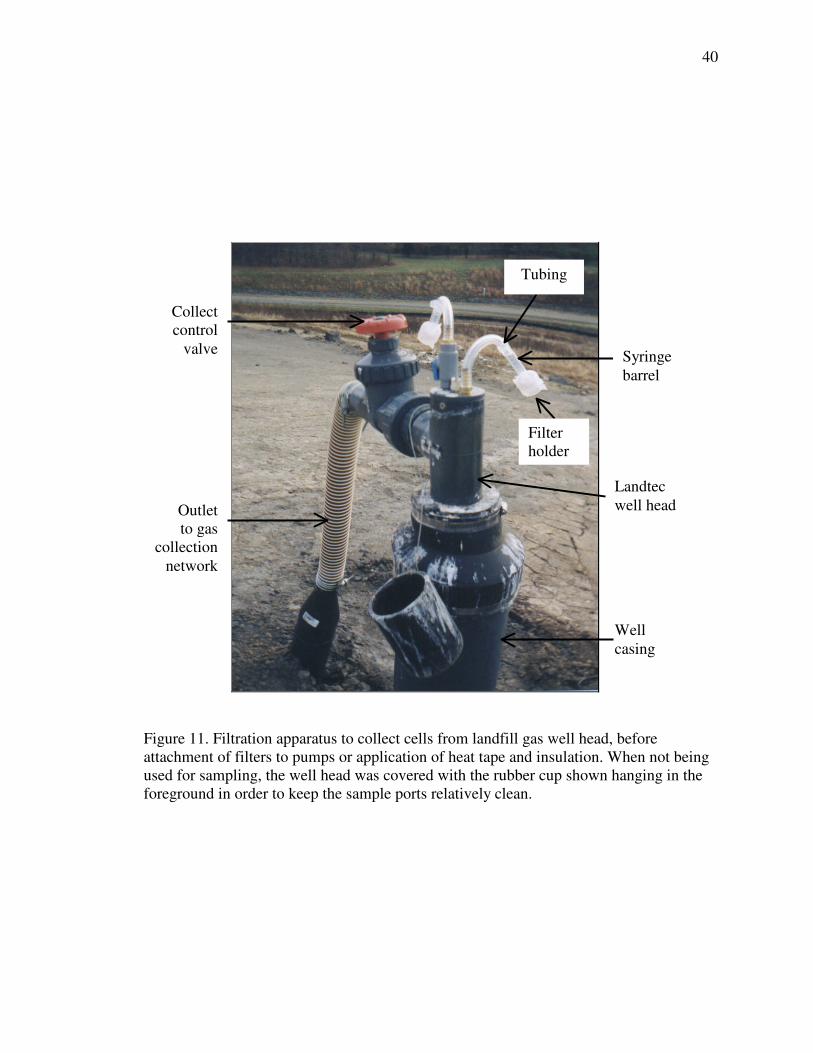
Landtec brand well heads were installed on each gas extraction well, and the
sampling collection apparatus was attached to ports on the well heads. Cells were
collected on Millipore Express polyethersulfone (PES) membranes (25 mm diameter)
with pore size of 0.22 µm, which were mounted in sterile filter holders (Millipore
Swinnex). The PES membrane is hydrophilic and offers fast flow, high filter capacity and
low protein binding while remaining bacterially retentive. Filter holders were attached to
well heads through sterile tubing and syringe barrels (Fig. 11). Gas temperatures typically
ranged between 44 °C and 47 °C at the surface.
Because the gas is saturated with water vapor while in the waste, condensate
forms when the gas cools upon reaching the surface. If this condensate collects on the
filter membrane, gas flow will stop and no sample will be collected. In order to prevent
formation of condensate on the membranes, the gas wells and filter holders were wrapped
in heating tapes (Omega. Stamford, CT) and then insulated with commercially available
closed-cell foam pipe insulation. The temperature of the heating tape�was set as close to
the gas temperature as possible with temperature controllers (Omega. Stamford, CT) in
order to keep vapor from condensing prior to filtration. Two complete collection systems
were simultaneously attached to the well head of one extraction gas well, so samples
were collected onto two separate filters at the same time. Figure 12 shows the gas
sampling process in the landfill. Immediately after collection, filters placed on ice in a
cooler. After transport to the laboratory, filters were kept at -20°C until further analysis.
40
Figure 11. Filtration apparatus to collect cells from landfill gas well head, before attachment of filters to pumps or application of heat tape and insulation. When not being used for sampling, the well head was covered with the rubber cup shown hanging in the foreground in order to keep the sample ports relatively clean.
Collect control
valve
Outlet to gas
collection network
Tubing
Landtec well head
Filter holder
Syringe barrel
Well casing
41
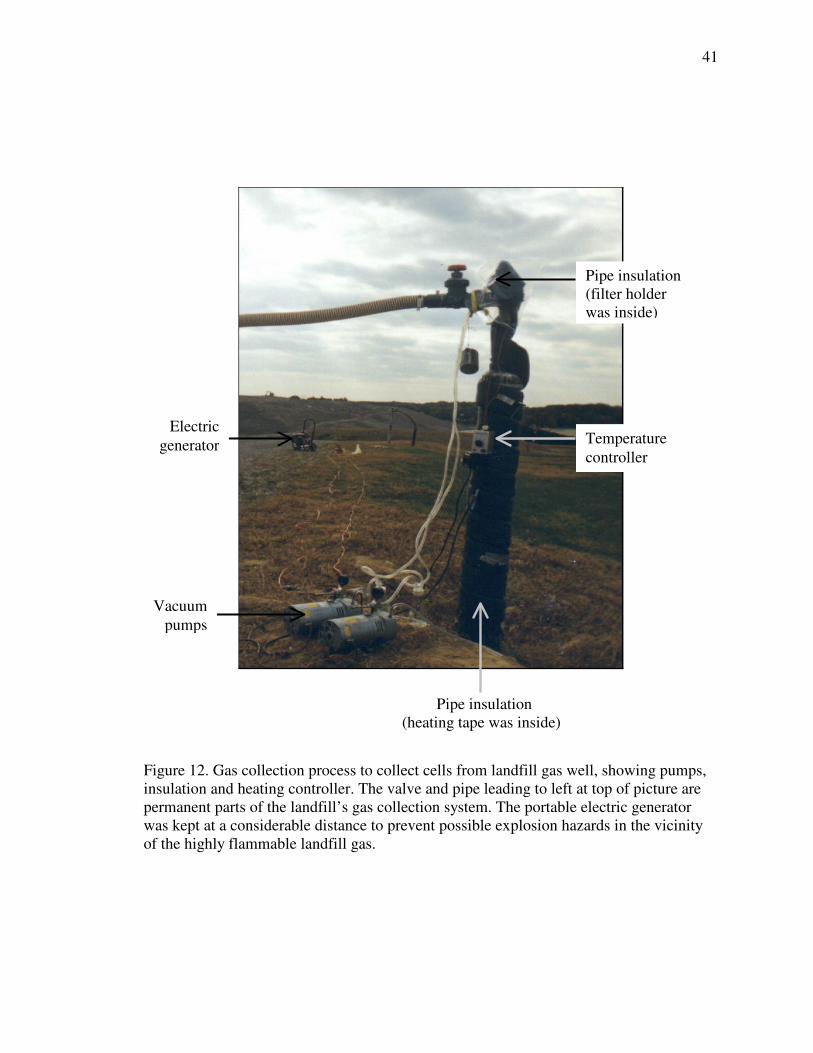
Figure 12. Gas collection process to collect cells from landfill gas well, showing pumps, insulation and heating controller. The valve and pipe leading to left at top of picture are permanent parts of the landfill’s gas collection system. The portable electric generator was kept at a considerable distance to prevent possible explosion hazards in the vicinity of the highly flammable landfill gas.
Vacuum pumps
Pipe insulation (heating tape was inside)
Temperature controller
Pipe insulation (filter holder was inside)
Electric generator
42
3.1.3 Cell Collection from Landfill Gas Condensate
Landfill gas condensate (LFGC) was collected from the landfill’s condensate
collection system at a point where the condensate was draining into a condensate sump.
The condensate in the sump arose from numerous wells and had traveled over 100 m
from the well heads. Gas condensate was collected into a clean bucket and transferred
into 15 L polycarbonate Nalgene carboys. Carboys were transferred to the laboratory on
ice. Immediately upon arrival at the laboratory, the landfill gas condensate was passed
through Sterivex filter units (Millipore Corp. Bedford, MA) to concentrate microbial
biomass, as suggested by Somerville, et al. (1989). Sterivex filter units have filters inside
a cylindrical polyvinyl chloride housing and are designed for pressure-driven
concentration of biomass. In this study, Sterivex GP filter units were used, which have
Millipore Express polyethersulfone (PES) membranes with pore size 0.22 µm. Gas
condensates were aseptically pumped through filters via a�Masterflex pump (Cole-
Parmer. Chicago, IL) using the layout shown in figure 13. Filtration continued until flow
rate slowed, where gas condensate volume was usually around 1.5 – 2.0 L. After
filtration, filters were rinsed with SET buffer (20% sucrose, 50 mM EDTA, 50 mM Tris
hydrochloride [pH 7.6]; Rodriquez, et al., 1983). Then the inlet port was capped with the
luer-lock end of a 3 or 5 ml disposable syringe while the outlet port was capped with a
syringe tip cover, which was cut about in half. The filters were stored at -20°C until
analyzed. �

43
15 L Carboy �
�
�������������������������������������������������������������������������������������������������������������������
�����������������������������������������������������������������������������������������
�
�������������Speed control Masterflex pump Sterivex filter
�
������������������������������
Waste container
Figure 13. The scheme of filtration process to concentrate cells from landfill gas condensate.
Gas condensate
Flow
44
3.2 Growth of Pure Cultures
To verify the performance of molecular techniques, the following strains were
used as references: Pseudomonas aeruginosa (ATCC 10145) was used as a Bacteria
representative, while Saccharomyces cerevisiae (ATCC 4108) was used as a Eucarya
reference strain. Methanococcus thermolithotrophicus (ATCC 35097), Methanosarcina
acetivorans (ATCC 35395) and Methanosaeta concilii (DSM 3013) were used as
Archaea reference strains. Each strain was purchased from the American Type Culture
Collection (ATCC. Manassas, VA) or Deutsche Sammlung von Mikroorganismen und
Zellkulturen GmbH (DSM. Braunschweig, Germany). Preparation of culture media and
growth conditions were as described by ATCC and DSM protocols. A brief description of
growth conditions is presented here.
P. aeruginosa (ATCC 10145) was grown under aerobic conditions at 37°C in
nutrient broth (Difco 0003. Detroit, MI). S. cerevisiae (ATCC 4108) was grown at 30°C
in YM broth (Difco 0711. Detroit, MI).
For anaerobic cultures, preparation medium and inoculation were performed as
described earlier. The anaerobic tubes with extra thick rubber stoppers and aluminum
seals were purchased from Bellco Glass (Vineland, NJ). For larger volumes, 125 mL
serum bottles were used (Wheaton, Fisher Scientific). For anaerobic media preparation, a
low-cost gassing manifold was used as described by Sowers and Moll (1995, Fig. 14).
M. thermolithotrophicus (ATCC 35097) was grown at 60 °C in ATCC medium 1439
under a gas mixture of 80% H2 + 20% CO2. M. acetivorans (ATCC 35395) was grown at
37 °C in ATCC medium 1355 under a gas mixture of 80% N2 + 20% CO2. M. concilii
45
(DSM 3013) was grown at 35°C in DSM media 334 under a gas mixture of 80% N2 +
20% CO2. Detailed media components and preparation are described in appendix B.
The cells were harvested by centrifugation at 4,303 × g (in a Sorvall SS34 rotor
at 6,000 rpm) for 15 min at 4°C. The supernatant was discarded, and the cells were
resuspended in fresh growth medium. Then cell pellets were collected after centrifugation
at 14,462 × g (in a Sorvall SS34 rotor at 11,000 rpm) for 30 min at 4°C. The cells for
nucleic acid extraction were stored at -80°C.
�
�
�
�
�
�
�
�
�
�
�
�
�
�

46
�
�
�
�
Figure 14. Apparatus for dispensing anaerobic media with gassing cannula (Sowers and Noll, 1995). The diagram shows a flask containing de-oxygenated medium and pipette that will be used to transfer the medium to the culture tubes. The flask, the pipette and the tubes are all flushed with oxygen free gas during the procedure.
47
3.3 Nucleic Acid Extraction
In order to avoid culturing, nucleic acids were directly extracted from landfill
gas, gas condensates and wastes. In the case of RNA extraction, RNA is easily degraded
by RNAases. Therefore, special precautions as described by Maniatis, et al. (1982) were
used throughout the RNA extraction.
3.3.1 Nucleic Acid Extraction from Pure Cultures
RNA was extracted from P. aeruginosa (ATCC 10145), S. cerevisiae (ATCC
4108), and M. acetivorans (ATCC 35395). 3 mL of Na-Ac buffer (50 mM Na-Ac and 10
mM EDTA, Thomm and Gohl, 1995) and 300 µL 10% SDS were used as lysis buffer.
Cells were disrupted by mechanical agitation for 3 min with a Beadbeater (BioSpec
Products, Inc. Bartlesville, OK) in the presence of 0.1 mm ice-cold and acid-washed
glassbeads (0.5 mm glassbeads for S. cerevisiae). After disruption, lysates were
transferred into microcentrifuge tubes. Then, nucleic acids were extracted and purified 3
times with phenol-isoamyl-chloroform (125:24:1, pH 4.3. Fisher Scientific. Fair Lawn,
NJ). Finally, nucleic acids were extracted with chloroform and precipitated with ethanol
overnight at -20°C. After 30 min centrifugation at 14,000 rpm and 4°C, RNA pellets were
rinsed with cold 70% ethanol. To remove residual DNA, DNase (DNA-free kit. Ambion.
Austin, TX) was used according to the manufacturer’s instructions. The amount of RNA
was determined by spectrophotometer at 260 nm and the integrity of RNA preparation
was determined by agarose gel electrophoresis.
DNA was extracted from P. aeruginosa (ATCC 10145), M. concilii (DSM 3013),
and M. thermolithotrophicus (ATCC 35097). Except for M. thermolithotrophicus (ATCC
48
35097), 3 mL of TE buffer (10 mM Tris- Cl [pH 7.6] and 1 mM EDTA), 300 µL of 10%
SDS were used as lysis buffer. Cell disruption was carried out with mechanical agitation
as described previously. Cell disruption of M. thermolithotrophicus (ATCC 35097) was
carried out by incubating in a lysis solution overnight at 4°C as described by Hoaki, et al.
(1994). Then, DNA was extracted and purified with phenol-isoamyl-chloroform (25:24:1,
pH 8.0, buffered with Tris, Fisher Scientific. Fare Lawn, NJ). Precipitation and collection
of the DNA pellet was done as described previously.
3.3.2 Nucleic Acid Extraction from Landfill Gas Condensates
Cell lysis for condensate samples was performed based on the method described
by Somerville, et al. (1989) in which cell lysis and proteolysis were carried out within the
filter housing. After the crude lysates were drawn off from the filter unit, nucleic acid
extraction, purification and precipitation were done as described previously.
3.3.3 Nucleic Acid Extraction from Landfill Gas
For landfill gas samples, the RNA was extracted directly from the filters by
mechanical disruption. Each filter was cut into quarters with an industrial razor blade
(VWR Scientific. Media, PA), which was cleaned with ethyl alcohol. The lysis buffer
contained 3 mL SET buffer (20% sucrose, 50 mM EDTA, 50 mM Tris hydrochloride [pH
7.6]; Rodriquez, et al., 1983) and 300 µL of 10% SDS. Cell disruption, nucleic acid
extraction, purification, precipitation and removal of DNA were achieved as described
previously.
49
For DNA extraction, cell lysis was carried out directly on the filter by incubating
the filter in a lysis solution described by Maher, et al. (2001). After incubation, lysates
were transferred to microcentrifuge tubes and then DNA extraction, purification and
precipitation were performed as described previously.
3.3.4 Nucleic Acid Extraction from Landfill Wastes
Five grams (wet basis) of landfill waste was added to a homogenizing chamber
containing 15 ml – 20mL extraction buffer, 1.5 – 2 mL of 10 % SDS, 5g of 0.5 mm glass
beads and 5g of 0.1 mm glass beads. For RNA extraction, the extraction buffer contained
20% sucrose, 50 mM EDTA, 50 mM Tris hydrochloride (pH 7.6), 1.7%
polyvinylpyrrolidone (PVP) and skim milk (0.1g/25mL, Becton Dickinson. Sparks, MD).
For DNA extraction, the extraction buffer contained TENP buffer (50 mM Tris, 20 mM
EDTA, 100 mM NaCl, 1 % [wt/vol] polyvinylpolypyrrolidone, PVPP; Picard, et al.,
1992). PVP (Felske, et al., 1996), skim milk (Volossiouk, et al., 1995) and PVPP were
used to remove contaminants, which are mostly humic substances. Tris and EDTA
(Ethylenediamine-tetraacetic acid) are known to protect the DNA from nuclease activity
(Picard, et al., 1992). Cell lysis was carried out by mechanical disruption as described
previously. After disruption, glass beads, particles, and cell debris were removed by
centrifugation at 4,303 × g (in a Sorvall SS34 rotor at 6,000 rpm) for 10 min at 4°C. The
supernatant was collected into a new tube. The pellet was washed twice with fresh
extraction buffer. After washing, the supernatant was collected and combined with
previous supernatant, and the pellet was discarded. The supernatant was then centrifuged
at 14,462 × g (in a Sorvall SS34 rotor at 11,000 rpm) for 30 min at 4 °C. The resulting
50
supernatant was discarded and the pellet was resuspended with buffer. For RNA
extraction, AE buffer (20 mM Na-Ac [pH 5.5] and 1 mM EDTA), and for DNA
extraction, TE buffer (10 mM Tris-HCl [pH 7.6] and 1 mM EDTA) were used. Then
nucleic acids were extracted, purified and precipitated as described previously.
The crude RNA extracts ranged from colorless to yellow to dark brown. Yellow
and dark brown RNA extracts were purified with an Rneasy mini kit (Qiagen. Valencia,
CA). First, guanidinium isothiocyanate (GITC)-containing buffer and ethanol were added
to the sample to provide conditions which promote selective binding of RNA to the
Rneasy membrane. The sample was then applied to the Rneasy mini spin column. RNA
bind to the membrane, contaminants were efficiently washed away, and high-quality
RNA was eluted in water. After purification with the kit, most samples appeared
colorless, however, some of the extracts still appeared slightly yellow.
The crude DNA extracts ranged from yellow to dark brown, and were purified
with a Wizard DNA Clean-up System (Promega. Madison, WI). This system is a simple
batch binding and column washing method for purifying DNA from contaminants such as
enzymes, nucleotides and salts.� The purification treatments were carried out according to
manufacturer’s instructions. After purification, all DNA extracts appeared colorless.
3.4 rRNA Quantification by Slot-blot Hybridization
Group-specific hybridization probes targeting the 16S rRNA of Bacteria
(EUB338, positions 338 to 355; Amann, et al., 1990), Archaea (ARC914, positions 943-
915; Raskin, et al., 1994a) and Eucarya (EUK516, positions 502 to 516; Amann, et al.,
1990) were used to measure the abundance of the corresponding populations in the
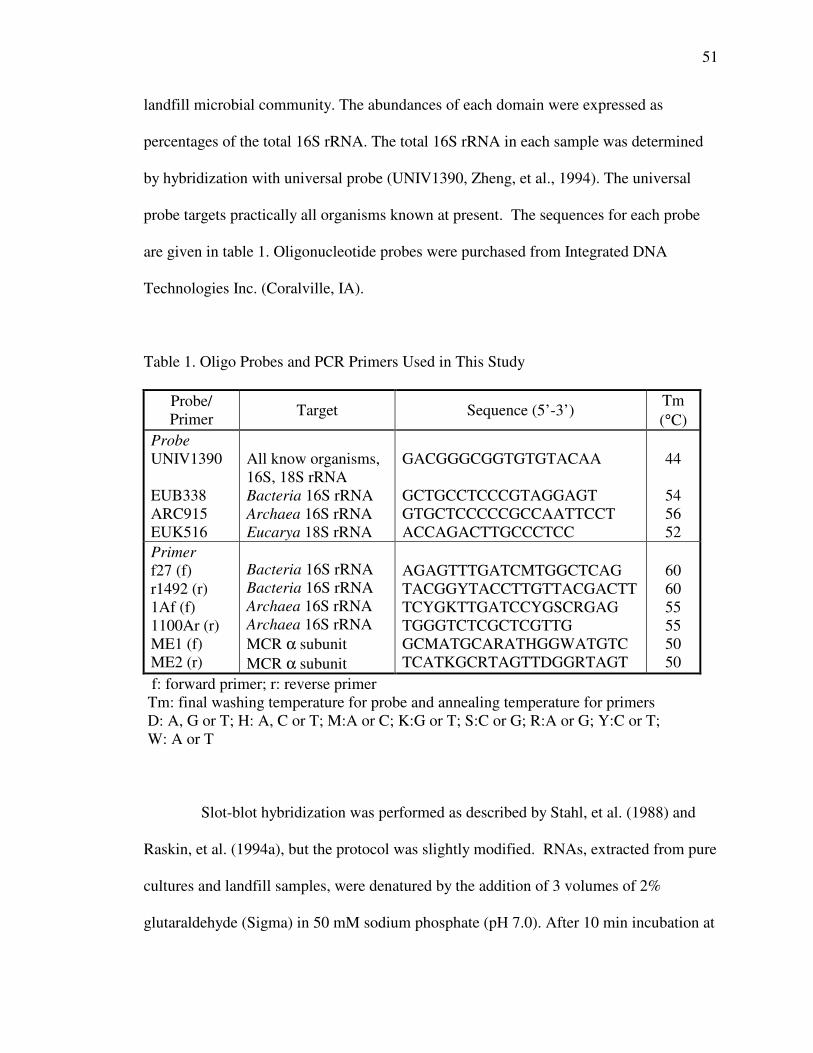
51
landfill microbial community. The abundances of each domain were expressed as
percentages of the total 16S rRNA. The total 16S rRNA in each sample was determined
by hybridization with universal probe (UNIV1390, Zheng, et al., 1994). The universal
probe targets practically all organisms known at present. The sequences for each probe
are given in table 1. Oligonucleotide probes were purchased from Integrated DNA
Technologies Inc. (Coralville, IA).
Table 1. Oligo Probes and PCR Primers Used in This Study
Probe/ Primer Target Sequence (5’-3’)
Tm (°C)
Probe UNIV1390 EUB338 ARC915 EUK516
All know organisms, 16S, 18S rRNA Bacteria 16S rRNA Archaea 16S rRNA Eucarya 18S rRNA
GACGGGCGGTGTGTACAA GCTGCCTCCCGTAGGAGT GTGCTCCCCCGCCAATTCCT ACCAGACTTGCCCTCC
44
54 56 52
Primer f27 (f) r1492 (r) 1Af (f) 1100Ar (r) ME1 (f) ME2 (r)
Bacteria 16S rRNA Bacteria 16S rRNA Archaea 16S rRNA Archaea 16S rRNA MCR α subunit MCR α subunit
AGAGTTTGATCMTGGCTCAG TACGGYTACCTTGTTACGACTT TCYGKTTGATCCYGSCRGAG TGGGTCTCGCTCGTTG GCMATGCARATHGGWATGTC TCATKGCRTAGTTDGGRTAGT
60 60 55 55 50 50
f: forward primer; r: reverse primer Tm: final washing temperature for probe and annealing temperature for primers D: A, G or T; H: A, C or T; M:A or C; K:G or T; S:C or G; R:A or G; Y:C or T; W: A or T
Slot-blot hybridization was performed as described by Stahl, et al. (1988) and
Raskin, et al. (1994a), but the protocol was slightly modified. RNAs, extracted from pure
cultures and landfill samples, were denatured by the addition of 3 volumes of 2%
glutaraldehyde (Sigma) in 50 mM sodium phosphate (pH 7.0). After 10 min incubation at
52
room temperature, dilution water was added to obtain a final volume of 50 mL. Dilution
water made up with RNAse-free water containing 1 �g of poly (A) (Amersham
Biosciences. Piscataway, NJ) per ml and 0.02 �l of 2% bromophenol blue per ml. Then
RNAs were loaded onto nylon membranes (Hybond-N. Amersham Life Science.
Buckinghamshire, England) using a slot-blotting apparatus (Bio-Dot SF. Bio-Rad.
Hercules, CA). The membrane was air dried and baked at 80°C for 2 hours to immobilize
RNA.
Probes were prepared as follow. First, each oligo probe was mixed with 3�l of 10
× kinase buffer (Roche Diagnostics Corp. Indianapolis, IN), 1.5 �l of 1% Nonidet P40
(IGEPAL CA-630. Sigma. St. Louis, MO), 1 �l polynucleotide kinase (3’ phosphatase
free; Roche Diagnostics Corp. Indianapolis, IN), an equimolar amount of [γ- 32P]ATP at
specific activity of > 7,000 Ci/mM and a concentration of >160 mCi/ml (initial activity
level; ICN Inc. Irvine, CA), and RNase-free water to obtain a total volumes of 30 �l.
Then this mixture was incubated for 30 min at 37°C. The unincorporated 32P was
removed by spun-column chromatography as described by Sambrook, et al. (1989).
Baked membrane was placed in hybridization tubes (Techne, Princeton, NJ) and
hybridization buffer (0.9 M NaCl, 50 mM sodium phosphate [pH 7.0], 5 mM EDTA,
10 × Denhardt solution (Sambrook, et al., 1989), 0.5 % sodium dodecyl sulfate (SDS),
0.5 mg of poly (A) per ml) was added. Membranes were prehybridized for 2 hr at 40 °C
in a rotating incubator (Hybridizer. Techne. Princeton, NJ). Then labeled probe was
added and incubation was continued for 14 to 18 hr at 40 °C. After incubation, the
membrane was washed with buffer (1% SDS-1×SSC: 0.15 M NaCl and 0.015 M sodium
citrate, pH 7.0) for 2 hr at 40°C. Washing buffer was changed every 15 min during the
53
first 1 hr period. Then final washing was carried out for another 30 min in 1% SDS-
1×SSC at the appropriated temperatures as indicated in table 1.
The membranes were air dried, and placed in the X-ray exposure holder (Kodak.
Rochester, NY) with X-ray film (Kodak Scientific Imaging Film. Rochester, NY).
Typically, hybridization with universal probe and Bacteria-specific probe needed less
than 24 h of exposure for quantification. However, hybridization with Archaea-specific
and Eucarya-specific probes required more than 2 days of exposure for adequate
quantification, further, gas samples required more than 3 days of exposure. After
exposure, films were developed in the film processor (Konica Corp. Scarborough, ME).
Hybridization signal net intensity was measured by using KODAK 1D image analysis
software (Eastman Kodak Company. Rochester, NY, 2000). Net intensity is the sum of
the background-subtracted pixel values in the band rectangle.
For universal and specific probe quantifications, RNA standard curves were
constructed. RNA standard curves were obtained from hybridization signals of the
reference series of RNAs extracted from pure cultures at different concentrations. The
least-squares method was used to calculate slopes and intercepts of the reference RNA
standard curves. The concentrations of RNA in the landfill samples were then calculated
from these standard curves. The abundances of each domain were expressed as
percentages of the total 16S rRNA in a given sample.
54
3.5 Polymerase Chain Reaction (PCR) Amplifications
DNA extracts from landfill samples were used as templates for PCR
amplification. Bacterial 16S rRNA genes were amplified using the Bacteria-specific
primers f27 and r1492 (Giovannoni, 1991). The reactions were carried out for 30 cycles
at 1 min at 92°C, 1 min at 60 °C, 1 min at 72°C, with a final extension at 72°C for 5 min
(McDonald, et al., 1999). Amplification was also performed with Archaea-specific 16S
rRNA primers 1Af and 1100Ar (Embley, et al., 1992). The reaction condition was 30
cycles with 95°C for 40 s, 55°C for 1 min, 72°C for 2 min, and a final extension step at
72°C for 3.5 min (Hales, et al., 1996).
As discussed previously, the methanogens are responsible for the terminal steps
of anaerobic degradation of organic materials. In order to detect the presence of
methanogens, the methanogen-specific primers ME1 and ME2 were used (Hales, et al.,
1996). These primers target for the methanogen-specific mcrA gene, which encodes the α
subunit of methyl coenzyme M reductase (MCR). MCR catalyzes the final step of
methanogenesis and appears to be conserved in all methanogens (Hales, et al., 1996). The
reaction conditions were 30 cycles of 94°C for 40 s, 50°C for 1.5min, 72°C for 3 min,
and a final extension step at 72 °C for 10 min.
Dilution of DNA template provides a simple method that can facilitate PCR
amplification, since it retains the target DNA sensitivity while diluting out inhibitors
(Alvarez, et al., 1994; Tsai and Olson, 1992a; Tsai and Olson, 1992b; Xia, et al., 1995).
In the present study, DNA from each landfill sample was diluted at different ratios,
undiluted, 10-1, and 10-2 dilution, and then PCR amplification was performed. Primers
55
were purchased from Integrated DNA Technologies Inc. (Coralville, IA). Primer
sequences and the annealing temperatures are shown in table 1.
56
4. Results
4.1 Isolation of Nucleic Acids from Landfill Gas, Gas Condensate, and Waste
Nucleic acids from landfill gas and landfill gas condensate were successfully
extracted with the common phenol purification method without any additional
purification steps. In landfill gas samples, the amount of extractable DNA was very low,
below the detection limit of gel electrophoresis. In contrast, recovered RNA from landfill
gas showed two distinct bands at greater than 1.1 kb and these are assumed to be 23S
rRNA and 16S rRNA (Fig. 15a). RNA from landfill gas condensate showed two bands at
greater than 0.98 kb it is assumed that these are from 23S rRNA and 16S rRNA as well.
A diffuse band of low-molecular weight RNA (less than 123 bp) was observed in gas
condensate. Treatment of the samples with DNase clearly differentiated RNA and DNA
in the gas condensate (Fig. 15b).
During excavation of the landfill, the correlation between the decomposition
process of landfill materials and depths (or waste age) could easily be observed. Close to
the surface, wastes contained identifiable materials, such as newspapers, glass and
plastic, and recognizable decomposing materials. However, at greater depths (at or below
60 ft (18. 3 m)), samples largely consisted of homogenous dark materials without
recognizable organic source materials. Ambient temperatures of the excavated wastes
ranged from 36°C to 58°C. Generally temperature increased with increasing depth below
the surface of the landfill (Fig. 16).
�
�
�
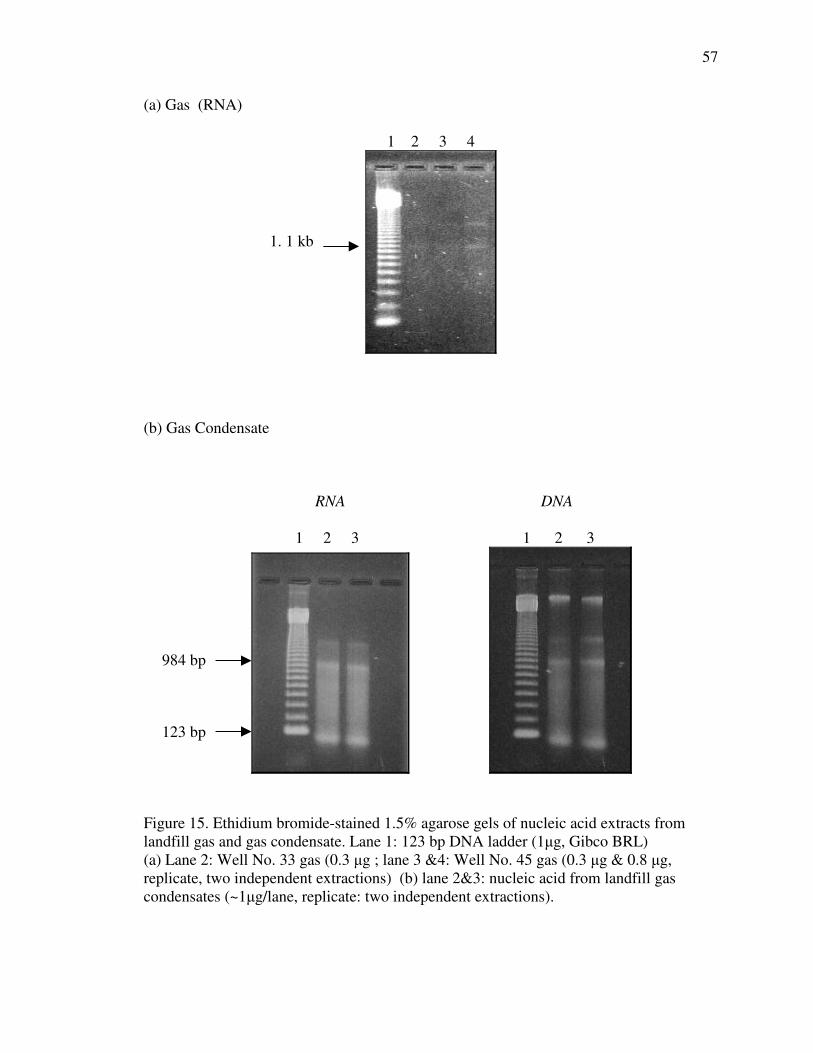
57
(a) Gas (RNA)
1 2 3 4
�
�
(b) Gas Condensate
RNA DNA 1 2 3 1 2 3
��������������������������� �������������������� �
Figure 15. Ethidium bromide-stained 1.5% agarose gels of nucleic acid extracts from landfill gas and gas condensate. Lane 1: 123 bp DNA ladder (1�g, Gibco BRL) (a) Lane 2: Well No. 33 gas (0.3 �g ; lane 3 &4: Well No. 45 gas (0.3 �g & 0.8 �g, replicate, two independent extractions) (b) lane 2&3: nucleic acid from landfill gas condensates (~1�g/lane, replicate: two independent extractions). ��������
1. 1 kb
984 bp
123 bp
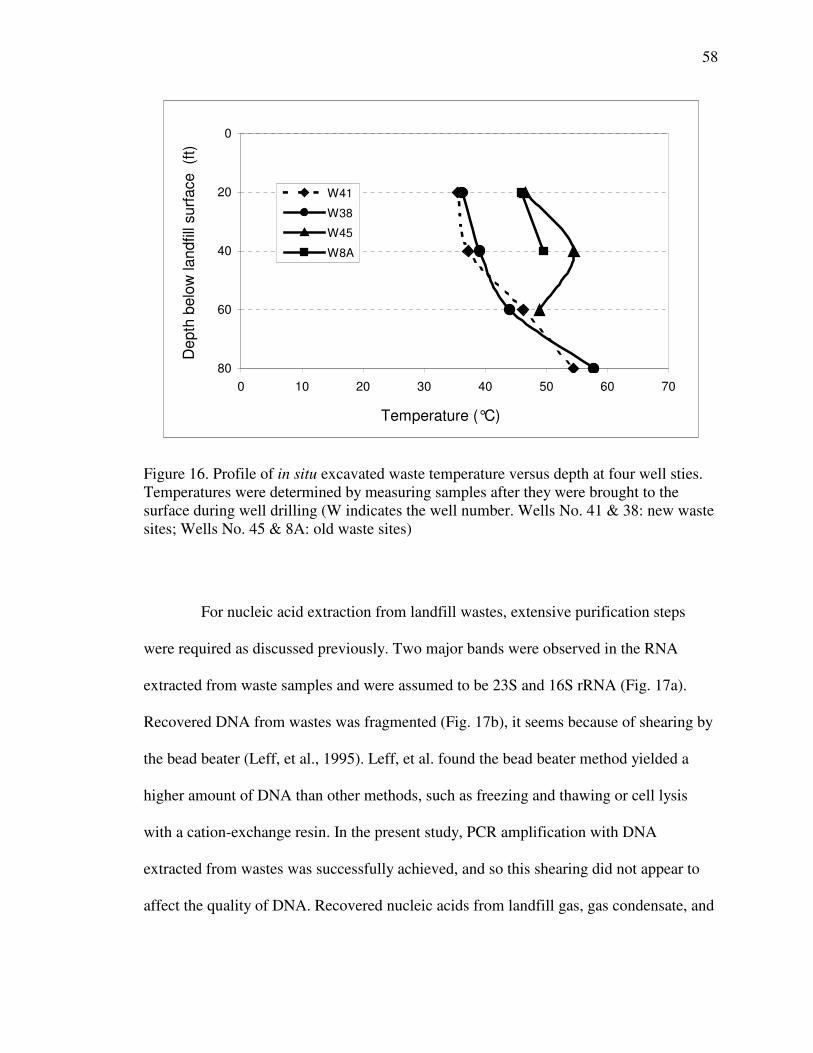
58
0
20
40
60
800 10 20 30 40 50 60 70
Temperature (°C)
Dep
th b
elow
land
fill s
urfa
ce (
ft)W41
W38
W45
W8A
�
�
Figure 16. Profile of in situ excavated waste temperature versus depth at four well sties. Temperatures were determined by measuring samples after they were brought to the surface during well drilling (W indicates the well number. Wells No. 41 & 38: new waste sites; Wells No. 45 & 8A: old waste sites)��
�
�
For nucleic acid extraction from landfill wastes, extensive purification steps
were required as discussed previously. Two major bands were observed in the RNA
extracted from waste samples and were assumed to be 23S and 16S rRNA (Fig. 17a).
Recovered DNA from wastes was fragmented (Fig. 17b), it seems because of shearing by
the bead beater (Leff, et al., 1995). Leff, et al. found the bead beater method yielded a
higher amount of DNA than other methods, such as freezing and thawing or cell lysis
with a cation-exchange resin. In the present study, PCR amplification with DNA
extracted from wastes was successfully achieved, and so this shearing did not appear to
affect the quality of DNA. Recovered nucleic acids from landfill gas, gas condensate, and
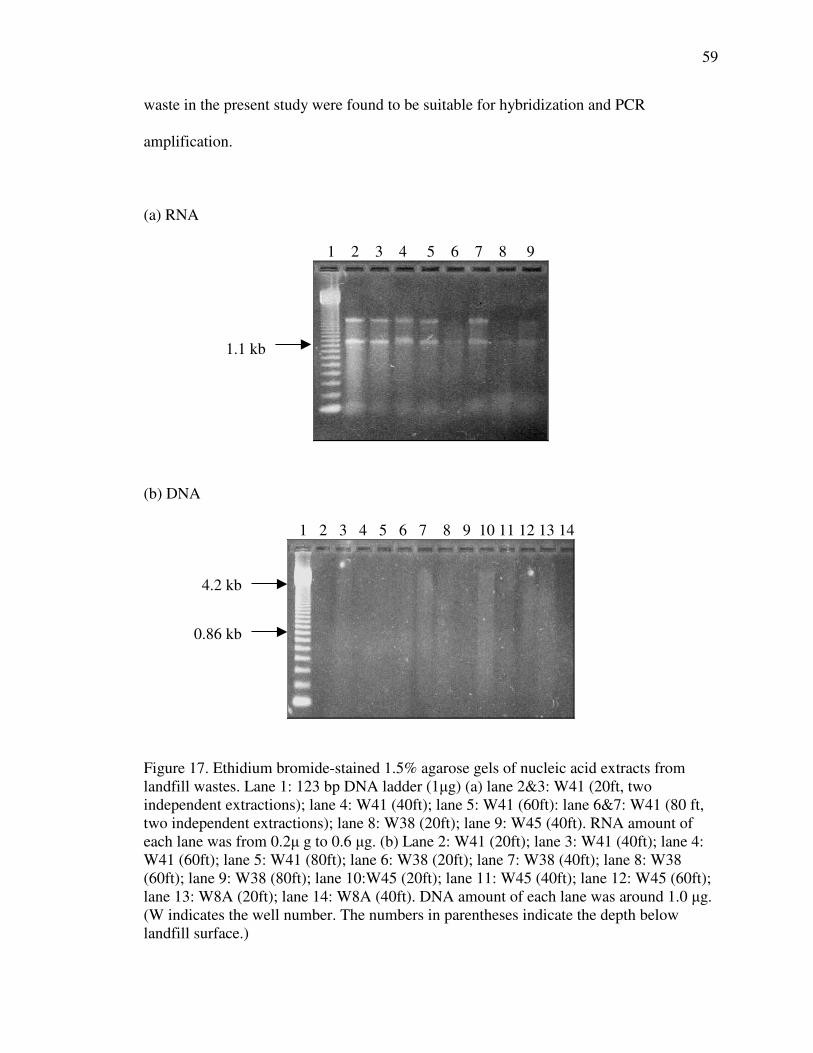
59
waste in the present study were found to be suitable for hybridization and PCR
amplification.
(a) RNA
1 2 3 4 5 6 7 8 9
�
�
�
(b) DNA 1 2 3 4 5 6 7 8 9 10 11 12 13 14
�
�
Figure 17. Ethidium bromide-stained 1.5% agarose gels of nucleic acid extracts from landfill wastes. Lane 1: 123 bp DNA ladder (1�g) (a) lane 2&3: W41 (20ft, two independent extractions); lane 4: W41 (40ft); lane 5: W41 (60ft): lane 6&7: W41 (80 ft, two independent extractions); lane 8: W38 (20ft); lane 9: W45 (40ft). RNA amount of each lane was from 0.2� g to 0.6 �g. (b) Lane 2: W41 (20ft); lane 3: W41 (40ft); lane 4: W41 (60ft); lane 5: W41 (80ft); lane 6: W38 (20ft); lane 7: W38 (40ft); lane 8: W38 (60ft); lane 9: W38 (80ft); lane 10:W45 (20ft); lane 11: W45 (40ft); lane 12: W45 (60ft); lane 13: W8A (20ft); lane 14: W8A (40ft). DNA amount of each lane was around 1.0 �g. (W indicates the well number. The numbers in parentheses indicate the depth below landfill surface.)
1.1 kb
0.86 kb
4.2 kb
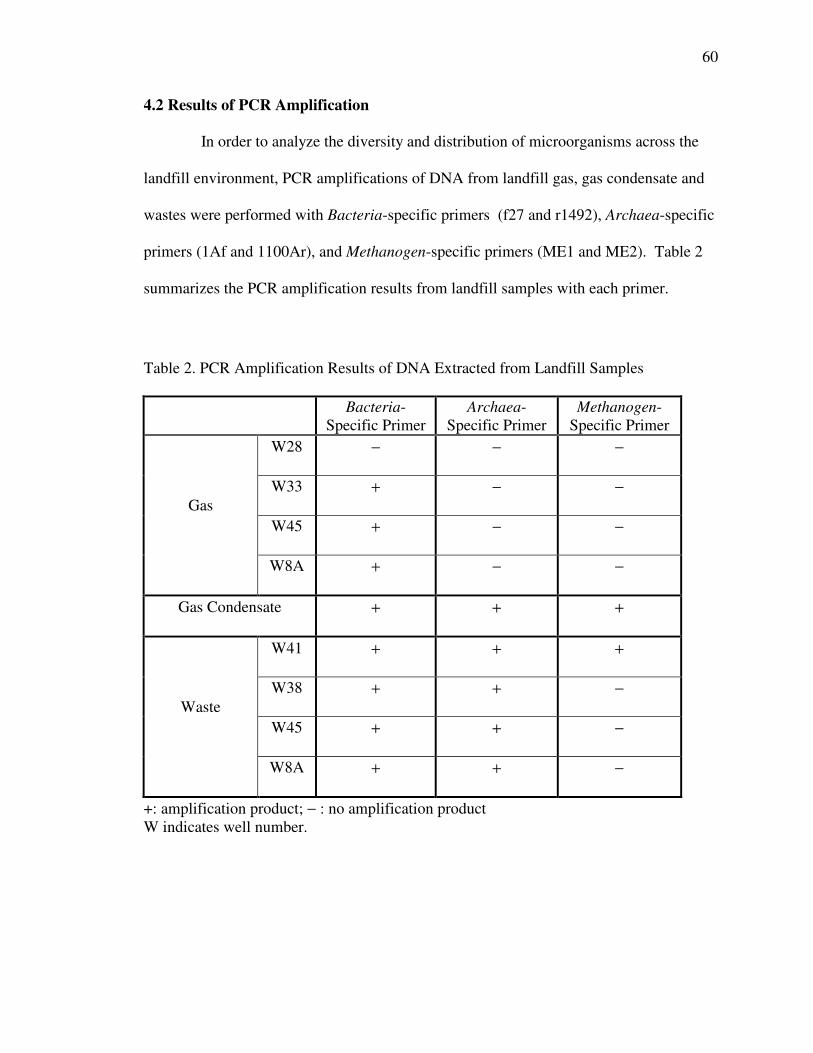
60
4.2 Results of PCR Amplification
In order to analyze the diversity and distribution of microorganisms across the
landfill environment, PCR amplifications of DNA from landfill gas, gas condensate and
wastes were performed with Bacteria-specific primers (f27 and r1492), Archaea-specific
primers (1Af and 1100Ar), and Methanogen-specific primers (ME1 and ME2). Table 2
summarizes the PCR amplification results from landfill samples with each primer.
�
�
Table 2. PCR Amplification Results of DNA Extracted from Landfill Samples
Bacteria-Specific Primer
Archaea-Specific Primer
Methanogen-Specific Primer
W28 − − −
W33 + − −
W45 + − − Gas
W8A + − −
Gas Condensate + + +
W41 + + +
W38 + + −
W45 + + − Waste
W8A + + −
+: amplification product; − : no amplification product W indicates well number.
�
�
�
�
�
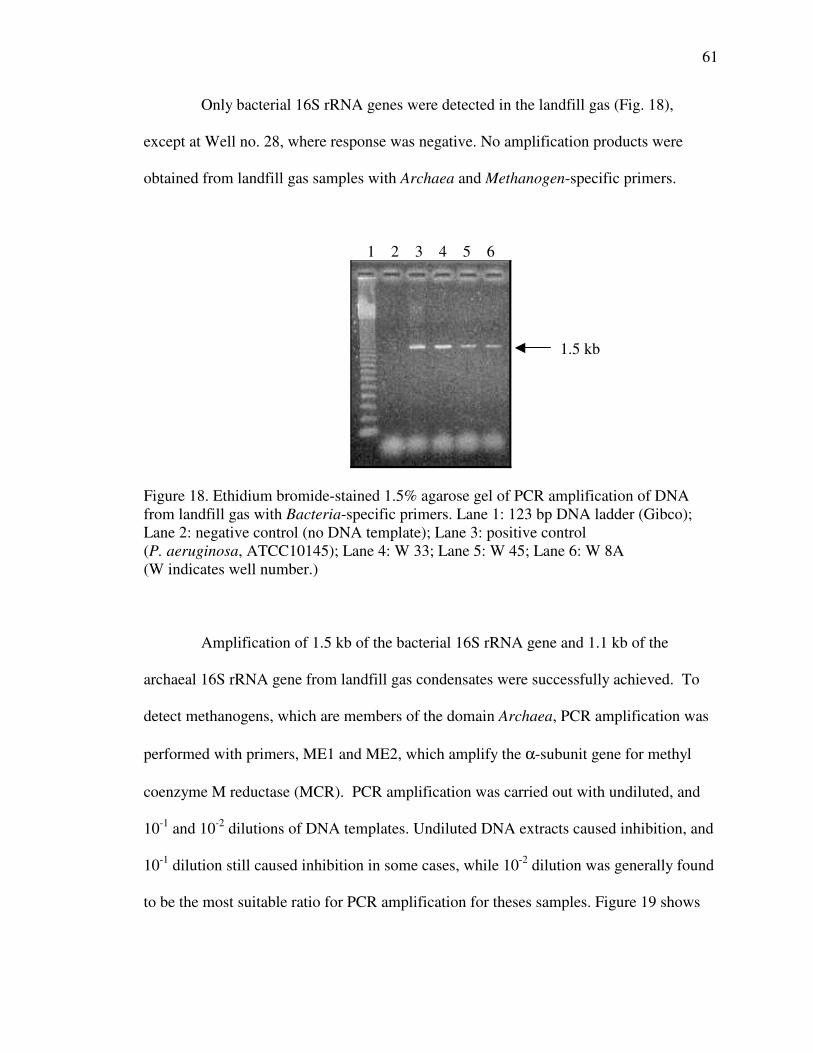
61
Only bacterial 16S rRNA genes were detected in the landfill gas (Fig. 18),
except at Well no. 28, where response was negative. No amplification products were
obtained from landfill gas samples with Archaea and Methanogen-specific primers.
1 2 3 4 5 6
Figure 18. Ethidium bromide-stained 1.5% agarose gel of PCR amplification of DNA from landfill gas with Bacteria-specific primers. Lane 1: 123 bp DNA ladder (Gibco); Lane 2: negative control (no DNA template); Lane 3: positive control (P. aeruginosa, ATCC10145); Lane 4: W 33; Lane 5: W 45; Lane 6: W 8A (W indicates well number.)
Amplification of 1.5 kb of the bacterial 16S rRNA gene and 1.1 kb of the�
archaeal 16S rRNA gene from landfill gas condensates were successfully achieved. To
detect methanogens, which are members of the domain Archaea, PCR amplification was
performed with primers, ME1 and ME2, which amplify the α-subunit gene for methyl
coenzyme M reductase (MCR). PCR amplification was carried out with undiluted, and
10-1 and 10-2 dilutions of DNA templates. Undiluted DNA extracts caused inhibition, and
10-1 dilution still caused inhibition in some cases, while 10-2 dilution was generally found
to be the most suitable ratio for PCR amplification for theses samples. Figure 19 shows
1.5 kb
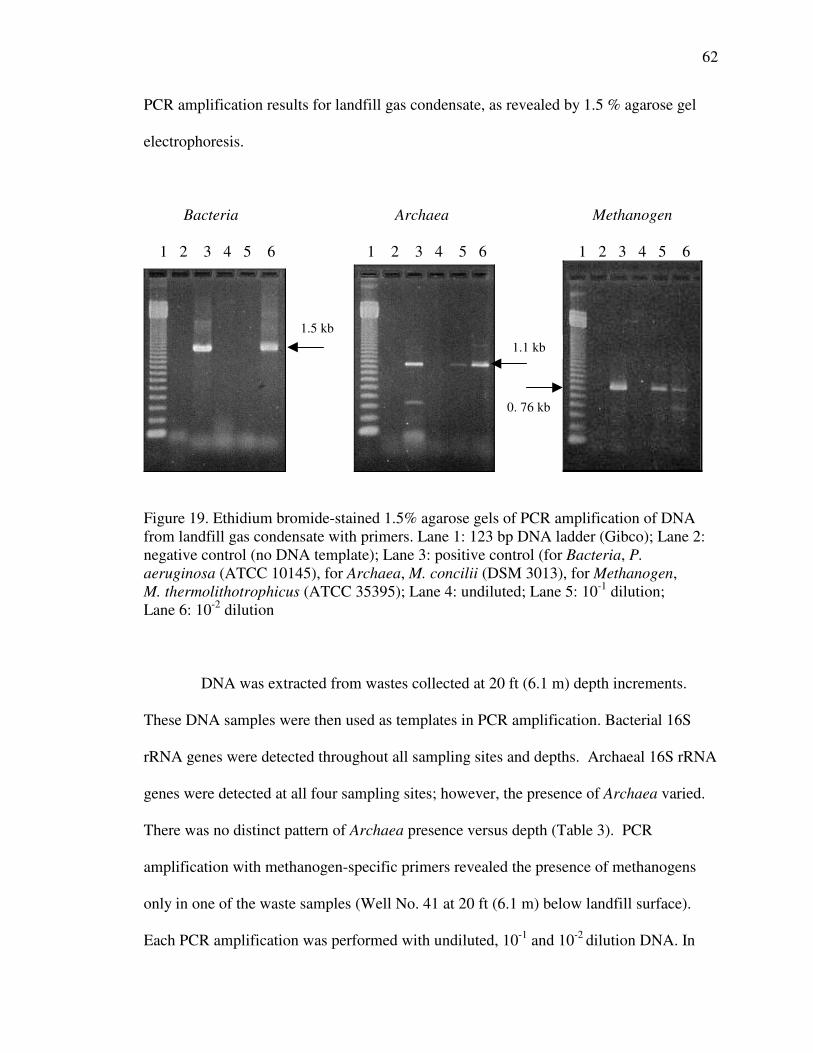
62
PCR amplification results for landfill gas condensate, as revealed by 1.5 % agarose gel
electrophoresis.
Bacteria Archaea Methanogen 1 2 3 4 5 6 1 2 3 4 5 6 1 2 3 4 5 6
Figure 19. Ethidium bromide-stained 1.5% agarose gels of PCR amplification of DNA from landfill gas condensate with primers. Lane 1: 123 bp DNA ladder (Gibco); Lane 2: negative control (no DNA template); Lane 3: positive control (for Bacteria, P. aeruginosa (ATCC 10145), for Archaea, M. concilii (DSM 3013), for Methanogen, M. thermolithotrophicus (ATCC 35395); Lane 4: undiluted; Lane 5: 10-1 dilution; Lane 6: 10-2 dilution
DNA was extracted from wastes collected at 20 ft (6.1 m) depth increments.
These DNA samples were then used as templates in PCR amplification. Bacterial 16S
rRNA genes were detected throughout all sampling sites and depths. Archaeal 16S rRNA
genes were detected at all four sampling sites; however, the presence of Archaea varied.
There was no distinct pattern of Archaea presence versus depth (Table 3). PCR
amplification with methanogen-specific primers revealed the presence of methanogens
only in one of the waste samples (Well No. 41 at 20 ft (6.1 m) below landfill surface).
Each PCR amplification was performed with undiluted, 10-1 and 10-2 dilution DNA. In
1.5 kb
0. 76 kb
1.1 kb
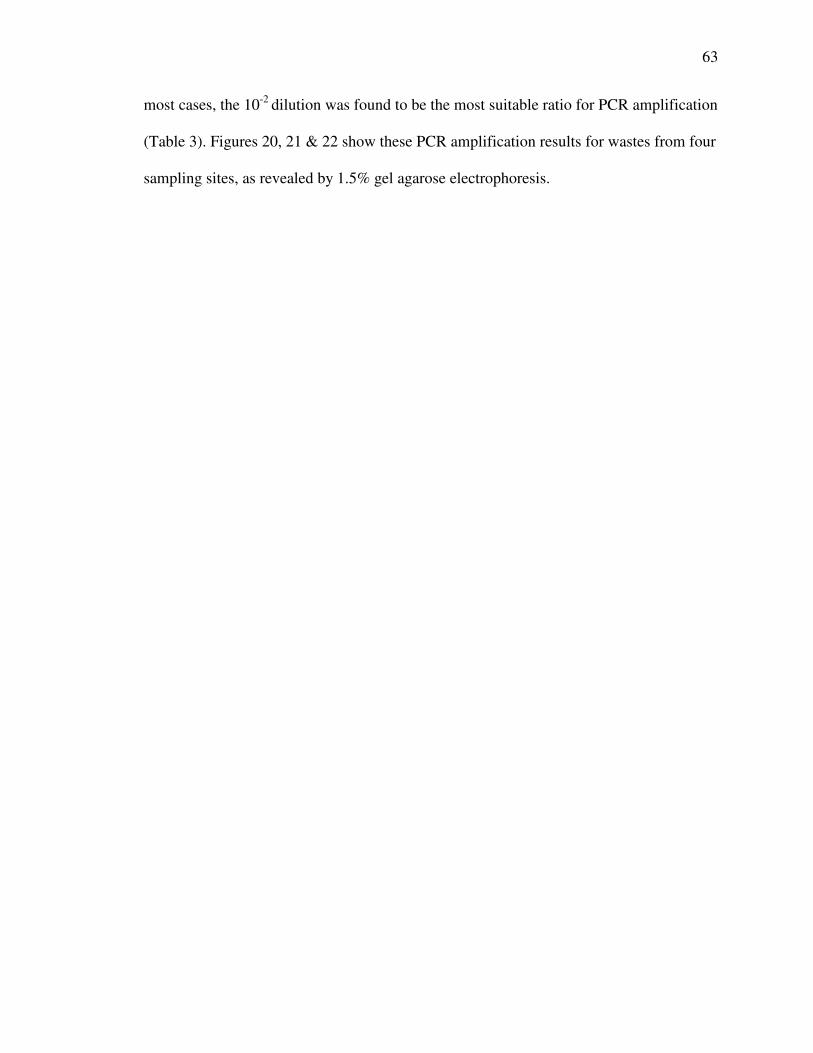
63
most cases, the 10-2 dilution was found to be the most suitable ratio for PCR amplification
(Table 3). Figures 20, 21 & 22 show these PCR amplification results for wastes from four
sampling sites, as revealed by 1.5% gel agarose electrophoresis.
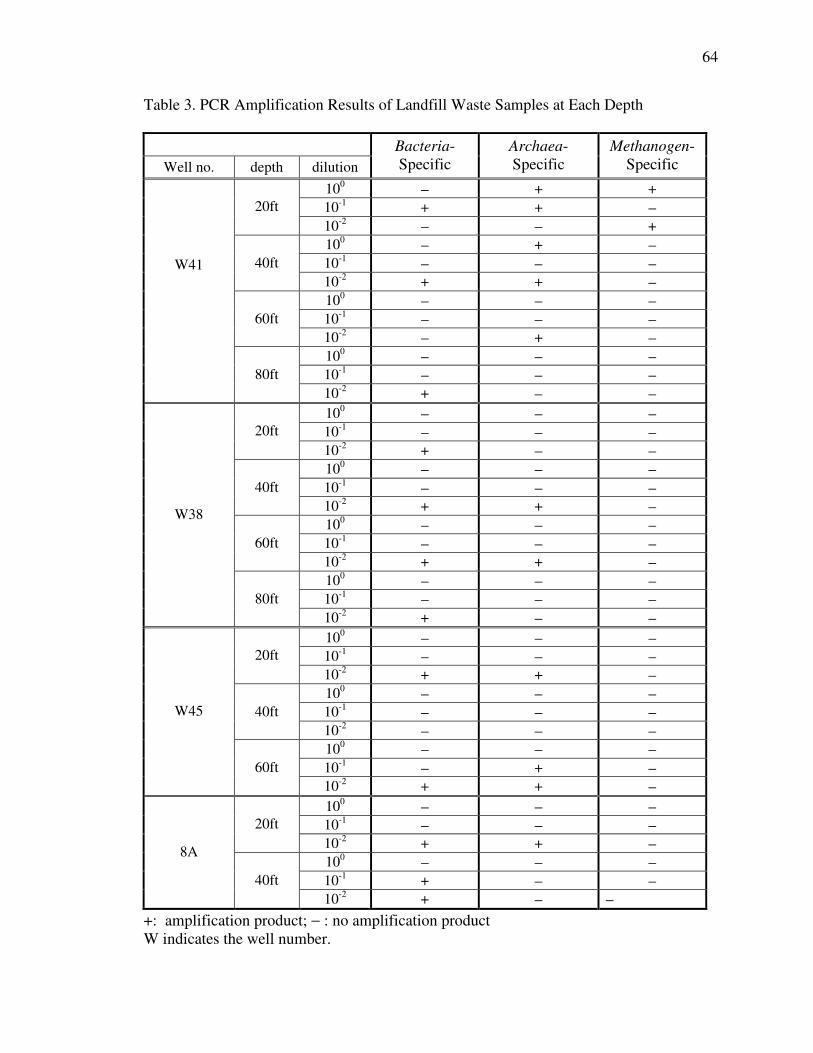
64
Table 3. PCR Amplification Results of Landfill Waste Samples at Each Depth
Well no. depth dilution Bacteria-Specific
Archaea-Specific
Methanogen-Specific
100 − + + 10-1 + + − 20ft 10-2 − − + 100 − + − 10-1 − − − 40ft 10-2 + + − 100 − − − 10-1 − − − 60ft 10-2 − + − 100 − − − 10-1 − − −
W41
80ft 10-2 + − − 100 − − − 10-1 − − − 20ft 10-2 + − − 100 − − − 10-1 − − − 40ft 10-2 + + − 100 − − − 10-1 − − − 60ft 10-2 + + − 100 − − − 10-1 − − −
W38
80ft 10-2 + − − 100 − − − 10-1 − − − 20ft 10-2 + + − 100 − − − 10-1 − − − 40ft 10-2 − − − 100 − − − 10-1 − + −
W45
60ft 10-2 + + − 100 − − − 10-1 − − − 20ft 10-2 + + − 100 − − − 10-1 + − −
8A
40ft 10-2 + − −
+: amplification product; − : no amplification product W indicates the well number.
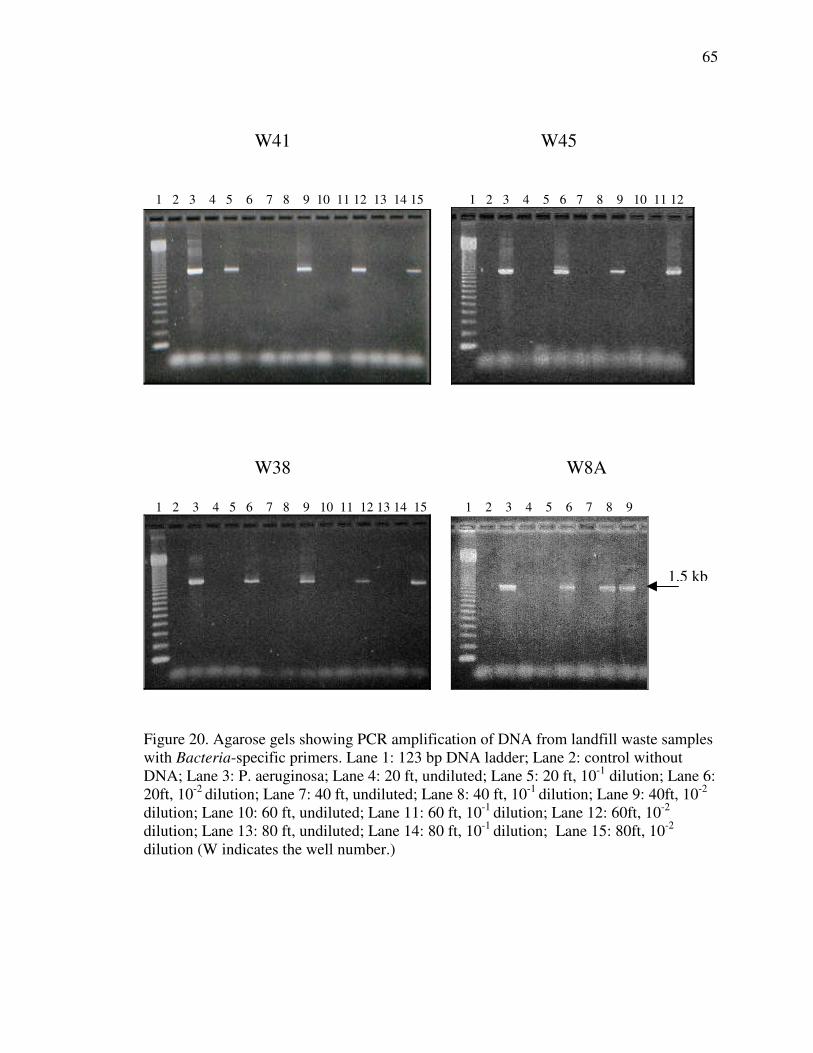
65
W41 W45
1 2 3 4 5 6 7 8 9 10 11 12 13 14 15 1 2 3 4 5 6 7 8 9 10 11 12 ����������������������������������
����� �
�
������������������������W38 W8A 1 2 3 4 5 6 7 8 9 10 11 12 13 14 15 1 2 3 4 5 6 7 8 9
����� ��������������������������������������
Figure 20. Agarose gels showing PCR amplification of DNA from landfill waste samples with Bacteria-specific primers. Lane 1: 123 bp DNA ladder; Lane 2: control without DNA; Lane 3: P. aeruginosa; Lane 4: 20 ft, undiluted; Lane 5: 20 ft, 10-1 dilution; Lane 6: 20ft, 10-2 dilution; Lane 7: 40 ft, undiluted; Lane 8: 40 ft, 10-1 dilution; Lane 9: 40ft, 10-2
dilution; Lane 10: 60 ft, undiluted; Lane 11: 60 ft, 10-1 dilution; Lane 12: 60ft, 10-2
dilution; Lane 13: 80 ft, undiluted; Lane 14: 80 ft, 10-1 dilution; Lane 15: 80ft, 10-2
dilution (W indicates the well number.) �
1.5 kb
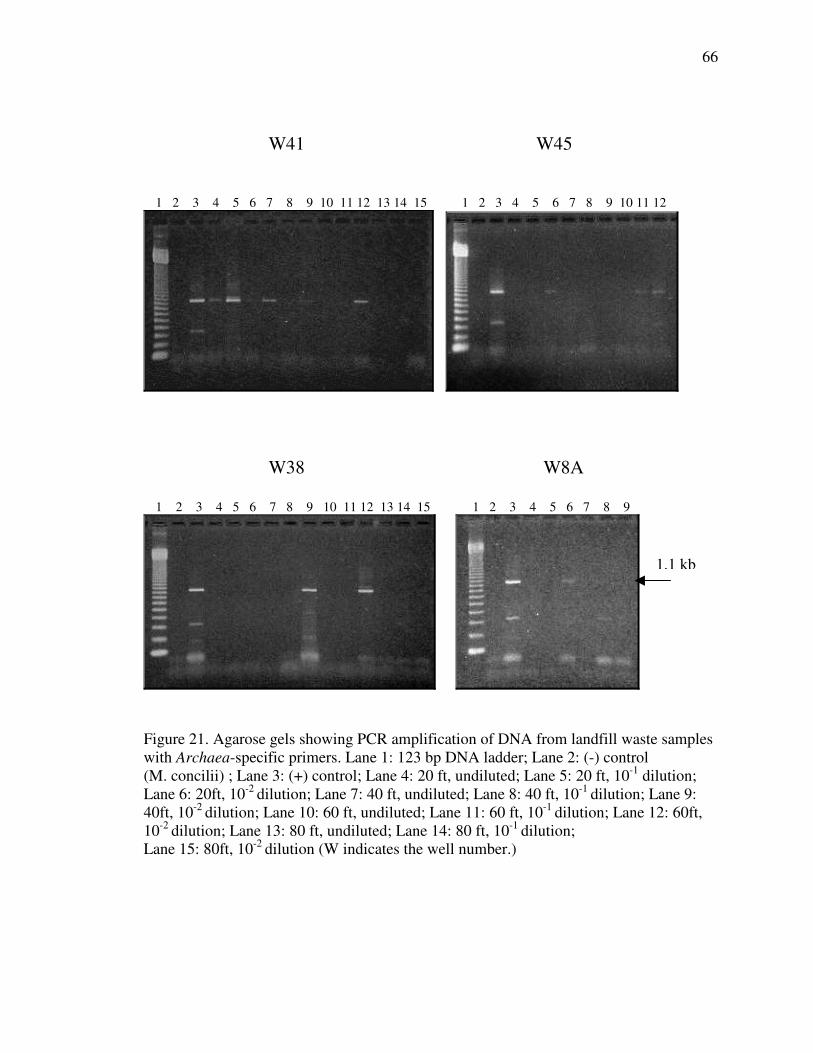
66
W41 W45
1 2 3 4 5 6 7 8 9 10 11 12 13 14 15 1 2 3 4 5 6 7 8 9 10 11 12�������������������������������������������
��� �
�
���������������������������W38 W8A 1 2 3 4 5 6 7 8 9 10 11 12 13 14 15 1 2 3 4 5 6 7 8 9����
����� �
Figure 21. Agarose gels showing PCR amplification of DNA from landfill waste samples with Archaea-specific primers. Lane 1: 123 bp DNA ladder; Lane 2: (-) control (M. concilii) ; Lane 3: (+) control; Lane 4: 20 ft, undiluted; Lane 5: 20 ft, 10-1 dilution; Lane 6: 20ft, 10-2 dilution; Lane 7: 40 ft, undiluted; Lane 8: 40 ft, 10-1 dilution; Lane 9: 40ft, 10-2 dilution; Lane 10: 60 ft, undiluted; Lane 11: 60 ft, 10-1 dilution; Lane 12: 60ft, 10-2 dilution; Lane 13: 80 ft, undiluted; Lane 14: 80 ft, 10-1 dilution; Lane 15: 80ft, 10-2 dilution (W indicates the well number.) �
1.1 kb
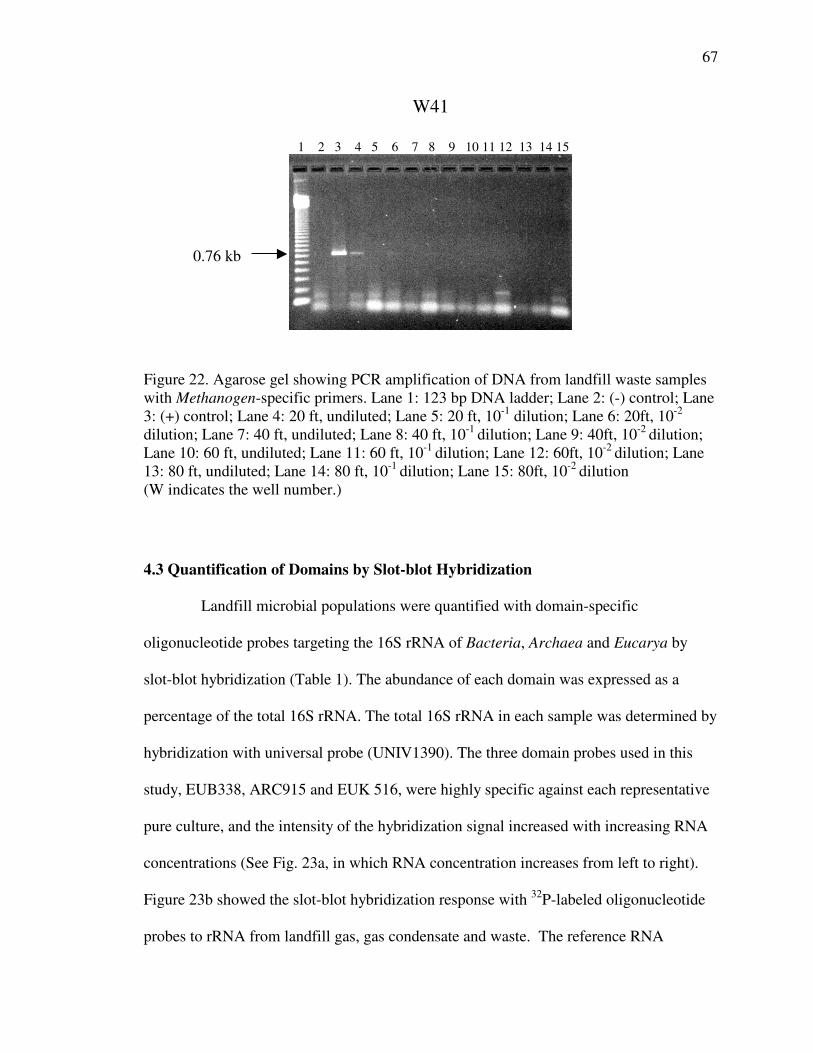
67
W41 1 2 3 4 5 6 7 8 9 10 11 12 13 14 15
�
Figure 22. Agarose gel showing PCR amplification of DNA from landfill waste samples with Methanogen-specific primers. Lane 1: 123 bp DNA ladder; Lane 2: (-) control; Lane 3: (+) control; Lane 4: 20 ft, undiluted; Lane 5: 20 ft, 10-1 dilution; Lane 6: 20ft, 10-2
dilution; Lane 7: 40 ft, undiluted; Lane 8: 40 ft, 10-1 dilution; Lane 9: 40ft, 10-2 dilution; Lane 10: 60 ft, undiluted; Lane 11: 60 ft, 10-1 dilution; Lane 12: 60ft, 10-2 dilution; Lane 13: 80 ft, undiluted; Lane 14: 80 ft, 10-1 dilution; Lane 15: 80ft, 10-2 dilution (W indicates the well number.) �
�
4.3 Quantification of Domains by Slot-blot Hybridization
Landfill microbial populations were quantified with domain-specific
oligonucleotide probes targeting the 16S rRNA of Bacteria, Archaea and Eucarya by
slot-blot hybridization (Table 1). The abundance of each domain was expressed as a
percentage of the total 16S rRNA. The total 16S rRNA in each sample was determined by
hybridization with universal probe (UNIV1390). The three domain probes used in this
study, EUB338, ARC915 and EUK 516, were highly specific against each representative
pure culture, and the intensity of the hybridization signal increased with increasing RNA
concentrations (See Fig. 23a, in which RNA concentration increases from left to right).
Figure 23b showed the slot-blot hybridization response with 32P-labeled oligonucleotide
probes to rRNA from landfill gas, gas condensate and waste. The reference RNA
0.76 kb

68
standard curves were obtained from the intensity of the hybridization signal at each
different RNA concentration from individual pure cultures (See for example, Fig. 24, 25
& 26).
Hybridization results are summarized in table 4 and the presented results are
average from 3 –5 replicate analyses. The results showed that in the landfill gas,
condensate, and waste, Bacteria were dominant and the relative contribution of Bacteria
remained quite similar among landfill samples (Gas: 85.9% ± 2.4%; Gas condensate:
86.8% ± 7.9%; and Waste: 86.5% ± 4.3%, where ± indicates the standard deviation, as
shown Table 4 & Fig. 27). Archaea comprised a small but substantial component in the
gas condensate (7.2% ± 1.4 %). In the raw waste materials, response levels for Archaea
were lower (2.1% ± 0.61%), while they were not detected in the gas. Eucarya were only
detected in waste materials (13.1% ± 3.1%). Overall, the relative abundances of three
domain populations in the landfill did not show any distinct pattern between relatively
young wastes (approximately 3 year-old: Wells No. 28, 33, 38, &41) and old wastes
(approximately 10 year-old: Wells No. 8A & 45, see Fig. 28). The three domain probes
counted for most of the rRNA quantified with the universal probe. The sum of the three
domain probes for landfill gas, gas condensate, and wastes were 84.6%, 94% and 101.9
%, respectively. These quantitative hybridization results for the landfill environment will
be compared with those found by other researchers for natural anaerobic environments
and anaerobic digesters in the discussion section.
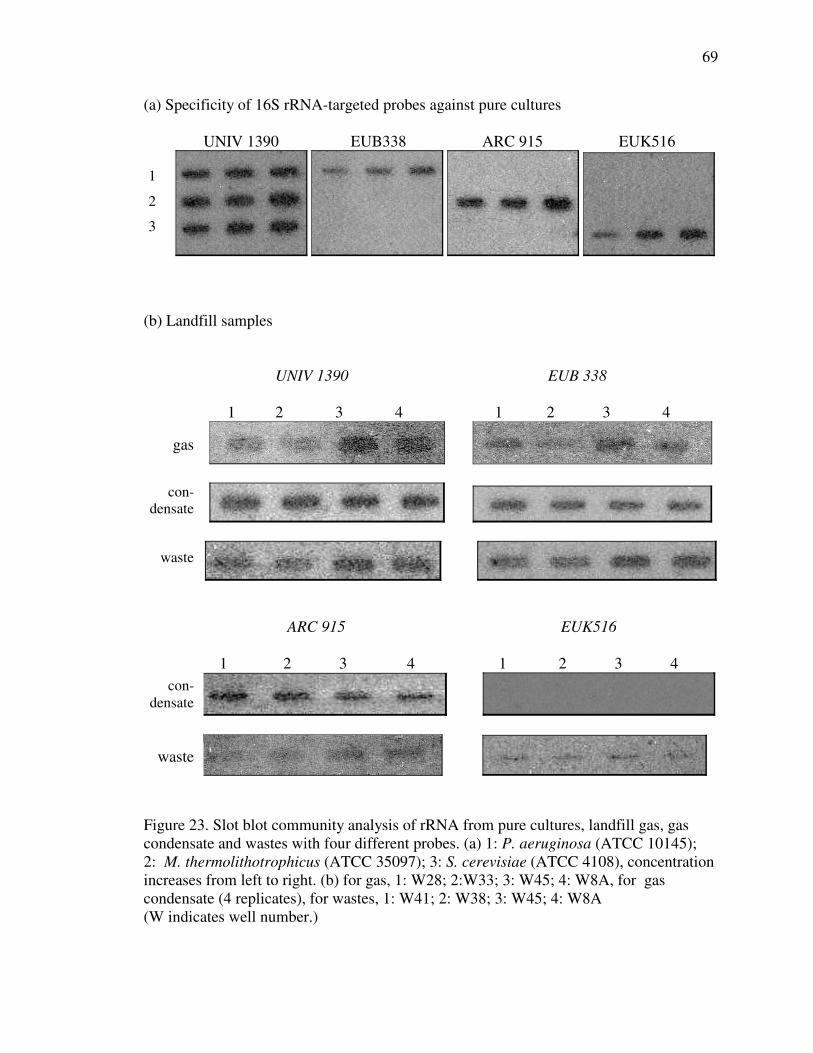
69
(a) Specificity of 16S rRNA-targeted probes against pure cultures
UNIV 1390 EUB338 ARC 915 EUK516
(b) Landfill samples UNIV 1390 EUB 338 1 2 3 4 1 2 3 4
ARC 915 EUK516
1 2 3 4 1 2 3 4
�
Figure 23. Slot blot community analysis of rRNA from pure cultures, landfill gas, gas condensate and wastes with four different probes. (a) 1: P. aeruginosa (ATCC 10145); 2: M. thermolithotrophicus (ATCC 35097); 3: S. cerevisiae (ATCC 4108), concentration increases from left to right. (b) for gas, 1: W28; 2:W33; 3: W45; 4: W8A, for gas condensate (4 replicates), for wastes, 1: W41; 2: W38; 3: W45; 4: W8A (W indicates well number.) �
gas
con- densate
waste
��1
2
3�
con- densate
waste
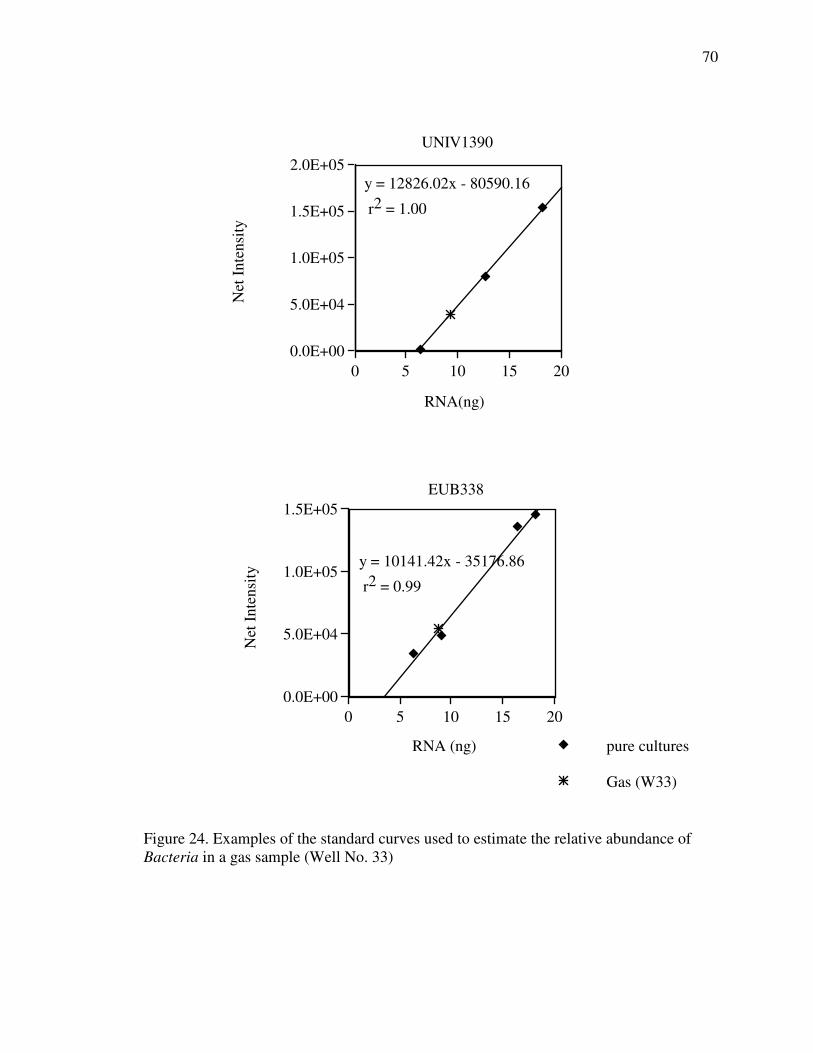
70
Figure 24. Examples of the standard curves used to estimate the relative abundance of Bacteria in a gas sample (Well No. 33)
0.0E+00
5.0E+04
1.0E+05
1.5E+05
2.0E+05
Net
Inte
nsity
0 5 10 15 20
RNA(ng)
y = 12826.02x - 80590.16
r2 = 1.00
UNIV1390
0.0E+00
5.0E+04
1.0E+05
1.5E+05
Net
Inte
nsity
0 5 10 15 20
RNA (ng)
y = 10141.42x - 35176.86
r2 = 0.99
EUB338
Gas (W33)
pure cultures
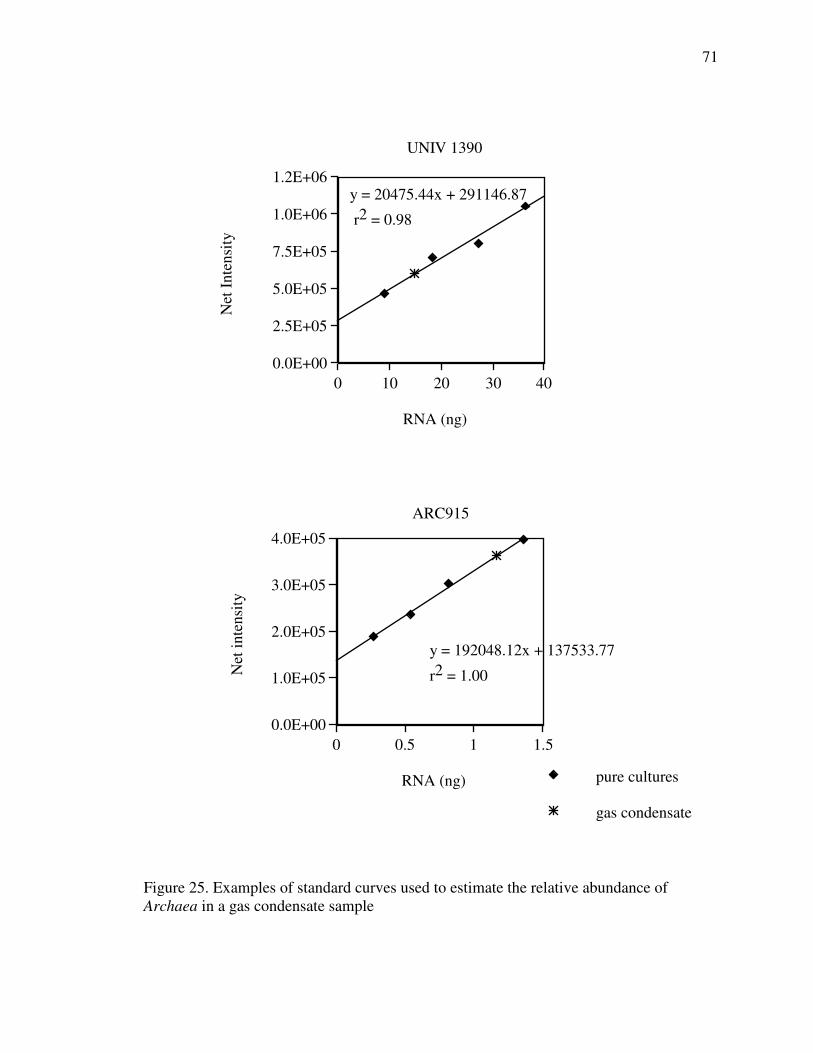
71
Figure 25. Examples of standard curves used to estimate the relative abundance of Archaea in a gas condensate sample
0.0E+00
2.5E+05
5.0E+05
7.5E+05
1.0E+06
1.2E+06
Net
Inte
nsity
0 10 20 30 40
RNA (ng)
y = 20475.44x + 291146.87
r2 = 0.98
UNIV 1390
0.0E+00
1.0E+05
2.0E+05
3.0E+05
4.0E+05
Net
inte
nsity
0 0.5 1 1.5
RNA (ng)
y = 192048.12x + 137533.77
r2 = 1.00
ARC915
gas condensate
pure cultures
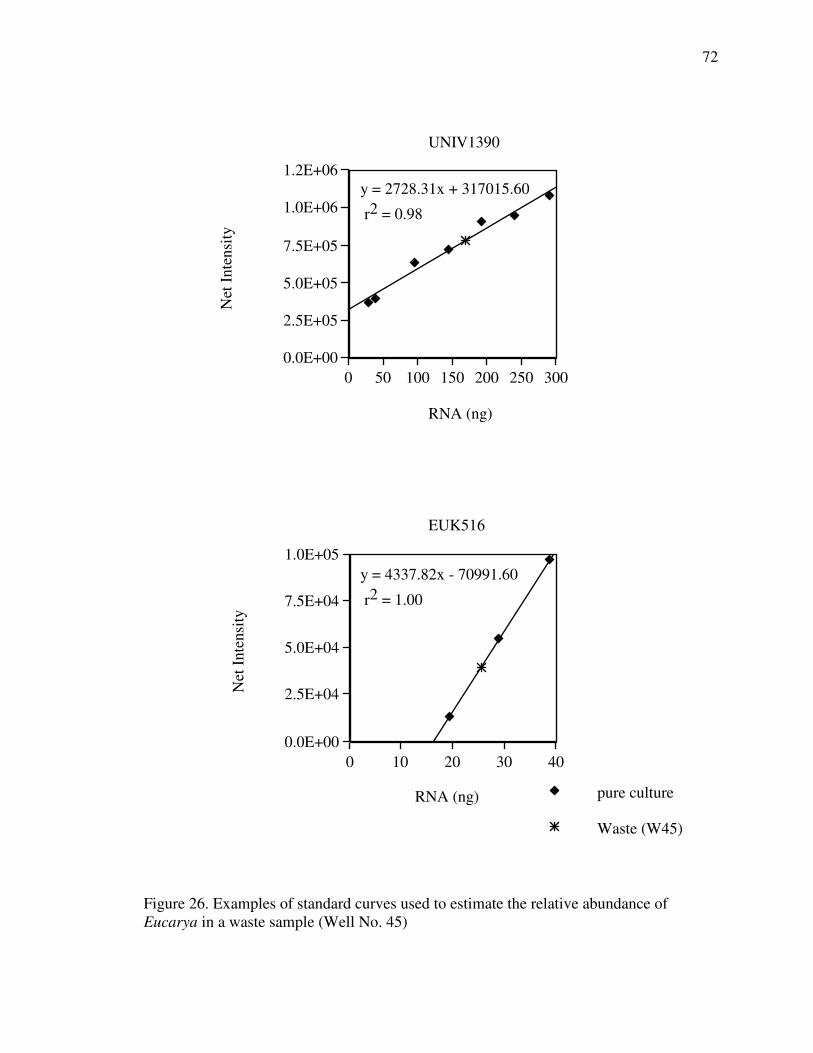
72
Figure 26. Examples of standard curves used to estimate the relative abundance of Eucarya in a waste sample (Well No. 45)
0.0E+00
2.5E+05
5.0E+05
7.5E+05
1.0E+06
1.2E+06
Net
Inte
nsity
0 50 100 150 200 250 300
RNA (ng)
y = 2728.31x + 317015.60
r2 = 0.98
UNIV1390
0.0E+00
2.5E+04
5.0E+04
7.5E+04
1.0E+05
Net
Inte
nsity
0 10 20 30 40
RNA (ng)
y = 4337.82x - 70991.60
r2 = 1.00
EUK516
Waste (W45)
pure culture
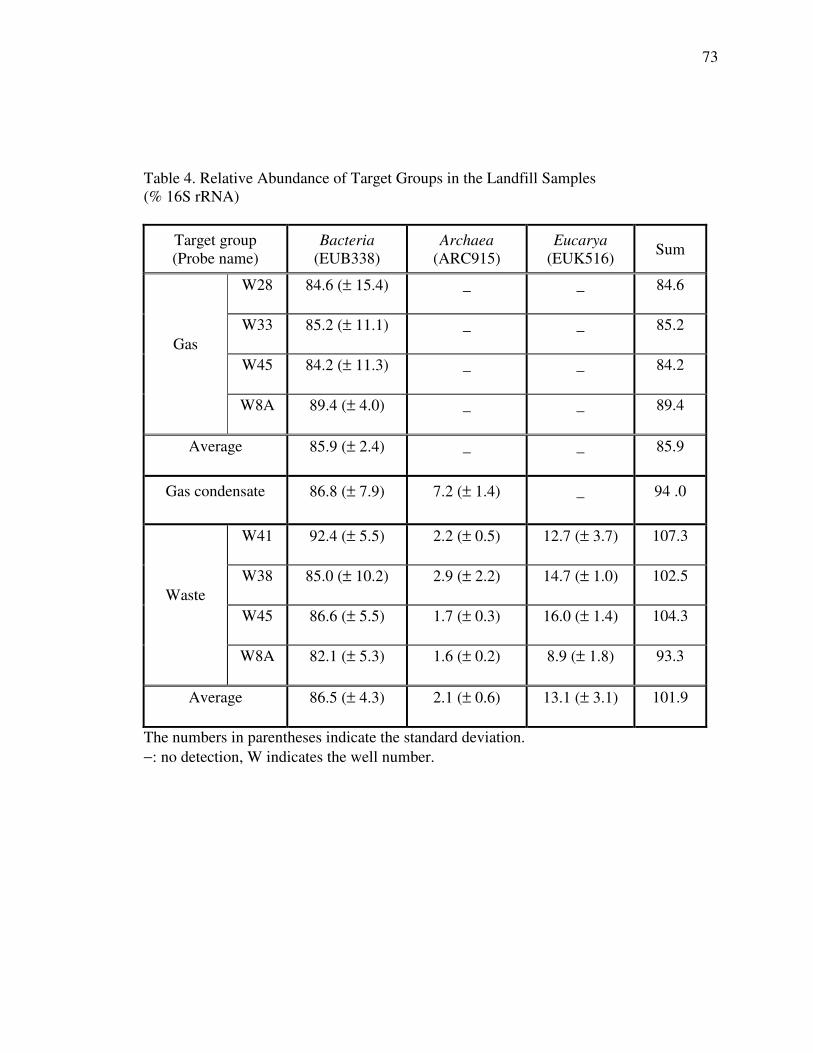
73
Table 4. Relative Abundance of Target Groups in the Landfill Samples (% 16S rRNA)
Target group (Probe name)
Bacteria (EUB338)
Archaea (ARC915)
Eucarya (EUK516) Sum
W28 84.6 (± 15.4) _ _ 84.6
W33 85.2 (± 11.1) _ _ 85.2
W45 84.2 (± 11.3) _ _ 84.2 Gas
W8A 89.4 (± 4.0) _ _ 89.4
Average 85.9 (± 2.4) _ _ 85.9
Gas condensate 86.8 (± 7.9) 7.2 (± 1.4) _ 94 .0
W41 92.4 (± 5.5) 2.2 (± 0.5) 12.7 (± 3.7) 107.3
W38 85.0 (± 10.2) 2.9 (± 2.2) 14.7 (± 1.0) 102.5
W45 86.6 (± 5.5) 1.7 (± 0.3) 16.0 (± 1.4) 104.3 Waste
W8A 82.1 (± 5.3) 1.6 (± 0.2) 8.9 (± 1.8) 93.3
Average 86.5 (± 4.3) 2.1 (± 0.6) 13.1 (± 3.1) 101.9
The numbers in parentheses indicate the standard deviation. −: no detection, W indicates the well number.
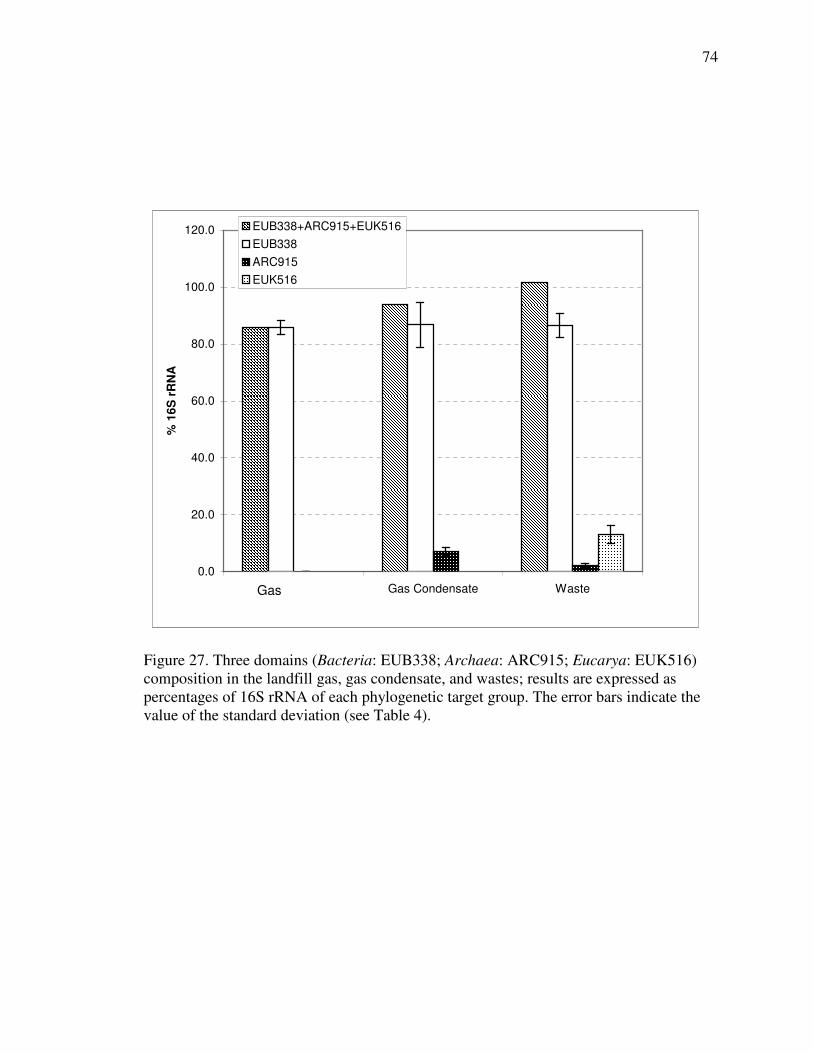
74
0.0
20.0
40.0
60.0
80.0
100.0
120.0
Gas Condensate WasteGas
% 1
6S r
RN
A
EUB338+ARC915+EUK516EUB338ARC915EUK516
Figure 27. Three domains (Bacteria: EUB338; Archaea: ARC915; Eucarya: EUK516) composition in the landfill gas, gas condensate, and wastes; results are expressed as percentages of 16S rRNA of each phylogenetic target group. The error bars indicate the value of the standard deviation (see Table 4). �
�
�
�
�
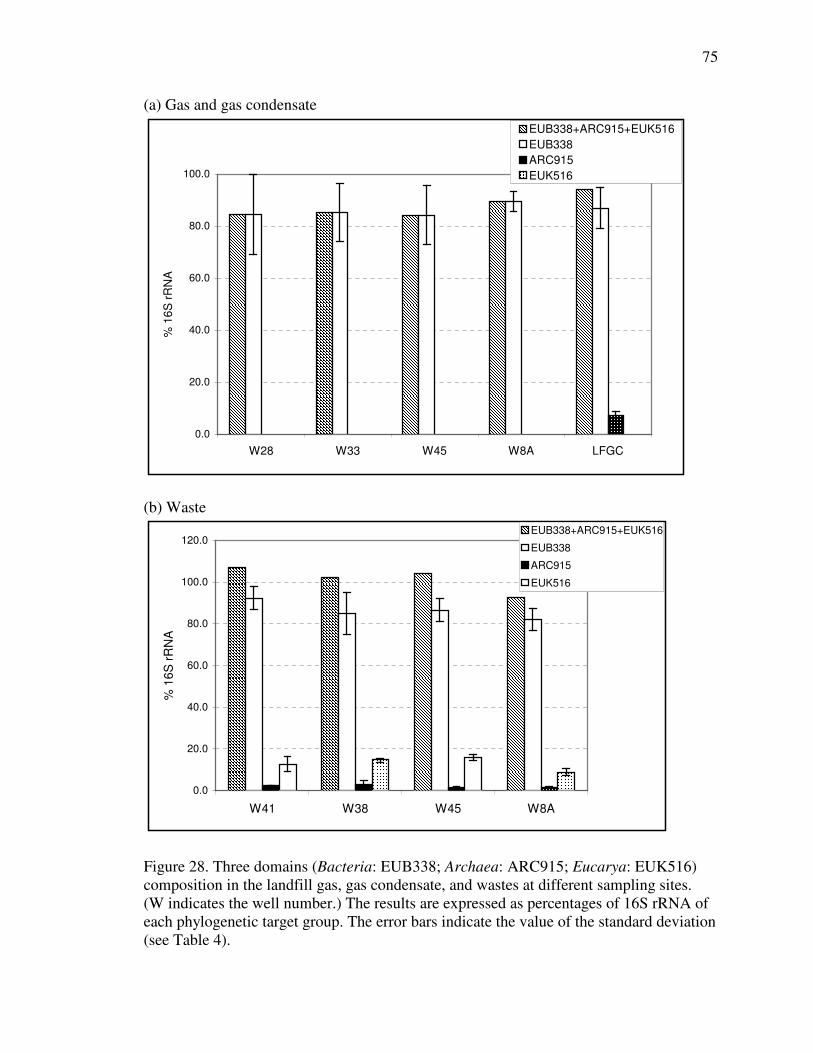
75
(a) Gas and gas condensate
0.0
20.0
40.0
60.0
80.0
100.0
W28 W33 W45 W8A LFGC
% 1
6S rR
NA
EUB338+ARC915+EUK516EUB338ARC915EUK516
(b) Waste
0.0
20.0
40.0
60.0
80.0
100.0
120.0
W41 W38 W45 W8A
% 1
6S rR
NA
EUB338+ARC915+EUK516
EUB338
ARC915
EUK516
�
Figure 28. Three domains (Bacteria: EUB338; Archaea: ARC915; Eucarya: EUK516) composition in the landfill gas, gas condensate, and wastes at different sampling sites. (W indicates the well number.) The results are expressed as percentages of 16S rRNA of each phylogenetic target group. The error bars indicate the value of the standard deviation (see Table 4).
76
5. Discussion
Detection, distribution and relative abundance of Bacteria, Archaea and Eucarya
in the landfill environment: The present study found that Bacteria dominated in the
landfill populations at least in terms of rRNA representation. The relative abundance of
Bacteria found by hybridization was approximately 86-87%. Also, bacterial 16S rRNA
was detected throughout all landfill samples, except in one of the gas samples by PCR
amplification (Well No. 28). In a previous study (Barry and Kim, 2000), the cell numbers
were only 4.3 to 196/mL in the landfill gas phase, while 3×10⁶/mL to 9 ×10⁶/mL in the
landfill gas condensate (See Appendix B for detailed information on this study). It is
suspected that, due to the low cell numbers in the gas stream, only Bacteria were detected
in the present study, i.e. the cell numbers of other groups may have been below the limit
of detection. Other sampling protocols could later be found to yield detectable levels of
archaeal biomass.
Archaea seemed to be a minor component of the microbial community at the
landfill site in the present study (7.2% in the gas condensate, 2.1% in the waste).
Archaeal 16S rRNA was detected in the gas condensate and wastes, but not in the gas
stream by PCR amplification. No prior study of this kind has been done in the landfill
environment, thus it is difficult to make direct comparisons, but the present study is
comparable with other studies from natural anaerobic ecosystems. Specifically, studies in
deep-sea sediments (1500 m deep, Vetriani, et al., 1999), two deep, anaerobic and
alkaline aquifers (316m, and 1,270m below surface, Fry, et al., 1997), marine arctic
sediments (Ravenschlag, et al., 2001), and Lake Michigan sediments (MacGregor, et al.,
77
1997), all found that Bacteria were dominant and Archaea were present in only limited
amounts (1.8 –10%) based on relative rRNA abundances.
Along with anaerobic niches, Archaea have been most frequently isolated from
extreme environments such as at high temperature, high salinity, and extremes of pH.
Numerous studies found an unexpected diversity of Archaea in terrestrial and marine
hydrothermal systems as well. For example, Barns, et al. (1994, 1996) found a great
phylogenetic diversity in archaeal rDNA clones recovered from a Yellowstone National
Park hot spring. The sediment was � 74°C at the site of sampling. Also, Takai and Sako
(1999) found a great phylogenetic diversity in archaeal rDNA clones recovered from a
shallow marine hydrothermal vent and an acidic hot spring in Japan. The effluent vent
water temperature was 128°C and the temperature of the sediments was 25-75°C. The
acidic hot spring environment in this study could be one of the most extreme habitats for
life due to its high temperature and strong acidity (pH 2.8). However, it seems the
Bacteria clearly dominated in most of these environments (Reysenbach, et al., 1998;
Harmsen, et al., 1997; Hugenholtz, et al., 1998; Takai & Sako, 1999).
In the present study, PCR amplification results showed no distinct pattern with
respect to the presence of Archaea as related to depth within the landfill. Consistent with
these results, the depth-related profiles of 16S archaeal rRNA in natural ecosystems
seems to vary in different studies as well. McDonald, et al. (1999) performed PCR
amplification with Archaea-specific primers (using the same primers as the present study,
i.e., 1Af and 1100Ar) in British bog peat, and found the presence of Archaea only below
8cm depth. Likewise, Archaea abundance generally increased in the deeper, anoxic
regions in permanently cold marine sediments from the Arctic Ocean (Sahm, et al.,
78
1998). However, MacGregor, et al. (1997) found Archaea abundance decreased with
depth in Lake Michigan sediments. In addition, Archaea abundances in deep-sea
sediment in the northwestern Atlantic Ocean (Vetriani, et al., 1999) and coastal marine
sediment from Aarhus Bay, Denmark (Sahm, et al., 1999) varied with depth. The present
study did not measure the relative abundances of Archaea with depth, but PCR
amplification results showed variability in the detection of Archaea as a function of
depth, and this variability in detection may be related to abundance.
In the landfill, the organic portion of waste is anaerobically broken down,
producing gases, mainly methane and carbon dioxide. To identify methanogens, PCR
amplification was performed with methanogen-specific primers. Methanogens were
identified only in the landfill gas condensate and in one of the waste samples (Well No.
41 at 20 ft (6. 1 m) below the landfill surface). This suggests that methanogens may not
be the major member of the Archaea in the landfill waste, an observation that is
supported by previous research. Qian and Barlaz (1996) measured hydrolytic, acetogenic
and methanogenic bacteria along with total anaerobes from different kinds of landfill
wastes (grass, leaves, food wastes) by the most probable number (MPN) technique. Their
results showed that methanogens were only a small portion (less than 0.2%) of total
anaerobes. Hemicellulolytic organisms accounted for the major portion of total
anaerobes. Also, in the natural anaerobic ecosystems studied by others, methanogens
were detected in only limited amounts (Hales, et al., 1996; McDonald, et al., 1999).
As described earlier, methanogens use a severely limited number of substrates and
have low growth rates. Also, it seems that the members of the Bacteria domain carry out
most of the functions in the food web in the anaerobic environments (Huang, et al.,
79
2002). This may explain the low abundance of Archaea (including methanogens) in the
landfill environment. Another possible explanation for the non-detection of Archaea
(including methanogens) in some landfill samples is that the probes used in the present
study may have been only limited applicability. As discussed earlier, probes are designed
based on known sequences, thus the probes used in the present study may not detect
certain novel microorganisms in the landfill samples. Further study is required to
understand the diversity and role of Archaea, especially methanogens, despite their
apparently low numbers in the present study.
Eucaryotic rRNA was only detected in landfill wastes, where they contributed
approximately 13% of the signal of the universal probe. The origin of Eucarya in the
wastes is unknown in the present study. However, several possible explanations exist. For
example, numerous studies have reported the presence of anaerobic protozoa in landfills.
Finlay and Fenchel (1991) isolated anaerobic protozoa, with symbiotic methanogens
(probably Methanobacterium formicicum) in municipal landfill material. Röling, et al.
(2001) found archaeal profiles that were clearly related to a methanogenic endosymbiont
of an anaerobic protozoan in a landfill leachate-polluted aquifer. Also, protozoa have
been detected in deep subsurface sediments (Sinclair and Ghiorse, 1989) and in relatively
shallow subsurface sediments in many different regions (Ghiorse and Wilson, 1988).
Further, protozoa possibly exist in an anaerobic groundwater from deep aquifers (Fry, et
al., 1997).
Eucaryotic RNA may also be associated with fungi. Anaerobic fungi have been
found in the rumen (Akin, et al., 1983; Bauchop, 1979; Orpin, 1975) and have been
reported to attack and degrade lignified plant tissues resistant to ruminal bacteria (Akin,
80
et al., 1983). Fungi also were detected in deep subsurface sediments by Sinclair and
Ghiorse (1989), and in relatively shallow subsurface sediments by Ghiorse and Wilson
(1988). Anaerobic fungi could play an important role in the landfill ecosystem, because
anaerobic fungi can degrade recalcitrant lingnocelluolosic substrates. Barlaz, et al. (1989)
enumerated cellulolytic and hemicellulolytic bacteria in refuse by an MPN (most
probable number) technique, but, they found no evidence of anaerobic cellulolytic fungi
in a refuse sample.
Based on rRNA sequence comparison, mold, animals and plants belong to the
Eucarya domain (Woese and Fox, 1977). Therefore, it is possible that the Eucarya signal
in wastes of the present study comes at least in part from mold, animal or plant sources in
waste materials rather than organisms involved in the degradation of wastes. Overall,
there is little information about the nature of eucaryotes in landfill wastes, but their
presence in landfills and other anaerobic natural ecosystems suggests that further studies
are needed to determine the role(s) that these microorganisms may play.
Technical considerations: Since little prior study focused on landfill microbiology,
the techniques used in the present study, such as the cell collection method for landfill
gas and the nucleic acid extraction protocols for landfill gas and wastes, were chosen
mainly for their simplicity based on references. Therefore, it will be worthwhile to
compare different methods in future studies. For example, a filtration method was used to
collect cells from landfill gas in this study. However, it seems likely that limited sample
size contributed to the lack of positive response to certain subsets of the anaerobic
community (e.g. Archaea). Therefore, it is suggested that application of a different
81
sampling method, such as a liquid impingement method, may improve collection
efficiency.
The extraction of nucleic acids from the environment is an essential step in all
studies of microbial community analysis by molecular methods. A particular challenge is
that RNA is easily degraded by RNases during the extraction process, and this makes it
more difficult to study environmental samples. The present study successfully extracted
nucleic acids from landfill samples. However, compared with landfill gas and gas
condensate samples, nucleic acids from waste needed extensive purification steps. In
addition, heterogeneity of wastes makes it more difficult to find a suitable purification
method. As described earlier, different lysis and purification methods affect the results of
any analysis of the microbial community structure. In the landfill environment, because
of a lack of comparative studies, it is unclear what effect the different lysis and
purification methods have on the study results. In particular, some methanogens, e.g.
Methanosarcina spp., have unusual outer cell layers (polysaccharide sacculus), which
might lead to difficulties in nucleic acid extraction (Balch, et al., 1979). This may have
contributed to the infrequency with which methanogens were detected in the present
study. However, the intent of the present study was not focused on comparison of
different extraction methods, and so this will be considered in the future.
Alm, et al. (2000) examined the effects on hybridization that resulted from the
presence of humic substances and DNA in the RNA extracts. They demonstrated that the
response in rRNA-targeted oligonucleotide probe hybridizations decreased as the
concentrations of DNA and humic substances in RNA extracts increased. However, they
observed that normalizations with a universal probe should help overcome this limitation,
82
because the decrease of hybridization signal by humic substances and DNA showed fairly
uniform behavior for different target sites. Some of the sum percentages of the three
domains in the present study were greater than 100%, an observation that has been
reported in other studies (Delong, et al., 1992; Ogram, et al., 1995; Shi, et al., 1999). This
may be due to partial degradation of sites for universal-probe annealing in some samples
(Ogram, et al., 1995). Further study would be needed to explore this concern.
Comparison of microbial community structures of landfill gas, gas condensate,
and waste: The sampling of landfill wastes is technically challenging as described
previously. In the present study, landfill gas and landfill gas condensate were used to
study the landfill microbial community. The results suggested that gas and gas
condensates could provide representative samples for analysis. It is believed that this is
the first report on investigation of the landfill microbial community using gas or gas
condensate coupled with molecular techniques. Recently, however, several studies
evaluated the landfill environment by using molecular techniques, but these studies
examined the landfill leachate (Daly, et al., 2000; Röling, et al., 2001; Huang, et al.,
2002; Van Dyke and McCarthy, 2002), or were limited to cellulolytic bacteria in a low-
level radioactive waste disposal site (Lockhart, et al., 2002). In the studies of Daly, et al.
(2000) and Van Dyke and McCarthy (2002), the authors designed the PCR primers for
phylogenetic subgroups of sulfate-reducing bacteria, and cellulose-degrading bacteria. In
particular, Daly, et al. (2000) mentioned that, due to the difficulty of sampling of landfill
wastes, leachate was used as the source for samples in their study. The study by Röling,
et al. (2000) focused on leachate contamination rather than waste degradation, while the
83
study by Huang, et al. (2002) examined the impact of leachate recirculation on microbial
communities by studying leachate.
However, the microbial community of leachate is likely different from that of the
landfill environment, because, in addition to inorganic compounds and heavy metals,
leachate contains high levels of organic constituents. These factors are important, for
example, metals are inhibitory to methanogens (Muller and Steiner, 1988). In addition,
unlike the present study, Huang, et al. (2002) found that methanogen-like rDNAs were
dominant in the archaeal library of the leachate from the recirculating landfill they
studied.
The extremely high and varied organic carbon load together with long retention
times in leachate may lead high diversity of certain microorganism groups. For example,
the study by Daly, et al. (2000) found an unexpected high level of diversity among
sulfate-reducing bacteria (SBR) in landfill leachate. SBR can compete with methanogens
for electron donors such as acetate and H2, and have the potential to inhibit
methanogenesis (Gurijala and Suflita, 1993; Harvey, et al., 1997). Daly, et al. believed
that leachate conditions favor to fermentative microorganisms for producing various
volatile fatty acids that serve as substrates for SBR. Then they suggested that the scale of
landfill sites and their extreme heterogeneity would promote microbial diversity. In
addition, because leachate results from the percolation of water through the site, this may
explain the high diversity of SBR in leachate. The inhibition of methanogenesis by
sulfate has been found in landfill waste (Gurijala and Suflita, 1993), however, no
comprehensive study has been done of SBR in landfills, therefore it will be considered in
future.
84
Landfills are often compared with anaerobic digesters. However, they are quite
different from the waste environment. Anaerobic digesters are simple concrete tanks in
which sludges are placed and allowed to decompose anaerobically. The hydraulic
retention times in a digester are typically 30-60 days. Applications of anaerobic digesters
are the treatment of liquid or sludge wastes from municipal and industrial sources, and
for the stabilization of wastewater sludge (Tchobanoglous, 1979). However, unlike an
engineered anaerobic digester (often operated under optimum conditions), the landfill
environment is extremely heterogeneous, contains high solids with relatively little
moisture, and has a retention time orders of magnitude greater than a digester. Clearly,
this can be expected to lead to a different microbial population. Nonetheless, a
comparison of results between there two environments can provide valuable insight into
the factors affecting community dynamics.
A few studies (Raskin, et. al., 1994b; Raskin, et al., 1995; Griffin, et al., 1998)
have evaluated the microbial community structure in anaerobic digesters by hybridization
with 16S rRNA targeted probes. As in the present research, these studies found that
Bacteria constituted the majority of the microorganisms in the anaerobic digester, while
Archaea were present in limited amounts. However, since conditions in anaerobic
digesters did not favor the growth of non-methanogenic Archaea (e.g. extreme
halophiles, thermoacidophiles, the Archaeoglobales, the Thermococcales, and the
thermophiles placed in the Crenarchaeota kingdom; Woese, et al., 1990), these authors
suggested that no Archaea other than methanogens were expected to be present in the
anaerobic digester. Also, they confirmed that the sum of the methanogenic signals was
relatively close in magnitude to the signal of the Archaea-specific probe. However, in the
85
present study, methanogens were only detected in landfill gas condensate and one waste
sample. Further analysis is needed to compare the microbial community of the landfill
with that of the anaerobic digester.
The present study shows that microbial populations from landfill gas are easily
collected and analyzed, and that it is possible to apply molecular techniques to landfill
gas samples. More information on microbial community structure could be obtained by
using additional molecular techniques, such as hybridization with group-specific probes,
or sequencing. For example, Raskin, et al. (1994a) designed eight probes which targeted
the phylogenetically defined groups of methanogens. Also, Devereux, et al. (1992)
designed a set of hybridization probes for quantifying different groups of the gram-
negative mesophilic sulfate reducing bacteria (SRB), further Van Dyke and McCarthy
(2002) designed the probes for the six major phylogenetic groups of SRB. By using these
group-specific probes, detailed community information could be obtained.
Also, 16S rDNA sequencing analysis could provide more information on the
diversity of microorganisms in landfills. New probes or primers could be designed based
on this new sequence information. Detailed procedures for retrieval of rRNA sequence
information and probe design for environmental samples is well addressed in the
literature (Amann, et al., 1995). As described earlier, probes can only be designed based
on known sequences, and therefore the probes used in the present study may not have
detected previously uncharacterized microorganisms in landfill samples. It will be
worthwhile in the future to design new probes based on more extensive knowledge of
landfill samples.
86
Another possible application of molecular techniques is florescence in situ
hybridization (FISH). Combined with microscopy, such as scanning confocal laser
microscopy (SCLM), FISH allows the determination of cell morphology and the analysis
of spatial distributions in situ (Amann, et al., 1995). As discussed earlier, in anaerobic
systems, microorganisms depend highly on other microorganisms. Therefore,
understanding spatial relationships within landfill samples will help to understand
associations between microorganisms.
The present study focused on culture-independent molecular techniques. However,
it is often impossible to infer the physiological role of organisms based only on their
phylogenetic positions (Etchebehere, et al., 2002). To overcome this limitation, it may be
necessary to consider the inclusion of conventional cultivation methods in future studies
to overcome this limitation. Finally, the protocols developed in the present study could be
used to monitor in situ microbial activity using landfill gas in order to provide
information for site management, for example to optimize “bioreactor landfill” operation.
A bioreactor landfill is a sanitary landfill that uses enhanced microbiological process to
transform and stabilize the readily and moderately decomposable organic waste
constituents within five to ten years of bioreactor process implementation. The
underlying philosophy for a bioreactor landfill is to keep the waste sufficiently wet, such
as through leachate recirculation, in order to maximize the biodegradation process
(O’Brien, Elements 2004). By using protocol developed in the present study, landfill gas
and gas condensate could be collected on regular basis and results from microbial
community analysis can help to operate “bioreactor landfill”.

87
A better understanding of microbial populations in landfills is important to improve
municipal solid waste management. This will help to reduce the time required for
stabilization of MSW in the landfill, and will result in smaller and reusable landfills. The
present study should provide the foundation for a comprehensive investigation of the
microbial ecology involved in landfill waste degradation. Information from slot-blot
hybridization and PCR amplification should be used as references for future studies of
the landfill environment.
88
6. Conclusions
The following general conclusions can be drawn from this study.
1. This study demonstrated that microorganisms from landfill gas and gas
condensates can be successfully collected, and nucleic acids can be extracted for
application of molecular techniques, such as PCR amplification and rRNA slot-blot
hybridization.
2. This study found that Bacteria dominated in the landfill populations. The relative
abundance of Bacteria found by hybridization was approximately 86-87%. Also,
Bacterial 16S rRNA was detected throughout all landfill samples, except in one of the gas
samples by PCR amplification.
3. Archaea were a minor component in the landfill environment. 16S rRNA was
detected in the gas condensate and wastes, but not in the gas stream by PCR
amplification. Also, hybridization results showed Archaea comprised 7. 2 % in the gas
condensate and 2.1 % in the raw waste materials, while they were not detected in the gas.
Lack of detection in the gas is believed to be a result of low sampling volumes rather than
an indication of complete absence, but further testing is required before a definitive
conclusion can be reached.
4. Methanogens were identified only in the landfill gas condensate and in one waste
sample using PCR amplification. This suggests that methanogens may be the minor
component of the Archaea domain in the landfill waste, and possibly in landfill gas. This
result is different from what researchers have typically encountered in other engineered
systems like anaerobic digesters.
89
5. Eucaryotic rRNA was only detected in landfill wastes, where their relative
abundance was approximately 13% based on relative rRNA contents.
6. The present study suggests that gas and gas condensates could provide
representative samples for studying the landfill environment.
7. The present study should provide useful tools for description of the landfill
microbial community, and add to our understanding of microbial community structure in
landfills.
90
7. Future Work
On the basis of the present study, the following lines of research show promise for the
future.
1. Application of different gas collection methods, and different lysis and
purification methods for nucleic acid extraction, to optimize the analysis of microbial
community structure and function.
2. Application of group-specific 16S rRNA hybridization probes, e.g., methanogenic
groups and sulfate reducing bacteria groups, to describe the detailed microbial
community of the landfill.
3. Sequencing analysis, which will help to identify new microorganisms and to
design new probes that will allow development of detailed diversity information. In
particular, new probes may help to detect unknown microorganisms in landfill
environment.
4. Application of the florescence in situ hybridization (FISH), which allows analysis
of the spatial relationships in the landfill microbial community.
5. A combination of cultivation methods and molecular methods should be used to
better understand the ecological roles of organisms in landfills.
6. Application of the protocols developed in the present study to develop tools for
site management, for example to optimize “bioreactor landfill” operation.
91
List of References Akin, D. E., G. L. R. Gordon, and J. P. Hogan. 1983. Rumen bacterial and fungal degradation of digitaria pentzii grown with and without sulfur. Appl. Environ. Microbiol. 46:738-748. Alm, E. W., D. Zheng, and L. Raskin. 2000. The presence of humic substances and DNA in RNA extracts affects hybridization results. Appl. Environ. Microbiol. 66:4547-4554. Alvarez, A. J., M. P. Buttner, G. A. Toranzos, E. A. Dvorsky, A. Toro, T. B. Heikes, L. E. Mertikas, and L. D. Stetzenbach. 1994. Use of solid-phase PCR for enhanced detection of airborne microorganisms. Appl. Environ. Microbiol. 60:374-376. Amann, R. I., B. J. Binder, R. J. Olson, S. W. Chisholm, R. Devereux, and D. A. Stahl. 1990. Combination of 16S rRNA-targeted oligonucleotide probes with flow cytomertry for analyzing mixed microbial populations. Appl. Environ. Microbiol. 56:1919-1925. Amann, R. I., N. Springer, W. Ludwig, H.-D. Görtz, and K.-H. Schleifer. 1991. Identification and phylogeny of uncultured bacterial endosymbionts. Nature (London) 351:161-164. Amann, R. I., W. Ludwig, and K.-H. Schleifer. 1995. Phylogenetic identification and in situ detection of individual microbial cells without cultivation. Microbiol. Rev. 59:143-169. Atlas, R., and R. Bartha. 1998. Microbial ecology: Fundamentals and application, 4th ed. Benjamin/Cummings Publishing Company Inc., Menlo Park, CA. Balch, W. E., and R. S. Wolfe. 1976. New approach to the cultivation of methanogenic bacteria: 2-Mercaptoethanesulfonic acid (HS-CoM)-dependent growth of Methanobacterium ruminantium in a pressurized atmosphere. Appl. Environ. Microbiol. 32:781-791.
92
Balch, W. E., G. E. Fox, L. J. Magrum, C. R. Woese, and R. S. Wolfe. 1979. Methanogens: Reevaluation of unique biological group. Microbiol. Rev. 43:260-296. Barlaz, M. A. 1997. Microbial studies of landfills and anaerobic refuse decomposition, p. 541-557. In C. J. Hurst, G. R. Knudsen, M. I. McInerney, L. D. Stetzenbach, and M. V. Walter (ed.), Manual of environmental microbiology. American Society for Microbiology Press, Washington, D.C. Barlaz, M. A., Schaefer, D. M., and R. K. Ham. 1989. Bacterial population development and chemical characteristics of refuse decomposition in a simulated sanitary landfill. Appl. Environ. Microbiol. 55:55-65. Barns, S. M., C. F. Delwiche, J. D. Palmer, and N. R. Pace. 1996. Perspectives on archaeal diversity, thermophily and monophyly from environmental rRNA sequences. Proc. Natl. Acad. Sci. USA 93:9188-9193. Barns, S. M., R. E. Fundyga, M. W. Jeffries, and N. R. Pace. 1994. Remarkable archaeal diversity detected in a Yellowstone National Park hot spring environment. Proc. Natl. Acad. Sci. USA 91:1609-1613. Barry, R. C., and M. Kim. 2000. Using landfill gas to study solid waste microbial communities. In abstracts of the 100th General Meeting of the American Society for Microbiology 2000. American Society for Microbiology, Washington, D.C. Bartlett, M. S., S. H. Vermund, R. Jacobs, P. J. Durant, M. M. Shaw, J. W. Smith, X. Tang, J.-J. Lu, B. Li, S. Jin, and C.-H. Lee. 1997. Detection of Pneumocystis carinii DNA in air samples: Likely environmental risk to susceptible persons. J. Clinic. Microbiol. 35:2522-2513. Bauchop, T. 1979. Rumen anaerobic fungi of cattle and sheep. Appl. Environ. Microbiol. 38:148-158. Bej, A. K., J. L. DiCesare, L. Haff, and R. M. Atlas. 1991a. Detection of Escherichia coli and Shigella spp. in water by using the polymerase chain reaction and gene probes for uid. Appl. Environ. Microbiol. 57:1013-1017.
93
Bej, A. K., M. H. Mahbubani, and R. M. Atlas. 1991b. Amplification of nucleic acids by polymerase chain reaction (PCR) and other methods and their applications. Critic. Rev. Biochem. Mol. Biol. 26:301-334. Bej, A. K., M. H. Mahbubani, J. L. DiCesare, and R. M. Atlas. 1991c. Polymerase chain reaction-gene probe detection of microorganisms by using filter-concentrated samples. Appl. Environ. Microbiol. 57:3529-3534. Benson, D., D. J. Lipman, and J. Ostell. 1993. GenBank. Nucleic Acids Res. 21:2963-2965. Bolton, N. 2003. Landfill gas-to-energy: Solving problems. MSW Manage. 13:38-44. Booker, T. J., and R. K. Ham. 1982. Stabilization of solid waste in landfills. J. Environ. Eng. ASCE 108:1089-1100. Brauns, L. A., M. C. Hudson, and J. D. Oliver. 1991. Use of the polymerase chain reaction in detection of culturable and nonculturable Vibrio vulnificus cells. Appl. Environ. Microbiol. 57:2651-2655. Brock, T. D., M. T. Madigan, J. M. Martinko, and J. Parker. 1994. Biology of Microorganisms. 7th ed., Prentice-Hall. Englewood Cliffs, NJ. Burr, M.D., and Pepper. I. L. 1997. Variability in presence-absence scoring of AP PCR fingerprints affects computer matching of bacteria isolates. J. Microbiol. Methods 29:63-68. Buttner, M. P., K. Willeke, and S. A. Grinshpun. 1997. Sampling and analysis of airborne microorganisms, p. 629-640. In C. J. Hurst, G. R. Knudsen, M. J. McInerney, L. D. Stetzenbach, M. V. Walter (ed.), Manual of environmental microbiology. American Society for Microbiology, Washington, D. C. Chatigny, M. A., J. M. Macher, H. A. Burge, and W. R. Solomon. 1989. Sampling airborne microorganisms and aeroallergens, p. 199-220. In S. V. Hering (ed.), Air sampling instruments, 7th ed. American Conference of Governmental Industrial Hygienists, Cincinnati.
94
Cox, C. S. 1987. The aerobiological pathway of microorganisms. John Wiley & Sons, Ltd., Chichester, England. Daims, H., A. Brühl, R. Amann, K.-H. Schleifer, and M. Wagner. 1999. The domain-specific probe EUB338 is insufficient for the detection of all Bacteria: Development and evaluation of a more comprehensive probe set. Syst. Appl. Microbiol. 22:434-444. Daly, K., R. J. Sharp, and A. J. McCarthy. 2000. Development of oligonucleotide probes and PCR primers for detecting phylogenetic subgroups of sulfate-reducing bacteria. Microbiol. 146:1693-1705. DeCosemo, G. A. L., I. W. Stewart, W. D. Griffiths, and J. S. Deans. 1992. The assessment of airborne microorganisms. J. Aerosol Sci. 23(Suppl. 1):S683-S686. DeLong, E. F. 1992. Archaea in coastal marine environments. Proc. Natl. Acad. Sci. USA 89:5685-5689. Devereux, R., M. E. Hines, and D. A. Stahl. 1996. S-cycling: Characterization of natural communities of sulfate-reducing bacteria by 16S rRNA sequence comparisons. Microbiol. Ecol. 32:283-292. Devereux, R., M. D. Kane, J. Winfrey, and D. A. Stahl. 1992. Genus- and group-specific hybridization probes for determination and environmental studies of sulfate-reducing bacteria. Syst. Appl. Microbiol. 15:601-609. Dunbar, J., S. Takala, S. M. Barns, J. A. Davis, and C. R. Kuske. 1999. Levels of bacterial community diversity in four arid soils compared by cultivation and 16S rRNA gene cloning. Appl. Environ. Microbiol. 65:1662-1669. Edwards, T., and B. C. McBride. 1975. New method for the isolation and identification of methanogenic bacteria. Appl. Microbiol. 29:54-0545. Embley, T. M., B. J. Finlay, R. H. Thomas, and P. L. Dyal. 1992. The use of rRNA sequences and fluorescent probes to investigate the phylogenetic positions of the anaerobic ciliate Metopus palaeformis and its archaeobacterial endosymbiont. J. Gen. Microbiol. 138:1497-1487.
95
Etchebehere, C., M. I. Errazquin, P. Dabert, and L. Muxi. 2002. Community analysis of a denitrifying reactor treating landfill leachate. FEMS Microbiol. Ecol. 40:97-106. Farquhar, G. H., and F. A. Rovers. 1973. Gas production during refuse decomposition. Water Air Soil Pollut. 2:483-495. Felske, A., E. Engelen, U. Nübel, and H. Backhaus. 1996. Direct ribosome isolation from soil to extract bacterial rRNA for community analysis. Appl. Environ. Microbiol. 62:4162-4167. Ferry, J. G. 1993. Fermentation of acetate, p. 305-334. In J. G. Ferry (ed.), Methanogenesis. Chapman & Hall, Inc., New York. Finlay, B. J., and T. Fenchel. 1991. An anaerobic protozoon, with symbiotic methanogens, living in municipal landfill material. FEMS Microbiol. Ecol. 85:169-180. Fry, N. K., H. K. Fredrickson, S. Fishbain, M. Wagner, and D. A. Stahl. 1997. Population structure of microbial communities associated with two deep, anaerobic, alkaline aquifers. Appl. Environ. Microbiol. 63:1498-1504. Gausing, K. 1977. Regulation of ribosome production in Escherichia coli: Synthesis and stability of ribosomal RNA and of ribosomal protein messenger RNA at different growth rates. J. Mol. Biol. 115:335-354. Ghiorse, W. C., and J. T. Wilson. 1988. Microbial ecology of the terrestrial subsurface. Adv. Appl. Microbiol. 33:107-172. Giovannoni, S. J. 1991. The polymerase chain reaction, p. 177-203. In E. Stackebrandt and M. Goodfellow (ed.), Nucleic acid techniques in bacterial systematics. John Wiley & Sons, Inc., New York. Griffin, M. E., K. D. McMahon, R. I. Mackie, and L. Raskin. 1998. Methanogenic population dynamics during start-up of anaerobic digesters treating municipal solid waste and biosolids. Biotechnol. Bioeng. 57:342-354.
96
Gurijala, K. R., and J. M. Suflita. 1993. Environmental factors influencing methanogenesis from refuse in landfill samples. Environ. Sci. Technol. 27:1176-1181. Gurtner, C., J. Heyrman, G. Piñar, W. Lubitz, J. Swings, and S. Rölleke. 2000. Comparative analysis of the bacterial diversity on two different biodeteriorated wall paintings by DGGE and 16S rDNA sequence analysis. Int. Biodeter. Biodegr. 46:229-239. Hales, B. A., C. Edwards, D. A. Ritchie, G. Hall, R. W. Pickup, and J. R. Saunders. 1996. Isolation and identification of methanogen-specific DNA from blanket bog peat by PCR amplification and sequences analysis. Appl. Environ. Microbiol. 62:668-675. Harmsen, H. J., D. Prieur, and C. Jeanthon. 1997. Distribution of microorganisms in deep-sea hydrothermal vent chimneys investigated by whole-cell hybridization and enrichment culture of thermophilic subpopulations. Appl. Environ. Microbiol. 63:2876-2883. Harvey, R. W., J. M. Suflita, and M. J. McInerney. 1997. Overview of issues in subsurface and landfill microbiology, p. 523-525. In C. J. Hurst, G. R. Knudsen, M. J. McInerney, L. D. Stetzenbach, and M. V. Walter (ed.), Manual of environmental microbiology. American Society for Microbiology, Washington, DC. Hickman, H. L. Jr. 1999. Principal of integrated solid waste management. American Academy of Environmental Engineers Publication. Hoaki, T. M., M. Nishijima, M. Kato, K. Adachi, S. Mizobuchi, N. Hanzawa, and T. Maruyama. 1994. Growth requirements of hyperthermophilic sulfur-dependent heterotrophic Archaea isolated from a shallow submarine geothermal system with reference to their essential amino acids. Appl. Environ. Microbiol. 60:2898-2904. Huang, L.-N., H. Zhou, Y.-Q. Chen, S. Luo, C.-Y. Lan, and L.-H. Qu. 2002. Diversity and structure of the archaeal community in the leachate of a full-scale recirculating landfill as examined by direct 16S rRNA gene sequence retrieval. FEMS Microbiol. Lett. 214:235-240. Hugenholtz, P., C. Pitulle, K. L. Hershberger, and N. R. Pace. 1998. Novel division level bacteria diversity in Yellowstone hot spring. J. Bacteriol. 180:366-376.
97
Hungate, R. E. 1950. The anaerobic mesophilic cellulolytic bacteria. Bacteriol. Rev. 14:1-49. Jones, W. J., D. P. Nagle Jr., and W. B. Whitman. 1987. Methanogens and the diversity of archaebacteria. Microbiol. Rev. 51:135-177. Kemp, P. F., S. Lee, and J. LaRoche. 1993. Estimating the growth rate of slowly growing marine bacteria from RNA content. Appl. Environ. Microbiol. 59:2594-2601. Kerkhof, L., and B. B. Ward. 1993. Comparison of nucleic acid hybridization and fluorometry for measurement of the relationship between RNA/DNA ratio and growth rate in a marine bacterium. Appl. Environ. Microbiol. 59:1303-1309. Kjelgaard, N. O., and C. G. Kurland. 1963. The distribution of soluble and ribosomal RNA as a function of growth rate. J. Mol. Biol. 6:341-348. Kortegast A. P., and A. R. Ampurch. 1997. Landfill site selection: A new approach to an old planning problem. Proceedings, ISEWA’97 World Conference. Wellington, New Zealand, International Solids Wastes Association. Copenhagen, Denmark. Kozdrój, J., and J. D. van Elsas. 2001. Structural diversity of microbial communities in arable soils of a heavily industrialized area determined by PCR-DGGE fingerprinting and FAME profiling. Appl. Soil Ecol. 17:31-42. Leff, L.G., J. R. Dana, J. V. McArthur, and L. J. Shimkets. 1995. Comparison of methods of DNA extraction from stream sediments. Appl. Environ. Microbiol. 61:1141-1143.
Lerman, L. S., S. G. Fischer, I. Hurley, K. Silverstein, and N. Lumelsky. 1984. Sequence determined DNA separations. Annu. Rev. Biophys. Bioeng. 13:399-423.
Lockhart, R., P. Humphreys, I. Beadle, and A. J. McCarthy. 2002. Molecular biological analysis of a low level radioactive waste disposal site. In abstracts of the 102th General Meeting of the American Society for Microbiology 2002. American Society for Microbiology, Washington, D.C.
98
Lodish, H., D. Baltimore, A. Berk, S. L. Zipursky, P. Matsudaira, J. Darnell. 1995. Molecular cell biology. 3rd ed. Science American Books Inc., New York. MacGregor, B. J., D. P. Moser, E. W. Alm, K. H. Nealson, and D. A. Stahl. 1997. Crenarchaeota in Lake Michigan sediment. Appl. Environ. Microbiol. 63:1178-1181. Maher, N., H. K. Dillon, S. H. Vermund, and T. R. Unnasch. 2001. Magnetic bead capture eliminates PCR inhibitors in samples collected from the airborne environment, permitting detection of Pneumocystis carinii DNA. Appl. Environ. Microbiol. 67:449-452. Maidak, B. L., N. Larsen, M. J. McCaughey, R. Overbeek, G. J. Olsen, and K. Fogel. 1994. The ribosomal database project. Nucleic Acids Res. 22:3485-3487. Maniatis, T., E. Fritsch, and J. Sambrook. 1982. Molecular Cloning: A laboratory Manual. Cold Spring Harbor Laboratory Press, Cold Spring Harbor, New York. Manz, W., R. Amann, W. Ludwig, M. Wagner, and K. H. Schleifer. 1992. Phylogenetic oligodeoxynucleotide probes for the major subclasses of proteobacteria; Problems and solution. Syst. Appl. Microbiol. 15:593-600. Marlowe, E. M., K. Josephson, and I. L. Pepper. 1999. Nucleic acid-based methods of analysis, p. 287-318. In R. M. Maier, I. L. Pepper, and C. P. Gerba (ed.), Environmental microbiology. Academic Press, San Diego, CA. McDonald, J. R., M. Upton, G. Hall, R. W. Pickup, E. Edwards, J. R. Saunders, D. A. Ritchie, and J. C. Murrell. 1999. Molecular ecological analysis of methanogens and methanotrophs in blanket bog peat. Microbiol. Ecol. 38:225-233. Miller, T. L., and M. J. Wolin. 1974. A serum bottle modification of the Hungate techniques for cultivating obligate anaerobes. Appl. Environ. Microbiol. 27:985-987. Moore, W. E. C. 1966. Techniques for routine culture of fastidious anaerobes. Int. J. Syst. Bacteriol. 16:173.
99
Muilenberg, M. L. 1989. Aeroallergen assessment by microscopy and culture. Immunol. Allergy Clinic. North Am. 9:245-268. Muller, R., and A. Steiner. 1988. Influence of nickel and copper on anaerobic sludge digestion, p. 41-144. Poster Papers. 5th International Symposium on Anaerobic Digestion, Bologna, Italy. Müller, V., M. Blaut, and G. Gottschalk. 1993. Bioenergetics of methanogenesis, p. 361-406. In J. G. Ferry (ed.), Methanogenesis. Chapman & Hall, Inc., New York. Mullis, K. B., and F. A. Faloona. 1987. Specific synthesis of DNA in vitro via a polymerase-catalyzed chain reaction. Methods Enzymol. 155:335-351. Nevalainen, A., K. Willeke, F. Liebhaber, J. Pastuszka, H. Burge, and E. Henningson. 1993. Bioaerosol sampling, p. 417-492. In K. Willeke and P. A. Baron (ed.), Aerosol measurement: Principals, techniques, and applications. Van Nostrand Reinhold, New York. Nevalainen, A., J. Pastuszka, F. Liebhaber, and K. Willeke. 1992. Performance of bioaerosol samplers: Collection characteristics and sampler design consideration. Atmos. Environ. 26A:531-540. New Jersey Department of Environmental Protection. 2003. Division of Solid and Hazardous Wastes. [Online] www.state.nj.us/dep/dshw New York City Office of the Mayor. 2002. Press Release, July 31, 2002. Niemi, R. M., I. Heiskanen, K. Wallenius, and K. Lindström. 2001. Extraction and purification of DNA in rhizosphere soil samples for PCR-DGGE analysis of bacterial consortia. J. Microbiol. Methods 45:155-165. O’Brien, J. K. Elements 2004. The solid waste manager’s guide to the bioreactor landfill. MSW Manage. 13:12-16.
100
Ogram, A., W. Sun, F. J. Brockman, and J. K. Fredrickson. 1995. Isolation and characterization of RNA from low-biomass deep-subsurface sediments. Appl. Environ. Microbiol. 61:763-768. Olsson, M. C., H. Lidman, S. Latouche, A. Björkman, R. Roux, E. Linder, and M. Wahlgren. 1998. Identification of Pneumocystis carinii f. sp. hominis gene sequences in filtered air in hospital environments. J. Clinic. Microbiol. 36:1737-1740. Orpin, C. G. 1975. Studies another rumen flagellate Neocallimastix frontalis. J. Gen. Microbiol. 91:249-262. Pace, N. R., D. A. Stahl, D. J. Lane, and G. J. Olsen. 1986. The analysis of natural microbial populations by ribosomal RNA sequences. Adv. Microb. Ecol. 9:1-55. Parker, A. 1983. Behavior of wastes in landfill-leachate. In R. Holmes (ed.), Practical waste management. John Wiley & Sons Ltd., Chichester, England. Palmgren, U., G. Ström, P. Malmberg, and G. Blomquist. 1986. The Nuclepore filter method: A technique for enumeration of viable and nonviable airborne microorganisms. Am. J. Ind. Med. 10:325-327. Palmisano, A. C., B. S. Schwab, D. A. Maruscik. 1993. Hydrolytic enzyme activity in landfilled refuse. Appl. Microbiol. Biotechnol. 38:823-832. Picard, C., X. Ponsonnet, E. Paget, X. Nesme, and P. Simonet. 1992. Detection and enumeration of bacterial in soil by direct DNA extraction and polymerase chain reaction. Appl. Environ. Microbiol. 58:2717-2722. Pillai, S. D., K. L. Josephson, R. L. Bailey, C. P. Gerba, and I. L. Pepper. 1991. Rapid method for processing soil samples for polymerase chain reaction amplification of specific gene sequences. Appl. Environ. Microbiol. 57:2283-2286. Pohland, F. G. 1987. Critical review and summary of leachate and gas production from landfills. EPA/600/S2-86/073, US EPA hazardous Waste Engineering Research Laboratory, Cincinnati, OH.
101
Pohland, F. G. 1991. Fundamental principles and management strategies for landfill codisposal practice. Proceedings Sardinia 91 Third International Landfill Symposium, Vol. II, p. 1445-1460. Grafiche Galeati, Imola, Italy. Poulsen, K. G. Ballard, and D. A. Stahl. 1993. Use of rRNA fluorescence in situ hybridization for measuring the activity of single cells in young and established biofilms. Appl. Environ. Microbiol. 59:1354-1360. Qian, X., and M. A. Barlaz. 1996. Enumeration of anaerobic refuse-decomposing microorganisms on refuse constituents. Waste Manage. Res. 14:151-161. Raskin, L. J., M. Stromley, B. E. Rittmann, and D. A. Stahl. 1994a. Group-specific 16S rRNA hybridization probes to describe natural communities of methanogens. Appl. Environ. Microbiol. 60:1232-1240. Raskin, L., K. Poulsen, D. R. Noguera, and B. E. Rittmann. 1994b. Quantification of Methanogenic groups in anaerobic biological reactors by oligonucleotide probe hybridization. Appl. Environ. Microbiol. 60:1241-1248. Raskin, L., D. Zheng, M. E. Griffin, P. G. Stroot, and P. Misra. 1995. Characterization of microbial communities in anaerobic bioreactors using molecular probes. Antonie Leeuwenhoek 68:297-308. Ravenschlag, K., K. Sahm, and R. Amann. 2001. Quantitative molecular analysis of the microbial community in marine arctic sediments (Svalbard). Appl. Environ. Microbiol. 67:387-395. Reysenbach, A.-L., G.S. Wickham, and N. R. Pace. 1994. Phylogenetic analysis of the hyperthermophilic pink filament community in Octopus spring, Yellowstone National Park. Appl. Environ. Microbiol. 60:2113-2119. Rice, C. M., R. Fuchs, D. G. Higgins, P. J. Stoehr, and G. N. Cameron. 1993. The EMBL data library. Nucleic Acids Res. 21:2967-2971. Rodriquez, R. L., and R. C. Tait. 1983. Recombinant DNA techniques: An introduction. Benjamin/Cummings Publishing Company, Inc., Menlo Park, CA.
102
Röling, W. F. M., B. M. van Breukelen, M. Braster, B. Lin, and H. W. van Verseveld. 2001. Relationships between microbial community structure and hydrochemistry in a landfill leachate-polluted aquifer. Appl. Environ. Microbiol. 67:4619-4629. Sahm, K. and U.-G. Berninger. 1998. Abundance, vertical distribution, and community structure of benthic prokaryotes from permanently cold marine sediments (Svalbard, Arctic Ocean). Mar. Ecol. Prog. Ser. 165:71-80. Sahm, K. B., J. MacGregor, B. B. Jorgensen, and D. A. Stahl. 1999. Sulphate reduction and vertical distribution of sulphate-reducing bacteria quantified by rRNA slot-blot hybridization in a coastal marine sediment. Environ. Microbiol. 1:65-74. Saiki, R. K., S. Scharf, F. Faloona, K. B. Mullis, G. T. Horn, H. A. Erlich, and N. A. Arnheim. 1985. Enzymatic amplification of �-globin genomic sequences and restriction site analysis for diagnosis of sickle cell anemia. Science 230:1350-1354. Sambrook, J., E. F. Fritsch, and T. Maniatis. 1989. Molecular cloning; A laboratory manual, 2nd ed. Cold Spring Harbor Laboratory Press, Cold Spring Harbor, New York. Sandaa, R.-A., and V. Torsvik, and ∅∅∅∅. Enger. 2001. Influence of long-term heavy-metal contamination on microbial communities in soil. Soil Biol. Biochem. 33:287-295. Sessitsch, A., A. Weilharter, M. H. Gerzabek, H. Kirchmann, and E. Kandeler. 2001. Microbial population structures in soil particle size fractions of a long-term fertilizer field experiment. Appl. Environ. Microbiol. 67:4215-4224. Shi, Y., M. D. Zwolinski, M. E. Schreiber, J. M. Bahr, G. W. Sewell, and W. J. Hickey. 1999. Molecular analysis of microbial community structures in pristine and contaminated aquifer; Field and laboratory microcosm experiments. Appl. Environ. Microbiol. 65:2143-2150. Sinclair, J. L., and W. C. Ghiorse. 1989. Distribution of aerobic bacteria, protozoa, algae, and fungi in deep subsurface sediments. Geomicrobiol. J. 7:15-31.
103
Somerville, C. C., I. T. Knight, W. L. Straube, and R. R. Colwell. 1989. Simple, rapid method for direct isolation of nucleic acids from aquatic environments Appl. Environ. Microbiol. 55:548-554. Sowers, K. R., and K. M. Moll. 1995. Techniques for anaerobic growth, p. 15-48. K. R. Sowers, and H. J. Schreier (ed.), In Archaea: A laboratory manual, methanogens. Cold Spring Harbor Laboratory Press, Plainview, NY. Stahl, D A., B. Flesher, H. R. Mansfield, and L. Montgomery. 1988. Use of phylogenetically based hybridization probes for studies of ruminal microbial ecology. Appl. Environ. Microbiol. 54:1079-1084. Stahl, D. A. 1995. Application of phylogenetically based hybridization probes to microbial ecology. Mol. Ecol. 4: 535-542. Stahl, D. A. 1997. Molecular approaches for the measurement of density, diversity, and phylogeny, p. 102-114. In C. J. Hurst, G. R. Knudsen, M. J. McInerney, L. D. Stetzenbach, and M. V. Walter (ed.), Manual of environmental microbiology. American Society for Microbiology, Washington, DC. Stärk, K. D. C., J. Nicolet, and J. Frey. 1998. Detection of Mycoplasma hyopneumoniae by air sampling with a nested PCR assay. Appl. Environ. Microbiol. 64:543-548. Steffan, R. J., and R. M. Atlas. 1991. Polymerase chain reaction: Application in environmental microbiology. Ann. Rev. Microbiol. 45:137-161. Takai, K., and Y. Sako. 1991. A molecular view of archaeal diversity in marine and terrestrial hot water environments. FEMS Microbiol. Ecol. 28:177-188. Tchobanoglous, G. 1979. Wastewater engineering: Treatment, disposal, reuse, 2nd ed. McGraw-Hill, New York. Tchobanoglous, G., T. Hilary, and S. Vigil. 1993. Integrated solid waste management: Engineering principles and management issues. McGraw-Hill, New York.
104
Thomm, M., and H. P. Gohl. 1995. Isolation of RNA from methanogenic Archaea, p. 379-381. K. R. Sowers, and H. J. Schreier (ed.), In Archaea: A laboratory manual: Methanogens. Cold Spring Harbor Laboratory Press, Plainview, NY. Thorne, P. S., M. S. Kiekhaefer, P. Whitten, and K. J. Donham. 1992. Comparison of bioaerosol sampling methods in barns housing swine. Appl. Environ. Microbiol. 58:2543-2551. Tsai, Y. L., and B. H. Olson. 1992a. Detection of low numbers of bacterial cells in soils and sediments by polymerase chain reaction. Appl. Environ. Microbiol. 58:754-757. Tsai, Y. L., and B. H. Olson. 1992b. Rapid method for direct extraction of DNA from soil and sediments. Appl. Environ. Microbiol. 57:1070-1074. U.S. Environmental Protection Agency. 1991. Solid waste disposal facility criteria 40 CFR Parts 257-258. U.S. Environmental Protection Agency. Washington, D.C. U.S. Environmental Protection Agency. 1993. Solid waste disposal facility criteria, technical manual. EPA/530-R-93-017. U.S. Environmental Protection Agency. Washington, D.C. U.S. Environmental Protection Agency. 1995. Decision-Maker’s guide to solid waste management, 2nd ed., US Environmental Protection Agency. EPA/530-R-95-023. U.S. Environmental Protection Agency. Washington, D.C. U.S. Environmental Protection Agency. 1996. New source performance and emission guidelines for municipal solid waste landfills, 40 CFR Part 60. U.S. Environmental Protection Agency. Washington, D.C. U.S. Environmental Protection Agency. 2002. Municipal solid waste in the United States: 200 facts and figures. U.S. Environmental Protection Agency. Washington, D.C. U.S. Environmental Protection Agency. 2003. Landfill methane outreach program. [Online.] www.epa.gov/lmop.
105
Van Dyke, M. I., and A. J. McCarthy. 2002. Molecular biological detection and characterization of Clostridium populations in municipal landfill sites. Appl. Environ. Microbiol. 68:2049-2053. Vetriani, C., H. W. Jannasch, B. J. MacGregor, D. A. Stahl, and A.-L. Reysenbach. 1999. Population structure and phylogenetic characterization of marine benthic Archaea in deep-sea sediments. Appl. Environ. Microbiol. 65:4375-4384. Volossiouk, T., E. J. Robb, and R. N. Nazar. 1995. Direct DNA extraction for PCR-mediated assays of soil organisms. Appl. Environ. Microbiol. 61:3972-3976. Wagner, M., and R. Amann. 1997. Molecular techniques for determining microbial community structures in activated sludge, p. 61-72. In T. E. Cloete and N. Y. O. Muyima (ed.), Microbial community analysis: The key to the design of biological wastewater treatment systems. International Association of Water Quality. London, England. Woese, C. R., and G. E. Fox. 1977. Phylogenetic structure of the prokaryotic domain: The primary kingdoms. Proc. Natl. Acad. Sci. USA 74:5088-5090. Woese, C. R., O. Kandler, and L. Wheelis. 1990. Towards a natural system of organisms: proposal for the domains Archaea, Bacteria and Eucarya. Proc. Natl. Acad. Sci. USA 87:4576-4579. Wolin, M. J., and T. L. Miller. 1982. Interspecies hydrogen transfer: 15 Years later. ASM New. Am. Soc. Microbiol. 48:561-565. WSDE. 1987. Solid waste landfill design manual. Washington State Department of Ecology. Olympia, WA. Xia, J. Q., C. V. Yason, and F. S. B. Kibenge. 1995. Comparison of dot blot hybridization, polymerase chain reaction, and virus isolation for detection of bovine herpesvirus-1 (BHV-1) in artificially infected bovine semen. Can. J. Vet. Res. 59:102-109. Yang, C.-H., D. E. Crowley, and J. A. Menge. 2001. 16S rDNA Fingerprinting of rhizosphere bacterial communities associated with healthy and phytophthora infected avocado roots. FEMS Microbiol. Ecol. 35:129-136
106
Young, L. Y., and A. C. Frazer. 1987. The fate of lignin and lignin derived compounds in anaerobic environments. Geomicrobiol. J. 5:261-293. Zehnder, A. J. B. 1978. Ecology of methane formation. In R. Mitchell (ed.), Water pollution microbiology. John Wiley & Sons Inc., New York. Zheng, D. E., W. Alm, D. A. Stahl, and L. Raskin. 1996. Characterization of universal small-subunit rRNA hybridization probes for quantitative molecular microbial ecology studies. Appl. Environ. Microbiol. 62:4504-4513. Zinder, S. H. 1993. Physiological ecology of methanogens, p. 128-296. In J. G. Ferry (ed.), Methanogenesis. Chapman & Hall, Inc., New York.
107
Appendix A: Using Landfill Gas to Study Solid Waste Microbial Communities This is a summary of a poster presentation presented by R.C. Barry and M. Kim at the 100th General Meeting of the American Society for Microbiology 2000. The results from this preliminary investigation provided an initial conformation that landfill organisms are indeed brought to the surface with gas flows. Background During the summer of 1998, samples of landfill gas and landfill gas condensates were collected from four landfills located in the Mid-Atlantic regions of the United States. Samples were evaluated for the presence and viability of microorganisms. The facilities participating in this study were the Burlington County Landfill in Florence, NJ; the Middlesex County (Edgeboro) Landfill in East Brunswick, NJ; the Waste Management Tullytown Landfill in Fairless Hills, PA; and the Central Solid Waste Management Center in Sandtown, DE. All of these facilities have active gas collection systems that apply vacuum to networks of gas extraction wells. Samples were evaluated by direct count and MPN procedures as well as microscopic examination. Procedures Direct counts of landfill gas samples A gas sampling pump (Bendix type C115, 2 L/min nominal flow rate) was used to draw gas from well heads through a sterile membrane filter (Nucleopore, 2 �m polycarbonate). Gas flow rates were measured using a rotameter calibrated against a laboratory standard at Drexel University. The filters were then stained with either DAPI or Acridine orange using an adaptation of the protocols described by Kepner and Pratt (1994). Counts were made under epifluorescent microscope, and results extrapolated to estimate concentrations in the original gas sample. In addition, at the Edgeboro landfill, samples were collected to compare microbial concentrations in wells with high gas flow rates to wells with low gas flow rates. Direct counts of condensate Samples of landfill gas condensate were collected from the Burlington County and Tullytown landfills. Condensate from Burlington County was collected from a drainage network and so originated at several wells. Condensate from Tullytown came from a single well. Samples were transported in sterile containers at 4 °C and were stained directly using DAPI or Acridine orange. Samples were then passed through sterile membrane filters (2 �m polycarbonate) for viewing (Kepner and Pratt, 1994). A Petroff-Hauser cell counter was also used to estimate microbial concentrations in the landfill gas condensate.
108
Chemical oxygen demand (COD) The COD of Burlington County landfill gas condensate was measured using the closed reflux colorimetric method (Standard Methods 522D, using Hach COD vials and a Spectronic Genesays 2 UV-Vis spectrophotometer). Where available, Landtec GEM-500 landfill gas analyzers and Landtec pitot-tube well heads owned by landfill operators were used to estimate landfill gas flow rates and composition. Most probable number (MPN) counts The 5-tube MPN method for total anaerobes described by Qian and Barlaz (1996) was used to estimate the number of viable bacteria in landfill gas and landfill gas condensate from the Burlington County landfill. Sterile syringes were used to withdraw 5 mL aliquots of landfill gas from sterile gas sampling lines, and the gas was then injected into serum bottles containing oxygen-free dilution buffer. Serial dilutions were prepared and used to inoculate vials of total anaerobe medium. The vials were incubated for 60 days; positive results were noted by visible changes in optical density. Results Findings are summarized in tables A and B. Significant concentrations of microorganisms were found in both landfill gas and landfill gas condensate. Direct count concentrations ranged from 4.3. to 196/mL in the gas phase, and from 3×10⁶/mL to 9×10⁶/ mL in the liquid condensate. MPN results for Burlington County samples were between 7 and 11 times lower than direct count results. Photomicrographs of DAPI stained particles from gas phase are shown in figure A, while microbes collected from the condensate are shown in figure B. Microbial assemblages, perhaps pieces of detached biofilms, were evident in samples collected from all sites, both in gas and in condensates. The condensate from Burlington County had a surprisingly high COD value of 14,400 mg/l, a result late verified by Burlington County during independent testing. A second round of sampling on March 2, 1999, showed a condensate COD of 18,800 mg/L and a pH of 4.26 (Leachate COD at the site is typically between 7,000 and 8,000 mg/L). The high COD and low pH are almost certainly the result of short-chain volatile fatty acids and related fermentation products condensing out of the gas phase along with the water. Reference Kepner, R. L., Jr., and J. R. Pratt. 1994. Use of fluorochromes for direct enumeration of total bacteria in environmental samples: past and present. Microbiol. Rev. 58:603-615. Qian, X., and M. A. Barlaz. 1996. Enumeration of anaerobic refuse-decomposing micro-organisms on refuse constituents. Was. Manage. Res. 14:151-161.

109
Table A. Direct Count and MPN Results for Landfill Gas
Facility Well Gas Flow (scfm)
Count (per mL)
Method
EW-98 20 72 AO EW-75 > 100 78 AO
Edgeboro Landfill East Brunswick, NJ
GW-26 73 124 AO
W-18 40 77 DAPI
W-1 N/A 4.3 DAPI
Burlington County, NJ
W-1 N/A 0.4 MPN
W-20 N/A 27 DAPI Tullytown
Fairless Hills, PA W-28 N/A 196 DAPI
Table B. MPN, Direct count, Chemical Oxygen Demand and pH Results for Landfill Gas Condensate
Facility Analysis Result
MPN 5 × 10⁵/ml
Petroff-Hause Count 3.3 × 10⁶/ml
Burlington County, NJ
(Sample Date 7/27/98)
COD 14,400 mg/l
COD 18,800 mg/l Burlington County, NJ
(Sample Date 3/2/99) pH 4.26
DAPI
8.8 × 10⁶/ml Tullytown Landfill
Fairless Hills, PA
(Sample Date 7/28/98) Petroff-Hauser Count 8.2 × 10⁶/ml
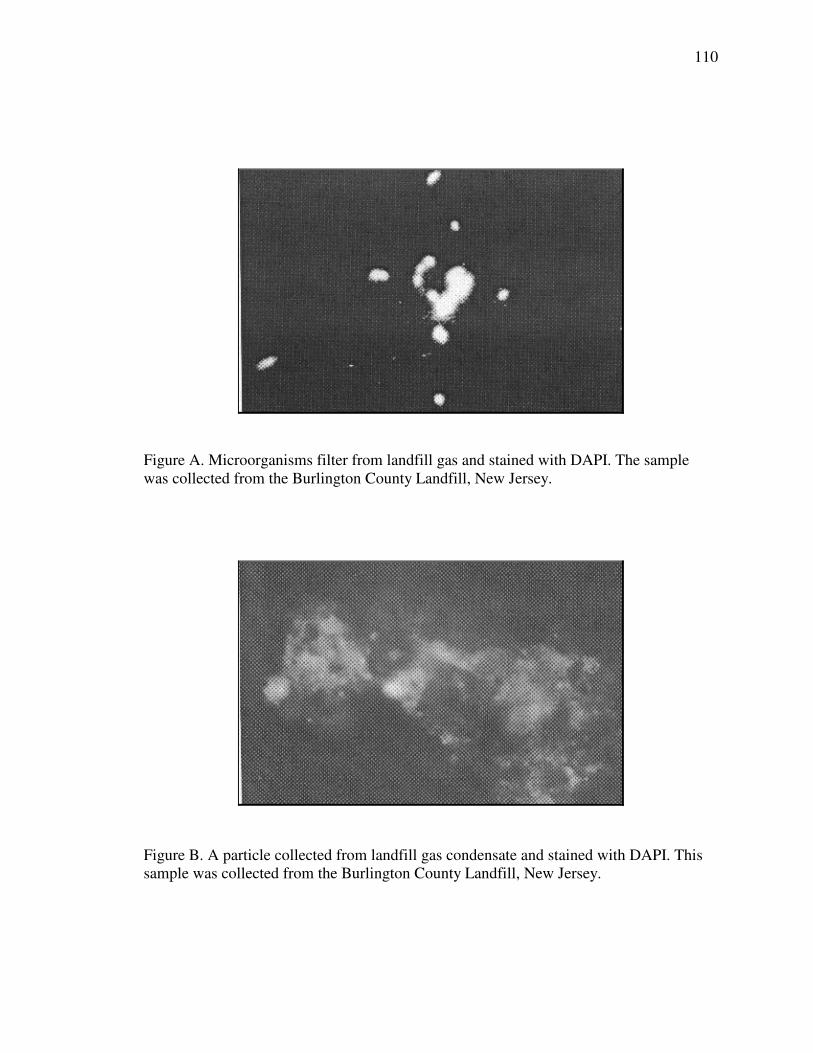
110
Figure A. Microorganisms filter from landfill gas and stained with DAPI. The sample was collected from the Burlington County Landfill, New Jersey.
Figure B. A particle collected from landfill gas condensate and stained with DAPI. This sample was collected from the Burlington County Landfill, New Jersey.
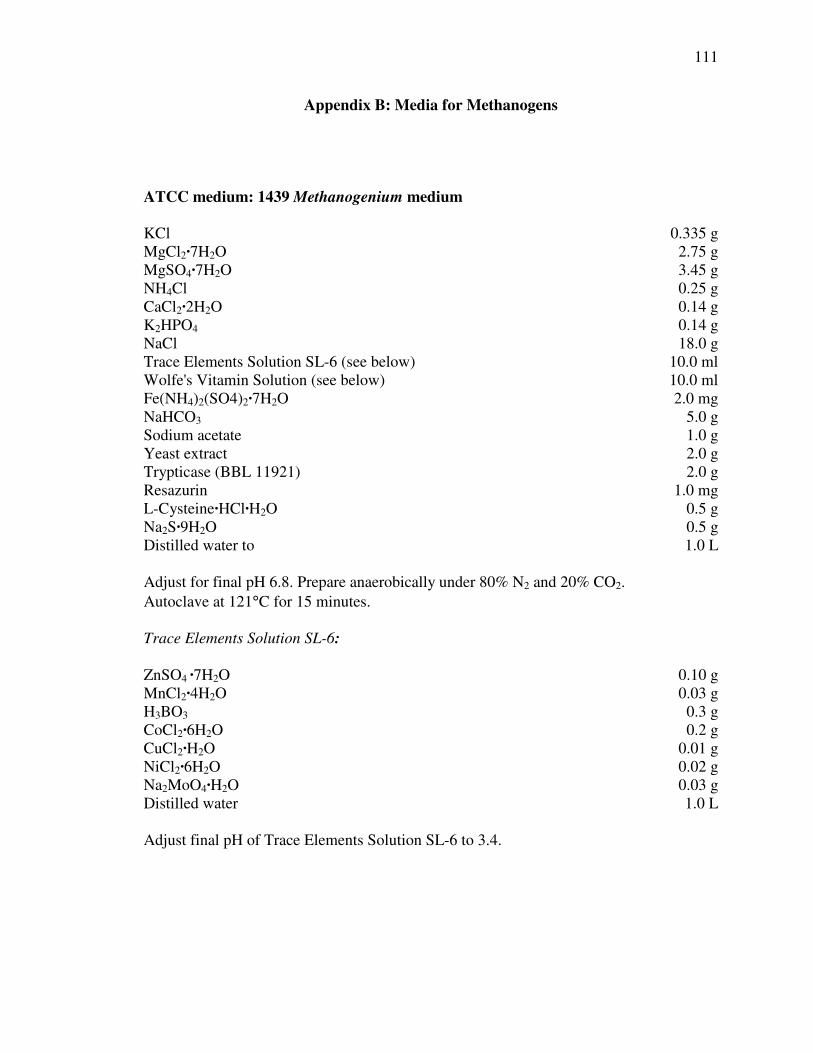
111
Appendix B: Media for Methanogens ATCC medium: 1439 Methanogenium medium KCl 0.335 g MgCl2·7H2O 2.75 g MgSO4·7H2O 3.45 g NH4Cl 0.25 g CaCl2·2H2O 0.14 g K2HPO4 0.14 g NaCl 18.0 g Trace Elements Solution SL-6 (see below) 10.0 ml Wolfe's Vitamin Solution (see below) 10.0 ml Fe(NH4)2(SO4)2·7H2O 2.0 mg NaHCO3 5.0 g Sodium acetate 1.0 g Yeast extract 2.0 g Trypticase (BBL 11921) 2.0 g Resazurin 1.0 mg L-Cysteine·HCl·H2O 0.5 g Na2S·9H2O 0.5 g Distilled water to 1.0 L Adjust for final pH 6.8. Prepare anaerobically under 80% N2 and 20% CO2. Autoclave at 121°C for 15 minutes. Trace Elements Solution SL-6: ZnSO4 ·7H2O 0.10 g MnCl2·4H2O 0.03 g H3BO3 0.3 g CoCl2·6H2O 0.2 g CuCl2·H2O 0.01 g 0.01 gNiCl2·6H2O 0.02 g Na2MoO4·H2O 0.03 g Distilled water 1.0 L Adjust final pH of Trace Elements Solution SL-6 to 3.4.
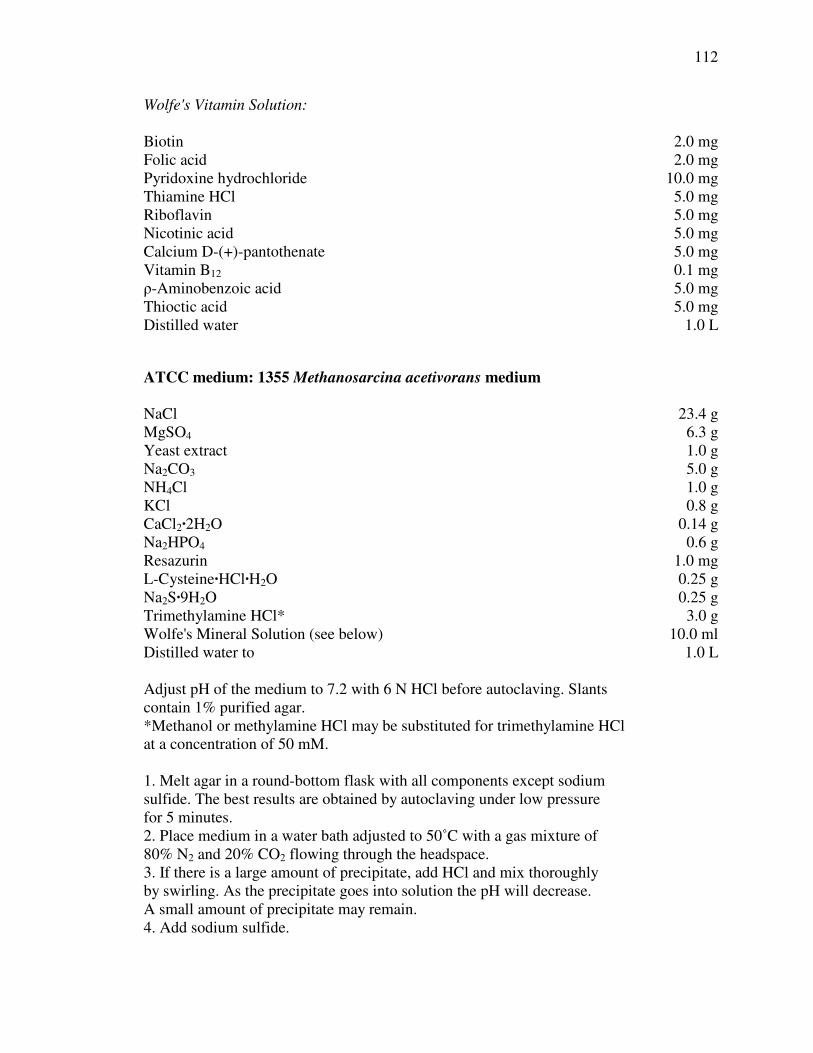
112
Wolfe's Vitamin Solution: Biotin 2.0 mg Folic acid 2.0 mg Pyridoxine hydrochloride 10.0 mg Thiamine HCl 5.0 mg Riboflavin 5.0 mg Nicotinic acid 5.0 mg Calcium D-(+)-pantothenate 5.0 mg Vitamin B12 0.1 mg �-Aminobenzoic acid 5.0 mg Thioctic acid 5.0 mg Distilled water 1.0 L ATCC medium: 1355 Methanosarcina acetivorans medium NaCl 23.4 g MgSO4 6.3 g Yeast extract 1.0 g Na2CO3 5.0 g NH4Cl 1.0 g KCl 0.8 g CaCl2·2H2O 0.14 g Na2HPO4 0.6 g Resazurin 1.0 mg L-Cysteine·HCl·H2O 0.25 g Na2S·9H2O 0.25 g Trimethylamine HCl* 3.0 g Wolfe's Mineral Solution (see below) 10.0 ml Distilled water to 1.0 L Adjust pH of the medium to 7.2 with 6 N HCl before autoclaving. Slants contain 1% purified agar. *Methanol or methylamine HCl may be substituted for trimethylamine HCl at a concentration of 50 mM. 1. Melt agar in a round-bottom flask with all components except sodium sulfide. The best results are obtained by autoclaving under low pressure for 5 minutes. 2. Place medium in a water bath adjusted to 50˚C with a gas mixture of 80% N2 and 20% CO2 flowing through the headspace. 3. If there is a large amount of precipitate, add HCl and mix thoroughly by swirling. As the precipitate goes into solution the pH will decrease. A small amount of precipitate may remain. 4. Add sodium sulfide.
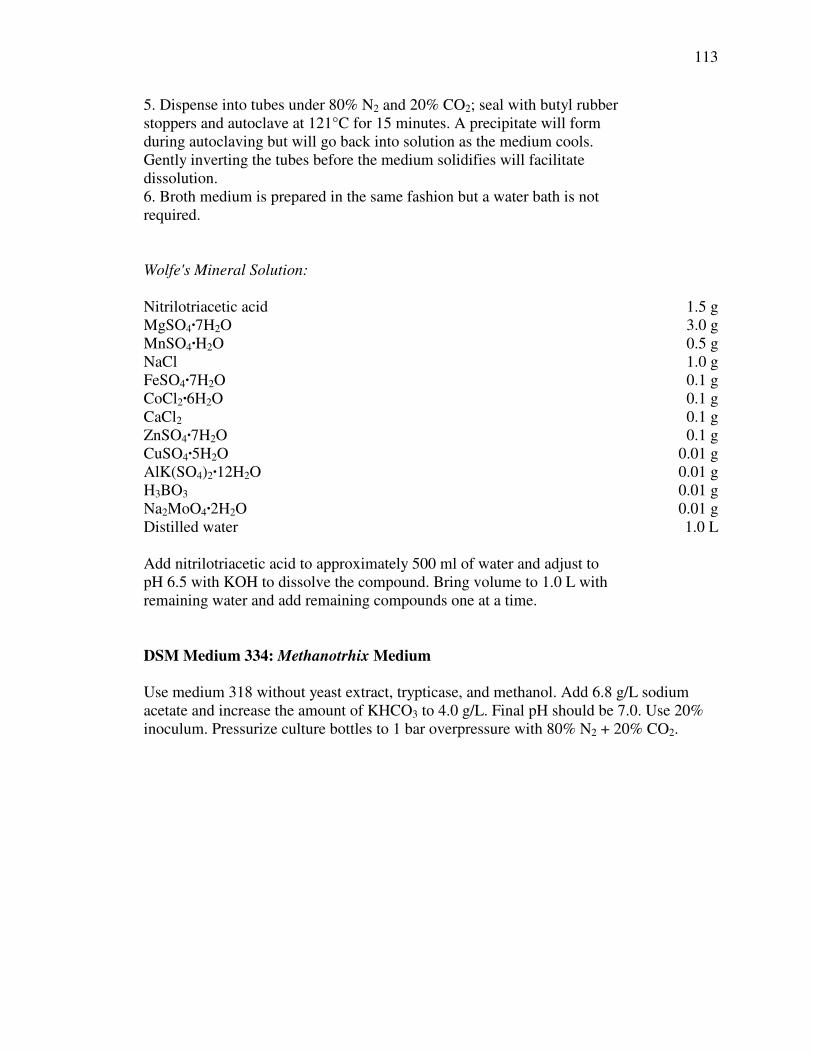
113
5. Dispense into tubes under 80% N2 and 20% CO2; seal with butyl rubber stoppers and autoclave at 121°C for 15 minutes. A precipitate will form during autoclaving but will go back into solution as the medium cools. Gently inverting the tubes before the medium solidifies will facilitate dissolution. 6. Broth medium is prepared in the same fashion but a water bath is not required. Wolfe's Mineral Solution: Nitrilotriacetic acid 1.5 g MgSO4·7H2O 3.0 g MnSO4·H2O 0.5 g NaCl 1.0 g FeSO4·7H2O 0.1 g CoCl2·6H2O 0.1 g CaCl2 0.1 g ZnSO4·7H2O 0.1 g CuSO4·5H2O 0.01 g AlK(SO4)2·12H2O 0.01 g H3BO3 0.01 g Na2MoO4·2H2O 0.01 g Distilled water 1.0 L Add nitrilotriacetic acid to approximately 500 ml of water and adjust to pH 6.5 with KOH to dissolve the compound. Bring volume to 1.0 L with remaining water and add remaining compounds one at a time. DSM Medium 334: Methanotrhix Medium Use medium 318 without yeast extract, trypticase, and methanol. Add 6.8 g/L sodium acetate and increase the amount of KHCO3 to 4.0 g/L. Final pH should be 7.0. Use 20% inoculum. Pressurize culture bottles to 1 bar overpressure with 80% N2 + 20% CO2.
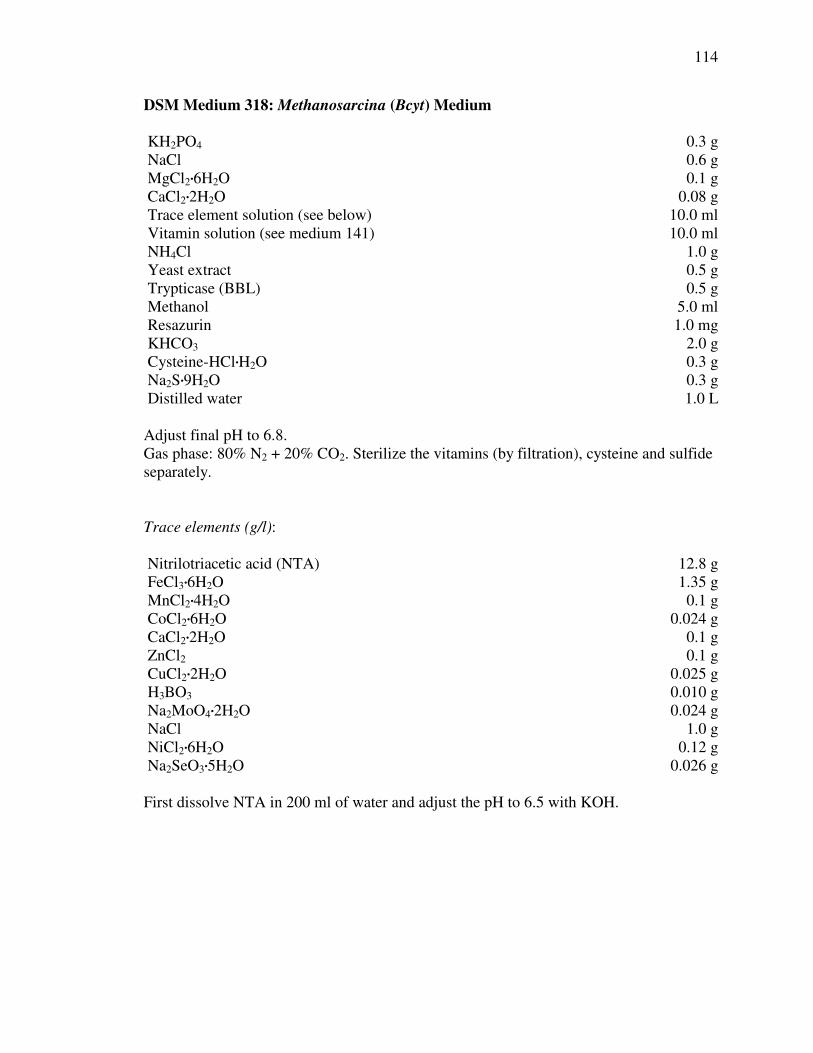
114
DSM Medium 318: Methanosarcina (Bcyt) Medium KH2PO4 0.3 g NaCl 0.6 g MgCl2·6H2O 0.1 g CaCl2·2H2O 0.08 g Trace element solution (see below) 10.0 ml Vitamin solution (see medium 141) 10.0 ml NH4Cl 1.0 g Yeast extract 0.5 g Trypticase (BBL) 0.5 g Methanol 5.0 ml Resazurin 1.0 mg KHCO3 2.0 g Cysteine-HCl·H2O 0.3 g Na2S·9H2O 0.3 g Distilled water 1.0 L Adjust final pH to 6.8. Gas phase: 80% N2 + 20% CO2. Sterilize the vitamins (by filtration), cysteine and sulfide separately. Trace elements (g/l): Nitrilotriacetic acid (NTA) 12.8 g FeCl3·6H2O 1.35 g 1.35 g MnCl2·4H2O 0.1 g CoCl2·6H2O 0.024 g CaCl2·2H2O 0.1 g ZnCl2 0.1 g CuCl2·2H2O 0.025 g H3BO3 0.010 g Na2MoO4·2H2O 0.024 g NaCl 1.0 g NiCl2·6H2O 0.12 g Na2SeO3·5H2O 0.026 g First dissolve NTA in 200 ml of water and adjust the pH to 6.5 with KOH.
115
Vita Name: Mijin Kim Birth Date: January 3, 1969. Birth Place: Seoul, Korea Education Ph.D. : Environmental Engineering, Drexel University, 2003 M. S. : Environmental Engineering, Drexel University, 1997 M. S. : Environmental Engineering, Kon-Kuk University, Seoul, Korea, 1993 B. A. : Environmental Engineering, Kon-Kuk University, Seoul, Korea, 1991 Experience Research assistant: Drexel University, 2001- 2003 Teaching assistant: Drexel University, 1999 - 2003 Research associate: Korea Environmental Technology and Research Institute, 1993-1994 Teaching and Research assistant: Kon-Kuk University, Seoul, Korea, 1991-1993 Grant Award Cooperation Activities Program Student Travel Grant. 2003. American Society for Microbiology, Washington, D.C. Poster Presentation at Professional Meetings Kim, M., and R. C. Barry. 2003. Characterization of landfill microbial communities using landfill gas and landfill gas condensate with rRNA slot-blot hybridization. In abstracts of the 103rd General Meeting of the American Society for Microbiology 2003. American Society for Microbiology, Washington, D.C. Kim, M., and R. C. Barry. 2002. Sampling and extraction of total RNA from landfill gas for analysis of microbial community structure. In abstracts of the 102nd General Meeting of the American Society for Microbiology 2002. American Society for Microbiology, Washington, D.C. Kim, M., and R. C. Barry. 2001. Comparison of microbial communities in landfills using fatty acid methyl ester (FAME) profiles. In abstracts of the 101st General Meeting of the American Society for Microbiology 2001. American Society for Microbiology, Washington, D.C. Barry, R. C., and M. Kim. 2000. Using landfill gas to study solid waste microbial communities. In abstracts of the 100th General Meeting of the American Society for Microbiology 2000. American Society for Microbiology, Washington, D.C.
