study of microbial polyhydroxyalkanoates using two-dimensional fourier-transform infrared...
TRANSCRIPT
Study of Microbial Polyhydroxyalkanoates Using Two-Dimensional Fourier-Transform Infrared CorrelationSpectroscopy
QIONG WU,1 GE TIAN,1 SUQIN SUN,2 ISAO NODA,3 GUO-QIANG CHEN1
1 Department of Biological Sciences and Biotechnology, Tsinghua University, Beijing 100084, People’s Republic of China
2 Department of Chemistry, Tsinghua University, Beijing 100084, People’s Repulic of China
3 The Procter and Gamble Company, Miami Valley Laboratories, P.O. Box 538707, Cincinnati, Ohio 45253-8707
Received 12 September 2000; accepted 20 January 2001Published online 15 August 2001; DOI 10.1002/app.1915
ABSTRACT: The premelting behavior of bacterially synthesized polyester poly(3-hy-droxybutyrate-co-3-hydroxyhexanoate), abbreviated as P(HB-co-HHx), was investi-gated by two-dimensional Fourier-transform infrared (2D FTIR) correlation spectros-copy. The temperature-dependent dynamic spectra were measured over a temperaturerange of 25–300°C. We focused our study on the thermally induced intensity fluctua-tions of bands for CAO (1700–1760 cm21), COH (2910–3010 cm21) and COOOCgroups (1220–1310 cm21) stretching vibrations. Changes of crystalline conformationdue to the thermal perturbation could be detected by the intensity and location varia-tions of those characteristic bands responding to the variations of dipole moments. 2Dcorrelation analysis indicated that the appearance of fully amorphous component didnot happen simultaneously with the disappearance of crystalline component, suggest-ing that there was an intermediate state between ordered crystalline and amorphousstates in P(HB-co-HHx). © 2001 John Wiley & Sons, Inc. J Appl Polym Sci 82: 934–940, 2001
Key words: polyhydroxyalkanoates; PHA; poly(3-hydroxybutyrate-co-3-hydroxyhex-anoate); P(HB-co-Hhx); 2D FTIR; premelting; biodegradable polymer
INTRODUCTION
Polyhydroxyalkanoates, abbreviated as PHA, aresynthesized by many bacteria as inclusion bodies1
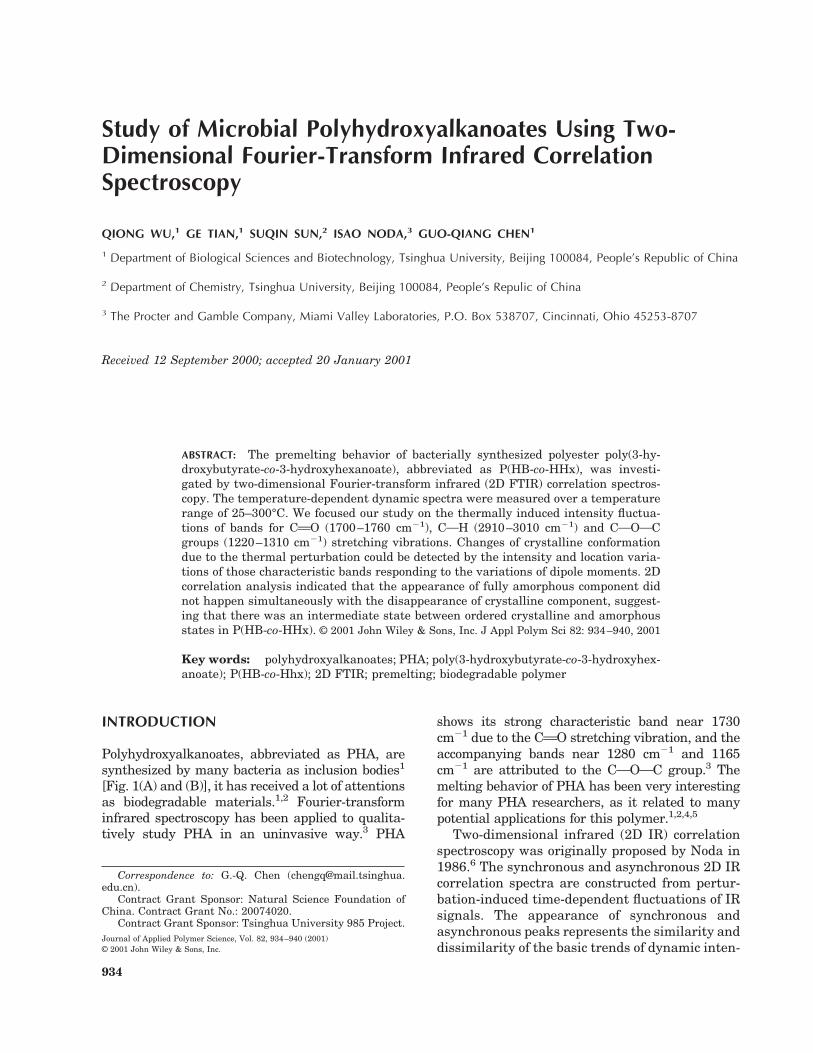
[Fig. 1(A) and (B)], it has received a lot of attentionsas biodegradable materials.1,2 Fourier-transforminfrared spectroscopy has been applied to qualita-tively study PHA in an uninvasive way.3 PHA
shows its strong characteristic band near 1730cm21 due to the CAO stretching vibration, and theaccompanying bands near 1280 cm21 and 1165cm21 are attributed to the COOOC group.3 Themelting behavior of PHA has been very interestingfor many PHA researchers, as it related to manypotential applications for this polymer.1,2,4,5
Two-dimensional infrared (2D IR) correlationspectroscopy was originally proposed by Noda in1986.6 The synchronous and asynchronous 2D IRcorrelation spectra are constructed from pertur-bation-induced time-dependent fluctuations of IRsignals. The appearance of synchronous andasynchronous peaks represents the similarity anddissimilarity of the basic trends of dynamic inten-
Correspondence to: G.-Q. Chen ([email protected]).
Contract Grant Sponsor: Natural Science Foundation ofChina. Contract Grant No.: 20074020.
Contract Grant Sponsor: Tsinghua University 985 Project.Journal of Applied Polymer Science, Vol. 82, 934–940 (2001)© 2001 John Wiley & Sons, Inc.
934
sity variations observed at two different wave-number, respectively.7
Some features of the 2D FTIR spectra distin-guish the advantages for 2D correlation analysisover the conventional one-dimensional FTIRspectroscopy. Autopeaks located at the diagonalpositions in synchronous 2D spectra represent theextent of the dynamic variations of IR signalsaffected by the external perturbation.8 Cross-peaks in synchronous 2D spectra are especiallyuseful in identifying the various inter- or in-tramolecular interactions because of the synchro-nism between the two variations at differentwavenumbers.9,10 Asynchronous spectra are uti-lized to enhance the spectral resolution of highlyoverlapped bands, for if the IR intensities of over-lapped bands vary in different ways, respectively,they could be clearly distinguished by the pres-ence of asynchronous crosspeaks.7 Another pow-erful advantage of 2D analysis is that the sign ofcrosspeaks in synchronous and asynchronousspectra can provide the sequential relationshipbetween the responses of different system compo-nents to the external stimulus.11,12
In 1993, a more general 2D correlation spec-troscopy was introduced, which enabled one toproduce 2D correlation spectra from various in-tensity variations of spectra with arbitrary andcomplex functional forms as well as simple sinu-soid waveform with a fixed frequency.13 The spec-tral intensity fluctuation may be induced by phys-ical variables such as temperature, pressure, con-centration, and composition.13 This led to a muchwider range of applications of 2D correlation anal-ysis. 2D approach has been very successful instudies of several research fields including thestudy of biological samples in recent years.14–16
In this article, temperature-dependent meltingbehavior of P(HB-co-HHx) was studied. 2D FTIRcorrelation analysis was expected to detect thechanges in the regions of CAO and COH stretch-
ing mode, and be useful for investigating thestructural variation during the heating process.
BACKGROUND
The generalized 2D correlation analysis of tem-perature-dependent FTIR spectra of PHBHHxsamples is carried out as follows. For a series oftemperature-dependent IR spectra A(n,T) ob-served as a function of wave number n and tem-perature T in a range between Tmin and Tmax, theorthogonal pair of 2D correlation spectra, F(n1, n2)and c (n1, n2, are given by
F~n1, n2! 1 i C~n1, n2!
51
p ~Tmax 2 Tmin! E0
`
Y1~v! z dv. (1)
The term Y1(v) is the temperature domain Fou-rier transform of the IR spectral intensity varia-tions A(n1,T) observed at some chosen wave num-ber n1, and Y2*(v) is the conjugate of the Fouriertransform of A(n2,T) observed at a different wavenumber n2. The IR spectral intensity variationsanalyzed by the 2D correlation technique is usu-ally mean centered around the temperature-aver-aged intensity to emphasize the spectral changesselectively induced by the effect of temperature.The Fourier frequency v represents the individ-ual Fourier frequency component of the variationof A(n,T) measured along the temperature axisT.13
The real part of the 2D correlation F(n1,n2) iscalled the synchronous spectrum. It representsthe overall similarity or coordinated feature of thetemperature-dependent variations in IR absorp-tion intensities measured at two different wavenumbers, n1 and n2. The asynchronous spectrumC(n1,n2) or the imaginary part of the 2D correla-tion, on the other hand, represents the dissimi-larity or independently varying trends of IR in-tensities as the temperature is changed. Whilethe generalized 2D correlation analysis in thisstudy is carried out for temperature variations,because of the historical close association betweenthe 2D correlation spectroscopy and statisticaltime-series analysis, terminologies implying somelevel of temporal variations, like synchronous andasynchronous spectra, are still used.
The temperature-based 2D correlation spectrahave the following useful properties. A synchro-
Figure 1 Molecular structure (A) and proposed struc-ture model (B) of polyhydroxyalkanoate (PHA).
MICROBIAL POLYHYDROXYALKANOATES 935
nous 2D IR correlation spectrum is symmetricwith respect to the main diagonal line (n1 5 n2).Autopeaks appearing at the diagonal positionrepresent the overall extent of temperature-in-duced changes in IR signals. Crosspeaks at off-diagonal positions of a synchronous spectrum rep-resent simultaneous changes of signals at twodifferent wave numbers, suggesting a coupled orrelated origin of intensity variations. If the sign ofa crosspeak is positive, the IR intensities at cor-responding wave numbers are increasing or de-creasing together. If negative, one is increasingwhile the other is decreasing. In an asynchronous2D IR correlation spectrum, crosspeaks develop ifthe spectral intensity varies independently or outof phase with each other. The sign of a crosspeakbecomes positive if the intensity changes at n1occur before (i.e., at lower temperatures than) n2,and negative if the intensity changes at n1 occurafter (i.e., at higher temperatures than) n2. Thissequence is reversed if F(n1, n2) , 0.11
METHODS
P(HB-co-HHx) was accumulated in cells of strainAeromonas hydrophila 4AK4, which was suppliedby Procter & Gamble Co., Cincinnati, OH. Puri-fied PHA was extracted by hot chloroform fromfreeze dry cells and precipitated by ethanol, fol-lowed by a vacuum dry process. NMR detectionshowed that the fraction of 3-hydroxyhexanoatein the sample of P(HB-co-HHx) was ca. 10%. Pu-rified PHA film on the KRS-5 (cocrystal of TlBrand TlI) window for FTIR scan was prepared bychloroform solution casting.
The FTIR spectra were obtained using a FTIRSpectrum 2000 spectrometer (Perkin-Elmer,
USA) at the scanning condition of 50 scans, aresolution of 4 cm21. An optical path difference(OPD) velocity of 0.5 cm/s, a gain of 8, KRS-5 asthe window material, a deuterium–triglycine–sulfate (DTGS) detector in the region of 4000 to400 cm21 equipped with a controlled heating de-vice were used for these studies.
Differential scanning calorimetry (DSC-7, Per-kin-Elmer) measurement was performed from250 to 180°C at a heating rate of 20°C/min.
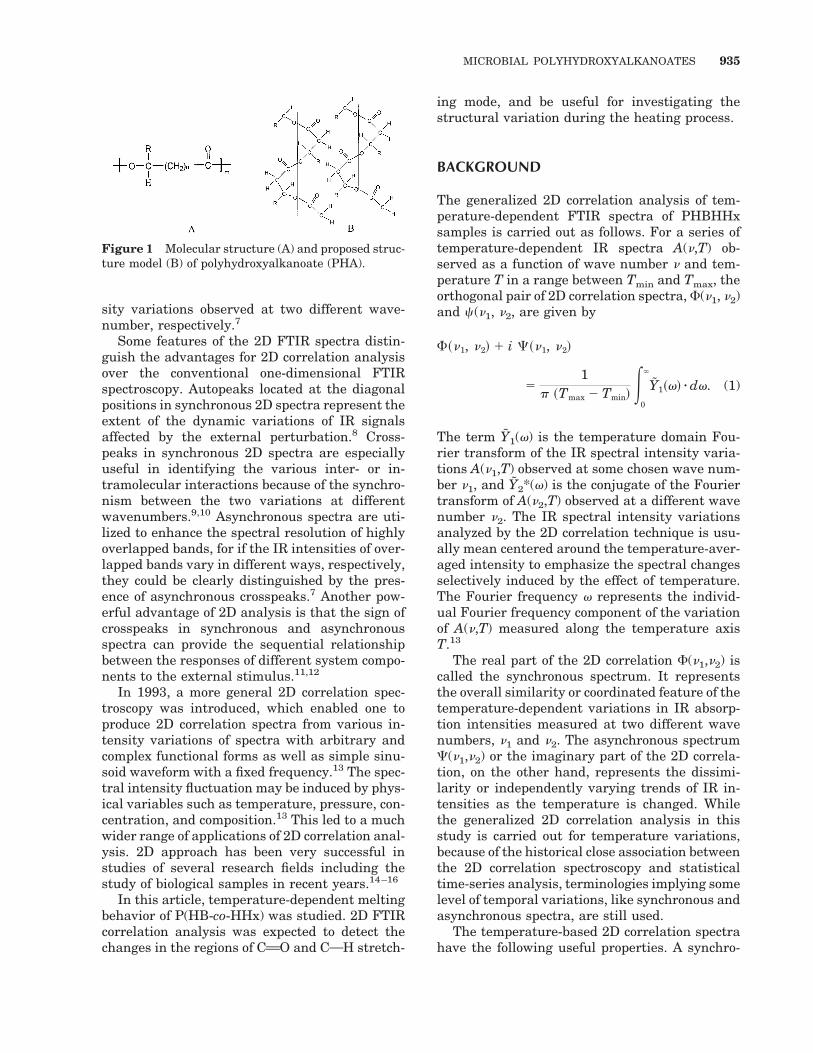
Figure 2 Dynamic IR spectra corresponding to thetemperature-dependent FTIR spectra of P(HB-co-HHx)in the spectral region of 1800–1700 cm21 over thetemperature range of 25 to 300°C.
Figure 3 Synchronous (A) and asynchronous (B) cor-relation spectra of P(HB-co-HHx) in the region of1700–1760 cm21.
936 WU ET AL.

RESULTS AND DISCUSSION
Temperature-dependent FTIR spectra of bacteri-ally synthesized P(HB-co-HHx) in the region of1800–1700 cm21 were obtained from 25 to 300°C,with an increment of 25°C. The heating processeswere carried out from room temperature to tem-peratures above the polymer melting point. Dur-ing the course of measurement, the polymer wasconverted from crystalline to amorphous phase.Band assignments could be made as follows: Bandof CAO group around 1720 cm21 was identifiedas the characteristic band of polyhydroxyalkano-ates (PHA) including P(HB-co-HHx). To accentu-ate the changing features of one-dimensionalspectra, different spectra termed dynamic spectraby Noda13 were constructed using all the averagespectral data collected from the entire heatingprocess (Fig. 2).
The synchronous and asynchronous 2D IRspectra in the spectral region between 1700 and1760 cm21 were shown in Figure 3(A) and (B),respectively. As mentioned above, the features inthis region mainly revealed the characteristics ofCAO stretching vibration in the copolymer. Theautopeak located at 1745 cm21 is expected to bethe characteristic band of amorphous componentof P(HB-co-HHx), compared to the band near1720 cm21, which is due to the crystalline phaseof the polymer [Fig. 3(A)]. Crosspeaks betweenthe 1745 cm21 band and the 1720 cm21 band inthe region were not found, and the intensity of thecrossregion was negative, indicating that varia-tions of these two bands occurred asynchronouslyand on opposite direction.
Asynchronous correlation spectrum could bemore important to detect the sequential order ofthe occurrence of events induced by the externalperturbation. The sequence of different spectral
intensity variations could be determined by thesigns of the crosspeaks in both synchronous andasynchronous 2D correlation spectra.15 Figure3(B) is the contour map of 2D asynchronous cor-relation spectrum in the same region of Figure3(A). A pair of crosspeaks was observed at thespectral coordinates between 1720 and 1745cm21. The signs of these crosspeaks pointed outthat the intensity variation of the band at 1745cm21 related to the amorphous phase followed the
Figure 4 Temperature-dependent FTIR spectra inthe stretching region of COH groups over a tempera-ture range from 25 to 300°C.
Figure 5 Synchronous (A) and asynchronous (B) 2Dcorrelation spectra between the CAO and COHstretching vibration regions.
MICROBIAL POLYHYDROXYALKANOATES 937
intensity decrease of the band at 1720 cm21 cor-responding to the ordered crystalline component.As the system temperature raised from 25 to300°C, the IR intensity at 1720 cm21 showed adecrease, indicating the highly ordered crystal-line phase was diminishing. This disappearanceof crystals did not result in the immediate appear-ance of fully amorphous liquid-like structure. Theexistence of much less ordered but not completelymolten intermediate structure has been describedas the premelting process in many polymers.12
Following the intermediate state, the amorphouscontribution increased at a higher temperature.
The shift of spectral bands to a higher wavenumber was closely related to the altered localorientation distribution of electric dipole-transi-tion moments in the system, which was inducedfrom the temperature-dependent variations of lo-cal environment of submolecular structures. Theincrease in temperature resulted in variations ofdipole moments for the CAO and COH stretch-ing bands. In the crystalline structure of thispolymer, the hydrogen atom of the CH2 and CH3groups located closer to the oxygen atom of othermolecules’ CAO groups than that in the amor-phous structure because of the highly ordered andprobably helix configuration of the crystals [Fig.1(B)], this can resemble the structural model pro-posed for poly-b-hydroxybutyrate or PHB.17 Withthe change of the microenvironment, the dipolemoments for these bands were enhanced, result-ing in increased wave numbers for the frequencyvalue of the band maximums.
The structural basis mentioned above could bereasonably investigated by the synchronous andasynchronous spectra using 2D correlation anal-ysis. The temperature-induced IR signal varia-tions in COH stretching region was shown in
Figure 4. The spectra could be divided into twosets, one was recorded from 25 to 125°C, and wasrepresented by bands located at 2935 and 2976cm21. Another included spectra recorded from150 to 300°C in which the above peaks shifted tohigher wave numbers, namely, 2937 and 2984cm21. This shift could be attributed to the forma-tion of amorphous structure. In the synchronous2D correlation spectrum [Fig. 5(A)], the cross-peaks at the spectral coordinates between COHand CAO spectral region showed the similarity ofthese two spectral variations. Positive peaks lo-cated at (1725 cm21, 2932 cm21), (1725 cm21,2974 cm21), and (1746 cm21, 2985 cm21), respec-tively, indicated that the COH groups and CAOgroups vibrated with coupling, and thus the di-pole moments could vary simultaneously. Moreinformation obtained from the asynchronousspectrum could prove the existence of a premelt-ing process [Fig. 5(B)]. Three negative crosspeaksincluding (1725 cm21, 2985 cm21), (1741 cm21,2932 cm21), and (1741 cm21, 2974 cm21) andtheir positive intensity in synchronous corre-sponding region indicated that the crystallinephase in the sample disappeared first. Appar-ently, only after going through the intermediatestate, the fully amorphous phase appeared at ahigher temperature.
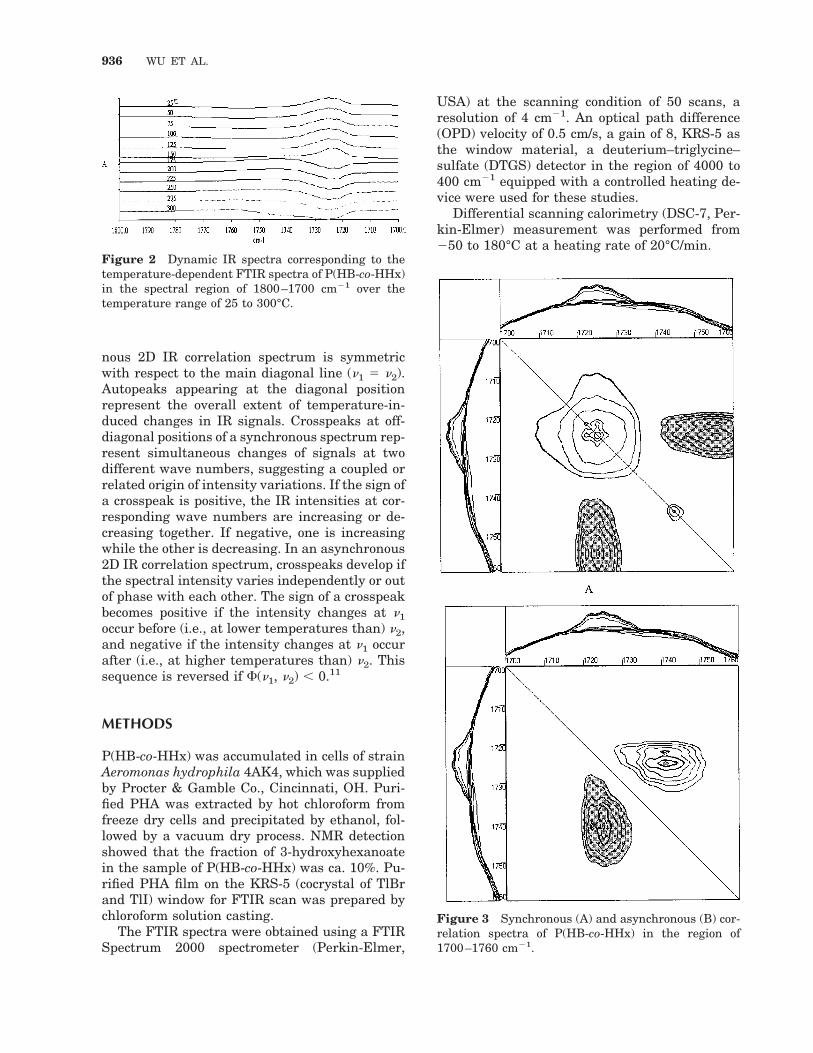
The thermally induced intensity variations ofP(HB-co-HHx) in the range from 1310 to 1220cm21 could be observed in Figure 6. The bands inthis spectral range were assigned to be the char-acteristic band of COOOC group in the polyester.The decreasing IR absorption at 1280 cm21 wasattributed to the phase transition (crystalline-amorphous) of this polymer and the disappear-ance of highly ordered and probably helix confor-
Figure 6 IR spectra in the region corresponding to the COOOC group in tempera-ture ranging from 25 to 300°C.
938 WU ET AL.
mation of polyester backbone as the temperaturewas raised above the melting point.
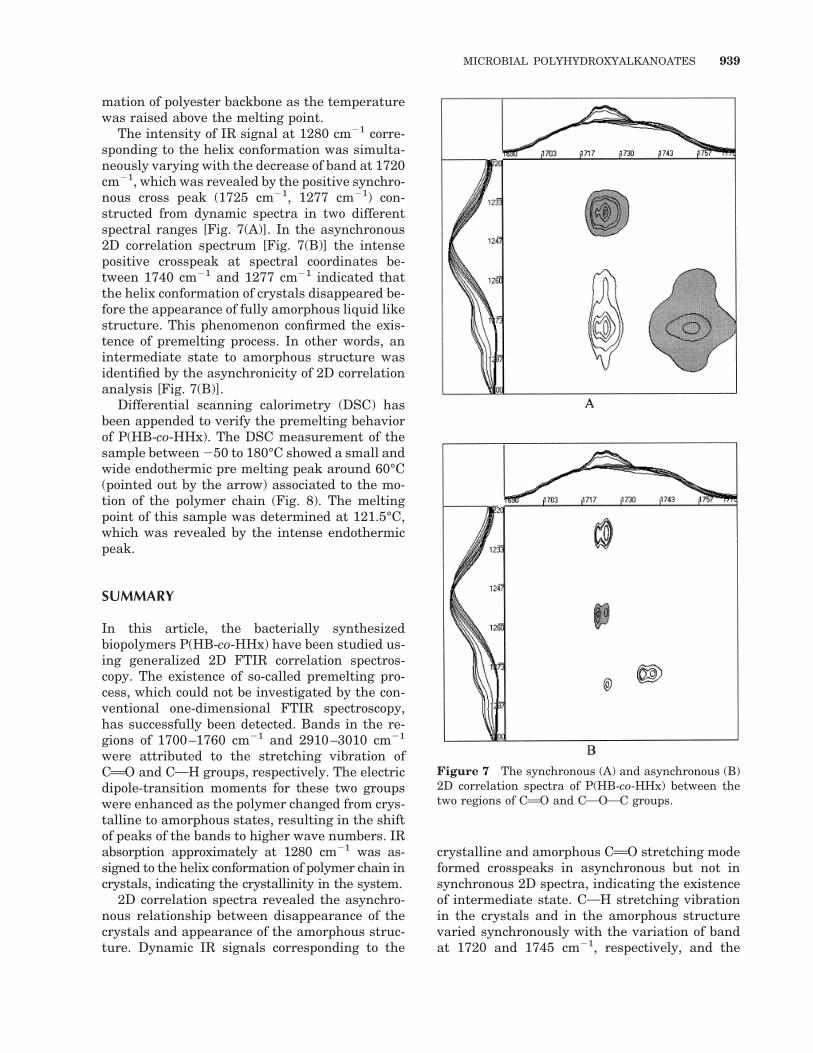
The intensity of IR signal at 1280 cm21 corre-sponding to the helix conformation was simulta-neously varying with the decrease of band at 1720cm21, which was revealed by the positive synchro-nous cross peak (1725 cm21, 1277 cm21) con-structed from dynamic spectra in two differentspectral ranges [Fig. 7(A)]. In the asynchronous2D correlation spectrum [Fig. 7(B)] the intensepositive crosspeak at spectral coordinates be-tween 1740 cm21 and 1277 cm21 indicated thatthe helix conformation of crystals disappeared be-fore the appearance of fully amorphous liquid likestructure. This phenomenon confirmed the exis-tence of premelting process. In other words, anintermediate state to amorphous structure wasidentified by the asynchronicity of 2D correlationanalysis [Fig. 7(B)].
Differential scanning calorimetry (DSC) hasbeen appended to verify the premelting behaviorof P(HB-co-HHx). The DSC measurement of thesample between 250 to 180°C showed a small andwide endothermic pre melting peak around 60°C(pointed out by the arrow) associated to the mo-tion of the polymer chain (Fig. 8). The meltingpoint of this sample was determined at 121.5°C,which was revealed by the intense endothermicpeak.
SUMMARY
In this article, the bacterially synthesizedbiopolymers P(HB-co-HHx) have been studied us-ing generalized 2D FTIR correlation spectros-copy. The existence of so-called premelting pro-cess, which could not be investigated by the con-ventional one-dimensional FTIR spectroscopy,has successfully been detected. Bands in the re-gions of 1700–1760 cm21 and 2910–3010 cm21
were attributed to the stretching vibration ofCAO and COH groups, respectively. The electricdipole-transition moments for these two groupswere enhanced as the polymer changed from crys-talline to amorphous states, resulting in the shiftof peaks of the bands to higher wave numbers. IRabsorption approximately at 1280 cm21 was as-signed to the helix conformation of polymer chain incrystals, indicating the crystallinity in the system.
2D correlation spectra revealed the asynchro-nous relationship between disappearance of thecrystals and appearance of the amorphous struc-ture. Dynamic IR signals corresponding to the
crystalline and amorphous CAO stretching modeformed crosspeaks in asynchronous but not insynchronous 2D spectra, indicating the existenceof intermediate state. COH stretching vibrationin the crystals and in the amorphous structurevaried synchronously with the variation of bandat 1720 and 1745 cm21, respectively, and the
Figure 7 The synchronous (A) and asynchronous (B)2D correlation spectra of P(HB-co-HHx) between thetwo regions of CAO and COOOC groups.
MICROBIAL POLYHYDROXYALKANOATES 939

asynchronous crosspeaks constructed from crys-talline COH groups and amorphous CAO groupsas well as from amorphous CAH groups and crys-talline CAO groups proved the interaction of di-pole moments between these two groups, con-forming to the characteristic of submolecularstructures. The helix structure of polymer chainin the crystals diminished simultaneously withthe gradual decrease of the crystalline CAOband, revealed by the synchronous crosspeak at1280 and 1720 cm21 wave numbers and the asyn-chronous crosspeak at 1280 and 1745 cm21.
REFERENCES
1. Lara, L. M.; Gjalt, W. H. Microbiol Mol Biol Rev1991, 63, 21.
2. Anderson, A. J.; Dawes, E. A. Microbiol Rev 1990,54, 450.
3. Hong, K.; Sun, S.; Tian, W. D.; Chen, G. Q.; Huang,W. Appl Microbiol Biotechnol 1999, 51, 523.
4. Steinbuchel, A.; Byrom, D.; Steinbuchel, A.; Byrom,D. Biomaterials: Novel Materials from BiologicalSources; Stockton, NY, 1991.
5. Lee, S. Y. Biotechnol Bioeng 1996, 49, 1.6. Noda, I. Bull Am Phys Soc 1986, 31, 520.7. Noda, I. J Am Che Soc 1989, 111, 8116.8. Noda, I. Appl Spectrosc 1990, 44, 550.9. Nakashima, K.; Ren, Y.; Nishiooka, T.; Noda, I. J
Phys Chem B 1999, 103, 6704.10. Liu, Y.; Ozaki, Y.; Noda, I. J Phys Chem 1996, 100,
7326.11. Noda, I.; Dowrey, A. E.; Marcott, C. Appl Spectrosc
1993, 47, 1317.12. Ozaki, Y.; Liu, Y.; Noda, I. Macromolecules 1997,
30, 2391.13. Noda, I. Appl Spectrosc 1993, 47, 1329.14. Noda, I.; Story, G. M.; Marcott, C. Vib Spectrosc
1999, 19, 461.15. Fabian, H.; Mantsch, H. H.; Schultz, C. P. Proc
Natl Acad Sci USA 1999, 96, 13153.16. Gericke, A.; Gadaleta, S. J.; Brauner, J. W. Bio-
spectroscopy 1996, 2, 341.17. Cornibert, J.; Marchessault, R. H. Macromolecules
1975, 8, 296.
Figure 8 Differential scanning calorimetry (DSC) scan of P(HB-co-HHx) from 250 to200°C.
940 WU ET AL.