study of rice processing, marketing and … of rice processing, marketing and distribution in ......
TRANSCRIPT

STUDY OF Rice Processing, Marketing and Distribution in Sierra Leone
By
Dunstan Spencer, Sanusi Deen, Agidi Gbagbo and Chrispin Wilson With
Pious Sesay
June 7, 2014
DISCLAIMER This publication was produced as consultant to the Rural Private Sector Development
Project (RPSDP). However, the results presented and views expressed are the sole responsibility of the authors and do not in any way engage the RPSDP, the Government
of Sierra Leone or the World Bank
Sanusi S. Deen Dunstan S. C. Spencer Chrispin E. Wilson Senior Partner Senior Partner Senior Partner Tel: +23276608663 Tel: +23276610441 Tel: +23276787890
Email: [email protected] Email: [email protected] Email: [email protected]
ENTERPRISE DEVELOPMENT SERVICES LTD 15 Mudge Farm, Off Sir Samuel Lewis Road
Freetown ~ Sierra Leone www.eds-sl.com

ii
EXECUTIVE SUMMARY
The study objectives are to assess the current processing, marketing and distribution mechanisms for rice and propose technically and economically feasible recommendations.
The dynamics involved in the process of rice production, marketing and trade, and the impact of policy intervention are examined in the study using a conceptual framework developed by IFPRI A which links the operations of markets, the macro environment, and growth in the agricultural sector.
In addition to extensive literature review, field data was collected for a representative sample of each significant market type identified in Value Chain Mapping (periodic markets, retail markets, wholesale markets, rice processing establishments), using structured questionnaires.
Government and Donor Policies
Since 2005, national development strategies and actions have been guided by Poverty Reduction Strategy (PRS) documents. Government’s current agricultural strategy and objectives are summarized in the current PRSP as follows:
To increase the production of staple food crops for food security:
To increase the production and export of cash-crops:
Improve access to Finance for Farmers:
Strengthen the capacity of MAFFS
An analysis of donors and development partners’ interventions under PRSPs I and II reveal that their assistance policies have been supportive of the agricultural sector in the areas of infrastructure development and access to finance and markets.
Value Chain Mapping
The marketing of a commodity, in this case rice starts with production and sale by farmers. In Sierra Leone rice is produced mainly by small producers. Ninety-five percent of the marketed surplus of rice is estimated to come from small producers.
Export of domestic rice
There are good prospects for increased export of rice which should be exploited: Data presented in the report shows that Sierra Leone has a comparative advantage not only in producing rice to supply its domestic markets but also for regional trade. As discussed above the country already has substantial exports to neighbouring countries. There are good prospects for further expansion of exports to regional markets. Regional demand for rice is high and growing rapidly, and Sierra Leone’s location is ideal for supplying regional rice markets. The country’s policy should therefore be to exploit its comparative advantage by:
a) Formalizing the export trade in local rice through trade negotiations with the importing countries
b) Investing in domestic value addition to maximize export revenues from the commodity c) Establishing an export processing zone in an appropriate location, with appropriate
infrastructure, services and amenities to function at international standards for such facilities.
Formalizing informal rice export activities would provide more reliable revenue streams for the state and enhanced security for traders through improved knowledge and enforcement of rights and responsibilities of all stakeholders at the border. In order to bring informal trading activities into formality and expand the tax base, a number of steps need to be taken to simplify business registration, harmonize and simplify import and export procedures, eliminate harassment, extortion

iii
and other corrupt practices at the borders, and provide targeted support to small firms that register formally.
Imported rice trade
The marketing system for imported rice is much simpler than that for domestic rice. Until the intervention of the MTI in October 2013, all importation of rice was undertaken by the private sector. The key government agencies and parastatals involved in the rice trade during the 1970s and 1980s included the Rice Department, the Rice Corporation and the Sierra Leone Produce Marketing Board (SLPMB), but by the late 1980s the private sector had assumed the dominant role in the marketing of both local and imported rice.
The quantity and value of rice imports have increased substantially in the last five years indicating that claimed increases in domestic rice production have had minimal effect on imports.
The six (6) largest importers of rice in Sierra Leone accounted for over 80% of all rice imports in the last two years. The situation has therefore not changed much in the last 30 years in terms of the number of importers dominating the trade, although their relative importance change from time to time.
A notable feature in 2013 is the direct intervention of the Government in the rice importing business in October, with the Ministry of Trade and Industry accounting for 22% of all imports in that year. That was an attempt to bring down the price of the commodity which had risen sharply in the preceding three months. It appears that the policy met with some success as the average CIF value of rice imports in October 2013 was the lowest in recent years.
The importers do not keep records of the destination of their sales and could only provide estimates based on their knowledge where wholesalers normally carry on their business. From their estimates, approximately 40% of importers sales are made to Western Area rice traders. Provincial traders account for approximately 60% the trade in imported rice, led by the Bombali District traders who take approximately 20% of imported rice. Kenema Districts accounts for approximately 15% followed by Bo and Kono Districts which consume approximately 10% each. The other districts account for relatively little (5%) consumption of imported rice.
Need to improve production and marketing statistics
With the importance of agriculture to the economy, it is essential to have accurate statistics on the sector for accuracy of management of the economy, particularly of the staple food crop rice. However, data on trends in food crop production are very confusing and questionable.
Also, regional trade in agricultural products is generally under-represented in official statistics, especially as it takes places through informal channels and with partners that may not keep proper records of this trade. An integrated mechanism is therefore needed to monitor and record informal trade flows to get a better handle on the full scope and scale of trade volumes. The informal cross-border data collection system that Uganda established in 2007 could provide a framework for a similar mechanism to monitor and record informal trade statistics for Sierra Leone. Establishing and implementing such a mechanism would require close collaboration between key entities such as Statistics Sierra Leone, National Revenue Authority, Ministry of Trade and Industry, and the Bank Of Sierra Leone, among others.
Marketable Surplus
Marketed surplus has generally been defined as that proportion of production that actually enters the market. Because of the uncertainly regarding the true level of production of rice in the country, the analysis in this study is based on two levels of production in 2009 which is used as the baseline year – a high variant based on FAO/MAFFS production data, and a low variant based on AHTS data.

iv
With the combination of high and low variants for rice production and marketed surplus, four different estimated quantities of domestic rice marketed are obtained representing:
1. FAO/MAFFS production data (allocated by District using the AHTS distributions) + EDS Market surplus ratios (187,118.3mt paddy in 2009, projected to 473,051.8 by 2025)
2. FAO/MAFFS production data (allocated by District using the AHTS distributions) + ATS Market surplus ratios (106,345.4mt in 2009, projected to 268,850.6mt by 2025)
3. ATHS production data by Districts + EDS Market surplus ratios (76,280.2 in 2009 projected to 191,503.1mt by 2025)
4. ATHS production data by Districts + AHTS Market surplus ratios (43,352.5mt in 2009 projected to 108,837.4mt by 2025)
Installed Milling Capacity
The national inventory of rice mills in Sierra Leone revealed the existence of approximately 401 rice mills installed in all the districts in the country, up from the 53 estimated to be operational after the civil war. Thirty-eight (9.5%) of the mills are not operational, primarily because of breakdowns, or in the case of the large mills, lack of proper business plans for their operation. As to be expected, the there is a concentration of rice mills in the major rice producing Districts, led by Port Loko District with 67 operational mills, Kambia with 59, Tonkolili and Bombali with 29 and 30 operational mills respectively. Kailahun District is not in one of the country’s rice belts but has a significantly large number of mills (34) due to its large farming population.
Twenty-five percent (25%) of the mills are privately owned and operated, all being small capacity mills. The five large integrated rice milling plants, installed in Bo, Kenema, Makeni, Torma Bum and Mambolo are each of 1 ton per hour capacity. Four (4) are of Indian manufacture, installed by MAFFS, each with a Bricketing machine, while the mill in Bo is of Chinese manufacture and was installed by the Chinese Government as a gift to Sierra Leone. None of these mills is in operation.
This study shows that Sierra Leone has sufficient installed milling capacity. Even with the high estimates of production and marketable surplus (the EDS estimates), the mills installed and assessed as “operational” have enough capacity to mill all the marketed rice in Sierra Leone operating only one shift of 8 hours per day, 24 days a month and 9 months a year. The recent investments by the Government and donor partners in increasing the rice milling capacity of the country through the ABCs and RPSDP as well as private sector investments have provided the country with sufficient milling capacity to serve its needs over the next five to ten years. But the distribution across Districts is not optimal, with substantial excess capacity in Kailahun, Koinadugu, Kenema, Kono, Moyamba and Pujehun Districts. The largest deficits are in Tonkolili and Port Loko Districts. The case for investment in additional milling capacity in Sierra Leone is therefore quite weak. However, there is a very strong case for greatly increased, and more efficient use of the installed capacity.
Efficiency of rice milling operations
It is evident from the data gathered in this study that private sector mills have less capital investment that the institution mills. This is a result of Government policy of “modernizing” the sector through the Government funded projects.
On the average the mills operated for 7 – 9 months during the year with the privately owned mills operating for longer than the ABC or RPSDP established mills. While institution mills operated at an average of between 1% -2% of their monthly capacity (defined as the amount of paddy that can be milled by the mill operating for 8 hours per day, 24 days a month), capacity use by private sector mills averaged 10% with almost 50% by one of the mills. So the private mills processed over 3,500 bushels (27.3 Kg) paddy ( during the year, compared to an average of 600 – 800 bushels for the institution mills. This higher level of operation is reflected in the bottom line of the businesses.

v
With custom rates for milling a bushel of paddy being about the same (Le 4,500), Gross returns (income over operating cost) at Le 5.7 million for private mills are four times higher than that achieved by ABC mills, and eight times higher than that earned by RPSDP mills. The situation is even bleaker when a depreciation charge of the value of the investment in the milling equipment is deducted from the Gross returns. While the resulting Gross Profit averages Le 3.4 million for the private sector mills it is slightly negative for the lower valued ABC mills (-Le 0.7million), and substantially negative for the higher valued RPSDP mills (- Le 3.2 million).
Why are the institution supplied mills performing so poorly, compared to the private sector mills? The answer lies in the lack of entrepreneurial drive of the managers and beneficiaries of the institution mills, and the poor location of most of the mills relative to the sources of supply of paddy for custom milling. The vast majority of private sector mills are located in the Scarcies area (Kambia & Port Loko Districts) the major surplus rice producing area of the country, while the institution mills are distributed all over the country, obviously for social and political reasons, but with sometime difficult access to sufficient customers for higher capacity use.
Business plans (BPs) for profitable private sector operation of the model mill establishments demonstrate, using state-of-the-art technologies, how rice can be marketed and sold profitably, by ensuring that the most effective and efficient processes are employed. The models are for large, medium and small scale businesses that purchase enough paddy rice in bulk during the buying season that normally lasts from November to March for milling during the rest of the year. Sufficient storage capacity is required to enable the Companies to store enough paddy to keep the mills busy for 280 working days. The rice will be marketed through different channels. To achieve a reasonable level of profitability (around 12% for small mills to 25% annual return on equity capital for small and large mills) the businesses must:
Make significant capital investment in structures and equipment ( $230,000 for small mills to $2million for large mills)1
Have sufficient operating capital to purchase and store paddy over a five month period for milling and sale of the product throughout the year (equity and loans amounting $130,000 for small mills up to $2 million for the large mill)
Recommendation on rice processing
The identified problems can be solved mainly in the following ways:
Modernization of existing Small, Medium and Large Scale Processing Centres in major rice production zones of the country, to equip them with the full complement of milling equipment. This should include provision of improved mechanical parboiling systems.
Provision of appropriate storage facilities- warehouses and Silos. The Sierra Leone Produce Marketing Company should be capacitated to erect and manage public warehouses and silos in the major rice producing districts, in association with the private mills.
Training should be provided in improved modern rice processing technology especially on threshing, parboiling, drying and milling, including in the organization and management of paddy supply systems for:
o Extension officers in all the Districts who will go to the communities to train the farmers
o Small and Medium Scale Processing groups who will directly apply them in their mills
1 Where existing business (all of which now operate on custom milling establishment) are to be transformed to
the model businesses (which will mill mainly on own account) the required capital investment will be significantly reduced due to the taking over of existing plant and equipment.

vi
Full privatisation of all institution mills (ABC, RPSPP, etc.). This analysis has clearly shown that institution operated mills are inefficient compared to the privately owned and operated mills. However, there are social issues associated with this recommendation which will have to be addressed in the privatisation process since the mills were provided as public goods by the financing institutions.
Market Infrastructure
About two-thirds of daily and periodic retail markets in Sierra Leone have market buildings. However, almost half of periodic markets have no market stalls of tables with most retailers displaying their goods on the ground.
Water and sanitation facilities in markets are inadequate: About a third of daily markets and over half of periodic markets have no toilet facilities Over half of both daily or periodic markets have no source of drinking water. Only about 10% have taps. The report recommends that there is a to invest to improve facilities in markets
But market buildings are often not used by retailers. Although there are permanent buildings with cement walls and corrugated iron sheets in about 80% of markets in Sierra Leone, about 70% of the rice traders in the markets, and 60% of traders in general, sell outside the structures. Traders give a variety of reasons for not selling in the market structures including the inappropriateness of the structures (too hot etc), poor accessibility to customers, etc. But the most often cited reason is that they will be disadvantaged if they locate in the buildings as customers would be high jerked by other traders who display their wares outside the market on the foot paths into the market. This calls into question continued investment in market infrastructure
A concerted campaign called for to:
Locate and design structures according to requirements of traders (need strong consultations)
Create conditions that remove incentives for traders to sell outside the structure (e.g. grouping traders by commodities, and enforcing no street trading laws)
Market entry
On the average rice traders in Sierra Leone have had some post-primary education. But the vast majority of rice traders do not have any formal business training, with about half having learnt the trade under the apprenticeship usually of a parent or close family member. Market entry appears to be liberal, this study found no evidence of significant entry barriers.
Credit constraints
Lack of capital and credit are the most important factors constraining retail rice market expansion. Half of imported rice retailers reported that lack of capital is the most important constraint to their capacity to expand their business. A further 20% report that lack of access to credit is the most constraining factor. The proportions are lower for local rice (30% and 15%), but they are still the most important factors. Low profit margins due to the competitive nature of the business and poor road infrastructure/lack of transport that cause high transport costs are the second most important constraint cited by retailers. For wholesalers the situation is virtually the same – lack of access to capital and credit being the most important constraints cited. Easier access to credit will oil wheel of rice trading
Traders make sales on credit to a majority of their customers but credit sales represent less than a
third of their sales volumes. Figure 28:Wholesalers make sales on credit to virtually all their customers. For retailers the proportion of buyers that receive credit is lower, ranging between 40 – 65 percent for local and imported rice. However, as shown in Figure 29:, only a small proportion of total sales is made in credit, 10% to 15% at retail level and 20-30% at wholesale level.

vii
Storage Use
Most retailers store produce overnight in their homes. Virtually all rice traders have access to storage facilities and store produce at least overnight. Very few traders (less than 2%) report that they do not have access to storage facilities and must sell all their stock the same day. But the majority of retailers store their commodity overnight in their homes. Next in importance for retailers (about 15% of traders) is storage in a communal facility in the market owned or rented by their Traders Association.
Although home storage provides security and reduces risks of losses to retailers, it is an inefficient commodity storage strategy. Markets should have sufficient and secure storage facilities which can be rented by Associations for use by their members.
Most wholesalers have access to dedicated store. Most wholesalers store their commodity in individual stores that they own or rent themselves and are located outside, but usually very close to markets,
Rice price setting
Wholesale and retail rice market price setting is not collusive, but there are questions relating to price setting by importers. Virtually all wholesalers of rice and about two thirds of retailers set their selling prices themselves without consultation, based on the price at which they purchase their supplies. About 40% of retailers reported that they consulted amongst themselves in the market and agree on one selling price. The evidence of this survey therefore clearly indicates that the rice price is set mainly by competitive means with little possibility of collusive behaviour among wholesalers and retailers.
However there is some recent evidence that there may be collusive behaviour among rice importers. Six firms account for over 80% of rice imports to Sierra Leone, which as stated by WFP (2010) is indicative of a high degree of market concentration. This situation is not new in Sierra Leone as for example Spencer et. al. (2007) reported that four firms handled all rice imports in 1996 (Spencer et all, 2007, but there was no evidence of collusive behaviour.
A notable feature in 2013 is the direct intervention of the Government in the rice importing business in October, with the Ministry of Trade and Industry accounting for 22% of all imports in that year. That was an attempt to bring down the price of the commodity which had risen sharply in the preceding three months. That intervention met with success as the average CIF value of rice imports in October 2013 was the lowest in recent years. It raises the issue as to how much collusion there is among the major importers in determining the price of imported rice. This analysis has shown that in two months in 2012 and four in 2013 the reported CIF prices for Sierra Leone are 128% to 242% of maximum expected prices. There is need for strict monitoring of rice importers, and application of sanctions if necessary, to ensure that they do not collude to earn monopolistic profits.
Rice price trends The movements of food crop prices in the country give an indication of the degree to which the level of domestic production (supplemented by imports) meet consumer demand. Monthly data on rice prices are collected by Statistics Sierra Leone for computation of the Consumer Price Index. Figure 32: shows that the retail price of local rice in Freetown, i.e. rice produced in Sierra Leone, has constantly been above that for imported rice except for a few months. However, the gap has narrowed significantly in the last two years implying that the supply of domestic rice to the Freetown market has increased faster than increases in demand.
Furthermore, unlike the situation in the past when local rice prices were higher than imported rice prices even in major rice producing areas such as the Scarcies (Kambia) and the Bolilands (Makeni)

viii
(Spencer, 1997), domestic rice prices are now lower than that for imported rice in the urban areas of the hinterland of Sierra Leone particularly in Kenema which is furthest away from Freetown the source of all imported rice, indicating that transportation costs of imported rice to provincial towns is now enough to remove the slight competitive advantage that imported rice may still have in Freetown.
Price volatility The coefficient of variation (CV), computed as the ratio of the standard deviation to the mean, is a useful tool to compare the degree of variation of different data series. Being an indicator for the dispersion of prices from their average, it provides useful hints to assess how prices change through the market in space and time for different actors (WFP, 2011b).
Intra-year rice price variability in Sierra Leone is reasonably low, with the CV usually under 0.20. Price variability is higher for local than for imported rice, with Freetown having an equal or higher variability than the provincial cities which are closer to the producing areas.
Price Seasonality
According to the traditional crop calendar of Sierra Leone (Figure 34:), local rice prices are expected to reach a peak at the end of the so called hungry or lean season, just before the onset of the harvest. A high seasonal peak indicates that the domestic market is not very efficient in smoothing out intra-annual price variations by its storage and distribution mechanisms.
The Grand Seasonal Index (GSI) is used to assess seasonal rice price variation. It is the ratio between the rice price at a given month and its centred moving average over the year that incorporates the full cycle of the seasonal patterns.
GSI computed for local and imported rice in Freetown and the provincial headquarter towns, using the ten to thirteen year monthly retail rice price series of Statistics Sierra Leone, show that the traditional seasonal peak in July/August is no longer evident in Sierra Leone, at least not in the urban cities, except for Makeni, and then it is only slightly evident. Rice price movements are now showing a bi-modal pattern with a slight peak in October/November, and an even lower peak, if any, in June. Imported rice prices show a seasonal pattern similar to that of local rice, another factor pointing to the integration of both markets. Access to imported rice during the traditional hungry season has apparently led to a smoothing of the seasonal peak or rice prices in recent times.
Market Integration
Rice markets have a fair degree of integration in the country. Analysing price trends, volatility and seasonality, there are indications that the rice market in Sierra Leone is fairly well integrated. There are also indications that the price of locally produced rice is determined by the price of imported rice in addition of course, to the level of production in the country. In addition to the international price for imported rice domestic transportation cost play a part in determining imported rice prices in the different urban areas of the country.
The results of Granger Causality Test for Freetown and the three Provincial City Markets (Bo, Kenema and Makeni) for which retail rice price series are available, reveal that the Freetown rice market is integrated with the provincial markets for both imported and local rice. For the linkages between the Provincial Markets – while the Bo and Kenema markets for both local and imported rice appear to be linked to those in Makeni, the reverse is not the case. However, while the Bo and Kenema imported rice markets appear not to be linked, the local rice markets appear to be linked.
We can conclude that the rice markets in Sierra Leone are well integrated. Freetown rice market prices for local as well as imported rice are linked to those in the provincial markets, Provincial rice markets for local rice are also integrated, although less so for imported compared to local rice.
Marketing Margins

ix
Marketing costs are incurred each time a commodity (in this case rice) is exchanged through a distribution system. It is critical to the efficiency of the system that these marketing costs be as low as possible in order to bridge the gap between consumer and farmer prices. One way to achieve that is to promote a competitive environment whereby marketing agents do not have the opportunity to exploit either ends of the marketing chain, namely farmers or consumers.
Price incentives affect the revenues and the procurement decisions of marketing agents; together with marketing and other costs, they affect profits. The analysis of operating costs and profits of traders allows one to understand the relative efficiency of various marketing agents and indicates the constraints that need to be removed in order to improve the marketing system.
Generally margins are higher for retailers of imported rice compared to retailers of local rice - around 24% for imported rice and 15% for local rice. However, wholesalers of local rice earn a higher margin (20-30%) than wholesalers of imported rice (about 8%). The GMM obtained in this study are not considered as excessive, and indicate that the rice trade in Sierra Leone, which is completely in the hands of the private sector, is competitive at both the wholesale and retail levels.
Need for improved physical access to markets
Availability and access to markets are strong incentives for investment in and production of agricultural commodities. National food security will be difficult to achieve without the development of the necessary organised and accessible market for rice. Meaningful efforts to develop the domestic rice industry must therefore address issues of access, input and innovations in the domestic rice market.
Poor access is the greatest setback domestic rice producers, both large and small, face in commercializing their businesses. All-weather feeder roads to Chiefdom market centres are often not available to enable farmers and farmers groups access these markets with ease and negotiate spot prices. Both large and small producers in major rice producing regions face the same challenge in marketing rice after harvests due to the poor state of the trunk roads linking these regions to regional markets. For example, the road from Mange on the Freetown/Kambia highway to the Scarcies mangrove swamp rice belt around Mambolo is not paved and in the rainy season is traversed with great difficulty for passengers and goods. This scenario is also true for the roads from the Port Loko into the Loko Massama rice bowls of Gbinti wala, Kalangba etc. In all weather conditions, the roads to the Bonthe and Pujehun rice belts around Torma Bum and Gbondapi respectively are barely passable and are far from being the commercial rice routes they are supposed to be. Upgrade of the following trunk roads will enhance the domestic rice trade:
Mange to Mambolo
Port Loko to Kalangba and to Rhombe
Bo to Torma Bum
Bo to Gbondapi
Magburaka to Mile 91
Marketing Innovations
The SLPMC and Sierra Leone Standards Bureau should establish and regulate systems for standardizing, branding and certifying locally produced rice that are consistent with international norms. It is well known that locally produced rice is exported to neighbouring countries under an informal trading regime. The MTI through the agency of the SLPMC should regularize this trade with a view to expanding the market for locally produced rice and by so doing, stimulating increased local production. An incentive scheme should be established to encourage collaboration from rice mills and traders. For example State procurement rules would preclude doing business with traders and mills that are not in compliance with the new marketing regulations.

x

xi
ACRONYMS
Acronym Description
ABC Agricultural Business Centres AfDB African Development Bank
AHTS Agricultural Household Tracking Survey
ASREP Agriculture Sector Rehabilitation Project
AU African Union
BDS Business Development Services
CAADP Comprehensive Africa Agriculture Development Programme
CBO Community Based Organisation
CET Common External Tariff
CI Confidence Interval
CORAD Consortium for Rehabilitation and Development
CORAD Consortium for Rehabilitation and Development
DFID United Kingdom Department for International Development
DRC Domestic Resource Cost
DTIS Diagnostic Trade Integration Study
EA Enumeration Area
EBA EU’s Everything But Arms agreement
ECOWAP ECOWAS Agricultural Policy
ECOWAS Economic Community of West African States
EDS Enterprise Development Services Ltd
EPA West Africa–EU Economic Partnership Agreement
EU European Union
EU European Union
FAO Food and Agriculture Organisation of the United Nations
FCE Farmer Controlled Enterprise
FFS Farmer Field Schools
FFS Farmer Field Schools
FIB First International Bank
FSCA Food Security through Commercialization of Agriculture
GDP Gross Domestic Product
GSI Grand Seasonal Index
GTZ Gesellschaft für Technische Zusammenarbeit (German aid agency)
IBRD International Bank for reconstruction and Development (World Bank)
ICT Information and Communications Technology
IDA International Development Association
IDB Islamic Development Bank
IFAD International Fund for Agricultural Development
IFC International Finance Corporation, (World Bank Group)
IMC International Medical Corps
IPAM Institute of Public Administration and Management
IVS Inland Valley Swamps
JICA Japanese International Communications Agency
KfW Kreditanstalt für Wiederaufbau (Reconstruction Credit Institute)

xii
Acronym Description
LEAD Livelihood Enhancement and Asset Development Program
LINKS Promoting Linkages for Livelihood Security and Economic Development
MAFFS Ministry of Agriculture, Forestry and Food Security
MAFFS Ministry of Agriculture, Forestry and Food Security
MDA Ministries, Departments and Agencies
MDG Millennium Development Goals
ME Margin of Error MFI Micro Finance Institution
MICS Multiple Indicator Cluster Survey
MITAF Microfinance Investment and Technical Assistance Facility
MODEP Ministry of Development and Economic Planning
MRU Mano River Union
MT Metric Ton
MT Metric Ton
MTI Ministry of Trade and Industry
MTI Ministry of Trade and Industry
NaCSA National Commission for Social Action
NEPAD New Partnership for Africa’s Development
NERICA New Rice for Africa
NGO Non–Governmental Organization
NR Non Response
NRDS National Rice Development Strategy
NRM Natural Resource Management
NTE Non Traditional Exports
NU Njala University
PAGE Promoting Agriculture, Governance and the Environment
PAGE Promoting Agriculture, Governance and the Environment
PC Producer Companies
PL 480 Public Law 480 of the United States of America
PMP Performance Monitoring Plan
PRSP Poverty Reduction Strategy Paper
PSDSP Public Sector Development Strategy Project
RARC Rokupr Agricultural Research Centre
RCPRP Rehabilitation and Community-based Poverty Reduction Project
RFCIP Rural Financial and Community Improvement Project
RPSDP Rural Private Sector Development Project
RPSDP Rural and Private Sector Development Project
SCP Small Holder Commercialisation Project
SEZ Special Economic Zone
SLAA Sierra Leone Airports Authority
SLARI Sierra Leone Agricultural Research Institute
SLARI Sierra Leone Agricultural Research Institute
SLIBA Sierra Leone Indigenous Business Association
SLIEPA, Sierra Leone Investment and Export Promotion Agency
SLPA Sierra Leone Ports Authority
SLPMB Sierra Leone Produce Marketing Board
SLPMC Sierra Leone Produce Marketing Company

xiii
Acronym Description
SLRA Sierra Leone Roads Authority
SNAP SNAP Sustainable Nutrition and Agricultural Promotion
SPSS Statistical Program for Social Scientists
SSL Statistics Sierra Leone
UN United Nations Organization UNDAF United Nations Development Action Framework
UNDP United Nations Development Program
UNDP United Nations Development Programme
UNHCR United Nations High Commission for Refuges
UNICEF United Nations Children’s Fund
USAID United States Agency for International Development
USG United States Government
UTB Union Trust Bank
VAM Vulnerability Assessment and Mapping
VC Value Chain
VCA Value Chain Analysis
VS&L Village Savings and Loan Association
WAEMU West African Economic and Monetary Union
WB World Bank
WFP World Food Programme
WHO World Health Organization
WTO World Trade Organisation
WVSL World Vision Sierra Leone

xiv
TABLE OF CONTENTS
EXECUTIVE SUMMARY .......................................................................... II
ACRONYMS………….. ............................................................................... XI
TABLE OF CONTENTS ......................................................................... XIV
LIST OF FIGURES ................................................................................ XVII
LIST OF TABLES ................................................................................. XVIII
CHAPTER 1. BACKGROUND ..............................................................1
1.1: Rice in Sierra Leone ....................................................................................................... 1
1.2: The Rural and Private Sector development Project (RPSDP) ....................................... 1
1.3: Objectives of the Study .................................................................................................. 2
1.4: Study Methodology And Data Collection Techniques ................................................... 2
CHAPTER 2. GOVERNMENT AND DONOR POLICIES ..................3
2.1 Government Policies ........................................................................................................ 4
2.2 Requirements for Organizing an Efficient Rice Market ................................................. 6
2.3. Legal and Regulatory Framework .................................................................................. 7
2.4 Donors and Development Partners Policies................................................................... 8
CHAPTER 3. RICE OUTPUT MARKETS ........................................ 13
3.1 Value Chain Mapping ............................................................................................... 13
3.2 Domestic rice processing and trade .......................................................................... 17
3.3 The Export Rice Trade .............................................................................................. 21
3.3.1 The current informal rice export trade ................................................................... 21
3.3.2 The prospects for expanding the rice export trade ................................................. 21
3.4 Imported Rice Trade.................................................................................................. 26
CHAPTER 4. MARKETED SURPLUS FOR RICE ........................... 31
4.1 Small Scale Rice Production ..................................................................................... 31
4.1.1 Comparative Advantage of Sierra Leone rice ....................................................... 31
4.2 Large Scale Rice Production and Marketing ............................................................ 34
4.3 National Rice Production And Demand .................................................................... 35
4.4 Marketed Surplus For Domestic Rice ....................................................................... 38
4.5 Projections Of Marketed Surplus To 2025 ................................................................ 40

xv
CHAPTER 5. MARKET STRUCTURE AND PERFORMANCE ..... 43
5.1 Structure of Market Buildings ................................................................................... 43
5.2 Water and Sanitation Facilities ................................................................................ 45
5.3 Use of Market Buildings ............................................................................................ 46
5.4 Characteristics of rice traders .................................................................................. 47
5.5 Conduct of the rice trade ........................................................................................... 48
5.6 Constraints to market expansion ............................................................................... 52
5.7 Credit and storage strategies .................................................................................... 54
5.8 Performance of the rice marketing system ................................................................ 57
5.8.1 Rice price setting.................................................................................................... 57
5.8.2 Rice price trends .................................................................................................... 57
5.8.3 Price volatility ........................................................................................................ 60
5.8.4 Seasonality of prices .............................................................................................. 61
5.8.5 Market integration ................................................................................................. 63
5.8.2 Marketing costs and returns .................................................................................. 64
CHAPTER 6. EVALUATION OF COMMERCIAL RICE
PROCESSING AND STORAGE ............................................................. 67
6.1 National Inventory of rice mills ................................................................................ 67
6.2 Ownership of Rice Processing Machinery and Facilities ......................................... 69
6.2.1 The ABC Mills ........................................................................................................ 69
6.2.2 RPSDP Mills: ......................................................................................................... 70
6.2.3 Government Owned Mills ...................................................................................... 71
6.2.3 Private Mills........................................................................................................... 71
6.3 Types of Mill Establishments..................................................................................... 71
6.3.1 Small Scale Rice Mill Establishments: .................................................................. 71
6.3.2 Medium Size Rice Mill Establishments ................................................................. 73
6.3.3 Large Rice Mill Establishments: ........................................................................... 75
6.4 Processing methods and products ............................................................................. 78
6.5 Efficiency Of Current Rice Milling Operations ........................................................ 81
6.6 Improving the efficiency of rice milling operations .................................................. 83
6.7 Possible solutions to the identified problems ............................................................ 86
6.8 Efficient Rice Processing – Model Establishments ....................................................... 88
6.9 Efficient Rice Processing – Indicative Business Plans ................................................. 95
6.9.1 Large Scale Mill .................................................................................................... 95
6.9.2 Medium Sized Mill ................................................................................................. 99
6.9.3 Small Scale Mill ................................................................................................... 104

xvi
CHAPTER 7. CONCLUSIONS AND RECOMMENDATIONS ..... 108
ANNEXES……………….. ........................................................................ 116
Annex 1: Terms of Reference for the evaluation ............................................................... 117
Annex 2: Time table ........................................................................................................... 120
Annex 3: List of documents and references ....................................................................... 123
Annex 4: Survey Instruments ............................................................................................. 126

xvii
LIST OF FIGURES
Figure 1: Conceptual framework for assessment of rice policies in Sierra Leone ............................. 4 Figure 2: Rice value chain map, Sierra Leone .................................................................................. 14 Figure 3: Market channels for marketed surplus 0f domestic rice in Sierra Leone ......................... 18 Figure 4: Current and Projected Regional Rice Imports 1961 – 2020 (metric tons) ........................ 22 Figure 5: Distances to major regional rice markets for Sierra Leone compared to other sources .. 23 Figure 6: Market channels for imported rice in Sierra Leone .......................................................... 27 Figure 7: Monthly Imports of rice into Sierra Leone in 2012 and 2013 ........................................... 28 Figure 8: Proportion of rice imports accounted for by the largest importers in Sierra Leone ........ 28 Figure 9: Average CIF price of rice imports by month in 2012 and 2013 ........................................ 29 Figure 10: Proportion of Rice Imports Received by Districts ......................................................... 31 Figure 11: Area of rice harvest and rice yield (1960 – 2010) ......................................................... 35 Figure 12: Structure of walls of market buildings in Sierra Leone ................................................. 44 Figure 13: Structure of the roofs of market buildings in Sierra Leone .......................................... 44 Figure 14: Structure of market stalls/tables in markets in Sierra Leone ....................................... 44 Figure 15: Toilet facilities available in markets in Sierra Leone ..................................................... 45 Figure 16: Sources of drinking water in markets in Sierra Leone .................................................. 45 Figure 17: Location of traders in markets in Sierra Leone ............................................................. 46 Figure 18: Gender of rice traders in Sierra Leone .......................................................................... 47 Figure 19: Average age and highest class attained by rice traders in Sierra Leone ....................... 47 Figure 20: Type of business training obtained by rice traders before they started trading .......... 48 Figure 21: Number of years that rice traders have been in their business ................................... 48 Figure 22: Distribution of customers of imported rice traders in Sierra Leone ............................. 49 Figure 23: Distribution of customers of local rice traders in Sierra Leone .................................... 50 Figure 24: Proportion of retailers that obtain their supplies within their Districts ....................... 51 Figure 25: Proportion of wholesalers that obtain their supplies within their Districts ................. 51 Figure 26: Constraints preventing retailers from doubling the amount they sell ......................... 52 Figure 27: Constraints preventing wholesalers from doubling the amount they sell ................... 53 Figure 28: Proportion of rice traders who made sales on credit to some of their customers ...... 54 Figure 29: Proportion of rice sales made on credit ........................................................................ 55 Figure 30: Storage strategies used by rice traders ........................................................................ 56 Figure 31: Methods of fixing market prices by rice traders in Sierra Leone .................................. 57 Figure 32: Trend of retail rice prices in Freetown .......................................................................... 58 Figure 33: Retail rice prices in provincial cities .............................................................................. 59 Figure 34: Sierra Leone National Seasonal Calendar ..................................................................... 61 Figure 35: Grand Seasonal Indices for rice in Sierra Leone, 2000-2013 ........................................ 62 Figure 36: Factory Layout for a model small scale rice processing facility in Sierra Leone ........... 89 Figure 37: Factory Layout for a model medium scale rice processing facility in Sierra Leone ...... 91 Figure 38: Factory Layout for a model large scale rice processing facility in Sierra Leone............ 93 Figure 39: Summary of projected performance of large scale model rice mill establishment...... 95 Figure 40: Summary of projected performance of medium sized model rice mill establishment ....................................................................................................................................100 Figure 41: Summary of projected performance of small scale model rice mill establishment ... 104
xviii
LIST OF TABLES
Table 1: Requirements Addressed in the PRSP and Gaps ................................................................. 9 Table 2: Areas of donor activity and support in the Agricultural Sector of Sierra Leone ............... 12 Table 3: Key stakeholders and their activities along the rice value chain ...................................... 15 Table 4: Rice imports into Sierra Leone .......................................................................................... 27 Table 5: Comparison of Sierra Leones import and Thailand export rice prices .............................. 29 Table 6: Estimated competiveness of rice production and imports in Sierra Leone in 2009 ......... 33 Table 7: West African Domestic Resource Cost (DRC) Comparisons for Rice production .............. 34 Table 8: Comparative Advantage of Rice Production systems in Sierra Leone, 2003 .................... 34 Table 9: Sierra Leone, National Rice Production and Self-Sufficiency ............................................ 35 Table 10: Trends in rice (paddy) production in Sierra Leone ........................................................ 36 Table 11: Rice production by District in Sierra Leone ................................................................... 37 Table 12: Rice production by District in 2009 ............................................................................... 37 Table 13: Proportion of rice harvest consumed and sold by farmers in Sierra Leone, 2009 ....... 38 Table 14: Percentage of rice production that is sold .................................................................... 39 Table 15: Estimated marketed surplus of domestic husk rice production by District in Sierra Leone – High production variants ................................................................................. 39 Table 16: Estimated marketed surplus of domestic husk rice production by District in Sierra Leone – Low production variants .................................................................................. 40 Table 17: Projections of marketed surplus of paddy rice in Sierra Leone in 2025 – Scenario 1 .. 41 Table 18: Projections of marketed surplus of paddy rice in Sierra Leone in 2025 – Scenario 2 .. 42 Table 19: Projections of marketed surplus of paddy rice in Sierra Leone in 2025 – Scenario 3 .. 42 Table 20: Projections of marketed surplus of paddy rice in Sierra Leone in 2025 – Scenario 4 .. 43 Table 21: Ranking of commodities sold by rice traders in Sierra Leone ....................................... 49 Table 22: Linear equations for monthly rice price trends (Leones/Kg) ........................................ 60 Table 23: Coefficient of variation of monthly rice prices in Sierra Leone .................................... 60 Table 24: Pair wise Granger Causality Tests for Regional Rice Markets in Sierra Leone .............. 64 Table 25: Marketing margins of Imported rice traders for an average transaction in Sierra Leone ......................................................................................................................................65 Table 26: Marketing margins of local rice traders for an average transaction in Sierra Leone ... 66 Table 27: Transactions by retailers of local rice in Sierra Leone .................................................. 66 Table 28: Location, ownership and condition of rice mills in Sierra Leone, by District ................ 68 Table 29: Physical characteristics of rice mill establishments in Sierra Leone ............................. 82 Table 30: Characteristics of Managers/Operators of Small rice mills in Sierra Leone ................. 82 Table 31: Cost and Returns for Small Rice Mills in Sierra Leone .................................................. 83 Table 32: Adequacy of installed milling capacity in Sierra Leone ................................................. 87 Table 33: Cost of Capital Investment for Model Large Scale Rice Milling Enterprise ................... 97 Table 34: Forecasted sales and cost of sales for large scale model rice mill ................................ 97 Table 35: Projected profit and loss for large scale rice milling company ..................................... 98 Table 36: Projected Balance Sheet for model large scale rice mill in Sierra Leone ...................... 99 Table 37: Cost of Capital Investment for Model Medium Sized Rice Milling Enterprise ............ 101 Table 38: Forecasted sales and cost of sales for Medium Sized model rice mill ........................ 102 Table 39: Projected profit and loss for Medium Sized rice milling company ............................. 103 Table 40: Projected Balance Sheet for model medium sized rice milling enterprise ................. 103 Table 41: Cost of Capital Investment for Model Small Scale Rice Milling Enterprise ................. 105 Table 42: Forecasted sales and cost of sales for small scale model rice mill ............................. 106 Table 43: Projected profit and loss for small scale rice milling company ................................... 106 Table 44: Projected Balance Sheet for model small scale rice milling enterprise ...................... 107
Page 1 of 157
CHAPTER 1. BACKGROUND
1.1: RICE IN SIERRA LEONE
As indicated in the National Rice Development Strategy report (MAFFS, 2009)2 The West African state of Sierra Leone occupies 72,300 km2 of which 5.4 million ha are potentially cultivable. The crop sub sector with the staple food rice dominating contributes about 75 percent of agricultural GDP. Annual per capita consumption of rice (104 kg) in Sierra Leone is amongst the highest in sub Saharan Africa. About 70 percent of Sierra Leone’s 4.9 million people in 2004 were below the national poverty line, with 52% living on less than US$1 per day, while 26% could not afford minimum daily calorific requirements.
While climatic conditions are generally favourable for crop production including rice, biotic and abiotic factors such as diseases, pests, low soil fertility, in addition to the use of low yielding local varieties, poor extension services, and several socio-economic factors are considered to be limiting farmers’ productivity. Also, most small holder farmer’s yield is greatly reduced by post harvest losses due to poor crop management, inappropriate storage and marketing facilities.
The form of agriculture practiced by the vast majority of Sierra Leonean farmers is very rudimentary. Fewer than five percent of the households use fertilizers, insecticides, herbicides and basic machinery which are resources that could help enhance rice production. Rice is cultivated in both the upland and diverse lowland ecologies - Inland Valley Swamps, Bolilands, Mangrove Swamps and Riverine Grasslands. Rice yield in the upland is however generally lower than in the lowlands.
1.2: THE RURAL AND PRIVATE SECTOR DEVELOPMENT PROJECT (RPSDP)
The Government of Sierra Leone has been allocated grant funds from the International Development Association of the World Bank which are administered by the International Development Association (IDA) and executed by the project Coordinating Unit of the Rural and Private Sector Development Project (RPSDP).
The project supports initiatives to improve quality o f produce for domestic/export markets; assists in strengthening marketing organizations at the producer level as well as private trade engaged in domestic marketing and export; support value addition and provide limited support for filling critical gaps in infrastructure along the value chain, in conjunction with initiatives supported by Government/other donors. The project development Objective is to “increase production of selected agricultural commodities by twenty percent and sales by ten percent through improvement in efficiency along the value chain for target beneficiaries”
The project has four components:
Component A: Domestic Marketing Improvement. This component aims at improving domestic distribution channels for selected agricultural products to improve the ability of farmers and traders to market their goods in Freetown and other large domestic markets.
Component B: Agricultural Export Promotion. This component aims to provide the necessary tools and services for promoting agricultural exports o f commodities such as cocoa, coffee, cashew, oil palm, cassava and ginger. The component supports an export promotion initiative for these commodities identified as promising for export by the Diagnostic Trade
2 Ministry of Agriculture Forestry and Food Security (MAFFS), 2009; National Rice Development Strategy
(NRDS), Sierra Leone, Prepared for the Coalition for African Rice Development (CARD)

Page 2 of 157
and Investment Study. Target beneficiaries include agricultural producers, agricultural exporters and other private enterprises in the value chain.
Component C: Support to Farmer-based Organizations and Technology Improvement, aims at increasing farmers' access to improved agricultural technology and practices to support quality improvement o f commodities supported under Components A and B and strategic studies to identify support for additional commodities and markets. It targets rural producers.
Component D: Policy Regulations, Project Management, Monitoring and Evaluation; finances the development of key policy regulations, the project management function and monitoring and evaluation.
1.3: OBJECTIVES OF THE STUDY
The study objectives are to assess the current processing, marketing and distribution mechanisms for rice and propose technically and economically feasible recommendations.
1.4: STUDY METHODOLOGY AND DATA COLLECTION TECHNIQUES
Initial Consultations:
The study commenced with an inception meeting with RPSDP, as employer, to introduce the project team and discuss the Project Work Plan, logistical issues, focal points for consultations and reporting.
As an entry point for performing the assignment, EDS held consultations with the Ministry of Agriculture Forestry and Food Security and the Ministry of trade and Industry to officially apprise Government about the study proposal and obtain advice and commitment of support. Arrangements for the collaboration of the relevant District Directors of Agriculture during field work were made at the level of the Minister and Director General of Agriculture.
Consultations were also held with the Ministry of Local Government and the Decentralization Secretariat to secure arrangements for the collaboration of the relevant District Councils and their District Development Committees., and with key private sector stakeholders, including major commercial rice producers and major importers of rice.
Secondary Data Collection:
EDS conducted a comprehensive desk review of relevant studies and literature on production, processing and marketing of rice in Sierra Leone as well as neighbouring countries that are potential markets for rice produced in Sierra Leone. All reports were thoroughly reviewed to extract background information relevant for this assignment.
Field Data collection:
EDS assessed the efficiency of rice markets by undertaking a number of activities and analysis covering: value mapping to describe the different rice marketing channels, assessment of rice processing facilities, analysis of rice traders, and assessment of types and functioning of markets.
For each significant market type identified in the Value Chain Mapping (e.g. periodic markets, retail markets, wholesale markets etc.) a representative sample was selected and a market questionnaire (see Annex 4) administered to collect information on market infrastructure (Location, Type and sizes of buildings, storage facilities, hygiene, etc), number of traders in the market by commodity, quantities of rice and other major commodities on sale, market prices (current, last week, last month, and time series data if available from local authorities, etc), types and quantities of taxes/levies paid by traders, and number and profiles of people in the market.

Page 3 of 157
A purposive sample of each type of rice trader was selected and a Traders Questionnaire (see Annex 4) administered to collect data on the general characteristics of traders (age, sex, education, past experience, etc), trade volumes and flows – current, past, future projections (number of customers by period, quantities sold, and sources of supply), prices and transaction costs – current, past, future projections (purchases, sales), constraints and coping mechanisms, and credit and stocks strategy.
An evaluation of commercial rice processing and storage was undertaken by first of all carrying out a national inventory of all commercial rice processing and storage facilities in the country. Information was recorded on the location of each facility or group of facilities, the make and installed milling capacity at each location, and the capacity utilization of the facilities. A representative purposive sample of establishments (milling and storage) serving the five types of rice production agro-ecologies in the country (mangrove swamps, riverine grasslands, bolilands, inland valley swamps and uplands) was selected, and technical assessment of the facilities carried out to see if they can produce the quality output expected in the local and export market in the ECOWAS region, i.e. installation of pre-cleaning and cleaning equipment, facility for parboiling rice, quality of storage facilities, environmentally safe disposal of wastes, etc.).
A rice processing questionnaire (see Annex 4) was administered to a purposive sample of milling establishments to collect data on: Demography (age and gender of mill manager, education/training of manager and operators); Mill Infrastructure (size of buildings and drying floors, make of walls and roofs); Processing equipment (brand, date installed, rated capacity, estimated investment cost); Mill operation (milling year, custom milling charge, quantity rice milled/ day, work days per month, labour use, fuel use, maintenance cost,)
Design of model rice processing establishments:
Using the information collected above, model rice processing establishments that are expected to meet the quality and environmental standards for a segmented market (i) the domestic rice market in Sierra Leone, and (ii) the ECOWAS market, which Sierra Leone might be expected to supply in the near future are designed. For each of the model establishments an indicative business plan is prepared. The business plans attempt to show the economic viability of the indicative models of commercial rice processing enterprises.
CHAPTER 2. GOVERNMENT AND DONOR POLICIES
The Sierra Leone rice market does not exist in a vacuum. In order to understand the constraints and incentives to its development and evaluate policy options for the medium-term, it is necessary to capture the various links between rice markets and the rest of the economy. A conceptual framework linking the operations of markets, the macro environment, and growth in the agricultural sector is needed (Figure 1:) in order to evaluate the impact of existing policies and guide the design and implementation of any reforms to be suggested by this study.
©
C
o
p
y
r
i
g
h
t
B
i
z
t
r
e
e
I
n
c
.
2
0
1
0
.
A
l
l
r
i

Page 4 of 157
Figure 1: Conceptual framework for assessment of rice policies in Sierra Leone
(after IFPRI, 1996)3
The dynamics involved in the process of rice production, marketing and trade, and the impact of policy intervention will be examined in the study. Following IFPRI (1996) these dynamics can be described as a sequence of mutually reinforcing processes:
1) reform-led improvements in the macro environment increase the efficiency of rice markets which improves the allocation of resources and promotes growth in the agricultural sector;
2) agricultural expansion, induced through specialization and associated with increased marketed surplus, increases liquidity in the agricultural sector, facilitating investment in improved inputs and the intensification of production;
3) this in turn raises supply in rice markets and demand in input markets, resulting in economies of scale in the distribution and delivery systems, which under competitive conditions translates into increased incentives to producers.
The success of market reforms may depend largely on the extent to which additional and facilitating measures are adopted to support the self-reinforcing sequence of specialization, intensification, and economies of scale. Examples of such measures to be examined in the study include provision of market information to strengthen the price transmission process across domestic markets, creation and functioning of the necessary legal environment that reduces the risk and uncertainty associated with market transactions, and supporting infrastructure for the marketing sector. This feedback system is also reinforced by expectations of a stable policy and macro environment; expectations that affect investment decisions in all sectors of the economy and stimulate growth.
2.1 GOVERNMENT POLICIES
Agricultural sector development policies have been the backbone of national development policies and strategies of successive governments of Sierra Leone during the last decade. As the staple food
3 International Food Policy Research Institute, 1996; Rice market monitoring and policy study, Final Report,
Prepared for the Asian Development Bank, Washington DC, December 1996)
Page 5 of 157
and most widely cultivated crop, produced by over two-thirds of the nation’s farmers, rice is the most important agricultural commodity produced and marketed in the country. The importance of this crop is evident from its share of the national economic output. It is estimated that agriculture contributes 45% of the national GDP with rice account for 35% of that national output.
Since 2005, national development strategies and actions have been guided by Poverty Reduction Strategy (PRS) documents developed through wide consultations with economic actors in all sectors of the economy and the support of donors and development partners. Since 2005, three Poverty Reduction Strategy Papers (PRSPs) have been formulated employing the participatory consultative approach and incorporation of lessons learnt from previous strategies. PRSP I covered a period of three years from 2005 to 2007. PRSP II (Agenda for Change) was in effect from 2008 to 2012. The current PRSP III was launched in July 2013 as a national Agenda for Prosperity and will be in effect for five years until 2018.
Government’s national development policy requires that the current Poverty Reduction Strategy Paper - PRSP and Millennium Development Goals MDGs shall be the official framework for all development activities in the country. All Government, donor and development partners’ development programmes and projects are required by this policy to be aligned to that framework and contribute towards the achievement of the outcomes specified in them, for each sector of the economy, within the indicated timelines.
Government’s current agricultural strategy and objectives are summarized in the current PRSP as follows:
To increase the production of staple food crops for food security:
Increase farmers’ access to agricultural inputs – fully operationalize the Agricultural Business Centres (ABCs), including construction and providing equipment; continue to provide extension services to farm households, providing them with improved chemicals, seeds, and tools.
Improve farmers’ use of technology – increase the activities of research and extension services, with plans that focus on use of technology.
Undertake land and water development programmes – rehabilitate inland valley swamps, and develop irrigated rice nucleus farms, which will be linked to out-grower schemes.
Improve the skills and organisation of farmers – roll out schemes for training on improved farming techniques, through Farmer Field Schools, and provide production support to new and existing Farmer-Based Organisations.
Encourage agricultural input markets to be led by the private sector – roll out the ‘agro-dealers’ support programme.
Improve animal health care to facilitate livestock production – establish District Livestock Clinics, provide training for middle-level personnel and Community Animal Health Workers, and provide support to cross-breeding and feed mill initiatives through ABCs.
Construct new feeder roads and rehabilitate existing feeder roads to facilitate the bringing of agricultural production to markets.
Operationalize a strategic grain reserve to ensure that food reserves are available in times of urgent need.
To promote and increase value-adding activities for agricultural goods:
Increase availability of processing facilities – provide agro-processing facilities at ABCs.
Page 6 of 157
Establish hubs of value-adding activities – promote value-adding activities for agricultural goods through the framework of SEZs, industrial Growth Centres and ‘Growth Poles’ (see Pillar 4 for more details).
To increase the production and export of cash-crops:
Facilitate better organisation of farmers: provide support towards the establishment and operationalization of smallholder cash-crop farmer cooperatives.
Rehabilitate existing plantations and facilitate the establishment of new plantations for cash-crop production by ensuring land lease agreement providing investment incentives.
Improve the institutional setup for export standards: build the capacity of the Standards Bureau to effectively monitor the quality of cash-crop exports.
Continue to increase regional and international integration: continue to participate in regional and international initiatives, including certification schemes and roundtables.
Improve access to Finance for Farmers:
Increase access to finance for agricultural workers and firms: build the capacity of financial institutions, including FSAs and Community Banks, to support small to medium scale investments in the agriculture sector, to lend to farmers of all sizes.
Strengthen the capacity of MAFFS
Provide support to the Agricultural Investment Task Force to coordinate agricultural investment and community impact, including the dissemination and enforcement of relevant guidelines as well as interacting regularly with the private sector to discuss challenges.
Strengthen the capacity of Ministry of Agriculture, Forestry and Food Security in the collection and analysis of quality of Agricultural statistics.
2.2 REQUIREMENTS FOR ORGANIZING AN EFFICIENT RICE MARKET
The minimum requirements for the development an efficient rice market in Sierra Leone are the following
1. Infrastructure a. All weather road network connecting production areas to processing facilities, domestic
market centres and export outlets b. Adequate weather-proof storage facilities at bulking and processing areas to reduce post
harvest losses to the barest minimum. c. Shipping and port facilities with adequate equipment for loading and unloading large
tonnages of bagged and bulk cargo.
2. Energy and Power a. Availability of affordable electricity supply for running processing plants. b. Reliable and affordable supplies of petroleum products for running generators and
transporting large cargos of produce from production to processing areas, market centres and port outlets
3. ICT a. Telecommunication facilities for transacting trade and other business activities in a
timely manner b. Information media (radio and print) for the dissemination of market information.

Page 7 of 157
c. Internet connectivity for rapid communication and for conduct trade and financial transactions.
4. Transportation a. Vehicle for haulage of cargos of products from farms to processing depots, market
centres and ports b. Air transportation for business travels into and out of the country as required. c. Sea transportation for movement of people and goods to and from coastal locations
5. Financial services
a. Banking for promoting investment and trade b. Insurance For investment protection and minimization of risk for financial institutions c. Availability of institutional credit for agricultural production and trade
6. Regulation, inspection and certification
a. Standards regulation b. Quality control c. Customs services
An assessment of the Minimum requirements met in the PRSP and the gaps is presented in Table 1:.
2.3. LEGAL AND REGULATORY FRAMEWORK
Rice is the most important agricultural product grown and traded in Sierra Leone. In an effort to create appropriate legal and regulatory framework for sustainable marketing and distribution of agricultural products in the country, the Government of Sierra Leone (GoSL) has passed legislations creating and empowering three strategic institutions:
1. The Sierra Leone Produce Marketing Company:
In 2009 the GoSL caused to be incorporated the Sierra Leone Produce Marketing Company as a limited liability company under the Companies Act No 5 of 2009. The purpose for which the company was formed was to carry on the business of dealers in agricultural products of all kinds. In practice the main activities of this company has been in the processing, packaging and marketing of local rice and in maintaining a buffer stock of this commodity with funding from government.
To enable the company carry out these functions, among others, the Sierra Leone Produce Marketing (Repeal) Act 2013 was legislated in July 2013 “Being an Act to repeal the Sierra Leone Produce Marketing Act, to dissolve the Sierra Leone Produce Marketing Board, to vest the property of the Board in the Sierra Leone Produce Marketing Company Limited…” With these resources vested in the SLPMC and funding for its rice purchases, the company is positioned to among other things, function like the former Rice Corporation, except that it is initially contracting with private mills to process its rice stock.
2. The Sierra Leone Produce Monitoring Board:
On the 13 September 2013, Government passed “The Produce Monitoring Board Act 2013”, being an Act to establish the Produce Monitoring Board to monitor the production, Processing and Marketing of produce…” . The purpose for which this Board was created are among other things to highlight just two are:
Initiate and encourage the processing of produce with the aim of adding value to them for export and for local consumption
Page 8 of 157
Regulate the internal marketing of produce.
3. The Sierra Leone Standards Bureau
The Bureau was created by the Standards Act No. 2 of 1996 (National Provisional Ruling Council Decree, Repeal and Amendment Act No. 3 of 1996) and went into force on the 18th December, 1996. It became operational on the 24th January 2000 assuming the Weights and Measures administration of the Ministry of Trade and Industry. The strategic vision of the bureau is aligned to the National development priorities especially in the Agricultural and Fisheries sectors for the export of agricultural products to international markets.
There is overlap in functions of these three institutions, the former two of which were established in
the same year 2013, specifically for the development and regulation of trade in locally produced
agricultural products. This anomaly must be addressed to avoid confusion in the markets for these
products. It would appear that the two new companies are re-creations of the former Rice
Corporation and the Sierra Leone Produce Marketing Board respectively. It would indeed be a good
idea if that was the case and conscious attempt is made to have them specialize in their functions,
while avoiding the mistakes and pitfalls that prevented the forms organizations in living up to the
great promise they held for the development of markets for the country’s agricultural products.
2.4 DONORS AND DEVELOPMENT PARTNERS POLICIES
To a large extent donor and development partners’ assistance policies to Sierra Leone are aligned to the Poverty Reduction Strategy framework as encapsulated in the PRSP documents. International Financial Institutions programmes also align with the PRSP. The United Nations agencies country programmes are more aligned to the achievement of the MDGs and follow the United Nations Development Action Framework (UNDAF), which is a programme document between government and the United Nations Country Team that describes the collective actions and strategies of the United Nations to the achievement of national development objectives. The UNDAF includes outcomes, activities and UN agency responsibilities that are agreed by government and shows where the United Nations can contribute most effectively to the achievement of national development priorities.
A UN programme that promises to impact on market development in Sierra Leone is the Purchase for Progress P4P food aid programme of the WFP. The new programme policy is to source supplies of commodities in the operational regions. Before now, food aid supplies came from US surplus supplies shipped to the recipient countries. These products found their way into local markets and depressed prices in the local markets. The P4P programmes in Sierra Leone and Liberia is now sourcing rice in-country and enhancing domestic demand for local rice. By enforcing quality standards, the programme is also helping to upgrade quality of local rice generally in the domestic market.
An analysis of donors and development partners’ interventions under PRSPs I and II reveal that their assistance policies have been supportive of the agricultural sector in the areas of infrastructure development and access to finance and markets. The donors and development partners’ intervention matrix presented in Table 2: below describes some of the major activities of these partners of relevance to the development of commodity markets within the framework of the PRSPs in Sierra Leone.

Page 9 of 157
Table 1: Requirements Addressed in the PRSP and Gaps
Market Development Requirements Pillars in
PRSP III
Provision Comments
Infrastructure
All weather rural road network connecting
production areas to processing facilities, domestic
market centres and export outlets
I and 4 Construct 4,818 km of new feeder roads, and rehabilitate 1,182 km of existing feeder roads. Construction of all on-going roads project completed. Roads network expanded and maintained to reach neighbouring countries
Adequate weather-proof storage facilities at bulking
and processing areas to reduce post harvest losses
to the barest minimum.
I Complete the construction and equipping of 650 ABCs (362 existing and 288 new).
The Smallholders Commercialization Programme SCP is Government’s flagship project for transforming agriculture in the country. The programme provides Agribusiness Centres ABCs with storage, processing equipment, offices etc.
Shipping and port facilities with adequate
equipment for loading and unloading large tonnages
of bagged and bulk cargo.
4 Berthing facilities to be expanded and a second port constructed at Sulima. Jetties and terminal buildings to be constructed nationwide
Energy and Power
Availability of affordable electricity supply for
running processing plants.
4 Reliable electricity supply would be available in all district headquarter towns. The energy sector will be unbundled and restructured with a regional power purchased agreement put in place. Up to 600 MW of additional capacity will be installed
Reliable and affordable supplies of petroleum
products for running generators and transporting
large cargos of produce from production to
processing areas, market centres and port outlets.
None Gap A critical requirement essential for the
development industries and agriculture. A
loose PPP, which needs to be strengthened.
ICT
Telecommunication facilities for transacting trade None Gap Service providers need closer regulatory

Page 10 of 157
Market Development Requirements Pillars in
PRSP III
Provision Comments
and other business activities in a timely manner supervision. Consumers may not be getting
equitable value for money
Information media (radio and print) for the
dissemination of market information.
None Gap These services a below international
standards. They need upgrading through
better equipment and training.
Internet connectivity for rapid communication and
for conducting trade and financial transactions.
None Gap Introduction of fibre optic connectivity has
not had the expected beneficial impact on
service quality and cost
Transportation
Vehicle for haulage of cargos of products from
farms to processing depots, market centres and
ports
None Opportunity for None State Actors Investment incentives should be provided
for this essential service in all value chains.
Air transportation for business travels into and out
of the country as required.
4 Construction of another terminal building at Lungi International Airport and second airport at Mamama
This development will have a significant
impact
Sea transportation for movement of people and
goods to and from coastal locations to markets
4 Construction and rehabilitations of jetties and terminal buildings.
This development will have a significant
positive impact.
Financial services
Banking for promoting investment and trade 1 Support Agricultural financial institutions to increase lending to farmers (at least 30% women). Build capacity of MFIs to support youth start-up enterprises Support the implementation of new targeted credit
schemes and create village banks, and Savings and Loans
Associations.
Quotas are unrealistic and unnecessary.
This development will have a significant
positive impact

Page 11 of 157
Market Development Requirements Pillars in
PRSP III
Provision Comments
Insurance For investment protection and
minimization of risk for financial institutions
4 Promote export credit guaranteed scheme
Necessary but not sufficient. Other
insurance schemes need to be developed
against the high risks in agricultural
investments.
Availability of institutional credit for agricultural
production and trade
1 and 4 Access to finance scheme roll out to 82,500 households by supporting the provision of affordable finance through outreach schemes. Implement the Financial Sector Development Plan Support the establishment an Export Development Fund
This development will have a significant
positive impact
Regulation, inspection and certification
Standards regulation 4 Strengthen the Standards Bureau and establish a well-equipped Laboratory for testing of goods
This development will have a significant
impact if done well.
Quality control 4 Provide support to SLIEPA, Standards Bureau and MAFFS to attract foreign investment in ‘cash’ crop production and to monitor export quality. Develop and implement a National Food Quality Policy and Bill
This development will have a significant
positive impact

Page 12 of 157
Table 2: Areas of donor activity and support in the Agricultural Sector of Sierra Leone
DONOR/ DEVELOPMENT PARTNER
INTERVENTION ACTIVITY YEAR TARGET MDA
AfDB Multinational NERICA rice distribution
Technology transfer. Kambia, Moyamba and Districts.
2004-2008 MAFFS
AfDB Agriculture Sector Rehabilitation Project
Support capacity building of MAFFS and rural communities.
2006-2011 MAFFS
AfDB Social Support Project 1 Nationwide construction of community markets, feeder roads, grain stores, drying floors
2003-2008 NaCSA
DFID
“Private Sector Development Strategy
Support Min. of Trade and Industry to develop and implement comprehensive private sector development plan
2006-2007 MTI
EC “Rehabilitation of 650km Feeder Roads in Four Districts”
Feeder road rehabilitation in Pujehun, Kambia, Port Loko and Kenema districts. Improved access to markets and social amenities for the rural poor.
2006-2010 SLRA
EC “Road Infrastructure Programme”
Improvement to the roads network by major trunk road rehabilitation and maintenance.
2004-2011 SLRA
EC “Freetown Conakry Road”
Freetown Conakry road rehabilitation, Phase I - Rehabilitation to laterite standard
2003-2012 SLRA
GTZ Promotion of Youth Employment through Private Sector Development (GTZ)
Facilitates process of job creation (10 000 youths) through the promotion of the private sector in urban and rural area
2004-2010 GTZ through Civil Society and Private Sector Institutions; Ministries of Youth and of Local Gov.
GTZ National Employment Survey (GTZ)
Identify nationwide potentials and obstacles in the labour market in rural and urban areas
2006-2007 GTZ through Task Force Min. of Labor
KfW Microfinance Sector Programme (KfW)
Establishment of Microfinance Investment and Technical Assistance Facility for promotion of sustainable supply of microfinance products
2006-2008 MITAF
(KfW)
Microfinance Banking (KfW)
Establishment of a Microfinance Bank 2006-2008 KfW through ProCredit Bank
(GTZ)
Seed Multiplication (GTZ)
Development of a Sustainable Seed Programme
2004-2007 German Min. Of Agriculture through FAO Trust Fund
(GTZ) Food-for-Work (GTZ)
Food-for-Work Programme. rehabilitation of rural infrastructures and job creation for Youth in Kono and
2004-2007 GTZ through MAFES and Min. Of Local

Page 13 of 157
DONOR/ DEVELOPMENT PARTNER
INTERVENTION ACTIVITY YEAR TARGET MDA
Kailahun Gov.
IDA “Infrastructure Development Project”
Road construction. Airport and port rehabilitation.
2005-20011 SLRA, SLAA, SLPA Min. of Transport and Communication
IFAD “Rehabilitation and Community-based Poverty Reduction”
Support to household recapitalisation. 2006-2010 MAFFS
IFAD RPCIF Establishment of Financial Services Associations and Community Banks
2006-2010 MAFFS
Islamic Development Bank (IDB)
“Rural Infrastructure Development Project”
Nationwide, construction of District and Regional Libraries, community markets, community centres, feeder roads
2004-2007 NaCSA
Islamic Development Bank (IDB)
“Social Action Support Project 2”
Nationwide, construction of District and Regional Libraries, community markets, community centres, feeder roads
2004-2007 NaCSA
JICA “Agricultural Development Project in Kambia District”
Support to rice production and processing in the Kambia District
2006-2008 MODEP MDAs MAFFS
Grant “Improvement of Power supply in Freetown, Western Area”.
Procurement and installation of two sets of five megawatt diesel engine generators in Kingtom Power station, construction of substations, transmission lines, rehabilitation of transmission system in Western Area.
NPA
CHAPTER 3. RICE OUTPUT MARKETS
3.1 VALUE CHAIN MAPPING
For each rice value chain (domestic rice, imported rice) EDS has prepared an institutional and
organization map setting out the interrelationships between the actors involved, identifying nodes
targeted by these institutions, identifying geographic presence, defining scale of
intervention/initiative in the product chain and providing descriptions of interventions. This study
will also provide a clear description of the situation and status of each of the value chains and of the
efforts underway to develop them.
Roberts & Fornie (2010) provide the latest and most comprehensive description of the rice value chain in Sierra Leone. A graphical representation of the major functions and participants in the rice value chain as produced by Roberts & Fornie (2010) is shown in Figure 2:.4 The role of the key participants in the value chain and their functions and their dynamic inter-relationships is presented in Table 3.
4 A. Tom Roberts and Samuel Fonnie (2010) Rice: A Value Chain Map and Solutions

Page 14 of 157
Figure 2: Rice value chain map, Sierra Leone
Source: Roberts & Fornie, 2010
MAFFS – Free
inputs,
SLARI/Research
Seed Project
Input dealers
NGOs
Technical training – MAFFS,
NGOs
FFS/FCEs
NGOs
Rice VCA by PAGE
PAGE, IFAD, RPSDP, FSCA ,
building capacity in
management capacity of
groups
RFCIP, PAGE, RPSDP –
production credit, matching
grants, innovation fund
Farmers, Traders. Producer
Groups, FCE Model
PAGE, RFCIP & RPSDP – credit
guarantee/innovation fund to
strengthen groups;
Establish & strengthen AMIS using
FFS & other groups.
Link groups to processing plant,
introduce WR System
Increase availability & access to
credit (Partner with FIB, Manocap,
Brac, Finance Salone, Community
Banks) Link groups to WFP P4P program
Specific Inputs
Markets
Rice
Production
Processing
Transportation
Trading
Input & investment policies,
regulations, fees & taxes,
coordinate development
activities,
Plant protection strategy
to Improve technical
knowledge on inputs
Link rice breeding to
market demand
Introduce grades &
standards,
Food safety regulations
Weights & measure,
packaging, branding
Develop rural roads
Warehousing receipt
Encourage Cross border
trade
Simplify common tariffs &
trade
Increase availability & access
to credit
Partner with FIB, Manocap,
Brac, Finance Salone,
Community Banks
Collection Bulking
FBOs, Large
traders, Brokers,
Small traders,
Small & large transporters
Small farmers,
Market vendors,
Cookery shops
Restaurants/Hot
els, Cross border
markets
(Conakry)Super
markets
Enabling
Environment MAFFS, SLARI &
Standards Bureau
Chamber of Agriculture, SLIBA &
Standards Bureau &SLRA
Promote regional exports, facilitate
linkages & provide market information RCPRP, RFCIP, ASREP. GTZ, LRRD, PAGE, RPSDP, PSDSP, FSCA
GTZ/ FAO (Seed Project) & PAGE, Nerica Project, Seed Project
Development Partners:
DFID, EU, USAID, IFAD, WB, FAO, AfDB,
MAFFS, MTI, JICA, USAID

Page 15 of 157
Table 3: Key stakeholders and their activities along the rice value chain
Value Chain Activity
Participants & Activity
Input Supply/ R&D Research, Development, Multiplication and Dissemination SLARI-RARC (Research, development, Foundation seed) JICA – Research/Extension NERICA Project (multiplication & dissemination) Research-in-Use (RIU) Government Strategies & Policies Agenda for Change and Prosperity (PRSP II & III) NASDP/NRDS/SCP PSDS Research, Seed & Fertilizer Policies MAFFS
Distribution of seed rice on recovery basis GTZ/FAO
Seed Project – Production & marketing of certified seeds to farming communities. Develop Public-Private Partnership to improve the seed industry
NGOs Provide improved rice seeds either directly or through voucher systems. PAGE/SNAP - empower producer groups to access improved seed & technology; technical
training of farmer groups, introduce GAPs ASREP supports IVS rehab/development, provides improved seeds & IVS drainage RCPRP supports IVS rehab/development, provides improved seeds Private Sector Companies Seed Tech (Seed rice) Fuladu (Seed Rice) KEL International-sells fertilizers & plant protection products China Machinery Centre (WINGIN) – Fertilizers, tractors, power tillers, rice mills, combined
harvesters Gouji – Fertilizers, small tractors, power tillers,
Production & Processing
Government
MAFFS provides extension support to farmers through demonstration farms; establish FFS & ABC
Provide subsidized mechanized service (tractors & combined harvesters) to producer communities
Distributes rice mills through the District Directorates of Agriculture; includes construction of stores & drying floors, enhancement of existing mills by providing pre-cleaners, scales and bagging equipment at no cost to groups & individual farmers. Small farmers
Smallholder rice producers in isolated production, uncoordinated supply chain
Farmer Based Org involved in production and some mechanized processing FFS Agribusiness Centres Marketing Assocs. Farmer Controlled Enterprises i.e. limited liability companies
Medium/Large farmers (100 to 1000 acres cultivated mechanically), Few with processing capacity; sell paddy as seed rice to MAFFS & some producers. Limited postharvest capability & lack adequate storage
Projects
IFAD RCPRP Support producers (groups, individuals) to rehabilitate old IVS and develop new IVS RFCIP

Page 16 of 157
Value Chain Activity
Participants & Activity
Pilot rural finance though Financial Services Associations (FSAs)
AfDB ASREP Ag sector rehabilitation including rehabilitation & development of rice production in the
predominant ecosystems in Kambia, Kenema, Moyamba, Port Loko & Pujehun Procurement & distribution of rice mills at no cost to farmer groups as well as individual
farmers FAO Support to the Special Project for Food Security (SPFS) to develop the FFS as an extension
tool Provide small mechanized mills to FFS networks Promote irrigation & drainage especially in the development & management of IVS
Food Security through Commercialization of Agriculture (FSCA) Establishing/strengthening sustainable FBOs through increased production, value addition
and improved marketing; Support to Value Addition and Marketing by building the capacities of the FBOs and
strengthen service provision to support value addition and value chain processes World Bank
Rural and Private Sector Development Project (RPSDP) United Nations Development Program (UNDP)
Procurement & distribution of 105 mills (72 manual & 33 mechanized); No pre-cleaners or other equipment installed
Private Sector Companies (medium & large scale) Max Thompson, Abhajar Rice Company, Doris Kargbo, Scott Manga, Fachima, FINIC Agro -Production, Fuladu, Trudy Appiah & Momoh Fofanah. Major activity is paddy production, few process paddy, most market paddy and do not undertake any value addition.
NGOs USAID/PAGE/SNAP (Kailahun, Kenema, Koinadugu and Kono Districts)
Establish farmer controlled enterprises, strengthen existing FBO, FFS & Marketing Associations using the value chain, increase productivity
Build capacity of producer companies/organizations, strengthen value chains and enhance marketing services to support value addition and the value chain processes, coordination and linkages
Support Amendment of Company Act to encourage rural agro-enterprise development EU Linking Relief and Rehabilitation for Development (LRRD) Action Aid – increased rice production in the Kambia & Port Loko District through
farmer groups; provision of improved rice seed (Pa Kiamp to farmer groups)
Collection/ Bulking Smallholder farmers
Small traders - Primary collectors
Large traders
Brokers (Barmoi Market)
Large producers also buy from farmers they service (Fuladu, Abhajar, Fachima, Momoh Fofanah, Doris Kargbo, etc.
Transportation/ Infrastructure
Government
Rehabilitation of feeder roads and farm-to-market roads Private Sector
Trucking companies
Source: (Based on Roberts & Fornie, 2010)

Page 17 of 157
3.2 DOMESTIC RICE PROCESSING AND TRADE
The rice marketing system is based on a complex set of inter-relationships among farmers, collectors, traders and processors. Rice flows from areas of surplus such as the Scarcies area in the North (Kambia and Port Loko Districts), the Bolilands also in the North (Bombali and Tonkolili Districts), and the Riverine grasslands in the South (Bonthe District), to demand centres – the main cities and across the border. Figure 3: is a generic diagram of domestic rice marketing channels in Sierra Leone.
Production
The marketing of a commodity, in this case rice starts with production and sale by farmers. In Sierra Leone rice is produced mainly by small producers (see Section 4.1). Ninety-five percent of the marketed surplus of rice is estimated to come from small producers. Most rice sales take place in 2 - 3 batches a year in the farmers’ village. However a third of mangrove farmers make sales in the nearby periodic (Lumor) market, with a quarter transporting some of their husk rice to Freetown for sale (EDS, 2009). Rice prices obtained by farmers vary slightly by region and type of rice farming system, with boli and mangrove swamp farmers in the Kambia District receiving the highest prices
Processing
After harvest most farmers leave rice sheaves in the field to dry. Threshing and winnowing are usually done by hand and further drying is on mud floors, tarmac roads or concrete drying floor.
Parboiling
Spencer et. al. (1976) estimated that 56 % of domestic rice consumed in the north and 20 % in the south was parboiled, with more parboiled rice being consumed in urban than in rural areas. Parboiling of domestically produced rice is still widespread in Sierra Leone with, in most cases 60 – 70% of farmers home- consumed rice being parboiled. The proportion of rice sold by farmers that is parboiled is lower (20-30% in the bolis and about 50% in the mangroves), but most of it is then parboiled by traders before milling (EDS, 2009).
Parboiling usually involves use of a large metal pot, half or a whole 44 gallon drum (2 or 5 bushel capacity). Using these containers about 15 bushels can be parboiled during an eight hour work-day. The grains of paddy are boiled for a few minutes, the water drained, and the grains allowed to steam until a few grains are open. The grains are then spread out to sun dry on concrete floors, hardened mud floors, tarmac roads, mats, or tarpaulin. In order to minimise breakage of grains during the drying process, processors try to ensure that only a few grains are open during parboiling, and that drying does not occur under direct sunlight. Parboiling usually takes place in villages near the farmer’s residence, although it is now common for it to take place within the vicinity of mills.
Hand Pounding
Hand pounding involves dehusking of paddy using a mortar and pestle, almost exclusively by women and children. Mortars are of various sizes and pestles are usually about six feet in length. Un- parboiled (raw) or parboiled rice may be hand pounded. After pounding the rice is winnowed and the operation repeated several times depending on the degree of milling required. From work studies Spencer et. al. (1976) reported that roughly 37 Kg can be pounded per person in an eight-hour workday (4.6 Kg per hour). Hand pounding produces an output of raw rice with about 47 % brokens, compared to about 32% brokens for parboiled rice. Since hand pounding techniques have not changed for a century no attempt will be made to repeat the work studies in this project, and the above input-output figures are used in the cost and returns studies reported later. As shown in Figure 3: very little of the rice marketed in Sierra Leone is now estimated to be hand pounded

Page 18 of 157
Figure 3: Market channels for marketed surplus 0f domestic rice in Sierra Leone
Note: Percentage distributions are estimates by EDS based on expert opinions using high variant for estimated marketed surplus (see Section Chapter 4)
Small Rice Mills
There are two types of small rice mills in operation in Sierra Leone. These are the Engleberg steel cylinder type mills (commonly called Hullers) and the rubber roller mills popularised by the Japanese manufacturer Satake. Both types of mills are usually powered by 10 - 20 hp. engines. Over 400 small mills are currently estimated to be installed in Sierra Leone (see Chapter 5)
Flow of Paddy
Flow of milled rice
20 % 10 %
Small Scale Farmers
Collector/ Assembler Hand Parboiling
Hand Pound
Wholesalers
Retailers
Urban Consumers (78,000mt milled rice)
(Consumers)
0 %
5%
Large Scale Farmers
Rice Producers
(187,000 mt paddy)
Machine Parboiling
Machine Milling 70 %
0 % 65 %
Rural Consumers (8,000mt milled
rice)
Export Market (20,000 mt milled rice)
(Consumers)
0 %
70%
18 %
85%
5%
2 %
5 %
5 %
5 %
20 %

Page 19 of 157
Assemblers/Collectors
Acting as bulk builders, traders are a necessary link within the market channel especially in a fragmented production system as is the case in Sierra Leone. As buying agents for Processors (including large scale farmers) and Wholesalers, they collect paddy from small-scale producers. They also buy hand pounded rice from farmers and sell directly to the consumers in rural markets. Frequently they provide value addition services, such as parboiling and milling. Assemblers often do not meet common regulatory requirements, i.e. being officially registered businesses, possessing appropriate storage, being equipped with standardized weighing scales.
Wholesalers
This group includes cross border traders as well as wholesalers who supply the towns and cities in Sierra Leone, as well as large scale producers. They often buy milled rice from Assemblers in rural areas and transport to their stores in urban areas. Large scale producer/wholesalers also buy milled rice from neighbouring small scale farmers. Sales are mainly to retailers in urban areas, although some sales (by bag) are made to consumers.
Retailers
These are the ubiquitous traders found in daily or periodic markets selling to consumers in small lots – often by cup weighing around 0.25Kg. They buy in bulk from Wholesalers usually located in the same city or District.
Transportation
Local rice is transported by truck of various capacities between producing and market centres. Paddy is transported very short distances to mills located in the producing District. Milled rice (raw milled and parboiled) is transported over longer distances between processing and demand centres either in bulk by wholesalers or in small lots (one or two bags) by retailers who travel outside their districts to obtain supplies. The last activity along the value chain is the distribution of rice within the urban towns and cities by wholesalers to retailers by push carts (‘omolankays’), taxis and small pickup trucks.
Rice Trade in the Bolilands (Bombali and Tonkolili Districts)
Mile 91 in Tonkolili District is a major hub of the rice trade in the Bolilands of Sierra Leone. Rice flows from the major bolis in the Chiefdoms of Yoni, Kholofa Mabang, Kholifa Rowala and Gbonkonlenken. Located in the middle of the bolilands rice area, Mile 91 has the advantage of being a junction town linking roads from the boli farmlands with highways leading to the major deficit/consuming areas of Freetown, Bo, Kenema and Koidu. Rice traders see an advantage in assembling paddy rice bought in the remotely located farms, in large stores at the mills in Mile 91, where they are parboiled, milled, packed and shipped to market destinations. There are four rice mills operating in the town. Two are privately owned and one is provided each by the RPSDP and the SCP
The rice traders are organized as a Rice Dealers Association which, among other things, appoints agents in the production areas to purchase rice from farmers on behalf of their members at harvest time. The associations also organize transportation to transfer paddy from farms to mills and regulate the price of the commodity by operating buffer stocks. Membership of an association lends credibility to the traders with financial institutions and farmers. In the Tonkolili District, Yoni Community Bank and the NGO BRAC are actively supporting rice traders, the latter focusing on women traders. Some rice traders move into the production areas themselves, with cash during the harvest to purchase paddy from farmers.

Page 20 of 157
Rice Trade in the Mangrove Swamps (Kambia and Port Loko Districts)
The Bamoi Periodic market is located in the Kamba Section, Magbema Chiefdom, in the Kambia District. This settlement, which has now grown into a medium sized town is dissected by the Freetown - Conakry Highway, about 160Km from Freetown. The market town in located about 20Km from the District Headquarter town of Kambia and 40km from the Guinea Sierra Leone border and 10km from Rokupr a major port for sea crafts that transport paddy rice from mangrove rice fields of North West Sierra Leone and adjacent islands to the mainland for processing and trade. The Bamoi Periodic Market is also close to Mambolo town in Mambolo Chiefdom, which prides and proclaims itself the “Rice Bowl” of Sierra Leone.
The market town is open for business seven days a week but is busiest on Saturdays and Sundays when produce dealers bring commodities to trade with dealers from Guinea, Mali and other parts of Sierra Leone. The largest numbers of traders deal in small quantities of seasonal produce, which are re-traded in the domestic market in various locations. By far the greatest volume of goods traded on Saturdays and Sundays are garri, rice and palm oil, in order of importance. These products are exported mainly to Guinea and Mali. Groundnut is imported from Guinea and Mali into Sierra Leone through this market center.
The Chairman of the Stores Owners Association, who own 43 stores in the market and others, estimate that on a weekly basis an average of 7000 bags of 60 kg each (420 tons) of rice, is shipped from Bamoi to external markets. An average of an additional 3000 bags (180 tons) is stored for a period of a week until the next Market weekend. These data are indicative of the order of magnitude of the trade that goes on in the periodic market. To obtain more accurate data for planning, data should be collected over a period of at least one year and analyzed.
Nonetheless, considering the volume of trade indicated by these estimates the situation calls for action to take advantage of this market opportunity for these products in which Sierra Leone has comparative advantage in the regional market, by:
a) Formalizing the export trade in these commodities through trade negotiations with the importing countries
b) Investing in domestic value addition to maximize export revenues from them
c) Establishing an export processing zone in that location, with appropriate infrastructure, services and amenities to function at international standards for such facilities.
Rice Trading in the Riverine Grasslands (Bonthe District)
The deep flooding grasslands of the southern river and tidal flood plains in Bum Chiefdom, Bonthe District and surrounding areas constitute an important ecology for sustainable rice production in Sierra Leone. The annual flooding of this area due to rises in the levels of the Jong, Sewa and Waanje rivers in their lower reaches across the southern grass plains results in the deposition of silt and plant nutrients eroded and leached from the forested areas of the sources and upper reaches of these rivers. This process results in a natural annual restoration of the nutrient status of this area and the development a wetland ecology that is suited to rice culture.
Due to the challenges of the prevailing ecology, most farmers in the Torma Bum grassland areas grow local floating rice varieties5. It is estimated that 60% of producers of these varieties parboil their harvest to avoid high post harvest losses through breakage and low percentage milling recovery due to their low starch content. It is also claimed that, for this reason the varieties are recommended for diabetics, which claim would give them a market niche if it were scientifically proven to be the case.
5 The most widely grown varieties are: Kalawai, Gbobi and Corbati

Page 21 of 157
At present there are four rice mills installed at Torma Bum, the Chiefdom headquarters of Bum Chiefdom. One of them, of unknown ownership, was supplied by MAFFS, and is a rice milling plant estimated to have a 2.5 ton per hour output capacity. It carries SONALIKA brand name and is of Indian manufacture. It is powered by a 62.5 KVA generator of the same brand name. The plant is complete with a brisket making plant that convert rice husk from the milling operation into combustible rods to fire par boiling tanks and steam generators for the par boiling of paddy rice for milling.
The other three are medium sized mills of approximately 800 kg per hour output. Of these two provide custom milling services but one, owned by a private company that provides mechanical cultivation services to farmers in the area is for milling the company’s own rice only.
Rice from the area is purchased by traders and shipped to Bo, Kenema and Freetown. However most of the rice destined for Bo is shipped as parboiled husked rice, which are milled and bagged in Bo before sale to rice sellers.
3.3 THE EXPORT RICE TRADE
3.3.1 The current informal rice export trade
Rice is currently traded informally among the Mano River Union countries (Sierra Leone, Guinea, Liberia and Cote d’Ivoire). There is an apparent net flow of rice from Sierra Leone to the neighbouring countries.
Periodically, when rice prices are high particularly due to outside forces, there is the tendency for restrictions to be put on the exportation of rice by State authorities. It is clear that this measure has had very little, and if any, only temporary effects on rice prices. By contrast such measures have tended to undermine the long term effects of prices in stimulating production and development of regional trade. Furthermore, they are contrary to the ECOWAS treaty which provides for the free movement of people and goods across the borders of member countries.
WFP6 reports that Kambia district of western Sierra Leone routinely exports parboiled local rice to nearby Conakry. Guinea’s Système d’Information sur les Produits Agricoles en Guinéee (SIPAG) estimated that on average, some 360 tons of local parboiled rice entered Guinea from Sierra Leone every month during the final quarter of 2009. WFP states that it is likely that these numbers are underestimated, as they only reflect quantities received through the border post at Pamélap. These volumes transit through Barmoi international market in Kambia.
The fact that the WFP estimate is likely to be an underestimate is confirmed by expert opinion obtained by EDS during its field survey. The Chairman of the Stores Owners Association in Barmoi, who owns 43 stores in the market and others, estimate that on a weekly basis an average of 7000 bags of 60 kg each (420 tons) of rice, is shipped from Bamoi to Guinea. An average of an additional 3000 bags (180 tons) is stored for a period of a week until the next Market weekend. These data are indicative of the order of magnitude of the trade that goes on in the periodic market. To obtain more accurate data for planning, data should be collected over a period of at least one year and analysed.
3.3.2 The prospects for expanding the rice export trade
Data presented in Section 4.1 show that Sierra Leone has a comparative advantage not only in producing rice to supply its domestic markets but also for regional trade. As discussed above the
6 WFP, 2010; Cross border trade and food security: Liberia & Sierra Leone, May 2010

Page 22 of 157
country already has substantial exports to neighbouring countries. There are good prospects for further expansion of exports to regional markets7
Regional demand for rice is high and growing rapidly (Figure 4:):
The 15 countries of the Economic Community of West African States (ECOWAS) annually import 4.7 million metric tons of rice valued at over US $1.2 billion; imports are projected to grow to over 6.5 million metric tons by 2020
The 5 countries in Southern Africa annually import 1 million tons of rice valued at over US$ 322 million; with imports likely to grow to over 1.5 million metrics tons by 2020
Figure 4: Current and Projected Regional Rice Imports 1961 – 2020 (metric tons)
Source: SLIEPA, 2012
Two factors are driving demand for imported rice :
Rising incomes and changing diets leading to increased consumption of rice – growth in per capita rice consumption has increased from around 4% per year in the 1980s to over 6% in the current decade
Expansion of domestic production is limited because of limited scope for continued expansion of rice acreage using current technologies; significant investment is needed to move to more modern irrigated rice production technology
7 SLIEPA, Sierra Leone Investment Outreach Campaign, Opportunities for Investors in the Rice Sector, Update:
September 2012
-1,000,000
0
1,000,000
2,000,000
3,000,000
4,000,000
5,000,000
6,000,000
7,000,000
8,000,000
Me
tric
To
ns
West Africa (Current Tech) West Africa (No area expansion)
Southern Africa (Current Tech)

Page 23 of 157
Sierra Leone’s location is ideal for supplying regional rice markets (Figure 5:)
Located at the far Western end of Africa’s equatorial belt, Sierra Leone is closer to the main regional rice markets (1100 nautical miles to Nigeria & 3200 to South Africa) c/f the main rice exporters (4880 – 9500 nautical miles)
With the Freetown Port now under private management, its natural advantages and location are likely to make it a major regional hub for shipping
Figure 5: Distances to major regional rice markets for Sierra Leone compared to other
sources
Source: SLIEPA, 2012
Producers in Sierra Leone have favoured access to key markets:
African Union and ECOWAS trade protocols: The ECOWAS trade Liberalization Scheme has was established in 1979 as a first step towards the creation of a common market through the liberalization of trade by the abolition, among member states8, of customs duties on
8 Benin, Burkina Faso, Cape Verde, Cote d’Ivoire, the Gambia, Ghana, Guinea, Guinea Bissau, Liberia, Mali,
Niger, Nigeria, Sierra Leone, Senegal and Togo
Page 24 of 157
imports and exports and abolition of non-tariff barriers. AU and ECOWAS policies on the development of African rice trade are encapsulated in ECOWAP, which is building regional productive capacities and developing the region’s comparative advantage in rice production. The need to protect African smallholder producers from the challenges of the global market is central to this policy framework. At issue is what uniform tariff rate to apply across the region to compensate for subsidies that give foreign producers a price advantage over small African producers. The options are between Nigeria’s 110% and the 10% tariff band in which rice has been placed under the March 2013 joint ECOWAS/WAEMU Ministerial agreement on the Common External Tariff (CET), which some consider inadequate protection for smallholder African farmers. Other challenging issues relating to the development of ECOWAP include: possible WTO limitations on preferential procurement arrangements for cereals produced by smallholder farmers; the design of regional trade defence mechanisms; the final market access offer to be made on food and agricultural products to the EU under the proposed West Africa–EU Economic Partnership Agreement (EPA).
Mano River Union Trade Protocols: The MRU was established in 1973 to foster economic co-operation among its member states: Sierra Leone, Liberia, Guinea and Cote d’Ivoire. The primary objective was to establish a Customs Union by creating a free trade area devoid of barriers to trade as a means of expanding the market available to its members with a view to expanding their productive capacities and growth potential. Achieving these objectives require harmonization of trade policies among the member states and developing their hard and soft infrastructures to collectively overcome challenges limiting trade within the bloc, the ECOWAS region and international markets. Trade within the union is therefore underpinned by a policy of free movement of peoples and goods across the existing borders, within framework of existing trade protocols. Rice is a strategic commodity historically traded among the member states of the union. At present the trade is largely informal but due to the importance of the cereal as the staple of the sub region, its trade needs to be formalized and regulated in the interest of safeguarding food security within the union.
EU Market: Sierra Leone is one of 49 LDCs covered by the EU’s Everything But Arms (EBA) agreement so producers in Sierra Leone are permitted to export all products (except arms) to the EU duty-free and quota-free.
3.3.3 Constraints to full exploitation of Sierra Leone’s comparative advantage9 At the farm level, farmers:
• Lack of fertilizer and knowledge of appropriate use • Lack of seed, poor seed germination, inappropriate seed for ecology where planted • Lack of credit some areas charge 100% interest, many farmers have high debts • Lack of chemicals and knowledge of use for control of pests • Very little mechanized cultivation, (tractors do not typically last beyond 2 or 3 seasons) • Lack of appropriate post harvest technology resulting in high post harvest losses • Lack of market information – farmers are price takers • Lack of enforcement and knowledge of grades and standards • Lack of irrigation, many farms are rain-fed • Many inland valley swamps are no longer intensely cultivated in the intensive paddy style introduced in the 1970’s and 80’s.
9 From Dunstan Spencer, Abdoulaye Fall and Alpha Kergna; Africa Rice Development Sector Study (Mali,
Senegal and Sierra Leone): Report for the International Finance Corporation (IFC), September, 2011

Page 25 of 157
At the level of Brokers and Traders: • Lack of uniform grades and standards, e.g. there are multiple definitions of a bushel, different cup sizes, different can sizes, different bag sizes • Lack of market information • Low trust • High risks particularly when crossing the border • Poor transportation and Logistics
At the level of Wholesalers of Local rice:
• Lack of timely market information and transparency • Low trust • Non uniform grades and standards • Consignment buyers sometimes disappear • Many are sources of market power
At the level of Wholesalers of Imported rice:
• Poor transportation and logistics • No market information system
At the level of retailers who sell rice in the terminal markets:
• Lack of uniform grades and standards • Lack of market information systems
Another issue constraining Sierra Leone’s ability to fully exploit its comparative advantage relates to the land tenure situation, particularly for expansion of large scale commercial rice farming. The Sierra Leone Agricultural Sector Review document10 concludes that for the small scale subsistence agriculture prevalent in the country now, the existing land tenure system is adequate. The study, however, identified the following points that need to be highlighted (particularly with regards to larger scale farming):
a) The first is the inability of the banks and other financial institutions to provide farm credit based on the current system of land holding. The issue has been that the financial institutions do not consider the existing system as providing the needed security on which farm credit could be advanced. The individual’s usufructuary estate does not provide the needed security. This is because the individual cannot mortgage the land on which he works without the consent of the family head and even where he can obtain the consent, the financial institution cannot sell the land to a purchaser who is not a member of the family should the farmer default in payment. To expect someone within the family to purchase the land in such circumstances is to show a lack of understanding of the social system operating in the traditional societies of Sierra Leone. To solve this problem, it has been suggested that community interests be registered to enable the communities’ access farm credit.
b) For large scale commercial farming, there already exist some arrangements under which farmers and companies could acquire leases on land and there is evidence that many farmers particularly expatriates have taken advantage of this. What needs to be done is to use the arrangements to fashion out new legislation, which take modern demands into consideration, and generally
10
Agricultural Sector Review and Agricultural Development Strategy, Volume I, June 2004. Ministry of Agriculture, Forestry and Food Security, Ministry of Fisheries and Marine Resources, Assisted by Food and Agricultural Organization of the United Nations (TCP/SIL/2904), In association with: World Bank, International Fund for Agricultural Development and United Nations Development Program

Page 26 of 157
streamlines the system to ensure that all parties know the full extent of their commitments under a leasehold arrangement.
c) It does not appear that the tenure system has sufficient safeguards for accommodating the interests of cattle owners in the community. The result is a constant conflict among crop farmers and those who rear cattle. It is important that a continuing dialogue among the people is instituted until a solution could be found
3.4 IMPORTED RICE TRADE
The marketing system for imported rice (Table 4:) is much simpler than that for domestic rice. Until the intervention of the MTI in October 2013, all importation of rice was undertaken by the private sector. The key government agencies and parastatals involved in the rice trade during the 1970s and 1980s included the Rice Department, the Rice Corporation and the Sierra Leone Produce Marketing Board (SLPMB), but by the late 1980s the private sector had assumed the dominant role in the marketing of both local and imported rice.
Table 4: shows that the quantity and value of rice imports have increased substantially in the last five years indicating that claimed increases in domestic rice production have had minimal effect on
imports. The effects on informal exports is discussed in Section 3.3.1. Figure 7: shows the monthly distribution of imports in the last two years for which data are available, indicating that there is no clear seasonal trend in imports. The distorting high peak in October 2013 was due to the large amount imported by the Ministry of Trade and Industry (MTI), as the Government intervened directly in the imported rice trade by importing over 20% of the total rice imported into the country
in that year (Figure 8:).
Figure 8: also shows that the six (6) most importers of rice in Sierra Leone accounted for over 80% of all rice imports in the last two years. The situation has therefore not changed much in the last 30 years in terms of the number of importers dominating the trade, although their relative importance change from time to time11.
11
Four firms (Bazzy, Halloway, Hedjazi and Saad) handled all rice imports in 1996 (Spencer et all, 2007;
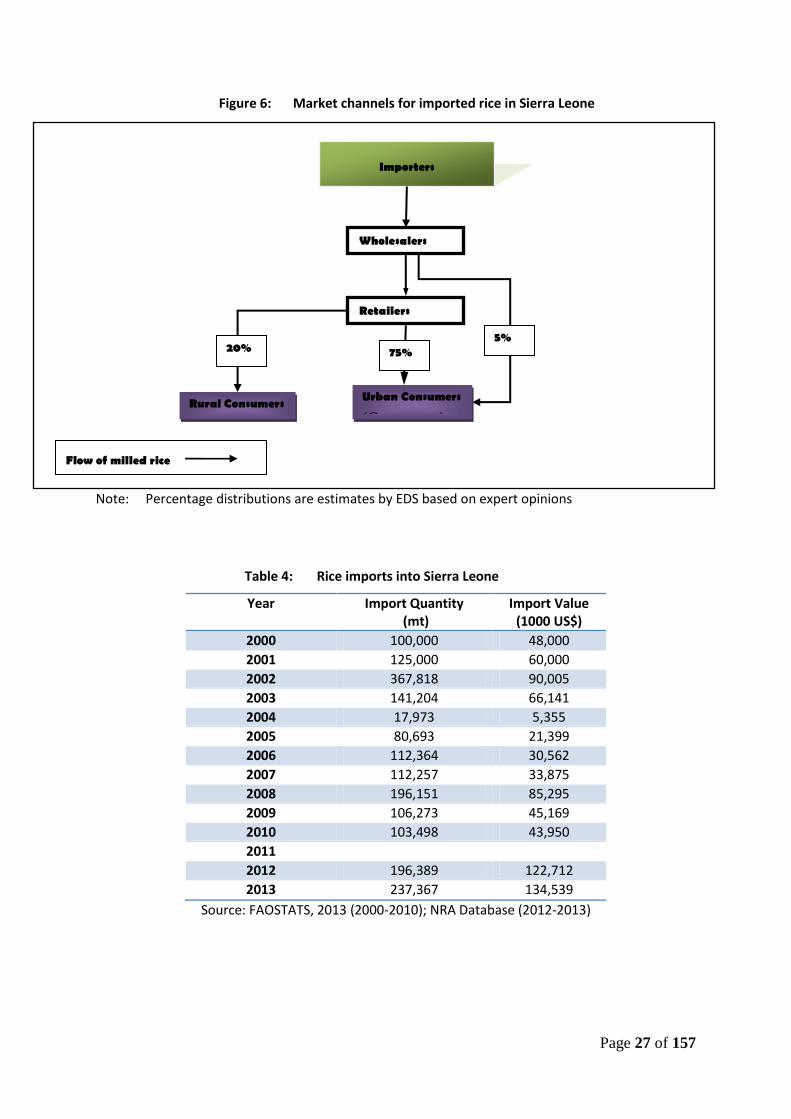
Page 27 of 157
Figure 6: Market channels for imported rice in Sierra Leone
Note: Percentage distributions are estimates by EDS based on expert opinions
Table 4: Rice imports into Sierra Leone
Year Import Quantity (mt)
Import Value (1000 US$)
2000 100,000 48,000
2001 125,000 60,000
2002 367,818 90,005
2003 141,204 66,141
2004 17,973 5,355
2005 80,693 21,399
2006 112,364 30,562
2007 112,257 33,875
2008 196,151 85,295
2009 106,273 45,169
2010 103,498 43,950
2011
2012 196,389 122,712
2013 237,367 134,539
Source: FAOSTATS, 2013 (2000-2010); NRA Database (2012-2013)
Wholesalers
Retailers
Urban Consumers
(Consumers)
20%
Flow of milled rice
Importers
Rural Consumers
(Consumers)
75% 5%
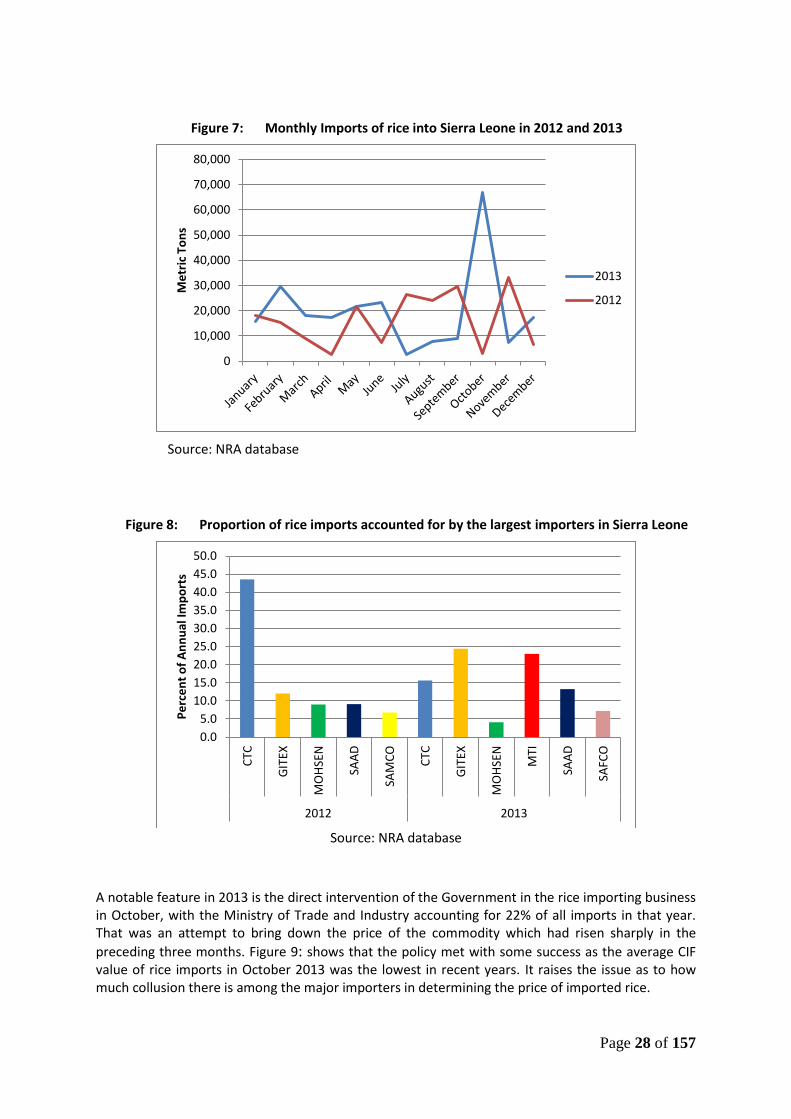
Page 28 of 157
Figure 7: Monthly Imports of rice into Sierra Leone in 2012 and 2013
Source: NRA database
Figure 8: Proportion of rice imports accounted for by the largest importers in Sierra Leone
Source: NRA database
A notable feature in 2013 is the direct intervention of the Government in the rice importing business in October, with the Ministry of Trade and Industry accounting for 22% of all imports in that year. That was an attempt to bring down the price of the commodity which had risen sharply in the
preceding three months. Figure 9: shows that the policy met with some success as the average CIF value of rice imports in October 2013 was the lowest in recent years. It raises the issue as to how much collusion there is among the major importers in determining the price of imported rice.
0
10,000
20,000
30,000
40,000
50,000
60,000
70,000
80,000
Me
tric
To
ns
2013
2012
0.0
5.0
10.0
15.0
20.0
25.0
30.0
35.0
40.0
45.0
50.0
CTC
GIT
EX
MO
HSE
N
SAA
D
SAM
CO
CTC
GIT
EX
MO
HSE
N
MTI
SAA
D
SAFC
O
2012 2013
Pe
rce
nt
of
An
nu
al Im
po
rts

Page 29 of 157
Normally one would expect a mark-up of 10 – 30% between FOB Asian ports and CIF for West African ports. For example freight costs for shipment of rice from Bangkok to Tema in Ghana are about US$ 90.00 per ton and to Freetown in Sierra Leone between US$ 80.00-110.00 per ton.12 Using a 30% mark-up, the reported CIF prices for Sierra Leone’s 128% to 242% of maximum expected prices during two months in 2012 and four months in 2013 (Table 5:)
Figure 9: Average CIF price of rice imports by month in 2012 and 2013
Source: NRA database
Table 5: Comparison of Sierra Leones import and Thailand export rice prices
Sierra Leone Thailand FOB prices CIF FOB = 70%
of CIF Rice,
Thai 25% FOB SL
C/F Thai
2012
January 722.78 505.946 534 94.75
February 644.56 451.192 529 85.29
March 1,169.65 818.755 544.4 150.40
April 496.07 347.249 550.67 63.06
May 769.89 538.923 553.25 97.41
June 1,919.57 1343.699 578 232.47
July 442.03 309.421 555 55.75
August 380.24 266.168 545 48.84
September 603.48 422.436 543.75 77.69
October 497.73 348.411 532.5 65.43
November 427.6 299.32 530 56.48
December 496.61 347.627 530 65.59
Average 624.84 437.388 543.8 80.43
12
Personal communications with importers and insurance agents in Accra and Freetown.
-
500
1,000
1,500
2,000
2,500
US
Do
llars
pe
r m
etr
ic t
on
2013
2012

Page 30 of 157
Sierra Leone Thailand FOB prices CIF FOB = 70%
of CIF Rice,
Thai 25% FOB SL
C/F Thai 2013
January 447 312.9 540 57.94
February 717 501.9 538.75 93.16
March 525 367.5 535 68.69
April 624 436.8 535.6 81.55
May 679 475.3 508.75 93.43
June 887 620.9 483.75 128.35
July 491 343.7 454 75.70
August 1,079 755.3 425 177.72
September 1,485 1039.5 428 242.87
October 189 132.3 423 31.28
November 942 659.4 405 162.81
December 438 306.6 398.67 76.91
Average 567 396.9 472.96 83.92
Sources: CIF Sierra Leone prices – NRA; FOB Thailand prices – World Bank Commodity Price Data (Pink Sheet), March 2014)
Apart from one13importer, all of the major rice importers are located in Freetown and do not have branches in any of the provinces. They make sales from their stores in the Western Area to wholesalers who transport consignments of rice to market centres in the Freetown and the provinces. The importers do not keep records of the destination of their sales and could only provide estimates based on their knowledge where wholesalers normally carry on their business. From their estimates, approximately 40% of importers sales are made to Western Area rice traders. Provincial traders account for approximately 60% the trade in imported rice, led by the Bombali District traders who take approximately 20% of imported rice. Kenema Districts accounts for approximately 15%
followed by Bo and Kono Districts which consume approximately 10% each (Figure 10:).
The other districts account for relatively very little (5%) consumption of imported rice. This could be explained by a variety of reasons. For example; Port Loko and Kambia Districts are surplus producers and net exporters of domestic rice to other provinces and neighbouring countries. Bonthe is a combined low demand and surplus rice producing district. Kailahun has cross border trade with the Republic of Guinea, which influence the supply and demand situation in the district, etc.
13
Moussa Mroue is located on Hanga Road in Kenema.
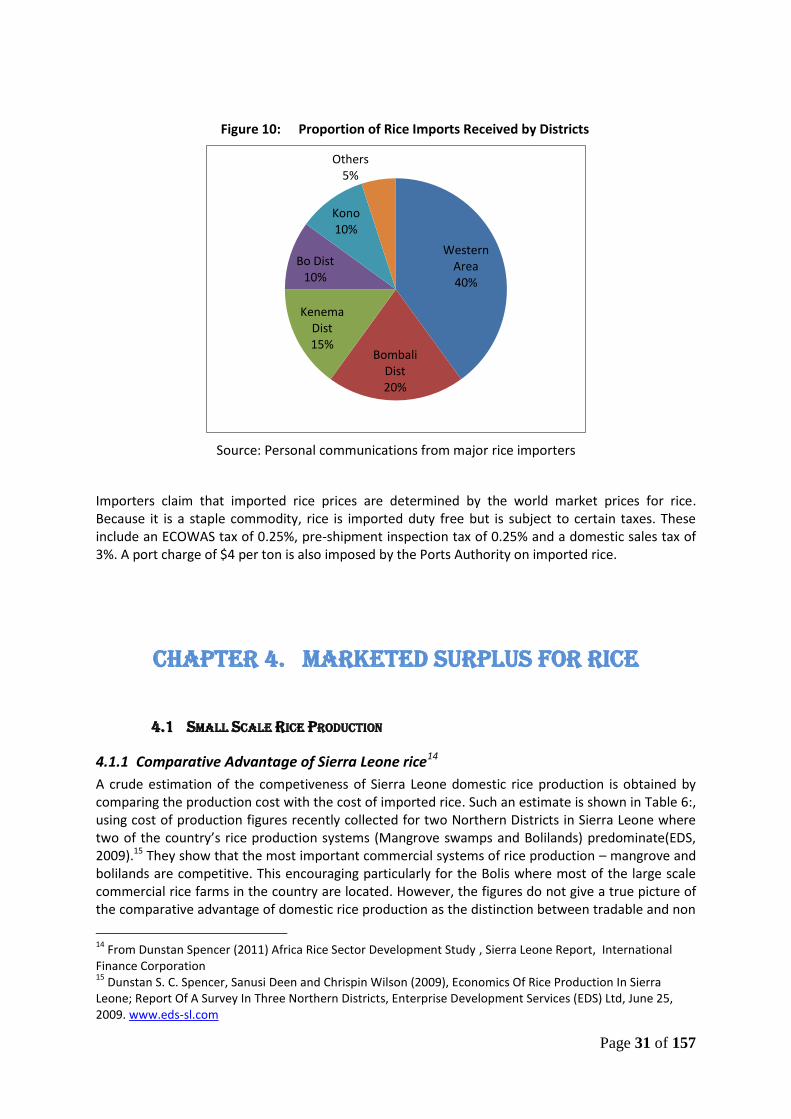
Page 31 of 157
Figure 10: Proportion of Rice Imports Received by Districts
Source: Personal communications from major rice importers
Importers claim that imported rice prices are determined by the world market prices for rice. Because it is a staple commodity, rice is imported duty free but is subject to certain taxes. These include an ECOWAS tax of 0.25%, pre-shipment inspection tax of 0.25% and a domestic sales tax of 3%. A port charge of $4 per ton is also imposed by the Ports Authority on imported rice.
CHAPTER 4. MARKETED SURPLUS FOR RICE
4.1 SMALL SCALE RICE PRODUCTION
4.1.1 Comparative Advantage of Sierra Leone rice14
A crude estimation of the competiveness of Sierra Leone domestic rice production is obtained by comparing the production cost with the cost of imported rice. Such an estimate is shown in Table 6:, using cost of production figures recently collected for two Northern Districts in Sierra Leone where two of the country’s rice production systems (Mangrove swamps and Bolilands) predominate(EDS, 2009).15 They show that the most important commercial systems of rice production – mangrove and bolilands are competitive. This encouraging particularly for the Bolis where most of the large scale commercial rice farms in the country are located. However, the figures do not give a true picture of the comparative advantage of domestic rice production as the distinction between tradable and non
14
From Dunstan Spencer (2011) Africa Rice Sector Development Study , Sierra Leone Report, International Finance Corporation 15
Dunstan S. C. Spencer, Sanusi Deen and Chrispin Wilson (2009), Economics Of Rice Production In Sierra Leone; Report Of A Survey In Three Northern Districts, Enterprise Development Services (EDS) Ltd, June 25, 2009. www.eds-sl.com
Western Area 40%
Bombali Dist 20%
Kenema Dist 15%
Bo Dist 10%
Kono 10%
Others 5%

Page 32 of 157
tradable resources is not countenanced. Thus, Government policy that distorts the market is not countenanced. For example tariffs such as import taxes and subsidies such as provision of mechanical cultivation services at subsidized rates, as is the case in Sierra Leone, give a competitive edge to domestic production that may not be sustainable.
A more robust measure of comparative advantage, is obtained by comparing local economic costs of production with international reference prices, and can be summarized neatly in one indicator, known as the Domestic Resource Cost (DRC) coefficient.16
The Domestic Resource Cost ratio, or DRC, measures the ratio of domestic factors used to produce one unit of a commodity (e.g. labour and capital invested in the production) to the added value generated by this unit of the commodity (i.e. the value of the production minus all the investment costs, e.g. seed, fertilizer, energy, etc). The DRC is estimated using social prices, i.e. prices that would prevail in the absence of government intervention on input and output markets (e.g. subsidies on fertilizer sales price and mechanization cost, duty on exports) or market failure (monopoly). If the ratio is greater than one, more domestic resources are invested in producing the commodity than the added value generated by the production activity—there is no comparative advantage in producing the commodity and the domestic resources would be more efficiently utilized if allocated to another productive activity. Conversely, if the ratio is below one, the commodity is produced using less domestic resources than the added value generated—producers of NTE commodities do have a comparative advantage.
Over the years, Sierra Leone’s rice production systems, like those in Mali, have been shown to have a comparative advantage in supplying domestic urban markets (Table 7: and Table 8:). The estimated domestic resource cost ratios for rice calculated in 2003 are generally consistent with the results of the economic profitability analysis. With the estimated DRC of rice grown in the 12 production systems being less than unity under import parity price, the country’s emphasis on attainment of self-sufficiency in rice production appears to be economically justified. These results support the conclusions derived earlier by Spencer (1997).
Moving to an export price regime implies a substantial decline in economic profitability for all rice cropping systems, as shown by the DRCs under the export parity regime in Table 8:.17 However, Sierra Leone still maintains a comparative advantage with the improved IVS (irrigated) systems. Even with the NERICAs the improved upland systems should only be used to satisfy the domestic market. More recent analysis by Phillips (2009)18 shows that the comparative advantage of Sierra Leones mangrove swamp rice production is being exploited by farmers in Kambia District who are exporting rice to the neighbouring Republic of Guinea.
16
Practical guides for estimation of DRCs are found in Pearson, Stryker, and Humphreys (1981); Tsakok, Isabelle. (1990) Agricultural Price Policy: A Practitioner's Guide to Partial Equilibrium Analysis. Ithaca: Cornell University Press; and Sadoulet, Elisabeth and Alain de Janvry (1995), Quantitative Development Policy Analysis. Baltimore: Johns Hopkins University Press. 17
Export parity price is for export to Nigeria, the largest potential regional market for Sierra Leone rice. 18
Phillips, James J., (2009) Sierra Leone Rice Value Chain Report

Page 33 of 157
Table 6: Estimated competiveness of rice production and imports in Sierra Leone in 2009
Local Rice
District Rice Type Total Variable Cost
Total Cost Family Labor Total Production Cost
Total Cost per Ha Yield
Paddy cost Milling Cost
Milled Rice Cost
Transport to Freetown
Freetown Wholesale Cost
Leones Leones Leones US$ (a) US$ Kg/Ha
US$/ ton US$/ton(b) US$/ton(c) US$/ton US$/ton
Bombali Boli 2,608,755 567,914 3,176,669 981.67 134.25 706.12 190.12 40.00 383.54 37.00 420.54
IVS 2,608,755 243,790 2,852,545 881.50 501.52 826.39 606.89 40.00 1,078.14 37.00 1,115.14
Upland 2,608,755 467,552 3,076,307 950.65 380.26 664.00 572.68 40.00 1,021.14 37.00 1,058.14
Tonkolili Boli 2,608,755 1,813,256 4,422,011 1,366.51 134.12 1,184.97 113.18 40.00 255.30 37.00 292.30
IVS 2,608,755 847,168 3,455,923 1,067.96 709.82 1,535.59 462.25 40.00 837.08 37.00 874.08
Upland 2,608,755 761,742 3,370,497 1,041.56 486.57 656.99 740.60 40.00 1,301.01 37.00 1,338.01
Kambia Mangrove 2,608,755 354,680 2,963,435 915.77 270.56 1,318.81 205.15 28.00 388.59 32 420.59
Boli 2,608,755 550,014 3,158,770 976.13 494.78 1,581.46 312.86 28.00 568.11 32 600.11
Imported rice (25% broken)
US $ per ton
FOB Price – Pakistan (d) 360 (a)
Freight & Insurance (e) 120 (b)
CIF Freetown (d) 480
Import duty (10%) 48
Landing Costs (12%) 58
Importers margin (10%) 48
Wholesale price 634
(a) US$1.00 = Le 3236 (Commercial Bank rate, June 2009) (b) Small mills custom milling cost Le 2000 - Le 5500 per bushel depending on location (c) Rice recovery rate - 60% (d) Jan 2009, 25% broken (source FAO Rice Price Update, Feb 2009 (e) Personal communications with Shipping Agents, Mar 2011

Page 34 of 157
Table 7: West African Domestic Resource Cost (DRC) Comparisons for Rice production
Country 1978 1993 1995 1996 2006
Cote D’Ivoire 1.68 1.02 0.73 NC NC
Mali 0.69 NC NC 0.40 0.95
Senegal 1.66 NC NC 1.12 0.33
Sierra Leone 0.89 NC 0.55 NC NC
Sources: CERDI Université d’Auvergne; Stanford University; WARDA. Annual Report, 2001-2002; Papa Seck et al (2010)
Table 8: Comparative Advantage of Rice Production systems in Sierra Leone, 2003
DRC DRC
PRODUCT Import Parity Export Parity
Upland Traditional 0.96 -
Upland Nerica 0.49 1.09
IVS Traditional 0.47 -
IVS HYV + Fertilizer (irrigated) 0.20 0.72
Boliland Traditional 0.66 -
Boliland HYV + Fertilizer 0.56 -
Boliland HYV + Fertilizer + Mechanization 0.73 1.33
Mangrove Traditional 0.68 -
Mangrove HYV + Fertilizer 0.53 1.16
Riverine Traditional 0.85 -
Riverine HYV + Fertilizer 0.61 -
Riverine HYV + Fertilizer + Mechanization 0.72 1.31
Source: MAFFS, Sierra Leone Agricultural Sector Review, 2004
4.2 LARGE SCALE RICE PRODUCTION AND MARKETING
Commercial producers are market oriented farmers who produce mainly for the market. Their target markets are Freetown, Bo, Kenema and Kono in Sierra Leone and neighbouring states, mainly Guinea, Mali and to a lesser extent Liberia. They operate larger farms (over 300 ha) which are usually mechanically cultivated, in the commercial rice producing districts of Bo, Kambia, Port Loko, Bonthe, Tonkolili and Bombali. The contribution of large scale farms to domestic rice supply is currently small. Most of the output is sold to institutions and NGOs.
A number of foreign companies have recently expressed interest in large scale rice production in Sierra Leone and marketing which will have a significant impact of supply to the domestics and export markets. The Hainah Group of Companies for International Economic Development proposes to invest millions of dollars in the Sierra Leone's agricultural sector to undertake the production and marketing of rice (and rubber) in the Tonkolili District. This investment will have a significant impact on the national rice economy. Already there are a number of foreign investors in the rice sub sector including Genesis Farm in Masemera Chiefdom, Port Loko District, AgriCapital in Bumpe Chiefdom, Bo District, Africa Rice in Bum Chiefdom, Bonthe District. The scale of these investments are as yet unknown as it appears that the investors are adopting a slow start-up strategy to be sure of profitability of their planned investments before up scaling. Equatah, another potential investor is
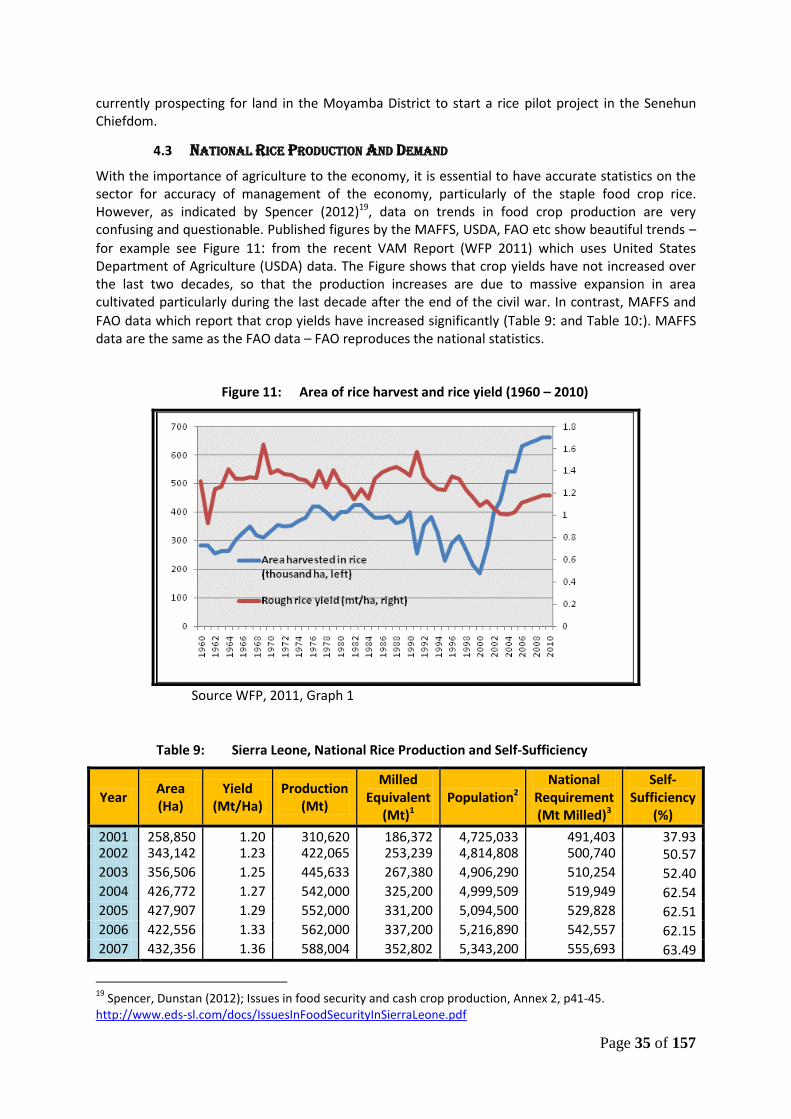
Page 35 of 157
currently prospecting for land in the Moyamba District to start a rice pilot project in the Senehun Chiefdom.
4.3 NATIONAL RICE PRODUCTION AND DEMAND
With the importance of agriculture to the economy, it is essential to have accurate statistics on the sector for accuracy of management of the economy, particularly of the staple food crop rice. However, as indicated by Spencer (2012)19, data on trends in food crop production are very confusing and questionable. Published figures by the MAFFS, USDA, FAO etc show beautiful trends –
for example see Figure 11: from the recent VAM Report (WFP 2011) which uses United States Department of Agriculture (USDA) data. The Figure shows that crop yields have not increased over the last two decades, so that the production increases are due to massive expansion in area cultivated particularly during the last decade after the end of the civil war. In contrast, MAFFS and
FAO data which report that crop yields have increased significantly (Table 9: and Table 10:). MAFFS data are the same as the FAO data – FAO reproduces the national statistics.
Figure 11: Area of rice harvest and rice yield (1960 – 2010)
Source WFP, 2011, Graph 1
Table 9: Sierra Leone, National Rice Production and Self-Sufficiency
Year Area (Ha)
Yield (Mt/Ha)
Production (Mt)
Milled Equivalent
(Mt)1 Population2
National Requirement (Mt Milled)3
Self-Sufficiency
(%)
2001 258,850 1.20 310,620 186,372 4,725,033 491,403 37.93 2002 343,142 1.23 422,065 253,239 4,814,808 500,740 50.57 2003 356,506 1.25 445,633 267,380 4,906,290 510,254 52.40 2004 426,772 1.27 542,000 325,200 4,999,509 519,949 62.54 2005 427,907 1.29 552,000 331,200 5,094,500 529,828 62.51 2006 422,556 1.33 562,000 337,200 5,216,890 542,557 62.15 2007 432,356 1.36 588,004 352,802 5,343,200 555,693 63.49
19
Spencer, Dunstan (2012); Issues in food security and cash crop production, Annex 2, p41-45. http://www.eds-sl.com/docs/IssuesInFoodSecurityInSierraLeone.pdf

Page 36 of 157
Year Area (Ha)
Yield (Mt/Ha)
Production (Mt)
Milled Equivalent
(Mt)1 Population2
National Requirement (Mt Milled)3
Self-Sufficiency
(%)
2008 475,592 1.43 680,097 408,058 5,473,530 569,247 71.68 2009 499,111 1.78 888,417 533,050 5,607,930 583,225 91.40 20104 549,022 1.87 1,026,671 616,003 5,746,800 597,667 103.07
Source: MAFFS, 2011 Notes: 1 Milled recovery = 60% 2 Population growth rate at 1.9% using 2004 population as baseline 3 Per caput consumption = 104 kg per person per annum 4 2010 Figures are projections projected at 10% increase for area and 5% increase for yield
Table 10: Trends in rice (paddy) production in Sierra Leone
Year Area Harvested (Ha) Production (mt) Yield (mt/ha)
2000 183,214 199,134 1.09
2001 300,000 300,000 1.00
2002 420,000 422,066 1.00
2003 440,000 445,633 1.01
2004 540,000 542,000 1.00
2005 650,000 738,000 1.14
2006 742,000 1,062,320 1.43
2007 432,356 588,004 1.36
2008 475,592 680,097 1.43
2009 499,111 888,417 1.78
2010 549,022 1,026,670 1.87
2011 603,924 1,078,010 1.78
Source: FAOSTATS, 2013
The World food Program (WFP) in collaboration with MAFFS published production figures by District that report national production and yield figures that are different from the MAFFS/FAO data. (Table 11:)
Because of the controversy associated with the statistics produced by MAFFS, the Government commissioned an independent study in 2010. The Agricultural Household Tracking Survey (henceforth, AHTS), was conducted between March and May 2010 with the aim of providing a rigorous assessment of agricultural activities by smallholder farmers in Sierra Leone. The AHTS was commissioned and overseen by the Office of the President, and implemented collaboratively by the Ministry of Agriculture, Forestry and Food Security (MAFFS), Statistics Sierra Leone (SSL) and the Abdul Latif Jameel Poverty Action Lab (J‐PAL) / Innovations for Poverty Action (IPA). The results are very different from the MAFFS/FAO figures (Table 12:). MAFFS has not accepted the results.
Because of the uncertainly regarding the true level of production of rice in the country, the rest of the analysis in this study will be based on two levels of production in 2009 which is used as the baseline year – a high variant based on FAO/MAFFS production data, and a low variant based on AHTS data.

Page 37 of 157
Table 11: Rice production by District in Sierra Leone
Source: Sierra Leone: Household Food Security Survey in Rural Areas, World Food Programme, Vulnerability Analysis and Mapping Branch (ODAV), November, 2008
Table 12: Rice production by District in 2009
District Yield Area Production
Kg/ha Ha mt
Bo 481.8 73,097 38,405
Bombali 404.8 68,800 29,526
Bonthe 259.6 10,191 2,464
Kailahun 510.4 74,058 38,803
Kambia 431.2 66,832 30,750
Kenema 398.2 96,944 40,111
Koinadugu 609.4 60,776 35,661
Kono 420.2 72,166 29,620
Moyamba 327.8 69,379 21,894
Port Loko 356.4 109,587 42,524
Pujehun 367.4 31,739 10,640
Tonkolili 473 87,974 40,102
Western - Rural 330 4,849 1,517
Western - Urban 185 154
Sierra Leone 431.2 826,578 362,170
Source: AHTS, Final Report, 2012

Page 38 of 157
4.4 MARKETED SURPLUS FOR DOMESTIC RICE
Marketed surplus has generally been defined as that proportion of production that actually enters the market (Newman, 1977). Some authors include barter sales in this category (Sharma and Gupter, 1970; Chinn 1976). Distress sales where grain is sold soon after harvest to satisfy prior obligations and replaced or repurchased later on are included in some definitions of marketed surplus. For purposes of this study, marketed surplus will be used to denote that portion of production that actually enters the market i.e. the proportion of production that is sold, including distress sales.
It is important to know the marketed surplus for major types of rice production systems and/or producing Districts in order to determine the potential supply of paddy to the commercial rice milling industry.
The AHTS survey reported that only 6% of rice produced in Sierra Leone was sold by farmers, with
47% consumed by farmers (Table 13:), the rest being allocated to seed (16%), post harvest losses (2-7%), gifts or credit to people, paid for farm labour, or paid for land use or loan repayment.
Surveys conducted by EDS have shown a much higher proportion of rice harvest being marketed. For example, a study in 200920 (Table 14:) indicated that mangrove swamp rice farmers have the highest marketable surplus. About 50% of their production is sold, compared to about 30% for Boliland farmers.
Table 13: Proportion of rice harvest consumed and sold by farmers in Sierra Leone, 2009
Source: AHTS, 2012, p 35
20
Dunstan Spencer, Sanusi Deen and Chrispin Wilson: Soros Economic Development Fund (SEDF), Sierra Leone Rice Enterprise Development Project, Project Report, Enterprise Development Services Ltd (EDS), June 25, 2009; www.edssl.com/docs/EDS%2020Economics%20of%20Rice%20Prodn%20in%20Sierra%20Leone%20-%20June%202009.pdf

Page 39 of 157
Table 14: Percentage of rice production that is sold
CONSUMPTION/ SALES
District Rice System Consumed Gift+Seed Sold
Bombali Boli 40 30 30
IVS 50 20 20
Upland 60 20 20
Tonkolili Boli 40 20 30
IVS 50 20 30
Upland 50 20 30
Kambia Mangrove 30 10 50
Boli 60 10 30
Source: Spencer, et. al., 2009, Table 6
In this report therefore, two sets of assumptions derived from the two sources are used in estimating the marketed surplus for the base year: (1) a low variant derived from AHTS, with 20% marketed surplus for mangrove swamps (Kambia and Port Loko Districts), 15% in the Bolilands (Bombali & Tonkolili Districts), and 10% in the rest of the country; (2) a high variant derived from the EDS study, with 50% marketed surplus in the mangrove swamps, 30% in the bolilands, and 10% in the rest of the country.
With the combination of high and low variants for rice production and marketed surplus, four different estimated quantities of domestic rice marketed are obtained representing:
1. FAO/MAFFS production data (allocated by District using the AHTS distributions) + EDS Market surplus ratios (Table 15:)
2. FAO/MAFFS production data (allocated by District using the AHTS distributions) + ATS Market surplus ratios (Table 15:)
3. ATHS production data by Districts + EDS Market surplus ratios (Table 16:) 4. ATHS production data by Districts + AHTS Market surplus ratios (Table 16:)
Table 15: Estimated marketed surplus of domestic husk rice production by District in Sierra Leone – High production variants
(Based on FAO/MAFFS national production estimate, Base Year (2009)
District Production EDS Market Surplus AHTS Market Surplus
mt Proportion of Total1 ratio mt ratio mt
Bo 94,209 0.1060 0.1 9,420.9 0.1 9,420.9
Bombali 72,428 0.0815 0.3 21,728.5 0.15 10,864.3
Bonthe 6,044 0.0068 0.1 604.4 0.1 604.4
Kailahun 95,185 0.1071 0.1 9,518.5 0.1 9,518.5
Kambia 75,431 0.0849 0.5 37,715.5 0.2 15,086.2
Kenema 98,394 0.1108 0.1 9,839.4 0.1 9,839.4
Koinadugu 87,478 0.0985 0.1 8,747.8 0.1 8,747.8
Kono 72,659 0.0818 0.1 7,265.9 0.1 7,265.9

Page 40 of 157
District Production EDS Market Surplus AHTS Market Surplus
mt Proportion of Total1 ratio mt ratio mt
Moyamba 53,707 0.0605 0.1 5,370.7 0.1 5,370.7
Port Loko 104,313 0.1174 0.5 52,156.5 0.2 20,862.6
Pujehun 26,100 0.0294 0.1 2,610.0 0.1 2,610.0
Tonkolili 98,372 0.1107 0.3 29,511.5 0.15 14,755.8
Western - Rural 3,721 0.0042 0.5 1,860.6 0.2 744.3
Western - Urban 378 0.0004 0.5 188.9 0.2 75.6
Sierra Leone 888,417 1.0000 187,118.3 106,345.4 1 National production distributed by District using proportions reported in AHTS
Table 16: Estimated marketed surplus of domestic husk rice production by District in Sierra Leone – Low
production variants
(based on AHTS national production estimate, Base Year (2009)
District Production
EDS Market Surplus AHTS Market Surplus
mt Proportion of Total ratio mt ratio mt
Bo 38,405 0.1060 0.1 3,840.5 0.1 3,840.5
Bombali 29,526 0.0815 0.3 8,857.8 0.15 4,428.9
Bonthe 2,464 0.0068 0.1 246.4 0.1 246.4
Kailahun 38,803 0.1071 0.1 3,880.3 0.1 3,880.3
Kambia 30,750 0.0849 0.5 15,375.0 0.2 6,150.0
Kenema 40,111 0.1108 0.1 4,011.1 0.1 4,011.1
Koinadugu 35,661 0.0985 0.1 3,566.1 0.1 3,566.1
Kono 29,620 0.0818 0.1 2,962.0 0.1 2,962.0
Moyamba 21,894 0.0605 0.1 2,189.4 0.1 2,189.4
Port Loko 42,524 0.1174 0.5 21,262.0 0.2 8,504.8
Pujehun 10,640 0.0294 0.1 1,064.0 0.1 1,064.0
Tonkolili 40,102 0.1107 0.3 12,030.6 0.15 6,015.3
Western - Rural 1,517 0.0042 0.5 758.5 0.2 303.4
Western - Urban 154 0.0004 0.5 77.0 0.2 30.8
Sierra Leone 362,170 1.0000 76,280.2 43,352.5
4.5 PROJECTIONS OF MARKETED SURPLUS TO 2025
EDS recognizes that marketed surplus in the future depends on the price elasticity of marketed surplus.21 However, an estimation of price elasticity for use in projecting marketed surplus is beyond the scope of this study. As an alternative future growth in marketed surplus for the four baseline scenarios discussed above are based on expert knowledge of stakeholders consulted during the
21
Price elasticity of marketed surplus can be defined as = - C/M *Price elasticity of consumption -C/M*PQ/I*Income elasticity of demand; where C= consumption, M= marketed surplus, P= price of commodity, Q= quantity of output’ I= Income

Page 41 of 157
study from which the following growth parameters are derived for in projecting growth in marketed surplus:
1. FAO/MAFFS: No change in crop area, exponential yield growth – from 1.78 mt/ha in 2009 to 4.50 mt/ha in 2025
2. FAO/MAFFS: No change in crop area, linear yield growth – from 1.78 mt/ha in 2009 to 3.0 mt/ha in 2025
3. AHTS: No change in crop area, plus exponential growth rate in yields from 0.43 mt/ha to 1.1 mt/ha by 2025
4. AHTS: No change in crop area, plus linear growth in yields from 0.43 to 0.725 mt/ha by 2025
The resulting estimated marketed surpluses under the different Scenarios are shown in Table 17: to Table 20:. They show the estimated quantities of domestic rice that will need to be processed and marketed in 2025. These estimates will be compared with the installed milling capacity in Sierra Leone. In subsequent analysis it will be assumed that all rice processed in the country must meet international standards so as to compete with imported rice in terms of quality so that surplus to domestic demand can be exported.
Table 17: Projections of marketed surplus of paddy rice in Sierra Leone in 2025 – Scenario 1
(High base year production with high yield - 4.5 mt/ha)
District Production AHTS Mkt Surplus EDS Mkt Surplus
mt Prop of Total ratio mt ratio mt
Bo 238,169 0.1060 0.1 23,816.9 0.1 23,816.9
Bombali 183,106 0.0815 0.15 27,465.8 0.3 54,931.7
Bonthe 15,281 0.0068 0.1 1,528.1 0.1 1,528.1
Kailahun 240,637 0.1071 0.1 24,063.7 0.1 24,063.7
Kambia 190,696 0.0849 0.2 38,139.2 0.5 95,348.1
Kenema 248,748 0.1108 0.1 24,874.8 0.1 24,874.8
Koinadugu 221,152 0.0985 0.1 22,115.2 0.1 22,115.2
Kono 183,688 0.0818 0.1 18,368.8 0.1 18,368.8
Moyamba 135,776 0.0605 0.1 13,577.6 0.1 13,577.6
Port Loko 263,713 0.1174 0.2 52,742.5 0.5 131,856.3
Pujehun 65,984 0.0294 0.1 6,598.4 0.1 6,598.4
Tonkolili 248,693 0.1107 0.15 37,303.9 0.3 74,607.8
Western - Rural 9,408 0.0042 0.2 1,881.5 0.5 4,703.8
Western - Urban 955 0.0004 0.2 191.0 0.5 477.5
Sierra Leone 2,245,998 1.0000 268,850.6 473,051.8
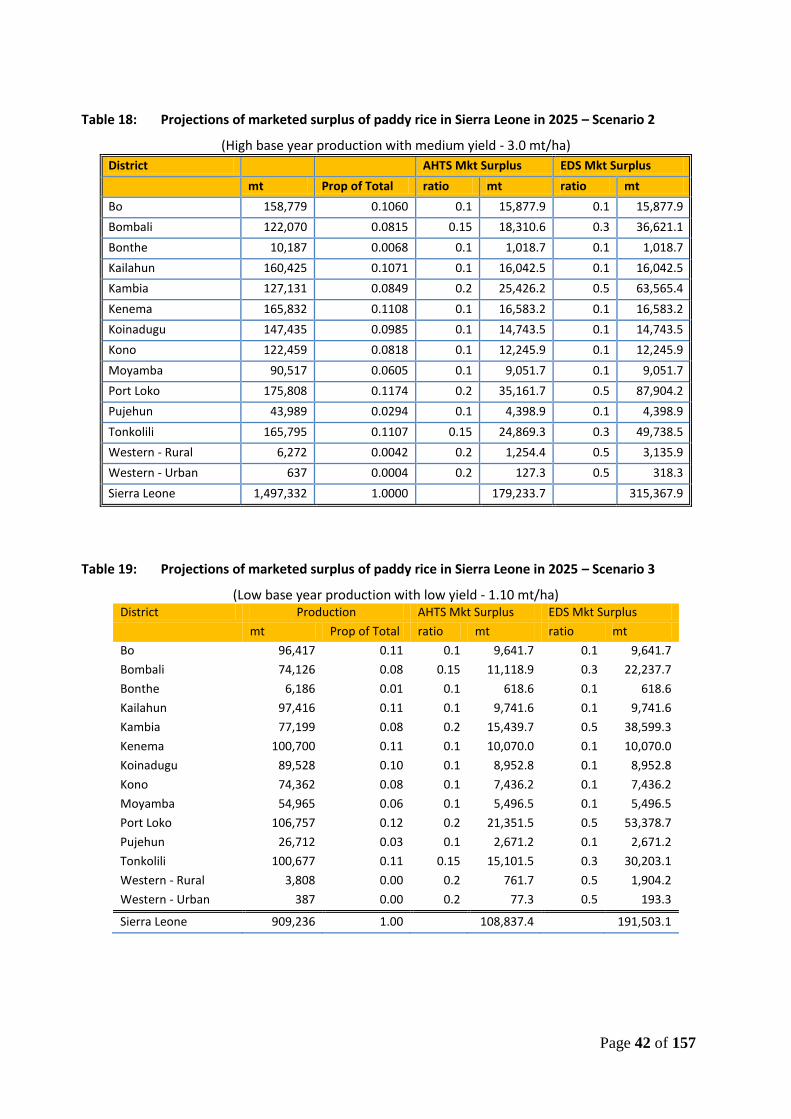
Page 42 of 157
Table 18: Projections of marketed surplus of paddy rice in Sierra Leone in 2025 – Scenario 2
(High base year production with medium yield - 3.0 mt/ha)
District AHTS Mkt Surplus EDS Mkt Surplus
mt Prop of Total ratio mt ratio mt
Bo 158,779 0.1060 0.1 15,877.9 0.1 15,877.9
Bombali 122,070 0.0815 0.15 18,310.6 0.3 36,621.1
Bonthe 10,187 0.0068 0.1 1,018.7 0.1 1,018.7
Kailahun 160,425 0.1071 0.1 16,042.5 0.1 16,042.5
Kambia 127,131 0.0849 0.2 25,426.2 0.5 63,565.4
Kenema 165,832 0.1108 0.1 16,583.2 0.1 16,583.2
Koinadugu 147,435 0.0985 0.1 14,743.5 0.1 14,743.5
Kono 122,459 0.0818 0.1 12,245.9 0.1 12,245.9
Moyamba 90,517 0.0605 0.1 9,051.7 0.1 9,051.7
Port Loko 175,808 0.1174 0.2 35,161.7 0.5 87,904.2
Pujehun 43,989 0.0294 0.1 4,398.9 0.1 4,398.9
Tonkolili 165,795 0.1107 0.15 24,869.3 0.3 49,738.5
Western - Rural 6,272 0.0042 0.2 1,254.4 0.5 3,135.9
Western - Urban 637 0.0004 0.2 127.3 0.5 318.3
Sierra Leone 1,497,332 1.0000 179,233.7 315,367.9
Table 19: Projections of marketed surplus of paddy rice in Sierra Leone in 2025 – Scenario 3
(Low base year production with low yield - 1.10 mt/ha) District Production AHTS Mkt Surplus EDS Mkt Surplus
mt Prop of Total ratio mt ratio mt
Bo 96,417 0.11 0.1 9,641.7 0.1 9,641.7
Bombali 74,126 0.08 0.15 11,118.9 0.3 22,237.7
Bonthe 6,186 0.01 0.1 618.6 0.1 618.6
Kailahun 97,416 0.11 0.1 9,741.6 0.1 9,741.6
Kambia 77,199 0.08 0.2 15,439.7 0.5 38,599.3
Kenema 100,700 0.11 0.1 10,070.0 0.1 10,070.0
Koinadugu 89,528 0.10 0.1 8,952.8 0.1 8,952.8
Kono 74,362 0.08 0.1 7,436.2 0.1 7,436.2
Moyamba 54,965 0.06 0.1 5,496.5 0.1 5,496.5
Port Loko 106,757 0.12 0.2 21,351.5 0.5 53,378.7
Pujehun 26,712 0.03 0.1 2,671.2 0.1 2,671.2
Tonkolili 100,677 0.11 0.15 15,101.5 0.3 30,203.1
Western - Rural 3,808 0.00 0.2 761.7 0.5 1,904.2
Western - Urban 387 0.00 0.2 77.3 0.5 193.3
Sierra Leone 909,236 1.00 108,837.4 191,503.1
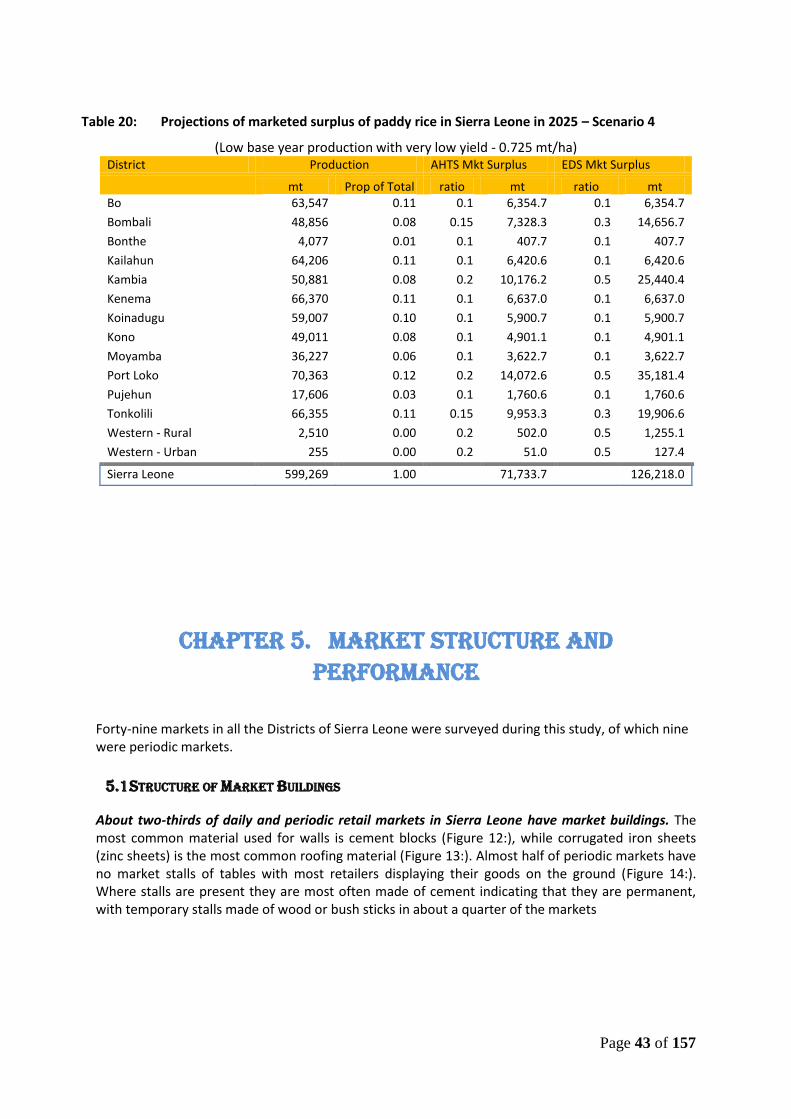
Page 43 of 157
Table 20: Projections of marketed surplus of paddy rice in Sierra Leone in 2025 – Scenario 4
(Low base year production with very low yield - 0.725 mt/ha) District Production AHTS Mkt Surplus EDS Mkt Surplus
mt Prop of Total ratio mt ratio mt
Bo 63,547 0.11 0.1 6,354.7 0.1 6,354.7
Bombali 48,856 0.08 0.15 7,328.3 0.3 14,656.7
Bonthe 4,077 0.01 0.1 407.7 0.1 407.7
Kailahun 64,206 0.11 0.1 6,420.6 0.1 6,420.6
Kambia 50,881 0.08 0.2 10,176.2 0.5 25,440.4
Kenema 66,370 0.11 0.1 6,637.0 0.1 6,637.0
Koinadugu 59,007 0.10 0.1 5,900.7 0.1 5,900.7
Kono 49,011 0.08 0.1 4,901.1 0.1 4,901.1
Moyamba 36,227 0.06 0.1 3,622.7 0.1 3,622.7
Port Loko 70,363 0.12 0.2 14,072.6 0.5 35,181.4
Pujehun 17,606 0.03 0.1 1,760.6 0.1 1,760.6
Tonkolili 66,355 0.11 0.15 9,953.3 0.3 19,906.6
Western - Rural 2,510 0.00 0.2 502.0 0.5 1,255.1
Western - Urban 255 0.00 0.2 51.0 0.5 127.4
Sierra Leone 599,269 1.00 71,733.7 126,218.0
CHAPTER 5. MARKET STRUCTURE AND PERFORMANCE
Forty-nine markets in all the Districts of Sierra Leone were surveyed during this study, of which nine were periodic markets.
5.1 STRUCTURE OF MARKET BUILDINGS
About two-thirds of daily and periodic retail markets in Sierra Leone have market buildings. The most common material used for walls is cement blocks (Figure 12:), while corrugated iron sheets (zinc sheets) is the most common roofing material (Figure 13:). Almost half of periodic markets have no market stalls of tables with most retailers displaying their goods on the ground (Figure 14:). Where stalls are present they are most often made of cement indicating that they are permanent, with temporary stalls made of wood or bush sticks in about a quarter of the markets

Page 44 of 157
Figure 12: Structure of walls of market buildings in Sierra Leone
Source: EDS rice markets survey
Figure 13: Structure of the roofs of market buildings in Sierra Leone
Source: EDS rice markets survey
Figure 14: Structure of market stalls/tables in markets in Sierra Leone
Source: EDS rice markets survey
0.0
10.0
20.0
30.0
40.0
50.0
60.0
70.0
80.0
Wood Corrugated Iron
Mud Cement No walls
Per
cen
t o
f m
arke
ts
Daily Markets
Periodic Markets
0.0
10.0
20.0
30.0
40.0
50.0
60.0
70.0
80.0
90.0
Corrugated Iron Tarpaul etc None
Per
cen
t o
f m
arke
ts
Daily Markets
Periodic Markets
0.0
10.0
20.0
30.0
40.0
50.0
60.0
Cement blocks Wood Other None
Per
cen
t o
f m
arke
ts
Daily Markets
Periodic Markets

Page 45 of 157
5.2 WATER AND SANITATION FACILITIES
Water and sanitation facilities in markets are inadequate: About a third of daily markets and over half of periodic markets have no toilet facilities (Figure 15:) with pit latrines, most of which are unsanitary, the usual type of toilets available. Over half of both daily or periodic markets have no source of drinking water. Only about 10% have taps (Figure 16:).
Figure 15: Toilet facilities available in markets in Sierra Leone
Source: EDS rice markets survey
Figure 16: Sources of drinking water in markets in Sierra Leone
Source: EDS rice markets survey
0.0
10.0
20.0
30.0
40.0
50.0
60.0
70.0
Pit Latrine Flush toilet No toilet
Per
cen
t o
f m
arke
ts
Daily Markets
Periodic Markets
0.0
10.0
20.0
30.0
40.0
50.0
60.0
Stream Well Tap None
Per
cen
t o
f m
arke
ts
Daily Markets
Periodic Markets

Page 46 of 157
5.3 USE OF MARKET BUILDINGS
Market buildings are often not used by retailers. Although there are permanent buildings with cement walls and corrugated iron sheets in about 80% of markets in Sierra Leone, about 70% of the rice traders in the markets, and 60% of traders in general, sell outside the structures (Figure 17:). Traders give a variety of reasons for not selling in the market structures including the inappropriateness of the structures (too hot etc), poor accessibility to customers, etc. But the most often cited reason is that they will be disadvantaged if they locate in the buildings as customers would be high jerked by other traders who display their wares outside the market on the foot paths into the market.
Figure 17: Location of traders in markets in Sierra Leone
Source: EDS rice markets survey
In the largest retail market in the country – the Waterloo market outside Freetown, retailers even display rice in wheel barrows which they move with and locate at all the entrances to markets! This is an issue which policy makers need to address. There is hardly any justification for building retail market structures if traders will not use them! Apart from extensive consultations with retailers on appropriate designs for market buildings, there will have to be strong incentives, including enforced legislation to make sure traders sell inside not outside market structures, including demarcated locations for specific commodities in the markets.
Imported rice is more widely available in retail markets than locally produced rice. All the daily markets surveyed, except one (97.5%) had retailers of imported rice compared to 77% of periodic markets with retailers of imported rice. By contrast only 72% of daily markets have retailers of local rice and only 55% of periodic markets.
The number of retailers of imported rice in daily markets ranges from 3 to 700 with a mean of 56. In periodic markets the range is from 10 to 200 with an average of 81 retailers. For local rice the number of retailers ranges from 1 to 95 with a mean of 16 in daily markets and 3 to 25 with a mean of 12 in periodic markets.
0
5
10
15
20
25
30
35
40
45
In Stalls On Tables On Ground
Inside Market Building
Outside Market Building
Per
cen
t o
f Tr
ader
s
All Traders
Rice Traders

Page 47 of 157
5.4 CHARACTERISTICS OF RICE TRADERS
Middle aged women with some post primary education dominate the rice trade. Retailers of rice are virtually all female, but women represent less than half of wholesalers (Figure 18:). There is not much difference in the average age or level of education achieved by traders of either gender (Figure 19:). But retailers tend to be slightly younger than wholesalers. On the average rice traders in Sierra Leone have had some post-primary education. But the vast majority of rice traders do not have any formal business training, with about half having learnt the trade under the apprenticeship usually of a parent or close family member (Figure 21:). About a third of retailers, and over half of wholesale rice traders have been in the business for over 10 years (Figure 21:)
Figure 18: Gender of rice traders in Sierra Leone
Source EDS rice traders survey
Figure 19: Average age and highest class attained by rice traders in Sierra Leone
Source EDS rice traders survey
0.0%
20.0%
40.0%
60.0%
80.0%
100.0%
Female Male NR
Retailers
Wholesalers
34.0 32.5
37.8 38.4
7.1 9.3 8.2 9.7
0.0
5.0
10.0
15.0
20.0
25.0
30.0
35.0
40.0
45.0
Female Retailers Male Retailers Female Wholesalers
Male Wholesalers
Year
s
Age
Highest_Class

Page 48 of 157
Figure 20: Type of business training obtained by rice traders before they started trading
Source EDS rice traders survey
Figure 21: Number of years that rice traders have been in their business
Source EDS rice traders survey
5.5 CONDUCT OF THE RICE TRADE
Imported rice is very important to rice traders but local rice is not. Imported rice ranks among the top three commodities traded by over 75% of retailers as well as wholesalers compared to about a tenth for local rice (Table 21:). Among retailers of rice in Sierra Leone roughly one-third ranked imported rice as the most important commodity they sold, compared to only two percent for local rice. Condiments was ranked as most important commodity sold among 18 percent of rice retailers followed by legumes by 10 percent of the retailers. Among wholesalers of rice, almost half ranked imported rice as their most important commodity, compared again to less than two percent for local rice. Rice was ranked as second most important commodity by about 16% of wholesalers with almost a similar percentage ranking it as the third most important commodity they trade.
0.0%
10.0%
20.0%
30.0%
40.0%
50.0%
60.0%
None Formal Apprenticeship NR
Retailers
Wholesalers
0.0%
10.0%
20.0%
30.0%
40.0%
50.0%
60.0%
< 1 Year 1-3 Years 3-10 Years > 10 Years
Retailers
Wholesalers

Page 49 of 157
Table 21: Ranking of commodities sold by rice traders in Sierra Leone
Commodity Retailers Wholesalers
First Second Third First Second Third
Imported rice 36.7% 16.2% 19.8% 49.4% 16.3% 14.3%
Local rice 2.0% 6.8% 6.8% 1.2% 3.8% 2.9%
Other cereals 2.6% 5.2% 11.3% 2.4% 17.5% 10.0%
Roots & tubers .5% .5%
0.0% 0.0%
Vegetables 2.6% 5.8% 9.6% 3.6% 1.3% 1.4%
Fruits .5% 1.0%
0.0% 0.0%
Eggs .5% 1.6%
1.2% 0.0%
Fish 9.2% 15.2% 1.7% 0.0% 1.3% 0.0%
Legumes 10.7% 0.0% 10.7% 1.2% 5.0% 1.4%
Cheese & milk .5% 14.7% 0.0% 3.6% 15.0% 12.9%
Oils 7.1% 6.8% 15.8% 2.4% 10.0% 18.6%
Sugar & honey 3.6% 24.6% 7.9% 3.6% 7.5% 20.0%
Condiments 17.9% 0.0% 15.3% 4.8% 1.3% 8.6%
Dry non food items 3.6% 1.0%
26.5% 21.3%
No Response 2.0% 0.0% 0.0% 0.0% 0.0% 0.0%
N 196 191 177 83 80 70
Source EDS rice traders survey
Most rice traders have between 10 and 70 customers a day. As expected retailers of imported rice have more customers in a day than wholesalers (Figure 22:). While about 40% of wholesalers of imported rice have less than 10 customers a day, only about 5% of retailers have that few customers. By contrast, about a third of retailers of local rice have less than 10 customers per day (Figure 23:).22
Figure 22: Distribution of customers of imported rice traders in Sierra Leone
Source EDS rice traders survey
22
The sample size of wholesalers of local rice is too small to make any meaningful analysis
0.0%
10.0%
20.0%
30.0%
40.0%
50.0%
60.0%
70.0%
80.0%
< 10 10 - 70 71 - 140 > 140 NR
Retailers Wholesalers

Page 50 of 157
Figure 23: Distribution of customers of local rice traders in Sierra Leone
Source EDS rice traders survey
Retailers obtain their supplies from wholesalers located within their Districts while wholesalers have to get theirs from other Districts23. Data in Figure 24: show that most retailers, as expected, obtain their supplies locally, i.e. within the Districts in which they are doing business. As expected retailers of local rice in more Districts obtain all of their supplies within their districts than retailers of imported rice (9 compared to 4 Districts). Retailers of imported rice more often move out of their Districts to obtain their supplies. Wholesalers, also as expected, often source their supplies outside their District of doing business (Figure 25:). Only in Kono do wholesalers source their supplies locally. Importers have Depots in Kono, as in Freetown, from which wholesalers in the Districts obtain their supplies.
This survey data therefore indicate that markets have a fair degree of integration in the country – wholesalers and even some retailers obtaining supplies from outside their districts. The issue is discussed further in Section 5.8 which examines the market price situation
23
Data on flow patterns for imported and local rice are currently being analysed and will be presented in the final report.
0.0%
10.0%
20.0%
30.0%
40.0%
50.0%
60.0%
< 10 10 - 70 71 - 140 NR
Retailers

Page 51 of 157
Figure 24: Proportion of retailers that obtain their supplies within their Districts
Figure 25: Proportion of wholesalers that obtain their supplies within their Districts
Source: EDS rice traders survey
0.0%
20.0%
40.0%
60.0%
80.0%
100.0%
120.0%
Local rice
0
0.2
0.4
0.6
0.8
1
1.2
Districts
Imported rice
0 0.2 0.4 0.6 0.8
1 1.2
Districts
Imported rice
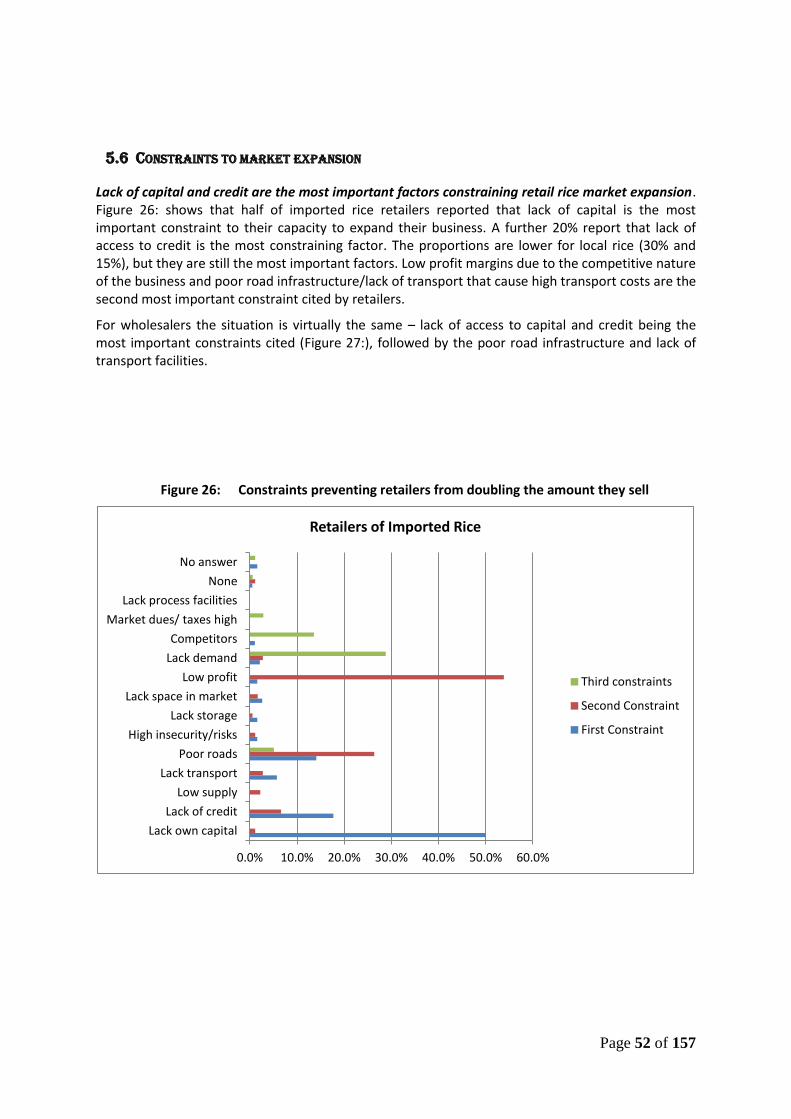
Page 52 of 157
5.6 CONSTRAINTS TO MARKET EXPANSION
Lack of capital and credit are the most important factors constraining retail rice market expansion. Figure 26: shows that half of imported rice retailers reported that lack of capital is the most important constraint to their capacity to expand their business. A further 20% report that lack of access to credit is the most constraining factor. The proportions are lower for local rice (30% and 15%), but they are still the most important factors. Low profit margins due to the competitive nature of the business and poor road infrastructure/lack of transport that cause high transport costs are the second most important constraint cited by retailers.
For wholesalers the situation is virtually the same – lack of access to capital and credit being the most important constraints cited (Figure 27:), followed by the poor road infrastructure and lack of transport facilities.
Figure 26: Constraints preventing retailers from doubling the amount they sell
0.0% 10.0% 20.0% 30.0% 40.0% 50.0% 60.0%
Lack own capital
Lack of credit
Low supply
Lack transport
Poor roads
High insecurity/risks
Lack storage
Lack space in market
Low profit
Lack demand
Competitors
Market dues/ taxes high
Lack process facilities
None
No answer
Retailers of Imported Rice
Third constraints
Second Constraint
First Constraint
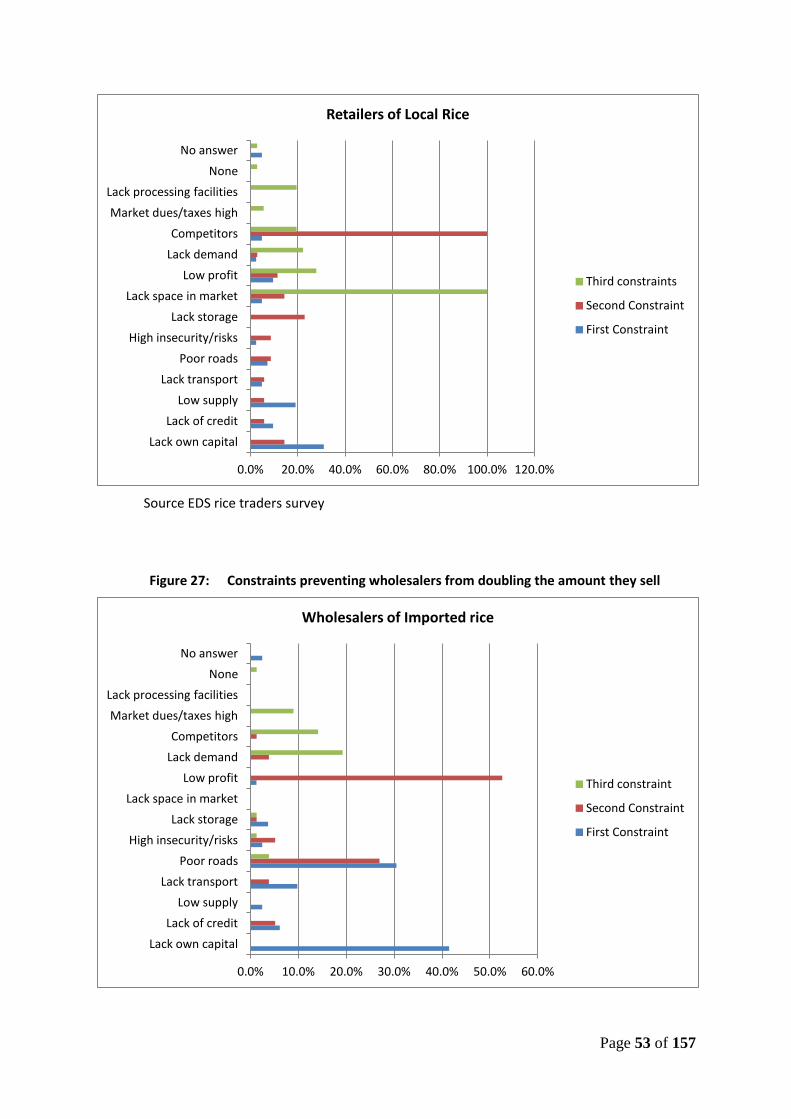
Page 53 of 157
Source EDS rice traders survey
Figure 27: Constraints preventing wholesalers from doubling the amount they sell
0.0% 20.0% 40.0% 60.0% 80.0% 100.0% 120.0%
Lack own capital
Lack of credit
Low supply
Lack transport
Poor roads
High insecurity/risks
Lack storage
Lack space in market
Low profit
Lack demand
Competitors
Market dues/taxes high
Lack processing facilities
None
No answer
Retailers of Local Rice
Third constraints
Second Constraint
First Constraint
0.0% 10.0% 20.0% 30.0% 40.0% 50.0% 60.0%
Lack own capital
Lack of credit
Low supply
Lack transport
Poor roads
High insecurity/risks
Lack storage
Lack space in market
Low profit
Lack demand
Competitors
Market dues/taxes high
Lack processing facilities
None
No answer
Wholesalers of Imported rice
Third constraint
Second Constraint
First Constraint
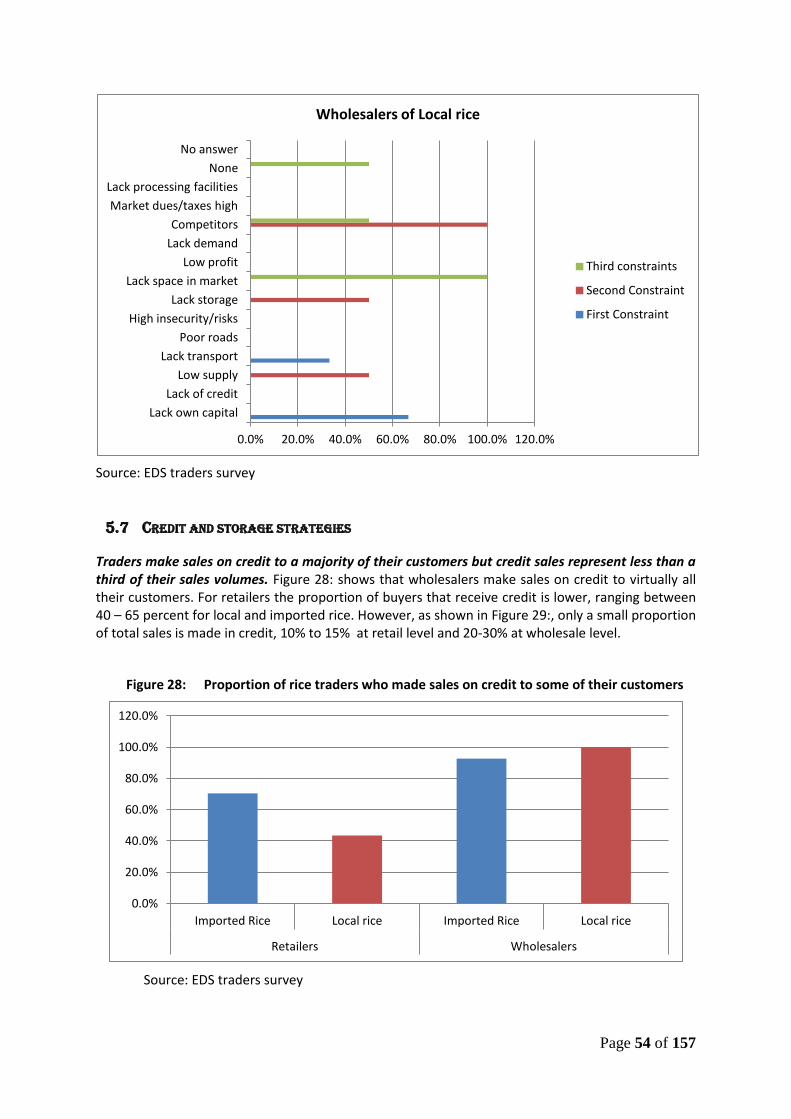
Page 54 of 157
Source: EDS traders survey
5.7 CREDIT AND STORAGE STRATEGIES
Traders make sales on credit to a majority of their customers but credit sales represent less than a third of their sales volumes. Figure 28: shows that wholesalers make sales on credit to virtually all their customers. For retailers the proportion of buyers that receive credit is lower, ranging between 40 – 65 percent for local and imported rice. However, as shown in Figure 29:, only a small proportion of total sales is made in credit, 10% to 15% at retail level and 20-30% at wholesale level.
Figure 28: Proportion of rice traders who made sales on credit to some of their customers
Source: EDS traders survey
0.0% 20.0% 40.0% 60.0% 80.0% 100.0% 120.0%
Lack own capital
Lack of credit
Low supply
Lack transport
Poor roads
High insecurity/risks
Lack storage
Lack space in market
Low profit
Lack demand
Competitors
Market dues/taxes high
Lack processing facilities
None
No answer
Wholesalers of Local rice
Third constraints
Second Constraint
First Constraint
0.0%
20.0%
40.0%
60.0%
80.0%
100.0%
120.0%
Imported Rice Local rice Imported Rice Local rice
Retailers Wholesalers

Page 55 of 157
Figure 29: Proportion of rice sales made on credit
Source: EDS traders survey
Most retailers store produce overnight in their homes. Virtually all rice traders have access to storage facilities and store produce at least overnight. Figure 30: shows that very few traders (less than 2%) report that they do not have access to storage facilities and must sell all their stock the same day. But the majority of retailers store their commodity overnight in their homes. Next in importance for retailers (about 15% of traders) is storage in a communal facility in the market owned or rented by their Traders Association.
Although home storage provides security and reduces risks of losses to retailers, it is an inefficient commodity storage strategy. Markets should have sufficient and secure storage facilities which can be rented by Associations for use by their members.
Most wholesalers have access to dedicated store. Also as shown in Figure 30:, most wholesalers store their commodity in individual stores that they own or rent themselves and are located outside, but usually very close to markets,. However, sharing of storage facilities is common among wholesalers with 20-30 percent reporting that they store their commodity in a store owned or rented by another trader. About a third of wholesalers of local rice store the commodity in stores inside markets that are owned or rented by their Association. These are usually the smaller wholesalers who are also retailers of the commodity.
0
5
10
15
20
25
30
35
Imported rice Local rice Imported rice Local rice
Retailers Wholesalers
Pe
rce
nt
of
Sale
s
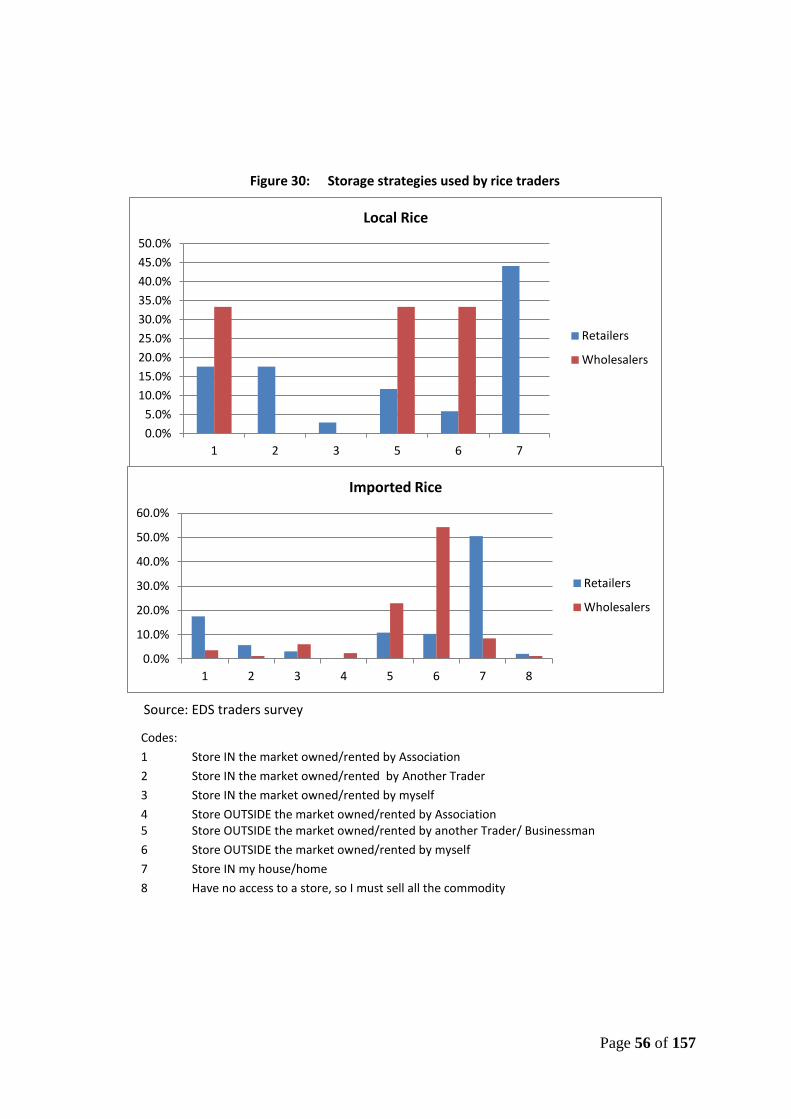
Page 56 of 157
Figure 30: Storage strategies used by rice traders
Source: EDS traders survey
Codes: 1 Store IN the market owned/rented by Association
2 Store IN the market owned/rented by Another Trader
3 Store IN the market owned/rented by myself
4 Store OUTSIDE the market owned/rented by Association 5 Store OUTSIDE the market owned/rented by another Trader/ Businessman
6 Store OUTSIDE the market owned/rented by myself
7 Store IN my house/home
8 Have no access to a store, so I must sell all the commodity
0.0%
5.0%
10.0%
15.0%
20.0%
25.0%
30.0%
35.0%
40.0%
45.0%
50.0%
1 2 3 5 6 7
Local Rice
Retailers
Wholesalers
0.0%
10.0%
20.0%
30.0%
40.0%
50.0%
60.0%
1 2 3 4 5 6 7 8
Imported Rice
Retailers
Wholesalers
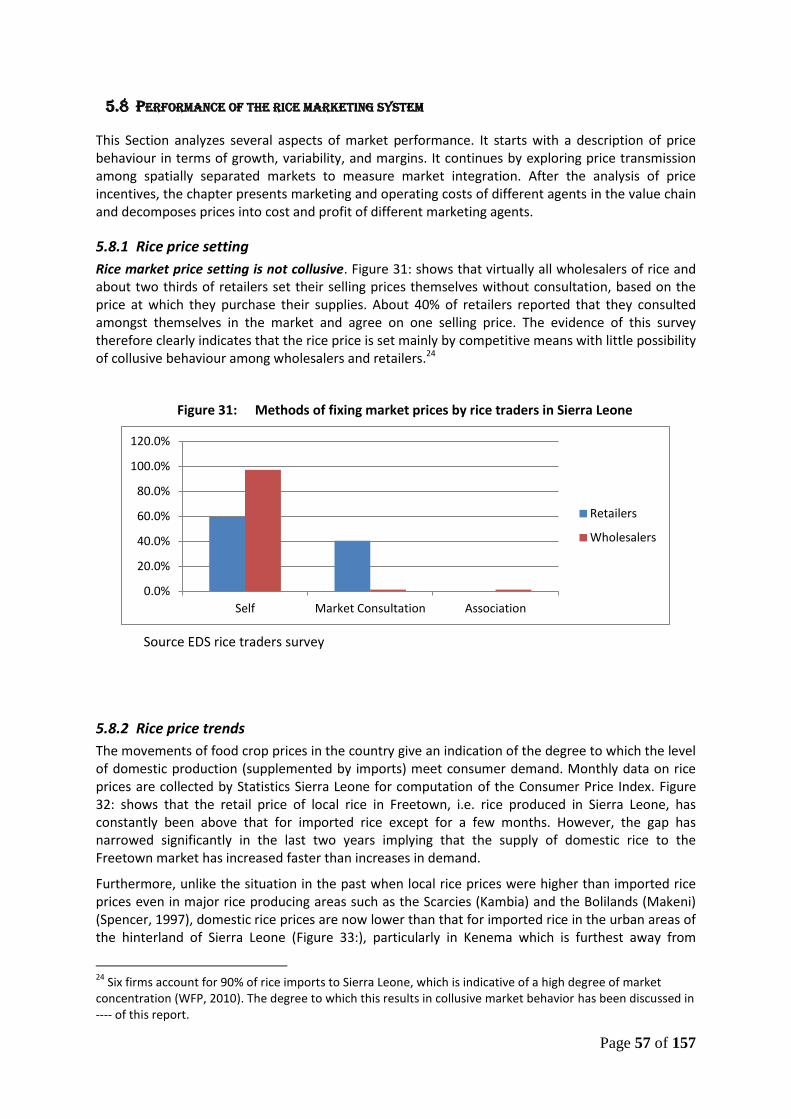
Page 57 of 157
5.8 PERFORMANCE OF THE RICE MARKETING SYSTEM
This Section analyzes several aspects of market performance. It starts with a description of price behaviour in terms of growth, variability, and margins. It continues by exploring price transmission among spatially separated markets to measure market integration. After the analysis of price incentives, the chapter presents marketing and operating costs of different agents in the value chain and decomposes prices into cost and profit of different marketing agents.
5.8.1 Rice price setting
Rice market price setting is not collusive. Figure 31: shows that virtually all wholesalers of rice and about two thirds of retailers set their selling prices themselves without consultation, based on the price at which they purchase their supplies. About 40% of retailers reported that they consulted amongst themselves in the market and agree on one selling price. The evidence of this survey therefore clearly indicates that the rice price is set mainly by competitive means with little possibility of collusive behaviour among wholesalers and retailers.24
Figure 31: Methods of fixing market prices by rice traders in Sierra Leone
Source EDS rice traders survey
5.8.2 Rice price trends
The movements of food crop prices in the country give an indication of the degree to which the level of domestic production (supplemented by imports) meet consumer demand. Monthly data on rice prices are collected by Statistics Sierra Leone for computation of the Consumer Price Index. Figure 32: shows that the retail price of local rice in Freetown, i.e. rice produced in Sierra Leone, has constantly been above that for imported rice except for a few months. However, the gap has narrowed significantly in the last two years implying that the supply of domestic rice to the Freetown market has increased faster than increases in demand.
Furthermore, unlike the situation in the past when local rice prices were higher than imported rice prices even in major rice producing areas such as the Scarcies (Kambia) and the Bolilands (Makeni) (Spencer, 1997), domestic rice prices are now lower than that for imported rice in the urban areas of the hinterland of Sierra Leone (Figure 33:), particularly in Kenema which is furthest away from
24
Six firms account for 90% of rice imports to Sierra Leone, which is indicative of a high degree of market concentration (WFP, 2010). The degree to which this results in collusive market behavior has been discussed in ---- of this report.
0.0%
20.0%
40.0%
60.0%
80.0%
100.0%
120.0%
Self Market Consultation Association
Retailers
Wholesalers

Page 58 of 157
Freetown the source of all imported rice, indicating that transportation costs of imported rice to provincial towns is now enough to remove the slight competitive advantage that imported rice may still have in Freetown.
Figure 32: Trend of retail rice prices in Freetown
Source: Statistics Sierra Leone, Consumer price index data
The linear equations shown in Table 22:, which provide the best fit to the rice price series data, show that the growth of rice prices has been slightly higher for imported rice than for local rice in each of the four cities, except for Kenema where the growth rate of imported rice price is almost double that of local rice.
Comparing growth rates across the cities we see that the growth rate for imported rice has been lowest for Freetown, the port city, and highest for Kenema the city farthest away from the port, probably a reflection of the fact that domestic transportation cost have grown faster than the CIF price for imported rice. For local rice the differences in growth rates between the cities are more difficult to explain, with Makeni in the heart of the Bolilands one of the major rice producing regions in Sierra Leone, having the highest growth rates
0
500
1,000
1,500
2,000
2,500
3,000
3,500
4,000
4,500
5,000
JAN
JUL
JAN
JUL
JAN
JUL
JAN
JUL
JAN
JUL
JAN
JUL
JAN
JUL
JAN
JUL
JAN
JUL
JAN
JUL
JAN
JUL
JAN
JUL
JAN
JUL
JAN
2000 2001 2002 2003 2004 2005 2006 2007 2008 2009 2010 2011 2012 2013
Leo
ne
s/K
g
Freetown
LOCAL RICE IMPORTED RICE

Page 59 of 157
Figure 33: Retail rice prices in provincial cities
Source: Statistics Sierra Leone, Consumer price index data
0
1,000
2,000
3,000
4,000
5,000
6,000
Leo
ne
s/K
g
BO
Local Rice Imported Rice
0
1,000
2,000
3,000
4,000
5,000
Leo
ne
s/K
g
Makeni
Local Rice Imported Rice
0
500
1000
1500
2000
2500
3000
3500
4000
4500
5000
JAN
JUN
NO
V
AP
R
SEP
FEB
JUL
DEC
MA
Y
OC
T
MA
R
AU
G
JAN
JUN
NO
V
AP
R
SEP
FEB
JUL
DEC
MA
Y
OC
T
MA
R
AU
G
JAN
JUN
2003 2004 2005 2006 2007 2008 2009 2010 2011 2012 2103
Leo
ne
s/K
g
KENEMA
Local Rice Imported Rice

Page 60 of 157
Table 22: Linear equations for monthly rice price trends (Leones/Kg)
(January 2000 – September 2013)
Freetown Bo Kenema Makeni
2000-2013 2003-2013 2003-2013 2003-2013
Local rice y = 21.713x + 421.05
y = 28.982x + 685.38
y = 18.137x + 178.64
y = 24.514x + 562.95
R² = 0.9063 R² = 0.8497 R² = 0.9201 R² = 0.8994
Imported rice y = 22.273x +
62.248 y = 29.682x + 423.75
y = 30.864x + 379.04
y = 26.476x + 399.62
R² = 0.8948 R² = 0.9265 R² = 0.9372 R² = 0.9009
Source: Calculated from Statistics Sierra Leone consumer price index data
5.8.3 Price volatility
The coefficient of variation (CV), computed as the ratio of the standard deviation to the mean, is a useful tool to compare the degree of variation of different data series. Being an indicator for the dispersion of prices from their average, it provides useful hints to assess how prices change through the market in space and time for different actors (WFP, 2011b).
The data in Table 23: shows that intra-year rice price variability in Sierra Leone is reasonably low, with the CV usually under 0.20. Price variability is higher for local than for imported rice, with Freetown having an equal or higher variability than the provincial cities which are closer to the producing areas. The volatility of imported rice prices is generally the same among all the cities. These data give further support to the notion that rice markets are reasonably well integrated in Sierra Leone.
Table 23: Coefficient of variation of monthly rice prices in Sierra Leone
Freetown Bo Kenema Makeni
Year Local Imported Local Imported Local Imported Local Imported
2000 0.12 0.12
2001 0.16 0.08
2002 0.09 0.03
2003 0.16 0.15 0.20 0.10 0.10 0.07 0.12 0.15
2004 0.16 0.08 0.19 0.08 0.11 0.06 0.12 0.08
2005 0.07 0.02 0.09 0.05 0.11 0.07 0.13 0.07
2006 0.08 0.06 0.06 0.00 0.08 0.01 0.07 0.01
2007 0.16 0.08 0.08 0.09 0.11 0.12 0.09 0.06
2008 0.17 0.11 0.18 0.13 0.15 0.13 0.14 0.13
2009 0.06 0.03 0.13 0.02 0.15 0.03 0.09 0.07
2010 0.04 0.04 0.07 0.03 0.03 0.02 0.08 0.04
2011 0.08 0.08 0.10 0.10 0.09 0.09 .07 0.12
2012 0.09 0.06 0.05 0.04 0.03 0.04 0.06 0.03
2013 0.02 0.04 0.03 0.02 0.06 0.03 0.09 0.08
Average 0.10 0.07 0.11 0.06 0.09 0.06 0.10 0.08
Source: Calculated from Statistics Sierra Leone consumer price index data
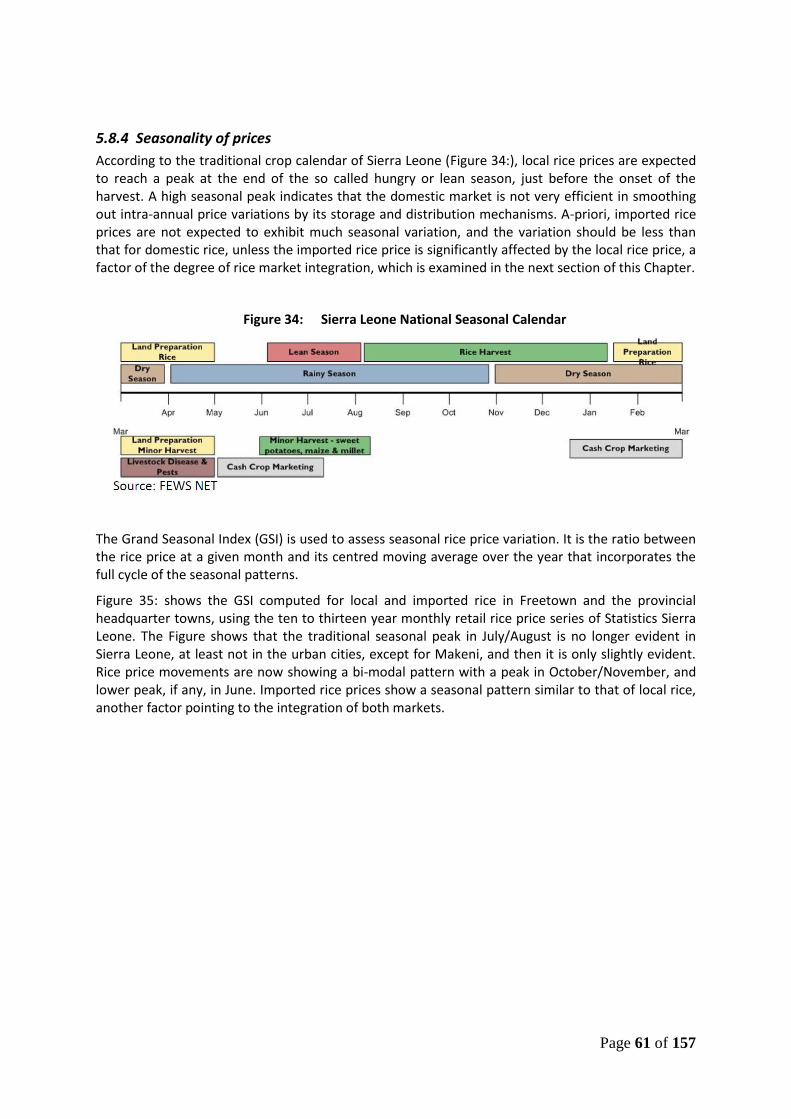
Page 61 of 157
5.8.4 Seasonality of prices
According to the traditional crop calendar of Sierra Leone (Figure 34:), local rice prices are expected to reach a peak at the end of the so called hungry or lean season, just before the onset of the harvest. A high seasonal peak indicates that the domestic market is not very efficient in smoothing out intra-annual price variations by its storage and distribution mechanisms. A-priori, imported rice prices are not expected to exhibit much seasonal variation, and the variation should be less than that for domestic rice, unless the imported rice price is significantly affected by the local rice price, a factor of the degree of rice market integration, which is examined in the next section of this Chapter.
Figure 34: Sierra Leone National Seasonal Calendar
The Grand Seasonal Index (GSI) is used to assess seasonal rice price variation. It is the ratio between the rice price at a given month and its centred moving average over the year that incorporates the full cycle of the seasonal patterns.
Figure 35: shows the GSI computed for local and imported rice in Freetown and the provincial headquarter towns, using the ten to thirteen year monthly retail rice price series of Statistics Sierra Leone. The Figure shows that the traditional seasonal peak in July/August is no longer evident in Sierra Leone, at least not in the urban cities, except for Makeni, and then it is only slightly evident. Rice price movements are now showing a bi-modal pattern with a peak in October/November, and lower peak, if any, in June. Imported rice prices show a seasonal pattern similar to that of local rice, another factor pointing to the integration of both markets.
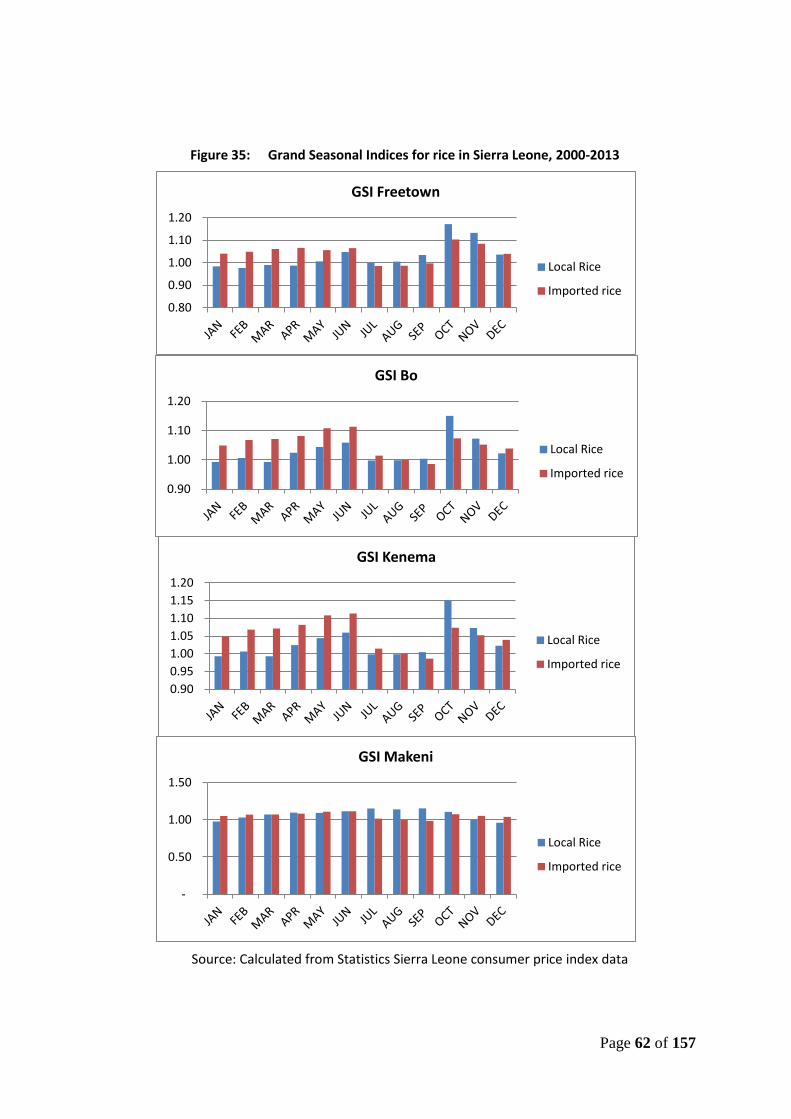
Page 62 of 157
Figure 35: Grand Seasonal Indices for rice in Sierra Leone, 2000-2013
Source: Calculated from Statistics Sierra Leone consumer price index data
0.80
0.90
1.00
1.10
1.20
GSI Freetown
Local Rice
Imported rice
0.90
1.00
1.10
1.20
GSI Bo
Local Rice
Imported rice
0.90
0.95
1.00
1.05
1.10
1.15
1.20
GSI Kenema
Local Rice
Imported rice
-
0.50
1.00
1.50
GSI Makeni
Local Rice
Imported rice

Page 63 of 157
5.8.5 Market integration
As explained by Ahmed et. al. (1996),25 the intuitive idea behind the measurement of market integration is to understand the interaction among prices in spatially separated markets. In the extreme case of two markets A and B completely separated from each other, the prices of the same commodity should not be related. If the areas where market A is located experiences a bad harvest, prices will suddenly increase. In market B, there is no reason to assume that a bad harvest has also occurred. In the absence of communication flows between the two markets, prices in B would not show any movement. On the other hand, if A and B were integrated, the price in B would also increase. This is because some food would flow from B to A decreasing the available supply in B. At the same time the price in A would be lower than in the absence of market integration. Therefore, the co-movement of prices gives an indication of the degree of market integration. However, it is conceivable that two pairs of markets (A,B) and (A',B') exhibit the same price co-movement and yet show a different rate of price adjustment. That suggests that the dynamics of price adjustment may also give important information about the integration of the two markets. For example, if price shocks from A to B take longer to be transmitted than from A' to B', then we may think of the second pair more integrated than the first one (even though the index of price co-movement may be the same).
As noted in the sections above, analysing price trends, volatility and seasonality, there are indications that the rice market in Sierra Leone is fairly well integrated. There are also indications that the price of locally produced rice is determined by the price of imported rice in addition of course, to the level of production in the country. In addition to the international price for imported rice domestic transportation cost play a part in determining imported rice prices in the different urban areas of the country.
The results of Granger causality tests are used to formerly examine whether rice markets in Sierra Leone are linked or isolated. The Granger causality test is a statistical hypothesis test for determining whether one time series is useful in forecasting another.26 Ordinarily, regressions reflect "mere" correlations, but Clive Granger, who won a Nobel Prize in Economics, argued that there is an interpretation of a set of tests as revealing something about causality. A time series X is said to Granger-cause Y if it can be shown, usually through a series of t-tests and F-tests on lagged values of X (and with lagged values of Y also included), that those X values provide statistically significant information about future values of Y.
The results of Granger Causality Test for Freetown and the three Provincial City Markets (Bo, Kenema and Makeni) for which retail rice price series are available, are shown in Table 24:. The data shows that the Freetown rice market is integrated with the provincial markets for both imported and local rice with the Null Hypothesis that Freetown does not Granger Cause the other markets and vice versa, being rejected in 11 out of 12 tests (only retained in case of Makeni does nor Granger Cause Freetown).
For the linkages between the Provincial Markets – while the Bo and Kenema markets for both local and imported rice appear to be linked to those in Makeni, the reverse is not the case. However, while the Bo and Kenema imported rice markets appear not to be linked, the local rice markets appear to be linked.
25
Raisuddin Ahmed, Francesco Goletti, Nicholas Minot, Philippe Berry, Romeo Bautista, Nguyen Viet Hai, and Nguyen The Binh (1996), Rice Market Monitoring and Policy Options Study, Final Report Prepared for the Asian Development Bank By The International Food Policy Research Institute, 1200 17th St. N.W., Washington, D.C. U.S.A. 26
Granger, C. W. J. (1969). "Investigating Causal Relations by Econometric Models and Cross-spectral methods". Econometrica 37 (3): 424–438. doi:10.2307/1912791. JSTOR 1912791

Page 64 of 157
We can conclude that the rice markets in Sierra Leone are well integrated. Freetown rice market prices for local as well as imported rice are linked to those in the provincial markets, Provincial rice markets for local rice are also integrated, although less so for imported compared to local rice.
Table 24: Pair wise Granger Causality Tests27 for Regional Rice Markets in Sierra Leone
(Observations = 119, Lags = 2)
Null Hypothesis : (rejected) Imported Rice Local Rice
F-Statistics Probability F-Statistics Probability
FREETOWN does not Granger Cause MAKENI 8.71629743 0.000293 21.54059 1.04E-08
MAKENI does not GRANGER Cause FREETOWN 12.8737757 8.68E-06 0.085163 0.91841
FREETOWN does not Granger Cause KENEMA 82.3568656 3.54E-23 51.04017 9.87E-17
KENEMA does not Granger Cause FREETOWN 13.9672134 3.56E-06 278745.2 3.88E-219
FREETOWN does not Granger Cause BO 78.9530205 1.50E-22 869.106 9.95E-72
BO does not Granger Cause FREETOWN 12.9154736 8.39E-06 126734.9 8.90E-199
BO does not Granger Cause MAKENI 223.686175 4.85E-41 11.00318 4.12E-05
MAKENI does not Granger Cause BO 0.46661369 0.628265 0.216996 0.8052
BO does not Granger Cause KENEMA 0.06245078 0.93949 53.31961 2.93E-17
KENEMA does not Granger Cause BO 1.65496743 0.195466 1112.481 9.62E-78
KENEMA does not Granger Cause MAKENI 315.76442 2.57E-48 16.21538 5.92E-07
MAKENI Does not Granger Cause KENEMA 0.05476965 0.946727 0.097698 0.9069
Source: Computed using Statistics Sierra Leone, CPI monthly rice price data set
5.8.2 Marketing costs and returns
Marketing costs are incurred each time a commodity (in this case rice) is exchanged through a distribution system. It is critical to the efficiency of the system that these marketing costs be as low as possible in order to bridge the gap between consumer and farmer prices. One way to achieve that is to promote a competitive environment whereby marketing agents do not have the opportunity to exploit either ends of the marketing chain, namely farmers or consumers.
Price incentives affect the revenues and the procurement decisions of marketing agents; together with marketing and other costs, they affect profits. The analysis of operating costs and profits of traders allows one to understand the relative efficiency of various marketing agents and indicates the constraints that need to be removed in order to improve the marketing system.
The data in Table 25:, Table 26: and Table 27: show the Gross Marketing Margin (GMM) for an average transaction, defined as the percent difference between the value of sales and cost of purchases. As a gross margin measure it is not a true profit measure as traders must cover their fixed cost, and other variable costs out of the revenue. The main fixed cost items are market dues for
27
Wessa P., (2013), Bivariate Granger Causality (v1.0.3) in Free Statistics Software (v1.1.23-r7), Office for Research Development and Education, URL http://www.wessa.net/rwasp_grangercausality.wasp/

Page 65 of 157
retailers which should be spread over all the commodities traded, and storage costs. Other costs not reflected in the analysis are local cost of transporting goods from point of purchase as well as to and from stores daily.
Retailers of imported rice purchase their supplies in bags from wholesalers. The average transaction size for retailers is between 1-2 bags of rice (Table 25:). However retailers of local rice mainly purchase their supplies from sellers in periodic markets (farmers and traders) in cups – 95% of transactions for local raw milled rice and 75% of transaction for local rice (Table 27:).
Generally margins are higher for retailers of imported rice compared to retailers of local rice - around 24% for imported rice and 15% for local rice (Table 25: and Table 26: However, wholesalers of local rice earn a higher margin (20-30%) than wholesalers of imported rice (about 8%). The GMM shown in the tables are not considered as excessive, and indicate that the rice trade in Sierra Leone, which is completely in the hands of the private sector, is competitive at both the wholesale and retail levels.
Table 25: Marketing margins of Imported rice traders for an average transaction in Sierra Leone
N Minimum Maximum Mean Std. Deviation
Parboiled Rice
Retailers
Quantity purchased (Bags) (a) 60 1.0 5.0 1.4 0.9
Duration of stock (Days) 59 1.0 14.0 5.2 3.9
Cost of purchase (Leones) 57 118,000.0 800,000.0 197,298.2 139,529.1
Value of sales (Leones) 58 140,000.0 1,040,000.0 260,510.3 175,605.1
Gross Marketing Margin (%) 57 7.1 41.7 24.6 7.1
Wholesalers
Quantity purchased (Bags) 45 2.0 300.0 35.5 49.2
Duration of stock (Days) 45 2.0 100.0 16.2 16.3
Cost of purchase (Leones) 45 280,000.0 40,800,000.0 4,449,188.9 6,552,130.8
Value of sales (Leones) 44 290,000.0 46,500,000.0 4,980,318.2 7,463,088.3
Gross Marketing Margin (%) 44 1.6 20.0 8.4 4.4
Raw Milled Broken Rice
Retailers
Quantity purchased (Bags) (a) 192 1.0 10.0 1.6 1.3
Duration of stock (Days) 191 1.0 21.0 4.4 3.8
Cost of purchase (Leones) 191 112,000.0 1,200,000.0 206,968.6 158,350.6
Value of sales (Leones) 191 140,000.0 1,600,000.0 272,873.3 210,700.1
Gross Marketing Margin (%) 191 6.3 40.0 23.3 6.3
Wholesalers
Quantity purchased (Bags) 83 1.0 200.0 34.1 33.8
Duration of stock (Days) 82 2.0 78.0 14.4 10.8
Cost of purchase (Leones) 82 66,000.0 25,200,000.0 4,079,243.9 4,125,164.9
Value of sales (Leones) 82 68,000.0 26,200,000.0 4,451,878.0 4,419,973.9
Gross Marketing Margin (%) 82 1.2 20.5 8.5 4.3
Notes: (a) 1 bag – 50 Kgs of imported parboiled or raw milled rice Source: EDS field survey, July, 2013
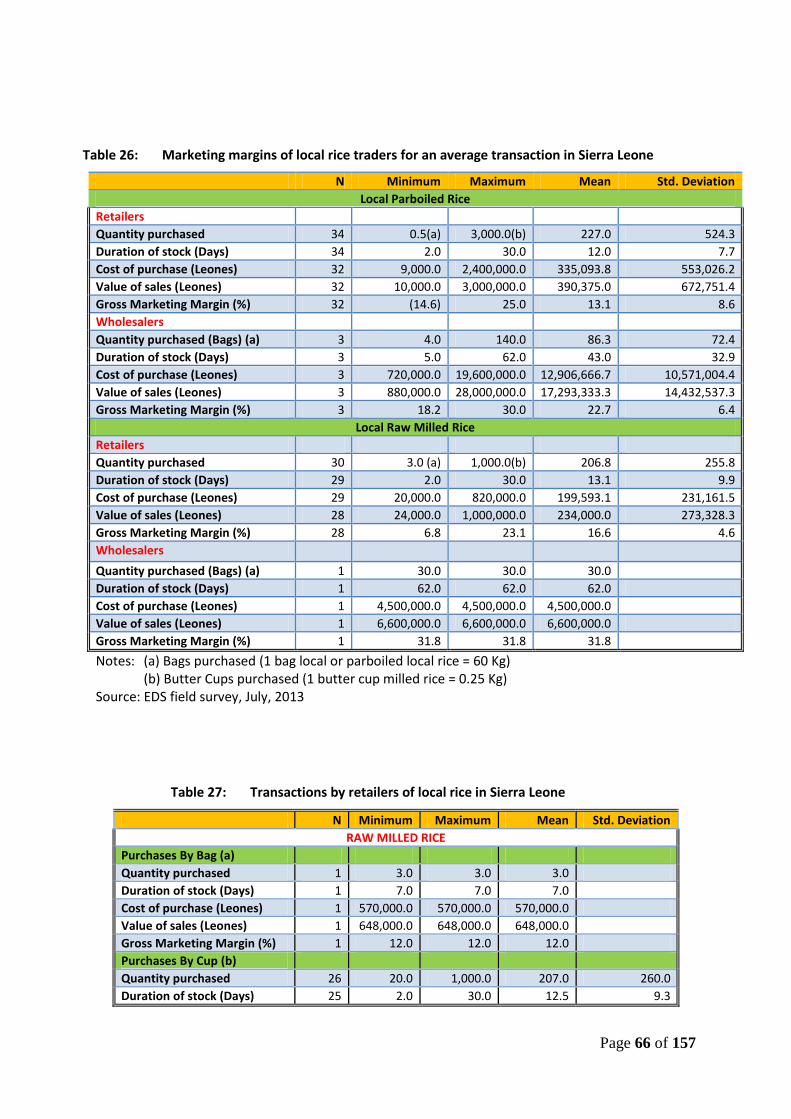
Page 66 of 157
Table 26: Marketing margins of local rice traders for an average transaction in Sierra Leone
N Minimum Maximum Mean Std. Deviation
Local Parboiled Rice
Retailers
Quantity purchased 34 0.5(a) 3,000.0(b) 227.0 524.3
Duration of stock (Days) 34 2.0 30.0 12.0 7.7
Cost of purchase (Leones) 32 9,000.0 2,400,000.0 335,093.8 553,026.2
Value of sales (Leones) 32 10,000.0 3,000,000.0 390,375.0 672,751.4
Gross Marketing Margin (%) 32 (14.6) 25.0 13.1 8.6
Wholesalers
Quantity purchased (Bags) (a) 3 4.0 140.0 86.3 72.4
Duration of stock (Days) 3 5.0 62.0 43.0 32.9
Cost of purchase (Leones) 3 720,000.0 19,600,000.0 12,906,666.7 10,571,004.4
Value of sales (Leones) 3 880,000.0 28,000,000.0 17,293,333.3 14,432,537.3
Gross Marketing Margin (%) 3 18.2 30.0 22.7 6.4
Local Raw Milled Rice
Retailers
Quantity purchased 30 3.0 (a) 1,000.0(b) 206.8 255.8
Duration of stock (Days) 29 2.0 30.0 13.1 9.9
Cost of purchase (Leones) 29 20,000.0 820,000.0 199,593.1 231,161.5
Value of sales (Leones) 28 24,000.0 1,000,000.0 234,000.0 273,328.3
Gross Marketing Margin (%) 28 6.8 23.1 16.6 4.6
Wholesalers
Quantity purchased (Bags) (a) 1 30.0 30.0 30.0
Duration of stock (Days) 1 62.0 62.0 62.0
Cost of purchase (Leones) 1 4,500,000.0 4,500,000.0 4,500,000.0
Value of sales (Leones) 1 6,600,000.0 6,600,000.0 6,600,000.0
Gross Marketing Margin (%) 1 31.8 31.8 31.8
Notes: (a) Bags purchased (1 bag local or parboiled local rice = 60 Kg) (b) Butter Cups purchased (1 butter cup milled rice = 0.25 Kg) Source: EDS field survey, July, 2013
Table 27: Transactions by retailers of local rice in Sierra Leone
N Minimum Maximum Mean Std. Deviation
RAW MILLED RICE
Purchases By Bag (a)
Quantity purchased 1 3.0 3.0 3.0
Duration of stock (Days) 1 7.0 7.0 7.0
Cost of purchase (Leones) 1 570,000.0 570,000.0 570,000.0
Value of sales (Leones) 1 648,000.0 648,000.0 648,000.0
Gross Marketing Margin (%) 1 12.0 12.0 12.0
Purchases By Cup (b)
Quantity purchased 26 20.0 1,000.0 207.0 260.0
Duration of stock (Days) 25 2.0 30.0 12.5 9.3

Page 67 of 157
N Minimum Maximum Mean Std. Deviation
Cost of purchase (Leones) 25 20,000.0 820,000.0 190,088.0 236,171.7
Value of sales (Leones) 25 24,000.0 1,000,000.0 225,120.0 275,514.6
Gross Marketing Margin (%) 25 6.8 23.1 16.8 4.8
PARBOILED RICE
Purchases By Bag (a)
Quantity purchased 8 0.5 11.0 2.8 3.5
Duration of stock (Days) 8 2.0 14.0 9.5 4.6
Cost of purchase (Leones) 8 100,000.0 2,200,000.0 563,750.0 710,089.3
Value of sales (Leones) 8 120,000.0 2,640,000.0 621,000.0 845,948.3
Gross Marketing Margin (%) 8 (14.6) 16.7 6.9 12.0
Purchases by Cup (b)
Quantity purchased 25 10.0 3,000.0 303.8 595.3
Duration of stock (Days) 25 3.0 30.0 13.1 8.4
Cost of purchase (Leones) 23 9,000.0 2,400,000.0 265,782.6 493,934.1
Value of sales (Leones) 23 10,000.0 3,000,000.0 321,913.0 618,451.9
Gross Marketing Margin (%) 23 - 25.0 15.1 6.4
(a) 1 bag local raw milled or parboiled local rice = 60 Kg (b) 1 butter cup milled rice = 0.25 Kg
CHAPTER 6. EVALUATION OF COMMERCIAL RICE PROCESSING AND STORAGE
This Chapter presents the results of the technical and financial evaluation of commercial rice processing and storage in Sierra Leone. Results are presented for the national inventory of commercial rice processing and storage facilities in the country; an assessment of technical status of facilities using a selected representative sample of establishments serving the five types of rice production agro-ecologies in the country (mangrove swamps, river-rain grasslands, bolilands, inland valley swamps and uplands); and technical/economic assessment of the processing channels. The information collected was used to design complete packages of Small, Medium and Large scale rice processing plants suitable to produce rice that will meet the quality and environmental standards for the domestic and ECOWAS markets. The final section presents indicative business plans for the three sizes of mills, in order to provide potential private sector investors with an economic profile of an efficient rice processing operation and an estimate of potential returns to investments.
6.1 NATIONAL INVENTORY OF RICE MILLS
As part of this study, EDS conducted a national inventory of rice mills in Sierra Leone. This revealed the existence of approximately 401 rice mills installed in all the districts in the country (Table 28:), up from the 53 estimated to be operational after the civil war.28 Thirty-eight (9.5%) of the mills are not operational, primarily because of breakdowns, or in the case of the large mills, lack of proper business plans for their operation.. As to be expected, the table shows that there is a concentration of rice mills in the major rice producing Districts, led by Port Loko District with 67 operational mills, Kambia with 59, Tonkolili and Bombali with 29 and 30 operational mills respectively. Kailahun
28
GoSL, Ag Sector Review, 2004

Page 68 of 157
District is not in one of the country’s rice belts but has a significantly large number of mills (34) due to its large farming population. Because there is hardly any mining going on in the District, and also because of the long history of cash crops husbandry, most adults are engaged in farming and almost every farmer grows an annual crop of rice.
Table 28: Location, ownership and condition of rice mills in Sierra Leone, by District
SCP - ABCs RPSDP - FBOs Private
District No of Mills Small Small Med Large Small Large29
Operational
Kambia 59 13 3 17 - 25
Port Loko 67 11 2 10 - 44 -
Tonkolili 29 15 - 11 - 3 -
Bombali 30 16 - 10 - 3
Bonthe 13 8 - - - 5 -
Kailahun 34 14 - 8 - 12 -
Moyamba 18 10 - 8 - - -
Pujehun 22 14 - 1 - 7 -
Bo 17 14 1 2 - - -
Koinadugu 23 11 3 9 - - -
Kenema 24 13 - 11 - - -
Kono 22 13 1 8 - - -
Western Area 5 1 1 3 - - -
Sub Total 363 153 11 98 - 99 0
Not Operational
Kambia 8 2 1 1 3 1
Port Loko 9 4 - 2 3 -
Tonkolili 2 2 - - - -
Bombali 2 2 - - - - 1
Bonthe - - - - - - 1
Kailahun 2 1 - - - 1
Moyamba 3 3 - - - -
Pujehun 1 1 - - - -
Bo 2 2 - - - - 1
Koinadugu 1 - - 1 - -
Kenema 5 3 - 2 - - 1
Kono 3 2 - 1 - -
Western Area - - - - - -
Sub Total 38 22 1 7 6 1 5
Grand Total 401 175 12 105 6 100 5
Sizes: Small = < 500Kg/hr Med = 500-999 Kg/hr Large = 1000Kg+ Kg/hr
Source: EDS Field Survey
29
Large Mills are all Government mills in various stages of privatization

Page 69 of 157
Twenty-five percent (25%) of the mills are privately owned and operated, all being small capacity mills. The five large integrated rice milling plants, installed in Bo, Kenema, Makeni, Torma Bum and Mambolo are each of 1 ton per hour capacity. Four (4) are of Indian manufacture, installed by MAFFS, each with a Bricketing machine, while the mill in Bo is of Chinese manufacture and was installed by the Chinese Government as a gift to Sierra Leone. None of these mills is in operation for various reasons including:
a) The Chinese plant, the oldest, was installed in Bo town, instead of in a major rice belt where its services would be in demand.
b) The MAFFS mills, though located in major rice belts of Sierra Leone, or as in the case of the Kenema mill, in the middle of a large Inland valley Swamp, are under management arrangements that do not include business plans as bases for their installation and operation.
6.2 OWNERSHIP OF RICE PROCESSING MACHINERY AND FACILITIES
The ownership of rice processing machinery and facilities in the country could be classified as follows:
1. State Sponsored Project Mills a. Agribusiness Centres (ABC) funded under the Smallholders Commercialization
Project (SCP) b. Rural and Private Sector Development Programme Mills – World Bank funded c. Government owned mills slated for privatization d. NERICA Dissemination Project mills
2. NGOs and development partners donated mills 3. Privately owned mills
6.2.1 The ABC Mills
Agribusiness Centres (ABCs) are established and financed under the Small holder Commercialization Programme (SPC) for farmers based organizations which constitute themselves into agribusiness groups. The groups, made up of two to four Farmer Based Organisations (FBOs) are provided with a three-compartment Agribusiness Centre (ABC) comprising of rice milling house, a store and an office. A concrete drying floor of sizes ranging from about 15m x 20m – 15x 25m is also provided in each centre, along with a water well fitted with a lift pump. Each ABC is supplied with a rice mill and generator. Some ABCs are also supplied with a power tiller, cassava grater, television and DVD player.
The largest number of rice mills in the country are those installed in the Agribusiness Centres of the Smallholder Commercialization Programme. There are 175 of these mills installed. The mills are in the small size category, rated at 200 to 250 kg per hour. They are almost all poorly maintained and managed. The mill operators are very poorly trained and do not follow any routine maintenance schedules.
Furthermore, there are major conceptual drawbacks in the establishment of the ABCs which affect their operations and should be rectified if they are to achieve their agribusiness development objectives for the smallholder farming communities. These drawbacks include:
a) Inadequacy of space in the design of the standard building for the shop and fertilizer storage,
b) Locating the trading shops for farmers’ products out of town in isolated areas rather than in the business areas of town.

Page 70 of 157
c) The qualifications and experience requirements and appointment process of the managers of ABCs and
d) The nature of the group marketing arrangement for the produce of members in the Centre. Since the ABCs are supposed to introduce farmers to modern business practices, decisions relating to their establishment should be based on rational choices and best business practices. Given this standard, one would suggest that:
i) The ABC shops should not store chemical fertilizers and processed commodities in the same room as is the current practice. . The space provided for these two products is inappropriate and grossly inadequate.
ii) The trading points for the members’ products should be in the main market centres, where buyers normally go to purchase those items; not in the remote locations currently selected for the ABC buildings. These locations are suitable for the storage of fertilizers, processing activities and administration. But just as no serious businessman will set up his/her new shop in a remote location, such a location is equally not suitable for the trading shops of the ABCs.
iii) Recruiting a manager to carry out a serious activity as trading the annual output of an ABC of 50 to 100 or more farmers must be done through a more businesslike process; certainly not through an election by farmers who are not familiar with the terms of reference required of a good business manager. Such an appointment should be by competitive selection and appointment based on the the recommendations of a competent panel after interviewing a list of highly qualified candidates.
iv) The ABC concept should encourage specialization for greater efficiency. In this regard, it would be beneficial to members of ABCs if they agree (contractually) to centralize the processing and marketing of all their produce in their ABCs. This will make for standardized processing and greatly increase the volume and value of products going through the ABC shops. This arrangement will also make the hiring of a well qualified manager cost effective.
Fortunately, all of the above recommendations can be achieved by:
a. Having the ABC shops in their area market centres. b. Vetting all managers and replacing unqualified ones with suitably trained managers. c. Using the existing donated facilities for only for processing, storage of
fertilizers/inputs and administration. d. Establishing a brand name and quality standards for all ABC products.
6.2.2 RPSDP Mills:
Rural and Private Sector Development Project (RPSDP) Centres are funded by the RPSDP with a similar concept as the ABCs and are provided with similar equipment and facilities. In addition to a rice mill, RPSDP Farmer Based Organisations (FBOs) are each supplied with a rice thresher, a de-stoning unit and a rice cutter.
Most of the mills donated by the RPSDP are of medium size, rated around 500 Kg per hour (Table 21). They are mainly of Chinese manufacture and better maintained than the ABC mills, although also plagued with many constraints, such as unavailability and high cost of spare parts. These have caused some FBOs to replace the mills with machines they have acquired themselves.

Page 71 of 157
6.2.3 Government Owned Mills
These are large capacity mills installed in Makeni, Mambolo, Torma Bum and Bo by the Government. The capacities of these mills are approximately 1 ton per hour. They have been earmarked for private acquisition by individuals or companies apparently under some form of hire purchase arrangement on terms that are not known. As indicated earlier, these mills are not yet operational.
NERICA Dissemination Project Processing Centres
There are a few rice processing centres provided under the NERICA Dissemination Project. Each centre is equipped with a building housing a small capacity mill (about 1 ton per day capacity), de-stoner, rice thresher and a generator.
NGOs and Development Partners Donated Mills
The FAO, JICA, World Vision, BRAC, Catholic Missions, Child Fund and other organizations have donated rice mills to some communities in their operational areas.
6.2.3 Private Mills
Private Mills are owned by individuals without any financial intervention from Government or donors. Most of these mills are installed and operated by private investors in the major rice producing areas of the country, where the demand for milling services are high.
Of the 28 privately owned mills in Kambia District, eleven (11) are in Mambolo town and seventeen (17) are located in other towns in the district.30 In Port Loko district 47 privately owned mills were identified, of which, 42 are located in 16 towns in Lokomassama Chiefdom31 which produces an estimated 40% of the rice output of the District. Kalangba Town and Gbinti Wala in the chiefdom have the largest numbers of mills, 8 and 6 respectively. Koya Chiefdom ranks second in the District, producing an estimated 20% of the District output. Masemera and BMK are other important rice producing Chiefdoms in the District. Rice from the Lokomassama is shipped mainly to the Kono District via Bombali.From Koya Chiefdom rice is shipped to Bamoi Market in Kambia District.
In the Tonkolili and Bombali Districts 3 and 4 respectively32privately owned millsw were identified. Rice is produced and sold in every chiefdomin the Kono district. . Apart from Dema, Saltia and some areas in Imperi Chiefdom in Bonthe, where cassava production is predominant, rice is produced throughout Bonthe district. Five (5) private mills were identified in the district three of them in the Torma Bum area.
6.3 TYPES OF MILL ESTABLISHMENTS
As indicated earlier, rice mills installed in Sierra Leone are in the small, medium and large size ranges.
6.3.1 Small Scale Rice Mill Establishments:
These establishments have mills with a capacity of about 1 – 2 tons of milled rice output per 8-hour day. The mills are rice de-huskers/polishers of two main types and are found in most of the ABCs.
a. Engleberg model mills: Most of these are Chinese manufactured mills made of a steel de-husking and polishing cylinder that rotates at 650rpm to 750rpm. A single blade is incorporated in the milling chamber to create the required friction for de-husking and polishing. A pair of
30
Tombo Wala, Rotaim Bana, Kalainkain, Robali, Rokel, Matayti, Rowolon, Makot, Royak, Yeleboya Fokol, Malambay, Mayaki, Rotaimlol, Romando, Rokitebeh, Katainma. 31
Gbinti Wala, Babara,Kalangba Town,Kabulor, Katick Wala, Mapang, Konta wala,Lumpa, Petifu Wala, Wareh Mapla, Katonga, Katoma, Kickam, Bemkia, Masiaka, Making 32
The independent estimates of the District Extension Officer and a prominent business woman in Mile 91
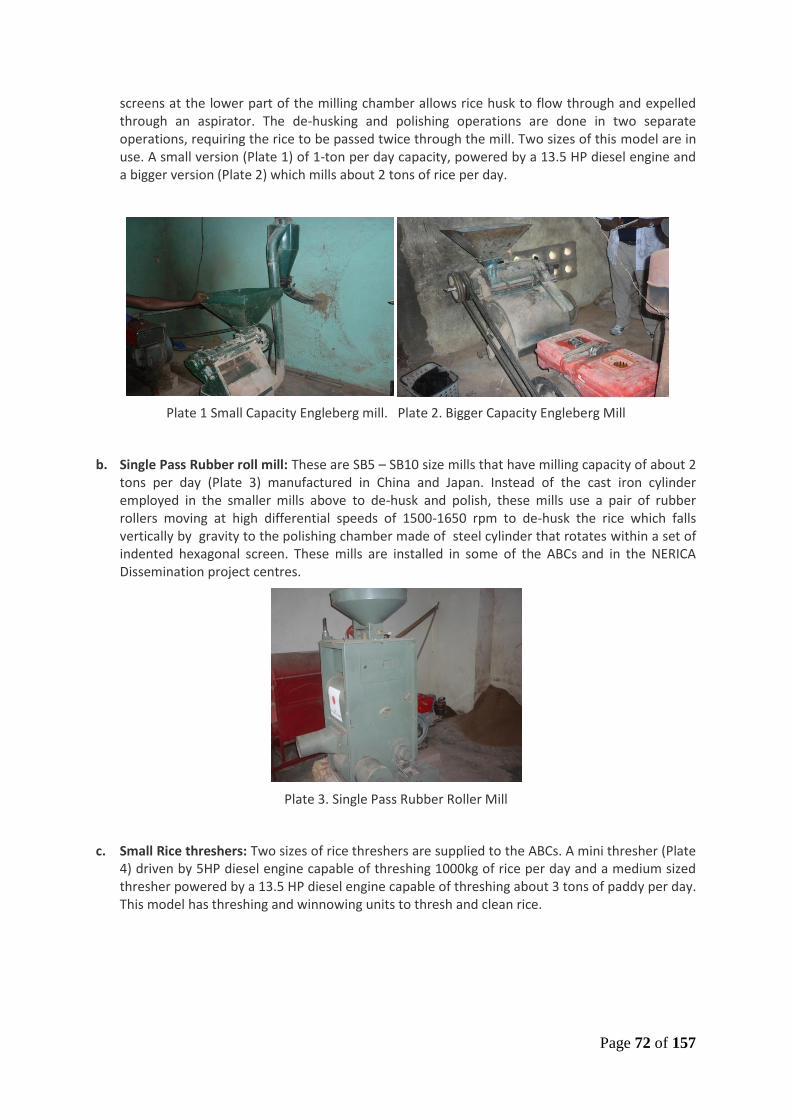
Page 72 of 157
screens at the lower part of the milling chamber allows rice husk to flow through and expelled through an aspirator. The de-husking and polishing operations are done in two separate operations, requiring the rice to be passed twice through the mill. Two sizes of this model are in use. A small version (Plate 1) of 1-ton per day capacity, powered by a 13.5 HP diesel engine and a bigger version (Plate 2) which mills about 2 tons of rice per day.
Plate 1 Small Capacity Engleberg mill. Plate 2. Bigger Capacity Engleberg Mill
b. Single Pass Rubber roll mill: These are SB5 – SB10 size mills that have milling capacity of about 2 tons per day (Plate 3) manufactured in China and Japan. Instead of the cast iron cylinder employed in the smaller mills above to de-husk and polish, these mills use a pair of rubber rollers moving at high differential speeds of 1500-1650 rpm to de-husk the rice which falls vertically by gravity to the polishing chamber made of steel cylinder that rotates within a set of indented hexagonal screen. These mills are installed in some of the ABCs and in the NERICA Dissemination project centres.
Plate 3. Single Pass Rubber Roller Mill
c. Small Rice threshers: Two sizes of rice threshers are supplied to the ABCs. A mini thresher (Plate 4) driven by 5HP diesel engine capable of threshing 1000kg of rice per day and a medium sized thresher powered by a 13.5 HP diesel engine capable of threshing about 3 tons of paddy per day. This model has threshing and winnowing units to thresh and clean rice.
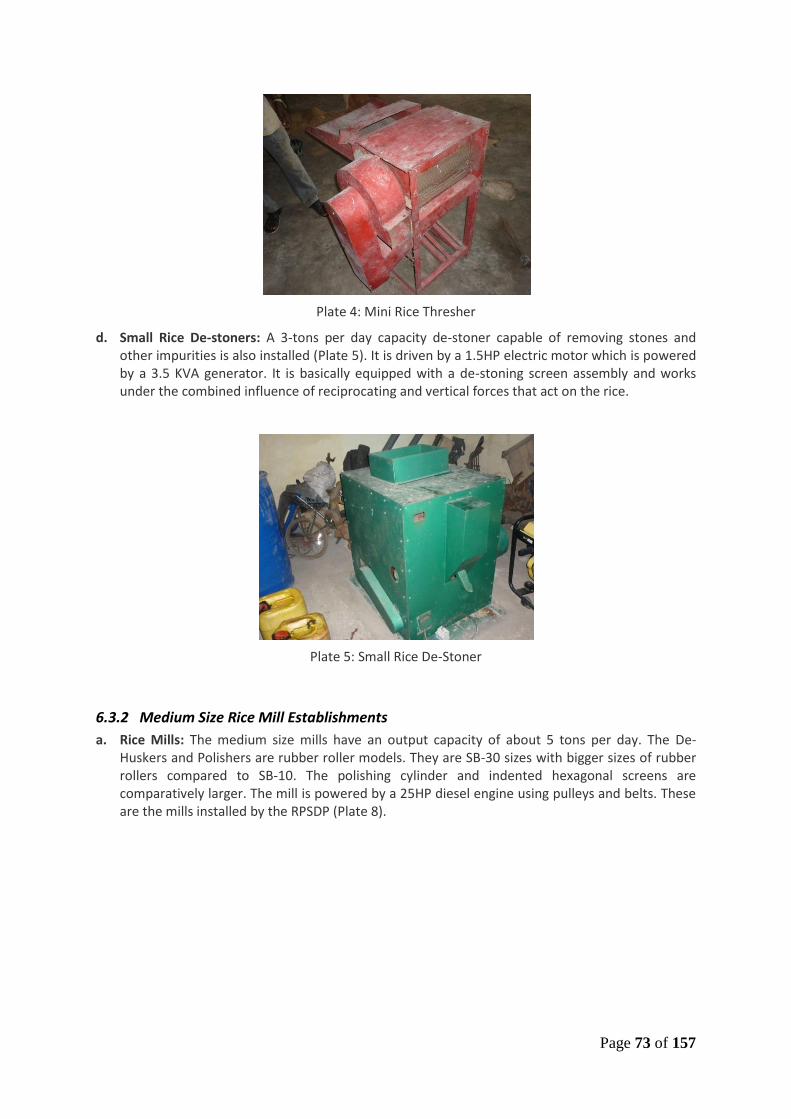
Page 73 of 157
Plate 4: Mini Rice Thresher
d. Small Rice De-stoners: A 3-tons per day capacity de-stoner capable of removing stones and other impurities is also installed (Plate 5). It is driven by a 1.5HP electric motor which is powered by a 3.5 KVA generator. It is basically equipped with a de-stoning screen assembly and works under the combined influence of reciprocating and vertical forces that act on the rice.
Plate 5: Small Rice De-Stoner
6.3.2 Medium Size Rice Mill Establishments
a. Rice Mills: The medium size mills have an output capacity of about 5 tons per day. The De-Huskers and Polishers are rubber roller models. They are SB-30 sizes with bigger sizes of rubber rollers compared to SB-10. The polishing cylinder and indented hexagonal screens are comparatively larger. The mill is powered by a 25HP diesel engine using pulleys and belts. These are the mills installed by the RPSDP (Plate 8).

Page 74 of 157
Plate 8: Medium Scale Rubber Roller Mill
b. Medium size De-Stoners: Associated with SB30 mills is a higher capacity de-stoner with sensitive and complex structures (Plate 9). Unlike those installed for the smaller mills, where broken grains are inseparable from the stones, this model can separate the broken grains from the stones. It has a capacity of over 5 tons of rice per day.
Plate 9: Medium Scale De-stoner
c. Medium size Rice Thresher: Rice threshers capable of threshing over 5 tons of rice per day are provided withthese mills. They are equipped with threshing, sieve assembly and winnowing units to achieve high performance in threshing and cleaning efficiencies (Plate 10).

Page 75 of 157
Plate 10: Medium Scale Rice Thresher
6.3.3 Large Rice Mill Establishments:
These are integrated mills in which the various operating units are linked with conveyors. They are made up of the following components:
a) Receiving Bay: This is the section where paddy (raw or parboiled) is loaded to feedr the processing units. The bay is an excavation in the floor which is concreted at the base and sides (Plate 11).
Plate 11: Receiving Bay in a large mill
b) Elevator: This is comprised of a gate that allows entry of paddy from the receiving bay and also cuts off paddy supply at desired times. The elevator is about 10m high and carries the grains vertically with the aid of buckets to feed the cleaner/de-stoner.
Plate 12: Elevator Section in a large Mill
c) Cleaning/De-stoning Units: in this unit, the rice is cleaned and de-stoned with the aid of various forms and sizes of interchangeable sieves arranged at different angles of inclination. The unit reciprocates using a cam mechanism, thereby enabling the separation of the impurities into different fractions such as stones, dust, weed seeds, straw etc (Plate 13).

Page 76 of 157
Plate 13: Cleaning/De-stoning Unit
d) De-husking Unit: This unit de-husks the cleaned paddy rice with the aid of abrasive rubber rollers. An adjustment mechanism is provided to regulate the clearance between rollers in order to control the rate of de-husking and breakages (Plate 14).
Plate 14: De-husking Unit
e) Husk Aspirator: The husk aspirator is a siphon system that sucks the husks and other lighter impurities out of the de-husking chamber (Plate 15).
Plate 15: Husk Aspirator
f) Second Stage Cleaner/De-stoner: The de-husked rice is conveyed with another set of bucket elevators where they undergo a second stage of cleaning and de-stoning (Plate 16).

Page 77 of 157
Plate 16: Second Stage Cleaner/De-stoner
h) Un-dehusked Rice Conveyor: This is belt conveyor that transports rice that escaped de-husking back to the de-husker (Plate 17).
Plate 17: Un-dehusked Rice Conveyor
i) Polishing Chamber: This is where the de-husked rice is polished with the aid of frictional forces created by the abrasive mechanism incorporated in the chamber (Plate 18).
Plate 18: Polishing Chamber
j) Indented Cylinder Grader: This is a system that uses a rotary indented cylinder to separate broken grains from whole grains after polishing (Plate 19).

Page 78 of 157
Plate 19: Indented Cylinder Grader
k) Bagging Unit: The whole grains conveyed from the grader are bagged and sealed automatically in the bagging unit and transferred to store for storage (Plate 20)
Plate 20: Bagging Unit
6.4 PROCESSING METHODS AND PRODUCTS
The country produces both parboiled and raw milled rice. The bulk of the local rice produced is parboiled.
i) Raw milled rice: Paddy rice is dried in the sun to reduce the moisture content to a required moisture level and milled.
ii) Parboiled milled rice: In the traditional process, paddy is washed and put into drums or rectangular tanks containing hot water. The paddy is continuously heated until the husk cracks. In some cases, the paddy is soaked in cold water in drums for about 2-3 days before being heated until the husks crack. The paddy is then sundried on a concrete floor or tarpaulin before milling.
The traditional methods of parboiling have a number of disadvantages. The product from rice parboiled after cold soaking sometimes gives off an offensive and unpleasant smell due to microbial activities that take place during fermentation. The swelling quality of the rice is also suppressed. When the paddy is soaked in hot water before heating, the milled product is always dark in colour
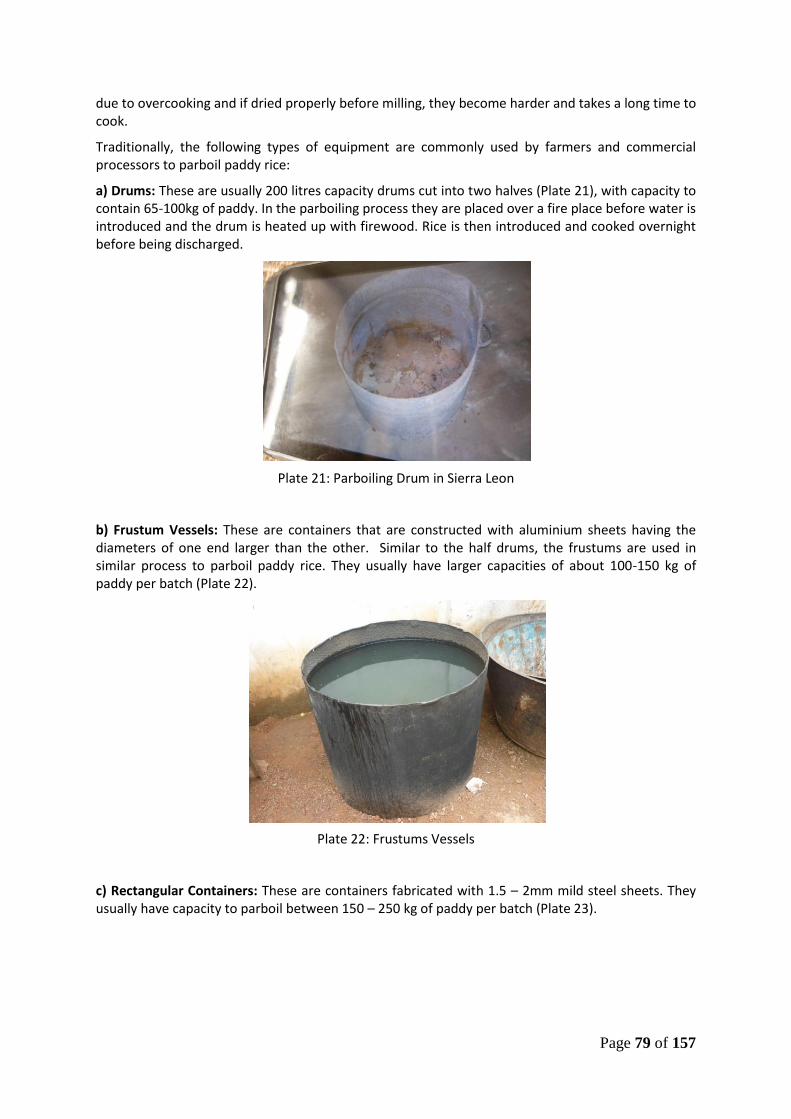
Page 79 of 157
due to overcooking and if dried properly before milling, they become harder and takes a long time to cook.
Traditionally, the following types of equipment are commonly used by farmers and commercial processors to parboil paddy rice:
a) Drums: These are usually 200 litres capacity drums cut into two halves (Plate 21), with capacity to contain 65-100kg of paddy. In the parboiling process they are placed over a fire place before water is introduced and the drum is heated up with firewood. Rice is then introduced and cooked overnight before being discharged.
Plate 21: Parboiling Drum in Sierra Leon
b) Frustum Vessels: These are containers that are constructed with aluminium sheets having the diameters of one end larger than the other. Similar to the half drums, the frustums are used in similar process to parboil paddy rice. They usually have larger capacities of about 100-150 kg of paddy per batch (Plate 22).
Plate 22: Frustums Vessels
c) Rectangular Containers: These are containers fabricated with 1.5 – 2mm mild steel sheets. They usually have capacity to parboil between 150 – 250 kg of paddy per batch (Plate 23).

Page 80 of 157
Plate 23: Rectangular Container
The following types of rice are produced in Sierra Leone:
i) Unpolished raw rice: This is rice produced by milling paddy after sun drying but without polishing. This is mostly done with glaberima steud variety which has a red bran coating (Plate 24). Milling recovery is comparatively low usually about 60-65% with rubber roller mills and about 55-60% with the Engleberg steel roller mill.
Plate. 24: Sample of unpolished raw rice in Sierra Leone
ii) Partially Polished raw rice: Unlike the unpolished raw rice, the polisher is set to effect partial polishing after dehusking (Plate 25).
Plate 25: Sample of partially polished raw rice in Sierra Leone
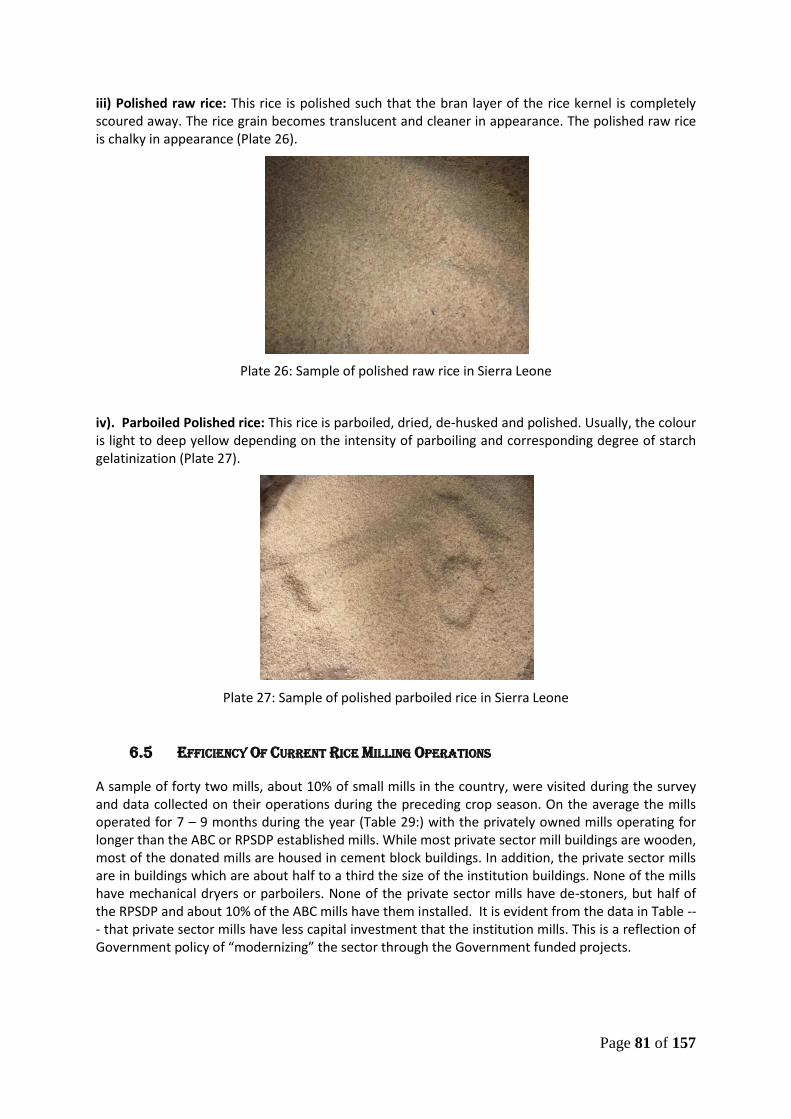
Page 81 of 157
iii) Polished raw rice: This rice is polished such that the bran layer of the rice kernel is completely scoured away. The rice grain becomes translucent and cleaner in appearance. The polished raw rice is chalky in appearance (Plate 26).
Plate 26: Sample of polished raw rice in Sierra Leone
iv). Parboiled Polished rice: This rice is parboiled, dried, de-husked and polished. Usually, the colour is light to deep yellow depending on the intensity of parboiling and corresponding degree of starch gelatinization (Plate 27).
Plate 27: Sample of polished parboiled rice in Sierra Leone
6.5 EFFICIENCY OF CURRENT RICE MILLING OPERATIONS
A sample of forty two mills, about 10% of small mills in the country, were visited during the survey and data collected on their operations during the preceding crop season. On the average the mills operated for 7 – 9 months during the year (Table 29:) with the privately owned mills operating for longer than the ABC or RPSDP established mills. While most private sector mill buildings are wooden, most of the donated mills are housed in cement block buildings. In addition, the private sector mills are in buildings which are about half to a third the size of the institution buildings. None of the mills have mechanical dryers or parboilers. None of the private sector mills have de-stoners, but half of the RPSDP and about 10% of the ABC mills have them installed. It is evident from the data in Table --- that private sector mills have less capital investment that the institution mills. This is a reflection of Government policy of “modernizing” the sector through the Government funded projects.
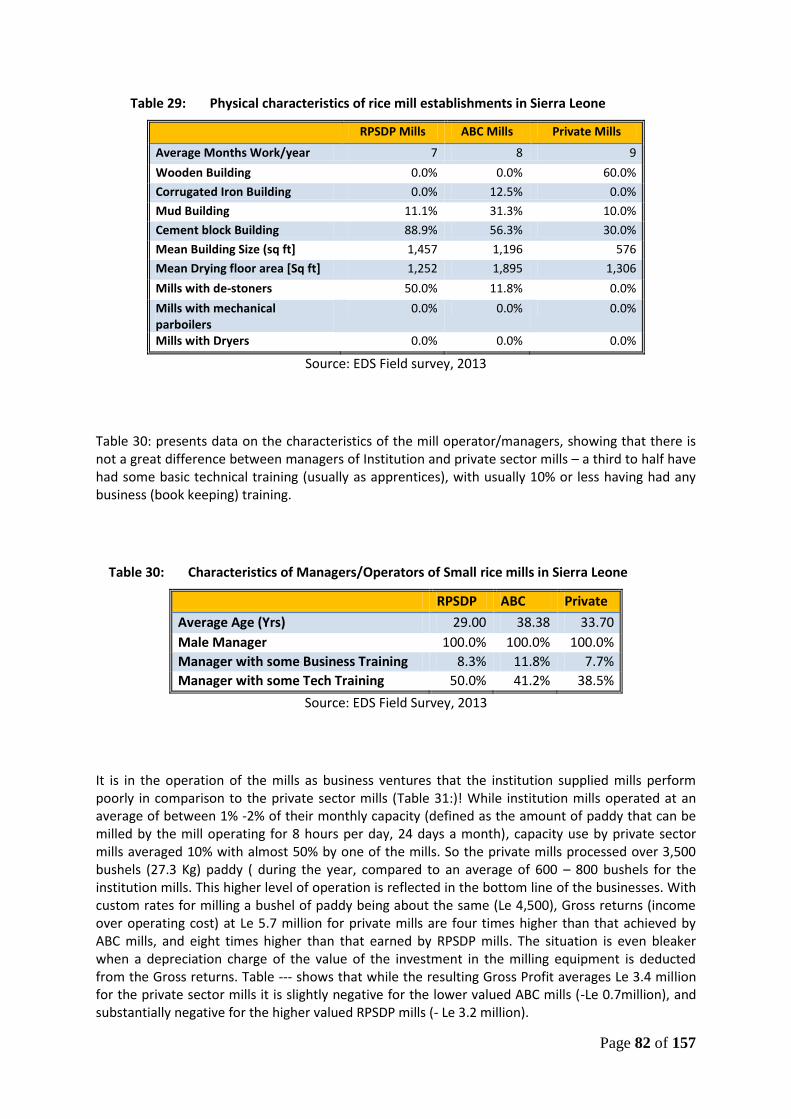
Page 82 of 157
Table 29: Physical characteristics of rice mill establishments in Sierra Leone
RPSDP Mills ABC Mills Private Mills
Average Months Work/year 7 8 9
Wooden Building 0.0% 0.0% 60.0%
Corrugated Iron Building 0.0% 12.5% 0.0%
Mud Building 11.1% 31.3% 10.0%
Cement block Building 88.9% 56.3% 30.0%
Mean Building Size (sq ft] 1,457 1,196 576
Mean Drying floor area [Sq ft] 1,252 1,895 1,306
Mills with de-stoners 50.0% 11.8% 0.0%
Mills with mechanical parboilers
0.0% 0.0% 0.0%
Mills with Dryers 0.0% 0.0% 0.0%
Source: EDS Field survey, 2013
Table 30: presents data on the characteristics of the mill operator/managers, showing that there is not a great difference between managers of Institution and private sector mills – a third to half have had some basic technical training (usually as apprentices), with usually 10% or less having had any business (book keeping) training.
Table 30: Characteristics of Managers/Operators of Small rice mills in Sierra Leone
RPSDP ABC Private
Average Age (Yrs) 29.00 38.38 33.70
Male Manager 100.0% 100.0% 100.0%
Manager with some Business Training 8.3% 11.8% 7.7%
Manager with some Tech Training 50.0% 41.2% 38.5%
Source: EDS Field Survey, 2013
It is in the operation of the mills as business ventures that the institution supplied mills perform poorly in comparison to the private sector mills (Table 31:)! While institution mills operated at an average of between 1% -2% of their monthly capacity (defined as the amount of paddy that can be milled by the mill operating for 8 hours per day, 24 days a month), capacity use by private sector mills averaged 10% with almost 50% by one of the mills. So the private mills processed over 3,500 bushels (27.3 Kg) paddy ( during the year, compared to an average of 600 – 800 bushels for the institution mills. This higher level of operation is reflected in the bottom line of the businesses. With custom rates for milling a bushel of paddy being about the same (Le 4,500), Gross returns (income over operating cost) at Le 5.7 million for private mills are four times higher than that achieved by ABC mills, and eight times higher than that earned by RPSDP mills. The situation is even bleaker when a depreciation charge of the value of the investment in the milling equipment is deducted from the Gross returns. Table --- shows that while the resulting Gross Profit averages Le 3.4 million for the private sector mills it is slightly negative for the lower valued ABC mills (-Le 0.7million), and substantially negative for the higher valued RPSDP mills (- Le 3.2 million).
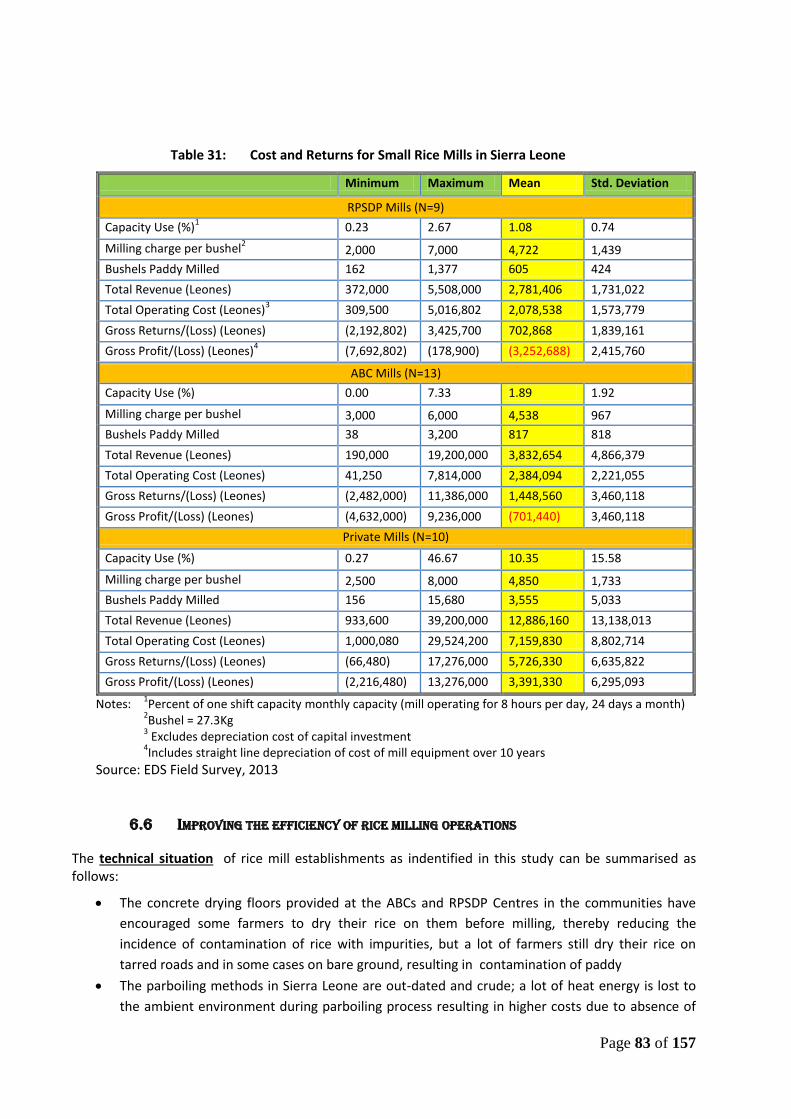
Page 83 of 157
Table 31: Cost and Returns for Small Rice Mills in Sierra Leone
Minimum Maximum Mean Std. Deviation
RPSDP Mills (N=9)
Capacity Use (%)1 0.23 2.67 1.08 0.74
Milling charge per bushel2 2,000 7,000 4,722 1,439
Bushels Paddy Milled 162 1,377 605 424
Total Revenue (Leones) 372,000 5,508,000 2,781,406 1,731,022
Total Operating Cost (Leones)3 309,500 5,016,802 2,078,538 1,573,779
Gross Returns/(Loss) (Leones) (2,192,802) 3,425,700 702,868 1,839,161
Gross Profit/(Loss) (Leones)4 (7,692,802) (178,900) (3,252,688) 2,415,760
ABC Mills (N=13)
Capacity Use (%) 0.00 7.33 1.89 1.92
Milling charge per bushel 3,000 6,000 4,538 967
Bushels Paddy Milled 38 3,200 817 818
Total Revenue (Leones) 190,000 19,200,000 3,832,654 4,866,379
Total Operating Cost (Leones) 41,250 7,814,000 2,384,094 2,221,055
Gross Returns/(Loss) (Leones) (2,482,000) 11,386,000 1,448,560 3,460,118
Gross Profit/(Loss) (Leones) (4,632,000) 9,236,000 (701,440) 3,460,118
Private Mills (N=10)
Capacity Use (%) 0.27 46.67 10.35 15.58
Milling charge per bushel 2,500 8,000 4,850 1,733
Bushels Paddy Milled 156 15,680 3,555 5,033
Total Revenue (Leones) 933,600 39,200,000 12,886,160 13,138,013
Total Operating Cost (Leones) 1,000,080 29,524,200 7,159,830 8,802,714
Gross Returns/(Loss) (Leones) (66,480) 17,276,000 5,726,330 6,635,822
Gross Profit/(Loss) (Leones) (2,216,480) 13,276,000 3,391,330 6,295,093
Notes: 1Percent of one shift capacity monthly capacity (mill operating for 8 hours per day, 24 days a month)
2Bushel = 27.3Kg
3 Excludes depreciation cost of capital investment
4Includes straight line depreciation of cost of mill equipment over 10 years
Source: EDS Field Survey, 2013
6.6 IMPROVING THE EFFICIENCY OF RICE MILLING OPERATIONS
The technical situation of rice mill establishments as indentified in this study can be summarised as follows:
The concrete drying floors provided at the ABCs and RPSDP Centres in the communities have
encouraged some farmers to dry their rice on them before milling, thereby reducing the
incidence of contamination of rice with impurities, but a lot of farmers still dry their rice on
tarred roads and in some cases on bare ground, resulting in contamination of paddy
The parboiling methods in Sierra Leone are out-dated and crude; a lot of heat energy is lost to
the ambient environment during parboiling process resulting in higher costs due to absence of

Page 84 of 157
insulation system; and there is Low durability of parboiling equipment due to lack of knowledge
to maintain them. Improved methods using simple equipment are generally lacking, even in the
Government provided large mills, and are needed.
The engines being used to provide power to the milling machines are outdated models which
overheat quickly due to absence of radiators and effective cooling systems. As such, operators
have to stop periodically to replace the cooling water.
Farmers and entrepreneurs (middle men that buy paddy and process paddy) mostly refuse to
use the de-stoners provided at the processing centers, hence a lot of contaminants are still
found in the milled rice in Sierra Leone
There is a lot of breakage of both raw milled and parboiled rice especially with the Engleberg
mills due to lack of conditioning of rice before milling, and the recovery rates for both raw and
parboiled milled rice are low.
Although broken rice is marketable and fetches higher prices, millers do not separate or grade
milled rice.
The milled rice contains a lot of dust in the form of husk and bran especially with the rice milled
by the Engleberg mills.
The quality of the parboiled milled rice is poor in terms of appearance and cooking qualities.
The running costs of all the mills were observed to be minimal. However, the rubber roll mill
seems to require more maintenance cost from frequent wear of the rollers, polishing bars and
sieves.
The storage facilities used by traders in rice markets are poor and there are no strategic storage
facilities e.g Silos and warehouses in the country
Most of the large mills are not in operation, not because of unavailability of paddy, but due to
lack of an arrangement or mechanism for getting paddy supply from the rural farming
communities.
Some of the mill operators do not have basic training in running the mills
Almost all rice threshers in the country are lying idle while traditional methods, which result in
high post harvest losses, are employed
The economic situation can be summarized as follows:
Private Sector mills are more efficient than institutional mills. Why are the institution supplied mills performing so poorly, compared to the private sector mills? The answer lies in the lack of entrepreneurial drive of the managers and beneficiaries of the institution mills, and the poor location of most of the mills relative to the sources of supply of paddy for custom milling. As shown in Table 21, the vast majority of private sector mills are located in the Scarcies area (Kambia & Port Loko Districts) the major surplus rice producing area of the country, while the institution mills are distributed all over the country, obviously for social and political reasons, but with sometime difficult access to sufficient customers for higher capacity use.
Sierra Leone has sufficient installed milling capacity. Table 32: presents an assessment of the current situation regarding the adequacy of installed milling capacity for the projected marketable surplus of rice by the year 2025. The data shows that even with the high estimates of production and marketable surplus (the EDS estimates), the mills installed and assessed as “operational” have enough capacity to mill all the marketed rice in Sierra Leone operating only one shift of 8 hours per day, 24 days a month and 9 months a year. However, as shown in Column 6 of the table, the distribution across Districts is not optimal, with

Page 85 of 157
substantial excess capacity in Kailahun, Koinadugu, Kenema, Kono, Moyamba and Pujehun Districts. The largest deficits are in Tonkolili and Port Loko Districts. The recent investments by the Government and donor partners in increasing the rice milling capacity of the country through the ABCs and RPSDP as well as private sector investments has provided the country with sufficient milling capacity to serve its needs over the next five to ten years. The case for investment in additional milling capacity in Sierra Leone is therefore quite weak. However, there is a very strong case for greatly increased, and more efficient use of the installed capacity.
Page 86 of 157
6.7 POSSIBLE SOLUTIONS TO THE IDENTIFIED PROBLEMS
The identified problems can be solved mainly in the following ways:
Modernization of existing Small, Medium and Large Scale Processing Centres in major rice production zones of the country, to equip them with the full complement of milling equipment. This should include provision of improved mechanical parboiling systems.
Provision of appropriate storage facilities- warehouses and Silos. The Sierra Leone Produce Marketing Company should be capacitated to erect and manage public warehouses and silos in the major rice producing districts, in association with the private mills.
Training should be provided in improved modern rice processing technology especially on threshing, parboiling, drying and milling, including in the organization and management of paddy supply systems for:
o Extension officers in all the Districts who will go to the communities to train the farmers
o Small and Medium Scale Processing groups who will directly apply them in their mills
Full privatisation of all institution mills (ABC, RPSPP, etc.). This analysis has clearly shown that institution operated mills are inefficient compared to the privately owned and operated mills. Indicative Business Plans for privately operated model establishments are presented in Section 6.8 below.

Page 87 of 157
Table 32: Adequacy of installed milling capacity in Sierra Leone
District
Scenario 1: High Base - High Yield2 Scenario 3: Low Base - Low Yield
2
Operational Installed
Mill Capacity
(mt)1
Prodn Mkt Surplus – AHTS ratios Mkt Surplus – EDS ratios Prodn Mkt Surplus – AHTS ratios Mkt Surplus – EDS ratios
mt mt Additional
(Surplus) Mill Capacity (mt)
mt Additional
(Surplus) Mill Capacity (mt)
mt mt Additional
(Surplus) Mill Capacity (mt)
mt Additional
(Surplus) Mill Capacity (mt)
Bo 238,169 23,817 4,947 23,817 4,947 96,417 9,642 (9,228) 9,642 (9,228) 18,870
Bombali 183,106 27,466 (20,652) 54,932 6,814 74,126 11,119 (36,999) 22,238 (25,880) 48,118
Bonthe 15,281 1,528 (9,204) 1,528 (9,204) 6,186 619 (10,114) 619 (10,114) 10,732
Kailahun 240,637 24,064 (23,347) 24,064 (23,347) 97,416 9,742 (37,669) 9,742 (37,669) 47,410
Kambia 190,696 38,139 (50,844) 95,348 6,365 77,199 15,440 (73,543) 38,599 (50,383) 88,983
Kenema 248,748 24,875 (21,533) 24,875 (21,533) 100,700 10,070 (36,338) 10,070 (36,338) 46,408
Koinadugu 221,152 22,115 (18,632) 22,115 (18,632) 89,528 8,953 (31,794) 8,953 (31,794) 40,747
Kono 183,688 18,369 (19,135) 18,369 (19,135) 74,362 7,436 (30,067) 7,436 (30,067) 37,504
Moyamba 135,776 13,578 (20,624) 13,578 (20,624) 54,965 5,497 (28,705) 5,497 (28,705) 34,201
Port Loko 263,713 52,743 (26,746) 131,856 52,367 106,757 21,352 (58,137) 53,379 (26,110) 79,489
Pujehun 65,984 6,598 (13,981) 6,598 (13,981) 26,712 2,671 (17,909) 2,671 (17,909) 20,580
Tonkolili 248,693 37,304 (13,232) 74,608 24,072 100,677 15,102 (35,434) 30,203 (20,332) 50,536
Western Area 9,408 1,882 (9,499) 4,704 (6,677) 3,808 762 (10,619) 1,904 (9,477) 11,381
Sierra Leone 2,245,998 268,851 (266,107) 473,052 (61,906) 909,236 108,837 (426,120) 191,503 (343,455) 534,958 1 Mills classed as “Operational”, operating 8 hours per day, 24 days a month, and 9 months a year 2. See Table 17

Page 88 of 157
6.8 EFFICIENT RICE PROCESSING – MODEL ESTABLISHMENTS
In this section the layout and composition of efficient rice milling establishments for Sierra Leone are proposed. Three plant sizes are envisaged – small, medium and large plants.
6.8.1: Small Scale Plants This plant is designed to mill 6 tons of rice and parboil 2tons of paddies per day. The factory basically has the following five (5) main work areas (Figure 36:):
Winnowing Area: This is the area where harvested rice from the field are cleaned using a reciprocator cleaner.
Parboiling Bay: Dry paddy rice is brought from the store and weighed into the tanks of the wet cleaners where each batch of paddy is cleaned to remove debris and unfilled grains. The cleaned paddy is then loaded into the parboilers.
Drying and Tempering Area: This is where the parboiled paddy is dried on steam heated drying platforms and spread out to gradually cool as ambient air passes over them. It is therefore provided with wire mesh or screen to prevent birds from feeding on the rice but allowing free ventilation.
Milling Area: This is the area where the milling machines are installed. They are arranged such that the rice husk and bran would be conveyed through pipes out of the work area into an adjacent field from where it is later evacuated for making briquettes, animal feeds or use as additive to the soil in farmer’s field.
Quality Control and Bagging Area: This is the section where milled rice is cleaned, de-stoned and graded by pneumatic cleaner, de-stoner and grader before weighing and bagging.
Offices and Stores: Apart from the work areas, office spaces, and lock-up store for finished product (milled rice) are provided.
Unique features of this model establishment, compared to existing small scale establishments in Sierra Leone is the installation of mechanical parboiling and drying equipment:
Parboilers: A unit of this will be provided with a capacity of 2 tons of paddy per day. Each parboiling unit is composed of a boiler where hot water and steam are generated and conveyed into the soaking/steaming tanks. The tanks are equipped with false bottoms and net to hold rice and allow steam to be circulated. Drain taps are also attached to evacuate soak water (Plate 28).
Steam heated dryer: A dryer of 2 tons of paddy per day will be provided. Drying takes place in two stages. The first stage drying reduces the moisture content of the rice from about 50% to 18% within 2 – 3 hours, while the second stage takes another 2 – 3 hours before tempering. A tempering period of about 3-4 hours between the first and second drying stages is observed to obtain good quality milled rice (Plate 29).

Page 89 of 157
Figure 36: Factory Layout for a model small scale rice processing facility in Sierra Leone
Bp Bd
St St
Wc
Dp Dp Dp
T T
of
So
Ba
Ta
Mr
6,000.0
3,600.0
1,200.0
10,200.0
3,600.010,000.02,400.0
17,000.0
1,200.0
3,600.0
3,600.0
FIG. 1 FACTORY LAYOUT PLAN (SMALL SCALE)
3,600
FIG. 2 FRONT VIEW (SMALL SCALE)
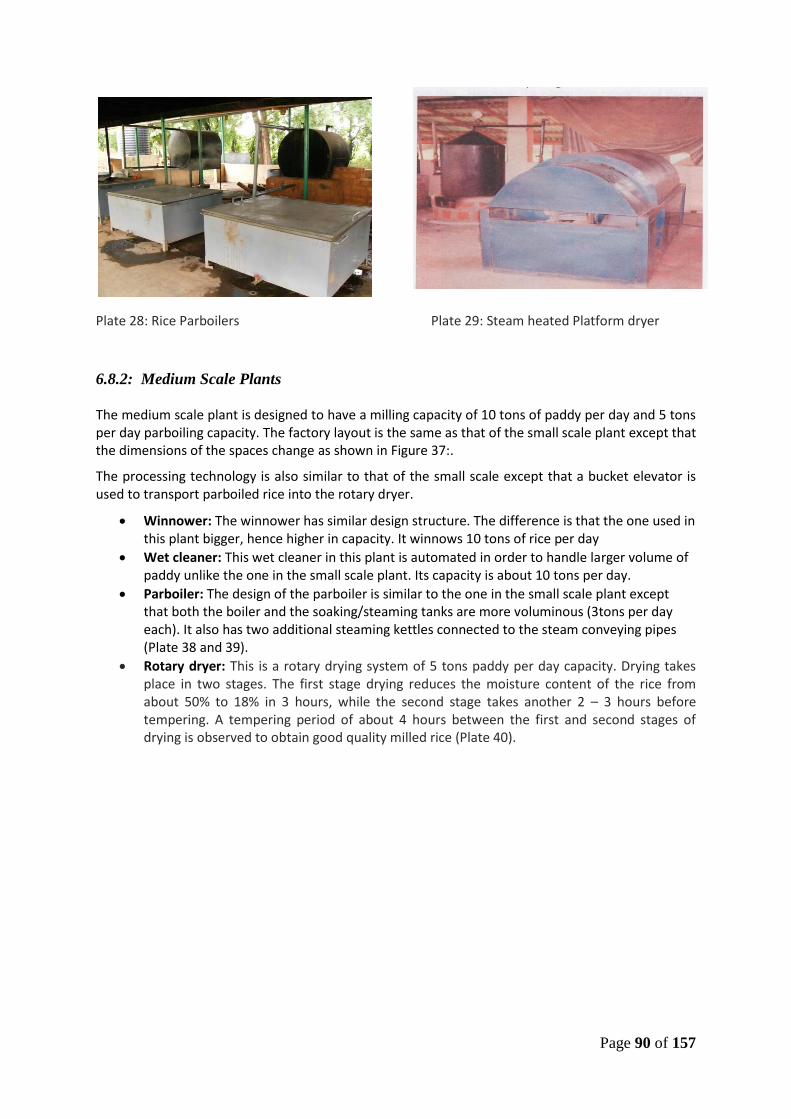
Page 90 of 157
Plate 28: Rice Parboilers Plate 29: Steam heated Platform dryer
6.8.2: Medium Scale Plants The medium scale plant is designed to have a milling capacity of 10 tons of paddy per day and 5 tons per day parboiling capacity. The factory layout is the same as that of the small scale plant except that the dimensions of the spaces change as shown in Figure 37:.
The processing technology is also similar to that of the small scale except that a bucket elevator is used to transport parboiled rice into the rotary dryer.
Winnower: The winnower has similar design structure. The difference is that the one used in this plant bigger, hence higher in capacity. It winnows 10 tons of rice per day
Wet cleaner: This wet cleaner in this plant is automated in order to handle larger volume of paddy unlike the one in the small scale plant. Its capacity is about 10 tons per day.
Parboiler: The design of the parboiler is similar to the one in the small scale plant except that both the boiler and the soaking/steaming tanks are more voluminous (3tons per day each). It also has two additional steaming kettles connected to the steam conveying pipes (Plate 38 and 39).
Rotary dryer: This is a rotary drying system of 5 tons paddy per day capacity. Drying takes place in two stages. The first stage drying reduces the moisture content of the rice from about 50% to 18% in 3 hours, while the second stage takes another 2 – 3 hours before tempering. A tempering period of about 4 hours between the first and second stages of drying is observed to obtain good quality milled rice (Plate 40).

Page 91 of 157
Figure 37: Factory Layout for a model medium scale rice processing facility in Sierra Leone
Bp Bd
St St
Wc
T 1 T
of
So
Ba
Ta
Mr
2
KtKt
DrDr
Ba
LEGEND Bp - Boiler for parboiler
Bd - Boiler for Dryer
St - Soaking /Steaming Tanks
Kt - Steaming kettles
Wc - Wet Cleaner /Winnower
Dr - Rotary Dryers
Mr - Rice Mill
Ba - Bagging Area
Ta - Tempering Area
of - Office
St- Store
T1 & T2 - Toilets
11,400.0
3,600.0
19,000.0
3,600.0
1,200.0
1,800.0
3,600.0
4,800.0
1,200.01,200.0
12,000.02,400.01,000.0
FIG. 4 FACTORY LAYOUT PLAN (MEDIUM SCALE)

Page 92 of 157
Plate 38: Parboiler Plate 39: Steaming Kettles
Plate 40. Rotary rice dryer
6.8.3: Large Scale Plants The large scale plant is designed to process 40 tons of paddy per day. The factory layout of the large scale plant is consists of Figure 38:
Paddy Receiving and cleaning section: This is where paddy would be received in a concreted
pit, cleaned with the aid of aspirators and further conveyed by bucket elevators to a
vibratory screen cleaners/de-stoner.
Parboiling bay: This is the section where the paddy would be parboiled using the by-product
(rice husk briquette) as source of heat energy.
Drying section: The parboiled rice would be dried in this section with a continuous flow
dryer and conditioned appropriately by tempering before being transferred to the next
operations
Cleaning and de-stoning unit: The dried rice would be cleaned, de-stoned in this unit before
milling

Page 93 of 157
Figure 38: Factory Layout for a model large scale rice processing facility in Sierra Leone
5,000.0
Pb
Br
15,000.0
27,000.0
Emi
Bm
Df
St
Of
8,400.0
3,600.0
8,000.0 3,000.0 2,000.0 2,000.0
6,000.0
4,000.0
9,600
1,200.0
1,200.0
1,200.0
FIG. 5 FACTORY LAYOUT PLAN (LARGE SCALE)
FIG. 6 FRONT VIEW (LARGE SCALE)

Page 94 of 157
6,000.012,000.0
FIG. 7 RIGHT HAND VIEW (LARGE SCALE)
FIG. 8 ISOMETRIC VIEW (LARGE SCALE)

Page 95 of 157
Dehusking unit: In this unit, the cleaned rice would be de-husked with rubber roller de-
huskers. Un-dehusked rice would be passed back to the mill again to ensure that every rice is
milled.
Polishing Unit: The properly milled rice would be polished to remove the bran layer in order
to make the rice to have a translucent appearance
Grading section: The polished rice would be graded by separating into broken and whole
grains
Bagging section: In this section, the rice would be bagged into different sizes of 10kg, 25kg
and 50kg .
Milled rice store: The milled rice would temporarily stored in this section before they are
transported to the warehouse.
6.9 EFFICIENT RICE PROCESSING – INDICATIVE BUSINESS PLANS
In this section a summary of the business plans (BPs) for profitable private sector operation of the model mill establishments is presented. The objective of preparing the BPs is to demonstrate, using state-of-the-art technologies, how rice can be marketed and sold profitably, by ensuring that the most effective and efficient processes are employed. The detailed Business Plans are in Annex 5.
6.9.1 LARGE SCALE MILL
The Business Plan (BP) is prepared for a model large scale establishment with a design indicated in Section 6.8.3. The projected performance of the Company is shown in Figure 39:, showing that the business should be a profitable one if operated along the lines of the projected BP.
Figure 39: Summary of projected performance of large scale model rice mill establishment
Page 96 of 157
The Headquarters of the model Company will be located in Makeni in Bombali District, which is approximately 120 miles from Freetown. Its main business will be to purchase enough paddy rice in bulk during the buying season that normally lasts from November to March for milling during the rest of the year. Sufficient storage capacity is provided to enable the Company to store enough paddy to keep a forty ton per day mill busy for 280 working days. The rice will be marketed through different channels. The Company will be a Private Limited Liability Company. It will have an Authorised Share Capital of 2,000 ordinary shares valued at $1,000 per share. The Company will start up with fixed assets totalling $2,022,500 as shown in Table 33: below.
In addition a provision of $53,000 will be made to pay for goods and services that will be needed to meet initial expenses relating to: Legal & Secretarial Services, Stationery & Office Expenses, Per Diem, Communication/IT, Publicity/Hospitality and Consultancy Fees. A total provision of $125,000 is made for consultancy service. This amount is to cover the period during the construction of various buildings and installation of machinery. This will give flexibility to the Promoters to hire the right people on short term basis to start the process of getting the Mill ready before the first year of trading. Those who prove to be effective can be absorbed into the workforce.
Marketing Strategy: The Company will develop a brand that will be easily identifiable, because of its strict adherence to quality. In addition, it will ensure clear and accurate labelling on its products and will sell at competitive prices. The production of parboiled rice, which is more nutritious than imported raw milled rice should give the company's product an edge.
Sales Strategy: The Company will have a small but highly trained and experienced sales and marketing staff. Clean parboiled rice from the Mill will be sold to Institutions, the government, UN Agencies and wholesalers in the main Provincial Towns with the bulk of the production targeted at the Western Area which is the Country's largest consumption centre. Rice will be sold ex-factory. The Mill will produce high quality rice, which will meet with customers' satisfaction. The mill will operate at full capacity in the first and second years and at one and a half capacity in the next three years with the possibilities of increasing the capacity to two full shifts. During the initial period before milling starts, the Company will engage essential staff on short term basis to oversee the installation of the machines, construction of the stores and staff houses and recruitment of staff. The advantage of hiring staff initially on short term basis will enable the Company to get rid of staff that are found unsuitable. This period will also be used to train essential staff. It is estimated that this period will run for a period of nine months.
Sales Forecast (Table 34:): The proposed mill capacity is 40 tons per day and perform at 85% efficiency at continuous operations; recovery of rate of paddy rice to milled rice is assumed to be 70%; the mill will operate for 280 days a year; the cost of paddy rice is assumed at $336 per ton and sales price at $670 per ton; in years 3, 4 & 5 the mill will operate one and a half shifts per day milling 14,280 tons of paddy and producing 9,996 tons of milled rice.
The direct cost of sales shown in Table 34:, is divided into three parts. The first part deals with the cost of purchasing paddy, the second deals with the purchase of jute bags for paddy rice, and the third part deals with the purchase of polythene bags for clean rice. The cost of the jute bags will be recovered from farmers at cost plus 20%.

Page 97 of 157
Table 33: Cost of Capital Investment for Model Large Scale Rice Milling Enterprise
Item Output Capacity
Materials specification
Source of power
Qty Unit Cost Amount
US Dollars
Rice aspiration/paddy cleaner
40tons/day 2mm mild steel sheets & angle iron
5 HP electric motor
1 100,000 100,000
Parboiling equipment 40tons/day 2mm galv. Sheet & 4mm thick mild steel plate
Rice husk briquette as heat source
1 220,000 220,000
Continuous flow dryer 40 tons/day 2mm & 3mm mild steel sheets
Rice husk briquette as heat source
1 150,000 150,000
Dehusker 20tons/day Rubber roller models 30 HP electric motor each
2 150,000 300,000
Cleaner/Destoner 40tons/day each
2mm mild steel sheets & angle iron
5HP electric motor
1 80,000 80,000
Polishers 20tons/day Rotary cylinders within indented disc
25 HP 2 100,000 200,000
Grader 40 tons/day - 5HP diesel engine
1 85,000 85,000
Auto-bagging weighing and bagging machine
300kg capacity 1 100,000 100,000
Auto-Polythene Sealer Big size 1 20,000 20,000
Drying floor 30m (length) x30m(width) X0.45m(height)
1 4,500 4,500
Borehole with overhead water storage
7.5HP submersible pump
1 45,000 45,000
Generator
100,000
Double Cab Vehicle x 2
90,000
Water Tank
6,000
Mill House
127,000
Dwelling Houses
250,000
Rice Stores
125,000
Office Equipment
20,000
Total Assets
2,022,500
Table 34: Forecasted sales and cost of sales for large scale model rice mill
Year 1 Year 2 Year 3 Year 4 Year 5
Sales
Sales $4,464,880 $4,464,880 $6,697,320 $6,697,320 $6,697,320 Jute Bags $258,999 $258,999 $388,500 $388,500 $388,500
Total Sales $4,723,879 $4,723,879 $7,085,820 $7,085,820 $7,085,820
Direct Cost of Sales
Paddy Rice $3,198,720 $3,198,720 $4,798,080 $4,798,080 $4,798,080 Jute Bags $216,000 $216,000 $324,000 $324,000 $324,000 Polythene Bags $210,000 $210,000 $315,000 $315,000 $315,000
Total Direct Cost of Sales $3,624,720 $3,624,720 $5,437,080 $5,437,080 $5,437,080

Page 98 of 157
Projected Profit and Loss: The net projected profit for the first five years will be $494,805, $546,815, $1,062,519, $1,060,343 and $1,078,509 (Table 35:). The sales to net profit ratio is projected to increase from 11.53% in year one, rising to 15.93% in year five. The three most important costs in the Projected Profit and Loss Account are fuel, personnel, and depreciation. It is assumed that the company will have to generate some of its own electricity from two generators rated at 150KVA and 50KVA respectively. Apart from the initial cost of acquiring the generators, the running costs are high. The yearly depreciation is projected to be $203,250 based on the straight line method. The Mill and all accessories will depreciate over a 10 year period, generators, motor vehicles, and office equipment will be depreciated over a period of 5 years while landed property will be depreciated over 20 years.
Table 35: Projected profit and loss for large scale rice milling company
Year 1 Year 2 Year 3 Year 4 Year 5
Sales $4,723,879 $4,723,879 $7,085,820 $7,085,820 $7,085,820
Direct Cost of Sales $3,624,720 $3,624,720 $5,437,080 $5,437,080 $5,437,080 Operations Payroll $49,008 $49,421 $62,769 $63,480 $64,926
Total Cost of Sales $3,673,728 $3,674,141 $5,499,849 $5,500,560 $5,502,006
Gross Margin $1,050,151 $1,049,738 $1,585,971 $1,585,260 $1,583,814 Gross Margin % 22.23% 22.22% 22.38% 22.37% 22.35%
Operating Expenses
Sales and Marketing Expenses
Sales and Marketing Payroll $17,304 $17,424 $25,672 $25,986 $26,307 Advertising/Promotion $4,850 $4,850 $5,093 $5,093 $5,347 Other Sales and Marketing Expenses $5,550 $5,500 $5,775 $5,775 $6,064
Total Sales and Marketing Expenses $27,704 $27,774 $36,540 $36,854 $37,718 Sales and Marketing % 0.59% 0.59% 0.52% 0.52% 0.53%
Finance and Administration Expenses
Finance and Administration Payroll $31,008 $31,383 $41,968 $42,362 $43,276 Depreciation $203,250 $203,250 $203,250 $203,250 $203,250 Rent $6,000 $6,000 $6,000 $6,600 $6,600 Utilities $7,150 $7,865 $8,651 $9,517 $10,468 Insurance $6,600 $6,600 $6,600 $6,600 $6,600 NASSIT $12,403 $12,539 $17,242 $17,460 $17,804 Fuel $6,743 $7,417 $8,159 $8,974 $9,872 Hospitality $5,500 $5,500 $5,500 $5,500 $5,500 Stationery $6,000 $6,600 $6,600 $7,260 $7,260 Communications/IT $7,576 $8,334 $8,334 $9,166 $9,166 Other Administrative Expenses $6,000 $6,000 $6,600 $6,600 $7,260
Total Finance and Administration Expenses
$298,230 $301,488 $318,904 $323,289 $327,056
Finance and Administration % 6.31% 6.38% 4.50% 4.56% 4.62%
Engineering Expenses:
Engineering Payroll $26,712 $27,161 $42,008 $42,774 $43,531 Fuel for Generators $30,000 $45,000 $49,500 $67,000 $67,000 Repairs & Maintenance $6,000 $8,000 $8,000 $10,000 $10,000 Other Engineering Expenses $4,200 $6,000 $6,000 $7,500 $7,500
Total Engineering Expenses $66,912 $86,161 $105,508 $127,274 $128,031 Engineering % 1.42% 1.82% 1.49% 1.80% 1.81%

Page 99 of 157
Year 1 Year 2 Year 3 Year 4 Year 5
Total Operating Expenses $392,846 $415,423 $460,952 $487,417 $492,805
Profit Before Interest and Taxes $657,305 $634,315 $1,125,019 $1,097,843 $1,091,009 EBITDA
1 $860,555 $837,565 $1,328,269 $1,301,093 $1,294,259
Interest Expense $162,500 $87,500 $62,500 $37,500 $12,500
Net Profit $494,805 $546,815 $1,062,519 $1,060,343 $1,078,509
Net Profit/Sales 10.47% 11.58% 15.00% 14.96% 15.22%
1 Earnings before interest, taxation, depreciation and amortisation
The Balance Sheet: The Projected Balance Sheet shows that the net worth of the Company will be $6,089,991 at the end of the fifth year (Table 36:). Retained earnings is projected at $3,211,482 together with the earning at the end of the fifth year means that total retained earnings will be ($3,011,482 + $1,078,509 = $4,089,991). Returns on Equity are 21.13%, 18.93%, 26.89%,21.16%, and 17.71% in each of the five years, a very respectable return to the prospective investor.
Table 36: Projected Balance Sheet for model large scale rice mill in Sierra Leone
Year 1 Year 2 Year 3 Year 4 Year 5 Assets
Total Current Assets $1,535,882 $2,338,929 $3,502,578 $4,516,170 $5,546,154 Fixed Assets $2,022,500 $2,022,500 $2,022,500 $2,022,500 $2,022,500 Accumulated Depreciation $203,250 $406,500 $609,750 $813,000 $1,016,250
Total Assets $3,355,132 $3,954,929 $4,915,328 $5,725,670 $6,552,404
Liabilities and Capital
Accounts Payable $13,327 $316,309 $464,189 $464,188 $462,413 Fixed Liabilities $1,000,000 $750,000 $500,000 $250,000 $0
Total Liabilities $1,013,327 $1,066,309 $964,189 $714,188 $462,413
Paid-in Capital $2,000,000 $2,000,000 $2,000,000 $2,000,000 $2,000,000 Retained Earnings ($153,000) $341,805 $888,620 $1,951,139 $3,011,482 Earnings $494,805 $546,815 $1,062,519 $1,060,343 $1,078,509
Total Capital $2,341,805 $2,888,620 $3,951,139 $5,011,482 $6,089,991
Total Liabilities and Capital $3,355,132 $3,954,929 $4,915,328 $5,725,670 $6,552,404
Net Worth $2,341,805 $2,888,620 $3,951,139 $5,011,482 $6,089,991
6.9.2 MEDIUM SIZED MILL
The Business Plan (BP) is prepared for a model medium sized establishment with a design indicated in Section 6.8.3. The projected performance of a medium sized rice milling establishment is summarized in Figure 40:, showing clearly that the business should be profitable.
The Headquarters of the model Company will be located in Makeni in Bombali District, which is approximately 120 miles from Freetown. Its main business will be to purchase enough paddy rice in bulk during the buying season that normally lasts from November to March for milling during the rest of the year. Sufficient storage capacity is provided to enable the Company to store enough paddy to keep a ten ton per day mill busy for 280 working days. The rice will be marketed through different channels. The Company will be a Private Limited Liability Company. It will have an Authorised Share Capital of 250 ordinary shares valued at $1,000 per share.

Page 100 of 157
Figure 40: Summary of projected performance of medium sized model rice mill establishment
The Company will start up with fixed assets totalling $332,500 as shown in Table 37: below. In addition a provision of $21,500 is made to pay for goods and services that will be needed to meet initial expenses relating to: Legal & Secretarial Services, Stationery & Office Expenses, Per Diem, Communication/IT, Publicity/Hospitality and Consultancy Fees. A total provision of $21,500 is also made for consultancy service. This amount is to cover the period during the construction of various buildings and installation of machinery. This will give flexibility to the Promoters to hire the right people on short term basis to start the process of getting the Mill ready before the first year of trading. Those who prove to be effective can be absorbed into the workforce.
Sales Forecast (Table 38:): Rice will be sold ex-factory. The Mill will produce high quality rice, which will meet with customers' satisfaction. The mill will operate at full capacity in the first and second years and at one and a half capacity in the next three years with the possibilities of increasing the capacity to two full shifts.
The proposed mill capacity is 10 tons per day and perform at 85% efficiency at continuous operations; recovery of rate of paddy rice to milled rice is assumed to be 70%; the mill will operate for 280 days a year; the cost of paddy rice is assumed at $336 per ton and sales price at $670 per ton; in years 3, 4 & 5 the mill will operate one and a half shifts per day milling 2,380mt of paddy and producing 1,116mt of milled rice.
The direct cost of sales shown in Table 38:, is divided into three parts. The first part deals with the cost of purchasing paddy, the second deals with the purchase of jute bags for paddy rice, and the third part deals with the purchase of polythene bags for clean rice. The cost of the jute bags will be recovered from farmers at cost plus 20%.

Page 101 of 157
Table 37: Cost of Capital Investment for Model Medium Sized Rice Milling Enterprise
Items Output Capacity Materials specification Source of power
Qty Unit Cost
(US$)
Amount US$
Rice winnower 10 tons/day -1.5mm mild steel sheet -500mm X 500mmX 2mm for frame
7.5 HP diesel engine
1 2,500 2,500
Automated Wet cleaner 10 tons/day 2mm galv. sheet 10 HP diesel engine
1 2,000 2,000
Rice Parboiler 5 tons/day each -3mm plate for boiler -2mm galv. Sheet for soaking/ steaming tanks
Firewood, husk (briquette) or gas
2 15,000 30,000
Steam heated Rotary dryer
2.5tons/day -3mm plate for boiler -2mm sheet for drying platform
Firewood, husk (briquette) or gas
2 20,000 40,000
Rice Mill 10tons/day each 1.5mm mild steel sheet and 50mm x 50mm x 2mm angle iron frame
20 HP water cool engine with radiator
1 3,400 3,400
De-stoner 1tons/day 1.5mm mild steel sheet 5 HP diesel engine
1 3,250 3,250
Grader/Cleaner 10 tons/day 1.5 mm mild steel sheet 5HP diesel engine
1 3,000 3,000
Platform weighing scale 200kg capacity 1 900 900
Mini weighing scale 10kg capacity 1 50 50
Polythene Sealers Medium 2 50 50
Hand held bag sewing machine
1 300 300
Drying floor 30m (length) x 40m (width) x0.45m (height)
1 3,000 3,000
Borehole with overhead water storage
3HP submersible pump
1 3,650 3,650
Double Cab 4x4 1 45,000 45,000
Generator 50 KVA 1 50,000 50,000
Office Equip 2,900 2,900
Water Tank 5,000 ltr. 1 2,500 2,500
Mill House 1 50,000 50,000
Store 1 40,000 40,000
Dwelling House 1 50,000 50,000
Total 332,500

Page 102 of 157
Table 38: Forecasted sales and cost of sales for Medium Sized model rice mill
Year 1 Year 2 Year 3 Year 4 Year 5
Sales
Sales of Clean Rice $1,116,220 $1,116,220 $1,674,330 $1,674,330 $1,674,330 Sale of Jute Bags $51,840 $51,840 $93,312 $93,312 $93,312
Total Sales $1,168,060 $1,168,060 $1,767,642 $1,767,642 $1,767,642
Direct Cost of Sales
Cost of Sales - Rice $799,680 $799,680 $1,195,520 $1,195,520 $1,195,520 Cost of Polythene Bags $49,980 $49,980 $74,970 $74,970 $74,970 Cost of Jute Bags $51,840 $51,840 $62,208 $62,208 $62,208
Total Direct Cost of Sales $901,500 $901,500 $1,332,698 $1,332,698 $1,332,698
Projected Profit and Loss: The net projected profit for the first five years will be $148,670, $150,285, $308,424, $312,312 and $301,460 respectively (Table 39:). The sales to net profit ratio is projected to increase from 12.73% in year one, rising to 17.05% in year five. The three most important costs in the Projected Profit and Loss Account are fuel, personnel, and depreciation. It is assumed that the company will have to generate some of its own electricity from two generators rated at 150KVA and 50KVA respectively. Apart from the initial cost of acquiring the generators, the running costs are high. The yearly depreciation is projected to be $31,000 based on the straight line method. The Mill and all accessories will depreciate over a 10 year period, generators, motor vehicles, and office equipment will be depreciated over a period of 5 years while landed property will be depreciated over 15 years.
Balance Sheet (Table 40:): The Projected Balance Sheet shows that the net worth of the Company will be about $1.5millionat the end of the fifth year, a substantial increase from the $0.4million at the end of the first year. Retained earnings are projected to increase from a negative $0.02million in the first year to $0.9million in the fifth year. With annual Returns on Equity of 39.42%, 28.49%, 36.90%, 27.20% and 20.80% in Year one to five respectively, the business is projected to be very profitable.

Page 103 of 157
Table 39: Projected profit and loss for Medium Sized rice milling company
Year 1 Year 2 Year 3 Year 4 Year 5
Sales $1,168,060 $1,168,060 $1,767,642 $1,767,642 $1,767,642
Direct Cost of Sales $901,500 $901,500 $1,332,698 $1,332,698 $1,332,698 Other Costs of Sales $0 $0 $0 $0 $0
Total Cost of Sales $901,500 $901,500 $1,332,698 $1,332,698 $1,332,698
Gross Margin $266,560 $266,560 $434,944 $434,944 $434,944 Gross Margin % 22.82% 22.82% 24.61% 24.61% 24.61%
Expenses
Payroll $33,900 $33,900 $46,595 $46,595 $48,925 Depreciation $31,300 $31,300 $31,300 $31,300 $31,300 Rent $1,500 $1,500 $1,650 $1,650 $1,815 Utilities $1,500 $1,575 $1,653 $1,736 $1,822 Insurance $1,500 $1,500 $1,500 $1,500 $1,500 NASSIT $3,390 $3,390 $4,660 $4,660 $4,893 Fuel $12,000 $12,600 $13,230 $13,892 $14,586 Hospitality $1,200 $1,200 $1,200 $1,320 $1,320 Stationery $1,200 $1,200 $1,260 $1,260 $1,323 Communications/IT $1,500 $1,500 $1,575 $1,575 $1,654 Repairs & Maintenance $1,500 $1,650 $1,815 $1,996 $2,196 Marketing & Promotions $1,200 $1,200 $1,260 $1,260 $13,123 Other Administrative Expenses $1,200 $1,260 $1,323 $1,389 $1,528
Total Operating Expenses $92,890 $93,775 $109,021 $110,133 $125,985
Profit Before Interest and Taxes $173,670 $172,785 $325,924 $324,812 $308,960 EBITDA
1 $204,970 $204,085 $357,224 $356,112 $340,260
Interest Expense $25,000 $22,500 $17,500 $12,500 $7,500
Net Profit $148,670 $150,285 $308,424 $312,312 $301,460
Net Profit/Sales 12.73% 12.87% 17.45% 17.67% 17.05%
1 Earnings before interest, taxation, depreciation and amortisation
Table 40: Projected Balance Sheet for model medium sized rice milling enterprise
Year 1 Year 2 Year 3 Year 4 Year 5
Assets
Total Current Assets $325,970 $457,555 $747,279 $1,040,890 $1,323,650 Fixed Assets $332,500 $332,500 $332,500 $332,500 $332,500 Accumulated Depreciation $31,300 $62,600 $93,900 $125,200 $156,500
Total Assets $627,170 $727,455 $985,879 $1,248,190 $1,499,650
Liabilities and Capital
Fixed Liabilities $250,000 $200,000 $150,000 $100,000 $50,000 Paid-in Capital $250,000 $250,000 $250,000 $250,000 $250,000 Retained Earnings ($21,500) $127,170 $277,455 $585,879 $898,190 Earnings $148,670 $150,285 $308,424 $312,312 $301,460
Total Capital $377,170 $527,455 $835,879 $1,148,190 $1,449,650
Total Liabilities and Capital $627,170 $727,455 $985,879 $1,248,190 $1,499,650
Net Worth $377,170 $527,455 $835,879 $1,148,190 $1,449,650

Page 104 of 157
6.9.3 SMALL SCALE MILL
The projected performance of a medium sized rice milling establishment is summarized in Figure 41:, showing, as in the case of the large and medium sized mills, that the business should be profitable.
Figure 41: Summary of projected performance of small scale model rice mill establishment
As for the other model mills, the assumption is that the Headquarters of the Company will be located in Makeni in Bombali District, which is approximately 120 miles from Freetown. Its main business will be to purchase enough paddy rice in bulk during the buying season that normally lasts from November to March for milling during the rest of the year. Sufficient storage capacity is provided to enable the Company to store enough paddy to keep a ten ton per day mill busy for 280 working days. The rice will be marketed through different channels. The Company will be a Private Limited Liability Company. It will have an Authorised Share Capital of 150 ordinary shares valued at $1,000 per share.
The Company will start up with fixed assets totalling $230,900 as shown in Table 41: below. In addition a provision of $10,250 is made available to pay for goods and services that will be needed to meet initial expenses relating to: Legal & Secretarial Services, Stationery & Office Expenses, Per Diem, Communication/IT, Publicity/Hospitality and Consultancy Fees. A total provision of $10,250 is also made for consultancy service. This amount is to cover the period during the construction of various buildings and installation of machinery. This will give flexibility to the Promoters to hire the right people on short term basis to start the process of getting the Mill ready before the first year of trading. Those who prove to be effective can be absorbed into the workforce.
Sales Forecast (Table 42:): Rice will be sold ex-factory. The Mill will produce high quality rice, which will meet with customers' satisfaction. The mill will operate at full capacity in the first and second years and at one and a half capacity in the next three years with the possibilities of increasing the capacity to two full shifts.

Page 105 of 157
Table 41: Cost of Capital Investment for Model Small Scale Rice Milling Enterprise
Machines/ Equipment Output Capacity
Materials specification Source of power Qty Unit
Cost($) Amount
Rice winnower 3tons/day 1.5mm mild steel sheet 3.5 HP diesel engine
1 2,300 2,300
Wet cleaner 3 tons/day 2mm galv. sheet N/A 1 350 350
Rice Parboiler 2 tons/day -3mm plate for boiler -2mm galv. Sheet for soaking/ steaming tanks
Firewood, husk (briquette) or gas
1 12,000 12,000
Steam heated platform dryer
2tons/day -3mm plate for boiler -2mm sheet for drying platform
Firewood, husk (briquette) or gas
1 15,000 15,000
Rice Mill 3tons/day each Engle-berge mill 15 HP water cool engine with radiator
1 2,800 2,800
De-stoner 3tons/day 1.5mm mild steel sheet 2 HP diesel engine
1 10,200 10,000
Grader/Cleaner 3 tons/day 1.5 mm mild steel sheet 3.5HP diesel engine
1 2,300 2,300
Platform weighing scale 150kg capacity 1 750 750
Polythene Sealers Medium size 1 50 50
Mini weighing scale 10kg capacity 1 50 50
Hand held bag sewing machine
1 300 300
Drying floor 20m (length) x20m(width) X0.45m(height
1 2,000 2,000
Borehole 2HP submersible pump
1 3,500 3,500
Double Cab 4x4 1 45,000 45,000
Generator 35 KVA 1 35,000 35000
Office Equip 2,500 2,500
Water Tank 1 2,000 2,000
Mill House 1 25,000 25,000
Store 1 30,000 30,000
Dwelling 1 40,000 40,000
Total 230,900
The proposed mill capacity is 5 tons per day and perform at 85% efficiency at continuous operations; recovery of rate of paddy rice to milled rice is assumed to be 70%; the mill will operate for 280 days a year; the cost of paddy rice is assumed at $336 per ton and sales price at $670 per ton; in years 3, 4 & 5 the mill will operate one and a half shifts per day milling 1,190mt of paddy and producing 833mt of milled rice.
The direct cost of sales shown in Table 42:, is divided into three parts. The first part deals with the cost of purchasing paddy, the second deals with the purchase of jute bags for paddy rice, and the third part deals with the purchase of polythene bags for clean rice. The cost of the jute bags will be recovered from farmers at cost plus 20%.
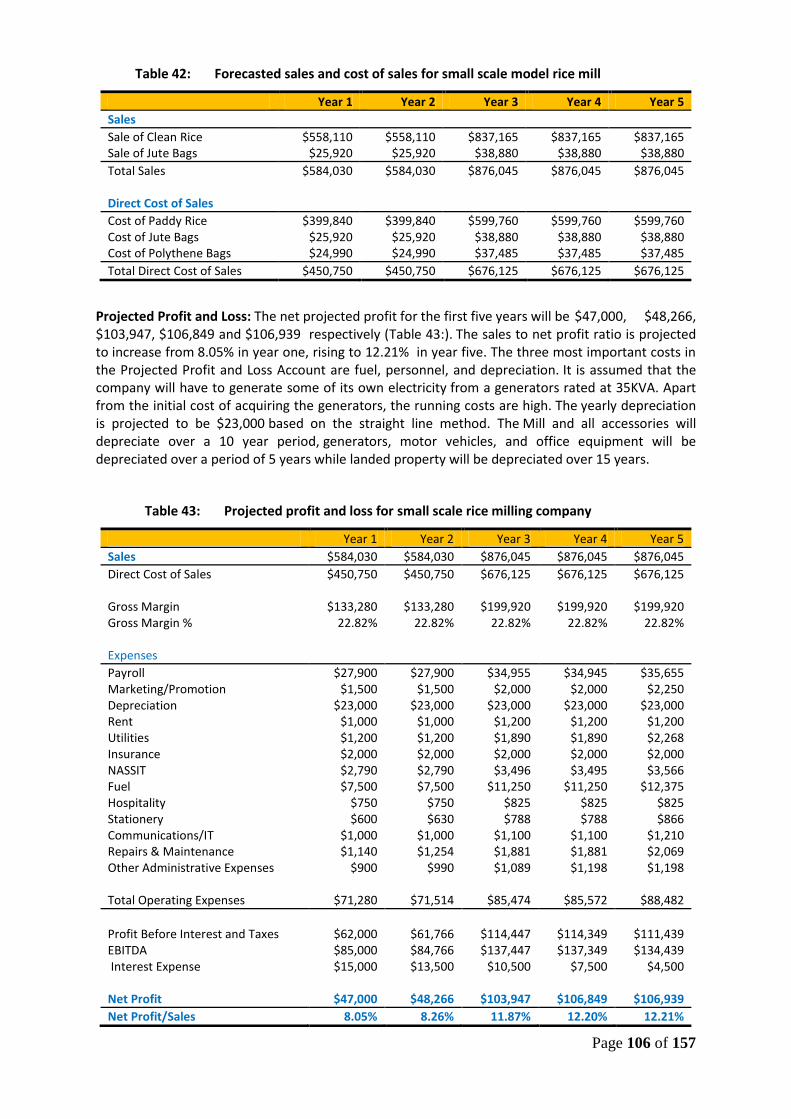
Page 106 of 157
Table 42: Forecasted sales and cost of sales for small scale model rice mill
Year 1 Year 2 Year 3 Year 4 Year 5
Sales
Sale of Clean Rice $558,110 $558,110 $837,165 $837,165 $837,165 Sale of Jute Bags $25,920 $25,920 $38,880 $38,880 $38,880
Total Sales $584,030 $584,030 $876,045 $876,045 $876,045
Direct Cost of Sales
Cost of Paddy Rice $399,840 $399,840 $599,760 $599,760 $599,760 Cost of Jute Bags $25,920 $25,920 $38,880 $38,880 $38,880 Cost of Polythene Bags $24,990 $24,990 $37,485 $37,485 $37,485
Total Direct Cost of Sales $450,750 $450,750 $676,125 $676,125 $676,125
Projected Profit and Loss: The net projected profit for the first five years will be $47,000, $48,266, $103,947, $106,849 and $106,939 respectively (Table 43:). The sales to net profit ratio is projected to increase from 8.05% in year one, rising to 12.21% in year five. The three most important costs in the Projected Profit and Loss Account are fuel, personnel, and depreciation. It is assumed that the company will have to generate some of its own electricity from a generators rated at 35KVA. Apart from the initial cost of acquiring the generators, the running costs are high. The yearly depreciation is projected to be $23,000 based on the straight line method. The Mill and all accessories will depreciate over a 10 year period, generators, motor vehicles, and office equipment will be depreciated over a period of 5 years while landed property will be depreciated over 15 years.
Table 43: Projected profit and loss for small scale rice milling company
Year 1 Year 2 Year 3 Year 4 Year 5
Sales $584,030 $584,030 $876,045 $876,045 $876,045
Direct Cost of Sales $450,750 $450,750 $676,125 $676,125 $676,125
Gross Margin $133,280 $133,280 $199,920 $199,920 $199,920 Gross Margin % 22.82% 22.82% 22.82% 22.82% 22.82%
Expenses
Payroll $27,900 $27,900 $34,955 $34,945 $35,655 Marketing/Promotion $1,500 $1,500 $2,000 $2,000 $2,250 Depreciation $23,000 $23,000 $23,000 $23,000 $23,000 Rent $1,000 $1,000 $1,200 $1,200 $1,200 Utilities $1,200 $1,200 $1,890 $1,890 $2,268 Insurance $2,000 $2,000 $2,000 $2,000 $2,000 NASSIT $2,790 $2,790 $3,496 $3,495 $3,566 Fuel $7,500 $7,500 $11,250 $11,250 $12,375 Hospitality $750 $750 $825 $825 $825 Stationery $600 $630 $788 $788 $866 Communications/IT $1,000 $1,000 $1,100 $1,100 $1,210 Repairs & Maintenance $1,140 $1,254 $1,881 $1,881 $2,069 Other Administrative Expenses $900 $990 $1,089 $1,198 $1,198
Total Operating Expenses $71,280 $71,514 $85,474 $85,572 $88,482
Profit Before Interest and Taxes $62,000 $61,766 $114,447 $114,349 $111,439 EBITDA $85,000 $84,766 $137,447 $137,349 $134,439 Interest Expense $15,000 $13,500 $10,500 $7,500 $4,500
Net Profit $47,000 $48,266 $103,947 $106,849 $106,939
Net Profit/Sales 8.05% 8.26% 11.87% 12.20% 12.21%
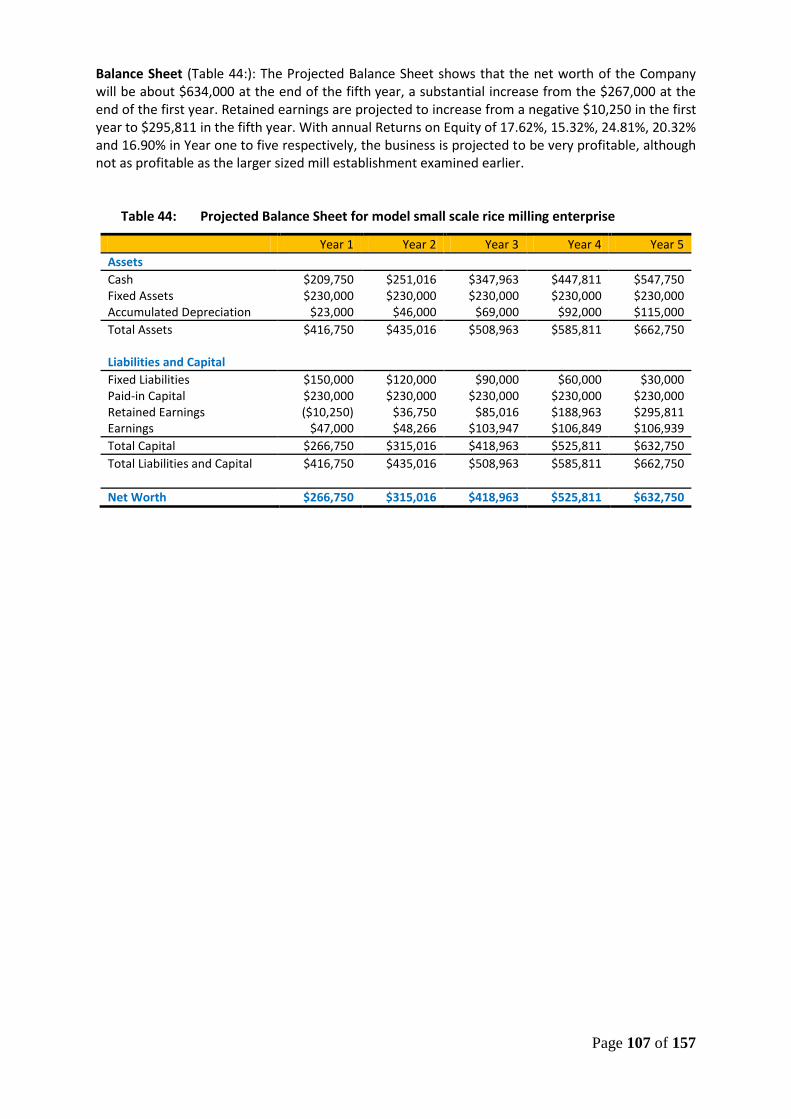
Page 107 of 157
Balance Sheet (Table 44:): The Projected Balance Sheet shows that the net worth of the Company will be about $634,000 at the end of the fifth year, a substantial increase from the $267,000 at the end of the first year. Retained earnings are projected to increase from a negative $10,250 in the first year to $295,811 in the fifth year. With annual Returns on Equity of 17.62%, 15.32%, 24.81%, 20.32% and 16.90% in Year one to five respectively, the business is projected to be very profitable, although not as profitable as the larger sized mill establishment examined earlier.
Table 44: Projected Balance Sheet for model small scale rice milling enterprise
Year 1 Year 2 Year 3 Year 4 Year 5
Assets
Cash $209,750 $251,016 $347,963 $447,811 $547,750 Fixed Assets $230,000 $230,000 $230,000 $230,000 $230,000 Accumulated Depreciation $23,000 $46,000 $69,000 $92,000 $115,000
Total Assets $416,750 $435,016 $508,963 $585,811 $662,750
Liabilities and Capital
Fixed Liabilities $150,000 $120,000 $90,000 $60,000 $30,000 Paid-in Capital $230,000 $230,000 $230,000 $230,000 $230,000 Retained Earnings ($10,250) $36,750 $85,016 $188,963 $295,811 Earnings $47,000 $48,266 $103,947 $106,849 $106,939
Total Capital $266,750 $315,016 $418,963 $525,811 $632,750
Total Liabilities and Capital $416,750 $435,016 $508,963 $585,811 $662,750
Net Worth $266,750 $315,016 $418,963 $525,811 $632,750

Page 108 of 157
CHAPTER 7. CONCLUSIONS AND RECOMMENDATIONS
Objectives
The study objectives are to assess the current processing, marketing and distribution mechanisms for rice and propose technically and economically feasible recommendations.
Donor Policies
An analysis of donors and development partners’ interventions under PRSPs I and II reveal that their assistance policies have been supportive of the agricultural sector in the areas of infrastructure development and access to finance and markets.
Value Chain Mapping
The marketing of a commodity, in this case rice starts with production and sale by farmers. In Sierra Leone rice is produced mainly by small producers. Ninety-five percent of the marketed surplus of rice is estimated to come from small producers.
Export of domestic rice
There are good prospects for increased export of rice which should be exploited: Data presented in Section 4.1 show that Sierra Leone has a comparative advantage not only in producing rice to supply its domestic markets but also for regional trade. As discussed above the country already has substantial exports to neighbouring countries. There are good prospects for further expansion of exports to regional markets
Regional demand for rice is high and growing rapidly, and Sierra Leone’s location is ideal for supplying regional rice markets. The country’s policy should therefore be to exploit its comparative advantage by:
d) Formalizing the export trade in local rice through trade negotiations with the importing countries
e) Investing in domestic value addition to maximize export revenues from the commodity f) Establishing an export processing zone in an appropriate location, with appropriate
infrastructure, services and amenities to function at international standards for such facilities.
Formalizing informal rice export activities would provide more reliable revenue streams for the state and enhanced security for traders through improved knowledge and enforcement of rights and responsibilities of all stakeholders at the border. In order to bring informal trading activities into formality and expand the tax base, a number of steps need to be taken to simplify business registration, harmonize and simplify import and export procedures, eliminate harassment, extortion and other corrupt practices at the borders, and provide targeted support to small firms that register formally. 33
Imported rice trade
The marketing system for imported rice is much simpler than that for domestic rice. Until the intervention of the MTI in October 2013, all importation of rice was undertaken by the private sector. The key government agencies and parastatals involved in the rice trade during the 1970s and
33
World Bank (2013) Sierra Leone Diagnostic Trade Integration Study (DTIS) Update June 2013, Report Number: 78309-SL

Page 109 of 157
1980s included the Rice Department, the Rice Corporation and the Sierra Leone Produce Marketing Board (SLPMB), but by the late 1980s the private sector had assumed the dominant role in the marketing of both local and imported rice.
The quantity and value of rice imports have increased substantially in the last five years indicating that claimed increases in domestic rice production have had minimal effect on imports.
The six (6) largest importers of rice in Sierra Leone accounted for over 80% of all rice imports in the last two years. The situation has therefore not changed much in the last 30 years in terms of the number of importers dominating the trade, although their relative importance change from time to time.
A notable feature in 2013 is the direct intervention of the Government in the rice importing business in October, with the Ministry of Trade and Industry accounting for 22% of all imports in that year. That was an attempt to bring down the price of the commodity which had risen sharply in the preceding three months. Figure 9: shows that the policy met with some success as the average CIF value of rice imports in October 2013 was the lowest in recent years.
The importers do not keep records of the destination of their sales and could only provide estimates based on their knowledge where wholesalers normally carry on their business. From their estimates, approximately 40% of importers sales are made to Western Area rice traders. Provincial traders account for approximately 60% the trade in imported rice, led by the Bombali District traders who take approximately 20% of imported rice. Kenema Districts accounts for approximately 15% followed by Bo and Kono Districts which consume approximately 10% each (NB Districts with the major urban centres in Sierra Leone. The other districts account for relatively very little (5%) consumption of imported rice.
Need to improve production and marketing statistics
With the importance of agriculture to the economy, it is essential to have accurate statistics on the sector for accuracy of management of the economy, particularly of the staple food crop rice. However, as indicated by Spencer (2012), data on trends in food crop production are very confusing and questionable.
Also, regional trade in agricultural products is generally under-represented in official statistics, especially as it takes places through informal channels and with partners that may not keep proper records of this trade. An integrated mechanism is therefore needed to monitor and record informal trade flows to get a better handle on the full scope and scale of trade volumes. The informal cross-border data collection system that Uganda established in 2007 could provide a framework for a similar mechanism to monitor and record informal trade statistics for Sierra Leone.34 Establishing and implementing such a mechanism would require close collaboration between key entities such as SSL, NRA, MTI, and the BSL, among others.
Marketable Surplus
Marketed surplus has generally been defined as that proportion of production that actually enters the market (Newman, 1977). Some authors include barter sales in this category (Sharma and Gupter, 1970; Chinn 1976).
Because of the uncertainly regarding the true level of production of rice in the country, the rest of the analysis in this study will be based on two levels of production in 2009 which is used as the baseline year – a high variant based on FAO/MAFFS production data, and a low variant based on AHTS data.
With the combination of high and low variants for rice production and marketed surplus, four different estimated quantities of domestic rice marketed are obtained representing:
34
World Bank (2013) Sierra Leone Diagnostic Trade Integration Study (DTIS) Update June 2013, Report Number: 78309-SL

Page 110 of 157
5. FAO/MAFFS production data (allocated by District using the AHTS distributions) + EDS Market surplus ratios (187,118.3mt paddy in 2009, projected to 473,051.8 by 2025)
6. FAO/MAFFS production data (allocated by District using the AHTS distributions) + ATS Market surplus ratios (106,345.4mt in 2009, projected to 268,850.6mt by 2025)
7. ATHS production data by Districts + EDS Market surplus ratios (76,280.2 in 2009 projected to 191,503.1mt by 2025)
8. ATHS production data by Districts + AHTS Market surplus ratios (43,352.5mt in 2009 projected to 108,837.4mt by 2025)
Installed Milling Capacity
The national inventory of rice mills in Sierra Leone revealed the existence of approximately 401 rice mills installed in all the districts in the country, up from the 53 estimated to be operational after the civil war. Thirty-eight (9.5%) of the mills are not operational, primarily because of breakdowns, or in the case of the large mills, lack of proper business plans for their operation. As to be expected, the there is a concentration of rice mills in the major rice producing Districts, led by Port Loko District with 67 operational mills, Kambia with 59, Tonkolili and Bombali with 29 and 30 operational mills respectively. Kailahun District is not in one of the country’s rice belts but has a significantly large number of mills (34) due to its large farming population.
Twenty-five percent (25%) of the mills are privately owned and operated, all being small capacity mills. The five large integrated rice milling plants, installed in Bo, Kenema, Makeni, Torma Bum and Mambolo are each of 1 ton per hour capacity. Four (4) are of Indian manufacture, installed by MAFFS, each with a Bricketing machine, while the mill in Bo is of Chinese manufacture and was installed by the Chinese Government as a gift to Sierra Leone. None of these mills is in operation.
This study shows that Sierra Leone has sufficient installed milling capacity. Even with the high estimates of production and marketable surplus (the EDS estimates), the mills installed and assessed as “operational” have enough capacity to mill all the marketed rice in Sierra Leone operating only one shift of 8 hours per day, 24 days a month and 9 months a year. The recent investments by the Government and donor partners in increasing the rice milling capacity of the country through the ABCs and RPSDP as well as private sector investments have provided the country with sufficient milling capacity to serve its needs over the next five to ten years. But the distribution across Districts is not optimal, with substantial excess capacity in Kailahun, Koinadugu, Kenema, Kono, Moyamba and Pujehun Districts. The largest deficits are in Tonkolili and Port Loko Districts. The case for investment in additional milling capacity in Sierra Leone is therefore quite weak. However, there is a very strong case for greatly increased, and more efficient use of the installed capacity.
Efficiency of rice milling operations
It is evident from the data gathered in this study that private sector mills have less capital investment that the institution mills. This is a result of Government policy of “modernizing” the sector through the Government funded projects.
On the average the mills operated for 7 – 9 months during the year with the privately owned mills operating for longer than the ABC or RPSDP established mills. While institution mills operated at an average of between 1% -2% of their monthly capacity (defined as the amount of paddy that can be milled by the mill operating for 8 hours per day, 24 days a month), capacity use by private sector mills averaged 10% with almost 50% by one of the mills. So the private mills processed over 3,500 bushels (27.3 Kg) paddy ( during the year, compared to an average of 600 – 800 bushels for the institution mills. This higher level of operation is reflected in the bottom line of the businesses.
With custom rates for milling a bushel of paddy being about the same (Le 4,500), Gross returns (income over operating cost) at Le 5.7 million for private mills are four times higher than that achieved by ABC mills, and eight times higher than that earned by RPSDP mills. The situation is even bleaker when a depreciation charge of the value of the investment in the milling equipment is deducted from the Gross returns. While the resulting Gross Profit averages Le 3.4 million for the

Page 111 of 157
private sector mills it is slightly negative for the lower valued ABC mills (-Le 0.7million), and substantially negative for the higher valued RPSDP mills (- Le 3.2 million).
Why are the institution supplied mills performing so poorly, compared to the private sector mills? The answer lies in the lack of entrepreneurial drive of the managers and beneficiaries of the institution mills, and the poor location of most of the mills relative to the sources of supply of paddy for custom milling. The vast majority of private sector mills are located in the Scarcies area (Kambia & Port Loko Districts) the major surplus rice producing area of the country, while the institution mills are distributed all over the country, obviously for social and political reasons, but with sometime difficult access to sufficient customers for higher capacity use.
Business plans (BPs) for profitable private sector operation of the model mill establishments demonstrate, using state-of-the-art technologies, how rice can be marketed and sold profitably, by ensuring that the most effective and efficient processes are employed. The models are for large, medium and small scale businesses that purchase enough paddy rice in bulk during the buying season that normally lasts from November to March for milling during the rest of the year. Sufficient storage capacity is required to enable the Companies to store enough paddy to keep the mills busy for 280 working days. The rice will be marketed through different channels. To achieve a reasonable level of profitability (around 12% for small mills to 25% annual return on equity capital for small and large mills) the businesses must:
Make significant capital investment in structures and equipment ( $230,000 for small mills to $2million for large mills)35
Have sufficient operating capital to purchase and store paddy over a five month period for milling and sale of the product throughout the year (equity and loans amounting $130,000 for small mills up to $2 million for the large mill)
Recommendation on rice processing
The identified problems can be solved mainly in the following ways:
Modernization of existing Small, Medium and Large Scale Processing Centres in major rice production zones of the country, to equip them with the full complement of milling equipment. This should include provision of improved mechanical parboiling systems.
Provision of appropriate storage facilities- warehouses and Silos. The Sierra Leone Produce Marketing Company should be capacitated to erect and manage public warehouses and silos in the major rice producing districts, in association with the private mills.
Training should be provided in improved modern rice processing technology especially on threshing, parboiling, drying and milling, including in the organization and management of paddy supply systems for:
o Extension officers in all the Districts who will go to the communities to train the farmers
o Small and Medium Scale Processing groups who will directly apply them in their mills
Full privatisation of all institution mills (ABC, RPSPP, etc.). This analysis has clearly shown that institution operated mills are inefficient compared to the privately owned and operated mills. However, there are social issues associated with this recommendation which will have to be addressed in the privatisation process since the mills were provided as public goods by the financing institutions.
35
Where existing business (all of which now operate on custom milling establishment) are to be transformed to the model businesses (which will mill mainly on own account) the required capital investment will be significantly reduced due to the taking over of existing plant and equipment.

Page 112 of 157
Market Infrastructure
About two-thirds of daily and periodic retail markets in Sierra Leone have market buildings. However, almost half of periodic markets have no market stalls of tables with most retailers displaying their goods on the ground.
Water and sanitation facilities in markets are inadequate: About a third of daily markets and over half of periodic markets have no toilet facilities Over half of both daily or periodic markets have no source of drinking water. Only about 10% have taps.
Recommendation: Need to invest to improve facilities in markets
But market buildings are often not used by retailers. Although there are permanent buildings with cement walls and corrugated iron sheets in about 80% of markets in Sierra Leone, about 70% of the rice traders in the markets, and 60% of traders in general, sell outside the structures. Traders give a variety of reasons for not selling in the market structures including the inappropriateness of the structures (too hot etc), poor accessibility to customers, etc. But the most often cited reason is that they will be disadvantaged if they locate in the buildings as customers would be high jerked by other traders who display their wares outside the market on the foot paths into the market. This calls into question continued investment in market infrastructure
A concerted campaign called for to:
Locate and design structures according to requirements of traders (need strong consultations)
Create conditions that remove incentives for traders to sell outside the structure (e.g. grouping traders by commodities, and enforcing no street trading laws)
Market entry
On the average rice traders in Sierra Leone have had some post-primary education. But the vast majority of rice traders do not have any formal business training, with about half having learnt the trade under the apprenticeship usually of a parent or close family member. Market entry appears to be liberal, this study found no evidence of significant entry barriers.
Credit constraints
Lack of capital and credit are the most important factors constraining retail rice market expansion. Half of imported rice retailers reported that lack of capital is the most important constraint to their capacity to expand their business. A further 20% report that lack of access to credit is the most constraining factor. The proportions are lower for local rice (30% and 15%), but they are still the most important factors. Low profit margins due to the competitive nature of the business and poor road infrastructure/lack of transport that cause high transport costs are the second most important constraint cited by retailers. For wholesalers the situation is virtually the same – lack of access to capital and credit being the most important constraints cited. Easier access to credit will oil wheel of rice trading
Traders make sales on credit to a majority of their customers but credit sales represent less than a
third of their sales volumes. Figure 28:Wholesalers make sales on credit to virtually all their customers. For retailers the proportion of buyers that receive credit is lower, ranging between 40 – 65 percent for local and imported rice. However, as shown in Figure 29:, only a small proportion of total sales is made in credit, 10% to 15% at retail level and 20-30% at wholesale level.
Storage Use
Most retailers store produce overnight in their homes. Virtually all rice traders have access to storage facilities and store produce at least overnight. Very few traders (less than 2%) report that they do not have access to storage facilities and must sell all their stock the same day. But the majority of retailers store their commodity overnight in their homes. Next in importance for retailers

Page 113 of 157
(about 15% of traders) is storage in a communal facility in the market owned or rented by their Traders Association.
Although home storage provides security and reduces risks of losses to retailers, it is an inefficient commodity storage strategy. Markets should have sufficient and secure storage facilities which can be rented by Associations for use by their members.
Most wholesalers have access to dedicated store. Most wholesalers store their commodity in individual stores that they own or rent themselves and are located outside, but usually very close to markets,
Rice price setting
Wholesale and retail rice market price setting is not collusive, but there are questions relating to price setting by importers. Virtually all wholesalers of rice and about two thirds of retailers set their selling prices themselves without consultation, based on the price at which they purchase their supplies. About 40% of retailers reported that they consulted amongst themselves in the market and agree on one selling price. The evidence of this survey therefore clearly indicates that the rice price is set mainly by competitive means with little possibility of collusive behaviour among wholesalers and retailers.
However there is some recent evidence that there may be collusive behaviour among rice importers. Six firms account for over 80% of rice imports to Sierra Leone, which as stated by WFP (2010) is indicative of a high degree of market concentration. This situation is not new in Sierra Leone as for example Spencer et. al. (2007) reported that four firms handled all rice imports in 1996 (Spencer et all, 2007, but there was no evidence of collusive behaviour.
A notable feature in 2013 is the direct intervention of the Government in the rice importing business in October, with the Ministry of Trade and Industry accounting for 22% of all imports in that year. That was an attempt to bring down the price of the commodity which had risen sharply in the preceding three months. That intervention met with success as the average CIF value of rice imports in October 2013 was the lowest in recent years. It raises the issue as to how much collusion there is among the major importers in determining the price of imported rice. This analysis has shown that in two months in 2012 and four in 2013 the reported CIF prices for Sierra Leone are 128% to 242% of maximum expected prices. There is need for strict monitoring of rice importers, and application of sanctions if necessary, to ensure that they do not collude to earn monopolistic profits.
Rice price trends The movements of food crop prices in the country give an indication of the degree to which the level of domestic production (supplemented by imports) meet consumer demand. Monthly data on rice prices are collected by Statistics Sierra Leone for computation of the Consumer Price Index. Figure 32: shows that the retail price of local rice in Freetown, i.e. rice produced in Sierra Leone, has constantly been above that for imported rice except for a few months. However, the gap has narrowed significantly in the last two years implying that the supply of domestic rice to the Freetown market has increased faster than increases in demand.
Furthermore, unlike the situation in the past when local rice prices were higher than imported rice prices even in major rice producing areas such as the Scarcies (Kambia) and the Bolilands (Makeni) (Spencer, 1997), domestic rice prices are now lower than that for imported rice in the urban areas of the hinterland of Sierra Leone particularly in Kenema which is furthest away from Freetown the source of all imported rice, indicating that transportation costs of imported rice to provincial towns is now enough to remove the slight competitive advantage that imported rice may still have in Freetown.
Price volatility The coefficient of variation (CV), computed as the ratio of the standard deviation to the mean, is a useful tool to compare the degree of variation of different data series. Being an indicator for the dispersion of prices from their average, it provides useful hints to assess how prices change through the market in space and time for different actors (WFP, 2011b).

Page 114 of 157
Intra-year rice price variability in Sierra Leone is reasonably low, with the CV usually under 0.20. Price variability is higher for local than for imported rice, with Freetown having an equal or higher variability than the provincial cities which are closer to the producing areas.
Price Seasonality
According to the traditional crop calendar of Sierra Leone (Figure 34:), local rice prices are expected to reach a peak at the end of the so called hungry or lean season, just before the onset of the harvest. A high seasonal peak indicates that the domestic market is not very efficient in smoothing out intra-annual price variations by its storage and distribution mechanisms.
The Grand Seasonal Index (GSI) is used to assess seasonal rice price variation. It is the ratio between the rice price at a given month and its centred moving average over the year that incorporates the full cycle of the seasonal patterns.
GSI computed for local and imported rice in Freetown and the provincial headquarter towns, using the ten to thirteen year monthly retail rice price series of Statistics Sierra Leone, show that the traditional seasonal peak in July/August is no longer evident in Sierra Leone, at least not in the urban cities, except for Makeni, and then it is only slightly evident. Rice price movements are now showing a bi-modal pattern with a slight peak in October/November, and an even lower peak, if any, in June. Imported rice prices show a seasonal pattern similar to that of local rice, another factor pointing to the integration of both markets. Access to imported rice during the traditional hungry season has apparently led to a smoothing of the seasonal peak or rice prices in recent times.
Market Integration
Rice markets have a fair degree of integration in the country. Analysing price trends, volatility and seasonality, there are indications that the rice market in Sierra Leone is fairly well integrated. There are also indications that the price of locally produced rice is determined by the price of imported rice in addition of course, to the level of production in the country. In addition to the international price for imported rice domestic transportation cost play a part in determining imported rice prices in the different urban areas of the country.
The results of Granger Causality Test for Freetown and the three Provincial City Markets (Bo, Kenema and Makeni) for which retail rice price series are available, reveal that the Freetown rice market is integrated with the provincial markets for both imported and local rice. For the linkages between the Provincial Markets – while the Bo and Kenema markets for both local and imported rice appear to be linked to those in Makeni, the reverse is not the case. However, while the Bo and Kenema imported rice markets appear not to be linked, the local rice markets appear to be linked.
We can conclude that the rice markets in Sierra Leone are well integrated. Freetown rice market prices for local as well as imported rice are linked to those in the provincial markets, Provincial rice markets for local rice are also integrated, although less so for imported compared to local rice.
Marketing Margins
Marketing costs are incurred each time a commodity (in this case rice) is exchanged through a distribution system. It is critical to the efficiency of the system that these marketing costs be as low as possible in order to bridge the gap between consumer and farmer prices. One way to achieve that is to promote a competitive environment whereby marketing agents do not have the opportunity to exploit either ends of the marketing chain, namely farmers or consumers.
Price incentives affect the revenues and the procurement decisions of marketing agents; together with marketing and other costs, they affect profits. The analysis of operating costs and profits of traders allows one to understand the relative efficiency of various marketing agents and indicates the constraints that need to be removed in order to improve the marketing system.
Generally margins are higher for retailers of imported rice compared to retailers of local rice - around 24% for imported rice and 15% for local rice. However, wholesalers of local rice earn a higher margin (20-30%) than wholesalers of imported rice (about 8%). The GMM obtained in this study are
Page 115 of 157
not considered as excessive, and indicate that the rice trade in Sierra Leone, which is completely in the hands of the private sector, is competitive at both the wholesale and retail levels.
Need for improved physical access to markets
Availability and access to markets are strong incentives for investment in and production of agricultural commodities. National food security will be difficult to achieve without the development of the necessary organised and accessible market for rice. Meaningful efforts to develop the domestic rice industry must therefore address issues of access, input and innovations in the domestic rice market.
Poor access is the greatest setback domestic rice producers, both large and small, face in commercializing their businesses. All-weather feeder roads to Chiefdom market centres are often not available to enable farmers and farmers groups access these markets with ease and negotiate spot prices. Both large and small producers in major rice producing regions face the same challenge in marketing rice after harvests due to the poor state of the trunk roads linking these regions to regional markets. For example, the road from Mange on the Freetown/Kambia highway to the Scarcies mangrove swamp rice belt around Mambolo is not paved and in the rainy season is traversed with great difficulty for passengers and goods. This scenario is also true for the roads from the Port Loko into the Loko Massama rice bowls of Gbinti wala, Kalangba etc. In all weather conditions, the roads to the Bonthe and Pujehun rice belts around Torma Bum and Gbondapi respectively are barely passable and are far from being the commercial rice routes they are supposed to be. Upgrade of the following trunk roads will enhance the domestic rice trade:
Mange to Mambolo
Port Loko to Kalangba and to Rhombe
Bo to Torma Bum
Bo to Gbondapi
Magburaka to Mile 91
Marketing Innovations
The SLPMC and Sierra Leone Standards Bureau should establish and regulate systems for standardizing, branding and certifying locally produced rice that are consistent with international norms. It is well known that locally produced rice is exported to neighbouring countries under an informal trading regime. The MTI through the agency of the SLPMC should regularize this trade with a view to expanding the market for locally produced rice and by so doing, stimulating increased local production. An incentive scheme should be established to encourage collaboration from rice mills and traders. For example State procurement rules would preclude doing business with traders and mills that are not in compliance with the new marketing regulations.

Page 116 of 157
ANNEXES
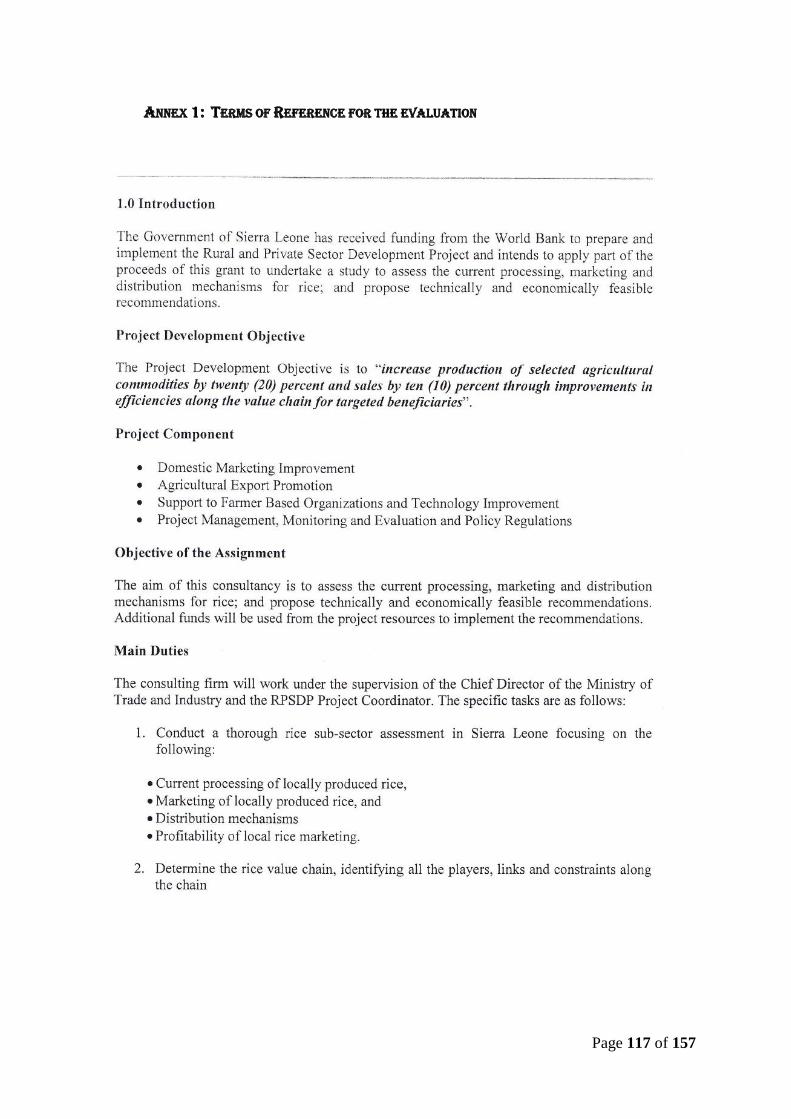
Page 117 of 157
ANNEX 1: TERMS OF REFERENCE FOR THE EVALUATION

Page 118 of 157

Page 119 of 157

Page 120 of 157
ANNEX 2: TIME TABLE
WORK PLAN
During the Inception Meeting EDS highlighted the significant dates on the work plan corresponding
to timelines for deliverables. These are shown in the table below:
Contract Week Dates Deliverable
3 1t -7 July Inception report
4 1t July Delivery of 2 vehicles to EDS
8 5 – 10 August Midterm report 1
12 2 – 7 September Midterm report 2
16 30 September – 5 October Draft Final report
18 14 – 19 October Final Report
The plan for up country visits for data collection (Markets, Traders, Processing Surveys, etc.) is shown below:
Tentative Dates
Markets/Traders/Processing Surveys
Technical Evaluation of mills
(Diesel Vehicle)
District Team 1 (Diesel Vehicle)
Team 2 (Petrol Vehicle)
Western Urban July 1-13 July 1-13
Western Rural July 15 -20
August 12 – 31
Kambia July 15 -20
Port Loko July 22 - 27
Bombali July 29 – Aug 3
Koinadugu August 5 - 10
Tonkolili Sept 2 - 7
Moyamba July 22 - 27
Bo July 29 – Aug 3
Pujehun August 5 - 10
Bonthe August 12 - 17
Kenema August 19 - 24
Kono August 26 - 31
Kailahun Sept 2 - 7

Page 121 of 157
Work Schedule and planning for deliverables
Deliverables Weeks
1 2 3 4 5 6 7 8 9 10 11 12 13 14 15 16 TOTAL
17-Jun
1-Jul
5-Aug
2-Sep
30-Sep
14-Oct
D1: Desk review Inception meeting 1
Initial consultations 2
Secondary data collection 2
Inception report 1
D2: Govt & Donor policies 3
D3: Efficiency of Output markets
Value chain mapping 2
Rice markets study 6
Rice Traders study 6
Assessment of market efficiencies 5
D4: Marketed surplus 3
. Mid term report 1
D5: Rice processing National inventory 3
Assessment of technical status
4
Assessment of econ performance 4
Design of model establishments 2
Mid term report 2

Page 122 of 157
D6: Business plans 6
D7: Recommendations and Report 2
Draft Final Report (Validation work shop) 1
Revised Final Report

Page 123 of 157
ANNEX 3: LIST OF DOCUMENTS AND REFERENCES
Abdul Latif Jameel Poverty Action Lab (J-PAL/ Innovation for Poverty Action (IPA), Ministry of Agriculture forestry and food security (MAFFS) (2011) Agricultural Tracking Survey, Draft Report
Bank of Sierra Leone (2011a), Monthly Economic Review, Vol 13, Issue 5, May 2011
Bank of Sierra Leone (2011b), Exchange Rate Statistics, 23/06/2011
Central Statistics Office (CSO) (1967) Agricultural Survey of Sierra Leone 1965/66, Freetown
Central Statistics Office (CSO) (1972) Agricultural Survey of Sierra Leone 1970/71, Freetown
Central Statistics Office (CSO) (1990), Report of the Labor Force Survey 1988-89
Dorward, A. (2009), Rethinking Agricultural Input Subsidy Programs in a Changing World. Paper prepared for the Trade and Markets Division of FAO. Center for Development, Environment and Policy, School of Oriental and African Studies, University of London, UK
Elbehri, A., and A. Sarris (2009) Farm Support Policies that Minimize Global Distortionary Effect. Paper presented to the FAO Expert Meeting on “How to feed the World in 2050”, FAO, Rome, Italy, June 24-26, 2009
Enterprise Development Services Ltd (EDS) (2009); Economics of rice production in Sierra Leone; www.edssl.com/docs/EDS%2020Economics%20of%20Rice%20Prodn%20in%20Sierra%20Leone%20-%20June%202009.pdf
Gert van der Meijden (1998) Motorized Soil Tillage In West-Africa: A survey on the current use and consequences of tillage done with engine-driven machinery; Food and Agriculture Organization of the United Nations, FAO Regional Office for Africa, Accra, Ghana
Granger, C. W. J. (1969). "Investigating Causal Relations by Econometric Models and Cross-spectral methods". Econometrica 37 (3): 424–438. doi:10.2307/1912791. JSTOR 1912791
Hossain, M. S. (2009). Food Security Situation in Bangladesh with Focus on the Impact of High Food Prices. The Guardian. A national Monthly, published by editor from 794/KA, South Shajahanpur, Dhaka-1217, Bangladesh
International Food Policy Research Institute (IFPRI), Concern Worldwide and Welthungerhilfe (2011) 2011 Global Hunger Index
International Food Policy Research Institute, 1996; Rice market monitoring and policy study, Final Report, Prepared for the Asian Development Bank, Washington DC, December 1996)
Ministry of Agriculture, Natural Resources and Forestry (MANRF) (1986); Planning, Evaluation, Monitoring and Services Division (PEMSD); 1984/85 Sample Census of Agriculture in Sierra Leone; Reconciled Area and Production of Rice for the 1984/85 Farming Season
Ministry of Agriculture, Natural Resources and Forestry (MANRF) (1987); Planning, Evaluation, Monitoring and Services Division (PEMSD); Report on Area, Yield and Production of Groundnuts, Rice and Maize for the 1986/87 Crop Production Season in Sierra Leone
Ministry of Agriculture, Forestry and Food Security (MAFFS) (2004) Agricultural Sector Review and Agricultural Development Strategy, Volume I, with Ministry of Fisheries and Marine Resources, Assisted by Food and Agricultural Organization of the United Nations (TCP/SIL/2904), In association with: World Bank, International Fund for Agricultural Development and United Nations Development Program
Ministry of Agriculture Forestry and Food Security (MAFFS), 2009; National Rice Development Strategy (NRDS), Sierra Leone, Prepared for the Coalition for African Rice Development (CARD)
Page 124 of 157
Ministry of Agriculture, Forestry and Food Security (MAFFS), (2011), Agricultural Statistical Bulletin, Volume 2.
Ministry of Agriculture, Forestry and Food Security (MAFFS), Planning, Evaluation, Monitoring and Statistics Division (PEMSD) and Sierra Leone Agricultural Research Institute (SLARI) (2010); Project: Strengthening the Availability and Access to rice statistics for Sub-Saharan Africa: a contribution to the Emergency Rice Initiative, Country report, Freetown, Sierra Leone. May, 2010
Morris, M., V. A. Kelly, R. Kopicki and D. Byerlee (2007). Fertilizer use in African agriculture. Washington D.C., World Bank.
Njoku, Athanasius Onwusaka (1971) Labor utilization in traditional agriculture: the case of Sierra Leone rice farms. 194pp. Ph.D. Thesis, University of Champaign, Champaign-Urbana, USA.
Raisuddin Ahmed, Francesco Goletti, Nicholas Minot, Philippe Berry, Romeo Bautista, Nguyen Viet Hai, and Nguyen The Binh (1996), Rice Market Monitoring and Policy Options Study, Final Report Prepared for the Asian Development Bank By The International Food Policy Research Institute, 1200 17th St. N.W., Washington, D.C. U.S.A.
Roberts, A. Tom, and Samuel Fonnie (2010) Rice: A Value Chain Map and Solutions
Sherrif, M. S. (2010) Cooperative Farmers Begin First Grade Cocoa Export From Sierra Leone: Early Gains And Challenges, Power Point presentation, World Bank, Freetown.
Sierra Leone Investment and Export Promotion Agency (SLIEPA) (2010) Leasing Agricultural Land in Sierra Leone: Information for Investors. www.eds-sl.com/docs/SL_agrilandleasing _09March(2).pdf
Spencer, D. S. C. (1972). "Micro-level Farm Management and Production Economics Research among Traditional African Farmers: Lessons from Sierra Leone". African Rural Employment Paper No. 3, Michigan State University, pp. 29.
Spencer, D. S. C. and Byerlee, D., (1977). “Small Farms in West Africa: A Descriptive Analysis of Employment, Incomes and Productivity in Sierra Leone.” African Rural Economy Working Paper No. 19. Njala University College, Sierra Leone, and Michigan State University, USA.
Spencer, D.S.C., Byerlee, D. and Franzel, S. (1979). "Annual Costs and Returns and Seasonal Labor Requirements for selected Farm and Non-farm Enterprises in Sierra Leone" African Rural Economy Working Paper No. 27, Njala University College, Sierra Leone and Michigan State University, USA.
Spencer, D. S. C. (1981). Rice Production in Sierra Leone; Chapter 6 in Rice in West Africa, S. R. Pearson, J. D. Stryker and C. P. Humphreys (eds.), Stanford University Press, California.
Spencer, D. S. C. (1997); Rice Trade and Price Policy Study. The Government of Sierra Leone, Ministry of Agriculture and Natural Resources and The World Bank (Agriculture Sector Support Project); Dunstan Spencer and Associates, Sierra Agricultural Services, and Ajua Consultants Ltd., Freetown, Sierra Leone. www.eds-sl.com/docs/SierraLeone-RicePolicyStudyFinal-Jan1997.pdf
Spencer, D. S. C., (2009) Farmer Perceptions, Child Labour, and Economics of Tree Crops Production and Marketing in Kailahun, Kenema and Kono Districts of Sierra Leone. www.eds-sl.com/docs/EDSFarmerPerceptions_ChildLabour_EconsofTreeCrops-Mar2011.pdf
Spencer, D. S. C., Deen, S. S., and Wilson, C. E., (2009) Economics of Rice Production in Sierra Leone, Report of a Survey in Three Northern Districts. Enterprises Development Services, Ltd.; Funded by the Soros Economic Development Fund (SEDF), New York, U.S.A. www.eds-sl.com/docs/EDS%20-%20Economics%20of%20Rice%20Prodn%20in%20Sierra%20Leone%20-%20June%202009.pdf

Page 125 of 157
Spencer, D. S. C. (2010) Farmers Assessment of Rice Varieties in Northern Sierra Leone; Report of a survey for CARE, December 15, 2010. www.eds-sl.com/docs/FarmersAssessmentofRiceVarietiesinNorthernSierraLeone.pdf
Spencer, D. S. C., Wilson, C. E., Kpolie, E. (2011), Baseline Study For The Sustainable Nutrition And Agricultural Promotion (SNAP) Program In Sierra Leone, Enterprise Development services, Ltd, Freetown, Sierra Leone
Spencer, Dunstan (2012); Issues in food security and cash crop production, Annex 2, p41-45. http://www.eds-sl.com/docs/IssuesInFoodSecurityInSierraLeone.pdf
Spencer, Dunstan, Sanusi Deen and Chrispin Wilson: Soros Economic Development Fund (SEDF), Sierra Leone Rice Enterprise Development Project, Project Report, Enterprise Development Services Ltd (EDS), June 25, 2009; www.edssl.com/docs/EDS%2020Economics%20of%20Rice%20Prodn%20in%20Sierra%20Leone%20-%20June%202009.pdf
Statistics Sierra Leone (SSL) (???), Consumption Aggregates and Poverty Estimates, Sierra Leone Integrated Household Survey (SLIHS) 2003/04
Statistics Sierra Leone(SSL) (2010), 2009 Annual Economic Review, Vol 2
Stolpher, Wolfgang F. (1966) Planning Without Facts: Lessons in Resource Allocation from Nigeria’s Development, Cambridge, Harvard University Press, MA, USA
Wessa P., (2013), Bivariate Granger Causality (v1.0.3) in Free Statistics Software (v1.1.23-r7), Office for Research Development and Education, URL http://www.wessa.net/rwasp_grangercausality.wasp/
Whittaker, Victor Augustus (1971) The economics of mechanical cultivation of rice lands in Sierra Leone. 135pp. Ph.D. Thesis, University of Illinois, Champaign-Urbana, USA.
World Bank (2006); Sierra Leone: Adding Value to Nature’s Bounty through Trade. A Diagnostic Trade Integration Study
World Bank (2013) Sierra Leone Diagnostic Trade Integration Study (DTIS) Update June 2013, Report Number: 78309-SL
World Food Program (WFP), Vulnerability Analysis and Mapping Branch (ODAV) (2010) Sierra Leone: Household Food Security Survey in Rural Areas, November, 2008
World Food Programme (WFP) (2011) Comprehensive Food Security and Vulnerability Analysis (CFSVA): The State of Food Security and Nutrition in Sierra Leone (Data collected in June-July, 2010) in partnership with the Ministry of Agriculture, Forestry and Food Security (MAFFS), Statistics Sierra Leone (SSL), Ministry of Health and Sanitation (MoHS), the Food and Agriculture Organization (FAO), the United Nations Children’s Funds (UNICEF), the United Nations Population Fund (UNFPA) and the NGO Innovations for Poverty Action – Sierra Leone (IPA-SL).
Newman, (1977)
Sharma and Gupter, 1970
Chinn (1976).

Page 126 of 157
ANNEX 4: SURVEY INSTRUMENTS
RICE MARKETING STUDY
MARKET QUESTIONNAIRE
SECTION 1: IDENTIFICATION
Date:___________________ Questionnaire No: |__|__|__|
Name and Signature of Interviewer: ____________________________________________________
VARIABLES RESPONSE OPTIONS CODE
Province 1 = Western Area; 2 = South; 3 = East; 4 = North |__|
District
1 = Western Urban; 2 = Western Rural; 3 = Bombali; 4 = Tonkolili; 5= Port Loko; 6 = Kambia; 7 = Bo; 8 = Bonthe 9 = Moyamba; 10 = Bonthe; 11 – Pujehun; 12 = Kono; 13 = Kenema; 14 = Kailahun
|__|__|
Chiefdom Name of Chiefdom: ____________________________ |__|__|
Village/Community
Name of Town/ Village/ Community:______________________________
Distance to C/dom Hdqts (Miles) |__|__|__| • |__|__|
Market Name of Market_____________________________________________
GPS of Market: _________________________N; ____________________________W
Consent Information
(Market Leader)
My name is -------, I am part of a team engaged by the Rural and Private Sector Development Project in the Ministry of Trade and Industry that is conducting a study of rice marketing in the country. The aim is to help the Government and donors to determine ways in helping to improve rice processing and marketing in our country. I would like to ask you some questions which will take less than 15 minutes of your time.
Your name will not be disclosed and any information you provide will be confidential and will not be disclosed to other people. Your participation is voluntary and you can choose not to answer any or all of the questions if you wish; however we hope you will participate since your views are important.
Do you have any questions?
May I begin the interview? Yes ____________ No ________________
Count of Rice Traders in Market:
Tally Total
Imported Rice
Local Rice
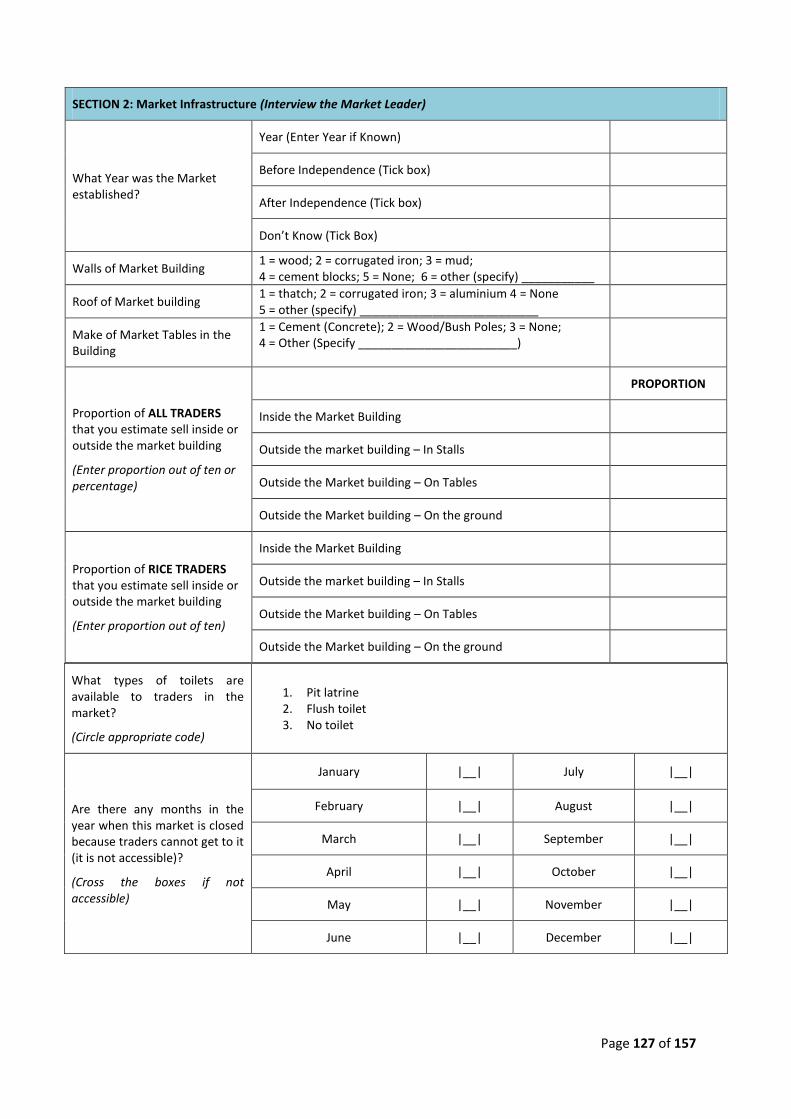
Page 127 of 157
What types of toilets are available to traders in the market?
(Circle appropriate code)
1. Pit latrine 2. Flush toilet 3. No toilet
Are there any months in the year when this market is closed because traders cannot get to it (it is not accessible)?
(Cross the boxes if not accessible)
January |__| July |__|
February |__| August |__|
March |__| September |__|
April |__| October |__|
May |__| November |__|
June |__| December |__|
SECTION 2: Market Infrastructure (Interview the Market Leader)
What Year was the Market established?
Year (Enter Year if Known)
Before Independence (Tick box)
After Independence (Tick box)
Don’t Know (Tick Box)
Walls of Market Building 1 = wood; 2 = corrugated iron; 3 = mud; 4 = cement blocks; 5 = None; 6 = other (specify) ___________
Roof of Market building 1 = thatch; 2 = corrugated iron; 3 = aluminium 4 = None 5 = other (specify) ___________________________
Make of Market Tables in the Building
1 = Cement (Concrete); 2 = Wood/Bush Poles; 3 = None; 4 = Other (Specify ________________________)
Proportion of ALL TRADERS that you estimate sell inside or outside the market building
(Enter proportion out of ten or percentage)
PROPORTION
Inside the Market Building
Outside the market building – In Stalls
Outside the Market building – On Tables
Outside the Market building – On the ground
Proportion of RICE TRADERS that you estimate sell inside or outside the market building
(Enter proportion out of ten)
Inside the Market Building
Outside the market building – In Stalls
Outside the Market building – On Tables
Outside the Market building – On the ground

Page 128 of 157
What is the main reason for lack of physical access to the market, if any?
(Circle the appropriate number)
1. Market is not operational during the months 2. Insecurity 3. Long distance 4. Lack of roads/bad road conditions 5. Weather conditions (floods) 6. Other (Specify _______________________) 88. Not applicable 99. No answer
How often does the market meet, when it is open (Periodicity)
(Circle the appropriate code)
1. Daily 2. On following days every week:
a. Sunday b. Monday c. Tuesday d. Wednesday e. Thursday f. Friday g. Saturday
3. Other frequency (Specify _____________________________________)
Where do traders get water from?
(Circle the appropriate code)
1. Stream/river 2. Well 3. Tap 4. No source (must bring own supply) 5. Other (Specify ________________)
99. No Answer

Page 129 of 157
SECTION 1: IDENTIFICATION
Date:___________________ Questionnaire No: |__|__|__|
Name and Signature of Interviewer: ____________________________________________________
VARIABLES RESPONSE OPTIONS CODE
Province 1 = Western Area; 2 = South; 3 = East; 4 = North |__|
District
1 = Western Urban; 2 = Western Rural; 3 = Bombali; 4 = Tonkolili; 5= Port Loko; 6 = Kambia; 7 = Bo; 8 = Bonthe 9 = Moyamba; 10 = Bonthe; 11 – Pujehun; 12 = Kono; 13 = Kenema; 14 = Kailahun
|__|__|
Chiefdom Name of Chiefdom: ____________________________ |__|__|
Village/Community Name of Town/ Village/ Community:______________________
Market Name of Market_____________________________________________
Consent Information
(Rice Trader)
My name is -------, I am part of a team engaged by the Rural and Private Sector Development Project in the Ministry of Trade and Industry that is conducting a study of rice marketing in the country. The aim is the help the Government and donors to determine ways in helping to improve rice processing and marketing in our country. I would like to ask you some questions which will take less than 15 minutes of your time.
Your name will not be disclosed and any information you provide will be confidential and will not be disclosed to other people. Your participation is voluntary and you can choose not to answer any or all of the questions if you wish; however we hope you will participate since your views are important.
Do you have any questions?
May I begin the interview? Yes ____________ No ________________
Infrastructure - Where does the trader sell? (Circle the number)
Inside Market Building
1 On Cement table
2 On wood/stick table
3 On floor/ground
Outside Market Building
4 On Cement table
5 On wood/stick table
6 On floor/ground
7 In/front of Shop
RICE MARKETING STUDY
TRADER QUESTIONNAIRE
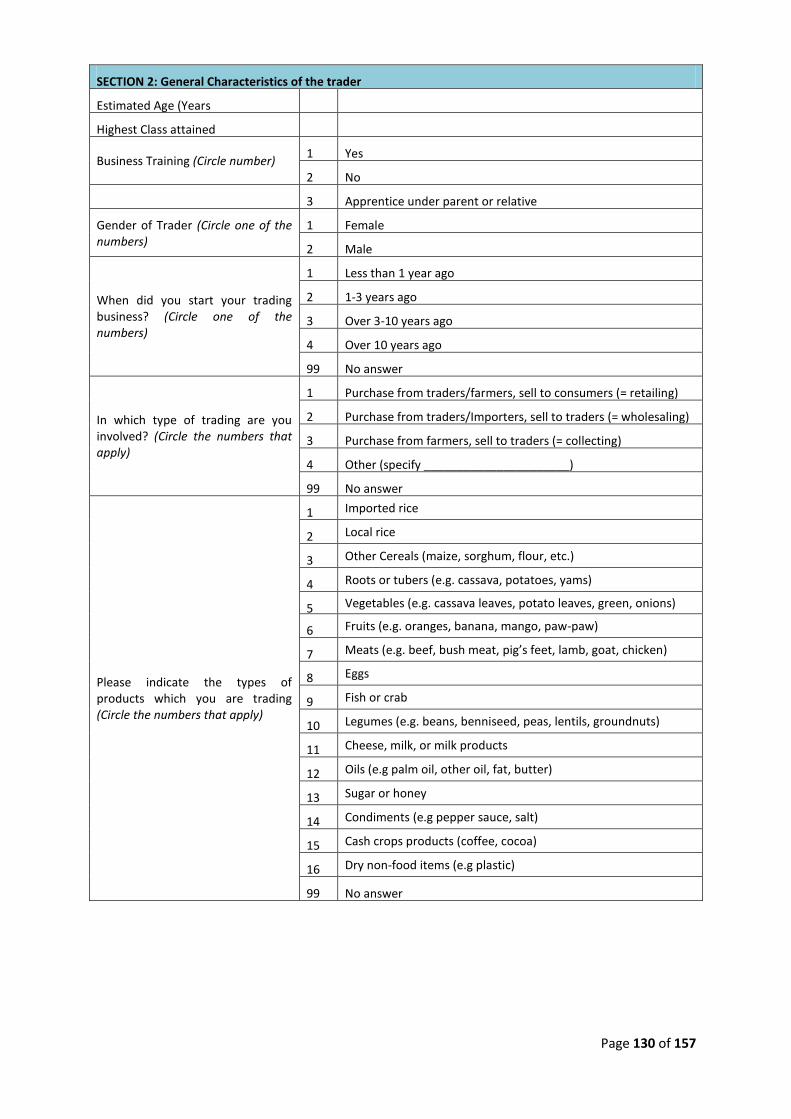
Page 130 of 157
SECTION 2: General Characteristics of the trader
Estimated Age (Years
Highest Class attained
Business Training (Circle number) 1 Yes
2 No
3 Apprentice under parent or relative
Gender of Trader (Circle one of the numbers)
1 Female
2 Male
When did you start your trading business? (Circle one of the numbers)
1 Less than 1 year ago
2 1-3 years ago
3 Over 3-10 years ago
4 Over 10 years ago
99 No answer
In which type of trading are you involved? (Circle the numbers that apply)
1 Purchase from traders/farmers, sell to consumers (= retailing)
2 Purchase from traders/Importers, sell to traders (= wholesaling)
3 Purchase from farmers, sell to traders (= collecting)
4 Other (specify ______________________)
99 No answer
Please indicate the types of products which you are trading (Circle the numbers that apply)
1 Imported rice
2 Local rice
3 Other Cereals (maize, sorghum, flour, etc.)
4 Roots or tubers (e.g. cassava, potatoes, yams)
5 Vegetables (e.g. cassava leaves, potato leaves, green, onions)
6 Fruits (e.g. oranges, banana, mango, paw-paw)
7 Meats (e.g. beef, bush meat, pig’s feet, lamb, goat, chicken)
8 Eggs
9 Fish or crab
10 Legumes (e.g. beans, benniseed, peas, lentils, groundnuts)
11 Cheese, milk, or milk products
12 Oils (e.g palm oil, other oil, fat, butter)
13 Sugar or honey
14 Condiments (e.g pepper sauce, salt)
15 Cash crops products (coffee, cocoa)
16 Dry non-food items (e.g plastic)
99 No answer

Page 131 of 157
Please indicate the three most important – in terms of quantities – commodities traded normally by you
1. for most important 2. for second most important 3. for third most important
1 Imported rice |__|
2 Local rice |__|
3 Other cereals (e.g. maize, sorghum, flour) |__|
4 Roots or tubers (e.g. cassava, potatoes, yams) |__|
5 Vegetables (e.g. cassava leaves, potato leaves, green, onions)
|__|
6 Fruits (e.g. oranges, banana, mango, paw-paw) |__|
7 Meats (e.g. beef, bush meat, pig’s feet, sheep, goat, chicken)
|__|
8 Eggs |__|
9 Fish or crab |__|
10 Legumes (e.g. beans, benniseed, groundnuts) |__|
11 Cheese, milk, or milk products |__|
12 Oils (e.g palm oil, other oil, fat, butter) |__|
13 Sugar or honey |__|
14 Condiments (e.g pepper sauce, salt) |__|
15 Cash crops products (coffee, cocoa) |__|
16 Dry non-food items (e.g. plastic) |__|
99 No answer |__|

Page 132 of 157
SECTION 3: Volume and flows of RICE
Imported Rice
Local Rice
Please provide an estimate of the number of customers to whom you sold RICE during the past DAY (Circle one of the numbers)
1 1 Less than 10
2 2 11 - 70
3 3 70 - 140
4 4 More than 140
99 99 No answer
Please state whether the number above is higher, lower or the same compared to a DAY DURING THIS SAME MONTH last year
(Circle one of the numbers)
1 1 Higher
2 2 Lower
3 3 Same
99 99 No answer
If the number is higher OR lower, please provide the MOST IMPORTANT reason
(Circle one of the numbers)
88 88 Not applicable (if no change OR no answer above)
1 1 Better harvest than last year
2 2 Worse harvest than last year
3 3 More effective demand/customers from other districts/ abroad
4 4 Less effective demand/customers from other districts/ abroad
5 5 More supply coming from other districts/abroad
6 6 Less supply coming from other districts/abroad
7 9 Higher price of rice
8 8 Lower price of rice
9 9 More capital available for trade
10 10 Less capital available for trade
11 11 Increased risk
12 12 Lower risk
13 13 Better location
14 14 Worse location
15 15 Other (Specify _____________________________________)
99 99 No Answer

Page 133 of 157
Imported Local
What is your most important source of rice (Where does the trader buy the rice traded?
(Enter appropriate District Code – see page 1)
|__|__| |__|__| Farmer within the district
|__|__| |__|__| Farmers outside the district
|__|__| |__|__| Importer in Freetown
|__|__| |__|__| Traders within the District
|__|__| |__|__| Traders outside the district But in Sierra Leone
|__|__| |__|__| Traders outside Sierra Leone
|__|__| |__|__| Other (Specify )
99 99 No answer
SECTION 4: Constraints
Imported Rice
Local Rice
What are the three most important constraints preventing you from doubling the amount of RICE you sell
(Circle three of the numbers)
1 1 Lack of own capital
2 2 Lack of credit/Credit is too expensive
3 3 Low quantity of produce (supply)
4 4 Lack of means of transport
5 5 Poor roads/ transport cost too high
6 6 Too muck insecurity/risks
7 7 Lack of storage space
8 8 Lack of Selling space in the market
9 9 Low profit margins (low sales price, high purchase price)
10 10 Lack of demand/customers
11 11 Competitors will not allow me to grow so much
12 12 Government will not allow me/ market dues & taxes too high
13 13 Lack of processing facilities
14 14 None
15 15 Other (Specify
99 99 No answer

Page 134 of 157
SECTION 5: Credit and Stocks strategy
Imported Rice
Local Rice
Do you provide credit to some of your customers? (Circle one of the numbers)
1 1 Yes
2 2 No
99 99 No answer
If yes above, what share of your total sales is currently is on credit?
|__| |__| % credit sales
3 3 Not applicable
99 99 No answer
Do you provide more credit to your customers compared to last year?
2 2 Yes
2 2 No
Where do you store your produce overnight? (Enter Code)
1. Store IN the market owned/rented by Association
2. Store IN the market owned/rented by Another Trader
3. Store IN the market owned/rented by myself
4. Store OUTSIDE the market owned/rented by Association
5. Store OUTSIDE the market owned/rented by another Trader/Businessman
6. Store OUTSIDE the market owned/rented by myself
7. Store in my house/home 8. Have no access to a store,
so I must sell all the commodity

Page 135 of 157
SECTION 6: Prices and transaction costs
Introduce the concept of a completed transaction: from the moment the trader purchases the commodity until he/she sells it; and discuss a complete example of such a completed transaction)
Imported Rice Local Rice
Rice Brand Parboiled (Long)
Broken (Fen Fen)
Parboiled (Wala)
Raw milled (Rough rice)
Unit Name Unit Code
What is the average size of your transaction by Rice Brand?
How many DAYS do you usually keep your commodity between purchases and sales?
Days
Days
Days
Days
Days
What was the purchase price of the rice (for each Brand of rice in the transaction)
What was the sales price of the rice
Could you please provide the various transaction costs for the above completed transaction (Leones) per transaction)
Variable Cost (Cost specific to the Brand)
Imported rice Local rice
a. Loading
b. Transport
c. Off-loading
d. Fumigation
e. Cleaning/Drying
f. Bagging
g. Storage
h. Processing
i. Losses
j. Financial expenses
k. Taxes/Market Dues

Page 136 of 157
Fixed Cost (joint cost items that apply to all rice brands and/or other commodities traded)
Fixed Costs (joint cost that apply to all rice brands and/or other commodities traded)
a. Loading
b. Transport
c. Off-loading
d. Fumigation
e. Cleaning/Drying
f. Bagging
g. Storage
h. Processing
i. Losses
j. Financial expenses
k. Taxes/Market Dues
How are the prices at which you sell your rice fixed? (Circle the appropriate number)
1 I fix my selling price without consultation based on the price at which I buy
2 We consult in the market and agree on one price to sell
3 Traders from whom we buy decide what price we should sell
4 Our Association fixes the price
5 Other (specify)_______________________________________
Sample Weight: (weigh sample of retail measure used by one or two traders in each market)
Name of Unit of measure Quantify (e.g. 3 cups) Weight (Kg)
Local Rice
Imported rice

Page 137 of 157
SECTION 1: IDENTIFICATION
Date:___________________ Questionnaire No: |__|__|__|
Name and Signature of Interviewer: ___________________________________________
VARIABLES RESPONSE OPTIONS CODE
Province 1 = Western Area; 2 = South; 3 = East; 4 = North |__|
District
1 = Western Urban; 2 = Western Rural; 3 = Bombali; 4 = Tonkolili; 5= Port Loko; 6 = Kambia; 7 = Bo; 8 = Bonthe 9 = Moyamba; 10 = Bonthe; 11 – Pujehun; 12 = Kono; 13 = Kenema; 14 = Kailahun
|__|__|
Chiefdom Name of Chiefdom: ____________________________ |__|__|
Mill
Name of Village/Community:______________________
Distance of Mill to C/dom Hdqts (Miles) |__|__|__| •
|__|__|
Name of Mill_____________________________________________
GPS of Mill: _______________N; _________________W
Consent Information (Rice Mill)
SECTION 3: Mill Infrastructure
Is Mill a registered Company? (Circle Number)
1 = Yes
2 = No
What Year was the Mill established OR Company Registered?
Year (Enter Year if Known)
Before Independence (Tick box)
After Independence (Tick box)
Don’t Know (Tick Box)
Walls of Mill Building 1 = wood; 2 = corrugated iron; 3 = mud; 4 = cement blocks; 5 = None; 6 = other (specify) ___________
Floor Space of Mill Building (Estimate by pacing)
_____________ ft BY ______________ft (_________Sq ft)
Floor Space of Drying Floor (Estimate by pacing)
_____________ ft BY ______________ft (_________Sq ft)
My name is -------, I am part of a team engaged by the Rural and Private Sector Development Project in the Ministry of Trade and Industry that is conducting a study of rice marketing in the country. The aim is the help the Government and donors to determine ways in helping to improve rice processing and marketing in our country. I would like to ask you some questions which will take less than 15 minutes of your time. Your name will not be disclosed and any information you provide will be confidential and will not be disclosed to other people. Your participation is voluntary and you can choose not to answer any or all of the questions if you wish; however we hope you will participate since your views are important. Do you have any questions? May I begin the interview? Yes ____________ No ________________
SECTION 2: Demography
Mill Manager Mill Mechanic
Estimated Age (Years)
Gender
Education:
Highest Class attained
Business Training
Technical Training
RICE MARKETING STUDY
PROCESSING QUESTIONNAIRE
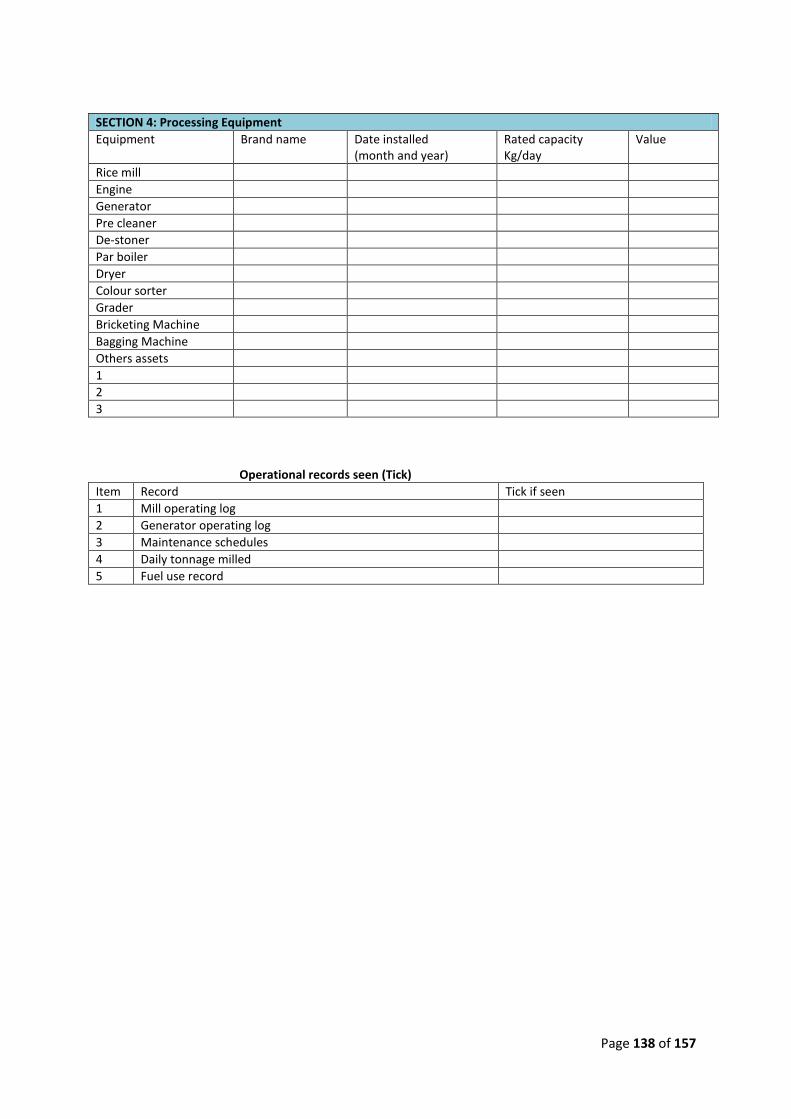
Page 138 of 157
SECTION 4: Processing Equipment
Equipment Brand name Date installed (month and year)
Rated capacity Kg/day
Value
Rice mill
Engine
Generator
Pre cleaner
De-stoner
Par boiler
Dryer
Colour sorter
Grader
Bricketing Machine
Bagging Machine
Others assets
1
2
3
Operational records seen (Tick)
Item Record Tick if seen
1 Mill operating log
2 Generator operating log
3 Maintenance schedules
4 Daily tonnage milled
5 Fuel use record
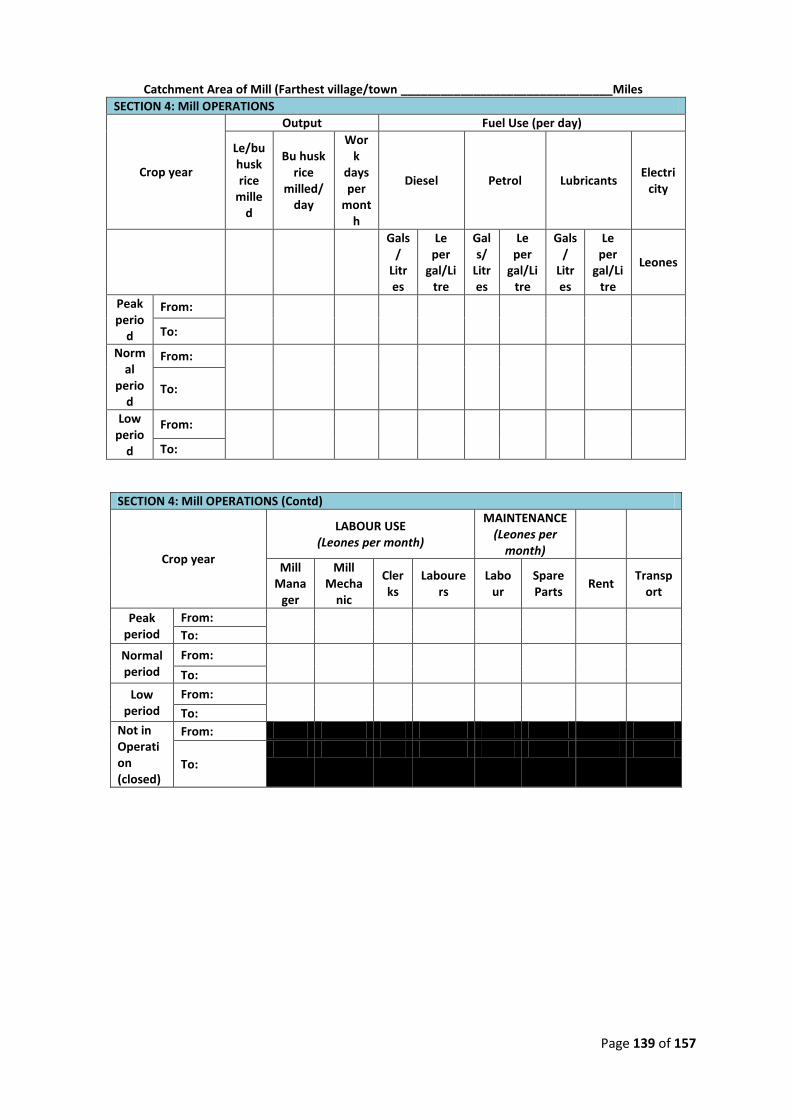
Page 139 of 157
Catchment Area of Mill (Farthest village/town ________________________________Miles
SECTION 4: Mill OPERATIONS
Crop year
Output Fuel Use (per day)
Le/bu husk rice
milled
Bu husk rice
milled/ day
Work
days per
month
Diesel Petrol Lubricants Electri
city
Gals/
Litres
Le per
gal/Litre
Gals/
Litres
Le per
gal/Litre
Gals/
Litres
Le per
gal/Litre
Leones
Peak perio
d
From:
To:
Normal
period
From:
To:
Low perio
d
From:
To:
SECTION 4: Mill OPERATIONS (Contd)
Crop year
LABOUR USE (Leones per month)
MAINTENANCE (Leones per
month)
Mill Mana
ger
Mill Mecha
nic
Clerks
Labourers
Labour
Spare Parts
Rent Transp
ort
Peak period
From:
To:
Normal period
From:
To:
Low period
From:
To:
Not in Operation (closed)
From:
To: