study of rock damage caused by tunnel boring · study of rock damage caused by tunnel boring at...
TRANSCRIPT

--~---- ~
Working Report 2004-32
Study of Rock Damage Caused by Tunnel Boring ••
. at Aspfi Hard Rock laboratory
Jorma Autio
Hanna Malmlund
Marja Siitari-Kauppi
- August 2004
POSIVA OY
FIN-27160 OLKILUOTO, FINLAND
Tel +358-2-8372 31
Fax +358-2-8372 3709

INSINOORITOIMISTO
SAANIO & RIEKKOLA OY SAATE 19.3.2004
SAATE TYORAPORTIN T ARKAST AMISESTA JA HYV AKSYMISEST A
TILAAJA
TILAUS
YHTEYSHENKILOT
TYORAPORTTI
LAATIJAT
TARKASTAJA
HYVAKSYJA
Posiva Oy 27160 OLKILUOTO
9760/03/EJOH 9568/04/EJOH
Jukka-Pekka Salo Reijo Riekkola
Posiva Oy Saanio & Riekkola Oy
Study of rock damage caused by tunnel boring at Aspo Hard Rock Laboratory
~u~ Saanio &Riekkola Oy
-~un~ Marja Siitari-Kauppi Helsingin Yliopisto,
Radiokemian laboratorio
Timo Saanio Saanio & Riekkola Oy
~:: C. ----R_cifc( Riekkola Saanio & Riekkola Oy
toimitusjohtaja

Radiokemian Laboratorio Kemian Laitos Helsingin Yliopisto
•
•
SAATE 1.7.2004
SAA TE TYORAPORTIN TARKAST AMISEST A JA HYV AKSYMISEST A
TYORAPORTTI
LAATIJAT
Jorma Autio Saanio & Riekkola Oy
HYVAKSYJA
Study of rock damage caused by tunnel boring at Aspo Hard Rock Laboratory
Hanna Malmlund
Jukka Lehto Professori
Helsingin Yliopisto Radiokemian laboratorio

Working Report 2004-32
Study of Rock Damage Caused by Tunnel Boring
· at AspO Hard Rock laboratory ·
POSIVA OY
FIN-27160 OLKILUOTO, FINLAND
Tel +358-2-837 2 31
Fax +358-2-8372 3709
Jorma Autio
Hanna Malmlun-d
Marja Siitari-Kauppi
August 2004

Working Report 2004-32
Study of Rock Damage Caused by Tunnel Boring ••
at AspO Hard Rock laboratory
Jorma Autio
Hanna Malmlund
Saanio & Riekkola Oy
Marja Siitari-Kauppi
University of Helsinki, Laboratory of Radiochemistry
August 2004
Working Reports contain information on work in progress
or pending completion.
The conclusions and viewpoints presented in the report
are those of author(s) and do not necessarily
coincide with those of Posiva .

STUDY OF ROCK DAMAGE CAUSED BY TUNNEL BORING AT ASPO HARD ROCK LABORATORY
ABSTRACT
Underground opening in rock excavated using Tunnel Boring Machine (TBM) technique is surrounded by a zone which has been damaged. The damage is caused partly by the impact of excavation tools and partly, if the stresses are high enough, by redistribution of stresses around the opening. This study is focused on properties of this excavation damage zone EDZ, caused by TBM excavation, adjacent to the tunnel surface where the fracturing and alteration of rock properties is most pronounced.
Samples were taken from the TBM-tunnel at Aspo Hard Rock Laboratory which was excavated in 1994 starting at a depth of 420 m. The microfracturing and spatial distribution of porosity adjacent to the surface of the deposition holes in the samples was studied in laboratory by using 14C-PMMA method and scanning electron microscopy (SEM). The rock samples were also analysed by using microscopical petrography, rock mechanical measurements and porosity determinations.
The rock samples, although taken relatively near from each other, were of different types of rock. Based on modal analysis the rock types were slightly foliated porphyritic tonalite, quartz-monzonite and slightly foliated quartz-monzodiorite. However the porosities of different samples were similar in spite of the rock composition being different. The average thickness of the damaged zone defined as the zone of increased porosity was about 20 mm. The porphyritic structure of rock samples, large single low porosity phenocrysts in higher porosity groundmass, causes a lot of variation in the micro fracturing and therefore causes uncertainty in the determination of the depth of the damaged zone. The thickest damaged zone found was 31 mm the thinnest was 17 mm. The calculated additional pore volume in the damaged zone ranged from 18 cm3 /m2 (in other words 18 ml more pore space than in intact rock per one square meter of tunnel surface) to 37 cm3/m2
, with the average value being 26 cm3/m2• The damage can be
divided roughly to three different zones: a) The first zone, the crushed zone, extends from the excavated surface to a maximum depth of about 3 mm, b) the second zone, fractured zone, extends from the crushed zone to a maximum depth of about 10 mm, c) the third zone of grain boundary fracturing and increased porosity extend from the fractured zone to a depth of 15-35 mm.
Keywords: EDZ, excavation damage, excavation disturbance, TBM, rock damage

TUNNELIPORAUSTEKNIIKALLA TAPAHTUVAN LOUHINNAN AIHEUTTAMA VAURIOVYOHYKE JA SEN TUTKIMINEN ASPON KALLIOLABORATORIOSSA
TIIVISTELMA
Tunnelinporaustekniikalla (TBM) louhitun tunnelin ymparilHi olevaan kallioon muodostuu vaurioitunut vyohyke (EDZ). Vaurioitunut vyohyke on osittain mekaanisessa louhinnassa kaytettavien leikkuuterien aiheuttamaa ja osittain, mikali jannitystila on tarpeeksi korkea, seurausta jannitystilan uudelleen jakautumisesta louhitun tilan ymparilla. Tassa selvityksessa tarkastellaan TBM-tekniikalla louhitun tunnelin pinnan valittomassa laheisyydessa, jossa vaurio on voimakkain, olevan vauriovyohykkeen ominaisuuksia.
Tarkastelua varten otettiin Ruotsissa sijaitsevasta Aspon kalliolaboratorion ns. TBMtunnelista naytteita vauriovyohykkeen tutkimista varten. TBM-tunneli sijaitsee 420 m syvyydessa ja se on louhittu 1994. Tunnelin laheisyydessa oleva mikrorakoilu ja huokoisuus selvitettiin tutkimalla naytteet laboratoriossa 14C-PMMA-menetelmalla ja elektronimikroskopialla (SEM). Lisaksi naytteille tehtiin mikroskooppisia ja kalliomekaanisia laboratoriotutkimuksia seka huokoisuusmaarityksia.
Naytteet edustivat erityyppisia kivilajeja. Mikroskooppitutkimusten perusteella naytteet olivat kvartsi-monzoniittia seka lievasti suuntautuneita porfyyrista tonaliittia ja kvartsimonzodioriittia. Naytteiden erilainen mineraalikoostumus ei kuitenkaan aiheuttanut merkittavia huokoisuuseroja eri naytteiden kesken, vaan huokoisuudet olivat samaa suuruusluokkaa eri naytteissa. Vaurioituneen vyohykkeen, missa huokoisuus on selvasti taustahuokoisuutta suurempi, paksuus on noin 20 mm. Tutkimusten perusteella kiven perusmassa oli huokoisempaa kuin yksittaiset porfyyrirakeet. Kivien porfyyrinen rakenne aiheuttaa tarkastelumittakaavassa suurta vaihtelua mikrorakoilun maaraan ja taten epavarmuutta vaurioituneen vyohykkeen paksuuden maarittamisessa. Suurin maaritetty vaurioituneen vyohykkeen paksuus oli 31 mm ja ohuin 17 mm. Laskettu vaurioituneen vyohykkeen lisaantynyt huokostilavuus (ts. kuinka paljon enemman vaurioituneessa vyohykkeessa on huokostilavuutta tunnelineliometria kohden verrattuna ehjaan kallioon) vaihteli valilla 18- 37 cm3/m2
, keskiarvon ollessa 26 cm3/m2.
Vaurioitunut vyohyke voidaan karkeasti jakaa kolmeen eri vyohykkeeseen: a) murskaantunut vyohyke, ulottuu louhintapinnalta maksimissaan noin 3 mm syvyyteen, b) rakoillut vyohyke, ulottuu murskaantuneesta vyohykkeesta maksimissaan 10 mm syvyyteen, c) vyohyke, jossa rakeiden rajapinnat ovat rakoilleet ja huokoisuus on selvasti suurempi kuin ehjassa kivessa ulottuen rakoilleesta vyohykkeesta syvyydelle 15-35 mm.
A vainsanat: EDZ, hairiovyohyke, vaurioitunut vyohyke, TBM, vaurioitunut kallio

TABLE OF CONTENTS
ABSTRACT
TIIVISTELMA
1
TABLE OF CONTENTS .................................................................................................. 1
1 INTRODUCTION ................................................................................................... 3
2 TUNNEL BORING AT ASP0 ................................................................................. 5
3 GEOLOGICAL SETTING OF TBM TUNNEL ....................................................... 13 3.1 General 13 3.2 Lithology, mineralogy and fracturing 13
4 ROCK MECHANICAL PROPERTIES .................................................................. 19 4.1 Porosity and Density determinations 19 4.2 Measurement of Strength Properties 19
5 STATE OF STRESS ............................................................................................ 23 5.1 In-situ stress 23 5.2 Secondary stress field 26
6 SAMPLES ........................................................................................................... 29 6.1 Sampling and the Locations of the Sampling Sections 29 6.2 Description of Samples 31 6.3 Preparation of the Samples for 14C-PMMA and SEM study 33 6.4 Microscopic thin section examination 34
7 ANALYSIS TECHNIQUE ..................................................................................... 37 7.1 14C-PMMA autoradiography 37
7 .1.1 Properties of the 14C-MMA tracer .................................................... 37 7.1.2 Drying, impregnation with 14C-MMA and polymerisation of Samples38 7.1 .3 Autoradiography .............................................................................. 38
7.2 Digital image analysis of 14C-PMMA autoradiographs 39 7.2.1 Calculation of porosity ..................................................................... 39 7.2.2 Intensity and optical density ............................................................ 39 7.2.3 Activity and optical density .............................................................. 39
7.3 Porosity 40
8 14C-PMMA RESULTS .......................................................................................... 43 8.1 Sample Posi3 43 8.2 Sample Posi4 46 8.3 Sample Posi5 50 8.4 Sample Posi6 53 8.5 Sample Posi7 57
9 RESULTS OF SEM-ANAL YSIS ........................................................................... 61 9.1 Electron microscopy 61 9.2 The SEM-sample 3.1/AI 61 9.3 The SEM-sample 4.21/BII 66 9.4 Sample SEM-sample 6.1/BII 71
10 ANAL VS IS OF RESULTS, CONCLUSIONS AND DISCUSSION ......................... 77
11 REFERENCES .................................................................................................... 85
12 APPENDICES ..................................................................................................... 89

2

3
1 INTRODUCTION
Underground opening in rock excavated using Tunnel Boring Machine (TBM) technique is surrounded by a zone, the properties of which have been altered. In the previous study of damage and disturbance from tunnel excavation (Emsley et al. 1997) this zone was defined as excavation disturbed zone EDZ which includes failed and damaged zones (similar to definitions by Emsley et al. 1997 and Read 1996). The damage and disturbance is caused partly by the impact of excavation tools and partly, if the stresses are high enough, by redistribution of stresses around the opening. The properties of EDZ differ from the properties of the host rock and therefore it can affect the flow of water and migration of radionuclides in rock.
TBM-technique has been used widely in hard rock for excavation of long tunnels with circular profile. One significant advantage of the technique compared to drill and blast excavation is the uniform circular shape of the tunnel and surface smoothness in applications where this is favorable, such as in water tunnels. TBM-excavation has been considered as one possible technique for excavating tunnels for the deep repository of spent nuclear fuel in Finland and Sweden.
This study is focused on properties of the damaged zone caused by TBM excavation adjacent to the tunnel surface where the fracturing and alteration of rock properties is most pronounced. The samples studied have been taken from two rounds in the TBMtunnel at Aspo hard Rock Laboratory, Figure 1-1. The TBM-tunnel was excavated in 1994 starting at a depth of 420 m.
Figure 1-1. Overview of the Aspo Hard Rock Laboratory and TBM-tunnel.

4
The EDZ caused by TBM excavation at A.spo has been studied previously in the ZEDEX-experiment (Emsley et al. 1997). Samples had also been taken and the cracking of samples was studied in laboratory (Tan 1996, Kou & Tan 1997). A fluorescent method was used in the discrimination cracks (Lindqvist et al. 1994)
14C-polymethylmethacrylate (14C-PMMA) method and Scanning Electron Microscopy (SEM) was used in this study to analyse the damage in samples taken from the TBMtunnel in terms of microfracturing and porosity both quantitatively and qualitatively. The method had been used earlier in similar type of application to study the damage in samples taken from the Olkiluoto Research Tunnel (Autio 1996, Siitari-Kauppi & Autio 1997, Autio & Siitari-Kauppi 1997, Autio et al. 1999). The work included also microscopical petrography, rock mechanical measurements of two size of samples and porosity determinations.
The TBM and rock factors affecting the extent and properties of EDZ are discussed first in Chapters 2, 3, 4 and 5 to see the framework before proceeding into the actual painting, the description of samples, analysis and results.

5
2 TUNNEL BORING AT ASPO
The tunnel excavated by using Tunnel Boring Machine (TBM), named TBM-tunnel hereafter, was excavated in 1994. The tunnel is 409 m long starting at the -420 m level, with a diameter of 5 m (Figs. 2-1 and 2-2). The first 200 m of the tunnel was declined with an inclination of about 1 :7.
The TBM used was of type Jarva Mk 15 shown in Figures 2-3, 2-4 and 2-5 manufactured by Robbins company. The TBM is of so-called open design intended primarily for boring in medium hard to hard competent rock. The normal boring cycle consists of four steps shown in Figure 2-5.
Figure 2-1. Lay-out of the TBM-tunnel at Aspo.
Figure 2-2. Photo of the TBM-tunnel at Aspo.

6
The main specifications of the TBM are as follows:
- Power requirement 1 680 kW -rotation speed of the cutter head 10.1 rpm - thrust of cutter head 8 300 kN -corresponding maximum cutter force 245 kN -torque of cutter head 1 588 kNm -number of cutters, 34 pes, 17' diameter - stroke 1.525 m - gripper force 25 000 kN - length 7.5 m -weight of main body 50 000 kg - weight of center section 30 000 kg
10 15
Figure 2-3. Longitudinal section of larva Mk 15 TBM used at Aspo.
Figure 2-4. larva Mk 15 TBM before tunnelling.

7
<<' <' f' c < ( ( '(' ( ' c' ( ( ( < (i £ ( ( ' << ,,. < «<<
~-··-······--~
::::~
i - -·-·-·-·--··- -··.;
A co.111plete boring cycle - step by step
Figure 2-5. A typical boring cycle ( Biickblom 1994 ).
The boring advanced 450 m in about three months boring at from 8 to 9 rpm for most of the time. Thrust was limited from 160 to 180 kN per cutter resulting in a total thrust from 5 440 to 6 120 kN.
The average performance of the boring was about 1.36 mlh (effective boring time) the highest being 2.5 m/h. The weekly average advance was 32 m, the best day was 14.7 m and best week 48.7 m. The degree of utilization was approximately 30% (Hammarstrom & Olsson 1996).
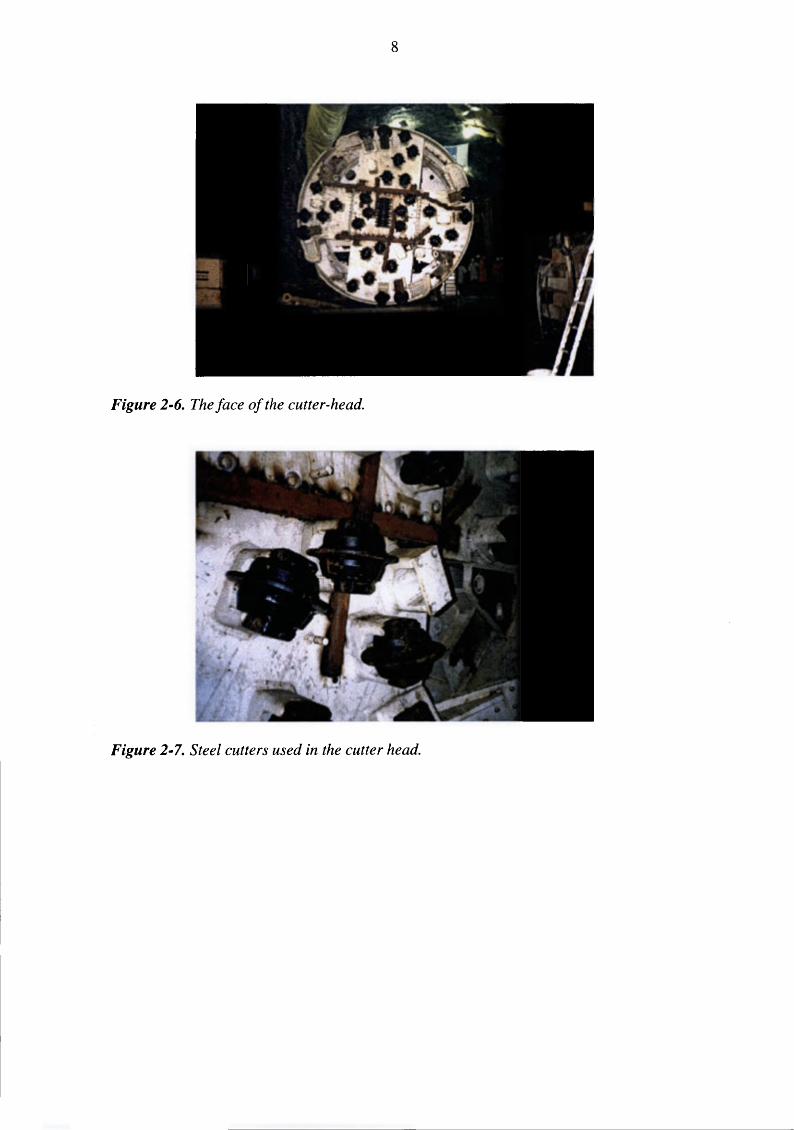
Total of 34 cutters of diameter 17" equal to 432 mm were used in the cutter head shown in Figures 2-6 and 2-7. The standard cutter spacing of the face cutters resulting the grooves in Figure 2-8 was 86 mm, see Figure 2-9.
8
Figure 2-6. The face of the cutter-head.
Figure 2-7. Steel cutters used in the cutter head.

9
Figure 2-8. End of the TBM tunnel showing the kerfs caused by cutters.
Figure 2-9. Kerfs on rock surface. Cutter positions 24 to 28 are spaced at 86 mm intervals (courtesy of Robbins, 1995 ).
Rock fragmentation in TBM boring is based on lateral fracture propagation which causes a chipping of the rock between two neighbouring cutters. The chipping may be caused by a single or multiple disc pass at speed. The speed of the outermost discs,

10
which travel at the highest speed was about 2.5 m/s at Aspo assuming a cutter head rotation speed of 10 rpm. The cutter works in small steps during which the contact force is increased until the rock fails resulting in drop of contact force. The loading time for one step is in the order of 2 to 4 milliseconds if we assume that the single contact length is in order of 5 to 10 mm. The chipping is caused by disc indentation on an fractured kerf surface caused by earlier successive tool contacts. In addition to lateral fracture propagation there are other types of fracturing, as shown in Figure 2-10. The principles of TBM excavation seem to be well established and have been studied in various occasions. The principles of rock cutting and tool design have been studied e.g. by Lislerud ( 1997) and the fracturing e.g. by Lindqvist & Rfmman ( 1980) and Howarth & Bridge ( 1988), Figure 2-11. The profound understanding of the failure process is hampered by the complexity of the processes occurring: nature of multimode multiple dynamic impact loading, confinement, deformation of rock in dynamic loading and coupling of neighbouring discs.
The fracturing of rock under the face cutters seem to be well characterised but the fracturing and rock failure under the outermost cutters which cut the final tunnel surface has not been studied extensively and is more complex in nature. The main reason for complexity of fracturing when compared to cutters in the center part of the cutter head is the loading and stress geometry. The outermost cutters are cutting a relatively steep angle where the stress concentrations and rock deformations induced by the excavation of the opening are significantly larger and the deformation modes are more complex at higher stress levels including plastic deformation and shearing.
Dlllkrlng
Chip loosening
• chlpt from tM 11t tool PMelng 0 chlpt from the 2nd tool puling
Figure 2-10. The principle of rock fragmentation and sidewall damage (Lislerud 1997).

11
Figure 2-11. Fractures caused by a TBM disc cutter of diameter 432 mm on granite. Indenting force 275 kN (on left) and 250 kN (on right) (Howarth & Bridge 1988).

12

13
3 GEOLOGICAL SETTING OF TBM TUNNEL
3.1 General
The dominant rocks at Aspo belong to the 1 700- 1 800 M year old Smaland granite suite with mafic inclusions and dykes (Emsley et al. 1997). The typical Smaland granite is unaltered, medium to coarse grained granite. The colour varies from grey to reddish grey. It has somewhat porphyritic and generally massive texture. The Smaland granite grades into the more mafic Aspo diorite at depth of 100 - 150 m. Aspo diorite is grey to reddish grey and medium grained porphyritic rock. Petrographically Aspo diorite is a quartz-monzodiorite, granodiorite or quartz monzonite. Fine grained, red to greyish red granite occurs very frequently on the Aspo island as well defined dykes intersecting the older rocks and also as irregular veins and sheets. Minor inclusions of mafic rock types (greenstones) are common in granite.
3.2 Lithology, mineralogy and fracturing
The lithology of the Aspo tunnel is demonstrated in Figure 3-1. The map is based on the tunnel mapping data (Rhen et al. 1997). In Figures 3-2 and 3-3 the mapping results of TBM tunnel are presented more accurately (Markstrom & Erlstrom 1996). The dominant rock type in the vicinity of the sampling positions is grey Aspo diorite. Diorite is medium grained and foliated and is intersected by several granite veins.
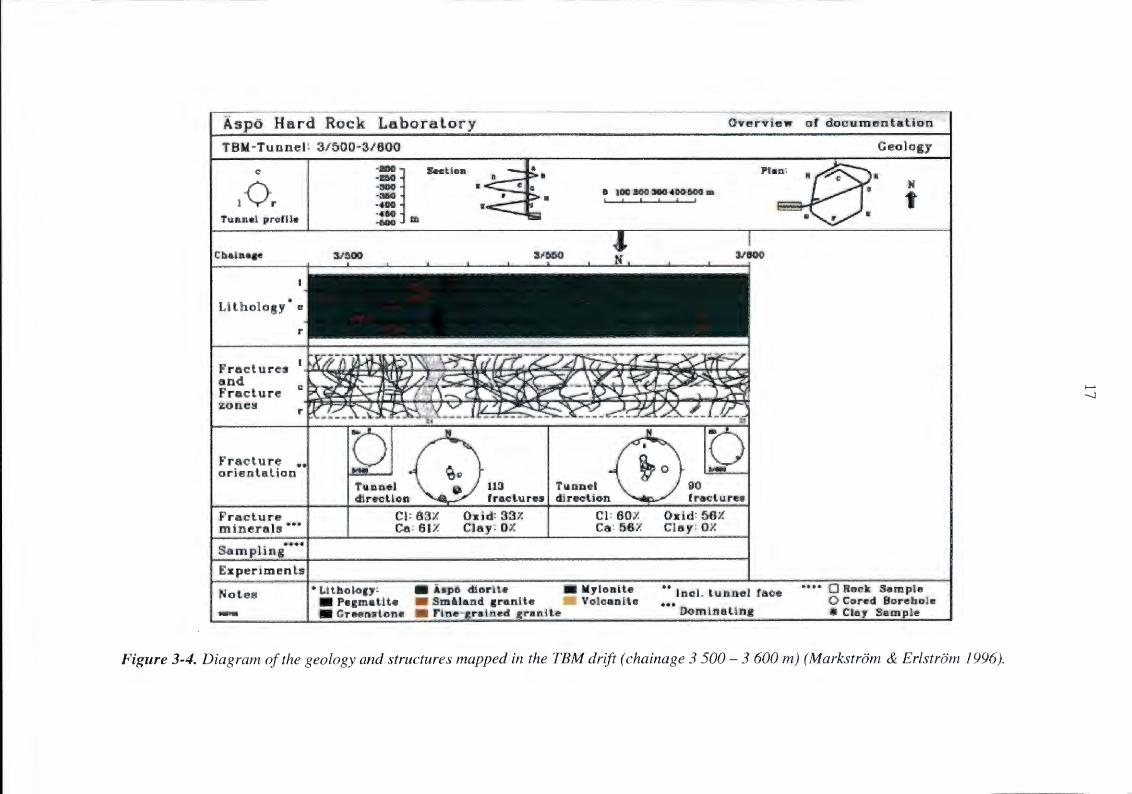
Minor fracture zones based on the tunnel data are presented in Figure 3-4. Fracture zones in the vicinity of the sampling area are dipping steeply to NE and NW. Steeply to NNE dipping fractures are dominant. Also some almost horisontal fractures are discovered. More specific results of the fracturing of TBM drift are shown in Figures 3-2 and 3-3.

14
LEGEND
- Mytonlte - As,o Olorlte Fine-grained Granite or .. nstone Sm"and (AvrO) Granite (Incl. m.Gvulcanlte)
1 Depth below surfac.
01100 Chalnag•ln tunnel
II .L I 10-ot~l UOll 4
Figure 3-1. Lithology of the Aspo tunnel (Rhen et al. 1997).

15
N
lt
0 50 100 m
Figure 3-2. Minor fracture zones based on tunnel data. Chainage 2 300- 3 600 m. Features mapped as 'fractures' (less than 10 cm wide) are not included (Rhen et al. 1997).

A
c
I Or
Litho log
res
re
fractu.... • orientation
d Rock ( ! 3/350 · 3/500
:ylonlt• Volcaillt
O•ervie
Figure 3-3. Diagram of the geology and structures mapped in the TBM drift (chainage 3 350-3 500 m) (Markstrom & Erlstrom 1996).
_. 0\
c:
Or
Lltb o1o •
Froclures n<l rac;lur
~(utes
1: 3/500-31600
:;:I --. •MO .... ·480 ..6aCJ
y
S.Ct..ion-
•
Overview
0 lOOI'OOaG .CDO&GG l I I I I I
•• lncl. lUJill
... Domi.nat.
Plan:
ology
N
0Bock &tmpl 0 Cored 8oreb~~tl e
ClaY Sam'Dle
Figure 3-4. Diagram of the geology and structures mapped:in the TBM drift ( chainage 3 500- 3 600 m) (Marks tram & Erlstrom 1996).
.........
........,)

18

19
4 ROCK MECHANICAL PROPERTIES
4.1 Porosity and Density determinations
Porosity and densities (dry bulk density, wet bulk density and grain density) were determined of four Samples POSi 2.21A, 4.21A, 4.22A and 5.21A in Geological Survey of Finland (Kivekas 1998). The samples were prepared from three drill core samples (POSi2.2, 4.2 and 5.2, 0 -92 mm) drilled from the TBM-tunnel. Following values were measured before the determinations: diameter -31 mm, length -29 mm and volume V 21 cm3
.
Results of porosity and density determinations are presented in Table 4-1. The porosity of Samples POSi 4.21A and 4.22A was slightly higher than porosities of Samples POSi 2.21A and 5.21A.
Table 4-1. Results of porosity and density determinations (Kivekiis 1998).
Sample
POSi 2.21A POSi 4.21A POSi 4.22A POSi 5.21A
Mass of wet
sample (g)
60.968 56.975 56.327 58.981
Mass of dry
sample (g)
60.888 56.855 56.200 58.877
Soaking: 2 days, Drying: 7 days.
Bulk Dry volume bulk
(cm3)
densitl (kg/m)
22.005 2767 20.528 2770 20.311 2767 21.294 2765
4.2 Measurement of Strength Properties
Wet Grain bulk density
densitl (kg/m) (kg!m3
)
2771 2777 2775 2786 2773 2784 2770 2779
Effective porosity
(%) 0.364 0.586 0.627 0.489
The latest results of measurement of rock mechanical properties at the level of the sampling (z = -450 m) are presented in Table 4-2. Results of rock mechanical laboratory testing of the part of the TBM tunnel near TBM assembly hall and the ZEDEX drift at level z = -420 m (see Fig. 2-1) are presented in Table 4-3. The measured cores are from a borehole drilled axially along the TBM tunnel before the TBM boring (Emsley et al. 1997, Stenberg & Gunnarsson 1998). Measurements were later performed also on cores from boreholes drilled from ZEDEX and TBM drift at level z = -420 m. The results from these tests are provided in Table 4-4 (Emsley et al. 1997, Stenberg & Gunnarsson 1998).
62 and 90 mm diameter test specimens were prepared of the core samples 3, 4, 5, 6 and 7 (see Figures 6-4, 6-5 and 6-6 in Chapter 6 for the samples). The measured uniaxial compressive strength, Young's modulus and Poisson's ratio of these samples are presented in table 4-5. The measured compressive strength is presented in Figure 4-1 with respect to sample diameter together with some previous measurements. The apparent difference between the strength of differents size of samples may have been

20
caused by the natural vanatlon tn texture and composition of Aspo diorite and difference in sampling positions.
Table 4-2. The mechanical properties (mean value) of the diorite in Aspo HRL (Nordlund et al. 1999) (E5o = tangential Young's modulus, determined at stress level equal to 50% of the ultimate strenth, Eini = Young's modulus detemined at the stress level equal to zero). The sample diameter is 45 mm and length 115 mm, height to diameter ratio 2.5.
Parameter Unit Value Uniaxial compressive strength, <Jc MP a 219 Tensile strength, <Jt MP a 14.7 Young's modulus, Eini GP a 80 Young's modulus, Eso GP a 73 Poisson' s ratio, Vini 0.21 Poisson' s ratio, v so 0.28 Tensile fracture toughness, K1c MPa"m 3.21 Cohesion, c MP a 49 Friction angle, <1> 44° H-B criterion constant, m 15 Crack-initiation stress, <Jci MP a 118 Crack -damage stress, <Jcct MP a 190
Table 4-3. Properties of Aspo diorite from rock mechanical laboratory testing (KA3191F) (Emsley et al. 1997).
Mean Value Standard Deviation
Uniaxial compressive strength (MPa) 195 31 Young's modulus (GPa) 69 5 Poisson' s ratio 0.25 0.03 Tensile strength (MPa) 16 3 Internal friction (0
) 45 3 Cohesion (MPa) 47 4
21
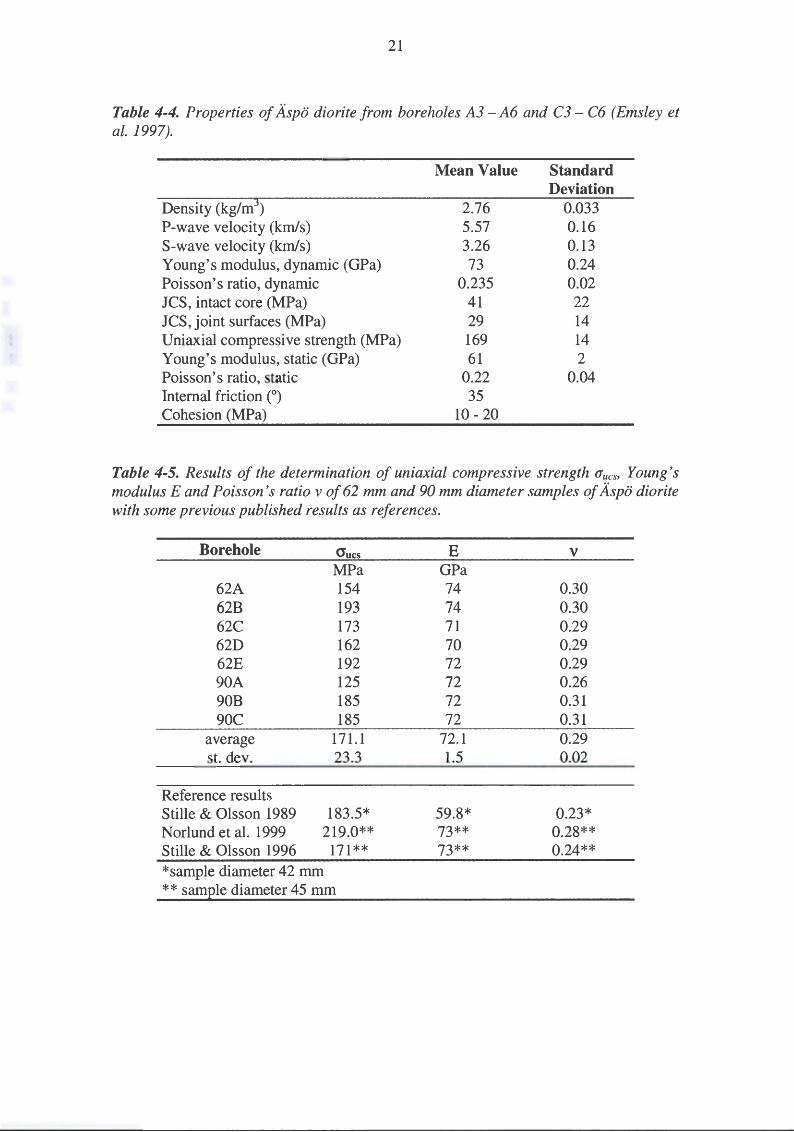
Table 4-4. Properties of Aspo diorite from bore holes A3- A6 and C3- C6 (Emsley et al. 1997).
Density (kg/m3)
P-wave velocity (km/s) S-wave velocity (km/s) Young's modulus, dynamic (GPa) Poisson' s ratio, dynamic JCS, intact core (MPa) JCS, joint surfaces (MPa) Uniaxial compressive strength (MPa) Young's modulus, static (GPa) Poisson' s ratio, static Internal friction (0
)
Cohesion (MPa)
Mean Value
2.76 5.57 3.26 73
0.235 41 29 169 61
0.22 35
10-20
Standard Deviation
0.033 0.16 0.13 0.24 0.02 22 14 14 2
0.04
Table 4-5. Results of the determination of uniaxial compressive strength aucs' Young's modulus E and Poisson 's ratio v of 62 mm and 90 mm diameter samples of Aspo diorite with some previous published results as references.
Borehole O'ucs E V
MP a GP a 62A 154 74 0.30 62B 193 74 0.30 62C 173 71 0.29 62D 162 70 0.29 62E 192 72 0.29 90A 125 72 0.26 90B 185 72 0.31 90C 185 72 0.31
average 171.1 72.1 0.29 st. dev. 23.3 1.5 0.02
Reference results Stille & Olsson 1989 183.5* 59.8* 0.23* Norlund et al. 1999 219.0** 73** 0.28** Stille & Olsson 1996 171** 73** 0.24** *sample diameter 42 mm ** sample diameter 45 mm

220 • 210
200 190
180
;. 170
- 160 Previous I'll
~ 150 measurements
i 140 ~ 130 l: 120 Cl)
110
100
90
80 70
60 50
20 40
22
I..___Results of this study
60 80 100
Sample diameter (mm)
• Unaxial peak strength
4 Crack damage strenath
120 140
Figure 4-1. The measured uniaxial compressive strength f5ucs of 45, 62 and 90 mm diameter samples of Aspo diorite. The strength of 45 mm diameter samples has been presented by Norlund et al. 1999 and Stille & Olsson 1996).

23
5 STATE OF STRESS
5.1 In-situ stress
In-situ stresses in the vicinity of the TBM-tunnel were determined in two different projects, the Zedex -project and the Prototype Repository project. The results differ clearly from each other. The results obtained in the Prototype Repository project are assumed to represent the state of stress in the position of the studied samples better because the area of interest was closer than in Zedex-project.
The results of the in-situ stress measurements (Dahlstrom 2000) obtained by overcoring and presented in Table 5-1 and Figure 5-1 represent the state of stress in the Prototype Repository tunnel and should correspond well to the state of stress in the sampling section which is located at the same depth range.
Table 5-l. Principal stress magnitudes and directions determined by overcoring ( Dahlstrom 2000 ).
Measuring point
8 9 10 11
Mean
Measurement depth in the hole
(m) 20.06 21.21 21.70 22.31
D a 1188/39
0 (J2 94/6
8 (JJ 356/51
Ot 02 MP a MP a
34.5 17.6 29.0 15.1 43.7 20.5 30.4 18.2 34.2 17.7
N
s
Figure 5-1. Directions of principal stresses (Dahlstrom 2000).
03 MP a
11.4 11.0 15.8 12.7 13.1
E

24
Stress measurements were also carried out near ZEDEX drift and TBM assembly hall at the level-420 m (See Fig. 2-1) during 1993- 1995 and have been described by Emsley et al. ( 1997). During the ZED EX Extension Project (Didriksson 1997) stress measurements were performed at the ZEDEX site in order to obtain stress data which could be correlated with excavation effects (Stenberg & Gunnarsson 1998). In-situ stresses were determined using overcoring technique. Measurements were made in boreholes located in the pillar between the ZEDEX and TBM drifts and in borehole extending south from the ZEDEX drift (Stenberg & Gunnarsson 1998). The measured average principal stresses and directions in the central part of the pillar and in the other side of ZED EX tunnel are presented in Table 5-2.
The orientation of cr2 and cr3 varied widely over the measurement points, falling within a region approximated by a great circle perpendicular to the average cr1 orientation (Fig. 4-1) (Emsley et al. 1997). From Table 5-2, it can be seen that their magnitudes are quite similar to each other. As a consequence of the small variation in cr2 and cr3 values, the average cr2 and cr3 orientations has little meaning, other than that they lie within a plane containing those orientations. However, the orientations of cr1 were much more consistent (Fig. 5-2). A generalised relationship between structure, velocity and stresses in the ZEDEX drift has been suggested and is presented in Figure 5-3 (Emsley et al. 1997).
Table S-2. Average principal stress magnitudes and directions obtained in borehole KXZSD8HR and KXZSD8HL (Stenberg & Gunnarsson 1998).
Borehole Stress Magnitude Dip Dip No. Component (MPa) Direction (0)
(0)
KXZSD8HR (jl 19.6 336 8 (j2 10.7 71 37
(j3 10.3 236 52 KXZSD8HL <Jt 20.1 351 24
(j2 9.2 230 49
(j3 7.8 96 31

25
A) N ASPO KXZSD8HL B) N ASPO KXZSDSHR
PRINCIPAL STRESS PRINCIPAL STRESS I DIRECTIONS DIRECTIONS I
f!iJl \ AVERAGES IN BOLD @ AVERAGES IN BOLD
0 r \- >< 0 crl t \ CJ crl
] I \ 0 cr2 0 cr2
~E x cr3 x cr3
wJ I I
~ X E \ 0 I X J
\ xo o ;- x >< x 0 f 0
><
s s
Figure 5-2. Principal stress orientations from boreholes a) KXZSD8HL and b) KXZSD8HR. Lower hemisphere equal angle projection with azimuths relative to the Aspo X co-ordinate (local North) (Stenberg & Gunnarsson 1988).
a. hcrl.ontal plan
LEGEND ZED£)( AREA Hot" I eonto I p ICII'I ot Z-4 15 1t
1>. aeottan A-A' VF -- '"-""• l -- IIDtr~rne fnot\re
.;
\ l ~ ...... , 11011 ... ·~ ··-0- Wlttl .. lalft
'2--+0+-- vs
I (2 Sin.lotu"e wlttl •ldltte
r jv f3
' I Jo 3t Jo •• , F 10
Figure S-3. Generalised relationship between structure, seismic velocity and stresses in the ZEDEX drift. VF represents the fast velocity, V1 the intermediate and Vs the slow velocity. f71 represents the maximum principal stress, f72 the intermediate and f73 the minimum principal stress (Emsley et al. 1997).

26
5.2 Secondary stress field
The estimates of the secondary stress field are based on the assumption that the in-situ stress field measured in the Zedex -project represents the situation in the TBM -tunnel. The results shown should be considered with care. If the stress field determined in the Prototype Repository project is closer to reality, the geometry and magnitudes of the secondary stress-field would alter clearly.
Modelling of the stress field close to the ZED EX and TBM drifts at level --420 m was performed using EXAMINE3 (Emsley et al. 1997). The calculations were based on a straight section of the drift, without accounting for the influence of other parts of the excavation such as the TBM assembly hall. Previous modelling showed (Detournay & St. John 1988) that these other drifts would have a limited effect on stresses in the investigated volume. (Emsley et al. 1997). Figure 5-4 shows the major compressive principal stress, a 1, the minor compressive principal stress a3 and the differential stress (a1-a3) for a cross section of several metres behind the drift face. The maximum compressive stress and the differential stress show similar spatial variation, although the differential stress is more concentrated close to the surface. In both cases the maximum values are in the floor and roof of the drifts. In the TBM drift, the floor and roof of the drift had generally symmetrical stress fields with the highest values of a1 and differential stress (a1-a3) of approximately 70 MPa. The a 1 stress trajectories were found to be tangential to the drift near the excavation surface. a 1 was found to be slightly over one third of the unconfined compressive strength of the rock. In the region of the side walls of the drift the differential stress was as low as 12 MPa.
The minimum principal stress a3 is slightly tensile in sidewalls of the drift (Fig. 5-4). The most extensive regions of decreased a3 stress values are those regions inclined at about 45° above and below horizontal. The a3 stress trajectories were rotated perpendicular to the drift perimeter close to the drift where the values approach zero MP a.

27
Figure 5-4. Stress models for the TBM drift. The maximum compressive principal stress ( a1) is shown at the top, the minimum compressive principal stress ( CY3) is shown in the centre and the differential stress ( (]j-CY3) is shown at the bottom. Minor undulations in stress close to the boundary are artefacts of the model (Emsley et al. 1997).

28

29
6 SAMPLES
6.1 Sampling and the Locations of the Sampling Sections
A total of five samples identified as POSi 3, 4, 5, 6 and 7, taken from the TBM drift were used to study the damage caused by boring. The diameter of samples was 90 mm and the length from 27.5 to 47.5 mm. Samples were taken from side walls and roof so that they represented two different states of stress as well as possible, according to the understanding of stress field at the time of the sampling. The rock type of the samples was specified on the geological maps as Aspo diorite.
Samples POSi 3 and 4 are located at section 3 598 m, i.e. one m in front of the tunnel face. The POSi 3 was placed on the N wall and POSi 4 on the S wall. Samples POSi 5, 6 and 7 are located at section 3 472 m. The POSi 5 location was selected on the N wall just above hole CT3A (used in a study conducted by Clay Technology, Pusch 1996) and POSi 6 in the S-wall. POSi 7 was located in the ceiling. The positions of the samples are shown in Figure 6-1 and the sampling sections were presented previously in Figures 2-1 and 2-4 in Chapter 2. All samples were taken radially to the tunnel axis and perpendicular to the tunnel wall.
The sampling was carried out by using the same technique and principles as used in the previous sampling at the Research Tunnel at Olkiluoto (Autio et al. 1996).
Clear cyclic rim shaped cutter grooves were seen on tunnel surface as seen in Figure 6-2. The distance between the two larger grooves in Figure 6-2 is about 1 m which is in the range of the 0.9 m stroke of the boring machine (maximum stroke being 152 cm) and therefore evidently caused by the regripping of the boring machine. The distance between the smaller and less distinct grooves shown in Figure 6-3 and seen on the rock surface in Figure 6-3 was from 19 to 30 mm. The rotation speed of the boring machine was estimated to be approximately 10 rpm and the average effective advance rate 1.36 mlh (equal to 23 mm/minute). Therefore the advance per one rotation is approximately 2.3 mm and distance between the smaller grooves corresponds to 8 to 13 cutter head rotations.

N
30
Sm
S N
Posi4
Section 3598 m
~- -~------------ -
Sm
s
Section 3472 m
Figure 6-1. Sample locations of samples PO Si 3, 4, 5, 6 and 7.
Figure 6-2. Sample hole on the tunnel wall.
Section 3598 m
30 mm 23 mm I 23 mm
l ... ..................... . -···········~···· · ·······1
··················································•
Direction towards the tunnel front
Section 3472 m
I I I
30mm l19mm: 24mm ,
~ -T ········T ·-· ·
····· Direction towards the TBM assembly hall
Figure 6-3. Distances between grooves observed on the rock surface in the sampling sections. The lines represent the small and less distict grooves compared to the two broad grooves seen in Figure 6-2.

31
6.2 Description of Samples
Photographs of the sampling positions are presented in Figure 6-2. Photographs of the samples (POSi 3, 4, 5, 6 and 7) are presented in Figures 6-4 to 6-6. The dimensions of the original samples are shown in Table 6-1. Geological mapping of rock types and fractures was carried out for the samples and the results are presented in Table 6-2.
Table 6-1. Sample lengths and diameters.
Specimen
POSi 3 POSi4 POSi 5 POSi 6 POSi 7
Length (cm) 27.5 46.5 47.5 41.0 29.5
Table 6-2. Geological description of the sampl-es.
Diameter (mm)
90 90 90 90 90
Sample Rock number type
Inclusions %
Degree of
foliation
Foliation Special remarks angle
POSi 3
POSi4
POSi 5
POSi 6
POSi 7
Porph. granitoid
Porph. granitoid
Porph. granitoid
Porph. granitoid
Amphibolite <5%
Amphibolite 1%
Granite veins 10%
0
0
None
None
Very weak
Very weak
Very weak
( 0)
60
55
35-40
Two fractures intersect the sample at 40° angle to the sample axis. The one in the central part of the sample is natural and very tight. The other one at the bottom part is less tight and might be opened by sampling. One 30 cm long filled fracture intersects the sample at 20° angle to the sample axis. Fracture fillings are probably chlorite and epidote. Some microcline megacrysts contain 5-10 mm long open cracks. One 15 cm long filled fracture in the bottom part of the sample. Fracture filling ts possibly chlorite. Some microcline megacrysts and granite vein contain 5-20 mm long open cracks. One 16 cm long filled fracture in the bottom part of the sample. Fracture crosses the sample at 40° angle from the sample axis and fracture filling is epidote.

32
Figure 6-4. Photograph of the Samples POSi 3 (left) and POSi 4 (right). Diameter of the samples is 90 mm. Designations of the corresponding 90 and 62 mm diameter samples prepared for rock mechanical testing are shown in parentheses
I ~ L C62E) _j
Figure 6-5. Photograph of the Sample POSi 5 and POSi 6. Diameter of the samples was 90 mm. Designations of the corresponding 62 mm diameter samples prepared for rock mechanical testing are shown in parentheses.

33
Figure 6-6. Photograph of the Sample POSi 7. Diameter of the sample was 90 mm. The designation of the corresponding 90 mm diameter sample prepared for rock mechanical testing is shown in parentheses.
6.3 Preparation of the Samples for 14C-PMMA and SEM study
The samples were prepared and partitioned for 14C-PMMA study in steps. Partitioning diagrams of the samples and the coding of each individual rock piece are presented together with the results later in Chapter 8 in Figures 8-1, 8-7, 8-13, 8-19 and 8-25.
Samples for electron microscopic (SEM) study were prepared from samples PO Si 3.1, POSi 4.21, POSi 6.1 and POSi 7.1, after the 14C-PMMA study.
The diamond saw used in the work was of the Diamant Board type. The thickness of the blade was 1.3 mm and 0 200 mm. The rotation speed was 2 800 rpm and the width of the cut 1.5 mm. After impregnation the samples were sawn to carry out autoradiography and scanning electron microscopy (SEM). The sawn rock surfaces were polished using Corodum aluminium oxide powders (180, 220, 400 and 600 Mesh). All the sawn and polished surfaces were exposed on autoradiographic film, and several autoradiographs were taken.
In general the code of the autoradiograph taken from the sawn surface is the same as that of the code of rock piece. Each part of the sample is coded according to its proximity to the disturbed surface. The frrst cut was along the axis of the cylindrical sample. The samples were then sawn parallel to the disturbed surface at depths from

34
5 mm to 31 mm. The principles of labelling and denotation of the samples is described in more detail in Autio et al. (1996).
6.4 Microscopic thin section examination
The microscopic thin section examination was carried out for three samples, POSi 3.1, POSi 4.21 and POSi 6.1 selected to represent the three different texture types of the samples. The study was carried out by the Geological Survey of Finland, 1998. Samples were studied using Leiz-polarizing microscope and Swift pointcounting extra equipment.
Based on the modal composition the thin section POSi 3.1 AI is slightly foliated porphyritic tonalite. Diameters of plagioclase phenocrysts are about 4 - 7 mm. The grain size of the groundmass is less than 0.3 mm, except for quartz grains, the grain size of which varies between 0.3 - 1.0 mm.
Thin section POSi 4.21 BII was classified as quartz-monzonite. In this section there are three potassium feldspar phenocryst (8- 10 mm). In the phenocrysts there were plagioclase and quartz inclusions. The grain size of plagioclase and quartz grains in groundmass are about 1 - 3 mm. Biotite grains are more fine-grained (0.2 - 0.5 mm).
The rock type of the thin section POSi 6.1 BI is slightly foliated quartz-monzodiorite. Few potassium feldspar phenocryst was detected with a grain size of about 7 mm. The groundmass is even and medium grained. Grain size varies between 1 - 4 mm. Minerals are altered in every section. Principally the most altered minerals are plagioclase altering to sericite or very fine grained epidote and biotite altering to chlorite and quartz. Results of the thin section examination are presented in Table 6-3.

35
Table 6-3. Modal composition of thin sections based on the point counting analysis (500 points/section).
POSi 3.1 AI POSi 4.21 BII POSi 6.1 BI Quartz 15.0 9.2 11.6 Potassium feldspar 2.0 32.2 18.6 Plagioclase 49.8 29.6 34.2 Biotite 19.0 13.6 20.8 Muscovite 4.0 6.2 5.0 Chlorite 0.2 0.2 0.2 Epidote 8.2 7.2 6.6 Apatite 0.4 + 0.4 Zircon + Titanite 1.0 0.6 1.6 Calcite 0.2 1.0 0.2 Opaque 0.2 0.2 0.8
Anortite-% An25 An27 An28
Rocktype based on Porphyritic Quartz- Quartz-the modal coml!osition tonalite monzonite monzodiorite
+= mineral has been detected optically, -= mineral has not been detected

36

~ --
37
7 ANALYSIS TECHNIQUE
7.1 14C-PMMA autoradiography
The 14C-PMMA method involves the impregnation of centimetre-scale rock cores with 14C labelled methylmethacrylate (14C-MMA) in a vacuum, irradiation polymerisation, autoradiography and optical densitometry using digital image-processing techniques (Siitari-Kauppi 1995, Hellmuth et al. 1993, 1994, 1999). Impregnation with 14C-MMA, a labelled low-molecular-weight and low-viscosity monomer which wets the silicate surfaces well and which can be fixed by polymerisation, provides information about the accessible pore space in crystalline rock that cannot be obtained using other methods.
Total porosity is calculated by using 2D autoradiographs of the sawn rock surfaces. The geometry of porous regions is then visualised. The conditions for applying this method are: (i) a known local bulk density; (ii) the presence of only two phases, i.e. mineral and PMMA; and (iii) a homogeneous distribution of pores and minerals below the lateral resolution limit of autoradiography.
7.1.1 Properties of the 14C-MMA tracer
Methylmethacrylate (MMA) is a monomer with a viscosity 0.00584 P (20°C) (Daniels & Alberty 1967) that is significantly lower than the viscosity of water 0.00895 P (25°C) (Leonard 1978). Because its contact angle on silicate surfaces is low, impregnation of bulk rock specimens by MMA is rapid and dependent on the existing pore apertures. The MMA molecule is small (molecular weight 100.1), it has non-electrolytic properties and only low polarity, the polarity of the ester being considerably lower than that of water. In the rock matrix MMA behaves like a non-sorbing tracer. The low~ energy of the Carbon-14 isotope, a maximum of 150 keY, is convenient for autoradiographic measurements.
The monomer used in this study was 14C-labelled MMA with a specific activity of 2- 5 mCilg, a total activity of 50 mCi, and a radiochemical purity of >95%. In this study, the dilution of the tracer was 925 000 Bq/ml (25 J.LCi/ml). The tracer activity was determined by using liquid scintillation counting (Rackbeta 280). The calibration sources were prepared by diluting the 14C-MMA with inactive MMA. Activities ranged from 462 Bq/ml (12.5 nCi/ml) to 185 000 Bq/ml (5 J.LCi/ml).

38
7.1.2 Drying, impregnation with 14C-MMA and polymerisation of Samples
Samples were vacuum-dried in an aluminium chamber from 8 to 11 days at a maximum temperature of 80°C and then cooled to 18°C. Impregnation with 14C-MMA was carried out by placing the tracer in a 50 ml reservoir and transferring it under vacuum to the impregnation chamber. Slow transfer of the monomer ensures de gassing and infiltration of the sample without vapour. Impregnation time was 11 days. After impregnation, samples were irradiated with gamma rays from a Co-60 source to polymerise the monomer in the rock matrix; the dose required was 50 kGy (5 Mrad). Samples were irradiated in polyethylene vials under a water and 14C-MMA emulsion.
7 .1.3 Autoradiography
Irradiation of rocks with Co-60 causes strong thermoluminescence in K-feldspar and other major rock-forming minerals which exposes autoradiographic film. To avoid this effect, the thermoluminescence was released by heating the impregnated and irradiated samples to 120°C for a period of 3 hours prior to sawing. Mylar foil with an aluminium coating was used to shield the film from other emissions.
After heating, the samples were sawn into pieces as shown in Figures from 6-6 to 6-10. The sawn rock surfaces were exposed on Kodak BioMax MR autoradiographic film, a high-performance autoradiographic film for 14C and other low-energy P-emitting nuclides. The nominal resolution of the P film is a few Jlm. The final resolution achieved depends on the roughness of the sawn surface and the range of the 150 ke V beta particles in the rock matrix. The beta absorption correction was obtained from the ratio of the densities of the rock (in this case 2. 7 g/cm3 for the Aspo diorite) and the polymethylmethacrylate.
With the level of tracer activity and the type of autoradiographic film employed, the exposure times for samples ranged from 14 to 16 days. Samples were impregnated with 14C-MMA using the drying and impregnation times shown in Table 7-1.
Table 7-1. Drying, impregnation and exposure times of autoradiographs of TBM samples.
Sample Drying Impregnation Exposure time of autoradiographs
POSi 3 11 d 11 d 14d/16d POSi4 8d 11 d 14d/16d POSi 5 11 d 11 d 14d/16d POSi 6 11 d 11 d 14d/16d POSi 7 8d 11 d 14d/16d

39
7.2 Digital image analysis of 14C-PMMA autoradiographs
7.2.1 Calculation of porosity
Interpretation of the results is based on digital image analysis of the autoradiographs. Digital image analysis started by dividing the autoradiograph into area units called pixels. In this study, the 300 dpi (dots per inch) resolution used in the quantitative analysis resulted in a pixel size of 85x85 ~m. Essentially, all the intensities of the subdomains were converted into corresponding optical densities, and these were in turn converted into levels of activity with the help of the calibration curves measured for each exposure. Finally, the levels of activity were converted into their corresponding porosities. In principle, the interpretation is based on studying the abundance of tracer in each sub-domain. References 3 and 4 contain the basic calculations related to porosity determination. The software program Mankeli was used in this study, implemented using the Matlab Image Processing Toolbox.
7.2.2 Intensity and optical density
Since the response of the image source (a flatbed scanner) and the amplifier of the digital image analyser are linear, the digitised grey levels of the film can be treated as intensities. Optical densities, which according to Lambert & Beer's law are proportional to concentration, are derived from the intensities:
7-1
where D is the optical density, Io is the intensity of the background and I is the intensity of the sample. It can be seen that as the intensity decreases, the optical density increases.
7 .2.3 Activity and optical density
A conversation function is required to relate the measured optical densities to the corresponding levels of activity. 14C-PMMA standards (tracer diluted with inactive MMA) having specific activities between 462 and 185 000 Bq/ml were used to establish the calibration function. The following calibration curve was used:
7-2
where Dmax is the maximum optical density, k is a fitting parameter, and A is the specific activity. Solving for A from Equation 7-2 gives:
7-3
40
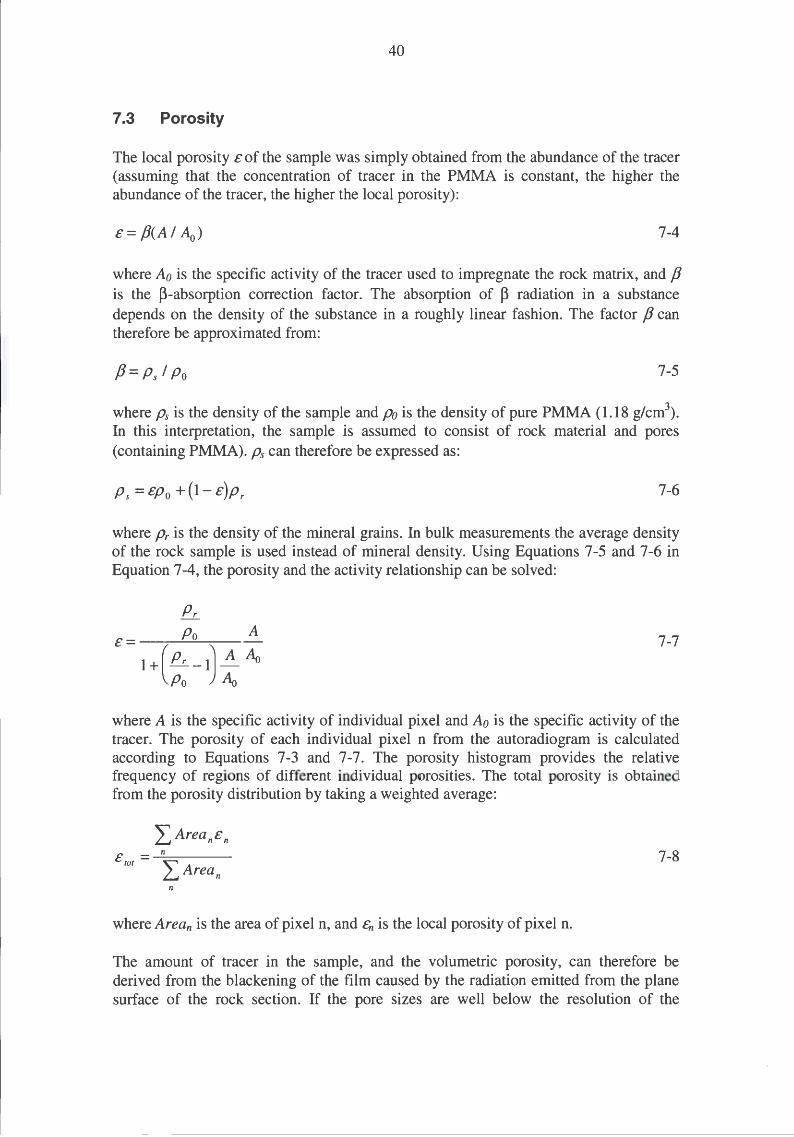
7.3 Porosity
The local porosity E of the sample was simply obtained from the abundance of the tracer (assuming that the concentration of tracer in the PMMA is constant, the higher the abundance of the tracer, the higher the local porosity):
7-4
where Ao is the specific activity of the tracer used to impregnate the rock matrix, and f3 is the ~-absorption correction factor. The absorption of ~ radiation in a substance depends on the density of the substance in a roughly linear fashion. The factor f3 can therefore be approximated from:
7-5
where Ps is the density of the sample and Po is the density of pure PMMA ( 1.18 g/cm3).
In this interpretation, the sample is assumed to consist of rock material and pores (containing PMMA). Ps can therefore be expressed as:
p s = Ep o + (1- E) p r 7-6
where Pr is the density of the mineral grains. In bulk measurements the average density of the rock sample is used instead of mineral density. Using Equations 7-5 and 7-6 in Equation 7-4, the porosity and the activity relationship can be solved:
Pr Po A E = -----:----'--'~--
1+(p,_1)~Ao Po Ao
7-7
where A is the specific activity of individual pixel and A0 is the specific activity of the tracer. The porosity of each individual pixel n from the autoradiogram is calculated according to Equations 7-3 and 7-7. The porosity histogram provides the relative frequency of regions of different individual porosities. The total porosity is obtained from the porosity distribution by taking a weighted average:
E _ n.;,..___ __ _
tot = :l:Arean 7-8
n
where Arean is the area of pixel n, and En is the local porosity of pixel n.
The amount of tracer in the sample, and the volumetric porosity, can therefore be derived from the blackening of the film caused by the radiation emitted from the plane surface of the rock section. If the pore sizes are well below the resolution of the

41
autoradiography, the major fraction of the beta radiation emitted is attenuated by silicate. The tracer can thus be considered to be diluted by silicate. For the 14C-PMMA method to be used, the bulk density must be known, there must be only two phases (i.e. mineral and PMMA), and the pores and minerals must be homogeneously distributed below the lateral resolution limit of the autoradiography.
Porosity profiles were measured from the autoradiographs taken from the surfaces of sawn rock samples. Each profile contains seven to thirteen measurements in which the thickness of a digitally-scanned sector is between 5 and 10 mm. The autoradiograph of Sample 3 is shown as an example in Figure 7-1 together with five porosity profiles that were measured from this sample. The total porosity profile of each sample is the arithmetic average of many profiles.
31 mm
0.8
~ 0.6 ~ ·; 0 0 0.4 Q.
0.2
0 0.5 1.5 2 2.5 3 3.5
distance (cm)
Figure 7-1. Autoradiograph of Sample 3.1/B (left) and porosity profiles (right) showing porosity of rock with respect to distance from the surface measured from the auto radiograph. The disturbed surface is on the left hand side of the autoradioraph.

42

43
8 14C-PMMA RESULTS
8.1 Sample POSi 3
The partition diagram of Sample POSi 3 is presented tn Figure 8-1 and the autoradiographs in Appendix 1.
The averaged porosity profile and the autoradiograph (3.1/B) representing a section perpedicular to the tunnel surface are shown in Figure 8-2. The porosity of 0.6% was measured at depths of 0 to 2 mm from the tunnel surface. A clear increase in the porosity extended to a depth of 7 mm from the tunnel surface. Highly porous minerals were found in the middle of the sample and they were excluded from the profile measurements, (see the arrow in Fig. 8-2.)
To visualise the localization of porous regions in the rock the autoradiograph was superpositioned on the photograph of section 3.1/B Ib as shown in Figure 8-3 and the highly porous regions were colored to red. A few fissures were located parallel to tunnel wall at a depth of 2 mm from the tunnel surface. These fissures transsected both the groundmass and phenocrysts. The depth of the excavation damage zone in section 3.1/B Ib was estimated to extend roughly to a depth of 10 mm from the tunnel surface. These observations conformed to the results from the porosity profile measurements carried out for section 3.1/B (Fig. 8-2).
EO 3.1/B 11
b
l l 45 mm rrD 3 1 1\1\ 3.1/A I
UJ :~LUJ ~ DJ~ I~
3.1/B I
3.1/A 11 3.1/A I SEM + THINSLICE
3.14/A 11 3.13/A 11 3.12/A 11 3.11/A 11
Figure 8-1. Partition diagram for Sample POSi 3 taken from TBM-tunnel at Aspo Hard Rock Laboratory at level -450 m. Autoradiographs have been prepared of the gray surfaces in the figure.

44
The photograph, the corresponding autoradiograph and the autoradiograph superpositioned on the section 3.11/A II are shown in Figure 8-4. The section 3.11/A II has been taken at a depth of 5 mm from the tunnel surface. The porosity histogram of the autoradiograph is shown in Figure 8-5. The groundmass is found porous, while the porosity of feldspar phenocrysts is low. A few intragranular fissures are observed transsecting feldspar grains. The highest porosities that were observed at this depth were ~ 1%.
0.7
0.6
0.5 ~ ~ 0.4 ·u; 0 0.3 ... 0 Q.
0.2
0.1
0
0 5 10 15 20 25 30 35
distance (mm)
Figure 8-2. Porosity profile (left) of Sample POSi 3.1, which is an average of five determined profiles of autoradiograph 3.1/B (right); tunnel surface is on the left side of the autoradiograph. A highly porous zone is excluded from the profile measurement (see the arrow).
Figure 8-3. Photograph, corresponding autoradiograph and autotadiograph superpositioned on to photograph of rock surface 3.1/B lb. Red areas represent porosities ~ 0.5%. Sample width is 35 mm. The section is perpendicular to the tunnel surface and the axis of the tunnel. The tunnel surface is on the left side.

45
Rock section 3.14/A 11 parallel to the tunnel surface at a depth of 29 mm from the surface was studied to investigate the porosity of undamaged rock. The porosity of the undamaged rock was found to be 0.15% in Sample POSi 3. The large feldspar phenocrysts were nonporous while the groundmass was porous. The porosity histogram of surface 3.14/A 11 is shown in Figure 8-6. The highest porosities found were~ 0.8%. The area fraction of porosities > 0.4% was smaller at this depth then the area fraction of correpsonding porosity at a depth of 5 mm from the tunnel surface.
Figure 8-4. Photograph, corresponding autoradiograph and autoradiograph superpositioned on to photograph of rock surface 3.11/A !I (section is parallel to the excavated surface at a depth of 5 mm from the tunnel surface). Red areas represent 50% of total area and porosity is higher tan or equal to 0.21% on these areas.
porosity(%)
Figure 8-5. Porosity histogram of autoradiograph from rock surface 3.11/A !I at a depth of 5 mm from the tunnel surface. The average porosity of the section was 0.26%.

46
porosity(%)
Figure 8-6. Porosity histogram of autoradiograph from rock surface 3.14/A If at a depth of 29 mm from the damaged rock wall surface. The average porosity of the section was 0.15%.
8.2 Sample POSi 4
The partition diagram of Sample POSi 4 is presented tn Figure 8-7 and the autoradiographs in Appendix 2.
The averaged porosity profile and the autoradiograph of section 4.21/B representing a section perpedicular to the tunnel surface are shown in Figure 8-8. The porosity value of 0.6% was measured at depths of 0 to 2 mm from the tunnel surface. This value is twice as high as the porosity value of undamaged rock. A clear increase in the porosity extended to a depth of around 15 mm from the tunnel surface. Some microfissures were found perpendicular to the tunnel surface extending to a depth of around 5 mm from the excavated surface. Also a few parallel fissures were found at a depth of around 2 mm from the tunnel surface.
To visualise the localization of porous regions in the rock the autoradiograph was superpositioned on the photograph of section 4.21/B Ib as shown in Figure 8-9 and the higly porous regions were colored to red. The increased porosity was located clearly in the groundmass of the matrix. A few microfissures transsected the feldspar phenocrysts to depths of 10-12 mm from the tunnel surface. The excavation damage zone extended to a depth of over 10 mm from the tunnel surface determined from the superpositioned image. These observations conformed to the results from the porosity profile measurements carried out for section 4.21/B (Fig. 8-8).

ED Effi4.21 _.{;;>
~
4.21/:tlll /j a ____.-\?-
b
fdJ D\DJ
I 42.1/B I
c.
47
!ill 4.21/A I
4.21/A 11
4.21/B 11 SEM + THINSLICE 4.214/A 11 4.213/A 11 4.212/A 11 4.211/A 11
Figure 8-7. Partition diagram for Sample Posi4.2 taken from the TBM drift at Aspo Hard Rock Laboratory at level -450 m. Autoradiographs have been prepared of the gray surfaces in the figure.
0.7
0.6
0.5 ~ ; 0.4 ·u; 0 0.3 0 c.
0.2
. 0.1
0
0 10 20 30 40
distance (mm)
Figure 8-8. Porosity profile (left) of Sample POSi 4.2, which is an average of seven separate porosity profiles of auto radiograph 4.21/B (right); tunnel surface is on the left side of the auto radiograph.

48
The photograph, the corresponding autoradiograph and the autoradiograph superpositioned on to the rock surface 4.2111 A II are shown in Figure 8-10. The section 4.211/ A II has been taken at a depth of 9 mm from the tunnel surface. The groundmass is found porous, while feldspar phenocrysts showed low porosities. A few intragranular fissures transsect feldspar phenocrysts. The porosity histogram of this autoradiographis shown in Figure 8-11. The highest porosities that were observed were clearly larger than 2.5%, while the highest porosities found from a depth of 26 mm from the tunnel surface were around 1.5% (see Figure 8-12).
Rock section 4.2.14/ A IT parallel to the tunnel surface at a depth of 26 mm from the surface was studied to investigate the porosity of undamaged rock. The porosity of the undamaged rock was 0.29 vol.% in Sample POSi 4.2. The feldspar phenocrysts were nonporous while the groundmass was porous. The porosity histogram of rock surface
Figure 8-9. Photograph, corresponding autoradiograph and autoradiograph superpositioned on to photograph of rock surface 4.21/B lb. Red areas represent porosities ~ 0.5%. Sample width is 45 mm. The section is perpendicular to the tunnel surface and the axis of the tunnel. The tunnel surface is on the left side.
Figure 8-10. Photograph, corresponding autoradiograph and autoradiograph superpositioned on to photograph of rock surface 4.211/A 11 (section is parallel to the excavated surface at a depth of 9 mm from the tunnel surface). Red areas represent 50% of total area and porosity is~ 0.38% on these areas.

49
4.2.14/ A IT is shown in Figure 8-12 shows that the highest porosities found were about 1.5%. The area fraction of porosities of 1% - 1.5% was clearly higher in the damaged zone at a depth of 9 mm from the tunnel surface than in the undamaged zone at the depth of 26 mm.
100
10
0.5 1.0 1.5 2.0 2.5 3.0 3.5 4.0
porosity(%)
Figure 8-11. Porosity histogram of autoradiograph from rock surface 4.211/A 11 at a depth of 9 mm from the tunnel surface. The average porosity of the section was 0.41 %.
100
10
0.5 1.0 1.5 2.0 2.5 3.0 3.5 4.0
porosity(%)
Figure 8-12. Porosity histogram of autoradiograph from rock surface 4.2.14/A 11 at a depth of 26 mm from the tunnel surface. The average porosity of the section was 0.29%.

50
8.3 Sample POSi 5
The partition diagram of Sample POSi 5 is presented tn Figure 8-13 and the autoradiographs in Appendix 3.
The averaged porosity profile and the autoradiograph of section 5.21/B representing a section perpedicular to the tunnel surface are shown in Figure 8-14. The increased porosity was located mainly in the groundmass of the matrix. A few fissures extended to depths of 10-15 mm from the tunnel surface perpendicular to it. Some fissures were found also parallel to the tunnel surface. The porosity value of around 0.6% was measured at a depth of 1 mm from the tunnel surface.
To visualise the localization of porous regions in the rock the autoradiograph was superpositioned on the photograph of section 5.21/A lib as shown in Figure 8-15 and the higly porous regions were colored to red. The increased porosity is evidently located in the groundmass of the rock. Microfissures were not found in the feldspar phenocrysts. The excavation damage zone extended to a depth of around 15 mm from the tunnel surface determined from the superpositioned image. These observations conformed to results from the porosity profile measurements carried out for section 5.21/B (Fig. 8-14).
5.21/B 11
5.21/B I a---b
a b
ITIJ 5.21/A I
I~ 17 5 8 5
~~ ~ ~ ~ 5.214/A I 5.213/A I 5.212/A I 5.211/A I
Figure 8-13. Partition diagram for Sample POSi 5.2 taken from TBM drift at Aspo Hard Rock Laboratory at level -450 m. Autoradiographs have been prepared of the gray surfaces in the figure.

51
0.6
0.5
~ 0.4 ~
~ ·c;; 0.3 0 0 Q. 0.2
0.1
0
0 10 20 30 40 50
distance (mm)
Figure 8-14. Porosity profile (left) of Sample POSi 5.2, that is an average of seven determined profiles of autoradiograph 5.21/B (right); tunnel surface is on the left side on the autoradiograph.
Figure 8-15. Photograph, corresponding autoradiograph and superpositioned autoradiograph on to photograph of rock surface 5.21/A Jib. Red areas represent porosities ;? 0.5%. Sample width is 45 mm. The section is perpendicular to the tunnel surface and the axis of the tunnel. The tunnel surface is on the left side.
The photograph, the corresponding autoradiograph and the autoradiograph superpositioned on to the rock surface 5.211/A I are shown in Figure 8-16. The section 5.211/A has been taken at a depth of 5 mm from the tunnel surface. The groundmass is found highly porous, while feldspar phenocrysts showed low porosities. A few intragranular fissures transsect feldspar phenocrysts. The porosity histogram of this autoradiograph is shown in Figure 8-17. The highest porosities were about 1.4%.

52
Figure 8-16. Photograph and porous areas superpositioned on to photograph of rock surface 5.211/A I (section is parallel to the excavated surface at a depth of 5 mm from damaged rock wall) according to the corresponding autoradiograph. Red areas represent 50% of total area and porosity is :?0.24% on these areas.
100
10
0.2 0.4 0.6 0.8 1.0 1.2 1.4 1.6 1.8 2.0
porosity(%)
Figure 8-17. Porosity histogram of autoradiograph from rock surface 5.211/A I at a depth of 5 mm from the tunnel surface. The average porosity of the section was 0.32%.
To investigate the porosity of undamaged rock section 5.214/A I was taken at a depth of 24 mm from the tunnel surface. The porosity of the undamaged rock was 0.15% in Sample POSi 5.2. The feldspar phenocrysts were nonporous while the groundmass was porous. The porosity histogram of rock surface is shown in Figure 8-18. The highest porosities found from a depth of 24 mm from the tunnel surface were less than 0.7%. The porosities from 0.8% to 1.5% found in the damaged zone were not found at this depth.

53
100
10
0.2 0.4 0.6 0.8 1.0 1.2 1.4 1.6 1.8 2.0
porosity(%)
Figure 8-18. Porosity histogram of autoradiograph from rock 5.2.14/A I at a depth of 24 mm from the tunnel surface. The average porosity of the section was 0.15%.
8.4 Sample POSi 6
The partition diagram of Sample POSi 6 is presented in Figure 8-19 and the autoradiographs in Appendix 3.
The averaged porosity profile and the autoradiograph of section 6.1/B representing a section perpedicular to the tunnel surface are shown in Figure 8-20. A clear increase in the porosity extended to a depth of around 15 mm from the tunnel surface. The increased porosity was found in the groundmass of the matrix. A few fissures were located perpendicular to the tunnel surface penetrating to depths of 5 - 7 mm from the surface. The porosity value of up to 0.6% was measured at a depth of 1 mm from the tunnel surface.
To visualise the localization of porous regions in the rock the autoradiograph was superpositioned on the photograph of section 6.1/A lib as shown in Figure 8-21 and the higly porous regions were colored to red. The increased porosity was located in the groundmass of the rock. A large mafic mineral area in the middle of the sample was found porous. The excavation damage zone extended to a depth of around 10 mm from the tunnel surface determined from the superpositioned image. These observations conformed to the results from the porosity profile measurements carried out for section 6.1/B (Fig. 8-20).

54
l l 32 mm
EO (@ 6~ 6.1/AI
a ~ ~~, ~ t \ m 11 J ~ ~ll c. ~b 13 5 5 4
6.1/BII:~~BI~a ~ ~ ~ ~ 6. 14/ A I 6.13/ A I 6. 12/ A I 6.11 I A I
Figure 8-19. Partition diagram for · Sample POSi 6 taken from the TBM drift at Aspo Hard Rock Laboratory at level -450 m. Autoradiographs have been prepared of the gray surfaces in the figure.
0.7
0.6
0.5
~ ~ 0.4 "(i) 0 0.3 0 c.
0.2
0.1
0
0 5 10 15 20 25 30 35
distance (mm)
Figure 8-20. Porosity profile (left) of Sample POSi 6, that is an average of seven determined profiles of autoradiograph 6.1/B (right); tunnel surface is on the left side on the autoradiograph.
The photograph, the corresponding autoradiograph and the autoradiograph superpositioned on to the rock surface 6.11/ A I are shown in Figure 8-22. The section 6.111 A I has been taken at a depth of 4 mm from the tunnel surface. The groundmass is found highly porous, while some feldspar grains showed low porosities. A few fissures transsect these grains. The porosity histogram of the autoradiograph is shown in Figure

55
8-23. The highest porosities that were observed at a depth of 4 mm from the tunnel surface, were less or equal to 3.5%.
Figure 8-21. Photograph, corresponding autoradiograph and autoradiograph superpositioned on to photograph of rock surface 6.1/A Jib. Red areas represent porosities.:? 0.5%. Sample length is 32 mm. The section is perpendicular to the tunnel surface and the axis of the tunnel. The tunnel surface is on the left side.
Figure 8-22. Photograph, corresponding autoradiograph and autoradiograph superpositioned on to photograph of rock surface 6.11/A I (section is parallel to the excavated surface at a depth of 4 mm from tunnel surface). Red areas represent 50% of total area and porosity is .:? 0.28% on these areas.

56
To investigate the porosity of undamaged rock section 6.14/A I was taken at a depth of 21 mm from the tunnel surface. The measured porosity of the undamaged rock was 0.25% in Sample POSi 6. Groundmass as well as some mafic mineral grains were found porous while feldspar phenocrysts were nonporous. The porosity histogram of rock surface 6.14/A I is shown in Figure 8-24. The highest porosities found from a depth of 21 mm from the tunnel surface were less or equal to 2.5% the area fraction of these high porosities being singnificantly lower than at a depth of 4 mm from the tunnel surface.
100
10
0.5 1.0 1.5 2.0 2.5 3.0 3.5 4.0
porosity(%)
Figure 8-23. Porosity histogram of autoradiograph from rock surface 6.11/A I at a depth of 4 mm from the tunnel surface. The average porosity of the section was 0.44%.
100
10
0.5 1 .0 1 .5 2.0 2.5 3.0 3.5 4.0
porosity(%)
Figure 8-24. Porosity histogram of autoradiograph from rock surface 6.14/A I at a depth of21 mm from the tunnel surface. The average porosity of the section was 0.22%.

57
8.5 Sample POSi 7
The partition diagram of Sample POSi 7 IS presented In Figure 8-25 and the autoradiographs in Appendix 3.
The averaged porosity profile and the autoradiograph of section 7 .1/B representing a section perpedicular top the tunnel surface are shown in Figure 8-26. Highest porosity values were 0.8% at the vicinity of the tunnel surface. The porosity was four times as high as in the undamaged rock. A clear increase in the porosity extended to a depth of around 10 mm from the tunnel surface. Mafic minerals were found highly porous in the increased porosity zone and plenty of fissures were found parallel to the tunnel surface.
To visualise the localization of porous regions in the rock the autoradiograph was superpositioned on the photograph of section 7.1/A Ib as shown in Figure 8-27 and the higly porous regions were colored to red. The increased porosity was located in the groundmass of the matrix, but two feldspar grains adjacent to the tunnel surface were found slightly porous. A few centimetres long fissure was found parallel to the damaged surface at a depths of 3 mm from the tunnel surface. The excavation damage zone extended to a depth of around 10 mm from the tunnel surface determined from the superpositioned image. These observations conformed to the results from the porosity profile measurements carried out for section 7 .1/B (Fig. 8-26).
The photograph, the corresponding autoradiograph and the autoradiograph superpositioned on to the rock surface 7.11/A 11 are shown in Figure 8-28. The section 7.111 A 11 has been taken at a depth of 5 mm from the tunnel surface. The groundmass as well as mafic mineral grains were found highly porous at a depth of 5 mm from the tunnel surface. The porosity histogram of the autoradiograph is shown in Figure 8-29. The highest porosities that were observed were less or equal to 2.5%.
l l 45 mm
EO ~~- ~~~[]::{1/AI LW = - 7.1/A 11
7.1/B 11 + SEM
7.1/8 I
/I a 21
I' I'
\ 7
rr-
7. 14/ A 11 7. 13/ A 11 7. 12/ A 11 7. 11 I A 11
Figure 8-25. Partition diagram for Sample POSi 7 taken from the TBM drift at Aspo Hard Rock Laboratory at level -450 m. Autoradiographs have been prepared of the gray surfaces in the figure.

58
0.9
0.8
0.7
~ 0.6 ~ ~ 0.5 ·u;
0.4 0 '-
8. 0.3
0.2
0.1
0
0 10 20 30 40 50
distance (mm)
Figure 8-26. Porosity profile (left) of Sample POSi 7, that is an average of seven determined profiles of autoradiograph 7.1/B (right); tunnel surface is on the left side of the autoradiograph.
Figure 8-27. Photograph, corresponding autoradiograph and superpositioned auto radiograph on to photograph of rock surface 7.1/A lb. Sample length is 45 mm. Red areas represent porosities ~ 0.6%. The section is perpendicular to the tunnel surface and the axis of the tunnel. The tunnel surface is on the left side of the rock sample.
The porosity of the undamaged rock was 0.18 vol.% in Sample POSi 7. This was measured from the autoradiograph of rock sample 7.13/ A II taken at a depth of 24 mm from the tunnel surface. Groundmass was found porous. A few microfissures transsected the large feldspar phenocrysts at this depth, too. The porosity histogram of rock surface 7.14/A II is shown in Figure 8-30. The highest porosities found were around 1% and porosities over 1.5% were not found.

59
Figure 8-28. Photograph, corresponding autoradiograph and autoradiograph superpositioned on to photograph of rock surface 7.11/A 11 (section is parallel to the excavated surface at a depth of 5 mm from tunnel surface) according to the corresponding autoradiograph. Red areas represent 50% of total area and porosity is ~ 0.29% on these areas.
c: 0 ·.= g
<!:::
100
10
0.5 1.0 1.5 2.0 2.5 3.0 3.5 4.0
porosity (%)
Figure 8-29. Porosity histogram of autoradiograph from rock surface 7.11/A 11 at a depth of 5 mm from the tunnel surface. The average porosity of the section was 0.42%.

60
0 .5 1.0 1.5 2 .0 2 .5 3 .0 3 .5 4 .0
porosity (%)
Figure 8-30. Porosity histogram of autoradiograph from rock surface 7.14/A I/ at a depth of 24 mm from the damaged rock wall surface. The average porosity of the section was 0.18%.
61
9 RESULTS OF SE M-ANALYSIS
9.1 Electron microscopy
Scanning electron microscopy and energy dispersive X-ray analysis (SEMIEDS) were performed in order both to study the pore apertures of porous regions in greater detail and to detect the corresponding minerals. The regions for SEMIEDS measurements were selected from 14C-PMMA autoradiographs. Local porosities are measured with the 14C-PMMA method, which yields an approximation of 2D images of centimetric-scale rock surfaces calculated from the intensities of the autoradiographs. The porous regions comprise pores and fissures with a wide aperture range. The apertures of pores and fissures in and around the minerals were determined.
Samples POSi 3, POSi 4 and POSi 6 were selected for SEMIEDS analysis. The partition diagrams for the SEM-samples taken from Sections 3.1/A I, 4.21/B 11 and 6.1/B 11 are presented in Figures 8-1, 8-7 and 8-19 respectively. 14C-PMMA autoradiographs were also made of the studied surfaces of SEM-samples.
Electron microscope analysis of the polished rock sections (polished using 0.25 J..Lm diamond paste) was performed using a Zeiss DSM 962 electron microscope and the Link ISIS program with a UTW Si(Li) detector operating in the back-scattered electron image (BSE) mode. A mosaic picture of the SEM samples were built up from several 20 fold macnification BSE images. The main minerals were identified using energydispersive X-ray microanalysis (EDS). The samples were coated with carbon. Magnifications of up to 2000x were used to reveal apertures down to 500 nm in size. The contrast between the pore space and solid rock was found to be enhanced by the MMA impregnant.
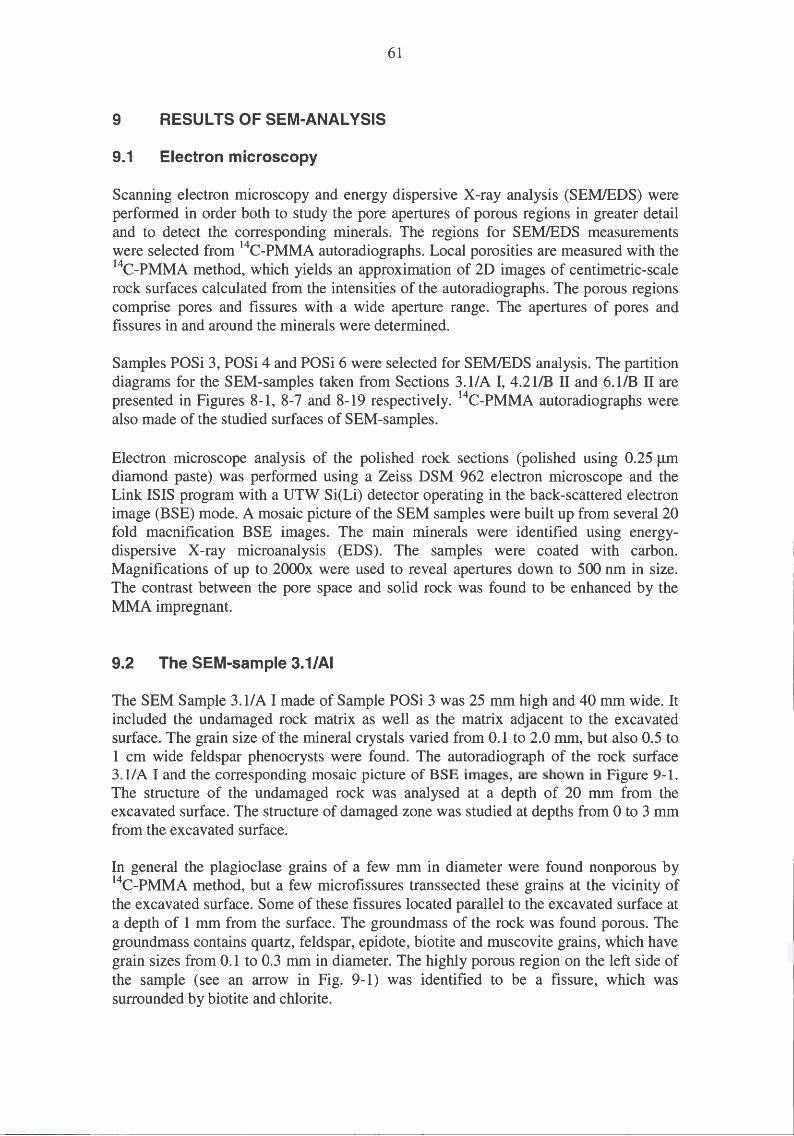
9.2 The SEM-sample 3.1/AI
The SEM Sample 3.1/A I made of Sample POSi 3 was 25 mm high and 40 mm wide. It included the undamaged rock matrix as well as the matrix adjacent to the excavated surface. The grain size of the mineral crystals varied from 0.1 to 2.0 mm, but also 0.5 to 1 cm wide feldspar phenocrysts were found. The autoradiograph of the rock surface 3.11 A I and the corresponding mosaic picture of BSE images, are shown in Figure 9-1. The structure of the undamaged rock was analysed at a depth of 20 mm from the excavated surface. The structure of damaged zone was studied at depths from 0 to 3 mm from the excavated surface.
In general the plagioclase grains of a few mm in diameter were found nonporous by 14C-PMMA method, but a few microfissures transsected these grains at the vicinity of the excavated surface. Some of these fissures located parallel to the excavated surface at a depth of 1 mm from the surface. The groundmass of the rock was found porous. The groundmass contains quartz, feldspar, epidote, biotite and muscovite grains, which have grain sizes from 0.1 to 0.3 mm in diameter. The highly porous region on the left side of the sample (see an arrow in Fig. 9-1) was identified to be a fissure, which was surrounded by biotite and chlorite.

62
Figure 9-1. Autoradiograph (top) of SEM sample 3.1/A I and corresponding BSE image (above).
The damaged zone was analysed first by scanning electron microscope. The backscattered electron (BSE) images acquired at 1 OOx and 200x magnifications are shown in Figure 9-2. On the left image in Figure 9-2 a quartz grain, which is located adjacent to the excavated surface, is heavily crushed and grain boundaries around a biotite grain are opened. On the right image in Figure 9-2 plenty of micro fissures are found adjacent to

63
the excavated surface and a biotiote grain is crushed. A fracture of around 40 J...Lm wide aperture transsects the groundmass at a depth of 0.5 mm from the excavated surface. The crushed minerals extended to depths of 0.5-1 mm from the surface.
The BSE images of the damaged zone at a depth of approximately 2 mm from the excavated surface acquired at 200x and 500x magnifications are shown in Figure 9-3. A quartz grain is fractured (Fig. 9-3, left) and the grain boundaries between quartz and feldspar grains are opened (Fig. 9-3, right). Potassium feldspar is located as a narrow band between plagioclase and quartz grains.
Figure 9-2. BSE image of crushed quartz grain. Magnification JOOx (left). BSE image of a fracture transsecting groundmass at a depth of 0.5 mm from the damaged surface. Magnification 200x (right). Q=quartz, Bi=biotite, Ap=apatite Q=quartz, Pl=plagioclase, Bi=biotite and Kfs=potassium feldspar.
Figure 9-3. BSE image of fractured quartz grain at a depth of 2 mm from excavated surface. Magnification 200x (left). Plagioclase and quartz grains at a depth of 0.5 mm from surface. Potassium feldspar is located between these grains. Magnification 500x. Q=quartz, Pl=plagioclase and Kfs=potassium feldspar.

64
The BSE image showing an overwiev from the excavated surface to a depth of around 0.5 mm is shown in Figure 9-4. The BSE images of crushed epidote and biotite grains are shown in Figure 9-5. The images are acquired at 500x and lOOOx magnifications at a depth of 0.5 mm from the excavated surface. A biotite grain is strongly damaged on the left image and opened lamellaes are found. The apertures of fractures are around 1 to 5 J.Lm in the crushed epidote grain that is shown on the right image. Grain boundaries between epidote and biotite mineral grains are opened.
Figure 9-4. BSE image at a depth of around 0.5 mm fro excavated surface. Magnification JOOx. Bi=biotite, Ep=epidote and Q=quartz.
Figure 9-5. BSE images of an epidote grain at a depth of 0.5 mm from the damaged surface. Magnifications 500x and 1 OOOx. Bi=biotite and Ep=epidote.

65
The BSE image showing an overwiev at a depth of 20 mm from the excavated surface representing the undamaged rock is shown in Figure 9-6. In the undamaged rock matrix, the dark areas in the autoradiograph contained fine grained feldspars, quartz and mafic minerals. No opened grain boundaries are not found, but plenty of intrafissures are observed in the quartz grain.
The BSE images acquired at 200x and 1 OOOx magnification are shown in Figure 9-7. Plagioclase and quartz grains are shown on the left image. The structures of quartz grains at a depth of 2 mm and at a depth of 20 mm from the excavated surface are quite similar, there are plenty of intrafissures in the grains, but the openings of pores and microfractures are are significantly smaller than in grains adjacent to the surface. An epidote grain at a depth of 20 mm from the excavated surface is shown on the right image. No observations of intrafissures or fractures are found.
Figure 9-6. BSE image of feldspar and quartz grains at a depth of 20 mm from excavated surface. Magnification 50x.
Figure 9-7. BSE image of quartz and plagioclase grains at a depth of 20 mm from excavated surface. Magnification 200x (left). BSE image of epidote grain at a depth of 20 mm from excavated surface. Magnification JOOOx (right). Ep=epidote, Q=quartz, Pl=plagioclase.
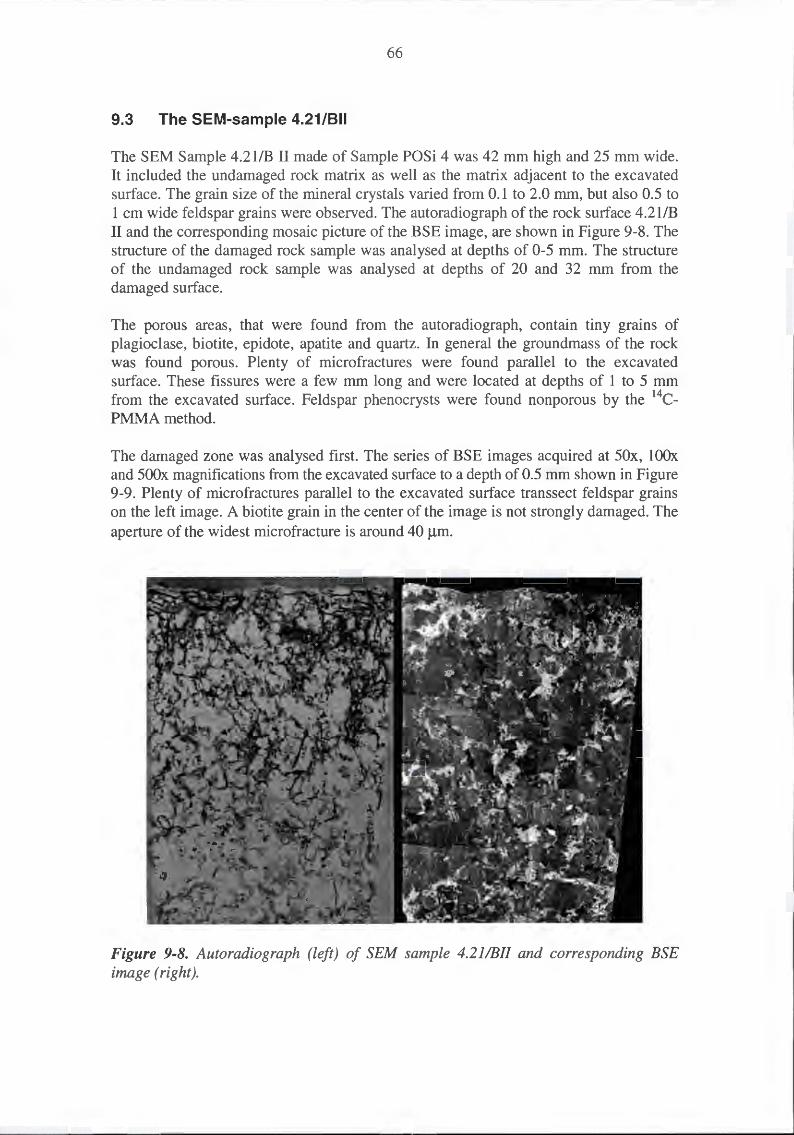
66
9.3 The SEM-sample 4.21/811
The SEM Sample 4.21/B II made of Sample POSi 4 was 42 mm high and 25 mm wide. It included the undamaged rock matrix as well as the matrix adjacent to the excavated surface. The grain size of the mineral crystals varied from 0.1 to 2.0 mm, but also 0.5 to 1 cm wide feldspar grains were observed. The autoradiograph of the rock surface 4.21/B II and the corresponding mosaic picture of the BSE image, are shown in Figure 9-8. The structure of the damaged rock sample was analysed at depths of 0-5 mm. The structure of the undamaged rock sample was analysed at depths of 20 and 32 mm from the damaged surface.
The porous areas, that were found from the autoradiograph, contain tiny grains of plagioclase, biotite, epidote, apatite and quartz. In general the groundmass of the rock was found porous. Plenty of microfractures were found parallel to the excavated surface. These fissures were a few mm long and were located at depths of 1 to 5 mm from the excavated surface. Feldspar phenocrysts were found nonporous by the 14CPMMA method.
The damaged zone was analysed first. The series of BSE images acquired at 50x, 100x and 500x magnifications from the excavated surface to a depth of 0.5 mm shown in Figure 9-9. Plenty of micro fractures parallel to the excavated surface transsect feldspar grains on the left image. A biotite grain in the center of the image is not strong! y damaged. The aperture of the widest micro fracture is around 40 J..Lm.
Figure 9-8. Autoradiograph (left) of SEM sample 4.21/B/1 and corresponding BSE image (right).

67
The BSE image of feldspar grain acquired at 1 OOx magnification at a depth of 1 mm from the excavated surface is shown in Figure 9-10. Again the aperture of the microfracture is a few tens of micrometers and the mircrofracture is located parallel to the excavated surface.
The two BSE images acquired at 500x magnification are shown in Figure 9-11. The plagioclase and biotite grains are analysed at a depth of 3 mm from the excavated surface. The apertures of microfissures found in the feldspar grain are below 5 J..Lm. An intrafissure transsects the biotite grain (see an arrow in the Fig. 9-11, right) and the grain boundaries are slightly opened at this depth.
Figure 9-9. BSE images ofmicrofractures at a depth of0.5 mm from excavated surface. Magnifications 50x, 100x and 500x.
Figure 9-10. BSE image of microfracture at a depth of 1 mm from excavated surface. Magnification 1 OOx.

68
The BSE image acquired at 500x magnification is shown in Figure 9-12. An apatite grain at a depth of 2 mm from the excavated surface is crushed. Intra- and intergranular fissures are found.
A series of BSE images acquired at 50x, 200x and 500x magnifications are shown in Figure 9-13. A quartz grain is crushed; plenty of intrafissures are observed. One microfissure having an aperture below 5 Jlm is located between the quartz and feldspar grains transsecting the feldspar grains.
Figure 9-11. BSE image of quartz grain at a depth of 3 mm from excavated surface. Magnification 200x.
Figure 9-12. BSE image of apatite grain at a depth of 2 mm from excavated surface. 500-fold magnification.

69
The undamaged rock was studied at depths of 20 and 32 mm from the excavated surface. The BSE images acquired at 20x (left) and 200x (right) magnifications are shown in Figure 9-14. The left image gives an overwiev at a depth of 20 mm from the excavated surface where the grain boundaries between feldspar and mafic mineral grains are not opened as seen on the close-up (right image).
The BSE images acquired at 100x and 200x magnifications are shown in Figure 9-15. Plenty of intragranular microfissures transsect the quartz grain at a depth of 32 mm from the excavated surface, whileas the grain boundaries between feldspar and mafic minerals and quartz grains are not opened. Quartz grains are found porous in the autoradiograph at this depth. The grainboundaries of biotite grains are not opened.
Figure 9-13. BSE image of quartz and feldspar grains at a depth of 3 mm from excavated surface. Magnifications 50x, 200x and 500x.
Figure 9-14. BSE image of feldspars, mafic minerals and quartz at a depth of 20 mm from the surface. Magnifications of 20x and 200x.

70
The BSE image acquired at 200x magnification is shown in Figure 9-16. An apatite grain at a depth of 32 mm from the excavated surface is not fractured.
Figure 9-15. BSE image of quartz, mafic mineral grains and apatite at a depth of 32 mm from excavated surface. Magnifications 1 OOx and 200x .
~ - . - :. : .. . I
•• ,•, a•
Figure 9-16. BSE image of apatite grain at a depth of 32 mm from excavated surface. 200-fold magnification.

71
9.4 Sample SEM-sample 6.1/811
The SEM Sample 6.1/B 11 made of Sample POSi 6 was 25 mm high and 43 mm wide. Only the damaged rock section was studied in this sample. The grain size of the mineral crystals varied from 0.1 to 2.0 mm, but also 0.5 to 1 cm wide feldspar grains were observed. The autoradiograph of the SEM sample 6.1/B 11 and the corresponding mosaic picture of BSE images, are shown in Figure 9-17.
The porous areas, that were found from the autoradiograph, contain tiny grains of plagioclase, biotite, epidote, apatite and quartz. This groundmass of the rock was found porous. A few of microfractures were found mainly parallel to the excavated surface. These fissures were a few mm long and were located at depths of 1 to 2 mm from the excavated surface. A few feldspar phenocrysts were found nonporous with the PMMA method.
The BSE images acquired at 50x and 200x magnifications adjacent to the excavated surface and close to it are shown in Figure 9-18. An overwiev of plagioclase, biotite, epidote and quartz grains is presented on the left image. Microfissures penetrate at maximum to a depth of 0.5 mm from the excavated surface. A microfissure transsect the groundmass on the right image.
The BSE images acquired at 500x magnifications are shown in Figure 9-19. A closer look at a depth of 0.5 mm from the excavated surface reveals plenty of intragranular fissures in feldspar, biotite and epidote grains. The apertures of the fissures varied from a few to 20 micrometers.

--------- ------------------------- - - -- -- -
72
Figure 9-17. Autoradiograph (top) of SEM sample 6.1/B //and corresponding BSE image (above).

73
Figure 9-18. BSE images of plagioclase, biotite, epidote and quartz grains. Magnifications of 50x and 200x.
Figure 9-19. BSE image of plagioclase, biotite and epidote grains at a depth of 0.5 mm from excavated surface. Magnifications of 500x.
The BSE images acquired at 20x and 50x magnifications are shown in Figure 9-20. An overwiev shows clearly numerous intrafissures in plagioclase and quartz grains. They are located parallel to the excavated surface at depths of 0.1 to 1 mm from the surface.
The BSE images acquired at 100x and 200x magnifications are shown in Figure 9-21. The plagioclase grain adjacent to the damaged surface is fractured. The fractures transsect the grain mainly parallel to the damaged surface. Some of the microfractures have apertures of over ten micrometers.
The BSE images acquired at 1 OOx, 200x and 500x magnifications are shown in Figure 9-22. A series of BSE images shows a crushed quartz grain. The fractures are located mainly parallel to the damaged surface and many of them are branched.

74
Figure 9-20. BSE image of quartz and plagioclase grains adjacent to excavated surface. Magnifications 20x and 50x.
Figure 9-21. BSE image of plagioclase grain adjacent to the surface. Magnifications of JOOx and 200x.
Figure 9-22. BSE image of quartz grain adjacent to excavated surface. Magnifications JOOx, 200x and 500x.

75
The BSE image acquired at 50x is shown in Figure 9-23. It is taken at a depth of 8 mm from the excavated surface showing an overwiev of groundmass.
The BSE images acquired at 200x and 500x magnifications are shown in Figure 9-24 giving a closer look at apatite and biotite grains at a depth of 8 mm. A distinct microfracture is penetrating through the biotite grain, but the grain boundaries of different minerals are not opened.
Figure 9-23. BSE image of quartz, apatite, plagioclase and biotite grains at a depth of 8 mm from excavated surface. Magnification 50x.
Figure 9-24. BSE image of biotite grain at a depth of 8 mm from excavated surface. Magnifications 500x.

76

77
10 ANALYSIS OF RESULTS, CONCLUSIONS AND DISCUSSION
The rock samples from the TBM tunnel were of different types of rock. Samples 5, 6 and 7 were similar in appearance and texture and Sample 3 was closer to these than Sample 4, which was clearly different as can be seen in Figures 6-4, 6-5 and 6-6. Based on modal analysis, Sample 3 was defined as slightly foliated porphyritic tonalite, Sample 4 was specified as quartz-monzonite and Sample 6 as slightly foliated quartzmonzodiorite.
The porosity profiles of the samples and the porosity of the undisturbed rock were similar in all samples as seen in Figure 10-1 in spite of the rock composition being different.
The average thickness of the damaged zone defined as the zone of increased porosity is about 20 mm as seen in Figure 10-2. The porfyritic structure of rock samples, large single low porosity phenocrysts in higher porosity groundmass, causes a lot of variation in the profiles and therefore causes uncertainty in the depth of the damaged zone. According to the porosity profile shown in Figure 10-3 it is possible that the thickest 31 mm disturbed zone is found in Sample 7.1 and the thinnest zone 17 mm in Samples 3.1 and 5.21.
1,00
- 0,60 -l--\11--------------------------- -+- Posi 3.1 ~ --Posi 4.21
-A- Posi 5.21
-*- Posi 6.1
- .-Posi 7.1
0,00 +-----,-----,----,.---,.---,-----,-----,-----,------,
0,00 5,00 10,00 15,00 20,00 25,00 30,00 35,00 40,00 45,00
Distance (mm)
Figure 10-1. Graph showing the porosity in the rock with respect to distance from the surface of the tunnel into the rock.

0,80
0,70 •
0,60
0,50 \
0,40
0,30
0,20
0,10
0,00
0,00
\ ~
5,00
78
IY = -o,09;8Ln(x) + 0,51 351 A = 0,9109
~ • • • ...
• ...... ..........___ . .. . . ... • • -
10,00 15,00 20,00 25,00 30,00 35,00 40,00 45,00
Distance (mm)
Figure 10-2. Graph showing all porosity values with respect to distance from the surface of the tunnel into the rock and a logarithmic trendline.
0,80
0,70
0,60
0,50
-+-Posi 3.1
--Posi 4.21
-.. • --- Posi 5.21
~ 0
~ 'i
-*- Posi 6.1
-.- Posi 7.1
e 0 0,30 a.
0,20
0,10
0,00
0, 0 5,00 40,00
-0,10
Distance (mm)
Figure 10-3. Graph showing the additional porosity in the rock caused by TBM-boring (i.e. the actual porosity minus the porosity of intact rock) with respect to distance from the surface of the tunnel into the rock.

79
The quantity of additional pore space per unit area of surface (V d) caused by disturbance during excavation was calculated by integrating the measured additional porosity over the measured length of the disturbed zone. When looking at the porosity of intact rock it should be noted that the porosities measured by 14C-PMMA method were found to be lower than those determined by water immersion method. Similar results have also been found in other studies (Autio et al. 1999). The porosity of the undisturbed rock Samples 4 and 5 was determined also by water immersion method for comparison. The porosities of Samples 4 and 5 determined by water immersion technique were 0.5% and 0.6% respectively, being clearly higher than the corresponding porosity 0.2% for both samples determined by 14C-PMMA method. The intergration of porosity yields the area A" shown in Figure 10-4 and hence the additional pore volume V d expressed as the volume of the additional porosity per one unit area of the tunnel surface.
The calculated additional pore volume V d in samples shown in Table 10-1 ranged from 18 cm3 1m2
( in other words 18 ml more pore space than in intact rock per one square meter of tunnel surface) in Sample 5.2 to 37 cm31m2 in Sample 7.1, with the average value being 26 cm3 1m2
•
According to the results there is no significant difference in the additional pore volume between the studied tunnel sections and different positions in the section as seen in Figure 10-5. The average additional pore space in the samples from Section 3 598 m is slightly smaller (23 cm31m2
) than the average of the additional pore space in the samples from Section 3 472 m (26 cm31m2
). The large variation in all results (Vd 18-37 cm31m2)
is evidently caused partly by the variation of the structure between the samples, porphyric structure and sporadic contact of excavation tool and rock surface.
Table 10-1. Additional pore volume, Vd, resulting from TBM-excavation.
Sample Section 3 598 m 3.1 4.2 Average
Section 3 4 72 m 5.2 6.1 7.1 Average
Total average
20 27 23
18 22 37 26
26

80
1.60
1.40
1.20
~ 1.00
~ A" V) 0.80
~ ~ 0.60
0.40
0.20 h
0.00 c::l 11) c::l 11) c::l ~ c::l 11) c::l ~ c::l 11) c::l ~
c::l 11) c::l ~ c::l 11) c::l c::l "' 11) C'4 c::l 11) C'4 c::l 11) C'4 c::l 11) C'4 c::l 11) C'4 c::l
c:i c:i ..: c.; eo; eo; ~ "' tO tO ....: clli oi oi ~ :::: ti ti ti ~ ~
Distance, mm
Figure 10-4. The calculation of the volume in principle. In this example the area A" is integrated from porosity profiles to obtain the average additional pore volume Vd over the damaged zone to h. In this study h was about 30 mm and the distance range used to calculate A" and Vd was from 0 to 30 mm.
0,80
• 0,70
0,60
0,50
0,40
0,30
0,20
0,10
0,00
0,00 5,00
y = ·0,0873Ln(x) + 0,4943
R2 = 0,7926
10,00 15,00 20,00 25,00
Distance (mm)
• Samples Posi 3 .1 and 4.21
• Samples Posi 5 .21 , 6.1 and 7.1
- (Samples Posi 3.1 and 4.21)
- (Samples Posi 5.21, 6.1 and 7.1)
y = -0,1047Ln(x) + 0,5271
R2 =0,8999
30,00 35,00
•
40,00 45,00
Figure 10-5. Porosities in Section 3 598 m (Sample POSi 3 and 4) and Section 3 472 m (Samples 5, 6 and 7) with respect to distance from the surface of the tunnel into the rock. Logarithmic curve fits are also shown.
The structure of the damage caused by TBM-boring is governed by the structure of the rock samples which is composed of large porphyric phenocrysts (plagioclase and potassium feldspar) and fine grained groundmass (plagioclase, biotite, epidote, apatite and quartz). A typical for these rocks and an uncommon feature to many other similar

81
rocks is that quartz grains exhibit a lot of intragranular fracturing at all distances from the damaged zone. The large porphyric phenocrysts are less deformable than the fine grained groundmass between them and therefore most of the damage, microfracturing and increase in porosity occurs in the groundmass. The porosity of the groundmass is clearly higher than in porphyric phenocrysts also in the undisturbed rock which in some cases seem to be almost non-porous.
The damaged zone is not continuous. There are spots adjacent to the damaged surface in samples where there seem to be practically no damage whereas some spots exhibit severe damage. This is evidently caused by the sporadic tool - rock contact. Therefore, and also because of the small number of samples and heterogeneity in and between the samples, the maximum extent of the damage is a very rough estimate.
The damage can be divided roughly to three different zones as shown below.
1. The first zone, the crushed zone, which extends from the excavated surface to a maximum depth of about 3 mm, is the zone of parallel fracturing. Two different types of dominant fracture pattern were identified. Open transsecting fracturing with apertures of tens of micrometers parallel to the excavated surface and fracturing perpendicular or diagonal to the surface (see Figs. 10-6, 10-7 and 10-8). Porosities in this zone range from 0.4 to 1.0% and are two five times higher than the porosity of the undisturbed rock matrix, which was found to be between 0.15 and 0.22% in the rock samples. A lot of mineral grains have been fractured, grain boundaries are open and fractures of varying orientation transsecting several mineral grains are running from the excavated surface into the zone and through it to the next zone. There is clearly more fracturing in groundmass than in porphyric phenocrysts and a lot of the intragranular fracturing in quartz is open. The porosity of the crushed zone is clearly higher than in the rest of the rock and some of the apatite and epidote grains are intensively fractured in addition to feldspars and quartz grains.
2. The fractured zone extends from the crushed zone to a maximum depth of about 10 mm. Porosities in this zone range from 0.25 to 0.4% and are at maximum two times higher than the porosity of the undisturbed rock matrix. The fracturing is clearly less intense than in the crushed zone and transsecting fractures are sparse. There appears to be no or very little fracturing running parallel to the excavated surface. Most of the fracturing is running perpendicularly or diagonally to the excavated surface. Most of the fracturing occurs at ground mass and grain boundaries. Porphyritic phenocrysts are mainly unfractured. Epidote and apatite grains are main! y unfractured.
3. Zone of grainboundary fracturing and increased porosity extends from the fractured zone to a depth of 15-35 mm. Porosity of the zone is close to that of intact rock. In general the fracturing is sparse and occurs mainly at grain boundaries and the intragranular fracturing found in quartz is tight. All other mineral grains except quartz are practically unfractured. At the end of the zone of even before it the porosity of rock drops down to the porosity of undisturbed rock, since most of the sparse fracturing is tight and doesn't affect the porosity

82
significantly. Most of the grain boundaries are tight at the distance of 30 mm from the excavated surface.
Figure 10-6. Different types of fractures and typical features shown in autoradiograph of rock surface in Sample POSi 4 and corresponding photograph, A: parallel fracturing, B: diagonal fracturing. Sample width is about 90 mm. Sample was taken from Section 3598 m in the TBM-tunnel. The section is perpendicular to the tunnel axis (and tunnel wall). The tunnel surface is on the top.

83
Crushed zone
Figure 10-7. The crushed, fractured and increased porosity zone and different types of fractures and typical features shown in autoradiograph of rock surface in Sample POSi 6 and corresponding photograph, A: parallel fracturing, B: diagonal fracturing. Sample width is about about 90 mm. Sample was taken from Section 3 472 m in the TBM-tunnel. The section is perpendicular to the tunnel axis (and tunnel wall). The tunnel surface is on the top.

84
Figure 10-8. Different types of fractures and typical features shown in auto radiograph of rock surface in Sample POSi 5 and corresponding photograph, A: parallel fracturing, B: diagonal fracturing. Sample width is about 90 mm. Sample was taken from Section 3 472 m in the TBM-tunnel. The section is perpendicular to the tunnel axis (and tunnel wall). The tunnel surface is on the top.

85
11 REFERENCES
Autio, J. 1996. Characterization of the excavation disturbance caused by boring of the experimental full scale deposition holes at TVO-Research Tunnel. Helsinki, Finland: Posiva Oy. POSIV A report -96-09 (and similar report in SKB"s series: SKB TR-97-24).
Autio, J., Aikas, K. & Kirkkomaki, T. 1996. Coring and description of the samples from the full scale experimental deposition holes and from the walls of the research tunnel at Olkiluoto. Posiva Oy, Work report TEKA-96-05e. Helsinki, Finland. 46 p. (similar report in SKB's series: Progress Report HRL-97-11)
Autio, J. & Siitari-Kauppi, M. 1997. Determination of the structure and porosity of rock in the disturbed zone around experimental full scale deposition holes using the 14CPMMA METHOD. In: Scientific Basis for Nuclear Waste Management XXI, edited by I.G. McKinley&C. McCombie. Mater.Res.Soc.Proc 506, Warrendale, PA,1997. pp. 597-604.
Autio, J., Kirkkomaki, T., Siitari-Kauppi, M., Laajalahti, M., Aaltonen, T. & Maaranen, J. 1999. Use of the 14C-PMMA and He-gas methods to characterise excavation disturbance in crystalline rock. Helsinki, Finland: Posiva Oy. POSIV A report 99-22. (and similar report in SKB"s series: SKB IPR-99-18)
Backblom, G. (ed). 1994. Internation workshop on the use of tunnel boring machines for deep repositories. Stockholm, Sweden: Swedish nuclear fuel and waste management Co. International Cooperation Report 94-10.
Dahlstrom, L-0. 2000. In Prototype repository-Project group meeting PGM2000-4, 15.6 2001 at Aspo, Minutes of the meeting, Appendix 2.
Daniels, F. & Alberty, R. A. 1967. Physical Chemistry, 3rd Ed. John Wiley & Sons, Inc., New York. p. 384 (767).
Detournay, E. & St. John, C. M. 1988. Design charts for a deep circular tunnel under non-uniform loading. Rock Mech. and Rock Engin., 21 (2), pp. 119- 137.
Didriksson, V. 1997. Extension of ZED EX drift (in swedish). Stockholm, Sweden: Swedish nuclear fuel and waste management Co, SKB. Technical Report NR TD-97-04. 13 p.
Emsley, S., Olsson, 0., Stenberg, L., Alheid, H-J. & Falls, S. 1997. ZEDEX- A study of damage and disturbance from tunnel excavation by blasting and tunnel boring. Stockholm, Sweden: Swedish nuclear fuel and waste management Co, SKB. Technical Report 97-30. 198 p.
Hammarstrom, M. & Olsson, 0 (eds). 1996. Aspo Hard Rock Laboratory, 10 Years of Research. Stockholm, Sweden: Swedish nuclear fuel and waste management Co, SKB.

86
Hellmuth, K. H., Siitari-Kauppi, M. & Lindberg, A. 1993. Study of Porosity and Migration Pathways in Crystalline Rock by Impregnation with 14Cpolymethylmethacrylate. Journal of Contaminant Hydrology, 13, pp. 403-418.
Hellmuth, K. H., Lukkarinen, S. & Siitari-Kauppi, M. 1994. Rock Matrix Studies with Carbon-14-Polymethylmethacrylate (PMMA); Method Development and Applications. Isotopenpraxis Environ. Health Stud., 30, pp. 47-60.
Hellmuth, K-H., Siitari-Kauppi, M., Klobes, P., Meyer, K. & Goebbels, J. 1999. Imaging and analyzing rock porosity by autoradiography and Hg-porosimetry/X-ray computertomography-applications, Phys. Chem. Earth (A), Vol. 24, No. 7, 569-573.
Howarth, D. F. & Bridge, E. J. 1988. Technical Note, Microfracture Beneath Blunt Disc Cutters in Rock. In: Hudson J A (ed), 1988. International Journal of Rock Mechanics and Mining Sciences & Geomechanics Abstracts. London, UK: Pergamon Press. pp. 35-38.
Kivekas, L. 1998. Porosity and density determinations of rock samples from TBMtunnel of Aspo rock laboratory. Espoo, Finland: Geological Survey of Finland. 20.2.1998. 9 p.
Kou, S. & Tan, X. 1997. Modelling of excavation depth and fractures in rock caused by tool indentation. Stockholm, Sweden: Swedish nuclear fuel and waste management Co, SKB. SKB report R-99-11.
Leonard, E. C. 1978. Vinyl and Diene Monomers, Part 1, A series of Monographs on the Chemistry, Physics, and Technology of High Polymeric Substances, Vol. XXIV, p. 157.
Lindqvist, P-A., Suarez del Rio, L. M., Montoto, M., Tan Xiangchun & Kou Shaoquan. 1994. Rock indentation database-testing procedures, results and main conclusions. Stockholm, Sweden: Swedish nuclear fuel and waste management Co, SKB. Project report PR 44-94-023.
Lindqvist, P-A. & Ranman, K-E. 1980. Mechanical rock fragmentation: chipping under a disc cutter. Lulea, Sweden: Lulea University of Technology. Tekniska rapport 1980:59.
Lislerud, A. 1997. Principles of Mechanical Excavation. Helsinki, Finland: Posiva Oy. Report POSIV A 97-12. 230 p.
Markstrom, I. & Erlstrom, M. 1996. Aspo Hard Rock Laboratory. Overview of documentation of tunnel, niches and core boreholes. Stockholm, Sweden: Swedish nuclear fuel and waste management Co, SKB. Progress Report HRL-96-19.
Nordlund, E., Chunlin, L. & Carlsson, B. 1999. Aspo Hard Rock Laboratory. Mechanical properties of the diorite in the prototype repository at Aspo HRL,

;---------------------~------------~------· -- -
87
Laboratory tests. Stockholm, Sweden: Swedish nuclear fuel and waste management Co, SKB. International Progress Report IPR-99-25. 21 p.
Pusch, R. 1996. Boring-induced Disturbance of Granitic Rock. Stockholm, Sweden: Swedish nuclear fuel and waste management Co, SKB. Djupforvar, Arbetsrapport: AR D-97-05
Read, R. S. 1996. Characterizing excavation damage in higly stressed granite at AECL"s Underground Research Laboratory. In: Martino, Martin (eds.). Designing the EDZ for a Nuclear Repository in Hard Rock, Proc. of an EDZ Workshop. Winnipeg MB. pp. 35-46.
Rhen, I. (ed), Gustafson, G., Stanfors, R. & Wikberg, P. 1997. ASPO HRL -Geoscientific evaluation 1997/5. Models based on site characterization 1986- 1995. Stockholm, Sweden: Swedish nuclear fuel and waste management Co, SKB. Technical report 97-06.
Siitari-Kauppi, M. 1995. Investigation of Porosity and Microfracturing in a Disturbed Zone with the 14C-PMMA Method Based on Samples from Full-Scale Experimental Deposition Holes of the TVO Research Tunnel. Nuclear Waste Commission of Finnish Power Companies, Report YJT-95-13 & Arbets Rapport AR D-96-001.
Siitari-Kauppi, M. & Autio, J. 1997. Investigation of rock porosity and microfracturing with 14C-PMMA method. Samples cored from the full-scale experimental deposition holes bored in the Research Tunnel at Olkiluoto. Helsinki, Finland: Posiva Oy. Working Report 97-53e. 85 p.
Stenberg, L. & Gunnarsson, D. 1998. Aspo Hard Rock Laboratory. Characterisation of the ZED EX drift in advance of the backfill and plug test. Stockholm, Sweden: Swedish nuclear fuel and waste management Co, SKB. Progress report HRL-98-10. 38 p.
Stille, H. & Olsson, P. 1989. First evaluation of rock mechanics. Stockholm, Sweden: Swedish nuclear fuel and waste management Co, SKB. PR 25-89-07.
Stille, H. & Olsson, P. 1996. Summary of rock mechanical results from the construction of Aspo Hard Rock Laboratory. Stockholm, Sweden: Swedish nuclear fuel and waste management Co, SKB. PR HRL-96-07
Tan Xiangchun, 1996. Modelling of drill string buckling and tool indentation in rock drilling and fragmentation. Lulea, Sweden: Lulea University. Ph. D thesis, 1996:197D.

88

89
12 APPENDICES
1 Autoradiographs of the Sample Posi 3.1 2 Autoradiographs of the Sample Posi 4.21 3 Autoradiographs of the Sample Posi 5.21 4 Autoradiographs of the Sample Posi 6.1 5 Autoradiographs of the Sample Posi 7.1

----------------------------~- ~--~ ~-- - - -
90
APPENDIX 1
35mm
3.1/A la 3.1/B lb 3.1/B lib The tunnel surface is on the left in the above images.
3.11/A 11 at a depth of 5 mm from tunnel surface
3.13./ A 11 at a depth of 27 mm from tunnel surface
45mm
3.12/A 11 at a depth of 16 mm from tunnel surface
3.14/A 11 at a depth of 29 mm from tunnel surface
Autoradiographs of sample 3 .1. Surfaces according to partition diagram in Figure 6-6.

91
APPENDIX2
44mm
4.21/A lb 4.21/B lb 4.21/B lib
The tunnel surface is on the left in the above images.
42.11/A 11 at a depth of 9 mm from 42.12/A 11 at a depth of 18 mm tunnel tunnel surface from tunnel surface
42.13/A 11 at a depth of 24 mm from tunnel surface
42.14A I 11 at a depth of 26 mm from tunnel surface
Autoradiographs of sample 42.1. Surfaces according to partition diagram in Figure 6-7.

92
APPENDIX3
41 mm
52.1/A Ila 52.1/A lib 52.1/B lib
The tunnel surface is on the left in the above images.
52.11/A I at a depth of 5 mm from 52.12/A I at a depth of 15 mm from tunnel surface tunnel surface
52.13/A I at a depth of 22 mm from tunnel surface
52.14/A I at a depth of 24 mm from tunnels surface
Autoradiographs of sample 52.1. Surfaces according to partition diagram in Figure 6-8.
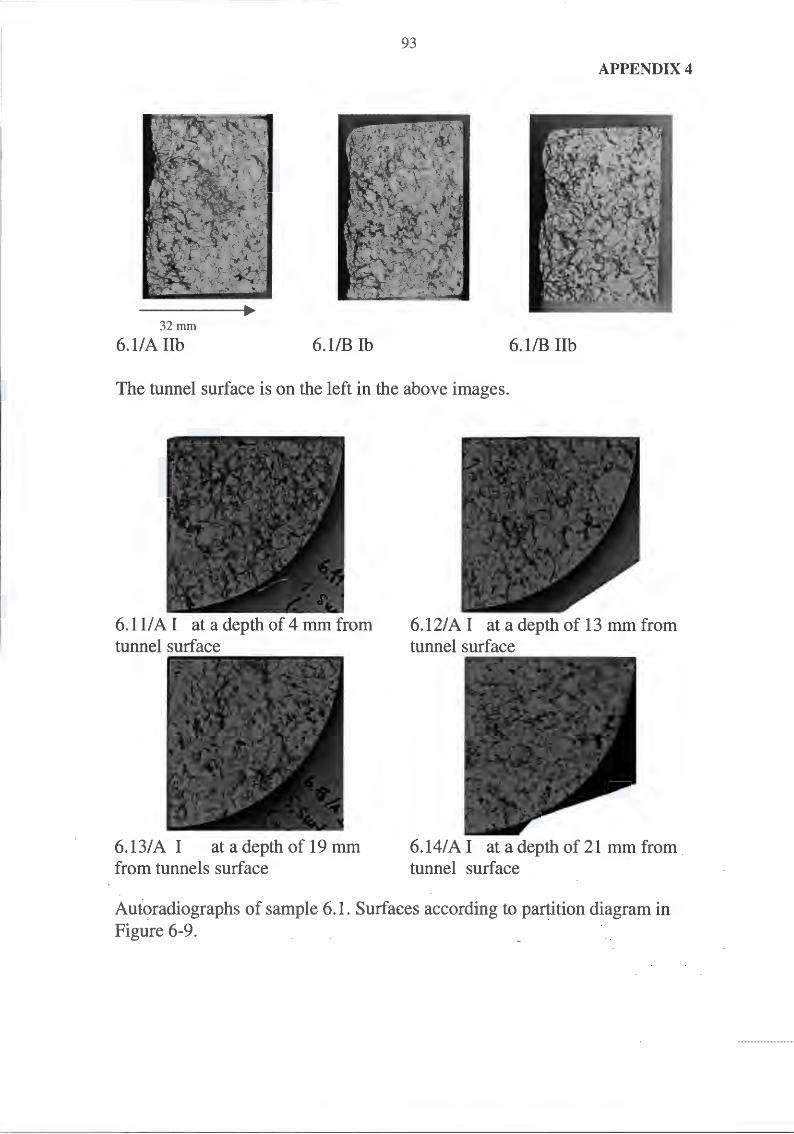
93
APPENDIX4
32mm
6.1/A lib 6.1/B Ib 6.1/B lib
The tunnel surface is on the left in the above images.
6.11/A I at a depth of 4 mm from tunnel surface
6.13/A I at a depth of 19 mm from tunnels surface
6.12/A I at a depth of 13 mm from tunnel surface
6.14/A I at a depth of 21 mm from tunnel surface
Autoradiographs of sample 6.1. Surfaces according to partition diagram in Figure 6-9.

40mm
7.1/A la 7.1/A lb
94
APPENDIXS
7.1/B lib
The tunnel surface is on the left in the above images.
7.11/A 11 at a depth of 5 mm from tunnel surface
7.13/A 11 at a depth of 24 mm from tunnel surface
7.12/A 11 at a depth of 14 mm from tunnel surface
7.14/A 11 at a depth of 26 mm from tunnels surface
Autoradiographs of sample 7 .1. Surfaces according to partition diagram in Figure 6-10.