study of sofc operational behavior by applying in-situ ... · study of sofc operational behavior by...
TRANSCRIPT
2010 Fuel Cell Seminar, October 18 - 21, 2010, San Antonio, TX, USA
StudyStudy of SOFC Operational of SOFC Operational BehaviorBehavior byby ApplyingApplyingInIn--SituSitu DiagnosticDiagnostic MethodsMethods
Günter Schiller, Wolfgang Bessler, Caroline Willich, K. Andreas Friedrich
Deutsches Zentrum für Luft- und Raumfahrt, Institut für Technische ThermodynamikPfaffenwaldring 38-40, D-70569 Stuttgart
2010 Fuel Cell Seminar, October 18 – 21, 2010, San Antonio, TX, USA
2010 Fuel Cell Seminar, October 18 - 21, 2010, San Antonio, TX, USA
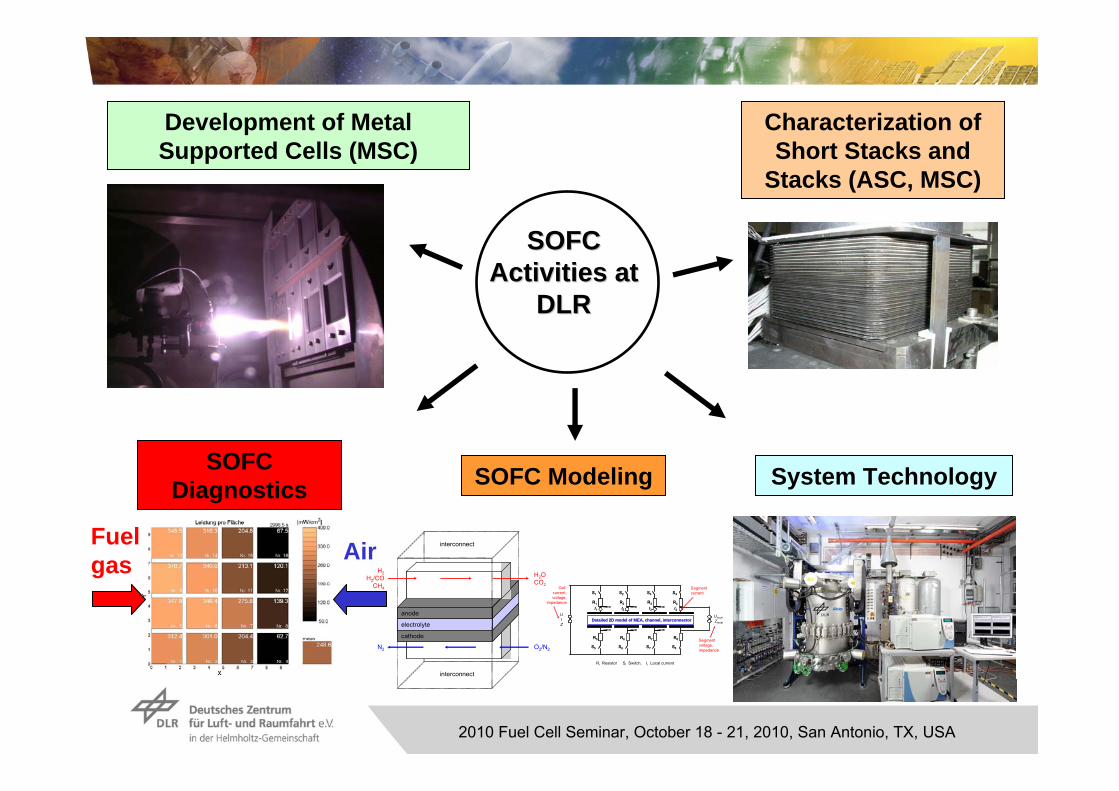
SOFC SOFC Activities at Activities at
DLRDLR
Characterization of Short Stacks and
Stacks (ASC, MSC)
Development of Metal Supported Cells (MSC)
System TechnologySOFC Diagnostics
Fuelgas Air
SOFC Modeling
H2H2/CO
CH4
H2OCO2
anode
electrolyte
cathode
O2/N2N2
interconnect
interconnect
Ri Resistor Si Switch, Ii Local current
Segmentvoltage,impedance
UlocalZlocal
Segmentcurrent
UIZ
Detailed 2D model of MEA, channel, interconnector
R1 R3 R4R2
R5 R7 R8R6
S1 S3 S4S2
S5 S7 S8S6
I4I3I2I1
Detailed 2D model of MEA, channel, interconnector
R1 R3 R4R2
R5 R7 R8R6
S1 S3 S4S2
S5 S7 S8S6
I4I3I2I1
Cell current,voltage,
impedance
2010 Fuel Cell Seminar, October 18 - 21, 2010, San Antonio, TX, USA
Investigation of Degradation and Investigation of Degradation and CellCell FailuresFailures
•• Insufficient understanding of cell degradation and cell failuresInsufficient understanding of cell degradation and cell failures in in SOFC SOFC
•• Extensive experimental experience is not generally available Extensive experimental experience is not generally available which which would allow accurate analysis and improvementswould allow accurate analysis and improvements
•• Long term experiments are demanding and expensiveLong term experiments are demanding and expensive
•• Only few tools and diagnostic methods available for developers dOnly few tools and diagnostic methods available for developers due ue to the restrictions of the elevated temperaturesto the restrictions of the elevated temperatures
2010 Fuel Cell Seminar, October 18 - 21, 2010, San Antonio, TX, USA
„„SophisticatedSophisticated““ ((nonnon--traditionaltraditional) ) InIn--situsitu DiagnosticsDiagnostics
•• ElectrochemicalElectrochemical impedanceimpedance spectroscopyspectroscopy on on stacksstacks
•• SpatiallySpatially resolvedresolved measuringmeasuring techniquestechniques forfor currentcurrent, , voltagevoltage, , temperaturetemperature
and gas and gas compositioncomposition
•• OpticalOptical imagingimaging
•• OpticalOptical spectroscopyspectroscopy
•• AcousticAcoustic emissionemission detectiondetection
•• XX--rayray tomographytomography

2010 Fuel Cell Seminar, October 18 - 21, 2010, San Antonio, TX, USA
OutlineOutline
•• IntroductionIntroduction
•• Experimental Experimental setupsetup forfor spatiallyspatially resolvedresolved measurementsmeasurements
•• ExemplaryExemplary resultsresults of of spatiallyspatially resolvedresolved measurementsmeasurements::
•• MSC MSC cellcell
•• ASC ASC cellcell withwith high high fuelfuel utilizationutilization
•• ASC ASC cellcell withwith reformatereformate as as fuelfuel gasgas
•• Outlook: Outlook: OpticalOptical microscopymicroscopy and and RamanRaman spectroscopyspectroscopy
•• ConclusionConclusion

2010 Fuel Cell Seminar, October 18 - 21, 2010, San Antonio, TX, USA
MotivationMotivation
Problems in planar cell technology: Problems in planar cell technology: •• Strong local variation of gas Strong local variation of gas
composition, temperature, andcomposition, temperature, andcurrent densitycurrent density
•• Distribution of electrical and Distribution of electrical and chemical potential dependent onchemical potential dependent onlocal concentrationslocal concentrations
This may lead to:This may lead to:•• Reduced efficiencyReduced efficiency•• Thermo mechanical stressThermo mechanical stress•• Degradation of electrodesDegradation of electrodes
Effects are difficult to understand due to the strong interdepenEffects are difficult to understand due to the strong interdependence of dence of gas composition, electrochemical performance and temperaturegas composition, electrochemical performance and temperature

2010 Fuel Cell Seminar, October 18 - 21, 2010, San Antonio, TX, USA
MeasurementMeasurement Setup Setup forfor SegmentedSegmented CellsCells
•• 16 16 galvanicallygalvanically isolated segmentsisolated segments•• Local and global iLocal and global i--V characteristicsV characteristics•• Local and global impedance Local and global impedance
measurementsmeasurements
•• Local temperature measurementsLocal temperature measurements•• Local fuel concentrationsLocal fuel concentrations•• Flexible design: substrateFlexible design: substrate--, anode, anode--, ,
and electrolyteand electrolyte--supported cellssupported cells•• CoCo-- and counterand counter--flowflow

2010 Fuel Cell Seminar, October 18 - 21, 2010, San Antonio, TX, USA
SegmentedSegmented CellsCells
•• Anode supported cells: Anode supported cells: Segmented cathode Segmented cathode ((H.C.Starck/InDECH.C.Starck/InDEC))
•• Electrolyte supported cells: Electrolyte supported cells: Segmented cathode and Segmented cathode and anodeanode
2010 Fuel Cell Seminar, October 18 - 21, 2010, San Antonio, TX, USA
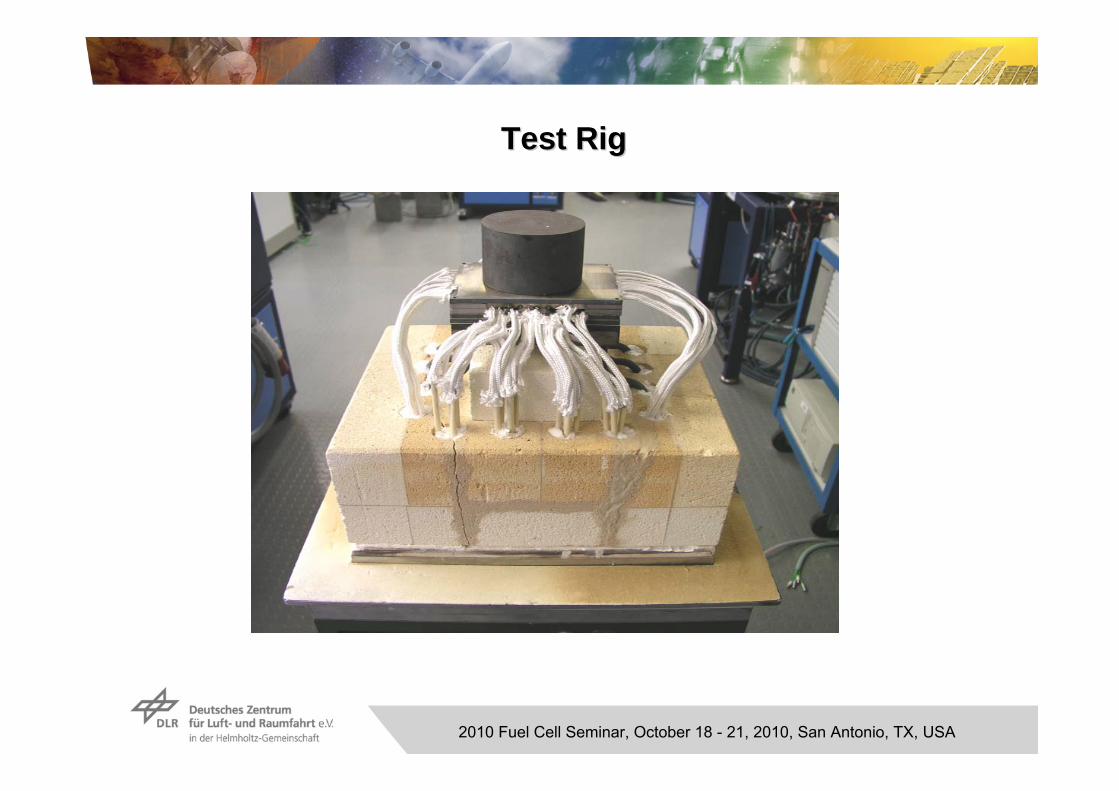
Test Test RigRig
2010 Fuel Cell Seminar, October 18 - 21, 2010, San Antonio, TX, USA
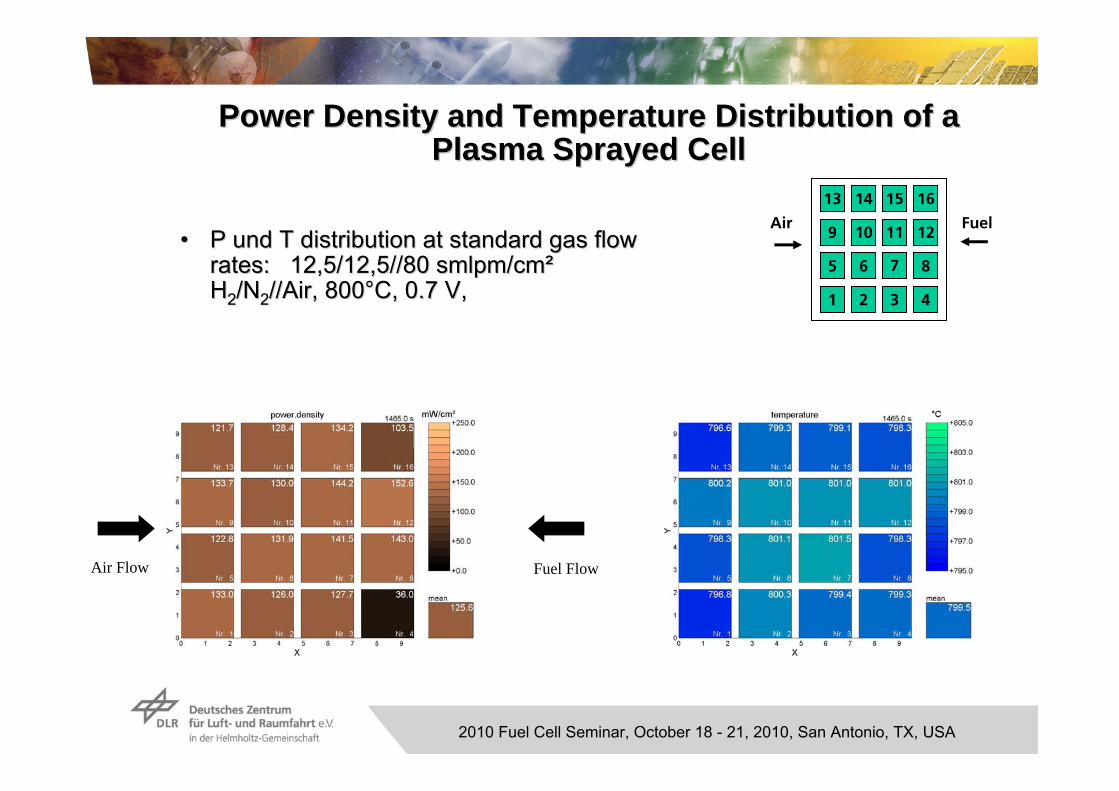
Power Power DensityDensity and and TemperatureTemperature Distribution of a Distribution of a Plasma Plasma SprayedSprayed CellCell
FuelAir•• P und T distribution at standard gas flow P und T distribution at standard gas flow
rates: 12,5/12,5//80 smlpm/cmrates: 12,5/12,5//80 smlpm/cm²²HH22/N/N22//Air, 800//Air, 800°°C, 0.7 V, C, 0.7 V,
13 14 15 16
9 10 11 12
5 6 7 8
1 2 3 4
Air Flow Fuel Flow

2010 Fuel Cell Seminar, October 18 - 21, 2010, San Antonio, TX, USA
OCV OCV VoltageVoltage MeasurementMeasurement forfor Determination of Determination of HumidityHumidity
•• Voltage distribution at standard flow rates:Voltage distribution at standard flow rates:•• 50% H50% H22, 50% N, 50% N22 + 3% H+ 3% H22O, 0.08 SlpM/cmO, 0.08 SlpM/cm²² airair
13 14 15 16
9 10 11 12
5 6 7 8
1 2 3 4
fuel gas air
22
20 lnHO
OHrevrev pp
pzFRTUU
Nernst Nernst equationequation::
ProducedProduced waterwater::S4: 0.61%, S8: 0.72%, S4: 0.61%, S8: 0.72%, S12: 0.78%, S16: 3.30%S12: 0.78%, S16: 3.30%

2010 Fuel Cell Seminar, October 18 - 21, 2010, San Antonio, TX, USA
Power Power DensityDensity DistribututionDistributution underunder ConditionsConditionsof High of High FuelFuel UtilizationUtilization
Counter-flow
Anode: 33% H2, 1% H2O,
66% N2
Cathode: air
T = 800 °C
Cell voltage: 0.59 V
Fu = 80%
Lit.: Fuel Cells, 10 (3), 411-418 (2010)
2010 Fuel Cell Seminar, October 18 - 21, 2010, San Antonio, TX, USA
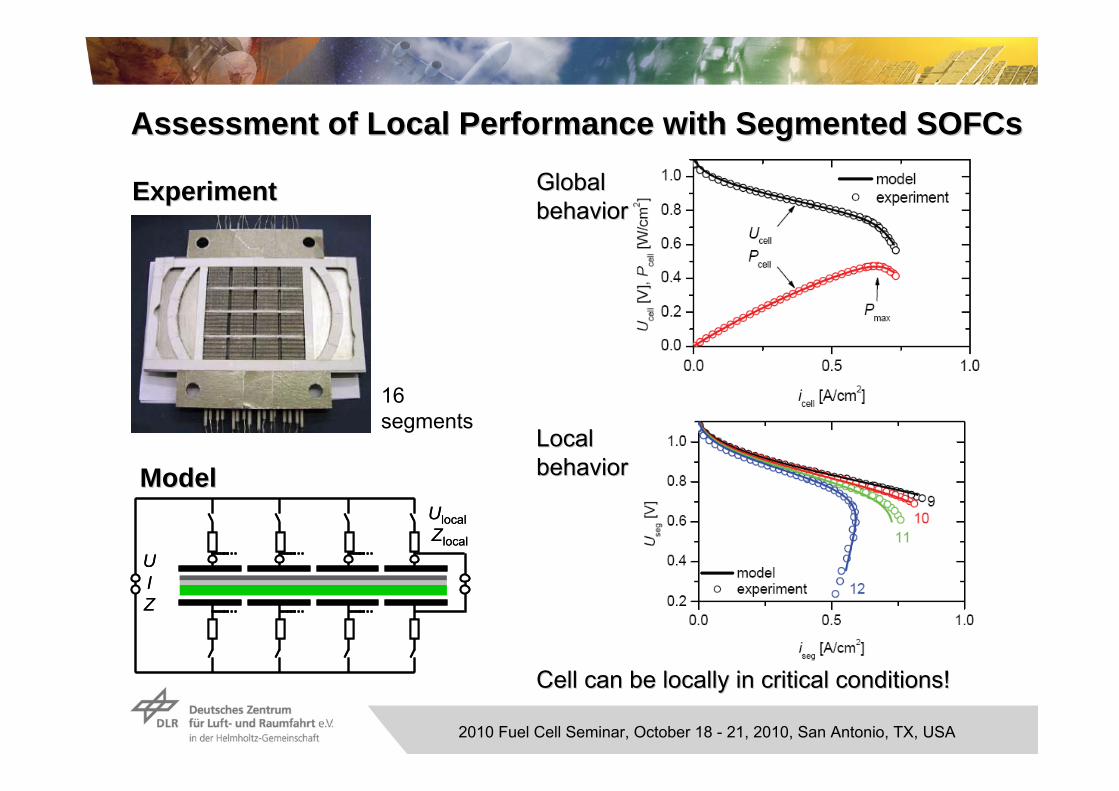
AssessmentAssessment of of LocalLocal Performance Performance withwith SegmentedSegmented SOFCsSOFCs
ExperimentExperiment
ModelModelUlocalZlocal
UIZ
UlocalZlocal
UIZ
16segments
Global Global behaviorbehavior
LocalLocalbehaviorbehavior
CellCell cancan bebe locallylocally in in criticalcritical conditionsconditions!!
2010 Fuel Cell Seminar, October 18 - 21, 2010, San Antonio, TX, USA
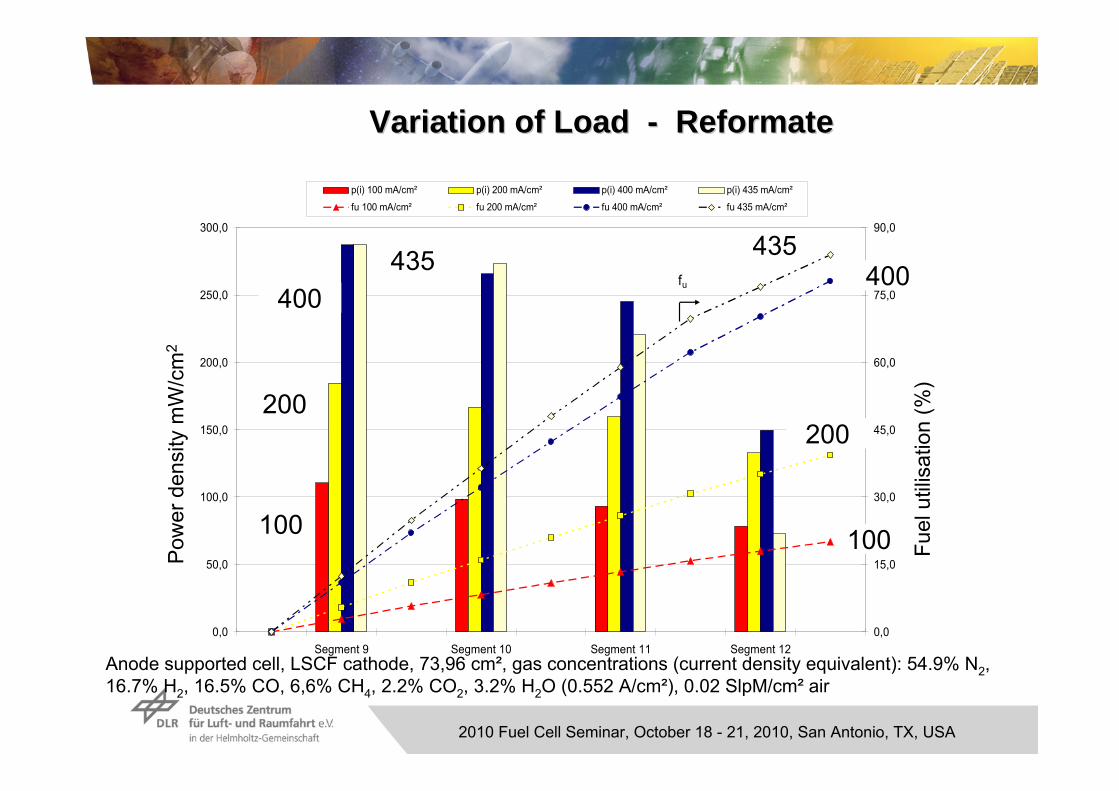
Variation of Variation of LoadLoad -- ReformateReformate
Anode supported cell, LSCF cathode, 73,96 cm², gas concentrations (current density equivalent): 54.9% N2, 16.7% H2, 16.5% CO, 6,6% CH4, 2.2% CO2, 3.2% H2O (0.552 A/cm²), 0.02 SlpM/cm² air
0,0
50,0
100,0
150,0
200,0
250,0
300,0
Segment 9 Segment 10 Segment 11 Segment 12
pow
er d
ensi
ty p
[mW
/cm
²]
0,0
15,0
30,0
45,0
60,0
75,0
90,0
fuel
util
isat
ion
fu [%
]
p(i) 100 mA/cm² p(i) 200 mA/cm² p(i) 400 mA/cm² p(i) 435 mA/cm²
fu 100 mA/cm² fu 200 mA/cm² fu 400 mA/cm² fu 435 mA/cm²
fu
100
200
400435
100
200
400435
Pow
er d
ensi
tym
W/c
m2
Fuel
util
isat
ion
(%)

2010 Fuel Cell Seminar, October 18 - 21, 2010, San Antonio, TX, USA
Alteration of Alteration of thethe Gas Gas CompositionComposition at at 435 mA/cm435 mA/cm²²
0
0,05
0,1
0,15
0,2
0,25
0,3
Segment 9 Segment 10 Segment 11 Segment 12
Gas
konz
entra
tion
/ %
H2 CO CH4 CO2 H2O
Con
cent
ratio
n/ %
H2
10 11 12
CO
CH4
H2O
CO2
9

2010 Fuel Cell Seminar, October 18 - 21, 2010, San Antonio, TX, USA
Alteration of Alteration of thethe Gas Gas CompositionComposition at at 100 mA/cm100 mA/cm²²
0
0,05
0,1
0,15
0,2
0,25
0,3
Segment 9 Segment 10 Segment 11 Segment 12
Gas
konz
entra
tion
/ %
H2 CO CH4 CO2 H2O
KS4X050609-7 in Metallischem Gehäuse; Substrat: Anodensubstrat, aktive Zellfläche:73,78 cm²,A: 542 µm NiO/YSZ, E: 14 µm YSZ + YDC,
K: 28 µm LSCF, Kontaktierung: 30 µm LSP16+Pt3600,Integral, Gasflüsse: 0,552 A/cm² Stromdichteäquivalent (54,9% N2, 16,7% H2,
16,5% CO, 6,6%CH4, 2,2%CO2, 3,2% H20) // 0,08 SlpM/cm² Luft, 800 °C, 100 mA/cm²
Metallic housing, anode substrate, active area 73.78 cm²Anode: 542 µm NiO/YSZ, Electrolyte: 14 µm YSZ + YDC,Cathode: 28 µm LSCFOperation conditions: 0.10 A/cm² - Anode = 5.52(54.9% N2, 16.7% H2, 16.5% CO, 6.6% CH4, 2.2% CO2, 3.2% H2O0.08 Nlpm/cm² Air, 800°C)
Con
cent
ratio
n/ %
9 10 11 12
H2
CO
H2O CO2CH4

2010 Fuel Cell Seminar, October 18 - 21, 2010, San Antonio, TX, USA
Potential Potential forfor OpticalOptical SpectroscopiesSpectroscopies
Raman spectroscopyRaman spectroscopyLaser Doppler Anemometry (LDA)Laser Doppler Anemometry (LDA)Particle Image Particle Image VelocimetryVelocimetry (PIV)(PIV)FastFast--Fourier Infrared (FTIR)Fourier Infrared (FTIR)Coherent AntiCoherent Anti--Stokes Raman Spectroscopy (CARS)Stokes Raman Spectroscopy (CARS)Electronic Speckle Pattern Electronic Speckle Pattern InterferometryInterferometry (ESPI)(ESPI)
Digital CCD camera
Distance microscope(resolution1 µm)
Quarz window
Transparentflow field
Imagingspectrograph
Lenses/filter
Pulsed Nd:YAG laser(532 nm, 10 ns)
Open tube(5 mm)
a) In situ microscopy b) In situ Raman laser diagnostics
15 cm
Heat & radiation shield
SOFC

2010 Fuel Cell Seminar, October 18 - 21, 2010, San Antonio, TX, USA
Setup Setup forfor 1D1D--Raman Raman SpectroscopySpectroscopy
3 double pulse 3 double pulse Nd:YAGNd:YAG PIV 400 PIV 400 laserlaser systemssystemsλλ = 532 nm= 532 nmRepetition rate: 10 HzRepetition rate: 10 HzSingle pulse: E Single pulse: E ≤≤ 350 mJ / 350 mJ / ~~7 ns7 nsPulse Pulse energyenergy: 6 x 300 mJ : 6 x 300 mJ Pulse Pulse lengthlength: : ~380 ns ~380 ns
(temporal (temporal resolutionresolution))
2010 Fuel Cell Seminar, October 18 - 21, 2010, San Antonio, TX, USA
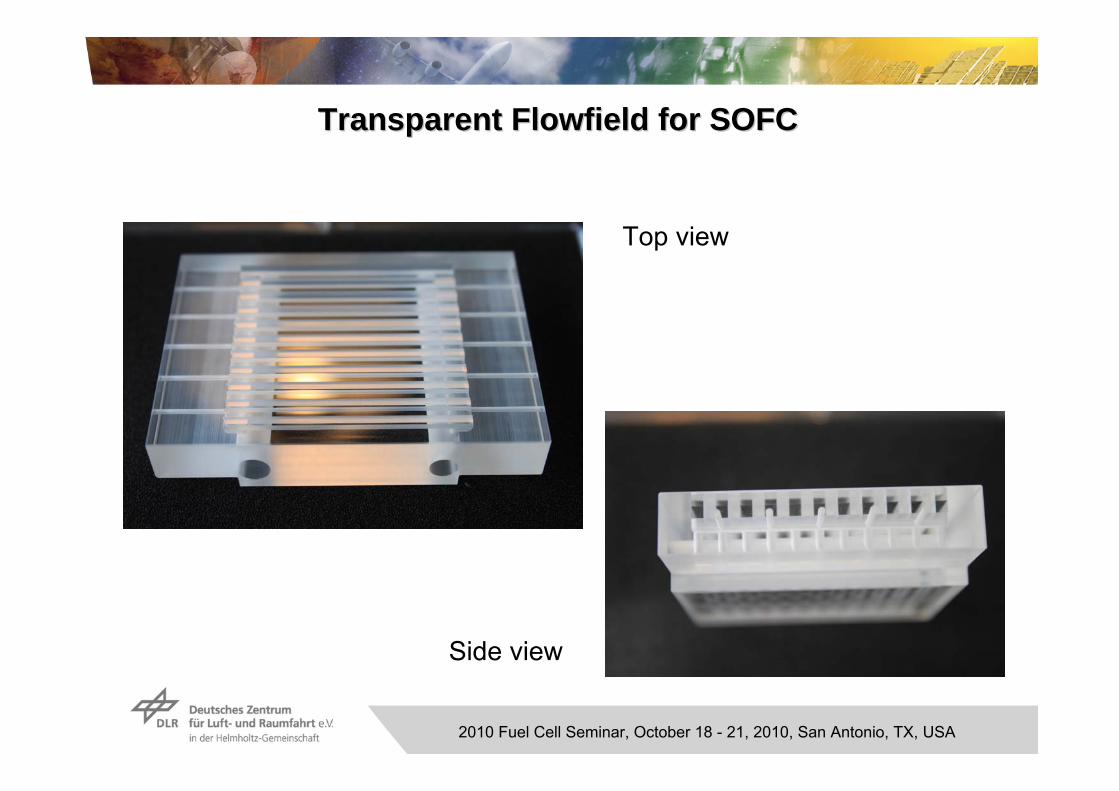
Transparent Transparent FlowfieldFlowfield forfor SOFCSOFC
Top view
Side view

2010 Fuel Cell Seminar, October 18 - 21, 2010, San Antonio, TX, USA
Experimental Setup Experimental Setup forfor RamanRaman SpectroscopySpectroscopy MeasurementsMeasurements

2010 Fuel Cell Seminar, October 18 - 21, 2010, San Antonio, TX, USA
CellCell HousingHousing withwith Transparent Transparent FlowfieldFlowfield in Hot in Hot FurnaceFurnace

2010 Fuel Cell Seminar, October 18 - 21, 2010, San Antonio, TX, USA
Setup Setup forfor InIn--SituSitu OpticalOptical MicroscopyMicroscopy
2010 Fuel Cell Seminar, October 18 - 21, 2010, San Antonio, TX, USA
ConclusionConclusion
•• InIn--situsitu diagnosticdiagnostic techniquestechniques allowallow forfor a a largelylargely extendedextended insightinsightintointo fuelfuel cellcell processesprocesses (fundamental (fundamental understandingunderstanding, , optimizationoptimization of of flowflow fieldfield))
•• TheThe potential of potential of spatiallyspatially resolvedresolved diagnosticsdiagnostics was was demonstrateddemonstrated withwith somesomeexemplaryexemplary resultsresults
•• TheThe obtainedobtained datadata cancan bebe usedused forfor modelingmodeling and and simulationsimulation forfor identificationidentification of of criticalcritical operatingoperating conditionsconditions
•• StrongStrong gradientsgradients of gas of gas concentrationsconcentrations and and currentcurrent densitydensity particularlyparticularly at at operationoperation withwith high high fuelfuel utilizationutilization maymay resultresult in in locallylocally criticalcritical operatingoperatingbehaviorbehavior
•• Additional Additional inin--situsitu diagnosticdiagnostic methodsmethods such as such as opticaloptical microscopymicroscopy and gasand gas--phasephase RamanRaman spectroscopyspectroscopy areare currentlycurrently builtbuilt up to up to provideprovide furtherfurther informationinformationforfor thethe understandingunderstanding of of cellcell reactionsreactions and and processesprocesses