study of soil erosion risk in the basin of northern al ... · pdf filestudy of soil erosion...
TRANSCRIPT
© 2015. Dr. Mona Barakat, Dr. Ilene Mahfoud & Aymen A. Kwyes. This is a research/review paper, distributed under the terms of the Creative Commons Attribution-Noncommercial 3.0 Unported License http://creativecommons.org/licenses/by-nc/3.0/), permitting all non commercial use, distribution, and reproduction in any medium, provided the original work is properly cited.
Global Journal of Science Frontier Research: HEnvironment & Earth ScienceVolume 15 Issue 4 Version 1.0 Year 2015Type : Double Blind Peer Reviewed International Research JournalPublisher: Global Journals Inc. (USA)Online ISSN: 2249-4626 & Print ISSN: 0975-5896
Study of Soil Erosion Risk in the Basin of Northern Al-KabeerRiver in Lattakia using Remote Sensing and Geographic Information System (GIS) Techniques
By Dr. Mona Barakat, Dr. Ilene Mahfoud & Aymen A. KwyesTishreen University, Syria
Abstract- The soil water erosionrisk is the most importantchallenges facingthe agricultural processinthe Syrian coastat the present time, especially those areas surrounding rivers and water leaks.
This study aims to produce soil erosion risk map based on Coo Rdination of Information on the Environment (CORINE) model for the near and middle basin part of the Northern Al-Kabeer River (Lattakia province).
To achieve this objective, the first phase of the study evaluates the soil erosion viability by estimating soil texture, Soil depth and stoniness percent. Consequently, soil erosion viabilities were classified according to its influencing degree in soil erosion. Keywords: risk water erosion, geographic information system, Al-Kabeer northeren river, CORINE methodology.
GJSFR-H Classification : FOR Code: 050399
StudyofSoilErosionRiskintheBasinofNorthernAlKabeerRiverinLattakiausingRemoteSensingandGeographicInformationSystemGISTechniques
Strictly as per the compliance and regulations of :

Study of Soil Erosion Risk in the Basin of Northern Al-Kabeer River in Lattakia using
Remote Sensing and Geographic Information System(GIS) Techniques
Dr. Mona Barakat α, Dr. Ilene Mahfoud
σ & Aymen A. Kwyes ρ
Abstract- The soil water erosionrisk is the most importantchallenges facingthe agricultural processinthe Syrian coastat the present time, especially those areas surrounding rivers and water leaks.
This study aims to produce soil erosion risk map based on Coo Rdination of Information on the Environment (CORINE) model for the near and middle basin part of the Northern Al-Kabeer River (Lattakia province).
To achieve this objective, the first phase of the study evaluates the soil erosion viability by estimating soil texture, Soil depth and stoniness percent. Consequently, soil erosion viabilities were classified according to its influencing degree in soil erosion. The potential risk erosion map was depending on cross all information which obtained from soil erodibility, erosivity index and the degree of slope on study area was formed by using GIS technologies.
Land cover map of study area was produced and classified to two classes depending on soil protection degree. Then, an actual risk map of soil erosion was prepared after crossing land cover and potential risk erosion classes of study sites.
The results showed that 2.47% of the study area facing high risk of soil erosion, while the soil risk was moderate in 22.18% and low in 75.35% of the study area. The high risk erosion spots mainly located in the center and northern parts of the study area. Moreover, the study confirm that the land cover is the most influential factor in soil water erosion, which reduced about 60.93% of the high risk of potential soil erosion. Keywords: risk water erosion, geographic information system, Al-Kabeer northeren river, CORINE methodology.
I. Introduction ater erosion is the result of overlap between the factor of soil and the worker rainfall (Kertesz and Gergely, 2011), which is one of the most
important environmental problems and agricultural, because it causes the loss of the elements of fertility in the soil (N, P, K and grained soft), which leads to lower the productive capacity of the soil, and thus exit from
the process of agricultural production (Tingtinget al.,
Author α: Professor at Soil and Water Sciences Department, Faculty of
Agriculture, Tishreen University, Lattakia, Syria.
Author σ: Lecturer at Forestry and Ecology Department, Faculty of
Agriculture, Tishreen University, Lattakia, Syria.
Author ρ: Postgraduate student at Soil and Water Sciences Department,
Faculty of Agriculture, Tishreen University, Lattakia, Syria.
e-mail: [email protected]
2008) , also works on the pollution of water bodies as the outputs of soil erosion up to aquariums closed and caused the phenomenon of eutrophication (Eutrophication) deprives so its vital importance and economic (Schiettecatte, 2007), as a result, leading to the loss of the most important exporters are essential for the continuation of human and two water and soil, especially soil erosion processes that are fast, unlike soil formation processes that are very slowly.
The factors affecting the water erosion of the soil in Syria in general and the Syrian coast in particular are many and varied, and has been highlighted in a study carried out by the (UNEP, 2004), and most notably the rain, the decline of soil and vegetation, so locating dangerous drift and evaluation is important and necessary. in order to develop appropriate strategies for soil and water conservation.
The identification of areas of the seriousness of water erosion ways through traditional estimating quantities of soil lost is difficult and is not possible in areas with large spaces and differentiated terrain , and he needs to make a lot of efforts and exchange huge amounts (Zhang et al., 2010;Ren, 2011), which requires finding alternative methods and fast help identify threatened areas drift in order to accelerate the adoption of appropriate measures to reduce degradation processes, such as the use of some experimental models that rely on measuring factors drift locally as an erosion rain, worker susceptibility of soil to erosion, factor terrain factor vegetation, which gave good results faster and less expensive when used with remote sensing techniques and geographic information systems (Prasann et al., 0.2013 ), which is one of the tools actors in the process of studying the vegetation and monitor the changes that defects during different periods of time (Ahmad and Verma, 2013), and help access to spatial database and wide to identify areas at risk of water erosion, and was able to determine the rate of deterioration and the development of strategies and plans necessary for the maintenance of those areas soils (Sakthivel et al.,.2011)
Used a lot of models in determining the seriousness of the drift depending on the techniques of
W
1
Globa
lJo
urna
lof
Scienc
eFr
ontie
rResea
rch
V
olum
eXV Issue
er
sion
IV
IVYea
r20
15
© 2015 Global Journals Inc. (US)
)
) H
1
remote sensing and geographic information systems, it has been to predict the risk of soil erosion and determine the spatial distribution has (Aydin and colleagues, 2010 ), so we will adopt in our study on one of these models, a model coordinate information environment (CORINE: Coo Rdination of Information Environment.
II. The Importance of Research and its Objectives
Leading factors causing erosion in the river basin Great Northern (human activity, and precipitation, high terrain corrugated and steep) to the loss of agricultural soils and the degradation characteristics Al_khasobeh, low production capacity, and that the arrival of the outputs of the drift to the river leads to the contamination of water basin and low value bio and agricultural.
The difficulty of identifying areas of dangerous drift by estimating the amount of soil lost in this area because of the large area of the hand, and Oaourtha hand, requires the use of modern technologies Kniz geographic information (GIS) to identify and assess the seriousness of the drift so that the foundation stone at
the development of the necessary procedures for soil conservation and the reduction of erosion, where the aim of this study was to:
Determine the risk of soil erosion and spatially distributed in the pelvic area and the Near East to the Grand River in the north of Latakia, depending on the model Corinne COREIN.
III. Materials and Methods of Work
a) Study area
© 2015 Global Journals Inc. (US)
2
Globa
lJo
urna
lof
Scienc
eFr
ontie
rResea
rch
V
olum
eYea
r20
15
)
)
XV Issue
er
sion
IV
IVH
Study of Soil Erosion Risk in the Basin of Northern Al-Kabeer River in Lattakia using Remote Sensing and Geographic Information System(GIS) Techniques
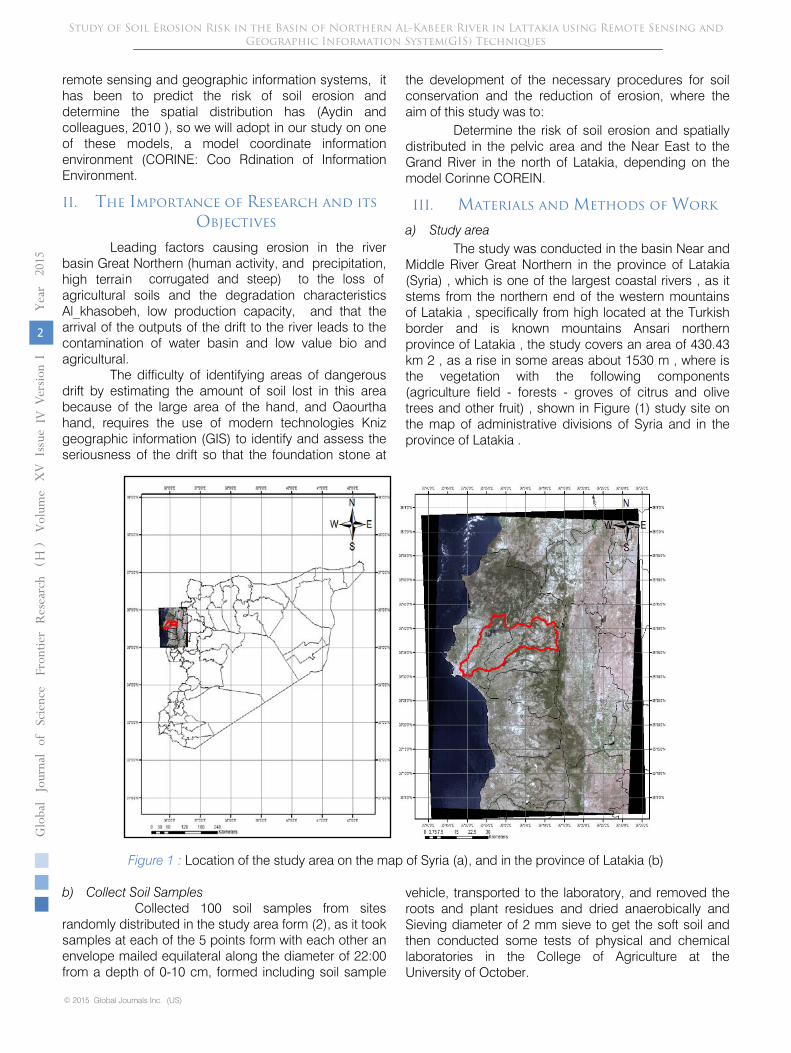
Figure 1 : Location of the study area on the map of Syria (a), and in the province of Latakia (b)
b) Collect Soil Samples Collected 100 soil samples from sites
randomly distributed in the study area form (2), as it took samples at each of the 5 points form with each other an envelope mailed equilateral along the diameter of 22:00 from a depth of 0-10 cm, formed including soil sample
vehicle, transported to the laboratory, and removed the roots and plant residues and dried anaerobically andSieving diameter of 2 mm sieve to get the soft soil and then conducted some tests of physical and chemical laboratories in the College of Agriculture at the University of October.
The study was conducted in the basin Near and Middle River Great Northern in the province of Latakia (Syria) , which is one of the largest coastal rivers , as it stems from the northern end of the western mountains of Latakia , specifically from high located at the Turkish border and is known mountains Ansari northern province of Latakia , the study covers an area of 430.43 km 2 , as a rise in some areas about 1530 m , where is the vegetation with the following components (agriculture field - forests - groves of citrus and olive trees and other fruit) , shown in Figure (1) study site on the map of administrative divisions of Syria and in the province of Latakia .

Figure 2 : map showing points of collection of soil samples in the study area
Was performed mechanical analysis of the soil using a method hydrometers, and determine the strength of the soil using the triangle textures by American classification (USDA), were identified as the percentage of coverage of the surface with gravel by taking an area of 13:00 2 from the sample and then measuring the coverage ratio with gravel, and measured the depth of the soil through using a metal rod runway was planted in the soil at the center of the sample, the sampling sites were identified using a global Positioning system (GPS: Global Position System).
Has been collecting climate data (monthly amounts of precipitation and temperature) of the meteorological station at (mouthpiece) for ten years (2011-2001), where values ranged between average annual rainfall (550-1006) mm, while the values ranged between monthly average temperatures (12 -28) degrees Celsius.
c)
Corinne model (CORINE: COoRdination of information on the Environment)
Based methodology to assess the risk of water erosion of the soil using a model Corinne, at the expense of some of the factors affecting the drift : the portability factor of soil erosion, rainfall erosion factor, factor inclination and vegetation factor, where both were calculated from previous indicators as follows :
i.
Soil Erodibility Index
Affected index susceptibility of soil to erosion each of the (soil texture, depth and percentage of coverage of the surface with gravel), as classified by the strength of the soil to four rows deep in three rows, while the percentage of coverage of the surface with gravel are classified in two rows (Table 1), and calculates the index susceptibility soil erosion, according to the following equation:
Index susceptibility to soil erosion,= Soil Texture X Soil Depth X Percentage of Stones Covered.
Table 1 : the ranks of each type of textures, depth and vulnerability index for soil erosion by CORINE
Erodibility Soil Depth
)cm( Stoness
Class soil texture
Class
0 -
- Rock Land
0
0-3 75> <10% Low Erodibility Soil
(Clay–Sandy Clay–Silty Clay)
1
3-6 25-75
>10% ModeratlyErodibility Soil(Sandy Clay Lome–
Clay Lom–Silty Clay Lome–Lome Sand–Sandy)
2
>6 25< -
High Erodibility Soil
(Lome-SiltyLome-Silty-Sandy Lome)
3
Study of Soil Erosion Risk in the Basin of Northern Al-Kabeer River in Lattakia using Remote Sensing and Geographic Information System(GIS) Techniques
1
Globa
lJo
urna
lof
Scienc
eFr
ontie
rResea
rch
V
olum
eXV Issue
er
sion
IV
IVYea
r20
15
© 2015 Global Journals Inc. (US)
)
) H
3

ii. Rainfall erosion index(Erosivity Index) Index was calculated based on the rainfall
erosion of all Station Fournier Index( FI) and (BGI: Bagnouls-Gaussen Index) is calculated as rainfall erosion index using the following relationship:
Rainfall erosion index = index Fournier row X row index Bagnold - Gawsn
FI = �Pi
2
P
12
i=1
Where pi: the amount of monthly precipitation in mm. P: Total annual rainfall in mm.
The index of Bagnold - Gawsn (BGI) is calculated according to the following equation.
BGI = �(2ti − Pi)Ki
12
i=1
Where
ti: Average monthly temperature b (degrees Celsius).
Ki: calculated value when 2ti-pi> 0.
Where Ki factor was calculated by the relationship (Ki = 2ti-pi), which is calculated when 2ti-pi> 0 and neglect If this ratio is less zero.
Index has been divided into five rows FI index and BGI to four rows, while the erosion index was divided into three rows rainfall as in the following table.
Table 2 : Values and the ranks of both index and index Fournier Bagnold - Gawsn, and rainfall erosion index by model CORINE
Classification
Erosivity Classification
BGI Classification
FI Class
Low
<4
Humid
0
Very low
< 60
1
Moderate
4 -8 Moist
0- 50
Low
60-90
2
High
>8
Dry
50 -130
Moderate
90-120
3
Very Dry
>130
High
120-160
4
Very High
>160
5
iii.
Slop Index
Was to determine the degree inclination using digital elevation model (DEM):has
been obtained from the Public Authority for Remote Sensing (GORS) in the
patient, has been manufacturing DEM in 2011 from the image accurately ester 30 m,. Were divided depending on the degree of inclination model CORINE to four rows in the table as (5).
Table 3 : Values and the Classesof Slopedegree by CORINE model
Classification
(%)Slope Angle
Class
Gentle to flat
5 >
1 Gentle
5-15
2
Step
15-30
3
Very steep
>30
4
iv.
Potential Soil Erosion Risk
Was calculated potential danger ( underlying ) to soil erosion using the following equation.
Was divided potential risk of erosion into four rows , there is no danger (0), low ( 0-5 ), average ( 5-11 ) and high ( > 11).
v.
Land Cover
Was obtained on the map represent the different types of ground cover in the study area and using a satellite image of the type (Landsat
TM) taken
on 08/28/2011, was rated among the coverage of ground in this map represented by the degree of protection of the soil and in accordance with the model Corinne to two rows: (1) full protection (Fully Protected) It includes forests, bodies of water, construction, roads
Study of Soil Erosion Risk in the Basin of Northern Al-Kabeer River in Lattakia using Remote Sensing and Geographic Information System(GIS) Techniques
© 2015 Global Journals Inc. (US)
4
Globa
lJo
urna
lof
Scienc
eFr
ontie
rResea
rch
V
olum
eYea
r20
15
)
)
XV Issue
er
sion
IV
IVH
and rocky Land. (2) Protection of incomplete (Not Fully Protected) which includes land crops and fruit trees in addition to the land of olive and citrus.
vi. Actual Soil Erosion RiskActual risk was calculated for each point of the
soil samples by selecting a row the potential danger to her, and then determine the type of ground cover and
The index is calculated Fournier (FI) according to the following equation:
The potential Soil Erosion Risk index = soil Erodibility map X Erosivity index X Slope Map

the actual risk is calculated for each point of law the following :
Actual Soil erosion Risk = Potential SoilErosion Risk map xVegetation map
The class
of the actual risk of erosion into three ranks of low, medium and high.
d)
Mapping
ArcGIS10 program was used to get the maps required for each of the indicators except for the previous rainfall erosion index. Where to get maps of soil properties (soil texture, soil depth, the percentage of gravel cover ) by applying the logarithm of Kriging on samples collected Haklaa. Expresses this logarithm process statistical geography allows estimating a surface depending on the values of a set of points distributed (samples) on this surface and actress for a particular phenomenon, and supports its core principle on the theory of variable -site The Regionalized Variable Theory which assumes that the change phenomenon represented by a set of samples raster Distributed on a surface according to the place shall be homogeneous from a statistical standpoint across the surface, as was the distribution of traits of the soil of the strength and depth of the coverage in areas with gravel samples over the entire study area. In a
later step, has been used three maps representing characteristics of the soil to get on the map of soil susceptibility to erosion, as this map that represents the product of the maps of the three above-mentioned among them.
Was then prepare a map of the
tendency that has been obtained using a digital elevation model (DEM) 30 m pixel accuracy. We subsequently prepare a map of the inherent risk of erosion by multiplying the process to my map susceptibility to soil erosion and tilt with the value of the index factor rainfall according to the equation mentioned in paragraph ( 3.3.4 ).
At a later stage, have been prepared Coverage Map Land cover for ground study site based on the satellite image of the moon Landsat TM taken on August 28, 2011, through the application of technology Category observer Supervised Classification mentioned on image using the program ERDASImagine8.4. Been dropping 75 sample field on the satellite image in order to identify areas of training (Training Zones) , which was used to collect spectral information representing various types of ground cover in the study area, and after the completion of the configuration file spectroscopy was performed classification process observer using the logarithm of the probability -Azam (Maximum Likelihood). Coverage was ground in the resulting image classification process through the ranks 5: (1) Forests, (2) Bodies of Water, (3) Construction - Methods - Tkchwet rocky, (4) crops - fruit trees, (5) Citrus - Olive. Was then testing the accuracy of the classification process by using a matrix error (Error Matrix). We eventually reclassified coverage map land resulting from
the classification process according to the model Corinne into two rows:(1) full protection (Fully Protected) It includes forests and water bodies, construction, roads, Altkchwet rock, and (2) the protection of non- full (Not Fully Protected), which includes land crops and fruit trees ( Kaltvahiat and almonds ... etc. ) in addition to the land of olive and citrus .
In the final stage, have been prepared map of the actual risk of water erosion of the soil in the study area in accordance with the model Corinne through the process of multiplying the map to the inherent risk of erosion with map coverage of land reclassified into two rows by the degree of protection of the soil.
IV.
Results and Discussion
a)
Soil Erodibility Index i.
Soil Texture
The soils Celtic textures and fine sandy loam and more resistant to erosion of sandy soils and sandy Allomah and Allomah (Corbaneet al.,.2008). It has been observed that 37.52% of the soils studied with the strength of (C, SC, SiC), which is characterized resistant severe erosion, while 35.81% of the soils strength (SCL, CL, SiCL, LS), a soil medium resistance to erosion, and 26.67% of the strength of soils (L, SiL, SL), a weak soils resistance to erosion. Figure (3) varieties strength of soils and their distribution within the study area.
Study of Soil Erosion Risk in the Basin of Northern Al-Kabeer River in Lattakia using Remote Sensing and Geographic Information System(GIS) Techniques
1
Globa
lJo
urna
lof
Scienc
eFr
ontie
rResea
rch
V
olum
eXV Issue
er
sion
IV
IVYea
r20
15
© 2015 Global Journals Inc. (US)
)
) H
5

Figure 3 : among the soil texture map of the study area
ii. Soil Depth the greater the depth of the soil increased ability
to absorb rain water and said the amount of water runoff and therefore less drift (Marina et al., 2008) Study showed that 44.40% of the soil with a depth of more
than 75 cm low susceptibility to erosion , and 39% of the soils studied with a depth of between 25-70 cm were classified as medium susceptibility to erosion, while the percentage of severe soil erosion susceptibility to 16.16% with a depth of less than 25 cm (Figure 4).
Figure 4 : map the ranks of the depth of the soil in the study area
iii. Surface Coverage of the Soil with Stoness The presence of gravel over the surface of the
soil can be a factor to protect the soil from rain drops act (Yukselet al.,.2008). It was found that 41.31% of the soils studied with superficial coverage of more than
10%, providing full protection of the soil while the percentage of soil surface coverage of less than 10%, which provides full protection is 58.69% of the study area (Figure 5).
Study of Soil Erosion Risk in the Basin of Northern Al-Kabeer River in Lattakia using Remote Sensing and Geographic Information System(GIS) Techniques
© 2015 Global Journals Inc. (US)
6
Globa
lJo
urna
lof
Scienc
eFr
ontie
rResea
rch
V
olum
eYea
r20
15
)
)
XV Issue
er
sion
IV
IVH

Figure 5 : Map ranks the coverage of the surface of the soil with gravel in the study area
iv. Soil Erodibility
Have been prepared map susceptibility of soils to erosion of multiplying the ranks of both the soil texture, depth and percentage of coverage of the
surface with Stoness which as previously stated in the way of working, and is shown in Figure (6) index susceptibility of soil erosion in the study area .
Figure 6 :
Erodibility map of the study area
Seen from the previous figure that 53.41 % of
the land area studied was the index usability of erosion is located within the first row, where the value of the index susceptibility of soil to erosion ranged between (0-3) any high scalability little drift, while the value of the index ranged between (3-6) at about 30.45 % of the area
studied and therefore fall within the second row, a high susceptibility medium to drift, while the remaining percentage of the area of the study area 16.14% fall
Study of Soil Erosion Risk in the Basin of Northern Al-Kabeer River in Lattakia using Remote Sensing and Geographic Information System(GIS) Techniques
1
Globa
lJo
urna
lof
Scienc
eFr
ontie
rResea
rch
V
olum
eXV Issue
er
sion
IV
IVYea
r20
15
© 2015 Global Journals Inc. (US)
)
) H
7
within the third grade and were of a high affinity for the drift where the Erodibilityindex is<6.
b)
Degrees of Slope
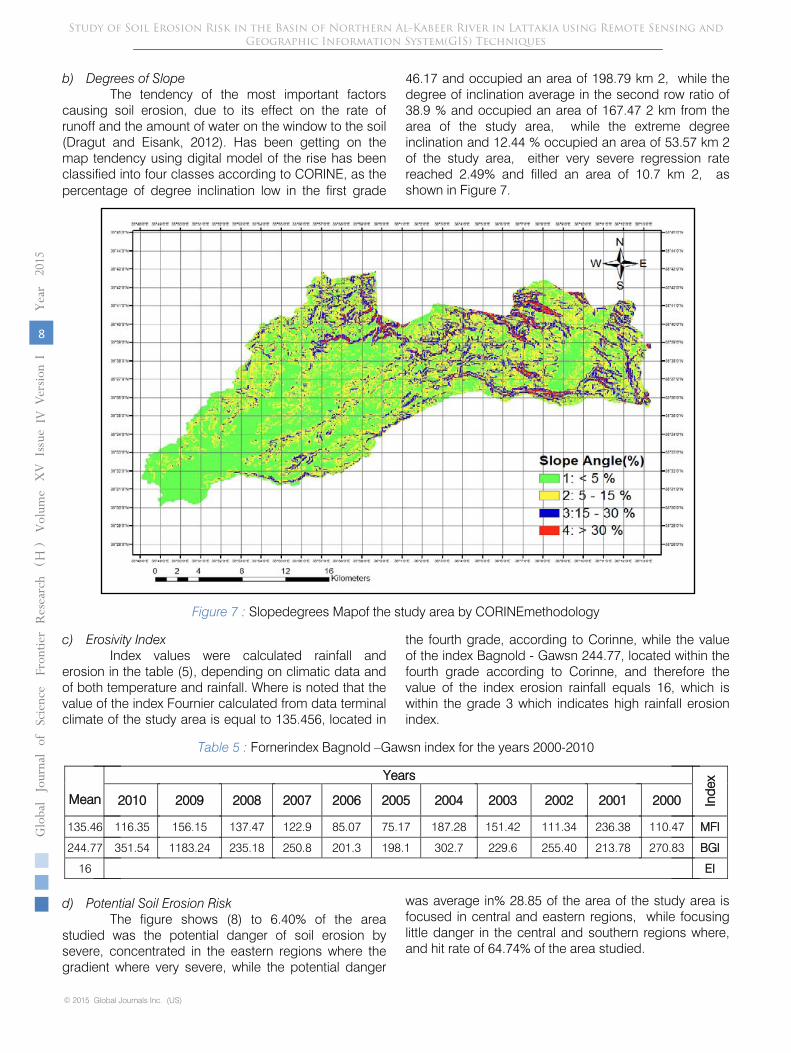
The tendency of the most important factors causing soil erosion, due to its effect on the rate of runoff and the amount of water on the window to the soil (Dragut and Eisank, 2012). Has been getting on the map tendency using digital model of the rise has been classified into four classes according to CORINE, as the percentage of degree inclination low in the first grade
46.17 and occupied an area of 198.79 km 2, while the
degree of inclination average in the second row ratio of 38.9 % and occupied an area of 167.47 2 km from the area of the study area, while the extreme degree inclination and 12.44 % occupied an area of 53.57 km 2 of the study area, either very severe regression rate reached 2.49% and filled an area of 10.7 km 2, as shown in Figure 7.
Figure 7 :
Slopedegrees Mapof the study area by CORINEmethodology
c)
Erosivity Index
Index values were calculated rainfall and erosion in the table (5), depending on climatic data and of both temperature and rainfall. Where is noted that the value of the index Fournier calculated from data terminal climate of the study area is equal to 135.456, located in
the fourth grade, according to Corinne, while the value of the index Bagnold - Gawsn 244.77, located within the fourth grade according to Corinne, and therefore the value of the index erosion rainfall equals 16, which is within the grade 3 which indicates high rainfall erosion index.
Table 5 :
Fornerindex Bagnold –Gawsn index for the years 2000-2010
d) Potential Soil Erosion Risk The figure shows (8) to 6.40% of the area
studied was the potential danger of soil erosion by severe, concentrated in the eastern regions where the gradient where very severe, while the potential danger
was average in% 28.85 of the area of the study area is focused in central and eastern regions, while focusing little danger in the central and southern regions where, and hit rate of 64.74% of the area studied.
Inde
x Years
Mean 2000 2001 2002 2003 2004 2005 2006 2007 2008 2009 2010
MFI
110.47
236.38
111.34
151.42
187.28
75.17
85.07
122.9
137.47
156.15
116.35
135.46
BGI
270.83
213.78
255.40
229.6
302.7
198.1
201.3
250.8
235.18
1183.24
351.54
244.77
EI
16
Study of Soil Erosion Risk in the Basin of Northern Al-Kabeer River in Lattakia using Remote Sensing and Geographic Information System(GIS) Techniques
© 2015 Global Journals Inc. (US)
8
Globa
lJo
urna
lof
Scienc
eFr
ontie
rResea
rch
V
olum
eYea
r20
15
)
)
XV Issue
er
sion
IV
IVH

Figure 8 : Map of the potential danger of soil erosion
e) Land Cover Index Plays Cover Ground role in alleviating the
collision between the raindrops and the soil surface, and reduce the rate of runoff over the soil, and reduce the severity and seriousness of soil erosion (Estoquea and Murayam, 2011), and therefore it has been relying on the lid Ground mainly to estimate the actual risk of erosion soil.
The figure shows (9) Ground cover map resulting from the classification process observer
accuracy rating of ( 87.44 ), as shown in Table (6) which expresses the error matrix. Map shows the cover ground that the biggest part of the study area is used in the cultivation of citrus and olive trees, especially the west and center of the study area, while the forests spread over small areas in the northern part near the dam , October 16, as well as in the eastern part where there are with areas planted with fruit and applestrees, in addition to agricultural crops.
Figure 9 : Land cover map of the study area and represent different types of ground cover in the study area
Study of Soil Erosion Risk in the Basin of Northern Al-Kabeer River in Lattakia using Remote Sensing and Geographic Information System(GIS) Techniques
1
Globa
lJo
urna
lof
Scienc
eFr
ontie
rResea
rch
V
olum
eXV Issue
er
sion
IV
IVYea
r20
15
© 2015 Global Journals Inc. (US)
)
) H
9

Table 6 : Matrix Error for the classification process observer
User’s Accuracy %
Reference Data
Class Names Total
Citrus trees-Olive
Field Crop -Fruit trees
Bulding-Rods-Rock Land
Water Bodies
Forest
72.88 837
225
1 0 1 610
Forest 98.49
1199
18
0 0 1181
0 Water Bodies
80.70
1280
232
10
1033
2 3 Bulding-Rods-Rock
Land 86.87
952
123
827
2 0 0
Field Crop- Fruit trees 98.26
4718
4636
26
10
37
9 Citrus trees-Olive
87.44 8986 5234 864 1045 1221 622 Total
98.26
86.87
80.70
98.49
72.88
Producer’s Accuracy
Represents (Figure 10) Land Cover Map after the re-classified according to the model Corinne into two rows (full protection and the protection of non-full), where the study indicates that 27.10% of the study area with full protection (forests - Bodies of Water -
constructors and Buildings - Methods - Tkchwet rocky (and that 72.9% of the area studied with incomplete protection which includes land planted with citrus, olive and fruit trees and crops.
Figure 10 :
land Cover map classes in the study area
Study of Soil Erosion Risk in the Basin of Northern Al-Kabeer River in Lattakia using Remote Sensing and Geographic Information System(GIS) Techniques
© 2015 Global Journals Inc. (US)
10
Globa
lJo
urna
lof
Scienc
eFr
ontie
rResea
rch
V
olum
eYea
r20
15
)
)
XV Issue
er
sion
IV
IVH
f) Actual Soil Erosion RiskThe table (7) shows the difference between the
areas of potential risk and areas of actual risk of soil erosion , and this is due to the role of Cover Ground in reducing the risk of soil erosion, as the proportion of areas that were classified as having the degree of high risk in the map of the potential danger of erosion from 6.40 % to 2.47 % in the map of the actual risk, after taking the factor of land cover into account the rate of
60.93 %, this corresponds to what referred to (Ekpenyong, 2013) to confirm the role of vegetation in minimizing the potential risk of erosion due to the protection and coverage provided by the soil. On the other hand, the percentage of areas that were classified as falling under little threat in the map of the potential danger increased from 64.74 % to 75.35 %. And fell in the average risk of 28.85 % to 22.18 %, respectively, in the map of the actual risk of erosion.

Study of Soil Erosion Risk in the Basin of Northern Al-Kabeer River in Lattakia using Remote Sensing and Geographic Information System(GIS) Techniques
1
Globa
lJo
urna
lof
Scienc
eFr
ontie
rResea
rch
V
olum
eXV Issue
er
sion
IV
IVYea
r20
15
© 2015 Global Journals Inc. (US)
)
) H
11
The concentrated areas of the actual risk the very soil erosion in the central and eastern parts of the study area, as well as was the case for the risk the
actual average has also focused in the central parts of Eastern and Central North, while focusing the actual risk low in the central and western parts of them (Figure 11).
Table 7 : The Values of the Potential and Actual Erosion Risk
Form 11 : Actual Soil Erosion Risk of map in the study area
V. Conclusions and Recommendations
1-Study pointed to the positive role played by the ground cover to protect the soil from erosion , falling values of the actual risk of soil erosion compared to the potential threat of erosion after the introduction of worker land cover , which led to the devaluation of the real danger by 60.93 % of the value of the potential risk grade soils severe dangerous drift .
2-The use of GIS techniques to map the risk of drift depending on the model CORINE is quick and effective way to assess the risk of soil erosion and the low cost and large area . This technique has proved effective in showing the impact of each indicator used in the model Corinne on the actual risk of erosion , and helped in determining the spatial distribution of the areas of risk , which leads to facilitate and accelerate the
development of strategies and take actions necessary to protect those soils .
3-Recommend follow-up study to other regions differentiated in terms of soil and vegetation and climatic conditions and using the model Corinne.
References Références Referencias
1. Ahmad, Ishtiyaq, and M. K. Verma. 2013. "Application of USLE Model and GIS in Estimation of Soil Erosion for Reservior." International Journal of Emerging Technology and Advanced Engineering, 3(4): 570-576.
2. Aydin, A. and Huseyin, B.Tecimen. 2010. "Temporal soil erosion risk evaluation: a CORINE methodology application at Elmalı dam watershed, Istanbul." Environ Earth Sci, 61: 1457–1465.

Study of Soil Erosion Risk in the Basin of Northern Al-Kabeer River in Lattakia using Remote Sensing and Geographic Information System(GIS) Techniques
© 2015 Global Journals Inc. (US)
12
Globa
lJo
urna
lof
Scienc
eFr
ontie
rResea
rch
V
olum
eYea
r20
15
)
)
XV Issue
er
sion
IV
IVH
3. Corbane C., D. Raclot, F. Jacob, J. Albergel, P. Andrieux. 2008. "Remote sensing of soil surface characteristics from a multiscale classification approach." Catena,75: 308–318.
4. Draguţ., Lucian, Clemens Eisank.,2012,Automated object-based classification of topography from SRTM data. Geomorphology, 141-142 : 21–33.
5. Ekpenyong., Robert Etim. 2013. "An Assessment of Land Cover Change and Erosion risk in AkwaIbom State of Nigeria using the Coordination of information on the Environment (CORINE) methodology. "Greener Journal of Physical Sciences, 3 (3): 76-89.
6. Estoquea,Ronald C., Yuji Murayama. 2011. "Spatio-Temporal Urban Land Use/Cover Change Analysis in a Hill Station: The Case of Baguio City, Philippines. " Procedia Social and Behavioral Sciences, 21: 326–335.
7. KertészÁdám, JakabGergely. 2011. "Gully erosion in Hungary, review and case study. "Procedia Social and Behavioral Sciences,19: 693–701.
8. -Marina B. Vega and J. M. Febles. 2008. "Application of the new method of evaluation of the soil erosion (EVERC) and the model MMF in soils of the Mamposton cattle production basin in Havana province Cuba." Cuban Journal of Agricultural Science, 42(3): 309-314.
9. Prasann., P., Rajesh a., S Evany Nithya, D P Allen. 2013. "Remote Sensing And GIS For Change Detection And Eco Degradation Studies In The Nilgiris – South India." International Journal of Chem Tech Research, 5(3): 1379-1386.
10. Ren, Sheng-ming And Yin Liang, Bo Sun. 2011. "Quantitative Analysis on the Influence of Long-term Soil and water conservation Measures Harnessing on Runoff and Sediment Yield of Watershed."Procedia Environmental Sciences, 10: 1732–1740.
11. Sakthivel., R, N.Jawahar Raj, V. Pugazhendi, S. Rajendran, A. Alagappamoses. 2011. "Remote Sensing and GIS for Soil Erosion Prone areas Assessment: A case study from Kalrayan hills, Part of Eastern Ghats, Tamil Nadu, India." Archives of Applied Science Research, 3(6): 369-376.
12. Schiettecatte, Gabriels, Cornelis. & Hofman. 2007. "Enrichment of Organic Carbon in Sediment Transport by Interrill and Rill Erosion processes." SSSAj 72(2): 50-55.
13. Tingting, LV., Sun, Xiaoyua, Zhang, Dandana, Xue, Zhenshana & Gong, Jianminga. 2008. "Assessment of Soil Erosion risk in northern Thailand. The International Archives of the Photogrammetry." Remote Sensing and Spatial Information Sciences, XXXVII. Part B8: 703-708.
14. UNEP. 2004. "Improving Coastal Land Degradation monitoring in LEBANON and SYRIA."
15. Yuksel, Alaaddin, Gundogan R., E. Akay A. 2008. "Using the Remote Sensing and GIS Technology for Erosion Risk Mapping of KartalkayaDam Watershed in Kahramanmaras, Turkey. "Sensors J, 8: 4851-4865.
16. Zhang, Zhaoling, Shiliang, Liua, Shikui Donga.2010. "Ecological Security Assessment of Yuan River Watershed Based on Landscape Pattern and Soil Erosion. "Procedia Environmental Sciences, 2: 613–618.