study of stator-vane fluctuating pressures in a turbofan engine for
TRANSCRIPT
NASA Technical Paper 221 7
April 1984
NASA j TP 2217 i c.1 i
I
I
Study of Stator-Vane Fluctuating Pressures in a Turbofan Engine for Static and Flight Tests
Arnold W. Mueller
LOAN COPY: RETURN TO AFWL TECttNlCAL LIBRARY KIRTlAND AFB, N.M. 87117
https://ntrs.nasa.gov/search.jsp?R=19840014295 2018-03-26T21:35:20+00:00Z

TECH LlBReRY KAFB, NM
NASA Technical Paper 221 7
1984
Natlonal Aeronautlcs and Space Admtntslratlon
Scientific and Technical Information Branch
Study of Stator-Vane Fluctuating Pressures in a Turbofan Engine for Static and Flight Tests
Arnold W. Mueuer
Langley Research Center Hampton, Virginia


SUMMARY
As part of a program t o s t u d y t h e f a n n o i s e g e n e r a t e d f r o m t u r b o f a n e n g i n e s , f l u c t u a t i n g s u r f a c e p r e s s u r e s i n d u c e d by fan- ro tor wakes w e r e measured on core- and bypass-s ta tor ou t le t gu ide vanes o f a modif ied s ta tor assembly of a JT15D-1 engine. T e s t s were conducted wi th the engine opera t ing wi thout an in f low cont ro l device on an outdoor t e s t s t a n d a n d i n f l i g h t w h i l e mounted beneath t h e wing of a tes t -bed a i r - c raf t . Resul t s o f da ta ana lyses show t h a t as the aerodynamic wakes shed from the r o t o r changed amplitude and shape with engine speed, the surface pressures on the s t a t o r v a n e s e x h i b i t e d t h e e f f e c t o f wake changes. Both core and bypass vanes had a nonuniform spanwise distribution of narrow-band f luctuating pressure a t blade-passage frequencies with high coherence between measurement locations. Pressures measured a t fan-rotor blade-passage f requencies were g e n e r a l l y h i g h e r f o r s t a t i c cond i t ions t han f o r f l i g h t . A study of t h e random c h a r a c t e r i s t i c s of t hese ampl i tudes i nd ica t ed t ha t the tone ampli tudes w e r e less s t ab le unde r s t a t i c c o n d i t i o n s t h a n i n f l i g h t . As t h e engine speed increased during both s t a t i c and f l i g h t t e s t s , t h e c o r e a m p l i t u d e s gen- e r a l l y became less dominated by noise and the bypass amplitudes became more dominated by noise . Fluctuat ing pressures measured a t the blade-passage frequency of the high- speed core compressor were interpreted to be acoustic; however, disturbance trace v e l o c i t i e s f o r e i t h e r t h e c o n v e c t e d r o t o r wakes o r a c o u s t i c p r e s s u r e s were d i f f i c u l t t o i n t e r p r e t b e c a u s e of t h e complex environment.
INTRODUCTION
Noise research on h igh-bypass- ra t io tu rbofan engines has ident i f ied numerous noise-generating mechanisms assoc ia ted wi th the ro tor b lades and s ta tor vanes . Tyler and Sof r in ( re f . 1 ) p resented r e su l t s which indicated that aerodynamic wakes l eav ing t h e r o t o r may i n t e r a c t w i t h s t a t o r v a n e s t o s e t u p complex p r e s s u r e p a t t e r n s i n t h e i n l e t d u c t . Hanson ( r e f . 2) , by using random-pulse-amplitude and position-modulation theo ry , s tud ied t he f a r - f i e ld no i se r e su l t i ng f rom the i n t e rac t ion of t h e r o t o r v i s - cous wakes wi th s ta tor vanes in subsonic ax ia l - f low fans . Researchers genera l ly recognized tha t s t a t i c t e s t i n g of turbofan engines usual ly produced far-f ie ld noise l e v e l s which were g rea t e r t han t hose ob ta ined from f l i g h t . Many s t u d i e s ( r e f s . 3 t o 8) suggested that inf low turbulence and shroud boundary-layer effects were some of the causes o f these h igh no ise l eve ls . These s tud ie s r e su l t ed i n t he deve lopmen t o f in f low- turbulence cont ro l devices and produced s ign i f icant ins ight in to s imula t ing f l i g h t n o i s e w i t h s t a t i c tests.
Concurren t wi th th i s no ise research , which tended to concent ra te on fa r - f ie ld noise and i t s r e l a t i o n s h i p t o t h e s o u r c e n o i s e , r e s e a r c h e r s were s tudy ing t he sou rce mechanisms wi th in t he t u rbo fan as they r e l a t ed t o t he ro to r -wake de fec t s t r u c t u r e , r o t o r - t i p v o r t e x s h e d d i n g , s u p p o r t - s t r u t p o t e n t i a l f i e l d , a n d s e p a r a t i o n d i s t a n c e between t h e r o t o r and the stator vanes downstream of the rotor . References 9 t o 1 5 are a f ew o f t he r e sea rch e f fo r t s s tudy ing va r ious a spec t s o f t hese mechanisms. Both ana ly t ica l and exper imenta l s tud ies us ing var ious types o f wake-survey , ro tor and s ta tor-response instrumentat ion have been conducted. Fan r i g s which produced experi- mental data were des igned or chosen for research so that hardware complicat ions would b e k e p t t o a minimum, thus permit t ing researchers minimal compromise with analyt ical work. The a n a l y t i c a l work has generally been based on incompressible f low with two- dimensional compact source s t r ip theo ry as a p p l i e d t o t h e r o t o r b l a d e s a n d s t a t o r
I
vanes. References 16 and 17 have extended the analytical work to include some compressible-f low effects with noncompact sou rce d i s t r ibu t ion .
Most experimental research has 'men done on a basic f an r i g , a l t hough r e fe r - ences 5, 9, and 14 have indicated a need for experimental data on a "real engine." Addi t iona l ly , wi th in the l a rge body of f l uc tua t ing p re s su re da t a t aken from s t a t o r - vane s tud ie s , ve ry few re l i ab le da t a have been r epor t ed i n a spanwise direct ion. The methodology has usually been t o measure f luc tua t ing pressures a long the chord l ine a t midspan of a stator vane and to assume knowledge of t he spanwise d i s t r ibu t ion .
The National Aeronautics and Space Administration (NASA) has recognized the need t o s tudy t he s imu la t ion e f f ec t iveness be tween t he no i se gene ra t ed by a turbofan engine when mounted on a s ta t ic t e s t s t a n d a n d t h a t g e n e r a t e d i n f l i g h t . To address t h i s n e e d , NASA in i t i a t ed an expe r imen ta l r e sea rch p rog ram us ing a h i g h l y i n s t r u - mented JT15D-1 engine' which had been been sl ightly modified. Mzmerous r e s u l t s o f t h e program have been reported. These r e s u l t s h a v e b e e n r e l a t i v e t o the in f low- control-device comparisons (refs. 6 and 7 ) ; t o the development of a measurement tech- n i q u e t o c o n v e r t n o n s t a t i o n a r y f l i g h t n o i s e i n t o narrow-band s t a t i o n a r y n o i s e ( r e f . 1 8 ) ; and t o t h e e f f e c t s o f s t a t i c , s imula ted forward speed and f l igh t tests on bo th uns t eady f an -b lade p re s su res and acous t i c f a r - f i e ld r ad ia t ion ( r e f s . 19 t o 22 ) .
~n o b j e c t i v e of the program w a s t o s t u d y t h e r o t o r - i n d u c e d f l u c t u a t i n g p r e s s u r e l e v e l s (FPL) a n d t h e i r d i s t r i b u t i o n a l o n g t h e s p a n o f b o t h t h e core- and bypass- s t a to r out le t guide vanes of this engine. The p u r p o s e o f t h i s r e p o r t i s t o p r e s e n t t h e r e s u l t s o f m e e t i n g t h i s o b j e c t i v e , t h u s f u l f i l l i n g t h e n e e d f o r s p a n w i s e d a t a which has of ten been expressed. (See refs . 5 and 14. The p resen t da t a , ob ta ined under s t a t i c a n d f l i g h t c o n d i t i o n s , are unique and provide the oppor tuni ty to s tudy exper imenta l ly the s ta tor -vane response under two w i d e l y d i f f e r e n t t e s t condi t ions f o r a n a c t u a l e n g i n e . The d a t a are analyzed by using time h i s t o r i e s , t h e s i g n a l - enhancement technique, narrow-band spectra, probabi l i ty -dens i ty- func t ion ana lys i s , and phase- and coherence-funct ion analysis . Comparisons between the s ta t ic and f l i g h t r e s u l t s are made.
SYMBOLS AND ABBREVIATIONS
A
BPF
BW
F1
2F1
F2
2F2
F1 BPF
maximum a l t i t u d e
blade-passage frequency
bandwidth, Hz
fundamental tone associated with BPF of low-speed f an
f i r s t harmonic of F1
fundamental tone associated with BPF of high-speed compressor
f i r s t harmonic of F2
low-speed fan-rotor blade-passage-frequency fundamental tones
-~ - . ~~
'Manufactured by P r a t t & Whitney A i r c r a f t of Canada. ""_" "~
2

F2 BPF
FPL
f
n ( t )
PDR
P(X)
R
RTV
SMT
s ( t )
Ta
t
X
v 2 ( f 1
A FPL
A PDR
6
Q n
0 2 n
2 Q S
4
w
high-speed-compressor blade-passage-frequency fundamental tones
f l u c t u a t i n g p r e s s u r e level, (2.9 X 10"' ps i ) , dB
frequency, Hz
random no i se , Gauss i an d i s t r ibu ted
p r o b a b i l i t y d e n s i t y f u n c t i o n
p r o b a b i l i t y d e n s i t y r a t i o
p r o b a b i l i t y d e n s i t y
r a t io of s i n e v a r i a n c e t o noise variance, a2102 s n
rubberized coat ing
stator-mounted transducer
s i n e s i g n a l , A s i n ( w t + 9 )
t i m e per iod of d a t a a n a l y s i s , sec
time, sec
amplitude
coherence function
s t a t i c -minus - f l i gh t f l uc tua t inq p re s su re l eve l , dB
s t a t i c -minus - f l i gh t p robab i l i t y dens i ty r a t io
s o l i d i t y
s t anda rd dev ia t ion of no i se s igna l , mV
var iance of Gaussian-dis t r ibuted random no i se , mV 2
var iance of s i n e s i g n a l , mv2
random phase angle, deg
radian frequency, 27rf
DESCRIPTION OF MPERIMENT
Engine
The test engine, shown i n the photograph and sketch of f i g u r e 1 , was a JT15D-1 two-spool turbofan engine. It b a s i c a l l y w a s an early-production model w i th t he
3

des iqn fea tures summarized i n t a b l e I. The engine had been modified (see t a b l e I) so that the rotor- interact ion tone with the core-s ta tor vanes would be a c o u s t i c a l l y c u t of f and produce lower broadband noise.
Figure l ( b ) shows some fea tu res o f t he test engine. The i n l e t u s e d i n t h e s ta t ic tests, a l though no t ' t he one u sed i n f l i gh t , w a s made o f f i b e r g l a s s t o t h e d imens ions o f the f l igh t in le t . S ix suppor t s t r u t s , which are l o c a t e d i n f r o n t of t he cen t r i fuga l co re compresso r , a r e pos i t i oned beh ind t he co re /bypass - s t a to r assem- bly. The s k e t c h a l s o shows a m u f f l e r f i t t e d t o t h e a f t p o r t i o n of the engine. The muf f l e r u sed du r ing t he s t a t i c tests had a d i f f e r e n t d e s i g n from t h a t u s e d i n f l i g h t . The purpose of using a m u f f l e r i n t h e s e t e s t s was t o reduce o r e l imina te any a f t no i se r ad ia t ion from the bypass duct which might compromise measurements of the f ront-end radiated fan noise .
Two photographs o f the ro tor b lades a re p resented in f igure 2. Typical metal angles and dimensions , a s measured on t h i s e n g i n e , are presented i n t a b l e 11. A c h a r a c t e r i s t i c a f f e c t i n g t h e f l o w t h r o u g h t h e b l a d e s i s t h e r a i s e d p o r t i o n s on t h e p re s su re and suc t ion s ides of t he ro to r . The la rges t ra i sed sur face ( somet imes r e f e r r e d t o a s a c l appe r ) is des igned t o be in c lose p rox imi ty w i th a counterpar t su r f ace on the oppos i te s ide o f an oppos i te b lade . (See f ig . 2 (a) . ) Once the engine i s s p i n n i n g a t a b o u t 2000 rpm, the ro to r b l ades assume a p o s i t i o n on the hub so t h a t t h e s e r a i s e d s u r f a c e s t o u c h e a c h o t h e r , t h u s s t i f f e n i n g t h e r o t o r b l a d e s . !the o t h e r r a i sed po r t ion had a d i f f e ren t des ign f rom tha t of t he c l appe r which a d d i t i o n a l l y s t i f fened the b lade . F igure 2 (b) shows tha t t he b l ades have a high degree of t w i s t and a c o n s i d e r a b l e v a r i a t i o n i n b o t h t h e m e t a l i n l e t a n d o u t l e t a n g l e s . This f i g u r e a l s o shows the core-s ta tor vanes and the w a l l s e p a r a t i n g t h e c o r e d u c t from the bypass duct. This wa l l i s loca ted j u s t downstream of the ro tor b lades .
Fiqure 3 presents both a photograph of the stator assembly showinq the core and bypass vanes and a sketch identifying the measurement transducers and the i r loca- t i o n s . The photoqraph (fiq. 3 ( a ) ) shows the sp l i t bypass vanes a long w i t h the transducer posit ions. Table I1 a lso p resents meta l angles and a s s o c i a t e d s t a t o r dimensions as measured on the engine.
Test F a c i l i t i e s and Setup
S t a t i c t e s t . - A photograph of the engine mounted on t h e o u t d o o r t e s t s t a n d a t t h e Ames Research Center i s shown i n f i g u r e 4. The engine w a s mounted so t h a t it w a s 15 f t above the concrete surface of the tes t a rea . For t h e results presented i n t h i s r epor t , no inf low control device covered the inlet . Far-f ie ld noise-measurement microphones si tuated on poles and on a t r a v e r s e r a i l may be seen. These microphones were placed approximately 1 2 f t from the engine fan face. (See ref . 20. )
Fl igh t test.- Fiqure 5 shows the research engine suspended beneath the wing of t h e t e s t a i r c r a f t . The a i r c ra f t ( a tw in -eng ine OV-1B) was flown with the starboard T53 turboprop enqine shut down and feathered to minimize inf low dis tor t ion during da ta acquis i t ion for the opera t ion of the JT15D-1. Resul t s of the fa r - f ie ld no ise measurements may be found i n re ference 21.
Test conditions.- Tests were conducted a t t h e o u t d o o r t e s t s i t e d u r i n g a time period when sur face wind speeds were less than 6 knots and the ambient temperature w a s approximately 62OF. Data were obtained a t four nominal engine speeds of 6750, 10 500, 1 2 000, and 13 500 rpm.
4

Dur ing t he f l i gh t tests, the t e s t - b e d a i r c r a f t w a s flown a t a c o n s t a n t a l t i t u d e of 300 f t with the f l ight speed maintained a t a constant nominal 130 knots. Wind speeds from the su r face to the f l i g h t a l t i t u d e were less than 10 knots, and tempera- t u r e s measured from t h e s u r f a c e up t o t h e f l i g h t a l t i t u d e were a nominal 60°F. For t h e s e f l i g h t tests, engine speeds ranged from a nominal 6700 r p m to approximately 15 000 rpm.
Ins t rumenta t ion
Descr ipt ion and mounting of pressure t ransducers . - Figure 3 p r e s e n t s a photo- g raph and ske t ch i den t i fy ing t he l oca t ions o f t he min ia tu re p re s su re t r ansduce r s u sed i n t h e s e tests. These transducers had a 0.04-in-diameter sensing area wi th a sens i - t i v i t y o f 1 V / p s i . For t h i s a p p l i c a t i o n t h e r e is an es t imated accuracy of 23 dB because of the harsh environment. The stator-mounted transducers (SMT), w i th i nd i - v idua l loca t ions denoted by le t ter des igna t ions A t o E, were bonded t o t h e s u r f a c e o f t he p re s su re s ide o f t he vanes a long t he span and 0.15 in . f rom the vane leading edge. Two t r ansduce r s were mounted a t l o c a t i o n s A and E ( f i g . 3 ( b ) ) so t h a t t h e y would be i n t h e boundary layer of e i ther the rotor hub or the bypass-duct outer wall. The SMT's were bonded with a rubber ized material (RTV). F igu re 6 (a ) p re sen t s a sketch of the mounting technique which shows the bonding material cove r ing t he t r ans - ducers. This technique w a s used t o p r o t e c t t h e t r a n s d u c e r s f rom any foreign objects which may be c o n t a i n e d i n t h e a i r f l o w . The t o t a l t h i c k n e s s of the project ion above the vane sur face w a s no g r e a t e r t h a n 0.014 in . This mounting technique w a s eva lua ted and determined to p re sen t min ima l i n t e r f e rence w i th t he measu red p re s su res . (See r e f . 23.)
Data-acquis i t ion system.- Figure 6(b) shows a ske tch of the da ta -acquis i t ion ins t rumenta t ion . S iqna ls from t h e s t a t o r t r a n s d u c e r were t ransmit ted through a hard- wired system in t he eng ine t o s igna l - cond i t ion ing and analog frequency-modulated magnetic tape-recording equipment. The ske tch a l so shows t h a t a s i g n a l w a s recorded which gave the p o s i t i o n of an instrumented rotor blade. This once-per-revolution pulse permitted the accurate measurement of fan speed and the appl icat ion of t he s iqnal-enhancement technique to s tudy the f luctuat ing-pressure data . The complete measurement system of f i g u r e 6 ( b ) had a flat response over the frequency range from 20 Hz t o 20 kHz. The dynamic range of the system w a s 120 t o 170 dB.
Dur ing t he f l i gh t tests, a i r c r a f t v a r i a b l e s ( s p e e d , a l t i t u d e , r o l l , etc.) and JT15D-1 engine var iab les ( fue l f low, in le t and bypass p ressures and tempera tures , etc.) were measured and recorded by using a digital-pulse code-modulated system. Details on a l l signal-conditioning and data-acquisit ion systems onboard the a i r c r a f t may be found i n r e f e r e n c e 24.
RESULTS AND DISCUSSION
A l l d a t a w e r e processed over a frequency range from 0 to 20 kHz by using a f a s t Fourier transform, dual-channel analyzer and per ipheral equipment to obtain averaged p res su re t i m e h i s t o r i e s , narrow-band constant-bandwidth spectra, signal enhancement, probabi l i ty funct ions, coherence, and phase information. A l l spec t ra l da ta have an analysis bandwidth of BW = 50 Hz and were analyzed for more than 3 sec. This pro- cedure insured that the random e r r o r w a s always less than fl .5 dB with a 90-percent conf idence l eve l . The r e l a t i o n s h i p s of t hese da t a as a func t ion of engine speed, and wi th r e spec t t o t he i r spanwise l oca t ions , were s tudied and are d i s c u s s e d i n this sec t ion .
5

I
Static-Test Resul t s
The i n i t i a l s t u d y of the pressure data took the form of cons ider ing the ampli- tude of pressure as it varied with time. Two techniques for s tudying these d a t a are as follows: ( 1 1 determining the unenhanced average pressure per increment of time, and ( 2 ) determining the s ignal-enhanced pressure per increment of time. Although the former is accomplished by averaging a defined number of samples of pressure over a time per iod which is not synchronized with the r o t o r r e v o l u t i o n , the s igna l - enhancement technique uses a once-per-revolution pulse to permit the synchronous averaging of the p res su re as it var ies wi th time r e l a t i v e t o the eng ine ro t a t iona l speed. This resul ts in averaging out any contaminat ing noise and presents the peri- od ic po r t ion of the averaged pressure time trace. (See re f . 25.) Since the measured p res su res are e s s e n t i a l l y t h e r e s u l t s of pe r iod ic wakes shed from the ro to r b l ades , it w a s expec ted tha t the unenhanced p res su re time trace (method 1 ) would appear t o be s t r o n g l y s i n u s o i d a l a t the fan- ro tor b lade-passage f requency , here inaf te r re fe r red to as BPF and designated as F, .
Figures 7 and 8 show some t y p i c a l measured unenhanced and enhanced r e s u l t s of pressure time traces d i s p l a y e d i n a 4-msec time increment. Figure 7 ( a ) shows some unenhanced average pressure time traces measured a t l o c a t i o n D a t engine speeds of 1 2 000 and 13 500 rpm f o r t h e s ta t ic tests. A t 1 2 000 r p m , t h e d a t a s u g g e s t t h a t a s t rong tone is p resen t ; however, the presence of a tone a t 13 500 rpm is not so w e l l - def ined. Figure 7(b) shows t h e r e s u l t s of signal enhancing the data measured a t l o c a t i o n D for the four enqine speeds of the s ta t ic test. By comparinq the unen- hanced da t a i n f i gu re 7 (a ) a t 1 2 000 rprn with its enhanced counterpar t in f ig - u r e 7 ( b ) , it may be seen that a s i n u s o i d a l s i g n a l t e n d s t o compose the s i g n a l i n f i gu re 7 ( a 1. The data comparison of f i g u r e 7 a t 13 500 rpm does not make such a clear d i s t inc t ion . Add i t iona l ly , by comparing the d a t a i n f i g u r e 7 ( b ) f o r t h e f o u r d i f fe ren t engine speeds , one may see tha t no t on ly does t he ampl i tude va ry bu t a l so t h e wave-shape changes of the p ressure trace do not appear as smoothly increasing frequency pat terns as the engine speed increases.
Fiqure 8 i n d i c a t e s the changing character of t h e s t a t o r r e s p o n s e i n a spanwise d i r ec t ion . Th i s f i gu re compares the signal-enhanced da ta of pressure time traces f o r a constant engine speed of 13 500 rpm for both the core ( A , B ) and bypass (D,E) loca- t i o n s . The f i g u r e i n d i c a t e s t h a t a spanwise d i f fe rence in wave shape is measured a t each locat ion on the core and bypass s t a t o r s . Thus, t he s t a to r f l uc tua t ing -p res su re d a t a of f i g u r e s 7 and 8 show p res su re - t r ace d i f f e rences a t a s i n g u l a r s t a t o r l o c a t i o n as a func t ion of engine speed and differences in shape along a rad ia l spanwise d i rec- t i o n a t a constant engine speed. These data, be l i eved t o be unique, are similar i n appearance and may be r e l a t e d to aerodynamic r e s u l t s , whereby hot-wire anemometry techniques were used t o measure the veloci ty-defect f low prof i les behind rotors and ahead of stators (See r e f s . 9 to 14 and 26. )
In order to measure the magnitudes of the unenhanced f luctuat ing pressures a t the fan-rotor BPF and a t its harmonics on the s t a to r vanes , narrow-band spectral ana lyses (BW = 50 H z ) were obta ined for the s ta t ic and f l i g h t tests. Figures 9 and 10 p r e s e n t t h e r e s u l t s f o r t h e static tests. Figure 9 shows the spectra f o r t h e core ( A , B ) , and f i g u r e 10 shows the spectra for the bypass ( D , E ) for the range of engine ro ta t iona l speed . Data f o r l o c a t i o n C are n o t a v a i l a b l e f o r p r e s e n t a t i o n . These spectra indica te the p resence of the fan- ro tor BPF, re la ted harmonics (or l ack of t h e m ) , and combination tones ( indicated by F1, 2F1, etc. 1 . Large mul t ip l e f r e - quencies below 3 kHz a t r a d i a l l o c a t i o n s D and E f o r 13 500 rpm are bel ieved to be t h e r e s u l t of aerodynamic shocks created by the supersonic rotor-blade t i p speed. (See r e f 21 .) A l s o , t h e d a t a show responses a t blade-passage frequencies compatible
6

with those of the high-speed compressor (designated as F2). Although the aerody- namic wakes shed from the fan rotor impact on t h e s t a t o r s and genera te the F1 f r e - quenc ie s , t h i s would not be the case for the high-speed compressor. (See f ig. 1 ( b ) The F BPF tones are generated by the core-compressor fan blades cutt ing the wakes shed &om the engine support s t ruts ahead of the compressor. (See ref . 6.) Acoustic p r e s s u r e s a t t h e s e F2 BPF tones have been measured i n t h e f a r f i e l d . ( S e e r e f s . 6 and 19.) Because of t h i s , t he f l uc tua t ing p re s su res a t the F2 BPF seen in f igures 9 and 10 a re thought to be acous t i c . The magnitudes of t he F2 FPL's are gene ra l ly la rger for the core loca t ions than for the bypass loca t ions , which would be reason- a b l e f o r t h i s test conf igura t ion .
Figure 11 compares the core and bypass FPL's a t the F1 BPF obtained from f i g - u r e s 9 and 10. The da ta show a s i g n a l which is gene ra l ly above the broadband noise by approximately 10 dB or more with the l e v e l s f o r b o t h s t a t o r s f a l l i n g between 140 and 165 dB. The broadband noise levels were p lo t t ed t o pe rmi t a la ter comparison wi th f l i gh t . These l eve l s , which were measured a t t h e base of the tones, are of t en s a i d t o be assoc ia ted wi th the tu rbulence of t he ro to r wakes. (See r e f . 25.) Fig- u r e 11 a l s o shows an obvious difference between the core data and the bypass data. A s the engine speed increases, the core data tend to increase in amplitude, whereas the bypass data have a d ip a t 10 500 rpm.
To i n v e s t i g a t e t h e c h a n g e i n f l u c t u a t i n g p r e s s u r e s a t t h e r o t o r BPF across the core- and bypass-stator span, the FPL's were p l o t t e d a s a percent of span length and a r e p r e s e n t e d i n f i g u r e 12. F igure 12(a) shows t h a t f o r l o c a t i o n s A and B on t h e core-stator vanes, changes on the order of 5 t o 1 0 dB o c c u r , e i t h e r r i s i n g o r d r o p - p ing as a function of engine speed. An except ion occurs a t 10 500 rpm where the spanwise d i s t r ibu t ion i s f l a t . For the bypass s t a to r ( f i g . 12 (b ) 1, it can be seen t h a t when moving radial ly outward f rom locat ion D t o E, i n c r e a s i n g f l u c t u a t i n g p r e s - sures are measured. I t is a lso observed tha t the lowes t and the l eas t change i n pressure magnitudes occurs a t 10 500 rpm.
Figure 13 presents the F2 FPL measured on the core and bypass s ta tors for the engine speeds of the s ta t ic tests. A s ment ioned prev ious ly , the s igna l i s be l ieved t o be acous t i ca l ly r e l a t ed t o t he co re compresso r . It i s obse rved t ha t t he co re da t a seem t o have a b e t t e r r a t i o of s ignal to noise than the bypass data , nei ther of which is a s good a s t h e r a t i o s i n f i g u r e 11. It can be s e e n t h a t t h e F2 FPL d a t a seem t o be more c o n s i s t e n t i n i nc reas ing i n l eve l a s eng ine speed i nc reases t han t he F1 FPL data. It may also be observed that the magni tudes of t he F FPL d a t a i n t h e c o r e a r e l a rge r t han i n t he bypass , w i th no measurable tone a t l o c a t l o n E a t a speed grea te r than 6750 rpm.
2
Hanson ( r e f . 2 ) has discussed the turbulence associated with the aerodynamic v e l o c i t y d e f e c t of t he wake shed behind a rotor blade. This wake may have both an amplitude and a posit ion modulation. The posit ion modulation is usua l ly small; how- ever, the amplitude modulation may be seve ra l o rde r s of magnitude greater than the
! average magnitude. Thus, in lieu of a pure sinusoidal-wave character seen by the s t a t o r a t the ro to r BPF, a s igna l such as tha t p resented in f igure 7 (a) may be observed. Signal enhancement (such as that presented i n f i g s . 7 ( b ) and 8) may do l i t t l e t o improve the wave shape . Data such as tha t in f igures 7 o r 8 could be e i t h e r narrow-band random noise or random noise which conta ins a pure tone. A narrow-band s p e c t r a l a n a l y s i s of data, such as t h a t i n f i g u r e s 7 or 8 (as presented i n f i g . 9 f o r unenhanced p r e s s u r e s ) , would not by i t s e l f d e t e r m i n e i f a tone con- t a ined i n no i se w a s of s teady or unsteady ampli tude. A s p a r t of t he ana lys i s of t h e da t a ob ta ined fo r t h i s report, it w a s d e s i r a b l e t o i n v e s t i g a t e t h e a m p l i t u d e
7

s t a b i l i t y of the f an - ro to r BPF tones ( such as t h o s e s e e n i n t h e spectra of f ig . 9 ) for t h e s t a t i c a n d f l i g h t cases.
References 10 and 25 discussed the use of performing a narrow-band ana lys i s o f the enhanced pressure time signal and comparing the magni tude of t h e BPF f rom the r e su l t i ng spec t rum wi th t ha t ob ta ined from the spectrum of the unenhanced pressure time s i g n a l . For c o n s t a n t e n g i n e s p e e d s , t h i s permits a n e s t i m a t i o n o f t h e amount of uns teadiness or randomness i n t h e f l u c t u a t i n g p r e s s u r e l e v e l a t t h e BPF i n t h e peri- odic po r t ion o f t he p re s su re time s i g n a l . It w a s n o t e d i n r e f e r e n c e 20, however, t h a t it is v e r y d i f f i c u l t t o m a i n t a i n a cons t an t f an speed when t e s t i n g o u t d o o r s wi thout an in f low cont ro l device . When the engine speed changes, phase changes i n t h e s i g n a l measured by t h e s ta tor t ransducers may be expected t o occur . Since the s ta t ic - tes t d a t a i n t h e p r e s e n t report were ob ta ined w i thou t an i n f low con t ro l dev ice , t he app l i ca t ion of the s igna l -enhancement t echnique ava i lab le dur ing th i s a n a l y s i s would not account for phase changes resul t ing f rom fan-speed changes. Addi- t iona l ly , the compar ison of the spectral ana lys i s o f s igna l -enhanced and s igna l - unenhanced pressures cannot account for the random phase var ia t ions which may occur i n t h e s i g n a l . ( S e e r e f . 27.) References 5 and 28 d iscuss th i s ensemble-averaging technique and compare i t w i t h t h e a p p l i c a t i o n o f t h e probability-density-function (PDF) ana lys i s t echnique . The PDF ana lys i s pe rmi t s one t o determine i f t h e r e i s a tona l s igna l added w i th no i se as w e l l as a measure of how uns teady o r random t h e amplitude is. S ince the PDF cons iders on ly the s iqna l ampl i tude , it i s n o t s u s c e p t i - b l e t o a n y f l u c t u a t i o n i n f r e q u e n c y o r e n q i n e r o t a t i o n a l s p e e d ( s u c h as the ensemble- averaging technique) or t o any random-phase var ia t ion which may occur.
!l%e PDF a n a l y s i s i s b a s e d o n t h e f a c t t h a t a d i sh - shaped p robab i l i t y dens i ty f u n c t i o n w i l l r e s u l t f o r a cons tan t -ampl i tude s inusoida l wave and t h a t a Gaussian- shaped p robab i l i t y dens i ty func t ion w i l l r e s u l t i f t h e wave i s narrow-band random noise. Thus, i f t h e two s i g n a l s are combined s o t h a t a s t a t iona ry and e rgod ic random-noise time h i s t o r y a p p e a r s i n t h e f o r m o f
i t has been shown (ref. 27) t h a t t h e p r o b a b i l i t y d e n s i t y of x ( t ) i s
I f t he va r i ance of t h e s i n e s i g n a l i s o2 and t h a t o f t h e n o i s e i s a2 t h e r a t i o of t h e t w o w i l l be
S n'
8

Typica l p lo t s of p ( x ) f o r d i f f e r e n t v a l u e s of R a re p resented i n f i g - ure 14. 'Ihis p l o t shows t h a t a s R i n c r e a s e s , t h e s i g n a l becomes inc reas ing ly s inu - s o i d a l w i t h a constant amplitude. 'Ihe r a t i o R may be p l o t t e d as a funct ion of the p r o b a b i l i t y d e n s i t y r a t i o PDR as determined by measur ing the ra t io o f the average magnitude of the side peaks to the magnitude of the minimum d e n s i t y a t x = 0 a s shown i n f i g u r e 15. This f i g u r e shows t h a t a s t h e PDR increases , the ampli tude of the tone becomes inc reas ing ly s t ab le . Thus, by measuring the PDR, a good q u a l i t a t i v e e s t i m a t i o n o f t h e s t a b i l i t y o f t h e t o n e may be a s ses sed . In con t r a s t t o t he l imi t a - t i o n of the s ignal-enhancement technique discussed ear l ier , the l imitat ion of the PDF a n a l y s i s is t h e i n s e n s i t i v i t y t o a PDR of uni ty . With t h e s e c o n s i d e r a t i o n s i n mind, t h e PDF a n a l y s i s w a s used t o s t u d y q u a l i t a t i v e l y t h e d e g r e e of amplitude steadiness i n t h e t o n e s . To e n s u r e t h a t t h e a n a l y s i s e r r o r was w e l l below t h a t of the measure- ment e r r o r of the t ransducers , the PDF of t he F1 and F2 B P F I s w a s obtained by measur- i n g t h e r e s u l t i n g s i g n a l a f t e r t h e o v e r a l l s i g n a l h a d b e e n b a n d p a s s f i l t e r e d w i t h a 7-percent bandwidth of the BPF. The analysis t ime Ta was always such that the minimum c r i t e r i o n o f Ta > 50/BW w a s exceeded by a f a c t o r o f 10. Thus, t h e a n a l y s i s e r r o r was est imated to be approximately less t h a n o r e q u a l t o 1 percent o f the t rue PDF.
Figure 16 presents examples of a t y p i c a l s e t of PDF d a t a f o r t h e s t a t i c t e s t a t 1 2 000 and 13 500 rpm for the p ressures measured on t h e c o r e s t a t o r a t l o c a t i o n A. I t can be seen tha t the PDF of t h e s i g n a l a t 1 3 500 rpm a p p e a r s t o be almost Gaussian shaped with an estimated PDR e q u a l t o 1.1. A t 1 2 000 rpm, the P D F shows t h a t a s t rong, constant ampli tude tone i s contained i n t h e s i g n a l w i t h t h e PDR e q u a l t o 1.5.
Figure 1 7 p re sen t s a graphic d i sp lay of the PDR a s a funct ion of the engine r o t a t i o n a l s p e e d f o r t h e s t a t i c t e s t s . The PDR da ta a re p resented for the core- s t a t o r l o c a t i o n s i n f i g u r e 1 7 ( a ) and for the bypass-s ta tor loca t ions i n f i g u r e 1 7 ( b ) . A comparison of the two da ta sets ind ica t e s t ha t t he co re F1 tones tend to be l e s s s t ab le , w i th less f luc tua t ion i n s t ab i l i t y a s speed i nc reases , t han t he bypass t ones . Thus, the core F1 tones are obscured by random noise, are themselves narrow-band random noise, or have unsteady amplitudes. Generally, the bypass F1 tones do not seem t o be narrow-band random noise b u t do appear to f luc tua te in s t rength of ampli- t u d e s t a b i l i t y .
Although not presented, the PDF ana lys i s of the high-speed-compressor F2 BPF tone data showed a l l a m p l i t u d e s t o be Gaussian dis t r ibuted. This would be compatible wi th acous t i c s igna l s which would propagate through a turbulent-f low environment, such as t h a t which e x i s t s from the core compressor to the bypass-stator area.
Fl ight-Test Resul ts
Fo r t he f l i gh t tests, s t a to r -p res su re da t a were ob ta ined fo r 10 d i f f e r e n t e n g i n e speeds from a nominal 6700 rpm to approximately 15 000 rpm. The narrow-band (50-H~ BW) spec t r a of the unenhanced pressures measured a t each locat ion on t h e s t a t o r s f o r each engine speed are presented in f igure 18. The da ta show the BPF for the low- speed fan (F1) and high-speed compressor (FZ) with the related harmonics and combi- na t ions of F1 and F2.
The da ta are p resen ted i n f i gu res 19 t o 21 t o i n d i c a t e how the magnitudes of t he FPLIs chanqed f o r t h e F1 BPF as a func t ion of engine speed and spanwise location. Figure 19 compares the core and bypass levels as a func t ion of engine speed. This f i g u r e shows the core p ressures a t the fan- ro tor BPF ( F1 1 f o r l o c a t i o n s A and B to be
9

q u i t e d i f f e r e n t f r o m t h e b y p a s s p r e s s u r e s measured a t l o c a t i o n s C, D, and E. The co re FPL's remain about 10 dB above the broadband levels and smoothly increase as t h e engine speed increases . The broadband FPL's fo r t he bypass da t a have abou t t he same magnitude and trend with engine speed as t h o s e f o r t h e core. The FPL's a t t h e F1 BPF fo r t he bypass l oca t ions , however, show a l a r g e f l u c t u a t i o n o f v a l u e s f o r i n c r e a s i n g engine speed. Rapid changes i n l e v e l f o r a l l bypass loca t ions occur as the eng ine speed moves from 9525 t o 10 91 7 rpm. Behavior i n t h i s r e g i o n is thought t o be incon- s i s t en t w i th behav io r wh ich may be due t o wake changes alone. Thus, nonuni formi t ies i n r o t o r e x i t f l o w a n d a e r o a c o u s t i c phenomena may be i n f l u e n c i n g t h e s t a t o r pres- sures . (See re fs . 25 and 29. )
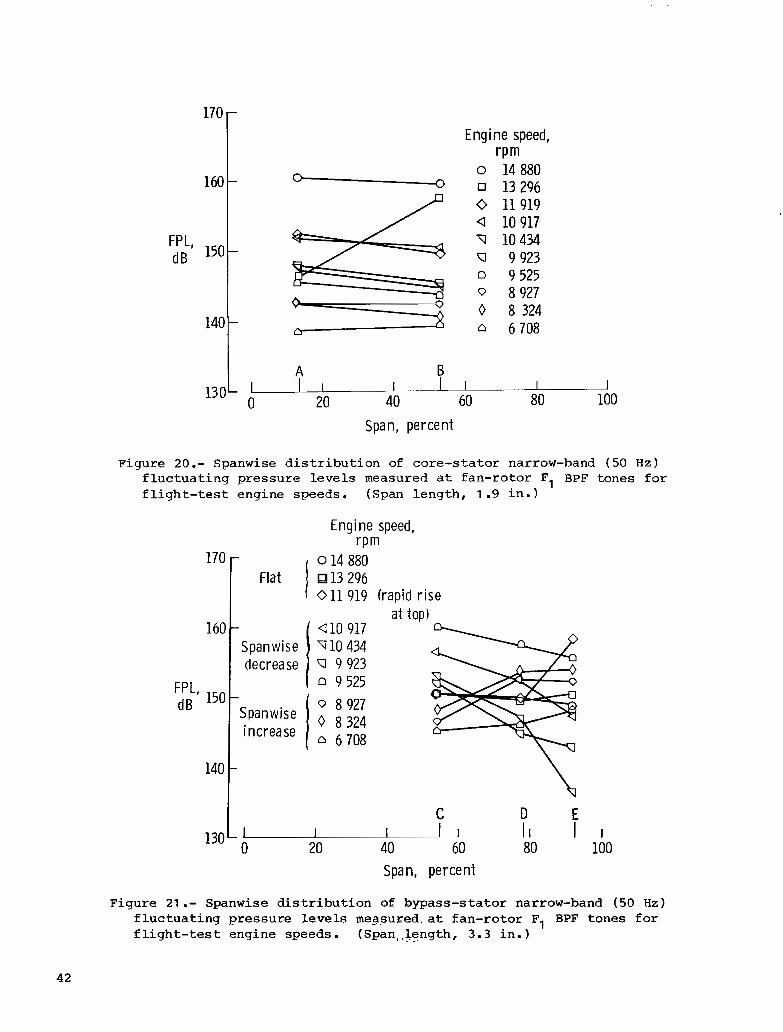
Figures 20 and 21 p r e s e n t t h e s p a n w i s e d i s t r i b u t i o n o f t h e F1 f l u c t u a t i n g p r e s s u r e l e v e l s a t t h e BPF fo r t he eng ine speeds ob ta ined du r ing t he f l i gh t s . F ig - u r e 20 s h m s t h a t a l o n g t h e c o r e s p a n , t h e r e i s a un i fo rm f luc tua t ing p re s su re a t t h e BPF. There is a s l i g h t d e c r e a s e i n magnitude i n a r a d i a l d i r e c t i o n a t any one engine speed except a t 13 296 rpm, where t h e r e i s a r a p i d rise i n l e v e l . lhis gene ra l un i - formi ty is n o t a p p a r e n t f o r t h e s p a n w i s e d i s t r i b u t i o n o f t h e b y p a s s d a t a p r e s e n t e d i n f i g u r e 21. Th i s f i gu re shows t h a t a t t h e t h r e e h i g h e s t s p e e d s of 14 880, 13 296, and 1 1 919 rpm, t h e r e t e n d s t o be a un i fo rm f luc tua t ing pressure on t h e s t a t o r s excep t a t t h e t i p l o c a t i o n E, where a 10-dB rise occurs a t 11 919 rpm. There i s a c o n s t a n t d e c r e a s e i n t h e f l u c t u a t i n g p r e s s u r e f o r t h e e n g i n e r o t a t i o n a l s p e e d s between 10 917 and 9525 rpm as the pos i t ion rad ia l ly changes f rom loca t ion C t o E. The lowest speeds of 8927, 8324, and 6708 rpm t e n d t o e x h i b i t a s p a n w i s e i n c r e a s e i n t h e F P L ' s , which i s i n i t i a l l y r a p i d f o r 8927 and 8324 rpm.
The s t ead iness of the ampli tudes of these F1 BPF's were inves t iga t ed i n an a t t empt t o ga in an in s igh t i n to t he f l uc tua t ing -p res su re da t a . F igu re 22 shows the PDR of the core and bypass data as a func t ion of the enqine speed. The core da ta ( f i g . 22 ( a ) ) show t h a t as the engine speed increased, the s teadiness of the F1 ampl i tudes genera l ly increased , thus ind ica t ing less turbulence o r an increase in ampl i tude s t ab i l i t y . Th i s is no t s een i n f i gu re 22 (b ) which shows t h a t as the engine speed increases , the unsteadiness of the ampli tudes of the BPF's i nc rease ; t ha t is, t h e r e is a genera l decrease in PDR, thus ind ica t ing grea te r tu rbulence o r a decrease i n a m p l i t u d e s t a b i l i t y .
The FPL's associated with the high-speed-compressor blade-passage frequency (F2) were measured f o r t h e f l i g h t case and are p resen ted i n f i gu re 23 as a func t ion of the engine speed. These data, as discussed earlier, are be l i eved t o be acous t i c pressures and can be s e e n t o have a greater magni tude in the core area ( f i g . 2 3 ( a ) than in the bypass area ( f ig . 23 (b ) ) . Add i t iona l ly , a l l PDF's of the F2 d a t a were analyzed and observed to be Gaussian shaped, a c h a r a c t e r i s t i c of narrow-band random noise .
I t is be l ieved tha t the core FPL's e x h i b i t d i f f e r e n t c h a r a c t e r i s t i c s from the bypass FPL's because of d i f f e rences between the f low distributions which ex is t a round the spinning-rotor hub, within the core duct , and wi th in and along the walls of the bypass duct. These f low differences would r e s u l t from hub and w a l l boundary-layer e f f ec t s , f l ow sepa ra t ion and vortex shedding from ro to r b l ades , ro to r -b l ade t i p s cutt ing through the bypass-duct w a l l boundary layer, and secondary flow. (See r e f s . 9 t o 16.) Additionally, it is known t h a t a rad ia l ly asymmetr ica l wake p r o f i l e is l i k e l y t o e x i s t b e h i n d a ro to r b l ade ( r e f s . 1 2 , 26, and 30) and tha t t he b l ade s t i f f e n e r s a f f e c t t h e f l o w and pressure losses over the fan blade ( ref . 31 1. The common w a l l shared by the core and bypass ducts, al though unknown i n its e f f e c t s , is expec ted t o compl i ca t e fu r the r t he i n t e rp re t a t ion of the measured pressures. F ina l ly , th i s nonuni formi ty of the spanwise d i s t r ibu t ion of the core and bypass FPL's
10
may be r e l a t e d t o wake var iance from ro tor b lade to ro tor b lade , which is caused by blade-geometry variance due to fabrication and uneven wear.
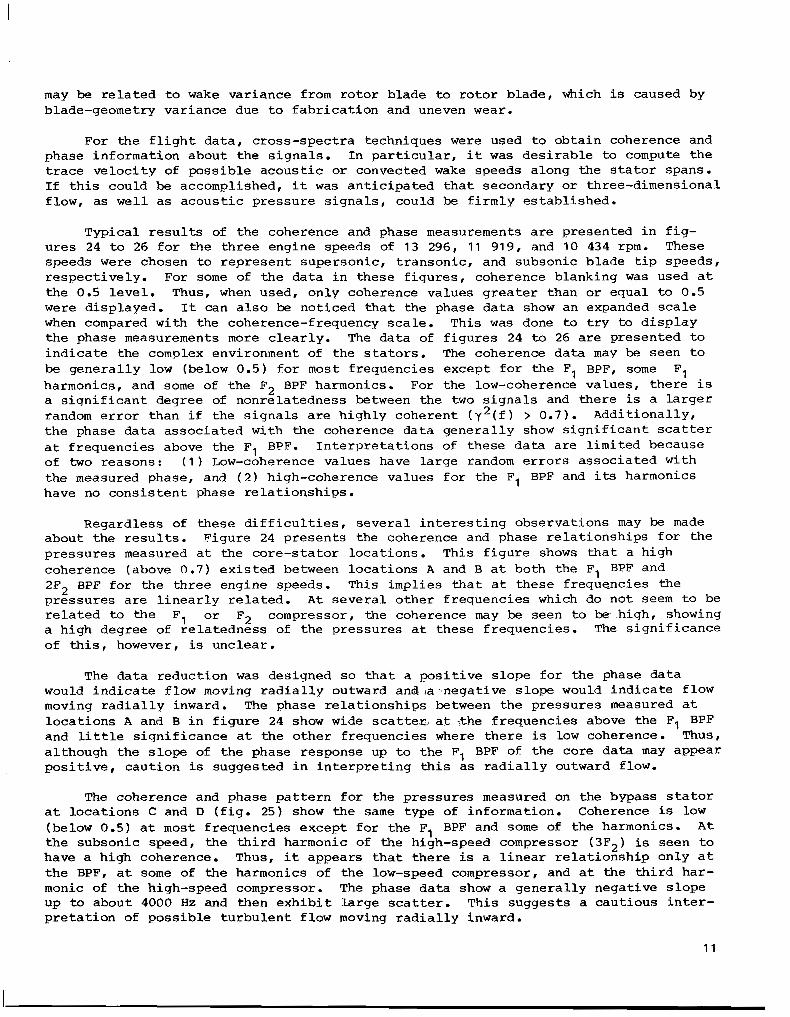
For the f l igh t da ta , c ross -spec t ra t echniques were used to obtain coherence and ,phase information about the s ignals . I n p a r t i c u l a r , it w a s d e s i r a b l e t o compute the t r a c e v e l o c i t y of possible acoust ic or convected wake speeds a long the s ta tor spans. I f t h i s cou ld be accomplished, it was an t ic ipa ted tha t secondary o r th ree-d imens iona l f low, as wel l as acous t ic p ressure s igna ls , could be f i rmly e s t ab l i shed .
Typ ica l r e su l t s of the coherence and phase measurements are p resen ted i n f i g - ures 24 to 26 for the three engine speeds of 13 296 , 11 91 9 , and 10 434 rpm. These speeds were chosen to represent supersonic , t ransonic , and subsonic blade t ip speeds, respec t ive ly . For some of the da ta in these f igures , coherence b lanking w a s used a t the 0.5 l eve l . Thus, when used, only coherence values greater than or equal to 0.5 w e r e displayed. It can a lso be not iced tha t the phase da ta show an expanded s c a l e when compared with the coherence-frequency scale. This w a s done t o t r y t o d i s p l a y the phase measurements more c l e a r l y . The da ta of f i g u r e s 24 t o 26 a re p re sen ted t o ind ica t e t he complex environment of t h e s t a t o r s . The coherence data may be s e e n t o be gene ra l ly low (below 0.5) f o r most f requencies except for the F1 BPF, some F1 harmonics, and some of t he F2 BPF harmonics. For the low-coherence values, there i s a s iqn i f i can t deg ree of nonrelatedness between the two s i g n a l s and there is a l a r g e r random e r ro r t han i f t he s igna l s a r e h igh ly cohe ren t ( y 2 ( f ) > 0.7). Addi t ional ly , the phase data associated with the coherence data general ly show s i g n i f i c a n t s c a t t e r a t f r e q u e n c i e s above the F1 BPF. I n t e r p r e t a t i o n s of these data are l imited because of two reasons: ( 1 ) Low-coherence values have large random er rors assoc ia ted wi th the measured phase, and ( 2 ) high-coherence values for the F1 BPF and its harmonics have no cons is ten t phase re la t ionships .
Regardless of t h e s e d i f f i c u l t i e s , s e v e r a l i n t e r e s t i n g o b s e r v a t i o n s may be made about the resu l t s . F igure 24 presents the coherence and phase re la t ionships for the pressures measured a t the core-s ta tor loca t ions . This f igure shows t h a t a high coherence (above 0.7) ex i s t ed between loca t ions A and B a t both the F1 BPF and 2F2 BPF for the th ree engine speeds . This impl ies tha t a t these f requencies the p r e s s u r e s a r e l i n e a r l y r e l a t e d . A t severa l o ther f requencies which do not seem t o be r e l a t e d t o t h e F, o r F2 compressor, the coherence may be seen to be high, showing a high degree of r e l a t edness of t he p re s su res a t t hese f r equenc ie s . The s ign i f i cance of t h i s , however , is unclear .
The da ta reduct ion w a s designed so t h a t a pos i t ive s lope for the phase da ta would ind ica te f low moving r a d i a l l y outward and, )a . .negative slope would ind ica te f low moving r a d i a l l y inward. The phase relationships between the pressures measured a t loca t ions A and B i n f i g u r e 24 show wide scattep. . a t ;the frequencies above the F1 BPF and little s igni f icance a t the o ther f requencies -where there is low coherence. Thus, a l though the slope of the phase response up t o t h e F1 BPF of the core data may appear pos i t i ve , cau t ion is s u g g e s t e d i n i n t e r p r e t i n g t h i s as r a d i a l l y outward flow.
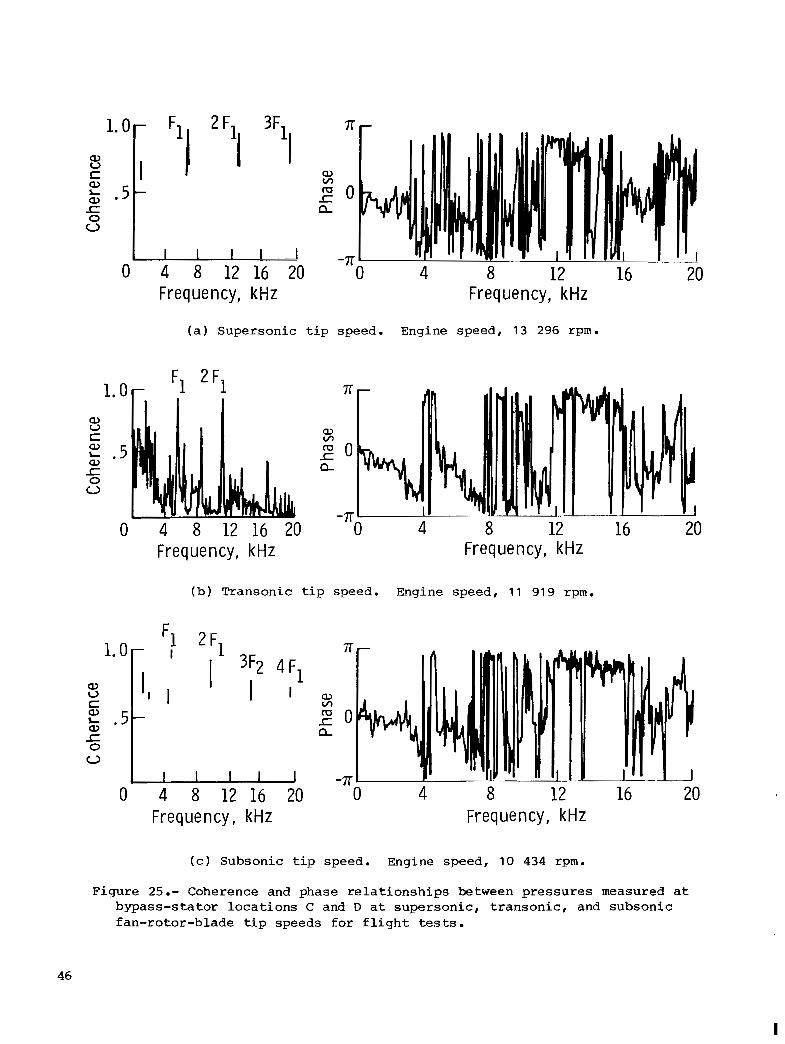
The coherence and phase pattern for the pressures measured on the bypass stator a t loca t ions C and D ( f i g . 25) show the same type of information. Coherence is low (below 0.5) a t most f requencies except for the F1 BPF and some of the harmonics. A t the subsonic speed, the third harmonic of the high-speed compressor (3F2) is seen to have a high coherence. Thus, it appears tha t there is a l i nea r r e l a t ionsh ip on ly a t the BPF, a t some of the harmonics of the low-speed compressor, and a t the t h i rd ha r - monic of the high-speed compressor. The phase data show a genera l ly nega t ive s lope up to about 4000 Hz and then exhib i t Parge sca t te r . This sugges ts a cau t ious i n t e r - p r e t a t i o n of poss ib l e t u rbu len t f l ow moving rad ia l ly inward .
11

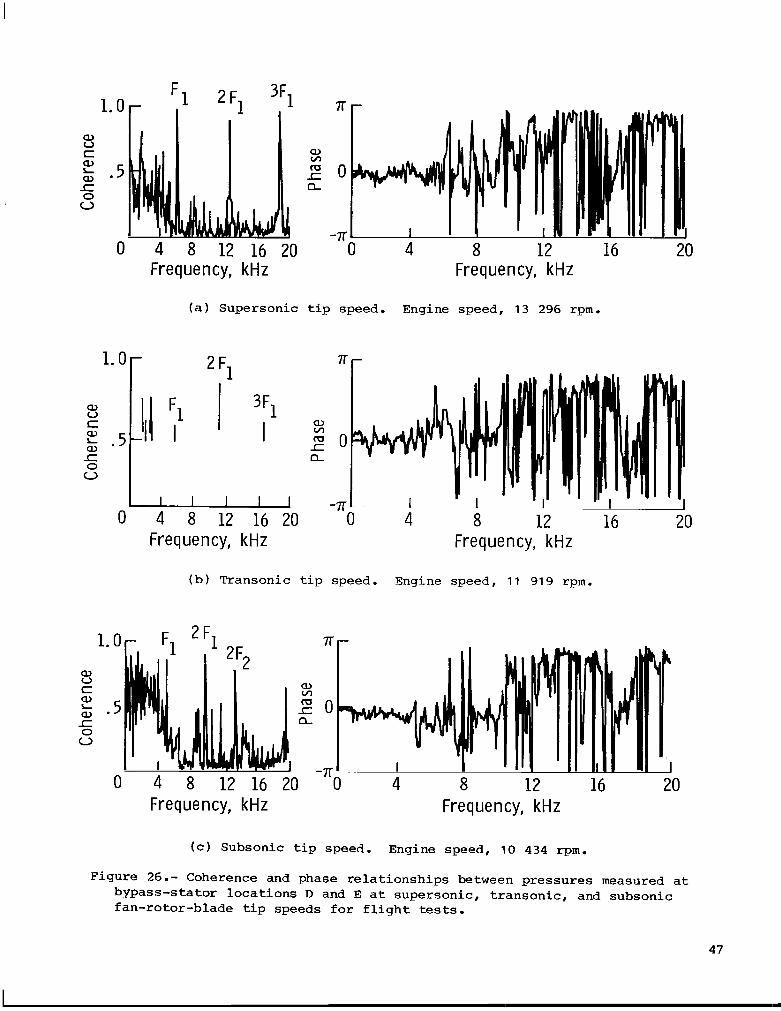
Data showing the coherence and phase relationship between the pressures measured a t the D and E loca t ions are p r e s e n t e d i n f i g u r e 26. Especially high coherence ( l a r g e r t h a n 0.8) is seen a t the subsonic and supersonic speeds for the low-speed-fan BPF (F1) and its harmonics and for the high-speed-compressor BPF (2F2) a t the second harmonic. A t the t ransonic speed , the Fl BPF coherence is not very high (0.65).
Thus, t he da t a o f f i gu res 25 and 26 sugges t a s t r o n g l i n e a r r e l a t i o n s h i p b e t w e e n the pressures measured by the bypass t ransducers a t subsonic and supersonic blade t i p speeds but a cons ide rab ly r educed l i nea r r e l a t ionsh ip a t t r anson ic b l ade t i p speeds f o r t h e F1 BPF pressure. The phase da ta sugges t a f l a t - s lope i nphase r e l a t ionsh ip below about 4 kHz f o r t h e s u b s o n i c b l a d e t i p speed, where the coherence appears t o be l a rge r t han 0.7. This is no t be l i eved t o be r ep resen ta t ive of secondary flow. The data above about 4 kHz fo r t he subson ic speed , and fo r a l l f requencies a t t h e t r a n s o n i c a n d s u p e r s o n i c b l a d e t i p s p e e d s , e i t h e r e x h i b i t l a r g e s c a t t e r o r may not be rel iably interpreted because of the low-coherence values .
Although the f l i g h t d a t a of f i g u r e s 24 t o 26 show high-coherence values a t the r o t o r BPF and its harmonics, the wide scatter of the phase data and low-coherence values precluded any meaningful interpretat ion of wave-trace veloci t ies . Similar behavior has been reported for some s t a t i c t e s t s . ( S e e ref. 5.) Such behavior is a t t r i b u t e d t o t h e s e v e r i t y of the environment , that is , turbulent f low and hard re f l ec t inq sur faces . (See re fs . 5 and 25.)
Comparison of S t a t i c and Fl ight Resul t s
Some comparisons of the s t a t i c d a t a w i t h t h e f l i g h t d a t a f o r t h e f a n - r o t o r F1 BPF tone ( f ig s . 11 and 19) for comparable engine speeds are p r e s e n t e d i n f i g u r e s 27 and 28. Figure 27 shows t h a t t h e c o r e - s t a t o r s t a t i c , a n d f l i g h t d a t a appear t o have the same t r end . Thus , bo th t he s t a t i c and f l i gh t FPL's a t t h e F1 BPF for core loca t ions A and B appear t o increase genera l ly up to approximate ly 1 2 000 rpm, where t h e p r e s s u r e s a t l o c a t i o n A t h e n a p p e a r t o d r o p i n v a l u e a t t h e n e x t h i g h e r e n g i n e speed. The pressures measured a t loca t ion B, however, t e n d t o i n c r e a s e d r a m a t i c a l l y for the next h igher engine speed . As d i s c u s s e d e a r l i e r , t h e s e c o r e d a t a of f i g u r e 27 do not have the same t rend as the bypass da ta . A comparison of the bypass-s ta tor s t a t i c and f l i g h t d a t a a r e p r e s e n t e d i n f i g u r e 28 a s a function of engine speed. a h i s f i g u r e shows the narrow-band FPL's a t t h e f a n - r o t o r F1 BPF tone as measured a t l o c a t i o n s D and E. The d a t a f o r l o c a t i o n E show the same g e n e r a l t r e n d f o r t h e s t a t i c and f l i g h t t e s t s ; however, t r e n d d i f f e r e n c e s b e t w e e n t h e s t a t i c a n d f l i g h t d a t a f o r l o c a t i o n D a re ev ident for increas ing engine speeds .
One may compare the spanwise d i s t r ibu t ions o f t he narrow-band FPL's of the F1 BPF t o n e s f o r t h e s t a t i c a n d f l i g h t d a t a by r e p l o t t i n g some of t he da t a p re sen ted i n f i g u r e s 1 2 , 20, and 21. These s ta t ic and f l igh t compar isons are p r e s e n t e d i n f i g - u r e s 29 and 30 f o r d a t a t h a t were measured a t comparable engine speeds and locations. Figure 29 shows t h a t f o r t h e c o r e d a t a , t h e s t a t i c t e s t s showed i n c r e a s i n g l e v e l s i n a rad ia l ly ou tward d i rec t ion for engine speeds of 6750 and 13 500 rpm, decreas ing l e v e l s a t 1 2 000 rpm, and cons tan t l eve ls a t 10 500 rpm. The f l i g h t d a t a show only one engine speed, 1 3 296 rpm, which r e s u l t s i n a n i n c r e a s i n g FPL i n a r a d i a l d i r e c - t i on . The FPL's dec rease r ad ia l ly ou tward fo r 1 1 919 and 1 0 434 rpm and appear con- s t a n t f o r 6708 rpm.
Figure 30 presents a similar spanwise-distribution comparison of the s ta t ic and f l i g h t d a t a f o r t h e b y p a s s s t a t o r . The s t a t i c - t e s t d a t a show, f o r l o c a t i o n s D and E, i nc reas ing l eve l s i n a radial ly outward direct ion for engine speeds of 6750, 10 500,
1 2

1 2 000, and 1 3 500 rpm. A t t he comparab le f l i gh t - t e s t speeds , t he f l i gh t da t a e x h i b i t s l i g h t , r a d i a l l y o u t w a r d i n c r e a s e s i n FPL a t 6 7 0 8 and 1 3 2 9 6 rpm, a s h a r p d e c r e a s e i n FPL a t 10 4 3 4 rpm, and a s h a r p , r a d i a l l y o u t w a r d i n c r e a s e i n FPL a t 1 1 919 rpm.
The da ta of f i g u r e s 27 to 30 suggest a complex environment i n which the core and bypass s t a to r s are immersed. Thus, no clear t rends seem ev iden t fo r t he va r i a t ion of t he FPL with engine speed or for the un i formi ty of the spanwise d i s t r ibu t ion of t he FPL's on the core and bypass s ta tors . As discussed earlier, this environment is b e l i e v e d t o be t h e r e s u l t of the differences in boundary-layer development along the ro to r b l ades , d i f f e rences i n hub and bypass-duct w a l l boundary layers, suspected asymmetrical wake p r o f i l e s due t o t h e r o t o r - b l a d e s t i f f e n e r s , and three-dimensional flow.
Figures 31 and 32 presen t t he d i f f e rences i n t he magn i tudes between the s ta t ic and f l i g h t FPL's f o r t h e f an-rotor F1 BPF tone and broadband noise. The f l i g h t l e v - els were sub t r ac t ed from the s ta t ic l e v e l s and are presented as a func t ion of engine speed. It is recognized tha t a l though the f l igh t and s ta t ic engine speeds are n o t equal , they are w e l l wi thin the experimental error associated with the ampli tudes. Figure 3 1 , which p r e s e n t s t h e s t a t i c - t o - f l i g h t d i f f e r e n c e s f o r t h e FIBPF l e v e l s , shows t h a t t h e l a r g e s t p o r t i o n of t he d i f f e rences lies above the ze ro r e fe rence l i ne with the s ta t ic tests producing hiqher ampli tudes than the f l ight tests by about 5 dB. The same observat ion may be made about the associated broadband levels pre- s e n t e d i n f i g u r e 3 2 . A poss ib l e r ea son fo r t he h ighe r s ta t ic l e v e l s is t h a t t h e o p e r a t i n g l i n e f o r t h e s ta t ic tests w a s h i g h e r t h a n f o r t h e f l i g h t tests , thus pro- ducing higher rotor loading. (See ref . 21 . ) Also , the engine did not have an inflow cont ro l device dur ing the s ta t ic tests. I t is known that because of the noniso t ropic na ture of t h e i n l e t t u r b u l e n c e which occurs during the s ta t ic tests, both tone and broadband acoust ic noise levels are la rger dur ing s t a t i c tests than du r ing f l i gh t . (See r e f . 3 . ) Addi t iona l ly , re fe rence 21 compared the tone and broadband f a r - f i e l d a c o u s t i c n o i s e f o r t h i s e n g i n e and showed the s t a t i c data (obtained without an inflow control . device) to be h i g h e r t h a n t h e f l i g h t d a t a .
The r e s u l t s of comparing the s t ead iness of the amplitudes of the fundamental tones as measured f o r t h e s t a t i c and f l i g h t data ( f i g s . 17 and 22) are p r e s e n t e d i n table I11 and f i g u r e 3 3 . Table I11 shows that the s t r eng th of the tone is not as l a rge fo r t he co re FPL's as for the bypass FPL' s , and f i g u r e 33 shows t h a t t h e r e appea r s t o be some d i f f e r e n c e between the static and f l igh t envi ronment as measured by t h e s t a b i l i t y of these tones. Thus, f i g u r e 33 appea r s t o show t h a t f l i g h t - t o n e a m p l i t u d e s t a b i l i t y is somewhat g rea t e r t han s t a t i c - tone ampl i tude s t ab i l i t y .
CONCLUDING REMARKS
S ta to r -vane f l uc tua t ing p re s su res were measured on a highly instrumented, f l i g h t - c e r t i f i e d JT15D-1 turbofan engine which w a s used i n a program by the Nat ional Aeronautics and Space Administration to s tudy forward-speed effects on fan-tone noise. These data, obtained for s ta t ic and f l i g h t tests, are be l i eved t o be unique and help fill the need for information about s ta tor-vane response for an engine in f l i g h t .
Pressure time traces ( r e s u l t i n g from the aerodynamics of the r o t o r wakes) were measured a t individual locat ions a long the leading edge of both a core and bypass s t a t o r . Data were obtained which showed nonuniform changes in t he ampl i tudes and wave shape of the p ressure wi th respec t to time fo r bo th a spanwise dis t r ibut ion of
13
these p ressure traces a t a constant engine speed and for these p re s su re traces a t any one loca t ion for d i f fe ren t engine speeds . The core spanwise d i s t r ibu t ions of the f l u c t u a t i n g p r e s s u r e l e v e l s (FPL) a t the fan-rotor blade-passage-frequency fundamen- t a l tones (pl BPF) were n o t i c e a b l y d i f f e r e n t from the bypass-stator FPL's as a func- t i o n of engine speed. The nonuniformity of these d a t a are believed due to the com- plex acoustic/aerodynamic .flow environment.
The core-s ta tor vanes exhib i ted fan F1 BPF ampl i tudes wi th p robabi l i ty dens i ty r a t i o s (PDR) lower than those for the bypass-stator-vane responses. This implies t h a t t h e y were not as stable as the bypass-stator-vane responses. A comparison of core and bypass PDR's wi th regard to s ta t ic and f l i g h t c o n d i t i o n s i n d i c a t e d t h a t some d i f f e rence ex i s t ed , t hus sugges t ing that the s ta t ic environment may have produced more unstable ampli tude tones than the f l ight environment . The magnitudes of t h e responses for the s ta t ic tests were g e n e r a l l y 5 dB g r e a t e r t h a n t h o s e f o r t h e f l i g h t tests. These r e s u l t s are b e l i e v e d t o be due t o t h e a n i s o t r o p i c n a t u r e of t h e i n l e t f low and higher rotor loading during the s t a t i c tests. There w a s a high spanwise coherence be tween s ta tor t ransducers for the f luc tua t ing pressures a t t he f an BPF's which ind ica t ed that they were exc i t ed by the same fo rc ing mechanism. Disturbance trace v e l o c i t i e s however could not be i n t e r p r e t e d a t the BPF f l u c t u a t i n g pressures because of the complex environment.
F luc tua t ing p re s su res were d e t e c t e d o n t h e stator vanes a t blade-passage f re- quencies of the high-speed core compressor. These l e v e l s were h ighe r on t h e c o r e - s t a t o r vane than on the bypass-stator vane, and a l l f l u c t u a t i n g p r e s s u r e l e v e l s had probabi l i ty dens i ty func t ions typ ica l o f nar row-band random noise. These f l u c t u a t i n g p r e s s u r e s are b e l i e v e d t o be a c o u s t i c s i n c e f a r - f i e l d a c o u s t i c t o n e s a t these high- speed-compressor fundamental tones (F2 BPF) have been measured*
Langley Research Center National Aeronautics and Space Administration Hampton, VA 23665 February 16, 1984
1 4
REFERENCES
1. Tyler , J. M.; and Sofr in , T. G.: Axial Flow Compressor Noise Studies . SAE Trans., vol. 70, 1962, pp. 309-332.
2. Hanson, Donald B.: Unified Analysis of Fan S t a t o r Noise. J. Acoust. SOC. America., vol. 54, no. 6, D e c . 1973, pp. 1571-1 591.
3. Cumpsty, N. A.; and Lowrie, B. Fans a t High Subsonic Speeds Ser. A: J. Eng. Power, vol.
4. Hanson, Donald B.: A Study of Mar. 1975,
5. Bliss, D. B.; Chandiramani, K.
W.: The Cause of Tone Generation by Aero-Engine and the E f f e c t of Forward Speed. Trans. ASME, 96, no. 3, J u l y 1974, pp. 228-234.
Subsonic Fan Noise Sources. AIAA Paper 75-468,
L.; and P ie rso l , A. G.: Data Analysis and Noise P red ic t ion fo r t he QF-1B Experimental Fan Stage. NASA CR-135066, 1976.
6. McArdle, J. G.; Jones, W. L.; Heidelberg, L. J.; and Homyak, L.: Comparison of Severa l Inf low Cont ro l Devices for F l igh t S imula t ion of Fan Tone Noise Using a JT15D-1 Engine. NASA T"81505, 1980.
7. Jones, W. L.; McArdle, J. G.; and Homyak, L. : Evaluation of Two Inf low Control Devices for F l igh t S imula t ion of Fan Noise Using a JT15D Engine. A I A A Paper 79-0654, Mar. 1979.
8. Atvars, Y.; and Rogers, D. F. : The Development of Inflow Control Devices f o r Improved Simulat ion of Fl iqht Noise Levels During Stat ic Test ing of a HBPR Turbofan Engine. AIAA-80-1024, June 1980.
9. Gal lus , H. E.; G r o l l i u s , H.; and Lambertz, J.: The Inf luence of Blade Number Ratio and Blade Row Spacing on Axial-Flow Compressor Stator Blade Dynamic Load and Staqe Sound Pressure Level. Paper 81-GT-165, American SOC. Mech. Eng., Mar. 1981.
10 . F lee te r , S . ; Jay, R. L.; and Bennett, W. A,: Rotor Wake Generated Unsteady Aero- dynamic Response of a Compressor S ta tor . Paper 78-GT-112, American SOC. Mech. Eng., Apr. 1978.
11 . Maqliozzi, B.; Hanson, D. B. ; Metzger, F. B.; and Johnson, B. V.: Noise and Wake Structure Measurements i n a Subsonic Tip Speed Fan. NASA CR-2323, 1973.
12. Shaw, L o r e t t a M.; and Balombin, Joseph R.: Rotor Wake Charac te r i s t i c s Re levan t t o Rotor -Sta tor In te rac t ion Noise Generation. NASA TM-82703, 1981.
13. Franke, G. F.; and Henderson, R. E.: Unsteady Stator Response to Upstream Rotor Wakes. A I M Paper 79-0579, Mar, 1979.
14. Jay, Robert L,; and Bennett, William A.: The E f f e c t s of S o l i d i t y , I n t e r b l a d e Phase Angle and Reduced Frequency on the Time-Variant Aerodynamic Response of a Compressor S t a t o r . AFOSR-TR-80-1041, U.S. A i r Force, June 1980. (Available from DTIC as AD A090 546. )
15. O'Brien, Walter F., Jr.; R e i m e r s , Stephen L.; and Richardson, Scott W.: I n t e r - a c t i o n of Fan Rotor Flow With Downstream S t r u t s . AIAA-83-0682, A p r . 1983,
15

17. Atassi, H.; and Hamad, G.: Sound Generated i n a Cascade by Three-Dimensional Disturbances Convected i n a Subsonic Flow. AIAA-81-2046, O c t . 1981.
18. Mueller, Arnold W.; and Preisser , John S. : Fl igh t Tes t o f a Pure-Tone Acoustic Source. NASA TP-1898, 1981.
19 . P re i s se r , J. S.; Schoenster, J. A.; Golub, R. A.; and Horne, C.: Unsteady Fan Blade Pressure and Acoustic Radiation From a JT15D-1 Turbofan Engine a t Simu- l a t e d Forward Speed. AIAA-81 -0096, Jan. 1981 .
20. Schoenster, James A.: F luc tua t ing Pressures on Fan Blades of a Turbofan Engine - S t a t i c and Wind-Tunnel Inves t iga t ions . NASA TP-1976, 1982.
21. Pre i sser , John S.; and Chestnut t , David: Fl ight Effects on Fan Noise With S t a t i c and Wind Tunnel Comparisons. AIAA-83-0678, Apr. 1983.
22. Schoenster, James A.: F luc tua t ing Pressure Measurements on t h e Fan Blades of a Turbofan Engine During Ground and F l igh t Tes t s . AIAA-83-0679, Apr. 1983.
23. Englund, David R.; G r a n t , Howard P.; and Lana t i , George A. : Measuring Unsteady Pressure on Rotat ing Compressor Blades. NASA TM-79159, [19791.
24. Knight, Vernie H., Jr.: In-Fl ight Je t Engine Noise Measurement System. Paper presented a t t h e ISA 27 th In t e rna t iona l Ins t rumenta t ion Symposium ( Ind ianapo l i s , I nd iana ) , A p r . 27-30, 1981 .
25. Hanson, Donald B.: Study of Noise and Inflow Distortion Sources i n t h e NASA QF-1 B Fan Using Measured Blade and Vane Pressures . NASA CR-2899, 1977.
26. Atassi, H. : Effect of Loading and Rotor Wake C h a r a c t e r i s t i c s on the Acoustic F ie ld of S ta tor Blades . AIAA Paper 76-566, J u l y 1976.
27. Bendat , Jul ius S.; and P ie r so l , A l l an G.: Engineer ing Applicat ions of Correla- t i o n and Spectral Analysis. John Wiley & Sons, Inc. , c.1980.
28. P i e r s o l , A. G.; Wilhy, E. G.; and Wilby, J. F.: Evaluat ion of Aero Commander Propeller Acoustic Data: Taxi Operations. NASA CR-159124, 1979.
29. Hanson, Donald B.: Study of Noise Sources i n a Subsonic Fan Using Measured Blade Pressures and Acoustic Theory. NASA CR-2574, 1975.
30. Shreeve, R. ; and Neuhoff, F. : Measurements of the Flow From a High Speed Com- pressor Rotor Using a Dual Probe D i g i t a l Sampling (DPDS) Technique. NPS67-82-010, U.S. Navy, Sept. 1982. (Available from DTIC as AD A122 432.)
31. P i c k e r e l l , D. J.: Rolls-Royce RB211-535 Power P lan t . J. Aircr., vol. 20, no. 1 , Jan. 1983, pp. 15-20.
16

TABLE I.- DESIGN FEATURES O F MODIFIED JT15D-1 ENGINE
Fan p r e s s u r e r a t i o ............................................................. 1.5
Bypass r a t i o ................................................................... 3.3
Hub / t ip r a t io ................................................................. 0.405
Rotor diameter. i n ............................................................. 21
Maximum fan ro ta t iona l speed . rpm ............................................ 16 000
Rotor blades ................................................................... 28
Core-stator vanes .............................................................. 71
Bypass-stator vanes ............................................................ 66
Rat io of number of bypass-s ta tor vanes to rotor blades ......................... 2.36
Rat io of number of core-s ta tor vanes to ro tor b lades ........................... 2.54
Rat io of rotor-blade spacing to bypass-s ta tor-vane spacing ..................... 1.83
Rat io of rotor-blade spacing to core-s ta tor-vane spacing ....................... 0.63
Primary exhaust area. in2 ...................................................... 79
Bypass exhaust area. i n 2 ....................................................... 190
17
TABLE 11.- METAL ANGLES AND DIMENSIONS OF ROTOR AND STATOR VANES OF JT15D-1 ENGINE
Radia l loca t ion above root, in.
0.30 .55
1.25 2.50 3.75 3.99 4.74 5 .OO 5.24 6.20
( a ) Rotor blade
Metal ang le s a t b lade loca t ions , deg
I n l e t
44.0 45.5 49.8 51 .4 58.5 59.7 63.6 64.9 66.3 73.2
Stagger
17.0 21 .4 33.7 45.2 52.6 54.2 58.3 61 .O 62.6 69.1
. .
~~
Exi t
-10.8 4.0
12.7 27.8 43.7 45.2 49.8 51 .4 53.2 60.4
(b) S ta tor vanes
Metal angles a t vane locations, deg
I n l e t Stagger Exi t Location
I I Core
Root SMT A SMT B Tip
-48.4 -46.4 -44.2 -40 -4
-31 - 3 -31 -2 -30 a6 -30 e7
-18 e3 -1 7 - 6 -1 5 -7 -13.3 pF SMT E
B Y F S S
-39 -0 -1 9.6 -36 3 -16.9 -35.5 -1 5 -3 -34.4 -14.0 -34 e 0 -1 4 e5
~~ . -
6.7 7.1 7.3 7.4 7.5
( c ) Dimensions
Component Average chord, in.
Rotor blade .......... Core-stator vane . . . . . 0.88 Bypass-stator vane . . . 1.53
Average span, in.
6.2 1 .89
3.3
S o l i d i t y , 6
1.93 1.88
~
18

TABLE 111.- COMPARISON OF mASURED PROBABILITY DENSITY RATIO FOR STATOR F1 BPF FLUCTUATING PRESSURES AS A FUNCTION OF ENGINE SPEED
[ S t a t i c and f l i g h t t e s t s 1
!-
probab i l i t y dens i ty r a t io a t eng ine ro t a t iona l speed Of - S MT
6750 rpm 13 296 rpm I 13 500 rpm 11 91 9 rpm 12 000 rpm 10 434 rpm 10 500 rpm 6708 rpm I I
( f l i g h t ) ( S t a t i c ) ( f l i g h t ) ( s t a t i c ) ( f l i g h t ) ( s t a t i c ) ( f l i g h t ) ( s t a t i c )
I Core-stator vane
I A
2.4 2.1 1.2 1 .o 1 .o 1 .o 1 .o 1 .O B 1 .o 1 .o 1 .5 1.5 1.3 1.2 1.2 1 .O
Bypass-stator vane
D 2 .o 1.5 1.2 2.3 2.2 1.5 2.7 2.5 E 1.9 1 .9 2.4 2.6 1 .o 1 .o 2.9 2.5

-Inlet--
-
t- JT15D-1- engine
66 bypass vanes
--Muffler--
c
L16 core-compressor blades
6 support struts
28 fan blades
(b) Cross-sec t iona l ske tch of JT15D-1 eng ine i n test conf igura t ion .
Figure 1.- Photograph and ske tch of JT15D-1 engine used in s ta t ic and f l i g h t tests.
20

(a) Overall view of f an rotor blades.
(b) Close-up view of fan rotor blades.
Figure 2 .- JT15D-1 rotor-blade assembly. L-84-10
21

L-80-896
(a) Stator-vane assembly.
22
(b) Transducer locations. All transducers are 0.15 i n . from leading edge. All dimensions are i n i n c h e s .
Figure 3 . - Photograph and sketch of stator-vane assembly and transducer locations.
"
L-82-117
Figure 4.- ST1 5D-1 engine mounted on outdoor static-test s tand a t t he A m e s Research Center.
23
Transducer housing, 6- Epoxy f i I let
Optical I
EpoxyA LPressure-sensit ive diaphragm w i th 0,0009-in. RTV overcoat
( a ) Transducer mounting.
Ai rc ra f t
(b) Sketch of stator-vane-mounted transducer data system in ST1 511-1 engine.
Figure 6.- Transducer-mounting technique and sketch of data-acquisit ion system.
24

E n g i ne speed, r Pm
13 500 0
Pressure, psi
0 12 000
I I I I I I I I Time, sec
(a) Unenhanced average p ressure time traces.
Engine speed, rDm
0 13 500 t
.t. 0.2 psi I
0 12 000
1
Pressure, psi
0 1 10 500
O k 6 750 k 0 . 5 msec
I I I I I I I I Time, sec
(b) Signal-enhanced pressure t i m e traces.
F igure 7.- Comparison of unenhanced average pressure and signal-enhanced pressure t i m e traces for c o n s t a n t s t a t o r l o c a t i o n D €or d i f f e r e n t static-test engine speeds.
25
I . . . .

Core location Pressure, 0.70
psi ps i A
Pressure, 0.70 psi psi Core
location B
Pressure, 0.7 ps i psi
I
Pressure, 0 7 psi psi
0 Time, sec
Bypass location
D
Bypass location
E
Figure 8.- Comparison of signal-enhanced pressure time t races a t core- and bypass- stator locations for static-test constant engine speed of 13 500 rpm.
26
140
Engine speed, 140 rPm
13 500
140 FPL, dB 12 000
140
10 500
140
6 750
Frequency, kHz
( a ) Location A.
Engine speed, rPm
140 13 500
FPL, 140 dB 12 000
140 10 500
140 6 750
-
0 ".
4 8 12 16 20 Frequency, kHz
( b ) Location B.
Figure 9.- Comparison of narrow-band (50 H z ) f l u c t u a t i n g p r e s s u r e spectra of core-s ta tor vanes for static-test engine speeds.
I

14(
14C
FPL, dB
130
130
Engine speed, rPm
13 500
-T l O d B j 1
12 000
10 500
6 750
4 8 12 16 20 Frequency , kHz
(a ) Location D.
I I
140
140
FPL, dB I
140
140
FPL, dB
130
6 750 I I 1 I I I 0 4 8 12 16 20
Frequency, kHz
(b) Location E.
Figure 10.- Comparison of narrow-band (50 Hz) fluctuating pressure spectra of bypass-stator vanes for static-test engine speeds.
28

Location
170
160
150
FpLt 140 dB
130
12c
11c
6 L
A .) Broadband B. P
I I u Engine speed, rpm
8 10 12 14 x103
( a ) Core s t a t o r .
Location
I I . 6 8 10 12 14 x1~3
Engine speed, r p m
(b) B y p a s s s t a t o r .
Figure 1 1 .- Stator-vane narrow-band (50 H z ) f l u c t u a t i n g pressure levels measured a t f an - ro to r F1 BPF t o n e f o r s t a t i c - t e s t engine speeds.
29

170
160
FPL, dB
150
140
170
160
FPL, dB
150
140
Engine speed, r Pm
0 13 500 0 12 000
1 I I 1 1 1 0 20 40 60 80 100
Span, percent
"
( a ) Core s t a t o r . Span length , 1.9 i n .
D E 1 I 1 1 1 1 I I 0 20 40 60 80 loo
Span, percent
( b ) Bypass s t a t o r . Span length; 3 . 3 in .
Figure 12.- Spanwise d i s t r i b u t i o n of measured narrow-band (50 H z ) f l u c t u a t i n g P res su re l eve l s of fan- ro tor F, BPF. tone for static-test engine speeds.
30

160
150
FpL' 140 dB
130
120
145
.~ 1 6
( a 1 Core s t a t o r .
h
P Location
A '1 Broadband O B 1 I 8 10 12 Ib x103
Engine speed, rprn
Engine speed, rprn
( b ) B y p a s s s t a t o r .
F igu re 13.- Comparison of measured narrow-band (50 H z ) f l u c t u a t i n g p res su re l eve l s fo r co re and bypass s t a t o r s a t c o r e - c o m p r e s s o r F2 BPF tones for s t a t i c - t e s t e n g i n e speeds .
31
.4
. 3 -
.2
- . . . . . . . . . . . .
-
.l-
0 . .
-4 -3 -2 -1 0 1 2 3 - 1 4
14.- P r o b a b i l i t y d e n s i t y f u n c t i o n s of s ine s igna l i n Gauss i an no i se . (See r e f . 27.) R = o,/an. 2 2
32
.- 0 m + nf
2 Y 1 - I 1.0 1.5 2 .(
PDR = y2/y1
1 2.5 3.0 3.5 4.0 Probabil ity density ratio, PDR
Figure 15.- Ratio of sine signal to noise power as a function of probability density ra t io . (See ref. 28.) R = as/an. 2 2
33
I
Probability density, p(x) .5 -
O b J -4 -2 0 2 4
( a ) PDF f o r l o c a t i o n A f o r s ta t ic- tes t engine speed of 13 500 rpm. PDR = y2/yl = 1 . l .
Probability 31 hT T 0
den s i ty, p (x)
+ I I -2 -2- 0 4
(b) PDF for l o c a t i o n A f o r s ta t ic- tes t engine speed of 12 000 rpm. PDR = y2 /y, = 1 .5.
Figure 16.- Examples t y p i c a l of measured p r o b a b i l i t y dens i ty func t ion and PDR of amplitudes of fan-rotor F1 BPF tone.
34

3 r Location o A
Engine speed, r p m
( a ) Core s ta tor .
Location O D V E
PDR 2l I 1 L 1 1 I 6 8 10 12 ldx 103
Engine speed, r p m
(b ) Bypass s ta tor .
Figure 17.- Comparison of probability density ratios of f luctuating pressures of Fl BPF tones as measured at s ta tor locat ions for s t a t i c - t e s t enqine speeds.
35

140
140
140
140
140
FPL, d B
140
140
140
140
13C
I 8 12 16
Frequency, kHz
r 1 F, 1
._ J 20
( a ) Locat ion A.
14 880
13 296
11 919
10 917
10 434
9 923
9 525
8 927
8 324
6 708
Figure 18.- Comparison of narrow-band (50 Hz) f l u c t u a t i n g p r e s s u r e spectra of s t a t o r v a n e s f o r f l i g h t - t e s t e n g i n e s p e e d s .
36
I

130
130
130
130
FpLl 130 d B
130
130
130
130
130
Engine speed, rPm
14 880
13 296
11 919
10 917
10 434
9 923
9 525
8 927
8 324
6 708
I I I’ 0 4 8 12 16 20
Frequency, kHz
(b) Location B.
Figure 18.- Continued.
37

13
13
13
13
13
FPL, dB
13
13
1 31
131
121
Engine speed, rPm
14 880
13 296
11 919
10 917
10 434
k 9 923
2 F.
8 927
8 324
I'
6 708 -~ I I
4 1
8 12 1
16 1
20
Frequency, kHz
( c ) Location C.
Figure 1 8. - Continued.
38

Engine speed,
130 10 917
130 10 434
FPL. dB
130 9 923
130 9 525
0
Frequency, kHz
(d) Locat ion D.
8 324
6 708
Figure 18.- continued.
39

130
130
130
130
130
130 FPL. dB
130
130
130
120
F1 ' 2F1 I Engine speed, rpm
14 880
13 296
10 917
10 434
9 923
9 525
8 324
6 708 - 1 4 8 12 16 20
Frequency, kHz
(e) Locat ion E.
F i g u r e 18.- Concluded.
40

170 -
160 -
150 -
FPL, dB
140 -
130 -
120 -
170-
160 -
150 -
FpL1 140 dB
-
130 -
120 -
110-
Location
I I I 6 8
I I 10 12 14 i 6 x1~3
Engine speed, r p m
( a ) Core stator.
Location
: 1 Broadband O E +
h
:
Engine speed, r p m
(b) Bypass stator.
Figure 19.- Stator-vane narrow-band ( 5 0 Hz) fluctuating pressure levels measured at fan-rotor F, BPF tone for f l ight-test engine speeds.
41
,,,r 160 1 -
dB
140
Engine speed, rP
o 14 880 0 13 296 0 11 919
7 10 434 KI 9 923 0 9 525 0 8 927 0 8 324 0 6 708
a 10 917
L A B 130 I I I 1 J
20 40 60 SO 100 Span, percent
Figure 20.- Spanwise d i s t r i b u t i o n of co re - s t a to r narrow-band (50 Hz) f l u c t u a t i n g p r e s s u r e l e v e l s measured a t fan- ro tor F, BPF tones for f l igh t - tes t engine speeds . (Span length , 1.9 i n . )
170
160
FPL, dB 150
140
130
Engine speed, rP m
0 14 880 Flat I 13 296
011 919 (rapid rise at toD)
I 0 8 927 Spanwise 8 324 increase 6 708
C D E I I I I 1 1 1 I 1 0 20 40 60 80 100
Span, percent
Figure 21 .- Spanwise d i s t r i b u t i o n of bypass-stator narrow-band (50 Hz) f l u c t u a t i n g p r e s s u r e l e v e l s measuzed, a t fan- ro tor F, BPF t o n e s f o r f l igh t - tes t engine speeds . (Spaq ,>length , 3 .3 in.)
42

I
2.5-
2 -
PDR
1.5 -
1-
3 r
2.5-
PDR 2 -
1.5-
1-
Location O A O B
I I I I " 6 8 10 12 14 16 x103
Engine speed, rpm
( a ) Core s t a t o r .
Location o c
I 6
I 8
I 10
I I 12 14 :6 x10³
Engine speed, rpm
( b ) Bypass stator.
Figure 22.- Comparison of p r o b a b i l i t y d e n s i t y r a t i o s of f l u c t u a t i n g pressures of F, BPF tones as measured a t S t a t o r l o c a t i o n s for f l ight- tes t engine speeds.
43

150 r Location
140 FP L, dB
130
z! !{ Broadband
160
150
140
FPL, dB
130
120
110
6 8 10 12 14 Engine speed, rprn
_I
16 x1~3
( a ) Core s t a t o r .
Location
OE+
u . ". .I_ ~- - ."I1 6 8 10 12 14 16 x1O3
Engine speed, rprn
( b ) Bypass s t a t o r .
Figure 23.- Comparison of measured narrow-band (50 Hz) f luc tua t ing pressure l eve ls of core and bypass s t a t o r s a t core-compressor F~ BPF tones for f l ight- tes t engine speeds.
44

I
0 4 8 12 16 20 0 4 8 12 16 20 ..
Frequency, kHz Frequency, kHz
( a ) Supersonic t i p speed. Engine speed, 13 296 rpm.
1.0 - - 1 1
W
2 1 W 1 1 , W
2 . 5 - -c Z O -c 0 0
a.
I J -7-r
0 4 8 12 16 20 0 4 8 12 16 20 s .
Frequency, kHz Frequency, kHz
(b) Transonic t ip speed . Engine speed , 11 91 9 rpm.
1.0 W V
W I= a,
1I a. 2 . 5 2 0 c 0 0
0 4 8 12 16 20 0 4 8 12 16 20 -7-f
Frequency, kHz Frequency, kHz
(c) Subsonic t i p speed. Engine speed, 10 434 rpm.
Figure 24.- Coherence and phase relationships between pressures measured a t co re - s t a to r l oca t ions A and B a t supersonic , t ransonic , and subsonic f a n - r o t o r - b l a d e t i p s p e e d s f o r f l i g h t tests.
45
0 4 8 12 16 20 o 4 8 12 16 20 Frequency, kHz Frequency, kHz
( a ) Supersonic t ip speed. Engine speed, 13 296 rpm.
1.0 a V c Q)
. 5 1= Z O l= Q)
0 0
Q
0 4 8 12 16 20 0 4 8 12 16 20 -7T
Frequency, kHz Frequency, kHz
( b ) Transonic t ip speed. Engine speed, 11 919 rpm.
1.0- F1 2F1 7T
' I Q, V c 1, I I i a v)
3F2 4 F~
E .5- 2 0 12 W
0 a.
0 I I I 1 I -77.
0 4 8 12 16 20 0 4 8 12 16 20 Frequency, kHz Frequency, kHz
( c ) Subsonic t ip speed. Engine speed, 10 434 rpm.
Figure 25.- Coherence and phase relationships between pressures measured a t bypass-s ta tor loca t ions C and D a t supersonic , t ransonic , and subsonic f an - ro to r -b l ade t i p speeds fo r f l i gh t tests.
46
I
1.0 Q) V
Q) c Q) v,
& .5 2 0 1IT a 0 0
-T
0 4 8 12 16 20 " 0 4 8 12 16 Frequency, kHz Frequency, kHz
( a ) Supersonic tip speed. Engine speed, 13 296 rpm.
1. O r 2 F.
0 4 8 12 16 20 0 4 8 12 16 -.
Frequency, kHz Frequency, kHz
Y 20
I
20
(b) Transonic t ip speed. Engine speed, 11 91 9 rpm.
1.0 7T
Q) V c Q)
Q) v,
& .5 2 0 r a 0 0
0 4 8 12 16 20 0 4 8 12 16 20 -7T
Frequency, kHz Frequency, kHz
(c ) Subsonic t i p speed. Engine speed, 10 434 rpm.
Figure 26.- Coherence and phase r e l a t ionsh ips between pressures measured a t bypass-s ta tor locat ions D and E a t supersonic , t ransonic , and subsonic fan- ro tor -b lade t ip speeds for f l igh t tests.
47

170
160
FpLi 150 dB
140
130
Static Fl ight Location 0 0 A 0 rn B
I 1 1. . I I 6 8 10 12 14 x lo3
Engine speed, r p m
Figure 27 .- Comparison of s ta t ic and f l i g h t measured narrow-band (50 Hz) f l u c t u a t i n g p r e s s u r e l e v e l s a t fan- ro tor F, t one fo r co re - s t a to r l oca t ions A and B.
17(
16(
14(
13(
Static Flight Location 0 0 D O
Static Flight Location 0 0 D
1 I 1 I 6 8 10 12 14 x lo3
Engine speed, r p m
Figure 28.- Comparison of s ta t ic and f l i g h t measured narrow-band (50 Hz) f l u c t u a t i n g p r e s s u r e l e v e l s a t fan- ro tor F, t o n e f o r bypass-s ta tor loca t ions D an E.
48

170
160
FpL, 150 dB
140
130
Engine speed, r p m Static Flight o 13 500 13 296 0 12 000 11 919
A B I 1 - 1 1 1 I
20 40 60 80 Span, percent
Figure 29.- Comparison of c o r e - s t a t o r s t a t i c and f l i g h t spanwise d i s t r i - bution of narrow-band (50 Hz) FPL of fan-rotor F, BPF tone.
170
160
FPL, dB 150
140
130
Engine speed, r p m Static FI ig h t
0 13 500 13 296 0 12 000 11 919
0 10 500 + 10 434 A 6 750 1 6 708
I 20
I 40
D E I I I I
60 80 100 Span, percent
Figure 30.- Comparison of bypass-stator s ta t ic and f l i g h t spanwise d i s t r i - bution of narrow-band (50 H z ) FPL of fan-rotor F, BPF tone.
49
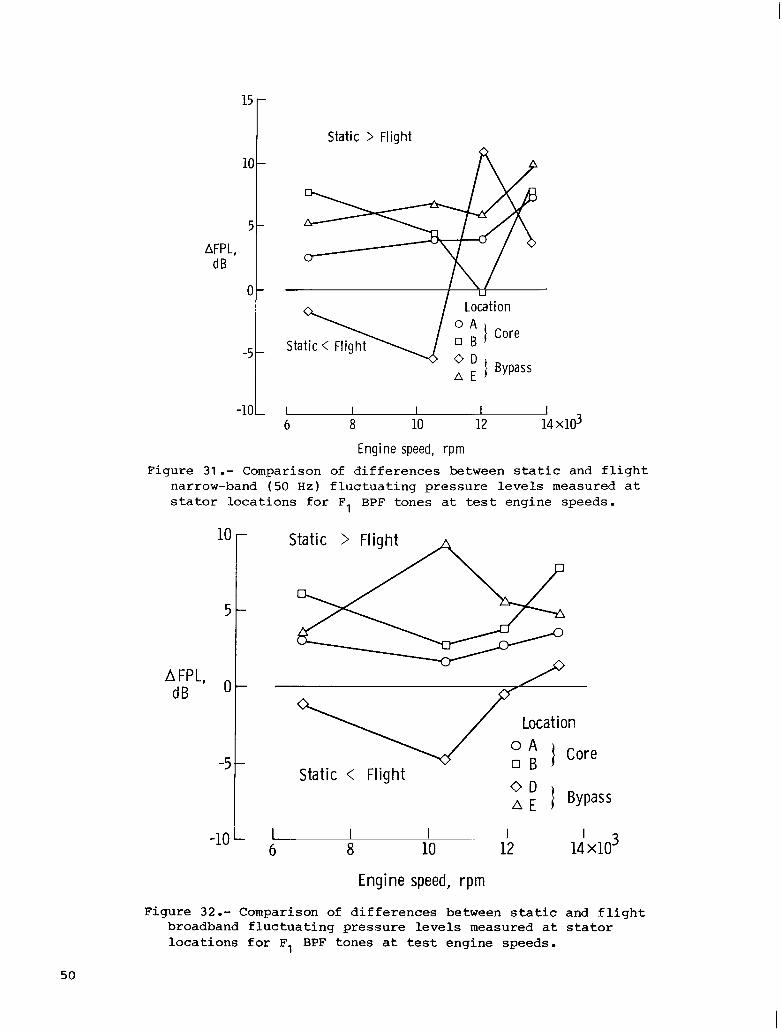
15 -
Static > Fl ight
AFPL, dB
I U
-1oL I I I I I 6 8 10 12 14 x103
Engine speed, rpm Figure 31 .- Comparison of differences between s ta t ic and f l i g h t
narrow-band (50 H z ) f l u c t u a t i n g p r e s s u r e l e v e l s measured a t s t a t o r l o c a t i o n s f o r F, BPF tones a t tes t engine speeds.
10
5
AFPL, d B
-5
-10
Location
Static < Flight O D 1 Bypass A E
1 I 1 1 6 8 10 12
Engine speed, r p m
Figure 32.- Comparison of differences between s ta t ic and f l i g h t b roadband f l uc tua t ing p re s su re l eve l s measured a t s t a t o r l o c a t i o n s f o r F, BPF tones a t test engine speeds.
50

2
1
APDR 0
-1
-2
Locat ion
O A 1 Core o B
Static < Flight
Engine speed, rpm
Figure 33 . - Comparison of d i f f e r e n c e s between s ta t ic and f l i g h t p r o b a b i l i t y d e n s i t y r a t i o s of f l u c t u a t i n g p r e s s u r e s of F, BPF tones as measured a t s t a t o r l o c a t i o n s f o r test engine speeds.
51

National Aeronautics and Space Administration
Washington, D.C. 20546 Official Business
Penalty for Private Use, $300
T H I R D - C L A S S B U L K R A T E Postage and Fees Paid National Aeronautics and Space Administration N A S A 4 5 1
1 1 I U , H , 8.40409 SOO303DS DEPT OF THE AIR FORCE AF NEAPONS LABORATORY
KIRTLAI\ID AFB NIM 87 1 16 Arm: T E C ~ N I C A L L I B ~ A R Y ( S U L )
NASA POSTMASTER: If Undeliverable (Section IS8 Postal Manual) Do Not Return

1. R e p 1 No. 2. Government Accession No, 3. Recipient's C a t a l o g No,
NASA TP-2217 4, Tttle and Subtttle 5. Repon Dare
STUDY OF STATOR-VANE FLUCTUATING PRESSURES I N A Apri l 1984 TURBOFAN ENGINE FOR STATIC AND FLIGHT TESTS 6. Performlng Organization Code
505-31-33-13 7. Authorlrl 8. Perlorming Organization Report NO.
Arnold W. Mueller L-15657
10, Work Unit No. 9 Performmg Organization Name and Addreu
NASA Langley Research Center Hampton, VA 23665
11. Contract or Grant No.
2. Swnlortng Agency Name and Address 13. Type of Repon and Perlod Covered
Technical Paper Na t iona l Aeronau t i c s and space Admin i s t r a t ion Washinqton, DC 20546 14. Spansoring A v n c y Code
5. Supplementary Notes
E. Abstract
A s part of a program to s t u d y t h e f a n n o i s e g e n e r a t e d f r o m t u r b o f a n e n g i n e s , f l u c t u - a t inq su r f ace p re s su res i nduced by f an - ro to r wakes were measured on core- and bypass- s t a to r ou t l e t gu ide vanes o f a modif ied JT15D-1 enqine. Tests were conducted with t h e e n q i n e o p e r a t i n q on an outdoor test s t a n d a n d i n f l i g h t . The ampl i tudes of pres -
h igher and appeared less s t a b l e f o r t h e s t a t i c tests than for t h e f l i g h t tests. sures measured a t fan- ro tor b lade-passaqe fundamenta l f requencies were g e n e r a l l y
compressor were i n t e r p r e t e d to be acous t i c ; however , d i s tu rbance trace v e l o c i t i e s f o r F luc tua t ing p re s su res measu red a t the blade-passage f requency of the high-speed core
e i t h e r t h e c o n v e c t e d rotor wakes or a c o u s t i c p r e s s u r e s were d i f f i c u l t to i n t e r p r e t hecause of the complex environment.
I . Key Words (Suggested by A ~ t h o r l s l )
Turbofan no i se sou rce S t a t o r - v a n e f l u c t u a t i n g p r e s s u r e s S t a t i c and f l i q h t n o i s e tests P r o b a b i l i t y - d e n s i t y a n a l y s i s Fan-rotor wakes
j. Security f lau i f . (of this report) 20. Security Clauif. lof thi'
U n c l a s s i f i e d U n c l a s s i f i e d
18. Dtrtributron Statement
U n c l a s s i f i e d - Unlimited
Sub jec t Ca tegory 71
Wd 21. No. of Pager 22. Rice
I 52 A04 J
Fat Sale by the National Technical lnfotmallon Servtce, Sprmefleld, Vlrglnla 22161 NASA-Langley. 1984
