study on high income group individual investors preferences … · study on high income group...
TRANSCRIPT
Study on High Income Group Individual Investors Preferences In
Capital Market With Respect To Risk On Investment: Special
Reference to Mumbai and Pune.
Dissertation Submitted
To
D.Y. Patil University, Navi Mumbai
Department of Business Management
In partial fulfillment of the requirements
For the award of Degree of
Master of Philosophy
In
Business Management
Submitted By
Mrs. Anamika Mitra
( Enrollment No.- DYP-M.Phil-11010 )
Research Guide
Professor Dr. Pradip Manjrekar
Dean
D.Y. Patil University, Navi Mumbai
Department of Business Management
Sector-4, Plot No. 10, CBD Belapur, Navi Mumbai
August 2014

Study on High Income Group Individual Investors Preferences In
Capital Market With Respect To Risk On Investment: Special
Reference to Mumbai and Pune.

DECLARATION
I hereby declare that the work presented in the thesis entitled “Study on High Income
Group Individual Investors preferences in Capital Market with respect to Risk
On Investment: Special reference to Mumbai and Pune.” Submitted for the Award
of Master of Philosophy in Business Management at the Dr. D. Y. Patil University,
Department of Business Management is my original work and the dissertations has
not formed the basis for the award of any degree, associate ship, fellowship or any
other similar titles.
The material borrowed from other sources and incorporated in the dissertation has
been duly acknowledge.
I understand that I myself could be held responsible and accountable for plagiarism, if
any, detected later on.
The research paper published based on the research conducted out of an in the course
of the study are also based on the study and not borrowed from other sources.
Ms. Anamika Mitra
Date: Aug,2014 M. Phil Scholar
Place: Navi Mumbai Enrollment No. :DYP-M.Phil-11010

CERTIFICATE
This is to certify that the dissertation entitled “Study on High Income Group
Individual Investors preferences in Capital Market with respect to Risk On
Investment : Special reference to Mumbai and Pune ” Is the bonafide research
work carried out by Ms. Anamika Mitra, in partial fulfillment of the requirements for
the award of the Degree of Master of Philosophy in Business Management and that
the dissertation has not formed the basis for the award previously of any degree,
associateship, fellowship or any other similar title of any University or Institution.
Also certified that the dissertation represents an independent work on the part of the
candidate.
Place: Navi Mumbai
Date: Aug,2014
Prof. Dr. R Gopal Prof. Dr. Pradip Manjrekar
Director & Head of Department Dean & Research Guide
Department of Business Management Department of Business Management
D.Y. Patil University, Navi Mumbai D.Y. Patil University, Navi Mumbai

ACKNOWLEDGEMENTS
I am grateful to Department of Business Management, D.Y. Patil University, Navi
Mumbai for giving me an opportunity to pursue M.Phil. I am especially grateful to
Prof. Dr. Gopal, Director and Head of the Department, Department of Business
Management, D.Y. Patil University, Navi Mumbai for encouragement and guidance.
I would specially like to express deep gratitude to my Guide Prof. Pradip Manjrekar,
Dean, Department of Business Management, D. Y. Patil University, Navi Mumbai. It
would be no exaggeration to say that this research would not have been completed
today without his rock steady guidance and moral support.
I sincerely thank my family for supporting me for this M. Phil research work and thus
have helped me in completing the M. Phil research work successfully.
Last I also wish to thank all my near and dear ones who have been directly or
indirectly instrumental in the completion of my dissertation.
Place: Navi Mumbai Ms. Anamika Mitra
Date: Aug,2014 M. Phil Scholar
INDEX
CHAPTER
NO.
TITLE PAGE NO.
List of Tables
List of Graphs
Executive Summary
1. INTRODUCTION
1-12
Indian Capital Market 1
Broad Constituents in the Indian Capital
Markets
2
Concepts and Definitions 3
Risk on Investment
7
Role Of SEBI In Indian Capital Market 7
Reforms In Capital Market Of India 8
Factors Affecting the Investors Preferences 10
Need For the Study 11
2. LITERATURE REVIEW 13-29
Research Gap 28
3. OBJECTIVE, HYPOTHESIS &
RESEARCH METHODOLOGY
30-37
Scope Of The Study
30
Objective of the study 31
Hypotheses of the study 31
Research Methodology 32
Limitation of Study 37
4.
PROFILE OF STUDY AREA AND
SAMPLE POPULATION
38-49
A Brief Profile of Mumbai and Pune city 38
Stock Exchanges in Mumbai and Pune 39
Profile Of Sample Population 42
5. ANALYSIS AND INTERPRETATION
OF DATA
50-103
6. FINDINGS AND CONCLUSION 104-109
7. RECOMMENDATIONS
110
8. BIBLIOGRAPHY
111-123
Annexure I - Questionnaire
123-128
LIST OF TABLES
Table No. List Of Tables Page No.
1 Age wise Distribution of respondents 43
2 Gender wise Distribution of respondents 44
3 Marital Status wise Distribution of respondents 45
4 Education wise Distribution of respondents 46
5 Annual Income wise Distribution of respondents 47
6 Annual Saving wise Distribution of respondents 48
7 Market Experience wise Distribution of respondents 49
8 Percentage wise Reasons for investment 51
8.1 Rank wise Reason for investment 52
9 Test of Normality for Investment options 54
9.1 Average Investment in Different financial assets 55
10 Rank Table of average Investment in Different financial
assets
56
11 Size of Investment in Equity Instruments 58
12 Age wise comparison with Investment 60
12.1 Rank Table of Age wise comparison with Investment 61
13 Education wise comparison with Investment 63
13.1 Rank Table of Education wise comparison with
Investment
64
14 Annual Income wise comparison with Investment 65
14.1 Rank Table of Annual Income wise comparison with
Investment
66
15 Gender-wise comparison with Investment 67
15.1 Rank Table of Gender-wise comparison with Investment 67
16 Age wise Comparison with Size of investment in Shares
69
17 Age wise Comparison with Size of investment in
Debentures
71

18 Age wise Comparison with Size of investment in Mutual
Funds
72
19 Gender wise Comparison with Size of investment in
Shares
73
20 Gender wise Comparison with Size of investment in
Debentures
74
21 Gender wise Comparison with Size of investment in
Mutual Funds
75
22 Education wise Comparison with Size of investment in
Shares
76
23 Education wise Comparison with Size of investment in
Debentures
77
24 Education wise Comparison with Size of investment in
Mutual Funds
78
25 Annual Income wise Comparison with Size of investment
in Shares
80
26 Annual Income wise Comparison with Size of investment
in Debentures
81
27 Annual Income wise Comparison with Size of investment
in Mutual Funds
82
28 Mean Preferences with respect to Mutual Fund Schemes
84
28.1 Actual Mean of Preferences 85
29 Sector wise investment in Shares 87
29.2 Mean rank table of Sector wise Investment Preferences in
Shares
88
30 Percentage wise number of companies in portfolio 89
31 Investor’s Concern w.r.t Investment 91
31.2 Table of residual for Investor’s Concern w.r.t investment 93
32 Respondent’s View on Strategy Change 94
33 Sector wise preference distribution 96
33.2 Mean rank table of Sector wise preference distribution 98
34 Factors Affecting Investment Decision 99
34.2 Mean rank table of Factors Affecting Investment Decision 100
35 Choices of Schemes w.r.t Mutual Fund 101
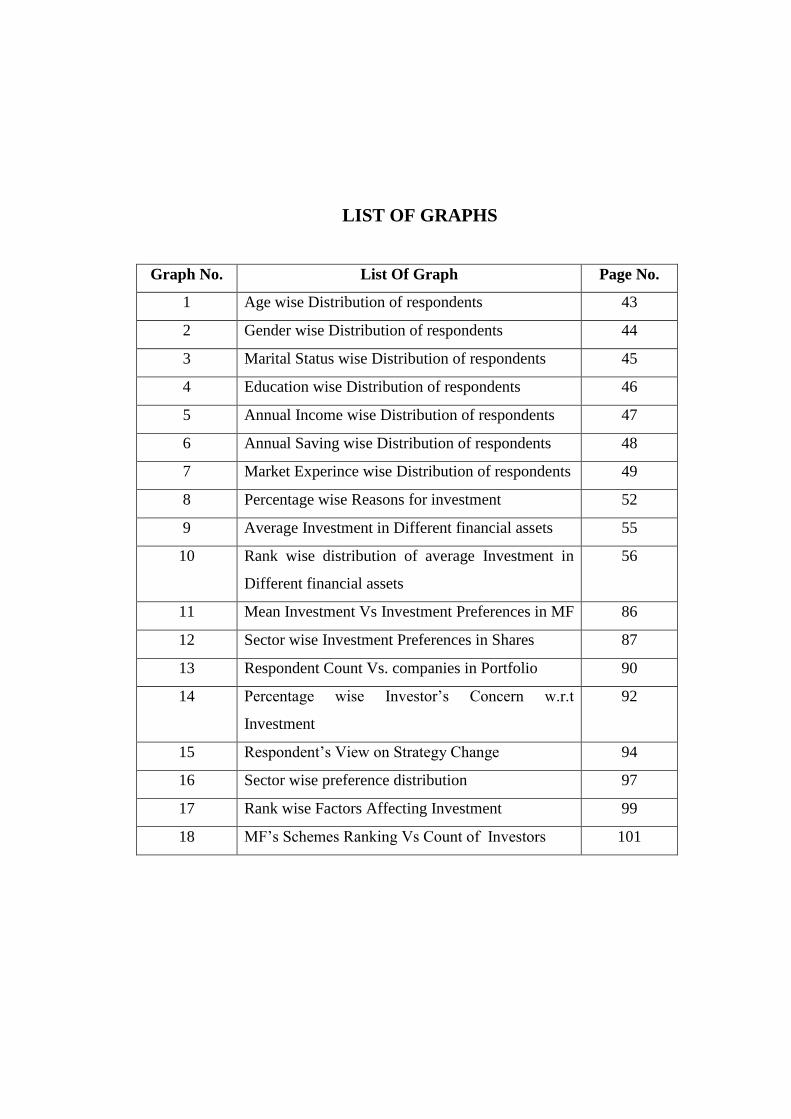
LIST OF GRAPHS
Graph No. List Of Graph Page No.
1 Age wise Distribution of respondents 43
2 Gender wise Distribution of respondents 44
3 Marital Status wise Distribution of respondents 45
4 Education wise Distribution of respondents 46
5 Annual Income wise Distribution of respondents 47
6 Annual Saving wise Distribution of respondents 48
7 Market Experince wise Distribution of respondents 49
8 Percentage wise Reasons for investment 52
9 Average Investment in Different financial assets 55
10 Rank wise distribution of average Investment in
Different financial assets
56
11 Mean Investment Vs Investment Preferences in MF 86
12 Sector wise Investment Preferences in Shares 87
13 Respondent Count Vs. companies in Portfolio 90
14 Percentage wise Investor’s Concern w.r.t
Investment
92
15 Respondent’s View on Strategy Change 94
16 Sector wise preference distribution 97
17 Rank wise Factors Affecting Investment 99
18 MF’s Schemes Ranking Vs Count of Investors 101

EXECUTIVE SUMMARY
EXECUTIVE SUMMARY
Capital Market is a one of the significant aspect of any financial market. Individual
investors represent a vital element for the functioning of capital market. But In India,
though the saving rate is high, barely two percent of these savings goes into financial
markets. With the rise in income, consumption patterns have changed and a new High
class has emerged, which is growing at a fast pace. There are large numbers of
investment opportunities available today. In this research work, it is going to briefly
examine how the High Income Group Individual Investor in Mumbai and Pune
manage their investments- their investment behaviour, their perception on investment
and if there exists a trend in their investment decisions. The study has been done to
find out the factors influencing their decisions on the Choice, Level and Size of
investment in different financial instruments in Capital Market. The study is based on
primary sources of data which are collected by distribution of a close ended
questionnaire. The data has been analyzed using percentage and chi-square test with
the help of statistical software. The results highlight that certain factors like education
level, awareness about the current financial system, age of investors etc... make
significant impact while deciding the investment avenues and there exists a trend in
the pattern of investment. Our descriptive analyses sheds new light on the links
between income and investments.
A well-organized and regulated capital market facilitates sustainable development of
the economy by providing long-term funds in exchange of financial assets to
investors. Investment is the employment of funds on assets with the aim of earning
income or capital appreciation. Investment is the most important things today. In spite
of such widespread interest of Indian investors in shares, investment knowledge is
very much lacking in them. This is evident from the fact that most of them usually get
attracted towards the stock exchanges like moths to a candle in periods of boom and
rising prices in a bid to become rich quickly. A proper understanding of money, its
value, the available avenues for investment, various financial institutions, the rate of
return/risk etc., are essential to successfully manage one’s finance for achieving life’s
goal. What are the fundamentals? And risk/return equations? And if investors are
ready to invest, how do they access the investments? Are there are restrictions or
disincentives that change the risk/return equation for the investors? These are some of
the questions that have been attempted to answer through this study. Actually, the
present research identifies the preferred investment avenues among the High Income
individual investors in Mumbai and Pune .
It is conferred that the most important reason for High Income Individual investors to
invest is Money required for emergency purposes and to secure their lives after
retirement. It is observe that there exists significant difference in the average
investment in different financial assets. Since Bank deposit, bond and other debt
options, provident fund and equity capital market options has resulted as prominent
option for investment. Bank, IT and Auto sector in shares is the most preferred sector
of investment. Most of the respondents have 6 to 10 companies in their portfolio. It
may conclude that people with Professional Degrees or Post graduation degrees have
a better understanding and willingness to invest in Capital Market Instruments.
Biggest concern in terms of respondent’s investment is for “Fall in sensex” Even most
of the respondents have fall in the category of “depression phase” and “inflation” with
next two positive residual.
Study indicates that Gender do effect the investment pattern like Males prefer Equity
Capital Market Instruments and Bank Deposits more than females as mode of
investment. Male population invest more than females in Shares. The Major concern
in terms of investment is Depressing phase in the market, risk associated with fall in
sensex and rising inflation. The most important criterion considered while operating
in Equity Market is Market Sentiments and the industry, Nature and type of Product.
Among the various capital market instruments available, Mutual Funds Schemes are
the most preferred instruments among investors followed by Shares and debentures.
Majority of investors have an experience of more than three years in capital market
investment.
The study indicates that majority of retail investors are investing major portion of
their savings in non-capital market instruments. The overall experience of investors
on capital market investment is that it is rewarding to majority of investors. Investors
mainly suggested the extension of more powers to SEBI on investor protection with a
view to improving capital market operations.
1
CHAPTER 1
INTRODUCTION
Indian Capital Market
Capital Market is a one of the significant aspect of any financial market. It is a market
for financial assets which has long or indefinite maturity. It is an institutional
arrangement for borrowing and lending money for a long period of time. Capital
markets involve various instruments which can be used for financial transactions.
Financial institutions like UTI, IDBI, ICICI, LIC etc play the role of lenders in the
capital markets. Business units and corporate are the borrowers in the capital market.
In short it can be said that Capital Markets are the financial market in which long term
debt and equity are traded. Capital markets acts as a means through which scattered
saving of investors are directed into productive activities of corporate entities.
Behavior of Indian capital Market, specially, stock market is always interesting,
challenging and if one understands it, it becomes pleasantly rewarding.
The history of the capital market in India dates back to the eighteenth century when
East India Company securities were traded in the country. Until the end of the
nineteenth century securities trading was unorganized and the main trading centers
were Bombay (now Mumbai) and Calcutta (now Kolkata). The Bombay Stock
Exchange was inaugurated in 1899 when the brokers formally established a stock
market in India. Thus, the Stock Exchange at Bombay was consolidated. After that
more & more stock exchanges have emerged in India & this forms a huge capital
market in India.
The 1990s witnessed the emergence of the securities market as a major source of
finance for trade and industry. Equity markets provided the required platform for
companies and start-up businesses to raise money through IPOs, VC, PE, and finance
from HNIs. As a result, stock markets became a people‘s market, flooded with
primary issues. In the first 11 months of 2007, the new capital raised in the global
public equity markets through IPOs accounted for $107 billion in 382 deals out of the
total of $255 billion raised by the four BRIC countries. This was a sizeable growth
2
from $90 billion raised in 302 deals in 2006. Today, the corporate sector prefers
external sources for meeting its funding requirements rather than acquiring loans from
financial institutions or banks.
With the onset of globalization and the subsequent policy reforms, significant
improvements have been made in the area of securities market in India.
Dematerialization of shares was one of the revolutionary steps that the government
implemented. This led to faster and cheaper transactions, and increased the volumes
traded by many folds. The adoption of the market-oriented economic policies and
online trading facility transformed Indian equity markets from a broker-regulated
market to a mass market. This boosted the sentiment of investors in and outside India
and elevated the Indian equity markets to the standards of the major global equity
markets.
Since 2003, Indian capital markets have been receiving global attention especially
from sound investors, due to the improving macroeconomic fundamentals. The
emergence of Indian Capital Market as an attractive avenue for international investors
has been financial story of recent times. The entry of world players has revolutionized
Indian markets, largely for the better. But In India, though the saving rate is high,
barely two percent of these savings goes into financial markets. Investors investing a
portion of their savings in equity are marginal compared to traditional investments
like banks, insurance and others. Indian Capital Market has transformed, regulated
capital market facilities and developed a world class services which are more
transparent and has been developed to gain the confidence of individual investors to
invest in various capital market instruments like shares, debentures and mutual funds.
Broad Constituents in the Indian Capital Markets
Fund Raisers are companies that raise funds from domestic and foreign sources, both
public and private. The following sources help companies raise funds.
Fund Providers are the entities that invest in the capital markets. These can be
categorized as domestic and foreign investors, institutional and retail investors. The
list includes subscribers to primary market issues, investors who buy in the secondary
3
market, traders, speculators, FIIs/ sub accounts, mutual funds, venture capital funds,
NRIs, ADR/GDR investors, etc.
Intermediaries are service providers in the market, including stock brokers, sub-
brokers, financiers, merchant bankers, underwriters, depository participants, registrar
and transfer agents, FIIs/ sub accounts, mutual Funds, venture capital funds, portfolio
managers, custodians, etc.
Organizations include various entities such as BSE, NSE, other regional stock
exchanges, and the two depositories National Securities Depository Limited (NSDL)
and Central Securities Depository Limited (CSDL).
Market Regulators include the Securities and Exchange Board of India (SEBI), the
Reserve Bank of India (RBI), and the Department of Company Affairs (DCA).
Participants in the Securities Market SAT, regulators (SEBI, RBI, DCA, DEA),
depositories, stock exchanges (with equity trading, debt market segment, derivative
trading), brokers, corporate brokers, sub-brokers, FIIs, portfolio managers, custodians,
share transfer agents, primary dealers, merchant bankers, bankers to an issue,
debenture trustees, underwriters, venture capital funds, foreign venture capital
investors, mutual funds, collective investment schemes.
Concepts and Definitions
Individual Investor
Any individual employing his funds for personal investment in the capital market with
the objective of receiving future benefits and who takes the financial decisions of his
own. It includes a person who owns any capital market instrument through
inheritance.
Security
The term security means a capital market instrument, which may be a share,
debentures or mutual fund scheme.

4
Capital Market
Capital Market is a market for long term financial instruments consisting of shares,
debentures and mutual fund schemes. It covers both primary market and secondary
market.
Primary Market
Primary market is that segment of capital market where new financial instruments like
shares, debentures and mutual fund schemes are offered to investors for cash which
are issued at par, at premium or at discount. It includes initial public offering,
subsequent issues and private placement.
Secondary Market
Secondary market is that segment of capital market where existing instruments are
listed in the stock exchanges, which facilitate buying and selling of the securities. It
includes any off-market transactions entered through a stockbroker.
Equity Market
The Indian Equity Market is more popularly known as the Indian Stock Market. The
securities market is divided into two interdependent segments:
The primary market provides the channel for creation of funds through issuance of
new securities by companies, governments, or public institutions. In the case of new
stock issue, the sale is known as Initial Public Offering (IPO).
The secondary market is the financial market where previously issued securities and
financial instruments such as stocks, bonds, options, and futures are traded.
The Indian market has 22 stock exchanges. The larger companies are enlisted with
BSE and NSE. The smaller and medium companies are listed with OTCEI (Over The
counter Exchange of India)
Share
A share is a form of capital market instrument, which evidences fractional ownership
of a corporate body and includes both equity shares and preference shares held in
physical or electronic form.

5
Debenture
It is a credit instrument issued by a corporate body including a public sector
undertaking whether convertible into shares or not and which carries a fixed rate of
interest.
Derivative Markets
The emergence of the market for derivative products such as futures and forwards can
be traced back to the willingness of risk adverse economic agents to guard themselves
against uncertainties arising out of price fluctuations in various asset classes. This
instrument is used by all sections of businesses, such as corporate, SMEs, banks,
financial institutions, retail investors, etc. According to the International Swaps and
Derivatives Association, more than 90 percent of the global 500 corporations use
derivatives for hedging risks in interest rates, foreign exchange, and equities.
Three broad categories of participants—hedgers, speculators, and arbitragers—trade
in the derivatives market.
Hedgers
They face risk associated with the price of an asset. They belong to the business
community dealing with the underlying asset to a future instrument on a regular basis.
They use futures or options markets to reduce or eliminate this risk.
Speculators
They have a particular mindset with regard to an asset and bet on future movements in
the asset‘s price. Futures and options contracts can give them an extra leverage due to
margining system.
Arbitragers
They are in business to take advantage of a discrepancy between prices in two
different markets. For example, when they see the futures price of an asset getting out
of line with the cash price, they will take offsetting positions in the two markets to
lock in a profit.
6
Mutual Fund Market
The Mutual Fund industry in India started in 1963 with the formation of Unit Trust of
India, at the initiative of the Government of India and Reserve Bank of India. Mutual
funds perform a crucial task as efficient allocators of resources in such transition
period. The process of liberalization, deregulation and restructuring of the Indian
economy has further created the necessity for efficient allocation of resources. In this
process of development, mutual funds have emerged as strong financial
intermediaries and are playing an important role in bringing stability to the financial
system and efficiency to the resource allocation process. As at the end of September
2006, there were 34 funds, which manage assets of Rs.291206 crores under 609
schemes. Performance of Mutual Funds in India is measured through growth of
Assets Under management.
Mutual fund scheme
A mutual fund scheme is a capital market instrument, issued by a mutual fund
organization, whether open-ended or close-ended and includes any type of scheme.
Debt Market
Debt market refers to the financial market where investors buy and sell debt
securities, mostly in the form of bonds. These markets are important source of funds,
especially in a developing economy like India. India debt market is one of the largest
in Asia. The most distinguishing feature of the debt instruments of Indian debt market
is that the return is fixed. This means, returns are almost risk free. This fixed return on
the bond is often termed as the 'coupon rate' or the 'interest rate'. Therefore, the buyer
(of bond) is giving the seller a loan at a fixed interest rate, which equals to the coupon
rate. Debt Instruments: There are various types of debt instruments available that one
can find in Indian debt Market like Government Securities, Corporate Bonds,
Certificate of Deposit, Commercial Papers etc.
Private Placement
It is a method of primary market operations in which new financial instruments are
offered directly to investors on a private basis without complying with all legal
formalities including the issue of prospectus.
7
Risk on Investment
You can't plan financially without understanding investment risk. Many people, when
they hear about 'risk', think automatically about the chance of being defrauded or not
getting all their money back. This 'capital' risk is important, but it isn't the only type.
Other types of risk involve uncertainty and unpredictability. When you make an
investment, it can be difficult to say with any certainty what you'll get back when you
finally cash it in. Share prices fluctuate, interest rates vary and inflation is a risk too.
Just concentrating on capital risk and ignoring these other risks can mean you take too
cautious an approach. Understanding risk means identifying your own attitude
towards it and identifying the different types of risk. Then you can pick up tips for
minimising the chances of things going wrong.
Role of SEBI in Indian Capital Market
The Securities and Exchange Board of India (SEBI) was incorporated as an investor
protection body in 1992 by virtue of a special enactment, the SEBI Act, 1992. The
basic functions of SEBI are to protect the interest of investors in securities and to
promote the development of, and to regulate the securities market and for matters
connected therewith or incidental thereto‖. The SEBI Act came into force on 30th
January, 1992 and with its establishment, all public issues are governed by the rules &
regulations issued by SEBI. SEBI was formed to promote fair dealing in issue of
securities and to ensure that the capital markets function efficiently, transparently and
economically in the better interests of both the issuers and the investors.
The following functions have been entrusted to SEBI:
a) Regulating the business in stock exchanges and any other securities markets.
b) Registering and regulating the working of stockbrokers, sub-brokers, bankers
to issue, registrars to issue, merchant bankers, underwriters and such other
intermediaries who may be associated with securities markets in any manner.
c) Registering and regulating the working of collective investment schemes
including mutual funds.
d) Promoting and regulating self-regulatory organizations.
8
e) Prohibiting fraudulent and unfair trade practices relating to securities markets.
f) Promoting investors‘ education and training of intermediaries of securities
market.
g) Prohibiting insider trading in securities.
h) Regulating substantial acquisition of shares and takeover of companies.
i) Calling for information from, undertaking inspection, conducting inquiries and
audits of the stock exchanges, intermediaries and self regulatory organizations
in the securities market.
j) Conducting research for the above purposes.
k) Performing such other functions as may be prescribed.
Reforms in Capital Market of India
The major reform undertaken in capital market of India includes Establishment of
SEBI: The Securities and Exchange Board of India (SEBI) was established in 1988. It
got a legal status in 1992. SEBI was primarily set up to regulate the activities of the
merchant banks, to control the operations of mutual funds, to work as a promoter of
the stock exchange activities and to act as a regulatory authority of new issue
activities of companies.
Establishment of Creditors Rating Agencies:
Three creditors rating agencies viz. The Credit Rating Information Services of India
Limited (CRISIL -1988), the Investment Information and Credit Rating Agency of
India Limited (ICRA 1991) and Credit Analysis and Research Limited (CARE) were
set up in order to assess the financial health of different financial institutions and
agencies related to the stock market activities. It is a guide for the investors also in
evaluating the risk of their investments.
Increasing of Merchant Banking Activities:
Many Indian and foreign commercial bank shave set up their merchant banking
divisions in the last few years. These divisions provide financial services such as
underwriting facilities, issue organizing, consultancy services, etc.
9
Rising Electronic Transactions:
Due to technological development in the last few years. The physical transaction with
more paper work is reduced. It saves money, time and energy of investors. Thus it has
made investing safer and hassle free encouraging more people to join the capital
market.
Growing Mutual Fund Industry
The growing of mutual funds in India has certainly helped the capital market to grow.
Public sector banks, foreign banks, financial institutions and joint mutual funds
between the Indian and foreign firms have launched many new funds. A big
diversification in terms of schemes, maturity, etc. has taken place in mutual funds in
India. It has given a wide choice for the common investors to enter the capital market.
Growing Stock Exchanges:
The numbers of various Stock Exchanges in India are increasing. Initially the BSE
was the main exchange, but now after the setting up of the NSE and the OTCEI, stock
exchanges have spread across the country. Recently a new Interconnected Stock
Exchange of India has joined the existing stock exchanges.
Investor's Protection:
Under the purview of the SEBI the Central Government of India has set up the
Investors Education and Protection Fund (IEPF) in 2001. It works in educating and
guiding investors. It tries to protect the interest of the small investors from frauds and
malpractices in the capital market.
Growth of Derivative Transactions:
Since June 2000, the NSE has introduced the derivatives trading in the equities. In
November 2001 it also introduced the future and options transactions. These
innovative products have given variety for the investment leading to the expansion of
the capital market.
These reforms have resulted into the tremendous growth of Indian capital market.

10
Factors Affecting the Investors Preferences
The Investors‘ preferences are influenced by various factors. Investors ‗choice is
unique and is influenced by various factors. The major factors which influence their
choice of investment alternatives can be listed below:
i) Stage in Life Cycle: People investment preferences are influenced to some extent
by the stage of the life cycle they exist in. An investor being a bachelor and below the
age group of 30 may be ready to take high risk compared to the investor who is
married and having two grown up children. In most of the cases the stage in life cycle
is inversely related to the degree of investments made in risky assets.
ii) Life Style : Life style relates to the activities, interests and opinions. People‘s life
style undoubtedly affects their investment choices.
iii) Income: Income is another important factor which influences the investors‘
choices. The Low Income individuals are expected to take higher risk to get more
income when compared to the high-income individuals.
iv) Household Size: Household size is another variable that may have an impact on
the investors‘ choices. Investors with many dependents adopt a conservative
investment policy. Smaller the size of the household, higher will be the disposable
income available for investment and consequently the choices of risky investment
alternatives.
v) Personality Characteristics: An individual‘s personality is usually described in
terms of traits that influence behavior. The market practices reveal that compulsive
people invest differently from cautious investors. The investment choices of introverts
are quite different from the investment choices of gregarious people.
vi) Market Condition: The market condition also plays a considerable role in
influencing the investment choices of the investors. The Boom in the capital market
pulls the investors towards the risky investments. The changes in the interest rates
also influence the asset selection decision of the investor.
11
vii) Commodity Trading: Along with the trading of ordinary securities, the trading in
commodities is also recently encouraged. The Multi Commodity Exchange (MCX) is
set up. The volume of such transactions is growing at a splendid rate.
Need For the Study
The individual investors numbering millions constitute the backbone of Indian capital
market. Any developing economy like India needs a growing amount of investor
savings to flow to the corporate world to mobilize sufficient funds required for
development and ensures continuous liquidity in the capital market.
Investment is the employment of funds on assets with the aim of earning income or
capital appreciation. Investment is the most important things today. The real
household disposable income has more than doubled since 1985. A proper
understanding of money, its value, the available avenues for investment, various
financial institutions, the rate of return/risk etc., are essential to successfully manage
one‘s finance for achieving life‘s goal. What drives High Income Group investors to
use different investment options available and what could be the motivators- reasons
for saving money/making long term investments, sources of information/key
Influencers , Financial investment options aware of, performance of industry and
economy, income and risk factors, play a significant role while selecting different
products of Capital Market, as it can create an opportunity for one product and may
not for other. Analyzing the impact of income and risk on investment pattern of
investment provide the valuable insight.
You can't plan financially without understanding investment risk. Many people, when
they hear about 'risk', think automatically about the chance of being defrauded or not
getting all their money back. This 'capital' risk is important, but it isn't the only type.
Other types of risk involve uncertainty and unpredictability. When you make an
investment, it can be difficult to say with any certainty what you'll get back when you
finally cash it in. Share prices fluctuate, interest rates vary and inflation is a risk too.
Just concentrating on capital risk and ignoring these other risks can mean you take too
cautious an approach.

12
Understanding risk means identifying your own attitude towards it and identifying the
different types of risk. Then you can pick up tips for minimising the chances of things
going wrong.
In this context the present study is planned to study High Income Individual investor‘s
preferences in terms of investment with respect to risk in capital Market instruments
in Mumbai and Pune Region.
13
CHAPTER 2
REVIEW OF LITERATURE
The behavior of investors in the capital market is influenced by various factors. Many
scholars have made studies on investor‘s behavior, investment patterns and
perceptions on Capital Market, and still many studies are going on. Researchers have
done extensive study to identify the factors which influence the participation of
investors in capital markets. Some literature covering different aspects of investment
with investor‘s perception is attempted here.
G. Manju (2012) carried out a study to analyze the level of satisfaction among
investors and the problems faced by investors in Indian stock market. The study
confirms the relationship between savings, status, marital status and gender of the
investors. And the researcher also affirms that investors need to be educated about
investment and options available in the market. The factors according to ranking by
investors refrains the investors from investing in capital markets are- High
Commissions, Wrong information from agents , uncertainty of returns, market
volatility and Lack of rules and regulatory agents.
Mahabaleswara Bhatta H.S. (2009) made an attempt to throw light on the investors‘
biases that influence decision making process. The researcher opined that the studies
on the unpredictable human behavior would help the investors to critically inspect
their investing decisions.
FatenZoghlemi and Hamadi Matoussi( 2009), carried out a study to identify the
psychological biases that influence the Tunisian investor‘s behavior. Following are
the relevant findings of the study:-The overconfident tendency seems not to be
popular among the Tunisian investors. The Tunisian investors seem to be under
optimistic and very risk averse. The Tunisian investors seem to be very sensitive to
rumors. Majority of the Tunisian investors (81%)are conservative, they seem to
conserve so long the past data and past evidence and continue to react according to
them ignoring the current data and Mast of the Tunisian investors (61%) emit
progressive reactions to news and they don‘t react fully and instantly to current news.

14
The average propensity to save shows that the level of savings is related to the level of
income L.C.Prasad (2008) conducted a survey to find out the preferences of
household investors and the relevant findings of the study are as follows, a. The
household investors most preferred type of investment was found to be shares.
Systematic Investment plan (SIP) is the most popular type of scheme among various
types of mutual funds. The too much price fluctuations were found to be the major
worry of the investors in the stock market.
Jasim Y. Al-Ajmi (2008) explores the relationship between risk tolerance and
demographic characteristics of investors. The study was conducted to investigate the
effect of Gender, Education, Age and Wealth of the investors on the risk tolerance
level .Major findings were as follows:-1) Men are more risk tolerant than Men are less
risk averse than women 2) Less educated investors are less likely to take risk. 3)The
effect of age on risk tolerance is complex 4) Wealthy investors the less wealthy
investors.
Kannadasan M (2006), analysed the behavioral pattern of the retail Investors, based
on various dependent variables viz., Age, Gender, Marital Status, Educational Level,
income Level, awareness, preference and Risk bearing capacity. The following are the
major findings of the study:- 1) Only 25percent of the sample respondents were
aware at all the investment avenues available in the capital Market. However all of
them are aware of at least one of them. 2) 90 percent of the retail investors are not
aware of the measures taken by the government to protect the interest of investors.
3)79 percent of the retail investors are interested to invest in shares and Debentures as
well. 4)The risk bearing capacity of the retail investors was not influenced by age.
The retail investor‘s age is not a criterion to decide their investment behavior and
investment option. 5)The investment strategy of the investors is influenced by their
income level. The retail investor‘s income level is playing a predominant role in
deciding their investment behavior and investment strategy as well. 6)The major
attributes of risk in investment are dividend, redemption period and value
appreciation.
15
Bodla and Turani( 2005), studies if the retail investor‘s perception about risk of a
security is consistent with the return perceived concerning the security. The study is
based on primary data and the respondents were asked to rank 11 investment
vehicle(blue chip stocks, small company stocks, Preference shares, debenture/Bonds,
Stock futures and options, Mutual fund , NSC/PPF/PF, Fixed deposits, Insurance
policies, Real Estate, and Gold/Silver) by risk and return on a 5 point scale. Some of
the relevant findings are as follows:- Most of the retail investors do not believe in the
dictate of financial theory-‗Higher the risk, Higher the return‘. The perceptions of the
investors vary according to the income level of investors. The perception appears to
be somewhat different between investors of various age groups. The return and risk
rankings for all the assets except one asset (FDs) do not match each other. Specially
the perceived returns of four assets i.e., blue chip stocks, debentures/Bonds,
NSC/PPF/PF, and insurance policies, are higher than the risk attached to them.
Rajarajan (2003) identifies that a strong association exists between demographic
characteristics and the risk bearing capacity of Indian investors. This study confirms
the earlier findings with regard to the relationship between age and income and the
risk bearing capacity of investors. He opines that information on risk bearing capacity
of investors will help the financial product designers to develop products, which suit
the risk characteristics of the investors. And also this information will help the
financial product marketers to target the prospective investors for the products instead
of approaching every individual with an array of products, which may not suit them at
all.
Jaspal and Subhash (2003) made an attempt to read the back of the mind of the
general investor as regards their expectations from mutual funds, taking into
consideration their age group and the occupation they are in. The following are the
findings of the study:-Majority of the investors belonging to salaries and retired
categories and those in the age group of more than 60 years gave maximum weightage
to ―past record of the organization‖ before deciding about investment in mutual funds.
The analysis of options expected in a mutual fund reveals that the investors belonging
to business category have given maximum weightage to the option of ―repurchase of
the units‖ by the fund followed by ―easy transferability‖ option. Age wise analysis
16
reveals that the investors in the age group of35-50 years also give more importance to
―repurchase facility‖ and easy transferability‖. As regards the performance appraisal
of mutual funds the respondents in the salaried category and in the age group of 35-
50years give highest importance to the ―return provided on investment by the fund‖ to
be the best criteria of performance appraisal of a fund.
Renu and Bosire (2003) analyzed the factors that influence the investors to choose
various schemes of mutual funds. The following are the major findings of the study:-
A drastic shift of interest towards private sector mutual funds was noticed in the
study. 65% of the investors preferred private sector sponsored mutual funds, 20%
preferred public sector and only 15%preferred foreign sponsored mutual funds.
Capital Appreciation was considered as a major influencing factor for selecting a
scheme/fund, followed by regular and stable income. The scheme proposed objectives
influence the investor in choosing particular scheme/fund. While past performance
and nature of products offered hold same influencing affect upon respondents. Most
of the investors (90%) preferred open ended schemes over the closed ended schemes.
Furqan Qamar (2003) analyzed the savings behavior and investment preferences
among average urban middle class of Delhi. The following are the relevant findings of
the study:- Despite financial sector reforms and entry of private, domestic and foreign
banks into the country, the nationalized commercial banks seem to be the favorite
choice of an average household. Capital market imperfections and associated risk
have not been a deterrent for many households as they were found investing in
debentures and share either directly or indirectly. The saving behavior and investment
preferences of average urban household seem to be significantly influenced by the
level of educational attainments and income of the respondents.
Murali (2002) has indicated that new issues market focuses on decreasing information
asymmetry, easy accessibility of capital by large sections of medium and small
enterprises, national level participation in promoting efficient investments, and
increasing a culture of investments in productive sector. In order that these goals are
achieved, a substantial level of improvement in the regulatory standards in India at the
voluntary and enforcement levels is warranted. The most crucial steps to achieve
these goals would be to develop measures to strengthen the new issues market.

17
Madhusudhan K (2001) suggests that Life Insurance Policy is found to be most
popular investment avenue. Other assets selected by majority of investors include
recurring deposits in post office, recurring deposits in banks, bank fixed deposits, etc.
The study suggests that investors are in general are risk – averse. Very few investors
who are educated and belong to high-income categories only have invested in shares
and debentures. He opines that risk aversion appears to decrease with education and
income. He also finds that the investors gave highest priority for safety while taking
investment decision.
Barber and Odean (2001) compare the performance of men and women using data
from the LDB dataset. The study is motivated by the two observations: (1) men tend
to be more prone to overconfidence than women in areas culturally perceived to be in
the male domain and (2) models that assume investors are overconfident tend to
predict investors will trade excessively and to their detriment. When combined, these
observations predict that men will trade more than women and that excessive trading
will hurt their performance. The annual turnover rates of men are about 80%, while
those of women are 50%. The excessive trading of men leads to poor returns. While
both men and women earn poor returns, men perform worse. Virtually all of the
gender based difference in performance can be traced to the fact that men tend to
trade more aggressively than women. Neither men nor women appear to have stock
selection ability (i.e., the gross returns earned on their trades are similar), so men‘s
tendency to trade aggressively and the resulting trading costs drag down men‘s
returns.
Shanmugham (2000) conducted a survey of 201 individual investors to study the
information sourcing by investors, their perceptions of various investment strategy
dimensions and the factors motivating share investment decisions, and reports that
among the various factors, psychological and sociological factors dominated the
economic factors in share investment decisions.
Ahmed Naseem (2000) in his study opined that bonus shares are considered a mover
of market sentiments which in turn sets an upbeat trend inequity price movement.

18
Pratip Kar and Others (2000) on behalf of SEBI made a comprehensive survey to
help gauge the impact of the growth of the securities market on the households during
the decade of the 1990s and to analyse the quality of its growth. The survey was based
on a sample of 300000 geographically dispersed rural and urban households out of
which a sample of 25,000 households were chosen for detailed canvassing by field
staff through a pre-tested questionnaire.
Raj Kabila and Uma Kabila (1998) in its discussion paper pointed out that as the
process of economic reform continues and the share of the corporate sector in the
economy increases, the role of securities markets as a source of raising funds for
investment is expected to become more critical. If Indian markets are to serve the
need of firms as well as a nationwide community of investors, it is essential that
efforts to lower transaction costs and to increase the integrity and fairness of Indian
markets continue. While measures that have been taken by the government, SEBI,
exchanges and market intermediaries in this direction have led to an increase in
capital market activity and investor confidence, it is necessary to focus on further
changes that are still required.
The investment decision making process of individuals has been explored through
experiments by Barua and Srinivasan (1991). They conclude that the risk perceptions
of individuals are significantly influenced by the skewness of the return distribution.
This implies that while taking investment decisions, investors are concerned about the
possibility of maximum losses in addition to the variability of returns. Thus the mean
variance framework does not fully explain the investment decision making process of
individuals.
Amanullah and Kamaiah (1998) in their study attempted to test whether Capital Asset
Pricing Model (CAPM) can perform well in describing the stock return in India. They
opined that though the CAPM describes stock return well in the Indian context, it is
preferable that investor‘s investment decision may be decided with the help of other
relevant factors such as P/E ratio, EPS dividend, bonus and right issues besides the
CAPM estimates. The estimation of these variables call for information on historical
data from the company‘s financial statements. There is an on-going argument that the
company presents a rosy picture of financial estimates by manipulating its financial
statements such as profit and loss account and balance sheet. In such a case it is
19
difficult to obtains true and fair view of its financial position and hence investment
decisions based on these statements may not provide a meaningful estimation of stock
returns. Thus investors are required to take extra care in estimating stock returns to
construct the portfolio of securities.
Balkrishan and Nartha (1997) made a review of Indian securities market in the light
of economic liberalization measure initiated in India. According to him financial
markets are instrumental in allocating the savings in the most desirable way so that
the desired national objectives can be achieved. This facilitates efficient production of
goods and services. Thus it contributes to the well-being and raises the standard of
living not only of borrowers but also of others in the economy. Financial markets
perform this function by transmitting the nation‘s saving into the best possible
productive uses which in turn raises the output and employment level in a country.
Belgaumi (1995) in his study attempted to test whether the random walk hypothesis or
weak from of efficient market hypothesis holds good in the Indian Stock Market. 70
companies were taken as sample in the A group of the Bombay Stock Exchange
during 1991-92. He concluded that share price behavior in the Indian stock market
followed the random walk model. Hence the exchanges are weakly efficient in pricing
their shares.
Bhave (1998) in his study pointed out that setting up of securities depositories will
bring about a change in the capital market with significant impact for the banking
industry.
Cherian Samuel (1996) in his study opined that the stock market plays only a limited
role providing finance for both U.S. and Indian firms. In seeking funding a firm‘s
main choice is between external and internal financing. Internal finance plays less of a
role in Indian firms than for U.S. firms and external debt a bigger role. This is in
consistent with the theoretical prediction that information and agency problems are
less severe for Indian firms that for U.S. firms.
Cirvante (1956) in his study pointed out that capital market in India is in a process of
transition. A gradual shift in investment is taking place from the private sector

20
investment to the public sector. This is due to the inability of the private sector to
undertake large scale investment on account of the paucity of aggregate savings and
the direction of these savings into trading and speculative activities rather than into
fixed investment.
Claessens(1995)in his study on equity investment in developing countries points out
that the benefits available to an investor of equity investment in emerging markets
ultimately depend on a trade-off between the expected rate of return and its associated
risk. To assess this trade-off a number of factors are important: the underlying factors
driving the rate of return and its variability; the efficiency of the domestic stock
market; the regulatory, accounting and enforcement standards in the host country etc.
The risk-return trade-off should, however, be investigated from the point of view of
an internationally well diversified investor who is considering investing in emerging
markets.
Crockett Andrew (1998) in his study revealed that the past twenty five years have
witnessed a process of accelerating change in the world‘s financial markets. Driven
by an interacting process of liberalistion and innovation, regulations have been
removed, new products have emerged and old boundaries between financial
intermediaries have been blurred. Innovation has brought many advantages. The menu
of financial assets and liabilities available to end-users has been greatly enlarged. The
costs of financial intermediation have fallen. Risk management tools have become
increasingly sophisticated. Developing countries have found new ways to mobilize
domestic and international savings.
Desai Ashok (2000) in his paper mentioned that regulators are necessary to prevent
intermediaries from decamping with investor‘s money. But in India there are too
many regulators who have no co-ordination among themselves. In addition to that
multiple regulation of financial institution divides up their business in an inefficient
manner. Thus financial regulation needs to be takeout of the hands of zealous servants
of the government and placed in the hands-off a much smaller number of regulators
who would have the investor‘s interests at heart and who would concentrate on giving
investors more choice and a greater voice in the investment decisions of the
intermediaries.
21
Feldman and Kumar (1995) in their article examine the main characteristics of
emerging stock markets. They point out that the regulatory environment is particularly
important for countries eager to integrate their market with the international financial
system. Without effective regulation and enforcement, domestic and international
investors will be reluctant to commit resources tothese markets. Regulation to effect
governmental control should be restricted to those strictly necessary for correcting
market failures proves to occur in unregulated markets.
Gupta (1992)conducted a survey of 1755 investor households to make factual data
available on investor preferences to mutual funds. According to the report (1993) the
availability of the mutual fund vehicle has enabled investors to substantially reduce
the risk of equity investment. Only 41-48 per cent of household investors viewed
direct share investment as safe whereas indirect share investment through pure equity
schemes of mutual funds was considered safe by 75 per cent of household investors.
Regular income and growth schemes of Unit Trust of India or other mutual fund
companies were perceived as safe by over 80 per cent household investors. In the case
of directly held shares, buying on stock exchanges was considered somewhat less safe
than buying new issues.
Gupta and Choudhury (2000) in their study pointed out that index funds have gained
acceptance among investors because it was found that fund managers often did worse
than the market average. The index fund is an admission of failure of fund
management to beat the market.
Gupta and others (1994) in their study enquired into shareowners geographic
distribution covering a sample of 165819 shareholders and 63157debenture holders
from 80 companies. The study pointed out that despite the spectacular growth of
shareholding among Indian households over the last decade, individual shareholders
are still highly concentrated in a few traditional areas. The top 10 cities ranked by
their percentage share of the total accounted for nearly two-thirds (65.3percent) of
India‘s total number of shareholders in 1992. However, the degree of concentration of
shareowners in traditional areas is slowly coming down. Bombay‘s share had fallen
by about one-fifth from 35.3 per cent in 1983-84 to27.3 per cent in 1992.The absolute

22
number of shareowners has exploded everywhere rising from an estimated 30 lakhs
for the whole country in 1983-84 to roughly 125lakhs in 1992; most places show an
increase of 3-4 times in the number of shareowners over this period. The share
owning population in India is currently increasing by about 10 per cent per annum
(excluding indirect ownership through mutual fund schemes).
Jayadev (1998) in his study made an evaluation of the performance of mutual fund
schemes in India in terms of return and risk. He observed that the average returns of
the selected 62 schemes are 1.29 per cent per month and the average risk is 7.5 per
cent. As many as 36 schemes have an above average return out of 62 schemes, 33
have returns in conformity with the linear relationship of above average returns with
above average risk and vice versa. Sixteen schemes have above average returns with a
risk less than average and13 schemes have less return than the average with higher
risk. In terms of risk adjusted performance, 33 schemes have outperformed their
bench-marks interns of the total risk and 30 schemes have outperformed in terms of
systematic risk.
Jha and Natarajan (1999) in their study analysed the structure of Indian stock market
in terms of volatility and price efficiency of Bombay Stock Exchange and National
Stock Exchange. They pointed out that there are well defined relations between stock
prices in the long run in each of these markets. Hence market segmentation is strongly
ruled out. The short-run behavior of stock prices is such that no stock price can be
considered to be independent of the other. Short run price movements are mostly
random or unstable but the impulse response function analysis suggests that the
instability will not persist for long.
Kishore22 (1997) in his article pointed out that the FIIs are manipulating equity
market through price rigging even during GDR issues of Indian companies for their
own benefit at the cost of domestic investors. They also play a major role in shaping
the ‗equity price movement‘ in India since 1991.However, FIIs whose hot money
moves from one emerging equity market to other markets on whims and flimsy
ground is creating disasters like that in December 1994. Mexican crisis and July 1997
Thailand problem do not help in ‗equity market development‘ in India.

23
Lamba (1999) in his paper attempted to given empirical evidence to the general
perception that Indian Stock Market reacts to domestic as well as external influences.
His study revealed that during January 1993-July 1998Indian market appeared to be
quite isolated from external influences. However an examination of the behavior of
the India market during the bullish and bearish sub-periods indicates that the major
developed markets exert considerably more (less) influence on the Indian market
during the bearish(bullish) phase.
Lease(1972) and others conducted a survey of individual investors to find out who the
potential investor is, how he makes his decisions, how he deals with his broker, what
his portfolio consists of and how well he has done as a portfolio manager. A sample
of 3000 individuals was selected, stratified according to the geographical distribution
of all American share holders as reported by the NYSE surveys. According to the
survey report (1974) the individual investor has to be primarily a fundamental analyst
who perceives him to hold a balanced and well diversified portfolio of income and
capital appreciation securities. He asserts that he invests predominantly for the long
run and is prone to use one of the broad based market indices as the bench-mark by
which to judge his personal investment performance results. Long-term capital
appreciation is the paramount investment concern with dividend income and
intermediate-term gains running distance second.
Levine and Zervos (1996) in their study examined whether there was any association
between stock markets and long run growth. According to them stock markets may
influence economic activity through their liquidity. Many high-return projects require
a long run commitment of capital. Investors, however, are generally reluctant to
relinquish control of their savings for long periods. Therefore without liquid markets
or other financial arrangements that promote liquidity, less investment may occur in
the higher return projects.
Malhotra (1994)examines the empirical relationship between equity prices and
various explanatory variables like dividend per share, earning per share, book value to
par value, P/E ration, yield, and growth etc. for the period from1982 to 1985.
According to the study, the dividend per share and earnings per share are the strongest
determinants of market price.
24
Misra (1997) traced the evolution of Indian Capital Market and described important
aspects of development in its primary and secondary segments. He pointed out that
Indian Capital Market has evolved during the last fifty years (1947-1997) from a
dormant segment of the financial system too highly active and dynamic segment
characterized by institutional build up, technological advancement and modernization.
The reforms in the market have been vast and varied since 1992. While the primary
market has emerged as a major source of funding for the corporate entities both in the
public and private sectors, the secondary market has modernized itself through
advanced technology and transparent trading practices. The array of development
financial institutions also has played a crucial role in meeting long-term credit needs
of the industrial sector.
Mohana Rao (1998) made a survey of Mutual funds to address the following
issues:(a) Which mutual fund is popular amongst the investors?(b) Which factors
govern the choice of a mutual fund organization?(c)What type of scheme/schemes is
preferred by households?(d) Which type of financial asset is opted by
investors?(e)How are mutual funds helping to enhance capital market activities in
India? And following conclusions were reached by him:-(a) The top most popular
mutual fund amongst investors is Unit Trust of India followed by State Bank of India
Mutual Fund and Can bank Mutual Fund.(b) The most popular financial asset
preferred by the respondents is UTI products followed by debentures and products of
mutual funds.(c) The most important factors of choice for a mutual fund organization
are ‗investors service‘ followed by income-cum-growth and tax benefits and capital
appreciation.(d) A vast majority of respondents agreed that mutual funds are desirable
and necessary for growth of Indian capital and money markets.(e) Majority of
respondents showed their willingness to invest their savings in private sector mutual
funds.
Mohanthy (1997) in his study observed that the primary objective of market
regulation is avoidance of market failure. Symptoms of market failure emerge when
the risk-return balance breaks down. This can happen when accurate evaluation of
market risks is not possible under imperfect market conditions. Viewed from this
perspective the first and for most task of the market regulator is to identify imperfect
25
market conditions, evaluate the risks involved and take corrective measures. For
proper identification of market imperfections the capital market can be viewed as
being composed of three distinct market segments: (i) the Capital Allocation Market
where savings are distributed among the productive users of capital (i.e. Primary
Market); (ii) the Financial Securities Market where the stocks owned by the providers
of capitals are traded by them (i.e. secondary market) and (iii) the Financial
Information Market where information is transmitted by the productive users of
capital to the suppliers.
Nagaishi (1999) in his paper on stock market development and economic growth
viewed that Indian stock market development from the 1980sonwards has not played
any prominent role in domestic savings mobilization. Both GDS and the share of the
financial assets of the household sector have been stagnating since 1992, that is, in the
post reform period.
Nagaraj (1996) in his paper examined the trends in the capital market growth and its
implications for the economy and the corporate sector. He observed that financial
liberalization thesis posits its likely positive effect on the economy‘s savings
investment and efficiency. A well functioning stock market also has a screening and
monitoring role.
Nandi (1995) studied the international mobility of capital in the context of India and
the quantitative relation between Indian stock market and the stock markets of some
important developed countries. Experience of the capital mobility across the countries
show that irrespective of the existence of control on the mobility of capital and
exchange rate movement some sort of a relation gets established between the capital
markets of major countries. Wherever a pervasive control on the movement of capital
exists capital flight takes place without the approval of the government machinery.
Nartha (1992) endeavored a study of the trend and progress of underwriting capital
issues in India for the period from 1970-71 to 1988-89. In his study he pointed out
that underwriting activities increased with the availability of underwriting facilities
provided by the various underwriting agencies. Yet is showed a declining trend in the
decade of the eighties largely on account of the equity cult in the late eighties and the

26
good public response with the entrance of most of the middle class families in the
capital market. Panda studies the working and role of stock exchanges before and
after independence. It revealed that listed stocks covered four fifths of the joint stock
companies. The shares of government sector joint stock companies were not yet
quoted on the recognized stock exchanges. Investment in stocks and shares was no
longer the monopoly of any particular class or of a small group of people. It attracted
the interest of a large number of small and middle class individuals. The people in
general were not reluctant to invest in equity shares.
Paranjape (1992) made a study of investors‘ preference on rights issues made by
corporate bodies. It revealed that only a little more than 20 percent of the investors
always applied for rights in the past. Roughly an equal number participated depending
on the availability of funds. The remaining did so only after evaluating the merits of
the offer, either by themselves or on the basis of advice from experts. Investors
generally go by the future prospects of company, its overall standing and the merits of
the offer. However a small number are likely to base their decision on the state of the
market as well.
Rangarajan (1998) in his paper put forward a valid view regarding the major issues to
be addressed in order to strengthen the functioning of Indian Capital Market. He held
that effective and efficient capital market required as table and sturdy infrastructure of
payment, settlement and clearing system and setting up of depositories. This
infrastructure is the life-line of the securities market as it helps market participants to
exercise economic choice by prompt and credible transfer of value.
SEBI (1996)made an analysis of income and expenditure of 100schemes of 15 Mutual
Funds and 13 Asset Management Companies. The report revealed that it was difficult
to establish any correlation between expense ratio of similar type and size of scheme
within the same mutual funds or across mutual funds, the profitability of an Asset
Management Company(AMC) or Return On Net Worth (RONW) to the corpus
managed by a fund and its years of existence. Schemes of same size and type have
varied expense ratio, income ratio, AMCs which manage more assets, earn a larger
income but RONW for them may be lower than one which manages a smaller corpus.
All this understates the state of affairs of the mutual funds and fund manager and

27
raises concerns about the need for a greater degree of introspection on the part of the
AMCs to get their houses in order.
Singh (1994) in his study pointed out that the proper development and growth of
securities market plays a vital role for a faster growth of industry and economy. The
role of securities market can be judged by examining how efficiently and successfully
they meet the financial requirements of the industrial enterprises by mobilizing by the
saving of masses and their ability to provide a well organized market for sale and
purchase of the industrial securities. The securities market helps in distributing the
fruits of economic prosperity in a country amongst the masses through returns on
investment of surpluses in the securities.
Terrance (2011) examined the behavior of individual investors and found them
exhibiting disposition effects, that is, they realize their profitable stocks held as
investment at a much higher rate than their unprofitable ones. The disposition effect is
found to influence market prices; yet its economic significance is likely to be the
greatest for individual investors.
Vinayakam (1994) in his study viewed that with the introduction offered pricing in
1992, the total equity share issues were of the order of Rs.2792crores. Of these the
share of premium was a stupendous Rs.1945 crores, i.e., nearly 70 per cent of the
issue amount. This has resulted in failure of certain issues which had to be bailed out.
He suggested that apart from the investors‘ awareness, education and associations
which go a long way in giving the much needed protection to the small investors, a
separate legislation or compendium conferring protection to investors was the need of
the hour. The investors would have a sigh of relief just as consumers did with the
emergence of Consumer Protection Act and consumer courts in all trading centers in
the country.
Vinayakam and Charumathi (1995) in their study observed that equity cult had spread
to different parts of the country and millions of Indian investors invested their savings
in the booming stock markets. What was once considered as the exclusive game of the
rich and privileged class is now becoming a matter of day interest for millions of
middle and low income groups of investing public in India.
28
Research Gap
A variety of work in economics, accounting and finance would have some linkages
with capital markets. Different study elicited how the demographic variables
influenced in the investment of retail investors and suggested that the government and
regulatory bodies like SEBI creates lot of awareness and encourage in retail investors
in equities to become greater part of development of economic system for making
investment on long term basis. Despite the spectacular growth of shareholders among
Indian Households over the last decade, individual investors are highly concentrated
on a few traditional areas.
A number of research gaps and limitations in the theoretical and methodological
approaches involved in previous studies are identified and suggestions made for
further research. Madhusudhan K indicated in his study that very few investors who
are educated and belong to High income group invest in Shares and Debentures.
Study by G Manju confirms the relationship between savings, status and gender of the
investor, but fails to identify each income group investment pattern of investors.
Murleedharan D in 2008 has analysed the pattern of investment preferences among
different income groups in physical and financial assets, but does not through any
light on their investment in Capital Market instrumentsin specific.
Literature review reveals that Retail Investors income level plays a predominant role
in deciding their investment behavior and investment strategy. Their perception vary
according to their income level. Their exist a strong association between demographic
factors and risk bearing capacity of Indian investors. A survey on the saving behavior
and investment preferences of average urban household of Delhi reveal that Level of
Education and income have a significant influence on them.
From our review of the literature, we argue that an under-researched area concerns but
no study has been done with respect to investment behavior of High Income Group
investors, their perception on investment and if there exists a trend in their investment
decisions. Capital Market has become highly competitive due to the extraordinary
growth being experienced by it in terms of total funds being managed, number of

29
players and choice of new innovative schemes being offered to the investors .The
highly competitive nature of this industry necessitates that marketers must fully
understand the investment behaviour of individual investors of all class and income
groups to be able to effectively market their products . The current state of knowledge
about the investor behaviour is found not to be quite satisfactory and in fact it is
inadequate when applied to understand the investment behaviour of High Income
Group investors. This thesis fills the aforementioned research gap. The number of
investors participating in the capital market in the city of Mumbai and Pune has also
witnessed a significant growth over the past few years. The present study dwells on
extent to which High Income Group‘s investment behavior in Mumbai and Pune
region and their opinion on the various investment options related to capital market
and consider the effects of these investments differ across the income distribution.
Our descriptive analyses will shed new light on the links between income and
investments.
The model is proposed based on an in-depth study of related literature on traditional
finance, behavioural finance and consumer behaviour and is empirically validated by
studying the investment behaviour of a sample of Capital Market investors. The
findings of the study will help the industry as well as government agencies charged
with regulating the market place in making their marketing and public policy
decisions, respectively. Further this study will improve consumer behaviour theory by
deepening our understanding of how High Income Group investors make buying
decisions for the intangible financial products. In this context the present study is
done to study High Income Individual investor‘s preferences in terms of investment
with respect to capital Market instruments in Mumbai and Pune Region.
30
CHAPTER 3
OBJECTIVE, HYPOTHESIS AND RESEARCH METHODOLOGY
Scope Of The Study
In today's scenario there has been a major change i.e. economic prosperity all over.
The real household disposable income has more than doubled since 1985. With the
economic development in India the proportion of High Income Group has emerged
which has led to different consumption patterns. This means the availability of huge
investible surplus. This has resulted in emergence of new options within the same or
fresh asset classes. The scope of the study is restricted to the market survey conducted
on High Income Individual Investors from Mumbai and Pune region, with respect to
preferences of various investment options while investing in capital Market.
A proper understanding of money, its value, the available avenues for investment,
various financial institutions, the rate of return/risk etc., are essential to successfully
manage one‘s finance for achieving life‘s goal. Income and risk factors play a
significant role while selecting particular product of Capital Market as it can create an
opportunity for one product and may not for the other, the analyzing impact of income
and risk on investment pattern of investors is important. So, analyzing the factors that
affect investment pattern of high income investors and other investment criteria
provide the valuable insight. . Like most developed and developing countries the
mutual fund cult has been catching on in India. Present study is based on an in-depth
study of related literature on traditional finance, behavioural finance and consumer
behaviour and is empirically validated by studying the investment behaviour of a
sample of Capital Market investors. This research also throws light on the effect of
saving objective on preference of the investor towards Investment Avenue. Further
this study will improve consumer behaviour theory by deepening our understanding
of how High Income Group investors make buying decisions for the intangible
financial products. The results of the study are based upon percentage and graphical
method, also resulting useful guidelines and investment trends for the future investors.

31
Objective of the study
To study the prime objectives of capital market investment of High Income
individuals investor.
To study High Income Individual preferences among different financial assets in
Capital Market Investment.
To study the factors influencing the choice of investment in equity market of High
Income individual.
To study the factors influencing the level and size of investment of High Income
individual.
To study the investment pattern and the diversification in capital market
investments of High Income individuals.
Hypotheses of the study
The following hypotheses have been formulated on the basis of objectives:
H01: All the options are not equally preferred for investment by High Income
individual investor.
H11: All the options are equally preferred for investment by High Income
individual investor.
H02: There exists no significant difference in the amount of investment in different
financial assets by High Income individual investor.
H12: There exists significant difference in the amount of investment in different
financial assets by High Income individual investor.
H03: There exists no significant difference in the Level of investment by High
Income individual investor in different financial instruments of Equity capital
market viz. Shares, Debentures and Mutual Funds

32
H13: There exists significant difference in the Level of investment by High Income
individual investor in different financial assets of Equity capital market viz.
Shares, Debentures and Mutual Funds
H04: Demographic factors do not have a significant influence on the level of
Investment by High Income individual investor.
H14: Demographic factors do have a significant influence on the level of
Investment by High Income individual investor.
H05: Demographic factors (Sex, Age, Education and Annual income) do not have
any association with the size of Investment by High Income individual
investor.
H15: Demographic factors (Sex, Age, Education and Annual income) have any
association with the size of Investment by High Income individual investor.
H06: There is no significant difference in investment by High Income individual
investor on level of sartorial diversification of Mutual Fund Schemes and
Shares.
H16: There is significant difference in investment by High Income individual
investor on level of sartorial diversification of Mutual Fund Schemes and
Shares.
H07: There exists no common saving pattern of investors by High Income
individual investor.
H17: There exists common saving pattern of investors by High Income individual
investor.
Research Methodology
This section presents the methods and procedures used to explore and investigate the
extent to which High Income Group‘s investment behavior, and their opinion on the
various investment options related to capital market and consider the effects of these
investments differ across the income distribution. The study is based on primary data.
The research methodology which is presented below specifies the methods and
33
procedures for the collection of data, sample selection, measurement and analysis of
data.
Reference Period
Primary data relating to income, savings, savings in financial assets etc.of investors
were collected for a period from 2012 to 2013.
Descriptive Research
Descriptive research is used to obtain information concerning the factors influencing
the investment behavior among investors. Review of literature and other available
information from various published and unpublished reports, journals ,periodicals,
books, newspapers etc(including Pro-quest database).The descriptive research helped
in preparing the ground –work for the next step i.e. field survey.
Survey Design
For the purpose of the study simple random sampling techniques is used to collect
information from target respondents. Mumbai and Pune are divided into seven groups
and samples are collected through simple random sampling method from each group.
Questionnaire was administered to 200 investors in seven regions on simple random
basis from the list of investors supplied by the broker firms and mutual fund agents.
The response was received from 1074 investors.
Defining the Sample
In India there is no official definition of the High Income Individual. Survey-based
studies such as those conducted by the National Sample Survey Organisation (NSSO)
classify Indian households into different income groups but do not specifically define
the High class. The National Council for Applied Economic Research (NCAER) in
2010-11 define the Indian middle class as those whose annual household income falls
in the income group of Rs. 2,00,000 - Rs.10,00,000 ($4,000-$21,000). The majority of
other studies such as the McKinsey & Company (2007) and Saxena (2010) have used
the NCAER data and definitions of the Indian middle class. Thus we can derive from
the above data that high class can be defined as those whose annual household income
is above Rs. 10,00,000(>$21000).

34
A second analysis of annual household income data, which is an aggregate of
expenditure and savings data, of number of households in six income brackets for the
year 2004 were obtained from Indices Analytics‘ data repository.
The six income brackets are -
1. < Rs. 75,000 (or, < Rs.0.75 lakh)
2. Rs.75,001 - Rs.150,000 (or, Rs.0.75 lakh – Rs.1.5 lakh) 198
3. Rs.150,001 - Rs.300,000 (or, Rs.1.5 lakh – Rs.3 lakh)
4. Rs.300,001 - Rs. 500,000 (or, Rs.3 lakh – Rs.5 lakh)
5. Rs.500,001 - Rs.1,000,000 (or, Rs.5 lakh – Rs.10 lakh)
6. > Rs.1,000,000 (or, > Rs.10 lakh)
The numbers of households in the first three income brackets (< Rs.0.75 lakh, Rs.0.75
lakh –Rs.1.5 lakh, Rs.1.5 lakh – Rs.3 lakh) were added up and classified as population
belonging to the ‗lower‘ income group. The next two income brackets (Rs.3 lakh –
Rs.5 lakh, Rs.5 lakh – Rs.10lakh) were added up and classified as ‗middle‘ income
group, and > Rs.10 lakh was classified as the ‗upper‘ income group. These income
categories were organized this way for the purpose of tractability in our analysis.
Area Definition
Mumbai is represented by six parliamentary constituencies: Mumbai North, Mumbai
North West, Mumbai North East, Central, Mumbai, and Mumbai South. The region
has an area of 4,355 km² and with a metropolitan population of 20,998,395 as per
2011 Census of India.
Pune is the cultural capital of Maharashtra.. As per the 2011 Census of India estimate,
the population of the Pune urban agglomeration is 6,049,968. This includes the towns
of Khadki, Pimpri-Chinchwad and Dehu.
Distribution of Income Groups-An estimation indicates that 3-4% of the population
lie in High income group, then our target population will be around 8-9lac individual.
Primary data have been collected from High Income individual investors through a
sample survey. The data is collected from target respondents through a structured
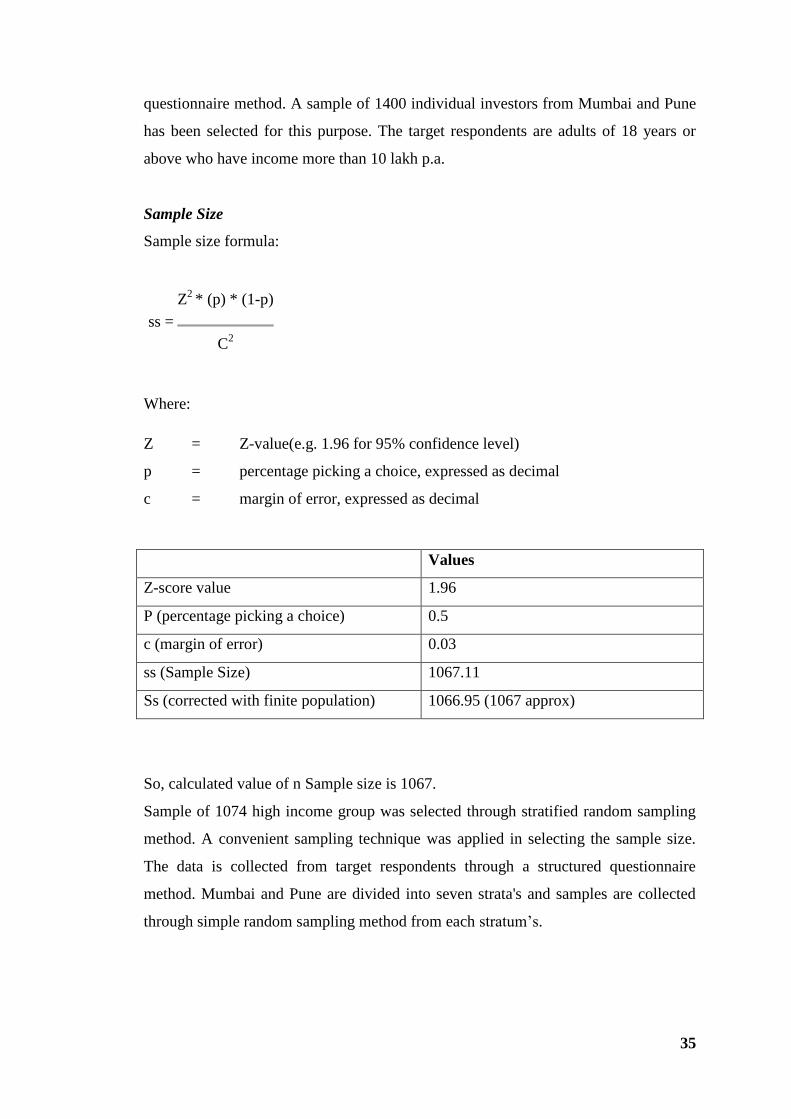
35
questionnaire method. A sample of 1400 individual investors from Mumbai and Pune
has been selected for this purpose. The target respondents are adults of 18 years or
above who have income more than 10 lakh p.a.
Sample Size
Sample size formula:
ss =
Z2
* (p) * (1-p)
C2
Where:
Z = Z-value(e.g. 1.96 for 95% confidence level)
p = percentage picking a choice, expressed as decimal
c = margin of error, expressed as decimal
Values
Z-score value 1.96
P (percentage picking a choice) 0.5
c (margin of error) 0.03
ss (Sample Size) 1067.11
Ss (corrected with finite population) 1066.95 (1067 approx)
So, calculated value of n Sample size is 1067.
Sample of 1074 high income group was selected through stratified random sampling
method. A convenient sampling technique was applied in selecting the sample size.
The data is collected from target respondents through a structured questionnaire
method. Mumbai and Pune are divided into seven strata's and samples are collected
through simple random sampling method from each stratum‘s.
36
Preparation of Questionnaire
The research questionnaire is divided into two sections. The first section of the
questionnaire collected information on the respondent‘s demographic profile –
Gender, qualification of respondents, market experience ,etc. The second section of
the questionnaire collected information on different variables in capital market
investments and risk associated with it.
Pilot study and finalistion of Questionnaire
The questionnaire prepared was tested through a pilot study covering a sample of 30
investors in Mumbai. It was finalized after making necessary modifications based on
the pilot study results and used for the field survey.
Tabulation of Data
From the data collected with the help of questionnaire, a master table was prepared.
Tabulation process was adapted to summaries raw data and displaying them on
compact statistical table in form of excel sheet. The collected data was tabulated by
coding to questions and subsequently subjected to various statistical analysis. The
tabulation in software package was done in computer in Statistical Package for Social
Sciences(SPSS), it is integrated sets of program suitable for wide range of operations
and analysis such as handling missing data, recording, variable information, simple
descriptive analysis and multivariate analysis. After tabulation of data the mean score
for each conflict was obtained. These mean scores were subjected to various statistical
analysis by employing following techniques.
Tools of Analysis
The data collected for the study have been analysed with the help of computer
keeping in view the objectives of study. Simple statistical tools like percentages and
averages are extensively used in the study. Apart from this, other mathematical and
statistical tools like Compound growth rate, ANOVA, Rank correlation co-efficient,
Chi-square test and Kolomogorov – Smimov (K.S.-test) were used for analysis.

37
Interpretation and report writing
The analysed data were interpreted to draw the inference and objective of the study in
view.
Limitations of the Study
The Limitations of the study can be stated as follows:
1.Official records relating to the details of individual investors are not available.
Hence only the details of investors supplied by broker firms and mutual fund agents
are used for the selection of samples.
2. Non-existence of vital statistics relating to capital market investment in Mumbai
and Pune data has forced the investigator to depend solely on the information
collected through field survey.
3. The investors in general do not properly keep records of their income, saving and
investment. Therefore the information furnished by them from their memories has to
be relied upon.
In spite of the above limitations, the highlights of the study can help the policy makers
and the investing community at large to frame suitable policies for the betterment of
capital market investment.

38
CHAPTER 4
PROFILE OF STUDY AREA AND SAMPLE POPULATION
An attempt is made in this chapter to analyze the socio economic indicators of High
income individual investors in Mumbai and Pune city. Profile of the study area and
sample population is presented below.
A Brief Profile Of Mumbai and Pune City
Mumbai, formerly known as Bombay, is the entertainment, fashion and commercial
centre of India. According to estimated figures, the business city of India is currently
home to over 1.26 million people. Mumbai is also the fourth most populated city in
the world. Mumbai's metropolitan area population is estimated to be over 20.5 million
in 2014. Along with the neighboring urban areas, including the cities of Navi Mumbai
and Thane, it is one of the most populous urban regions in the world.
Pune is the cultural capital of Maharashtra. Since the 1950-60s, Pune has had
traditional old-economy industries which continue to grow. According to recent
estimates, Growth of Population in Pune is 12% every year. Its city population was
estimated to be 8,242,142 in 2014. This includes the towns of Khadki, Pimpri-
Chinchwad and Dehu.
Economy
Mumbai is the financial, commercial and entertainment capital of India. It is also one
of the world's top ten centers of commerce in terms of global financial flow. Mumbai
accounts for slightly more than 6.16% of India's economy contributing 10% of factory
employment, 30% of income tax collections, 60% of customs duty collections, 20%
of central excise tax collections, 40% of foreign trade and rupees 40,000 crore (US
$10 billion) in corporate taxes to the Indian economy. The city houses important
financial institutions such as the Reserve Bank of India, the Bombay Stock Exchange,
the National Stock Exchange of India, the SEBI and the corporate headquarters of
39
numerous Indian companies and multinational corporations. It is also home to some
of India's premier scientific and nuclear institutes like BARC, NPCL, IREL, TIFR,
AERB, AECI, and the Department of Atomic Energy. The city also houses India's
Hindi (Bollywood) and Marathi film and television industry. Mumbai's business
opportunities, as well as its potential to offer a higher standard of living,[19] attract
migrants from all over India, making the city a melting pot of many communities and
cultures.
As of 2009-10, Mumbai enjoys a Per Capita Income of $2,845. This is 16.6% higher
than 2008-09 levels of $2,440. In PPP dollars, Mumbai had a Per Capita Income of
$7,050 as of 2009-10 fiscal. In the recent years Mumbai is experiencing rapid growth.
By 2020-21 fiscal, Mumbai's GDP Per capita at PPP is expected to reach US$ 23,000,
making it South Asia's richest city.
As one of the largest cities in India, and as a result of its many colleges and
universities, Pune is emerging as a prominent location for IT and manufacturing
companies to expand. Pune has the seventh largest metropolitan economy[citation
needed] and the sixth highest per capita income in the country. Growth in the software
and education sectors has led to an influx of skilled labour from across India. The city
is now also known for Manufacturing, Automobile, and Government& Private sector
Research Institutes, Information technology (IT) and Educational, Management.
Stock Exchanges in Mumbai and Pune
Bombay Stock Exchange (BSE) was Established in 1875, BSE Ltd. (formerly known
as Bombay Stock Exchange Ltd.), is Asia‘s first Stock Exchange and one of India‘s
leading exchange groups. Popularly known as BSE, the bourse was established as
"The Native Share & Stock Brokers' Association" in 1875. BSE is a corporatized and
demutualised entity, with a broad shareholder-base which includes two leading global
exchanges, Deutsche Bourse and Singapore Exchange as strategic partners. BSE
provides an efficient and transparent market for trading in equity, debt instruments,
derivatives, mutual funds. It also has a platform for trading in equities of small-and-
medium enterprises (SME). More than 5000 companies are listed on BSE making it
world's No. 1 exchange in terms of listed members. The companies listed on BSE Ltd
command a total market capitalization of USD 1.32 Trillion as of January 2013. It is
40
also one of the world‘s leading exchanges (3rd largest in December 2012) for Index
options trading (Source: World Federation of Exchanges).
The National Stock Exchange (NSE) is India's leading stock exchange covering
various cities and towns across the country. NSE was set up by leading institutions to
provide a modern fully automated screen-based trading system with national reach.
The Exchange has brought about unparalleled transparency, speed & efficiency,
safety and market integrity. It has set up facilities that serve as a model for the
securities industry in terms of systems, practices and procedures.
NSE has played a catalytic role in reforming the Indian securities market in terms of
microstructure, market practices and trading volumes. The market today uses state-of-
art information technology to provide an efficient and transparent trading, clearing
and settlement mechanism, and has witnessed several innovations in products &
services viz. demutualization of stock exchange governance, screen based trading,
compression of settlement cycles, dematerialization and electronic transfer of
securities, securities lending and borrowing, professionalization of trading members,
fine-tuned risk management systems, emergence of clearing corporations to assume
counterparty risks, market of debt and derivative instruments and intensive use of
information technology.
United Stock Exchange, India‘s newest stock exchange, marks the beginning of a
new chapter in the development of Indian financial markets. USE represents the
commitment of ALL 21 Indian public sector banks, respected private banks and
corporate houses to build an institution that is on its way to becoming an enduring
symbol of India‘s modern financial markets. Sophisticated financial products such as
currency and interest rate derivatives are exciting introductions to Indian markets and
hold immense opportunities for businesses and trading institutions.
The Multi Commodity Exchange of India Limited (MCX), India‘s first listed
exchange, is a state-of-the-art, commodity futures exchange that facilitates online
trading, and clearing and settlement of commodity futures transactions, thereby
providing a platform for risk management. The Exchange, which started operations in
November 2003, operates within the regulatory framework of the Forward Contracts
(Regulation) Act, 1952. MCX offers trading in varied commodity futures contracts
41
across segments including bullion, ferrous and non-ferrous metals, energy, agri-based
and agricultural commodities. MCX is India‘s leading commodity futures exchange
with a market share of about 86 per cent in terms of the value of commodity futures
contracts traded in 9M FY2013-14.
OTC Exchange Of India was incorporated in 1990 the Exchange was set up to aid
enterprising promoters in raising finance for new projects in a cost effective manner
and to provide investors with a transparent & efficient mode of trading. Modeled
along the lines of the NASDAQ market of USA, OTCEI introduced many novel
concepts to the Indian capital markets such as screen-based nationwide trading,
sponsorship of companies, market making and scrip less trading. As a measure of
success of these efforts, the Exchange today has 115 listings and has assisted in
providing capital for enterprises that have gone on to build successful brands for
themselves like VIP Advantage, Sonora Tiles & Brilliant mineral water, etc.
Inter-connected Stock Exchange of India Limited (ISE) is a national-level stock
exchange, providing trading, clearing, settlement, risk management and surveillance
support to its Trading Members.ISE incorporated as a company limited by guarantee
in January - 1998. It has 791 Trading Members, who are located in 84 cities spread
across 18 states. SE aims to address the needs of small companies and retail investors
by harnessing the potential of regional markets, so as to transform them into a liquid
and vibrant market using state-of-the art technology and networking.
Pune Stock Exchange Ltd. is a company limited by guarantee. The Exchange was
established on 2nd Sept. 1982 to cater to the needs of the growing investor
community in the city. Starting small, with 35 members and a few lac rupees business
initially, the exchange has grown tremendously to over 185 members and about 15-20
crores of business daily.
42
Profile Of Sample Population
The study of investor‘s preferences in capital market investment with special
reference to Mumbai and Pune was carried and primary data have been collected from
individual investors through a sample survey. The data is collected from target
respondents through a structured questionnaire method. A sample of 1074 individual
investors from Mumbai and Pune has been selected for this purpose. The target
respondents are adults of 18 years or above who have income more than 10 lakh p.a.
For the purpose of sample study Mumbai district was divided into six geographical
regions as per the six parliamentary Mumbai North, Mumbai North West, Mumbai
North East, Mumbai North Central Mumbai South Central, and Mumbai South. And
Pune district is taken as one region as a whole.
A sample of 200 investors were selected from each of the seven sample regions on
simple random basis from the list of investors supplied by broker firms and mutual
funds agents. The personal profile of respondents who participated in the survey is
presented in tables below. It is arranged in the order of age, sex, marital status,
educational qualification, occupation income, and savings.
Personal Profile of Respondents
In this section an attempt is made to present the demographic indicators namely age,
education, occupation, income, gender and stage of life cycle of High Income
individual investors in Mumbai and Pune city.
Distribution of Retail Investors according to Age Sex Marital Status and Education:
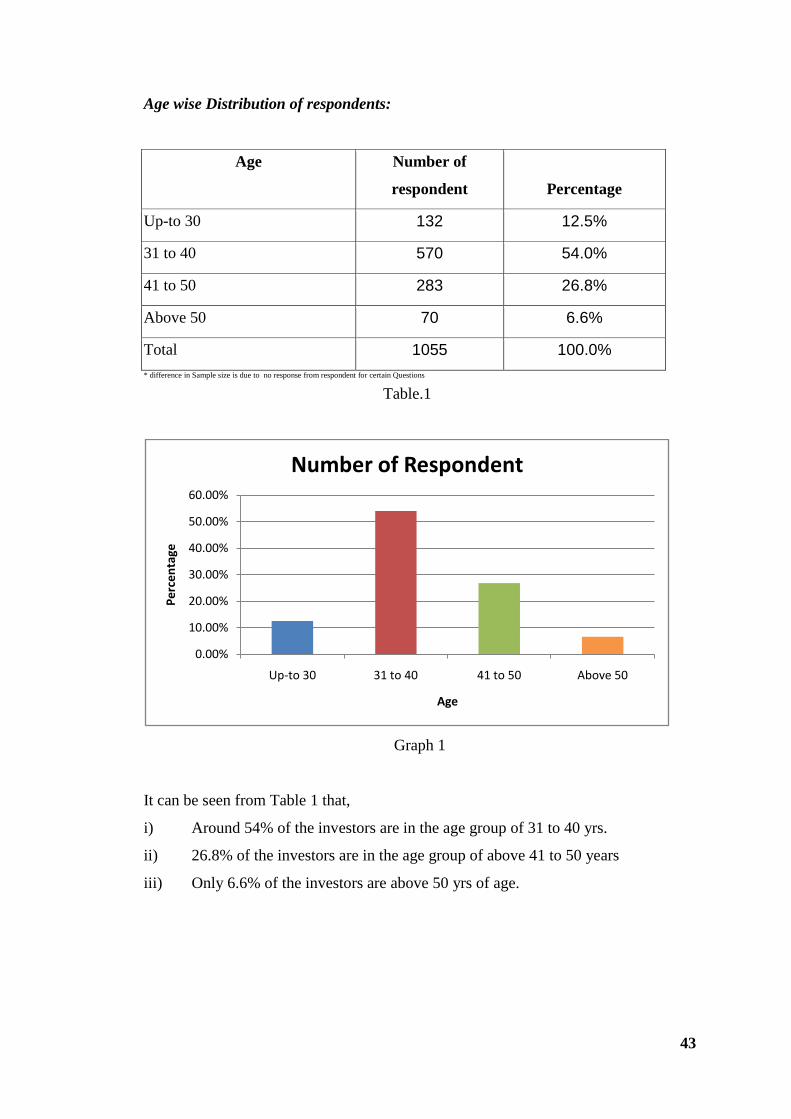
43
Age wise Distribution of respondents:
Age Number of
respondent Percentage
Up-to 30 132 12.5%
31 to 40 570 54.0%
41 to 50 283 26.8%
Above 50 70 6.6%
Total 1055 100.0%
* difference in Sample size is due to no response from respondent for certain Questions
Table.1
Graph 1
It can be seen from Table 1 that,
i) Around 54% of the investors are in the age group of 31 to 40 yrs.
ii) 26.8% of the investors are in the age group of above 41 to 50 years
iii) Only 6.6% of the investors are above 50 yrs of age.
0.00%
10.00%
20.00%
30.00%
40.00%
50.00%
60.00%
Up-to 30 31 to 40 41 to 50 Above 50
Pe
rce
nta
ge
Age
Number of Respondent
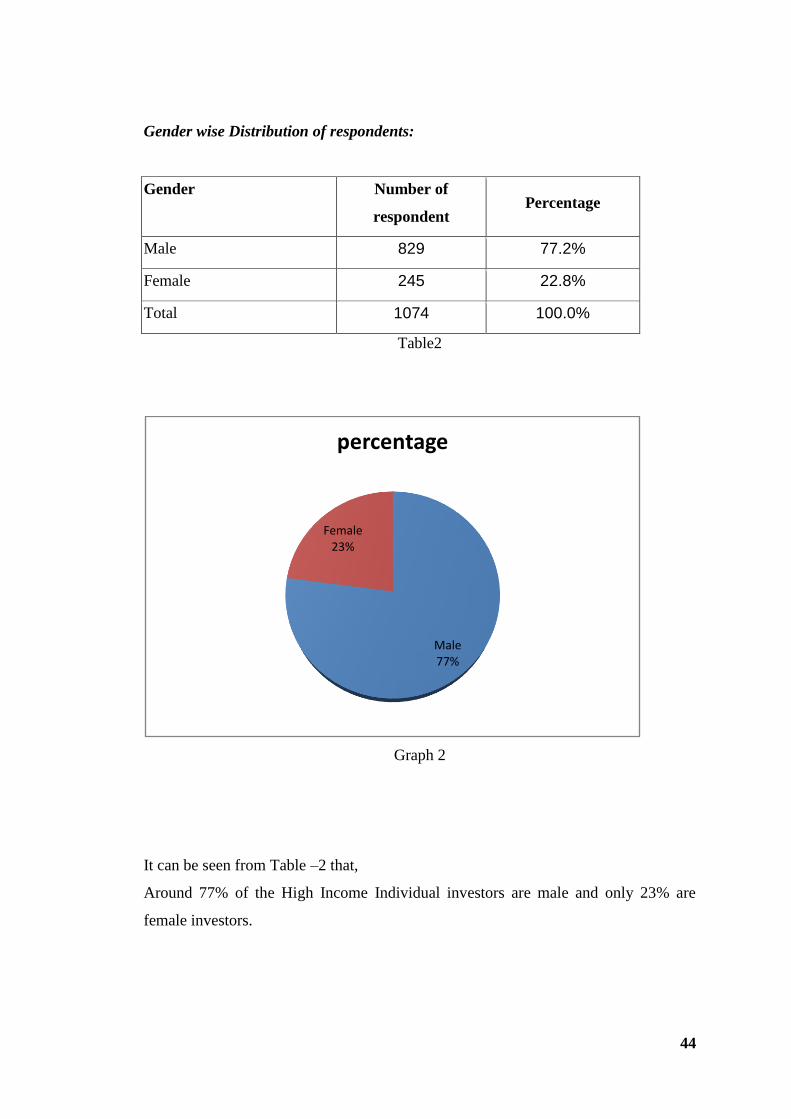
44
Gender wise Distribution of respondents:
Gender Number of
respondent Percentage
Male 829 77.2%
Female 245 22.8%
Total 1074 100.0%
Table2
Graph 2
It can be seen from Table –2 that,
Around 77% of the High Income Individual investors are male and only 23% are
female investors.
Male77%
Female23%
percentage
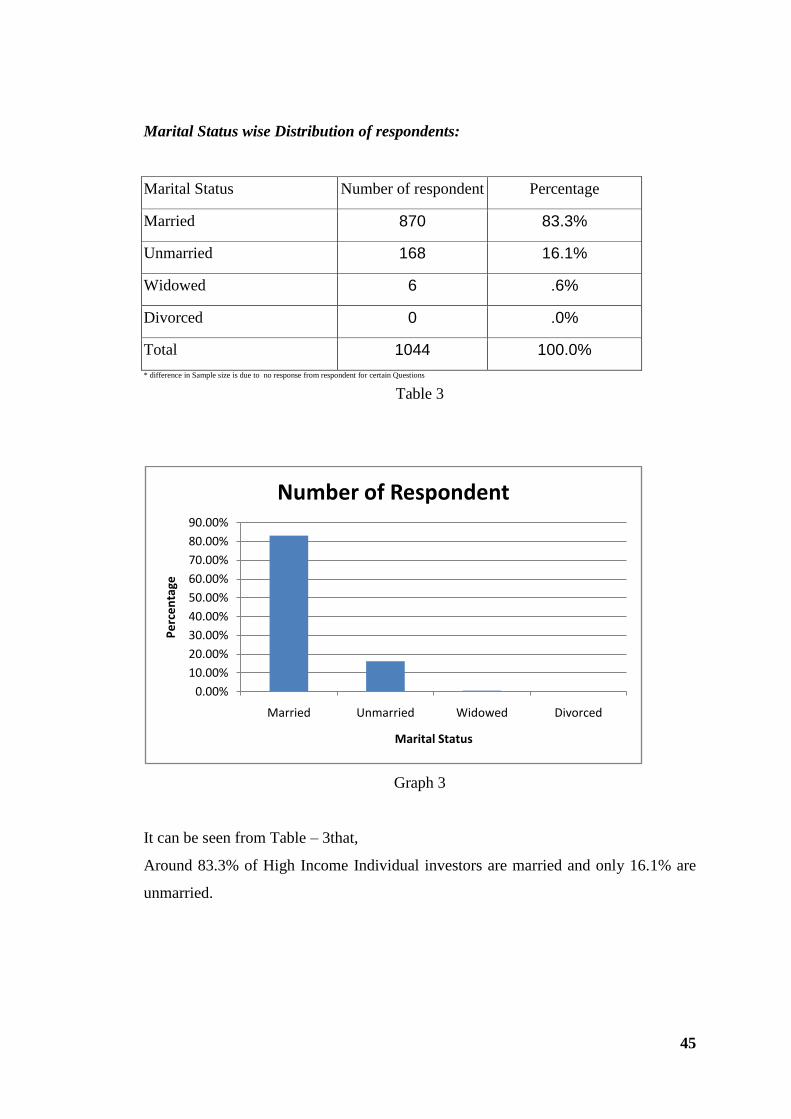
45
Marital Status wise Distribution of respondents:
Marital Status Number of respondent Percentage
Married 870 83.3%
Unmarried 168 16.1%
Widowed 6 .6%
Divorced 0 .0%
Total 1044 100.0%
* difference in Sample size is due to no response from respondent for certain Questions
Table 3
Graph 3
It can be seen from Table – 3that,
Around 83.3% of High Income Individual investors are married and only 16.1% are
unmarried.
0.00%
10.00%
20.00%
30.00%
40.00%
50.00%
60.00%
70.00%
80.00%
90.00%
Married Unmarried Widowed Divorced
Pe
rce
nta
ge
Marital Status
Number of Respondent
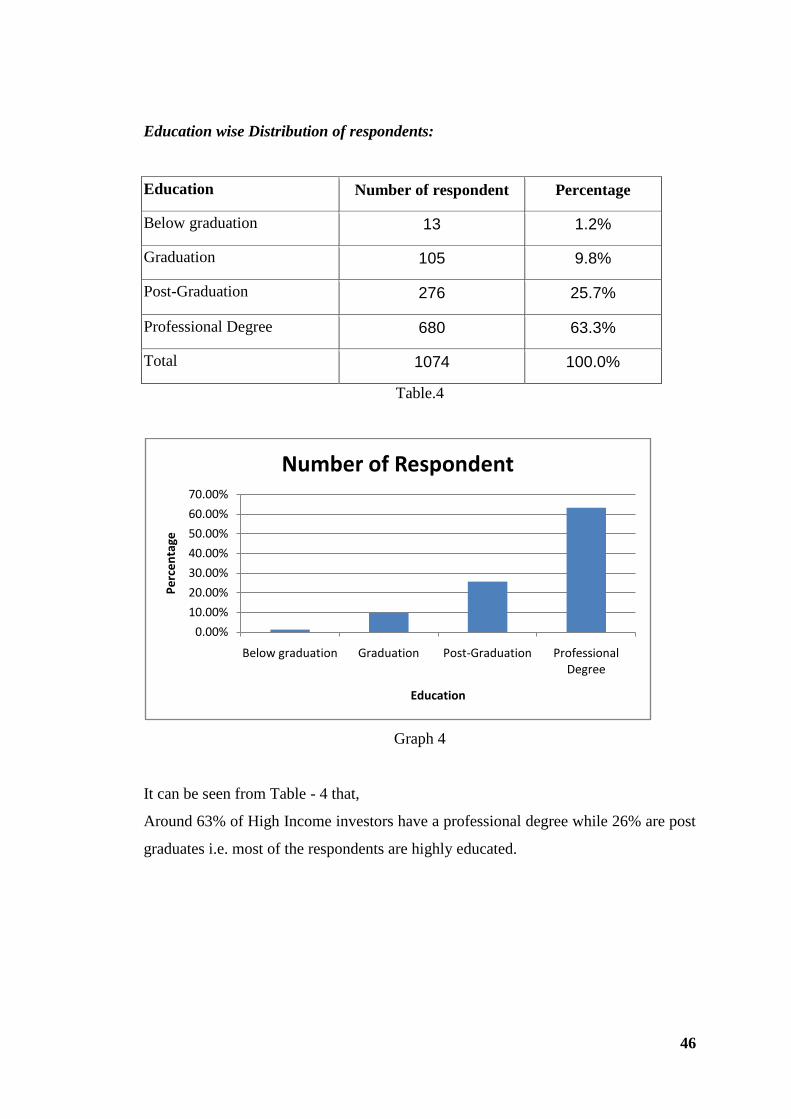
46
Education wise Distribution of respondents:
Education Number of respondent Percentage
Below graduation 13 1.2%
Graduation 105 9.8%
Post-Graduation 276 25.7%
Professional Degree 680 63.3%
Total 1074 100.0%
Table.4
Graph 4
It can be seen from Table - 4 that,
Around 63% of High Income investors have a professional degree while 26% are post
graduates i.e. most of the respondents are highly educated.
0.00%
10.00%
20.00%
30.00%
40.00%
50.00%
60.00%
70.00%
Below graduation Graduation Post-Graduation Professional Degree
Pe
rce
nta
ge
Education
Number of Respondent
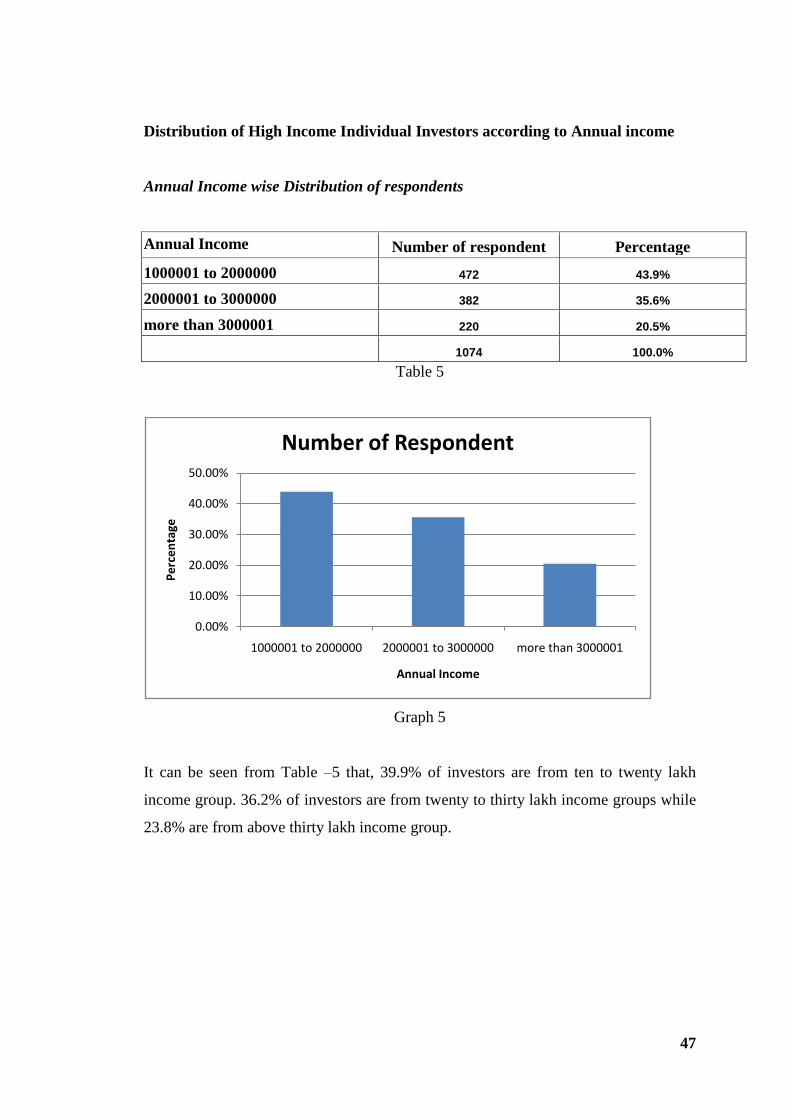
47
Distribution of High Income Individual Investors according to Annual income
Annual Income wise Distribution of respondents
Annual Income Number of respondent Percentage
1000001 to 2000000 472 43.9%
2000001 to 3000000 382 35.6%
more than 3000001 220 20.5%
1074 100.0%
Table 5
Graph 5
It can be seen from Table –5 that, 39.9% of investors are from ten to twenty lakh
income group. 36.2% of investors are from twenty to thirty lakh income groups while
23.8% are from above thirty lakh income group.
0.00%
10.00%
20.00%
30.00%
40.00%
50.00%
1000001 to 2000000 2000001 to 3000000 more than 3000001
Pe
rce
nta
ge
Annual Income
Number of Respondent
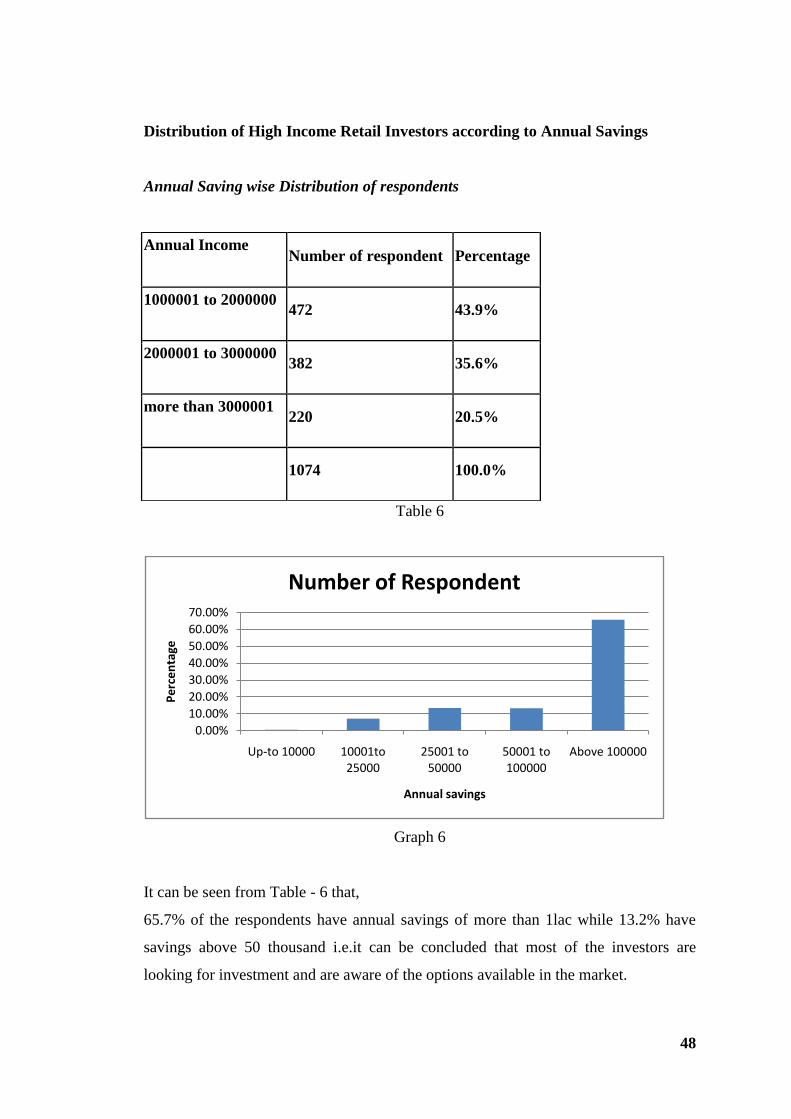
48
Distribution of High Income Retail Investors according to Annual Savings
Annual Saving wise Distribution of respondents
Table 6
Graph 6
It can be seen from Table - 6 that,
65.7% of the respondents have annual savings of more than 1lac while 13.2% have
savings above 50 thousand i.e.it can be concluded that most of the investors are
looking for investment and are aware of the options available in the market.
0.00%
10.00%
20.00%
30.00%
40.00%
50.00%
60.00%
70.00%
Up-to 10000 10001to 25000
25001 to 50000
50001 to 100000
Above 100000
Pe
rce
nta
ge
Annual savings
Number of Respondent
Annual Income Number of respondent Percentage
1000001 to 2000000 472 43.9%
2000001 to 3000000 382 35.6%
more than 3000001 220 20.5%
1074 100.0%
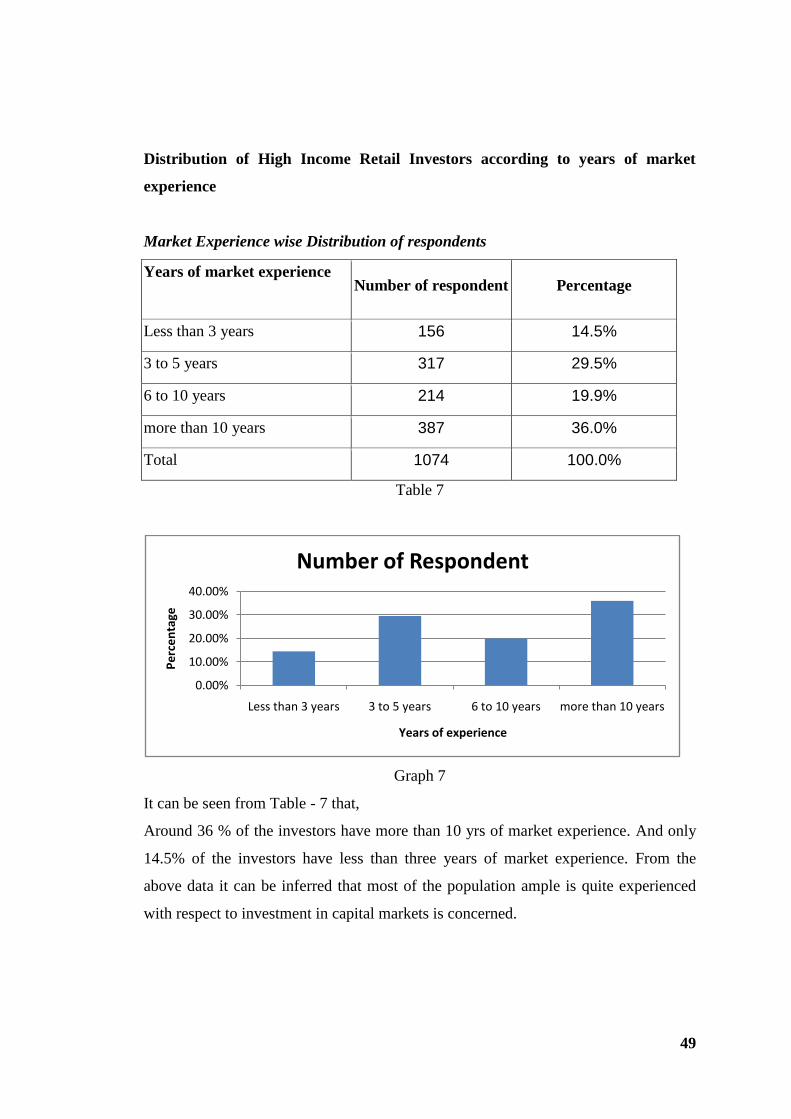
49
Distribution of High Income Retail Investors according to years of market
experience
Market Experience wise Distribution of respondents
Years of market experience
Number of respondent Percentage
Less than 3 years 156 14.5%
3 to 5 years 317 29.5%
6 to 10 years 214 19.9%
more than 10 years 387 36.0%
Total 1074 100.0%
Table 7
Graph 7
It can be seen from Table - 7 that,
Around 36 % of the investors have more than 10 yrs of market experience. And only
14.5% of the investors have less than three years of market experience. From the
above data it can be inferred that most of the population ample is quite experienced
with respect to investment in capital markets is concerned.
0.00%
10.00%
20.00%
30.00%
40.00%
Less than 3 years 3 to 5 years 6 to 10 years more than 10 years
Pe
rce
nta
ge
Years of experience
Number of Respondent
50
CHAPTER 5
ANALYSIS AND INTERPRETATION OF DATA
The investment scene in Mumbai and Pune in earlier years was characterized by the
existence of banks, chit funds, post office savings schemes etc., but the emergence of
capital market helped investors to divert their savings to corporate sector through
capital market instruments. Moreover, the socio-economic conditions that prevail in
Mumbai and Pune due to literacy rate, influence of print and visual media, high rate
of wages and inflow on foreign remittance have created an atmosphere conducive to
the development of capital market. The vast reforms in the capital market initiated in
line with economic liberalization in the country have also helped to arouse the interest
of investors. A comparative analysis of savings invested in capital market instruments
and in other financial assets of 1074 sample investors from Mumbai and Pune in
presented.
Prime objectives of capital market investment of High Income Group investor
Study of the important reasons for the capital investment of High Income Group is
carried out by listing four objectives for investment. Respondent were asked to
respond for more than one objective.
H01: All the options for reason of investment are equally preferred by High Income
individual investor.
H11: All the options for reason of investment are not equally preferred by High
Income individual investor.
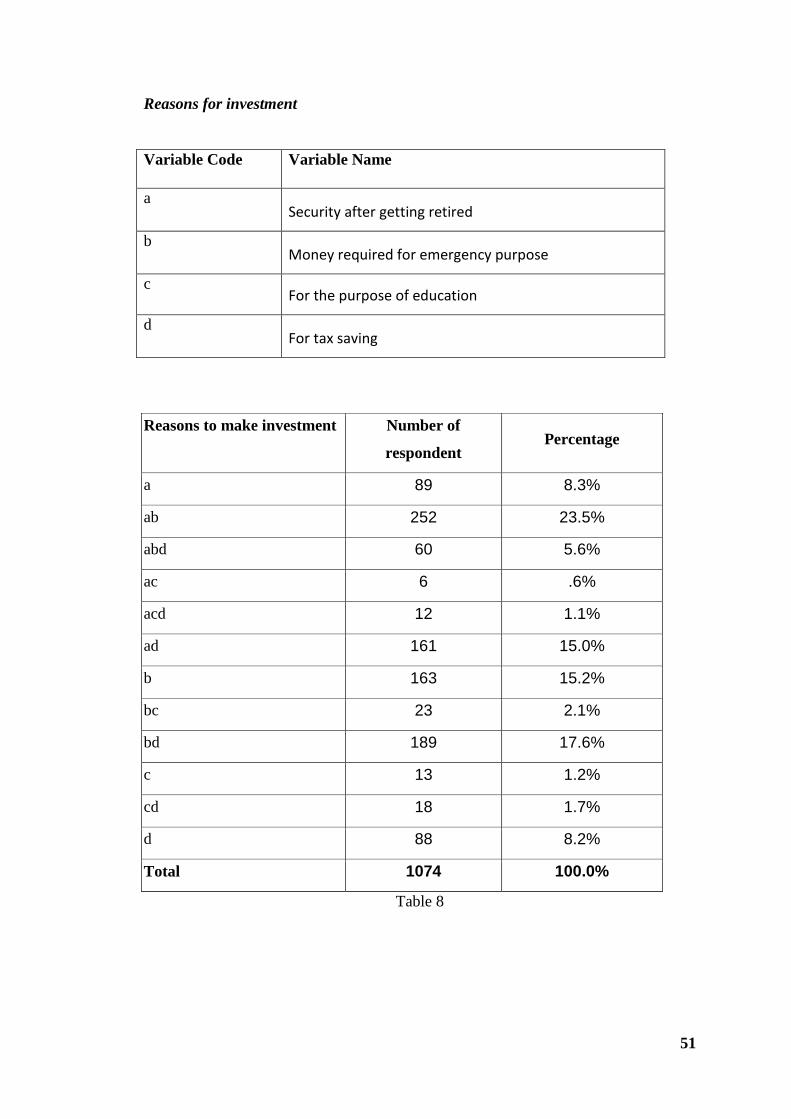
51
Reasons for investment
Variable Code Variable Name
a Security after getting retired
b Money required for emergency purpose
c For the purpose of education
d For tax saving
Reasons to make investment Number of
respondent Percentage
a 89 8.3%
ab 252 23.5%
abd 60 5.6%
ac 6 .6%
acd 12 1.1%
ad 161 15.0%
b 163 15.2%
bc 23 2.1%
bd 189 17.6%
c 13 1.2%
cd 18 1.7%
d 88 8.2%
Total 1074 100.0%
Table 8
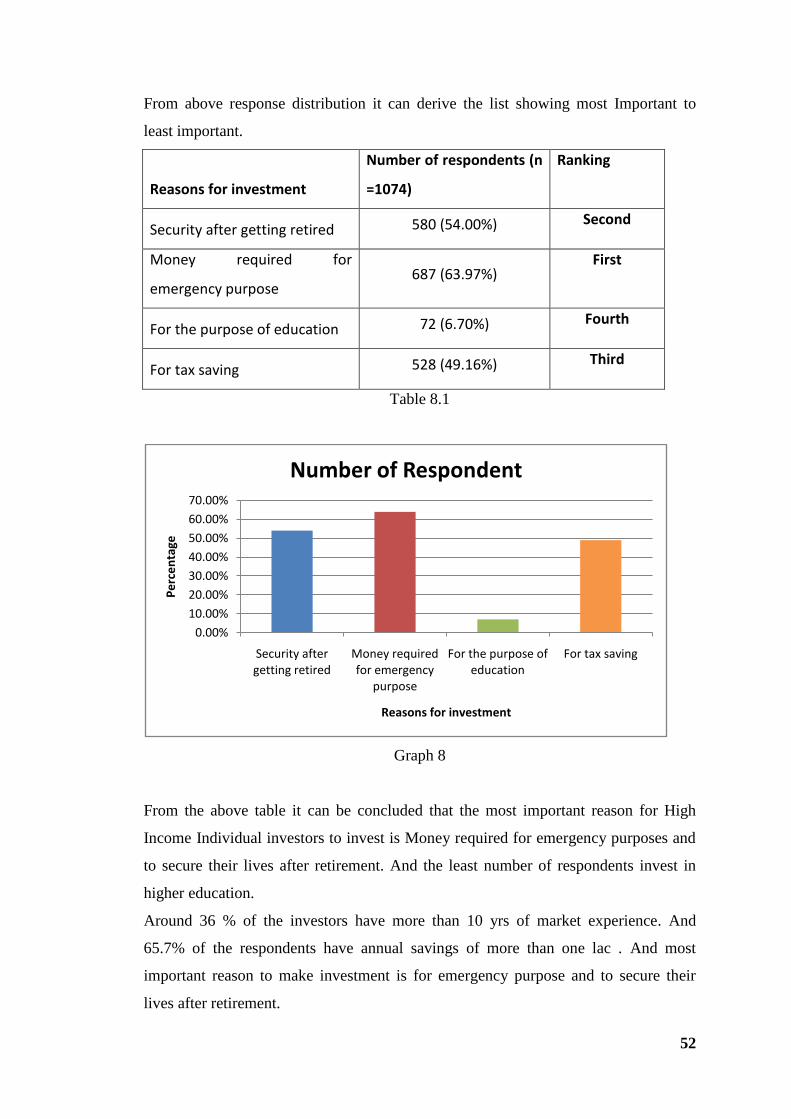
52
From above response distribution it can derive the list showing most Important to
least important.
Reasons for investment
Number of respondents (n
=1074)
Ranking
Security after getting retired 580 (54.00%) Second
Money required for
emergency purpose 687 (63.97%)
First
For the purpose of education 72 (6.70%) Fourth
For tax saving 528 (49.16%) Third
Table 8.1
Graph 8
From the above table it can be concluded that the most important reason for High
Income Individual investors to invest is Money required for emergency purposes and
to secure their lives after retirement. And the least number of respondents invest in
higher education.
Around 36 % of the investors have more than 10 yrs of market experience. And
65.7% of the respondents have annual savings of more than one lac . And most
important reason to make investment is for emergency purpose and to secure their
lives after retirement.
0.00%
10.00%
20.00%
30.00%
40.00%
50.00%
60.00%
70.00%
Security after getting retired
Money required for emergency
purpose
For the purpose of education
For tax saving
Pe
rce
nta
ge
Reasons for investment
Number of Respondent
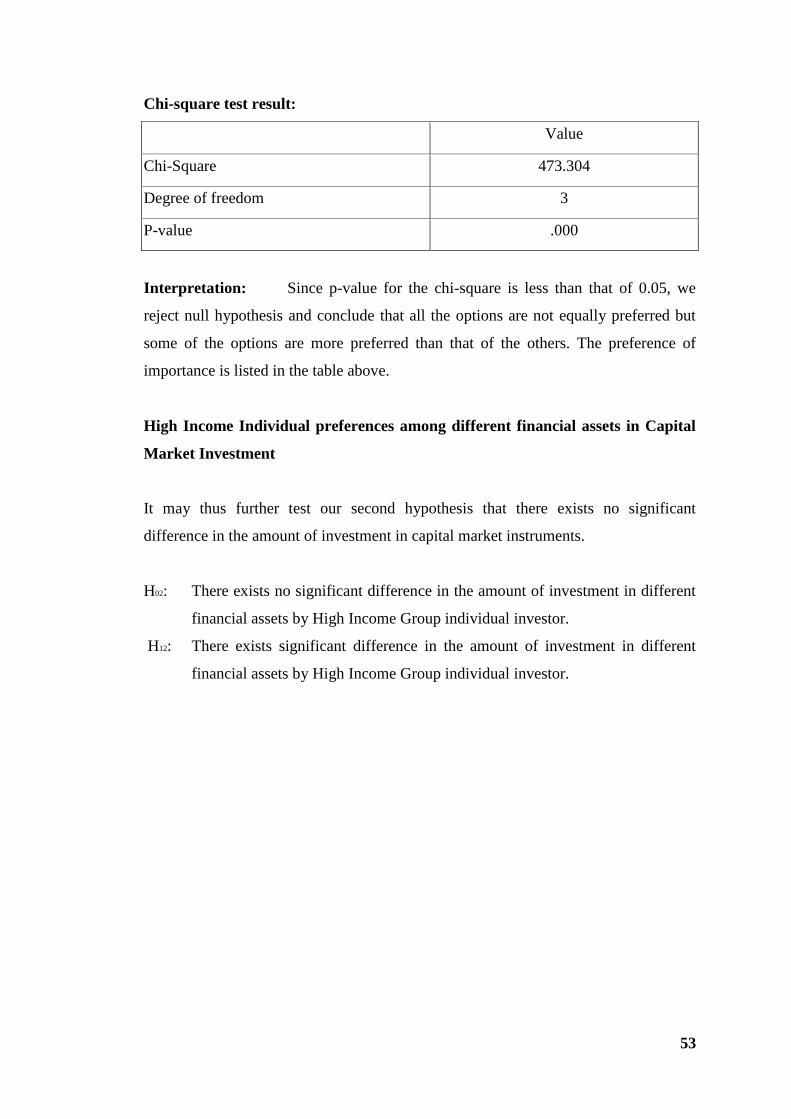
53
Chi-square test result:
Value
Chi-Square 473.304
Degree of freedom 3
P-value .000
Interpretation: Since p-value for the chi-square is less than that of 0.05, we
reject null hypothesis and conclude that all the options are not equally preferred but
some of the options are more preferred than that of the others. The preference of
importance is listed in the table above.
High Income Individual preferences among different financial assets in Capital
Market Investment
It may thus further test our second hypothesis that there exists no significant
difference in the amount of investment in capital market instruments.
H02: There exists no significant difference in the amount of investment in different
financial assets by High Income Group individual investor.
H12: There exists significant difference in the amount of investment in different
financial assets by High Income Group individual investor.
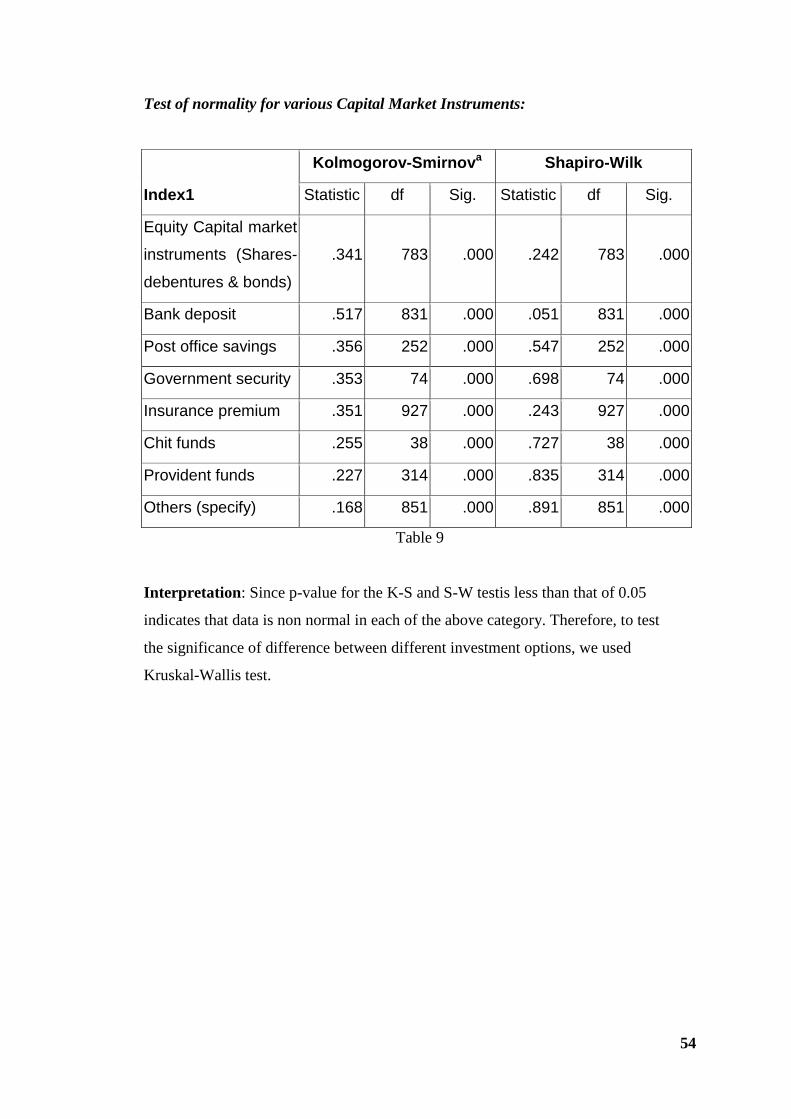
54
Test of normality for various Capital Market Instruments:
Index1
Kolmogorov-Smirnova Shapiro-Wilk
Statistic df Sig. Statistic df Sig.
Equity Capital market
instruments (Shares-
debentures & bonds)
.341 783 .000 .242 783 .000
Bank deposit .517 831 .000 .051 831 .000
Post office savings .356 252 .000 .547 252 .000
Government security .353 74 .000 .698 74 .000
Insurance premium .351 927 .000 .243 927 .000
Chit funds .255 38 .000 .727 38 .000
Provident funds .227 314 .000 .835 314 .000
Others (specify) .168 851 .000 .891 851 .000
Table 9
Interpretation: Since p-value for the K-S and S-W testis less than that of 0.05
indicates that data is non normal in each of the above category. Therefore, to test
the significance of difference between different investment options, we used
Kruskal-Wallis test.
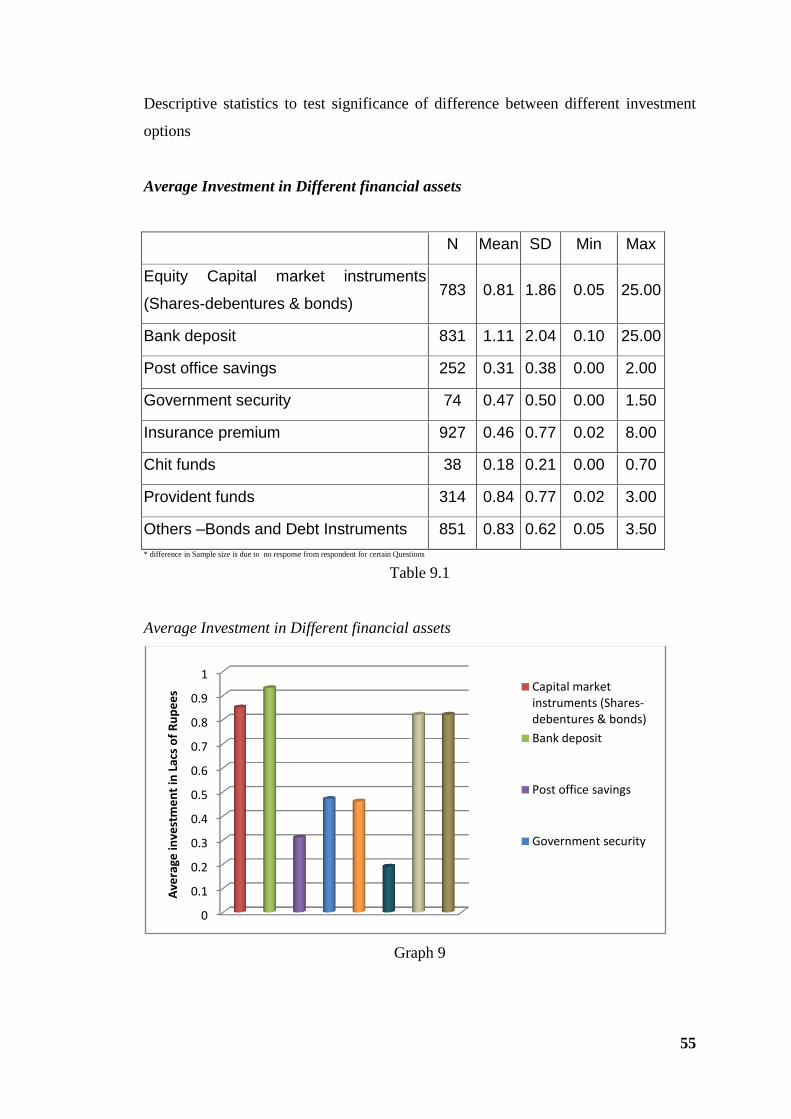
55
Descriptive statistics to test significance of difference between different investment
options
Average Investment in Different financial assets
N Mean SD Min Max
Equity Capital market instruments
(Shares-debentures & bonds) 783 0.81 1.86 0.05 25.00
Bank deposit 831 1.11 2.04 0.10 25.00
Post office savings 252 0.31 0.38 0.00 2.00
Government security 74 0.47 0.50 0.00 1.50
Insurance premium 927 0.46 0.77 0.02 8.00
Chit funds 38 0.18 0.21 0.00 0.70
Provident funds 314 0.84 0.77 0.02 3.00
Others –Bonds and Debt Instruments 851 0.83 0.62 0.05 3.50
* difference in Sample size is due to no response from respondent for certain Questions
Table 9.1
Average Investment in Different financial assets
Graph 9
0
0.1
0.2
0.3
0.4
0.5
0.6
0.7
0.8
0.9
1
Ave
rage
inve
stm
en
t in
Lac
s o
f R
up
ee
s Capital market instruments (Shares-debentures & bonds)
Bank deposit
Post office savings
Government security
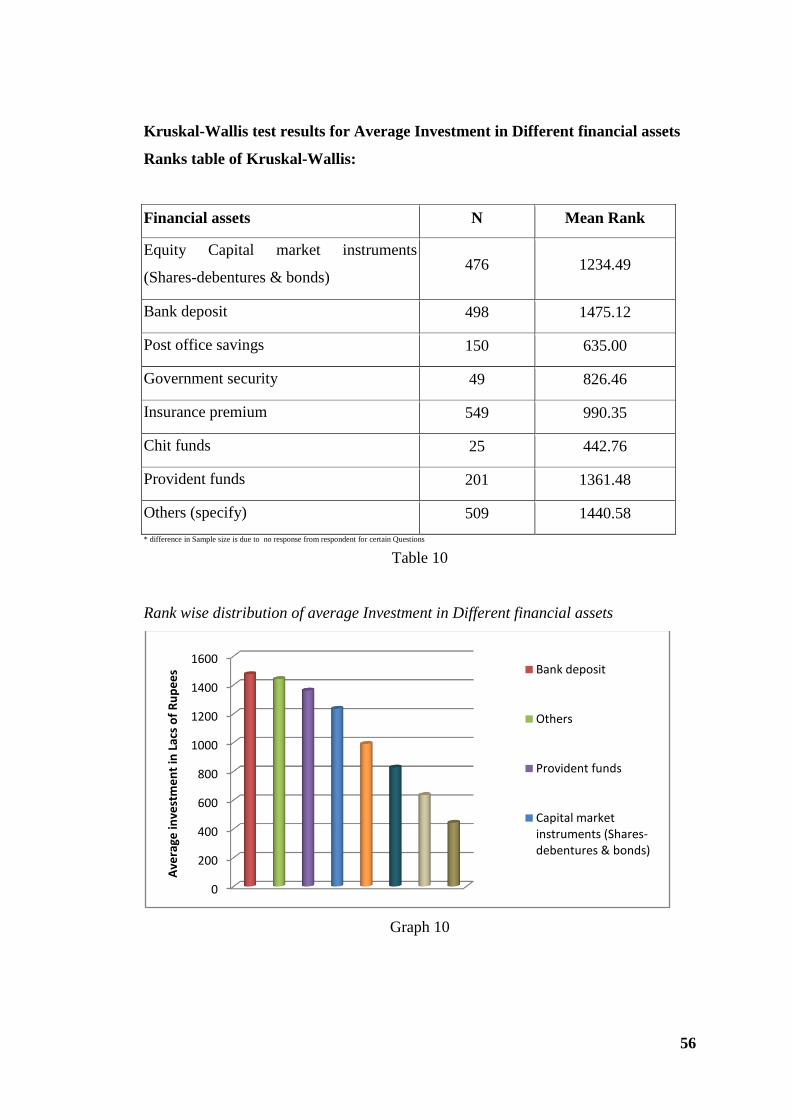
56
Kruskal-Wallis test results for Average Investment in Different financial assets
Ranks table of Kruskal-Wallis:
Financial assets N Mean Rank
Equity Capital market instruments
(Shares-debentures & bonds) 476 1234.49
Bank deposit 498 1475.12
Post office savings 150 635.00
Government security 49 826.46
Insurance premium 549 990.35
Chit funds 25 442.76
Provident funds 201 1361.48
Others (specify) 509 1440.58
* difference in Sample size is due to no response from respondent for certain Questions
Table 10
Rank wise distribution of average Investment in Different financial assets
Graph 10
0
200
400
600
800
1000
1200
1400
1600
Ave
rage
inve
stm
en
t in
Lac
s o
f R
up
ee
s Bank deposit
Others
Provident funds
Capital market instruments (Shares-debentures & bonds)
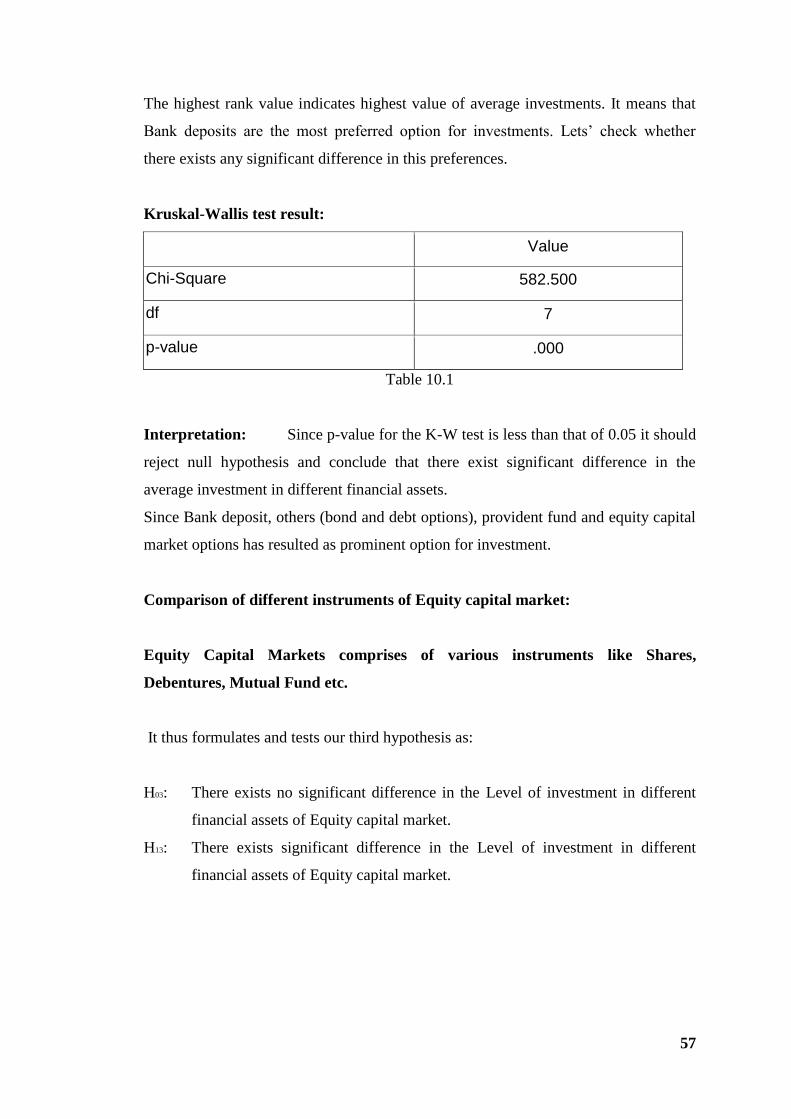
57
The highest rank value indicates highest value of average investments. It means that
Bank deposits are the most preferred option for investments. Lets‘ check whether
there exists any significant difference in this preferences.
Kruskal-Wallis test result:
Value
Chi-Square 582.500
df 7
p-value .000
Table 10.1
Interpretation: Since p-value for the K-W test is less than that of 0.05 it should
reject null hypothesis and conclude that there exist significant difference in the
average investment in different financial assets.
Since Bank deposit, others (bond and debt options), provident fund and equity capital
market options has resulted as prominent option for investment.
Comparison of different instruments of Equity capital market:
Equity Capital Markets comprises of various instruments like Shares,
Debentures, Mutual Fund etc.
It thus formulates and tests our third hypothesis as:
H03: There exists no significant difference in the Level of investment in different
financial assets of Equity capital market.
H13: There exists significant difference in the Level of investment in different
financial assets of Equity capital market.
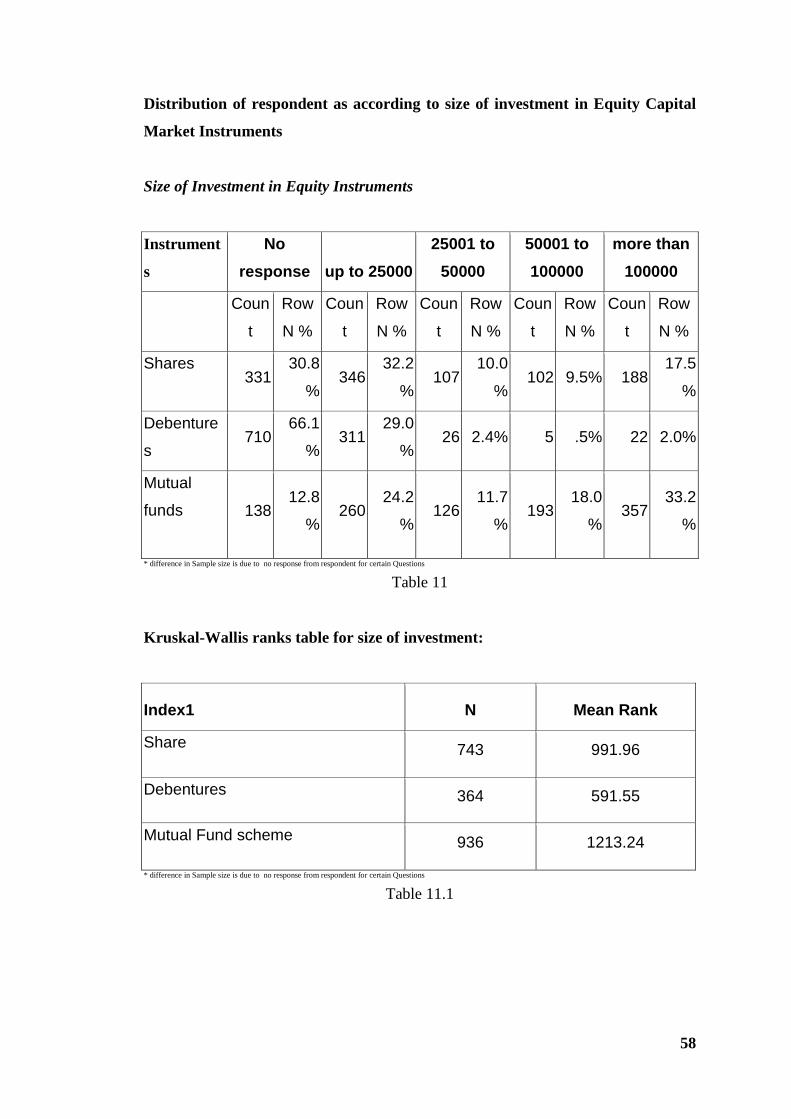
58
Distribution of respondent as according to size of investment in Equity Capital
Market Instruments
Size of Investment in Equity Instruments
Instrument
s
No
response up to 25000
25001 to
50000
50001 to
100000
more than
100000
Coun
t
Row
N %
Coun
t
Row
N %
Coun
t
Row
N %
Coun
t
Row
N %
Coun
t
Row
N %
Shares 331
30.8
% 346
32.2
% 107
10.0
% 102 9.5% 188
17.5
%
Debenture
s 710
66.1
% 311
29.0
% 26 2.4% 5 .5% 22 2.0%
Mutual
funds 138 12.8
% 260
24.2
% 126
11.7
% 193
18.0
% 357
33.2
%
* difference in Sample size is due to no response from respondent for certain Questions
Table 11
Kruskal-Wallis ranks table for size of investment:
Index1 N Mean Rank
Share 743 991.96
Debentures 364 591.55
Mutual Fund scheme 936 1213.24
* difference in Sample size is due to no response from respondent for certain Questions
Table 11.1
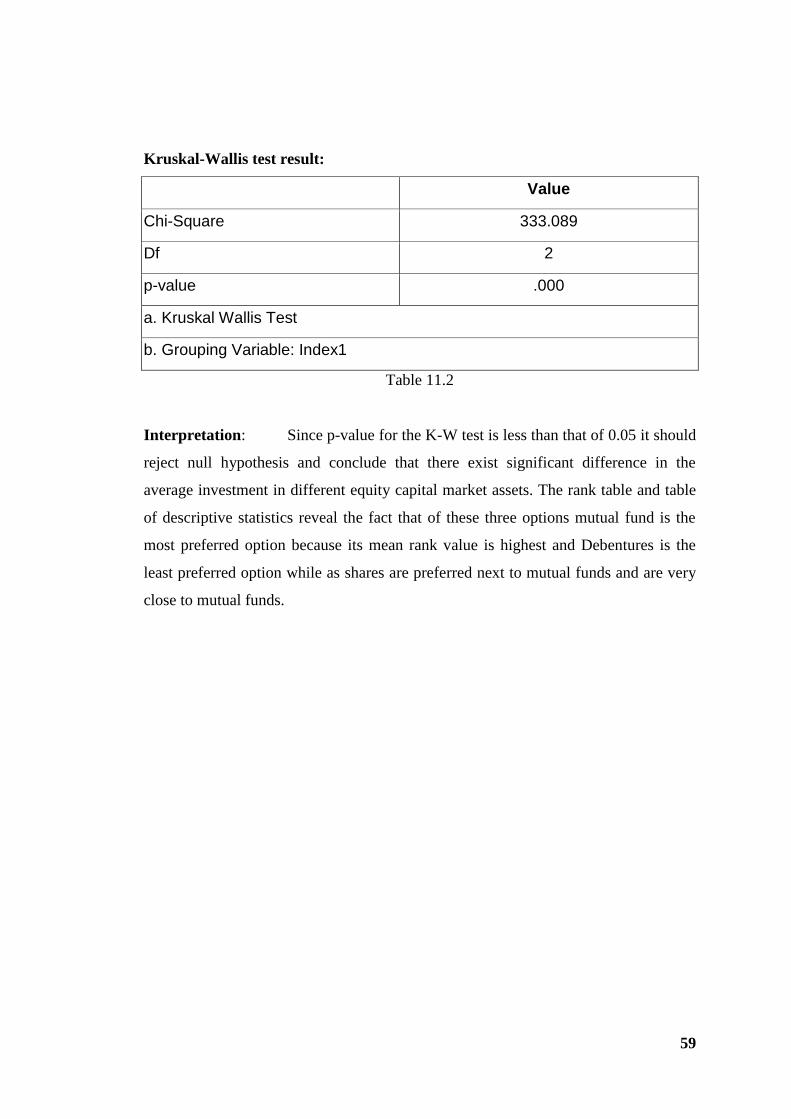
59
Kruskal-Wallis test result:
Value
Chi-Square 333.089
Df 2
p-value .000
a. Kruskal Wallis Test
b. Grouping Variable: Index1
Table 11.2
Interpretation: Since p-value for the K-W test is less than that of 0.05 it should
reject null hypothesis and conclude that there exist significant difference in the
average investment in different equity capital market assets. The rank table and table
of descriptive statistics reveal the fact that of these three options mutual fund is the
most preferred option because its mean rank value is highest and Debentures is the
least preferred option while as shares are preferred next to mutual funds and are very
close to mutual funds.
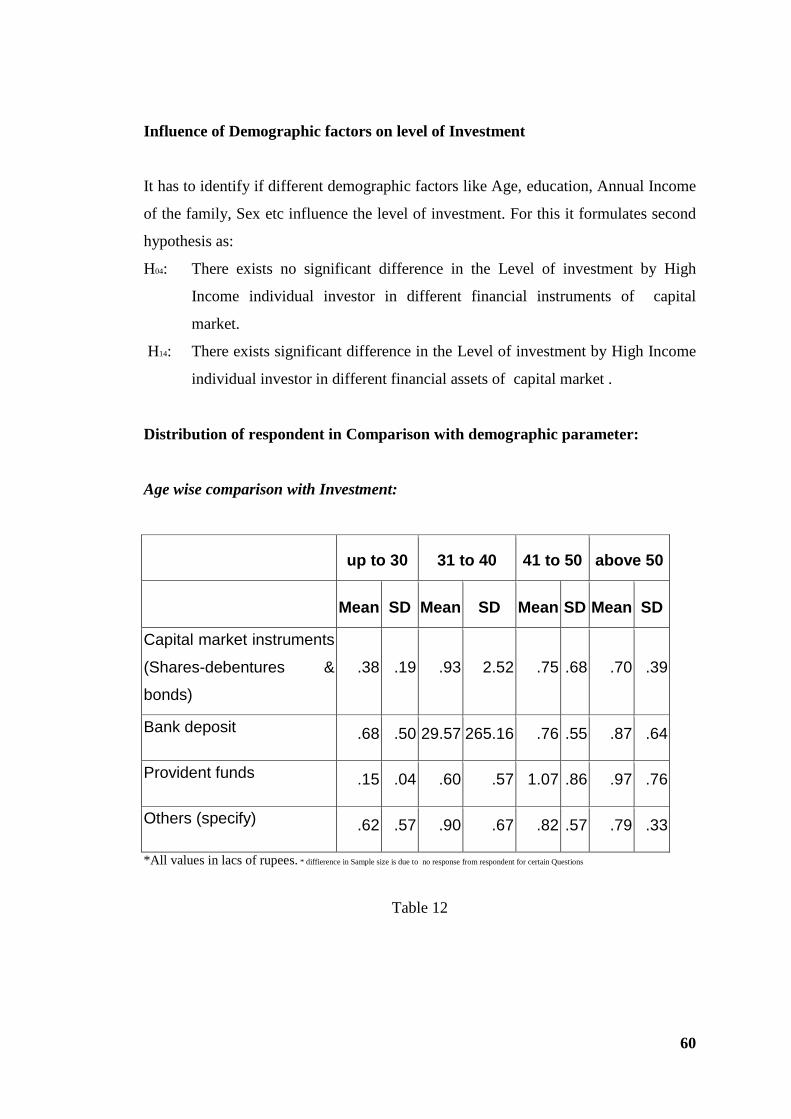
60
Influence of Demographic factors on level of Investment
It has to identify if different demographic factors like Age, education, Annual Income
of the family, Sex etc influence the level of investment. For this it formulates second
hypothesis as:
H04: There exists no significant difference in the Level of investment by High
Income individual investor in different financial instruments of capital
market.
H14: There exists significant difference in the Level of investment by High Income
individual investor in different financial assets of capital market .
Distribution of respondent in Comparison with demographic parameter:
Age wise comparison with Investment:
up to 30 31 to 40 41 to 50 above 50
Mean SD Mean SD Mean SD Mean SD
Capital market instruments
(Shares-debentures &
bonds)
.38 .19 .93 2.52 .75 .68 .70 .39
Bank deposit .68 .50 29.57 265.16 .76 .55 .87 .64
Provident funds .15 .04 .60 .57 1.07 .86 .97 .76
Others (specify) .62 .57 .90 .67 .82 .57 .79 .33
*All values in lacs of rupees. * diffierence in Sample size is due to no response from respondent for certain Questions
Table 12
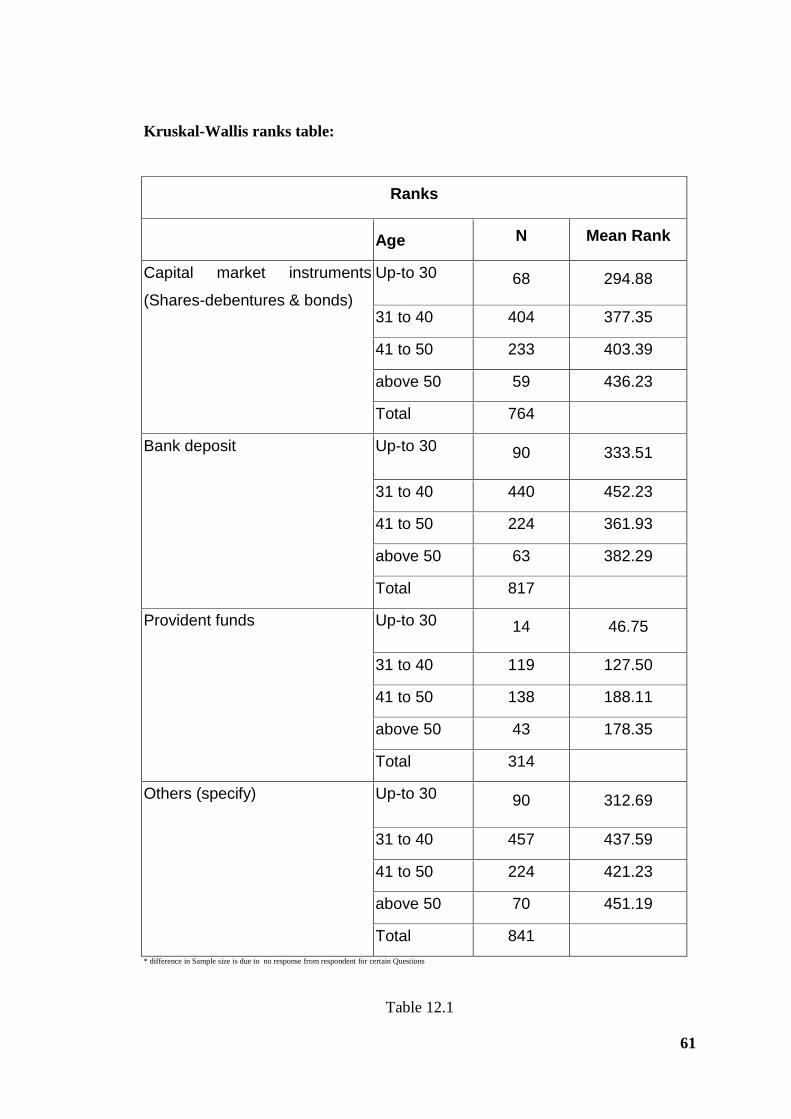
61
Kruskal-Wallis ranks table:
Ranks
Age N Mean Rank
Capital market instruments
(Shares-debentures & bonds)
Up-to 30 68 294.88
31 to 40 404 377.35
41 to 50 233 403.39
above 50 59 436.23
Total 764
Bank deposit Up-to 30 90 333.51
31 to 40 440 452.23
41 to 50 224 361.93
above 50 63 382.29
Total 817
Provident funds Up-to 30 14 46.75
31 to 40 119 127.50
41 to 50 138 188.11
above 50 43 178.35
Total 314
Others (specify) Up-to 30 90 312.69
31 to 40 457 437.59
41 to 50 224 421.23
above 50 70 451.19
Total 841
* difference in Sample size is due to no response from respondent for certain Questions
Table 12.1
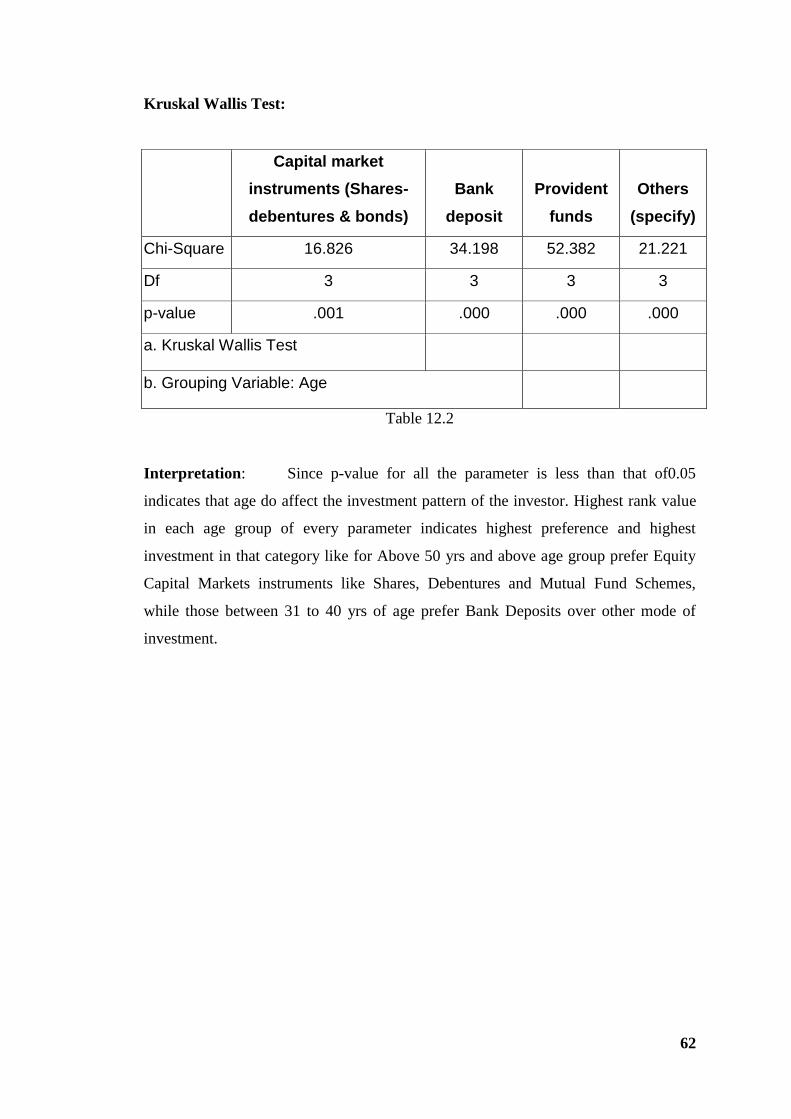
62
Kruskal Wallis Test:
Capital market
instruments (Shares-
debentures & bonds)
Bank
deposit
Provident
funds
Others
(specify)
Chi-Square 16.826 34.198 52.382 21.221
Df 3 3 3 3
p-value .001 .000 .000 .000
a. Kruskal Wallis Test
b. Grouping Variable: Age
Table 12.2
Interpretation: Since p-value for all the parameter is less than that of0.05
indicates that age do affect the investment pattern of the investor. Highest rank value
in each age group of every parameter indicates highest preference and highest
investment in that category like for Above 50 yrs and above age group prefer Equity
Capital Markets instruments like Shares, Debentures and Mutual Fund Schemes,
while those between 31 to 40 yrs of age prefer Bank Deposits over other mode of
investment.
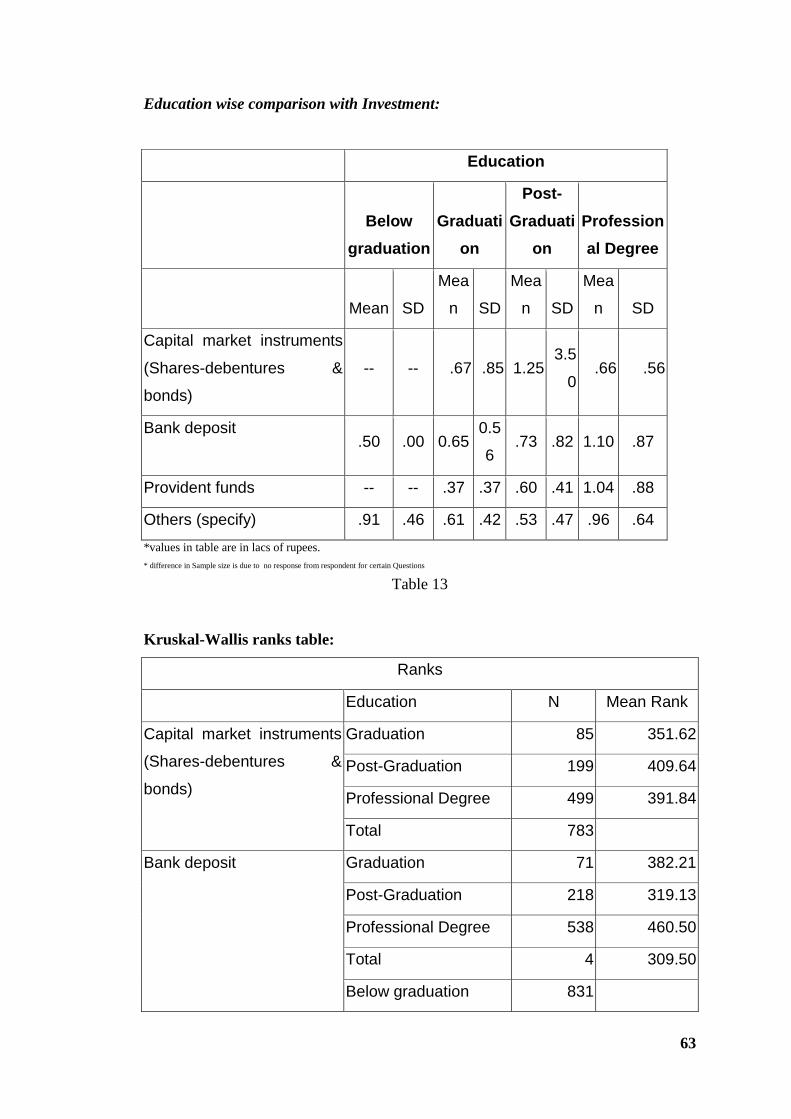
63
Education wise comparison with Investment:
Education
Below
graduation
Graduati
on
Post-
Graduati
on
Profession
al Degree
Mean SD
Mea
n SD
Mea
n SD
Mea
n SD
Capital market instruments
(Shares-debentures &
bonds)
-- -- .67 .85 1.25 3.5
0 .66 .56
Bank deposit .50 .00 0.65
0.5
6 .73 .82 1.10 .87
Provident funds -- -- .37 .37 .60 .41 1.04 .88
Others (specify) .91 .46 .61 .42 .53 .47 .96 .64
*values in table are in lacs of rupees.
* difference in Sample size is due to no response from respondent for certain Questions
Table 13
Kruskal-Wallis ranks table:
Ranks
Education N Mean Rank
Capital market instruments
(Shares-debentures &
bonds)
Graduation 85 351.62
Post-Graduation 199 409.64
Professional Degree 499 391.84
Total 783
Bank deposit Graduation 71 382.21
Post-Graduation 218 319.13
Professional Degree 538 460.50
Total 4 309.50
Below graduation 831
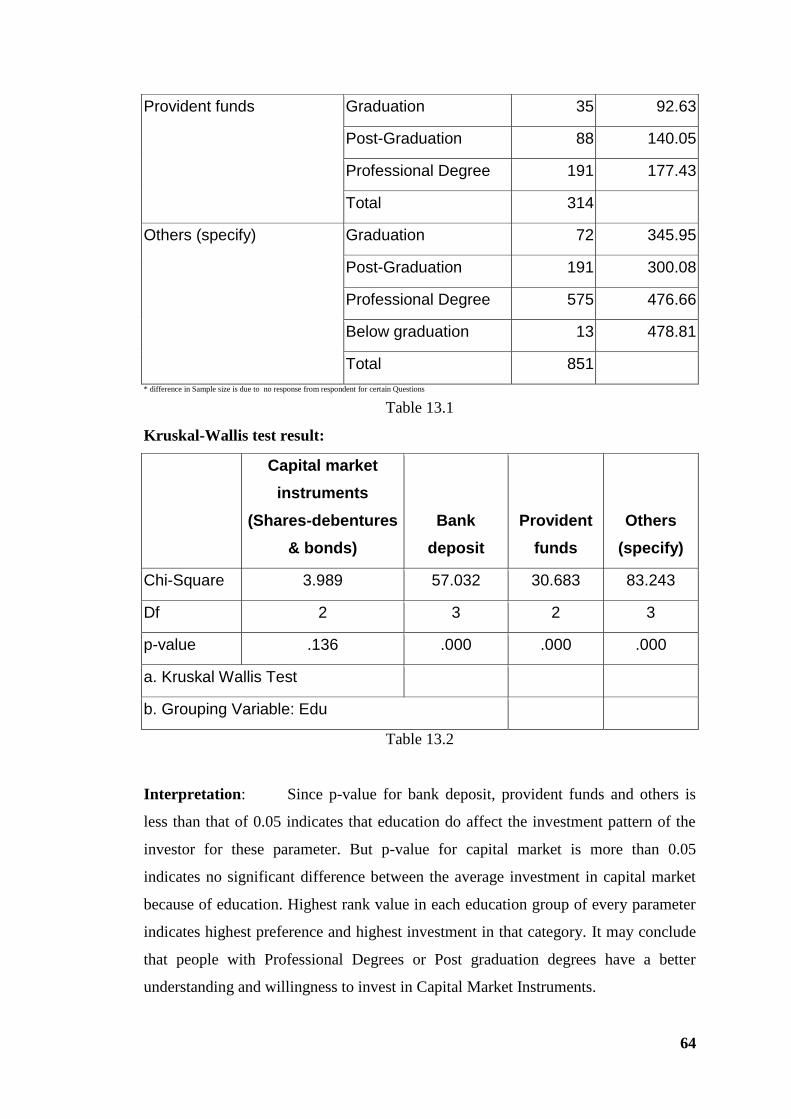
64
Provident funds Graduation 35 92.63
Post-Graduation 88 140.05
Professional Degree 191 177.43
Total 314
Others (specify) Graduation 72 345.95
Post-Graduation 191 300.08
Professional Degree 575 476.66
Below graduation 13 478.81
Total 851
* difference in Sample size is due to no response from respondent for certain Questions
Table 13.1
Kruskal-Wallis test result:
Capital market
instruments
(Shares-debentures
& bonds)
Bank
deposit
Provident
funds
Others
(specify)
Chi-Square 3.989 57.032 30.683 83.243
Df 2 3 2 3
p-value .136 .000 .000 .000
a. Kruskal Wallis Test
b. Grouping Variable: Edu
Table 13.2
Interpretation: Since p-value for bank deposit, provident funds and others is
less than that of 0.05 indicates that education do affect the investment pattern of the
investor for these parameter. But p-value for capital market is more than 0.05
indicates no significant difference between the average investment in capital market
because of education. Highest rank value in each education group of every parameter
indicates highest preference and highest investment in that category. It may conclude
that people with Professional Degrees or Post graduation degrees have a better
understanding and willingness to invest in Capital Market Instruments.
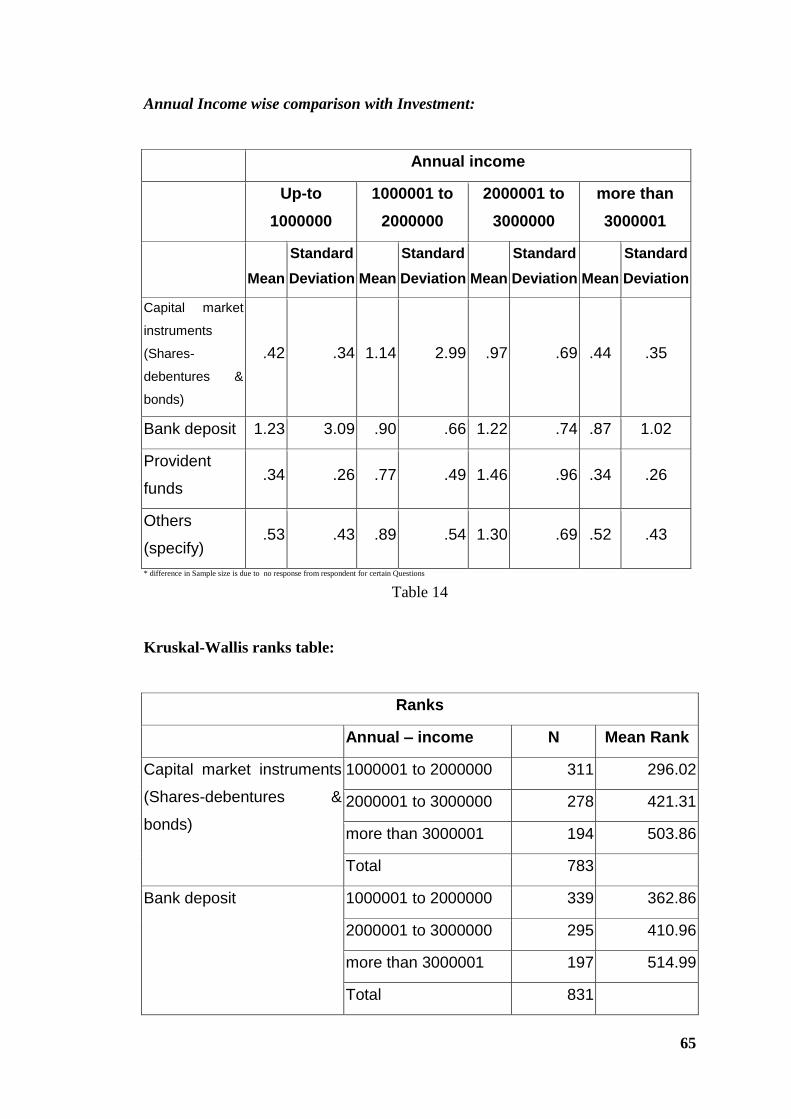
65
Annual Income wise comparison with Investment:
Annual income
Up-to
1000000
1000001 to
2000000
2000001 to
3000000
more than
3000001
Mean
Standard
Deviation Mean
Standard
Deviation Mean
Standard
Deviation Mean
Standard
Deviation
Capital market
instruments
(Shares-
debentures &
bonds)
.42 .34 1.14 2.99 .97 .69 .44 .35
Bank deposit 1.23 3.09 .90 .66 1.22 .74 .87 1.02
Provident
funds .34 .26 .77 .49 1.46 .96 .34 .26
Others
(specify) .53 .43 .89 .54 1.30 .69 .52 .43
* difference in Sample size is due to no response from respondent for certain Questions
Table 14
Kruskal-Wallis ranks table:
Ranks
Annual – income N Mean Rank
Capital market instruments
(Shares-debentures &
bonds)
1000001 to 2000000 311 296.02
2000001 to 3000000 278 421.31
more than 3000001 194 503.86
Total 783
Bank deposit 1000001 to 2000000 339 362.86
2000001 to 3000000 295 410.96
more than 3000001 197 514.99
Total 831
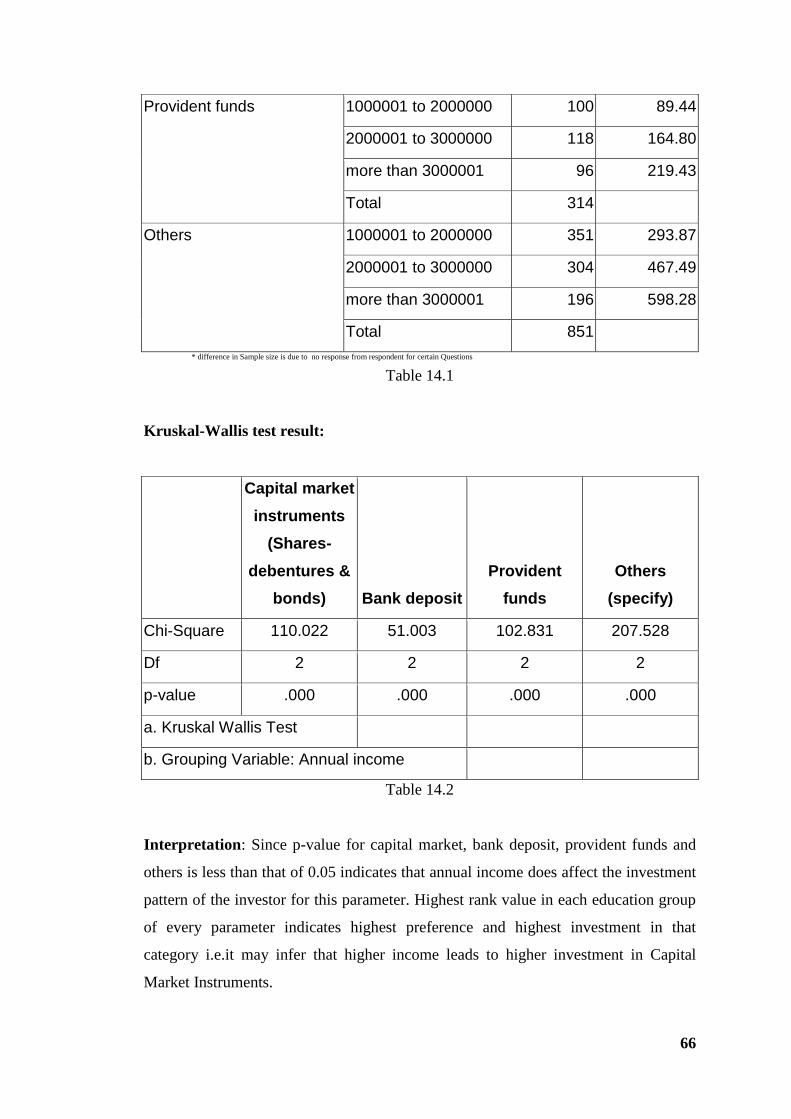
66
Provident funds 1000001 to 2000000 100 89.44
2000001 to 3000000 118 164.80
more than 3000001 96 219.43
Total 314
Others 1000001 to 2000000 351 293.87
2000001 to 3000000 304 467.49
more than 3000001 196 598.28
Total 851
* difference in Sample size is due to no response from respondent for certain Questions
Table 14.1
Kruskal-Wallis test result:
Capital market
instruments
(Shares-
debentures &
bonds) Bank deposit
Provident
funds
Others
(specify)
Chi-Square 110.022 51.003 102.831 207.528
Df 2 2 2 2
p-value .000 .000 .000 .000
a. Kruskal Wallis Test
b. Grouping Variable: Annual income
Table 14.2
Interpretation: Since p-value for capital market, bank deposit, provident funds and
others is less than that of 0.05 indicates that annual income does affect the investment
pattern of the investor for this parameter. Highest rank value in each education group
of every parameter indicates highest preference and highest investment in that
category i.e.it may infer that higher income leads to higher investment in Capital
Market Instruments.
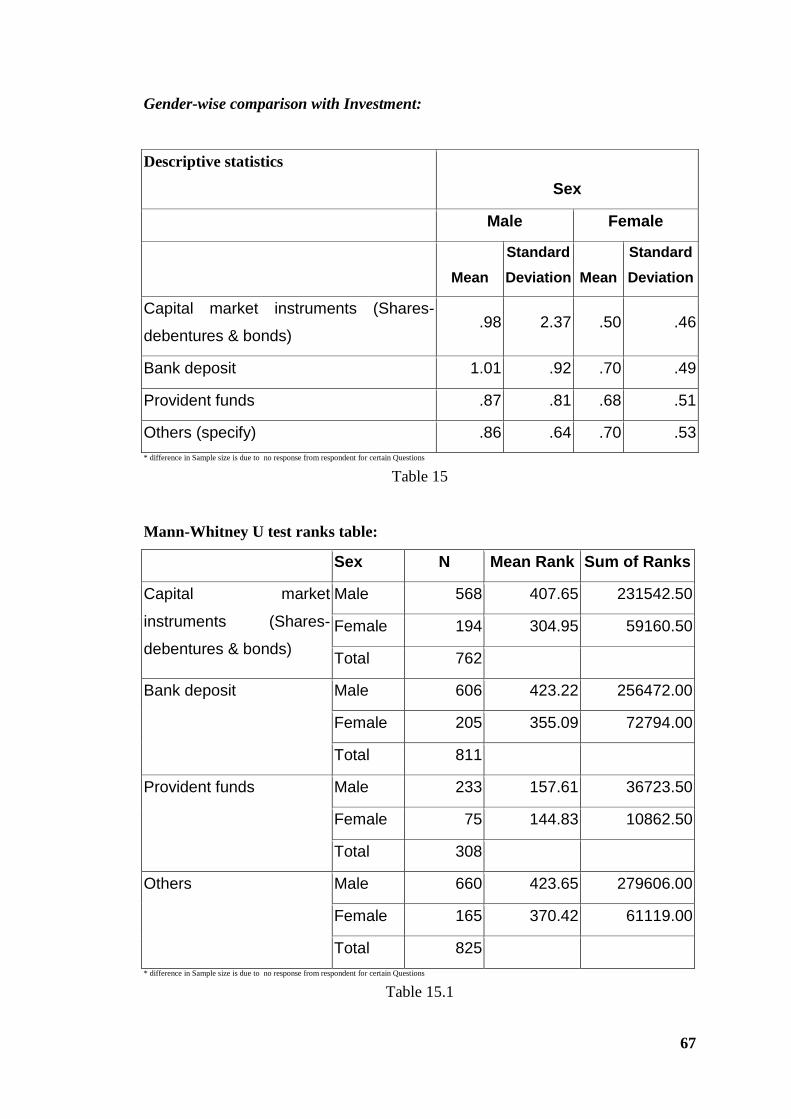
67
Gender-wise comparison with Investment:
Descriptive statistics
Sex
Male Female
Mean
Standard
Deviation Mean
Standard
Deviation
Capital market instruments (Shares-
debentures & bonds) .98 2.37 .50 .46
Bank deposit 1.01 .92 .70 .49
Provident funds .87 .81 .68 .51
Others (specify) .86 .64 .70 .53
* difference in Sample size is due to no response from respondent for certain Questions
Table 15
Mann-Whitney U test ranks table:
Sex N Mean Rank Sum of Ranks
Capital market
instruments (Shares-
debentures & bonds)
Male 568 407.65 231542.50
Female 194 304.95 59160.50
Total 762
Bank deposit Male 606 423.22 256472.00
Female 205 355.09 72794.00
Total 811
Provident funds Male 233 157.61 36723.50
Female 75 144.83 10862.50
Total 308
Others Male 660 423.65 279606.00
Female 165 370.42 61119.00
Total 825
* difference in Sample size is due to no response from respondent for certain Questions
Table 15.1
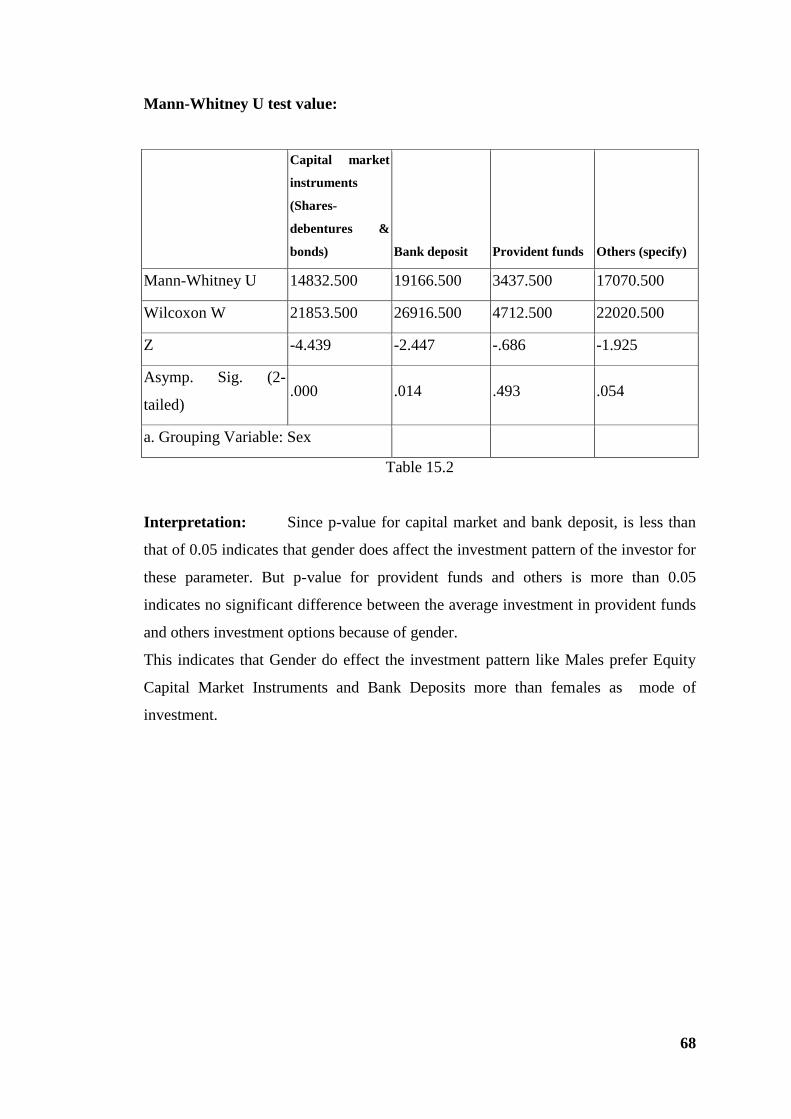
68
Mann-Whitney U test value:
Capital market
instruments
(Shares-
debentures &
bonds) Bank deposit Provident funds Others (specify)
Mann-Whitney U 14832.500 19166.500 3437.500 17070.500
Wilcoxon W 21853.500 26916.500 4712.500 22020.500
Z -4.439 -2.447 -.686 -1.925
Asymp. Sig. (2-
tailed) .000 .014 .493 .054
a. Grouping Variable: Sex
Table 15.2
Interpretation: Since p-value for capital market and bank deposit, is less than
that of 0.05 indicates that gender does affect the investment pattern of the investor for
these parameter. But p-value for provident funds and others is more than 0.05
indicates no significant difference between the average investment in provident funds
and others investment options because of gender.
This indicates that Gender do effect the investment pattern like Males prefer Equity
Capital Market Instruments and Bank Deposits more than females as mode of
investment.
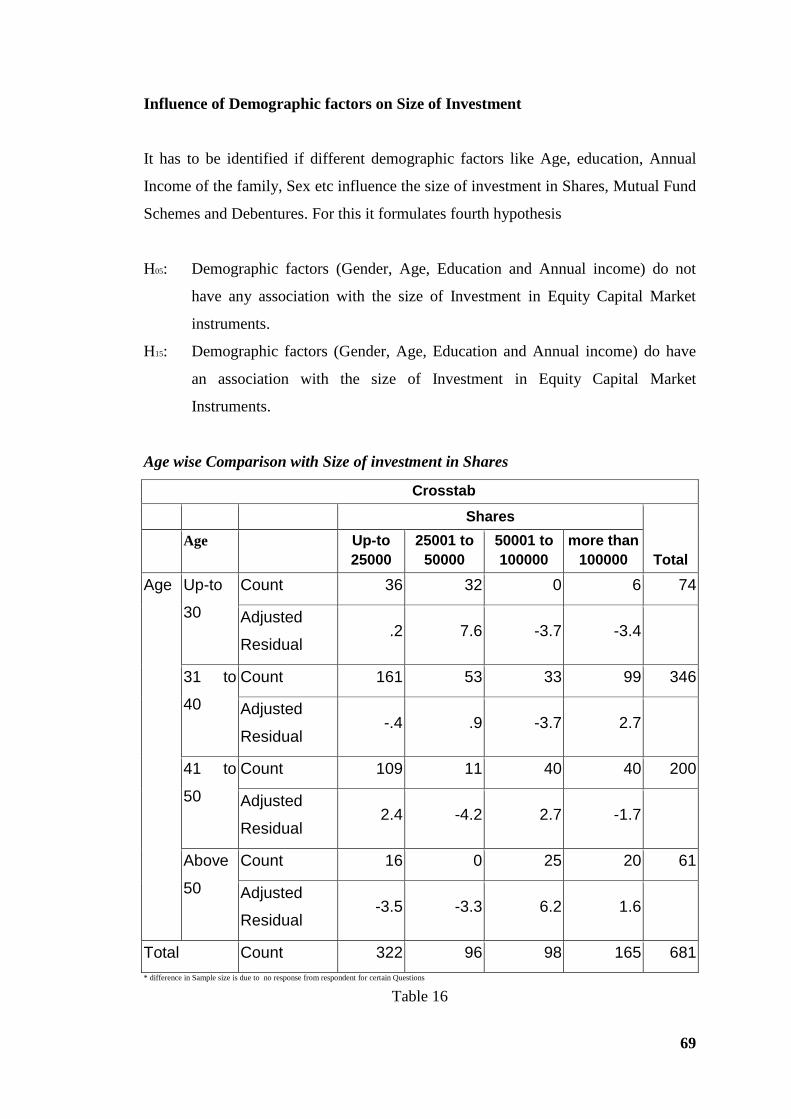
69
Influence of Demographic factors on Size of Investment
It has to be identified if different demographic factors like Age, education, Annual
Income of the family, Sex etc influence the size of investment in Shares, Mutual Fund
Schemes and Debentures. For this it formulates fourth hypothesis
H05: Demographic factors (Gender, Age, Education and Annual income) do not
have any association with the size of Investment in Equity Capital Market
instruments.
H15: Demographic factors (Gender, Age, Education and Annual income) do have
an association with the size of Investment in Equity Capital Market
Instruments.
Age wise Comparison with Size of investment in Shares
Crosstab
Shares
Total Age Up-to
25000
25001 to
50000
50001 to
100000
more than
100000
Age Up-to
30
Count 36 32 0 6 74
Adjusted
Residual .2 7.6 -3.7 -3.4
31 to
40
Count 161 53 33 99 346
Adjusted
Residual -.4 .9 -3.7 2.7
41 to
50
Count 109 11 40 40 200
Adjusted
Residual 2.4 -4.2 2.7 -1.7
Above
50
Count 16 0 25 20 61
Adjusted
Residual -3.5 -3.3 6.2 1.6
Total Count 322 96 98 165 681
* difference in Sample size is due to no response from respondent for certain Questions
Table 16

70
Chi-square test value:
Value df p-value
Pearson Chi-Square 136.700a 9 .000
Table 16.1
Interpretation :Since p-value for the chi-square is less than that of 0.05 it should
reject null hypothesis and conclude that age is associated with the size of the
investment with respect to shares. The higher absolute values of the adjusted residual
imply maximum deviation from expected and that particular category shows
significant contribution for deviation. People in the age group of 31 to 50 yrs invest
more in Shares, but invest up to 25000 only.
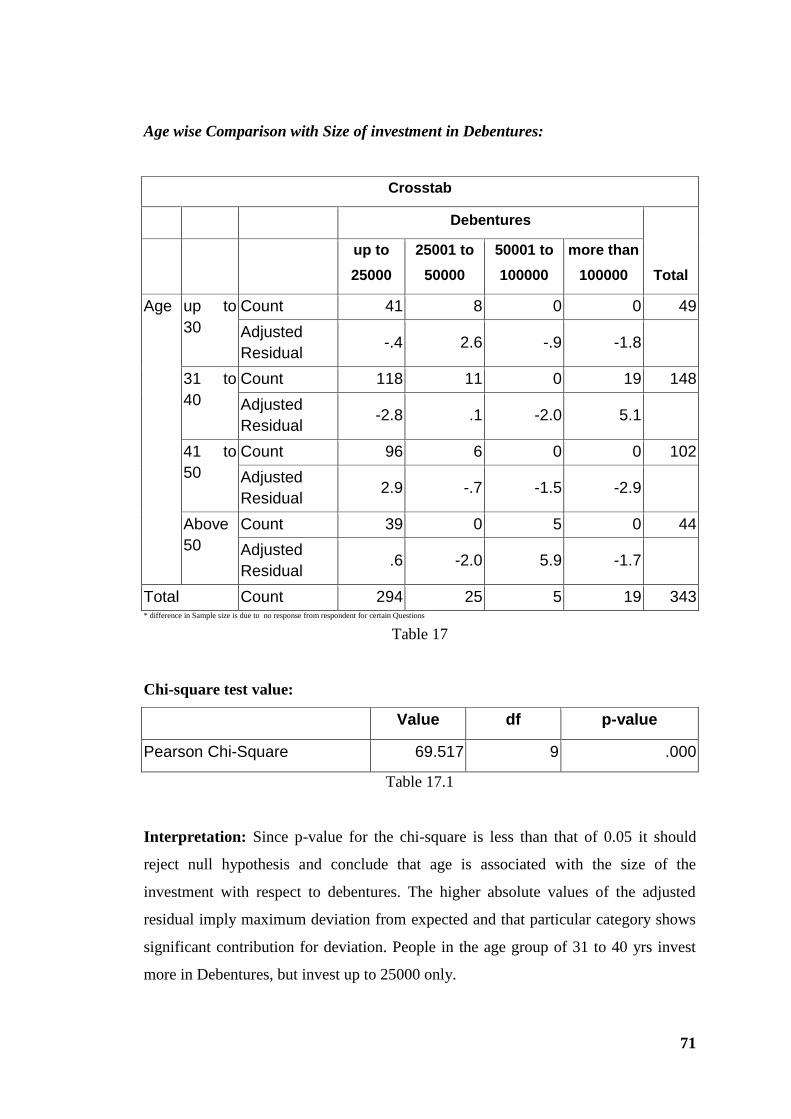
71
Age wise Comparison with Size of investment in Debentures:
Crosstab
Debentures
Total
up to
25000
25001 to
50000
50001 to
100000
more than
100000
Age up to
30
Count 41 8 0 0 49
Adjusted
Residual -.4 2.6 -.9 -1.8
31 to
40
Count 118 11 0 19 148
Adjusted
Residual -2.8 .1 -2.0 5.1
41 to
50
Count 96 6 0 0 102
Adjusted
Residual 2.9 -.7 -1.5 -2.9
Above
50
Count 39 0 5 0 44
Adjusted
Residual .6 -2.0 5.9 -1.7
Total Count 294 25 5 19 343 * difference in Sample size is due to no response from respondent for certain Questions
Table 17
Chi-square test value:
Value df p-value
Pearson Chi-Square 69.517 9 .000
Table 17.1
Interpretation: Since p-value for the chi-square is less than that of 0.05 it should
reject null hypothesis and conclude that age is associated with the size of the
investment with respect to debentures. The higher absolute values of the adjusted
residual imply maximum deviation from expected and that particular category shows
significant contribution for deviation. People in the age group of 31 to 40 yrs invest
more in Debentures, but invest up to 25000 only.
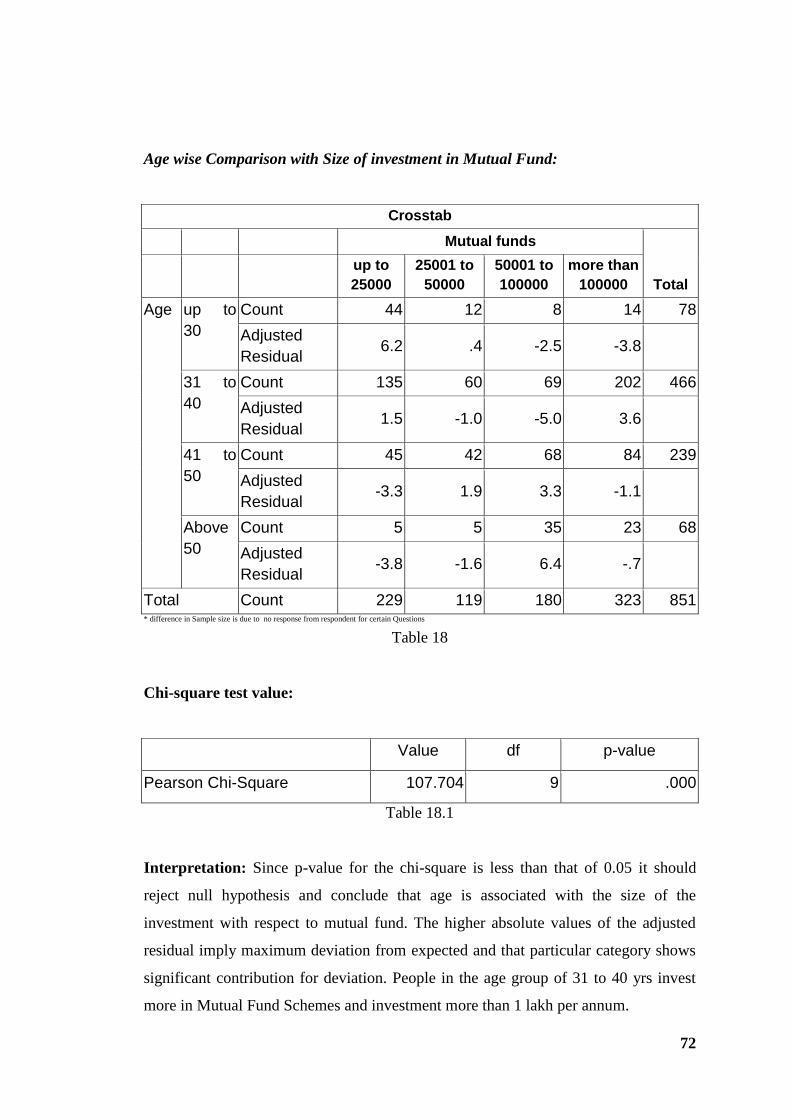
72
Age wise Comparison with Size of investment in Mutual Fund:
Crosstab
Mutual funds
Total up to
25000
25001 to
50000
50001 to
100000
more than
100000
Age up to
30
Count 44 12 8 14 78
Adjusted
Residual 6.2 .4 -2.5 -3.8
31 to
40
Count 135 60 69 202 466
Adjusted
Residual 1.5 -1.0 -5.0 3.6
41 to
50
Count 45 42 68 84 239
Adjusted
Residual -3.3 1.9 3.3 -1.1
Above
50
Count 5 5 35 23 68
Adjusted
Residual -3.8 -1.6 6.4 -.7
Total Count 229 119 180 323 851 * difference in Sample size is due to no response from respondent for certain Questions
Table 18
Chi-square test value:
Value df p-value
Pearson Chi-Square 107.704 9 .000
Table 18.1
Interpretation: Since p-value for the chi-square is less than that of 0.05 it should
reject null hypothesis and conclude that age is associated with the size of the
investment with respect to mutual fund. The higher absolute values of the adjusted
residual imply maximum deviation from expected and that particular category shows
significant contribution for deviation. People in the age group of 31 to 40 yrs invest
more in Mutual Fund Schemes and investment more than 1 lakh per annum.
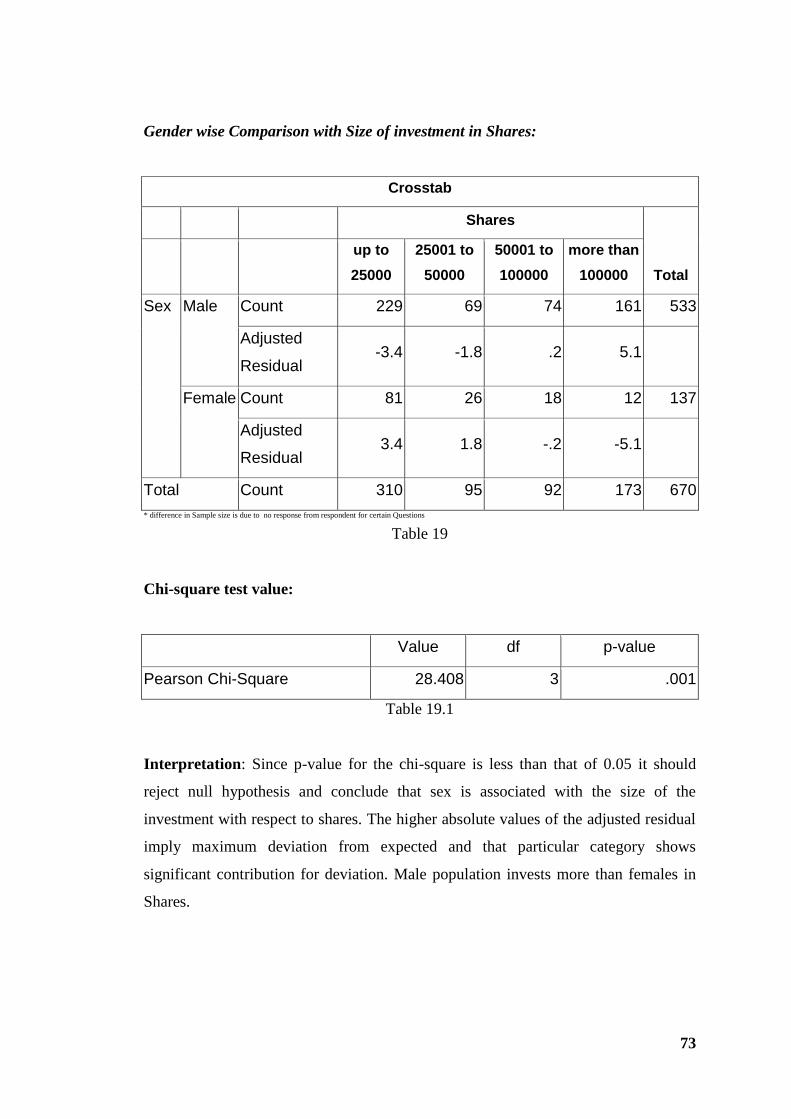
73
Gender wise Comparison with Size of investment in Shares:
Crosstab
Shares
Total
up to
25000
25001 to
50000
50001 to
100000
more than
100000
Sex Male Count 229 69 74 161 533
Adjusted
Residual -3.4 -1.8 .2 5.1
Female Count 81 26 18 12 137
Adjusted
Residual 3.4 1.8 -.2 -5.1
Total Count 310 95 92 173 670
* difference in Sample size is due to no response from respondent for certain Questions
Table 19
Chi-square test value:
Value df p-value
Pearson Chi-Square 28.408 3 .001
Table 19.1
Interpretation: Since p-value for the chi-square is less than that of 0.05 it should
reject null hypothesis and conclude that sex is associated with the size of the
investment with respect to shares. The higher absolute values of the adjusted residual
imply maximum deviation from expected and that particular category shows
significant contribution for deviation. Male population invests more than females in
Shares.
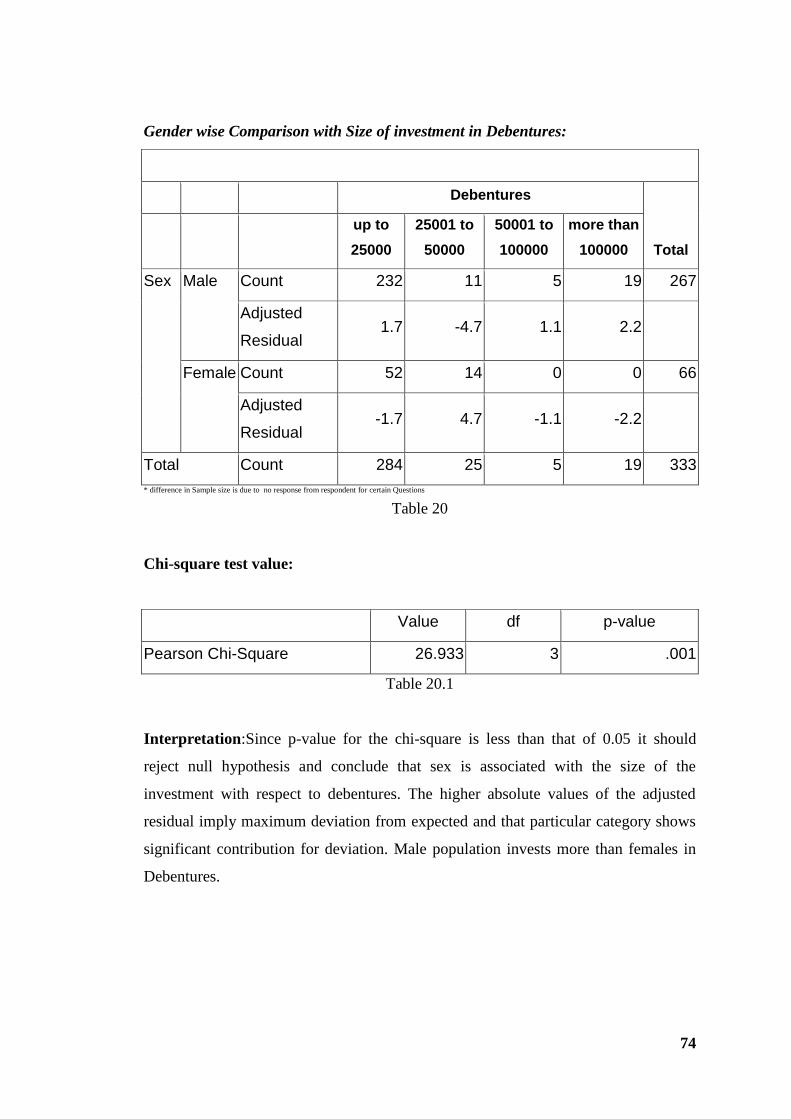
74
Gender wise Comparison with Size of investment in Debentures:
Debentures
Total
up to
25000
25001 to
50000
50001 to
100000
more than
100000
Sex Male Count 232 11 5 19 267
Adjusted
Residual 1.7 -4.7 1.1 2.2
Female Count 52 14 0 0 66
Adjusted
Residual -1.7 4.7 -1.1 -2.2
Total Count 284 25 5 19 333
* difference in Sample size is due to no response from respondent for certain Questions
Table 20
Chi-square test value:
Value df p-value
Pearson Chi-Square 26.933 3 .001
Table 20.1
Interpretation:Since p-value for the chi-square is less than that of 0.05 it should
reject null hypothesis and conclude that sex is associated with the size of the
investment with respect to debentures. The higher absolute values of the adjusted
residual imply maximum deviation from expected and that particular category shows
significant contribution for deviation. Male population invests more than females in
Debentures.
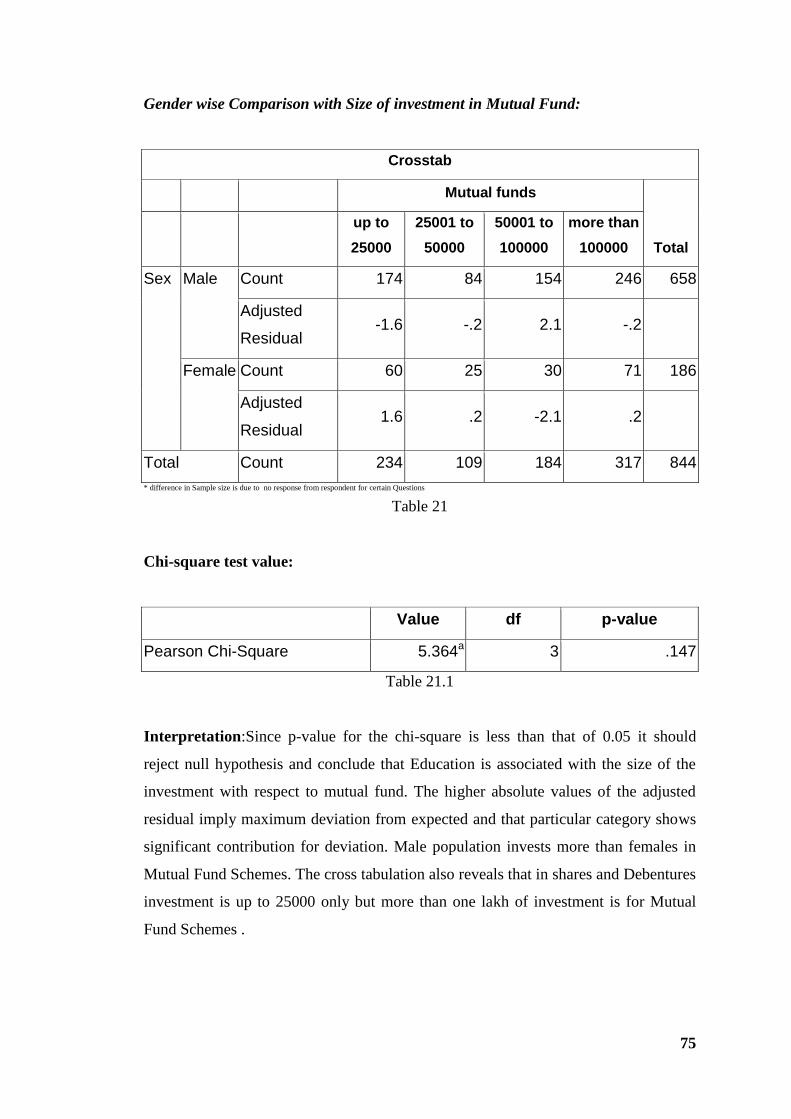
75
Gender wise Comparison with Size of investment in Mutual Fund:
Crosstab
Mutual funds
Total
up to
25000
25001 to
50000
50001 to
100000
more than
100000
Sex Male Count 174 84 154 246 658
Adjusted
Residual -1.6 -.2 2.1 -.2
Female Count 60 25 30 71 186
Adjusted
Residual 1.6 .2 -2.1 .2
Total Count 234 109 184 317 844
* difference in Sample size is due to no response from respondent for certain Questions
Table 21
Chi-square test value:
Value df p-value
Pearson Chi-Square 5.364a 3 .147
Table 21.1
Interpretation:Since p-value for the chi-square is less than that of 0.05 it should
reject null hypothesis and conclude that Education is associated with the size of the
investment with respect to mutual fund. The higher absolute values of the adjusted
residual imply maximum deviation from expected and that particular category shows
significant contribution for deviation. Male population invests more than females in
Mutual Fund Schemes. The cross tabulation also reveals that in shares and Debentures
investment is up to 25000 only but more than one lakh of investment is for Mutual
Fund Schemes .
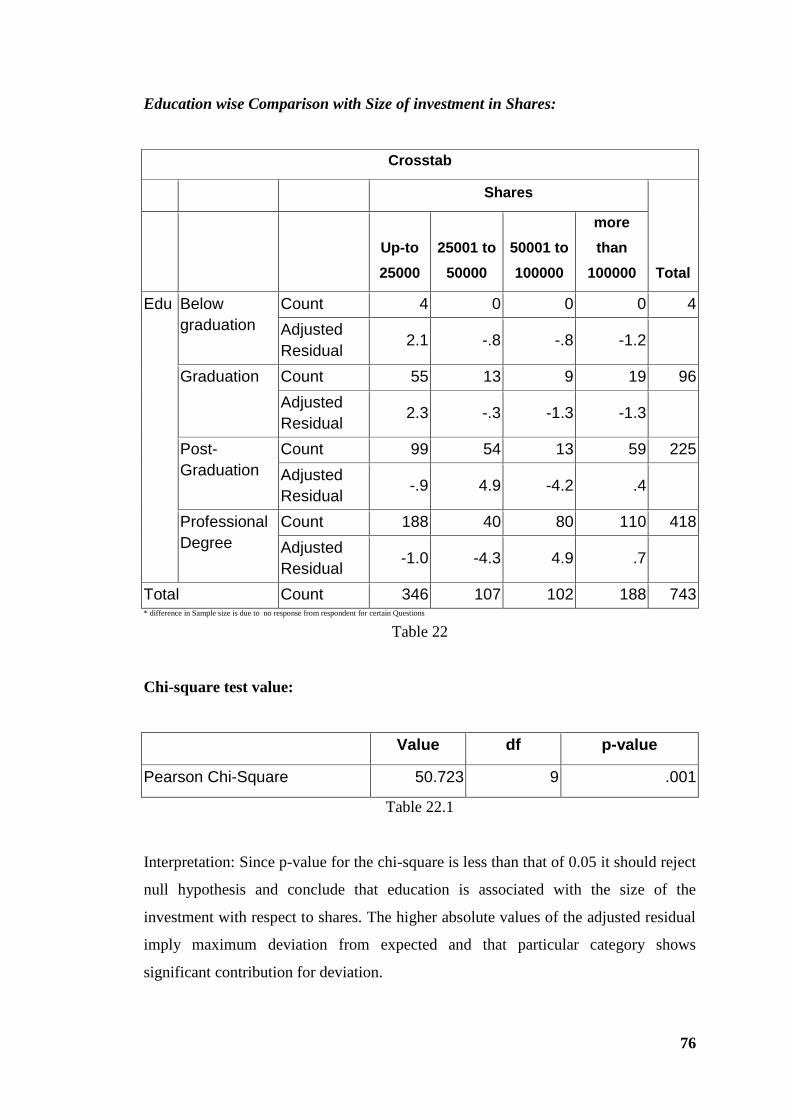
76
Education wise Comparison with Size of investment in Shares:
Crosstab
Shares
Total
Up-to
25000
25001 to
50000
50001 to
100000
more
than
100000
Edu Below
graduation
Count 4 0 0 0 4
Adjusted
Residual 2.1 -.8 -.8 -1.2
Graduation Count 55 13 9 19 96
Adjusted
Residual 2.3 -.3 -1.3 -1.3
Post-
Graduation
Count 99 54 13 59 225
Adjusted
Residual -.9 4.9 -4.2 .4
Professional
Degree
Count 188 40 80 110 418
Adjusted
Residual -1.0 -4.3 4.9 .7
Total Count 346 107 102 188 743 * difference in Sample size is due to no response from respondent for certain Questions
Table 22
Chi-square test value:
Value df p-value
Pearson Chi-Square 50.723 9 .001
Table 22.1
Interpretation: Since p-value for the chi-square is less than that of 0.05 it should reject
null hypothesis and conclude that education is associated with the size of the
investment with respect to shares. The higher absolute values of the adjusted residual
imply maximum deviation from expected and that particular category shows
significant contribution for deviation.
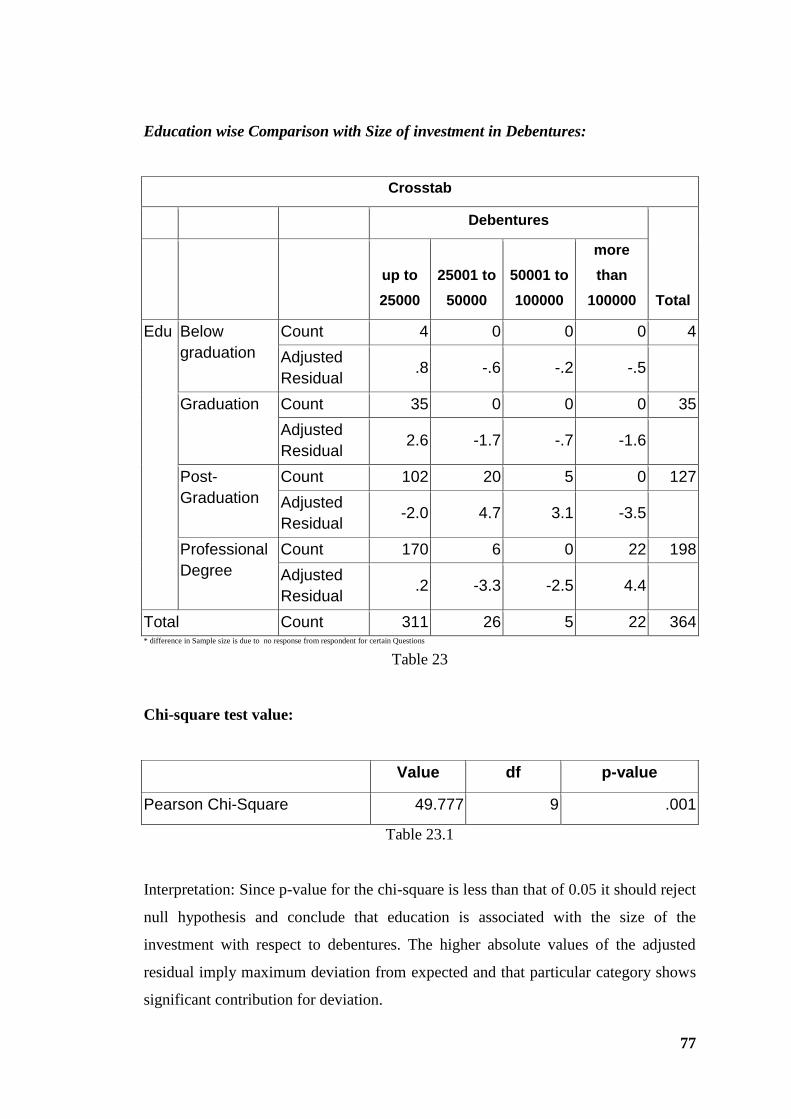
77
Education wise Comparison with Size of investment in Debentures:
Crosstab
Debentures
Total
up to
25000
25001 to
50000
50001 to
100000
more
than
100000
Edu Below
graduation
Count 4 0 0 0 4
Adjusted
Residual .8 -.6 -.2 -.5
Graduation Count 35 0 0 0 35
Adjusted
Residual 2.6 -1.7 -.7 -1.6
Post-
Graduation
Count 102 20 5 0 127
Adjusted
Residual -2.0 4.7 3.1 -3.5
Professional
Degree
Count 170 6 0 22 198
Adjusted
Residual .2 -3.3 -2.5 4.4
Total Count 311 26 5 22 364 * difference in Sample size is due to no response from respondent for certain Questions
Table 23
Chi-square test value:
Value df p-value
Pearson Chi-Square 49.777 9 .001
Table 23.1
Interpretation: Since p-value for the chi-square is less than that of 0.05 it should reject
null hypothesis and conclude that education is associated with the size of the
investment with respect to debentures. The higher absolute values of the adjusted
residual imply maximum deviation from expected and that particular category shows
significant contribution for deviation.
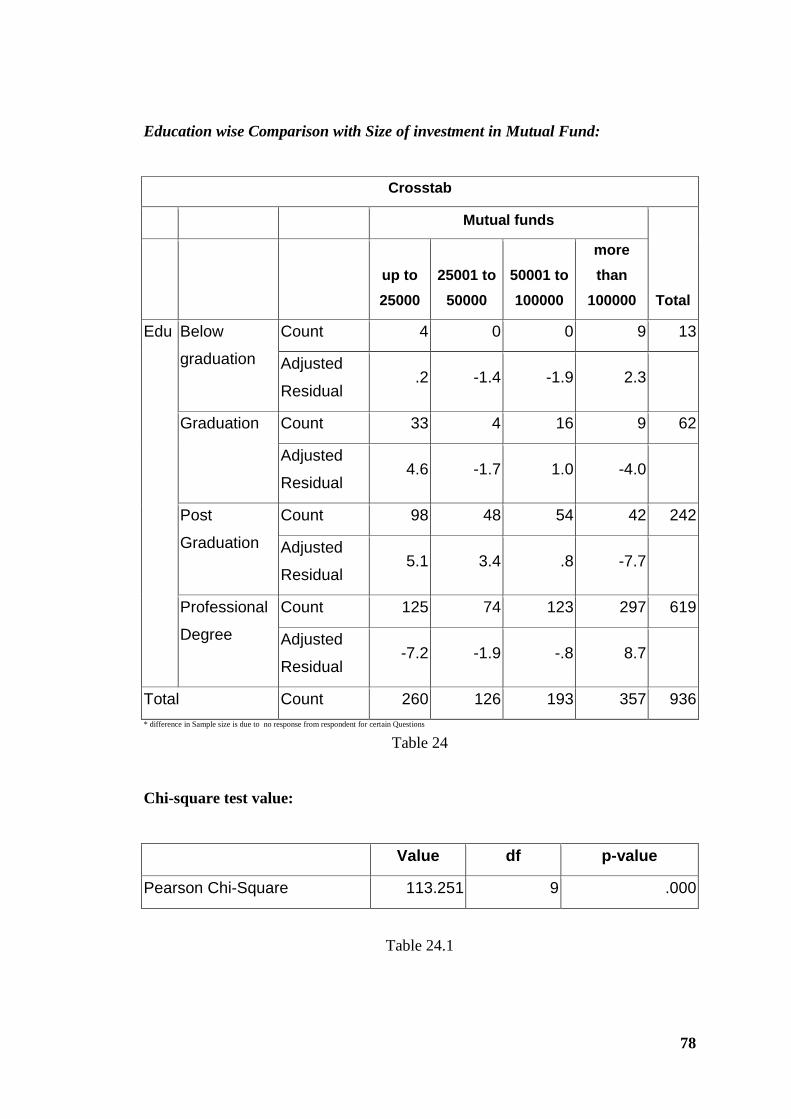
78
Education wise Comparison with Size of investment in Mutual Fund:
Crosstab
Mutual funds
Total
up to
25000
25001 to
50000
50001 to
100000
more
than
100000
Edu Below
graduation
Count 4 0 0 9 13
Adjusted
Residual .2 -1.4 -1.9 2.3
Graduation Count 33 4 16 9 62
Adjusted
Residual 4.6 -1.7 1.0 -4.0
Post
Graduation
Count 98 48 54 42 242
Adjusted
Residual 5.1 3.4 .8 -7.7
Professional
Degree
Count 125 74 123 297 619
Adjusted
Residual -7.2 -1.9 -.8 8.7
Total Count 260 126 193 357 936
* difference in Sample size is due to no response from respondent for certain Questions
Table 24
Chi-square test value:
Value df p-value
Pearson Chi-Square 113.251 9 .000
Table 24.1

79
Interpretation: Since p-value for the chi-square is less than that of 0.05 it should
reject null hypothesis and conclude that education is associated with the size of the
investment with respect to mutual fund.
The higher absolute values of the adjusted residual imply maximum deviation from
expected and that particular category shows significant contribution for deviation.
It May conclude that people with professional degrees and post graduation degrees
invest more in Equity Capital market Instruments while investment in shares and
debentures is maximum up to twenty five thousand Rupees while in Mutual Fund
Schemes investment is up to one lakh rupees.
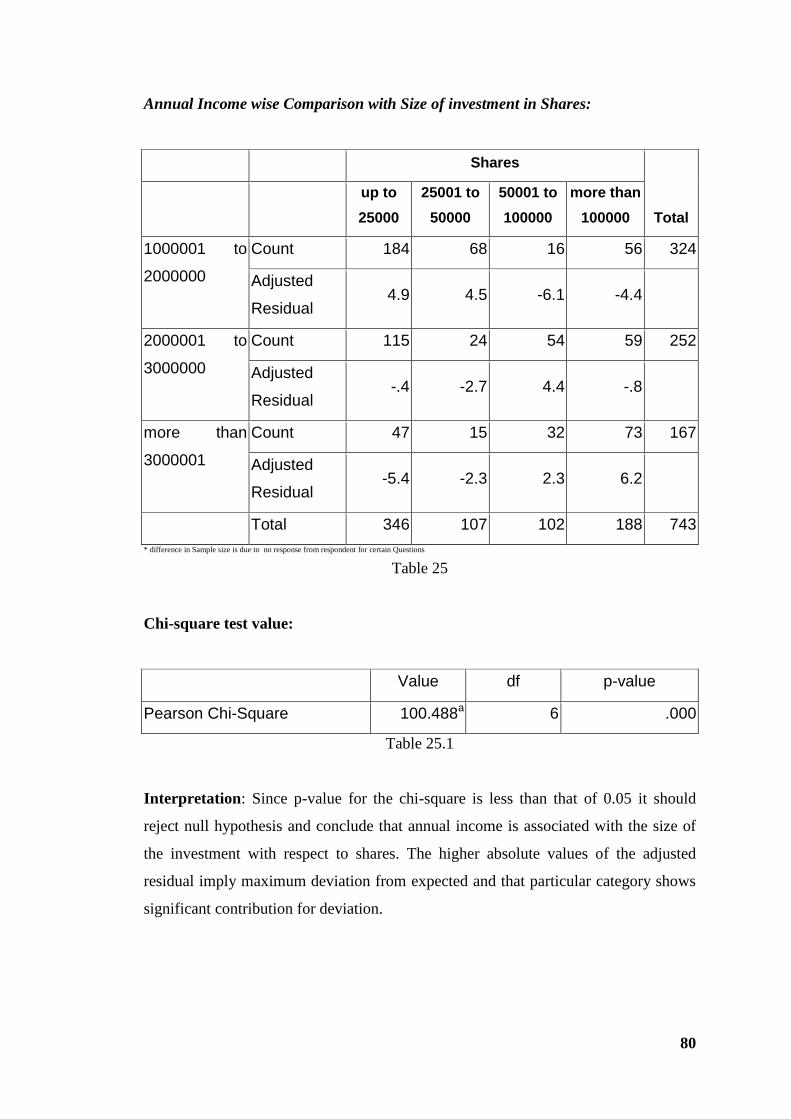
80
Annual Income wise Comparison with Size of investment in Shares:
Shares
Total
up to
25000
25001 to
50000
50001 to
100000
more than
100000
1000001 to
2000000
Count 184 68 16 56 324
Adjusted
Residual 4.9 4.5 -6.1 -4.4
2000001 to
3000000
Count 115 24 54 59 252
Adjusted
Residual -.4 -2.7 4.4 -.8
more than
3000001
Count 47 15 32 73 167
Adjusted
Residual -5.4 -2.3 2.3 6.2
Total 346 107 102 188 743
* difference in Sample size is due to no response from respondent for certain Questions
Table 25
Chi-square test value:
Value df p-value
Pearson Chi-Square 100.488a 6 .000
Table 25.1
Interpretation: Since p-value for the chi-square is less than that of 0.05 it should
reject null hypothesis and conclude that annual income is associated with the size of
the investment with respect to shares. The higher absolute values of the adjusted
residual imply maximum deviation from expected and that particular category shows
significant contribution for deviation.
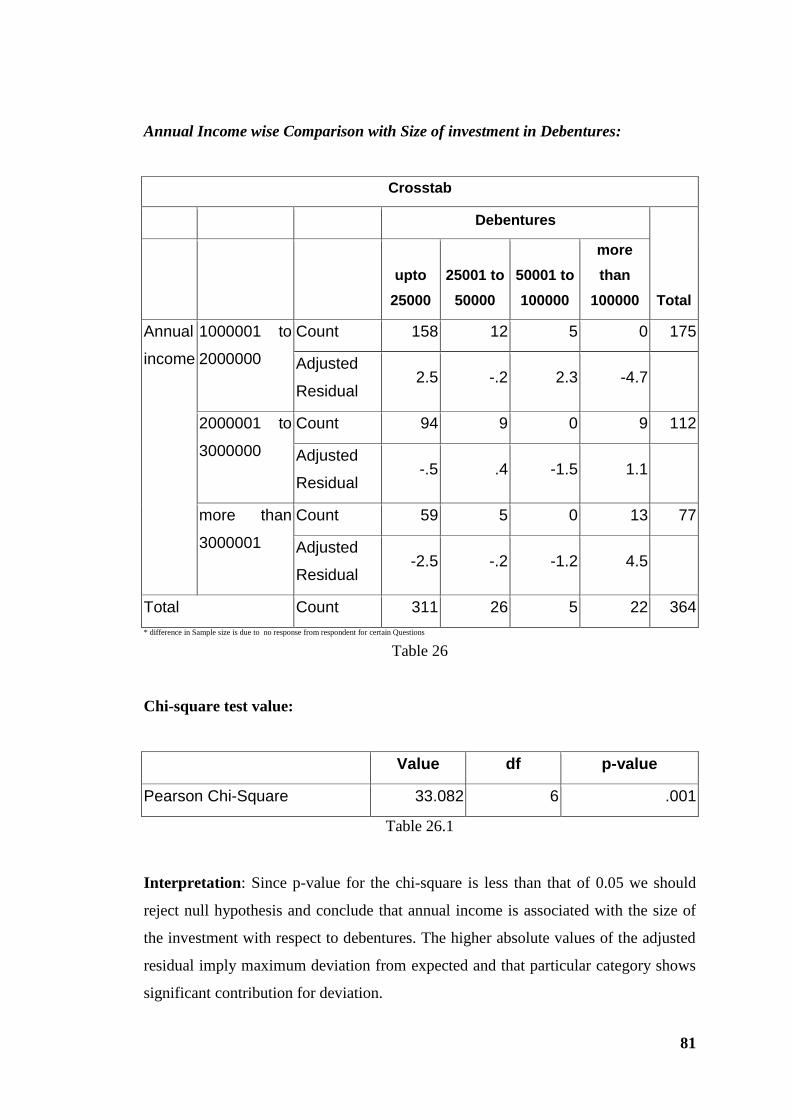
81
Annual Income wise Comparison with Size of investment in Debentures:
Crosstab
Debentures
Total
upto
25000
25001 to
50000
50001 to
100000
more
than
100000
Annual
income
1000001 to
2000000
Count 158 12 5 0 175
Adjusted
Residual 2.5 -.2 2.3 -4.7
2000001 to
3000000
Count 94 9 0 9 112
Adjusted
Residual -.5 .4 -1.5 1.1
more than
3000001
Count 59 5 0 13 77
Adjusted
Residual -2.5 -.2 -1.2 4.5
Total Count 311 26 5 22 364
* difference in Sample size is due to no response from respondent for certain Questions
Table 26
Chi-square test value:
Value df p-value
Pearson Chi-Square 33.082 6 .001
Table 26.1
Interpretation: Since p-value for the chi-square is less than that of 0.05 we should
reject null hypothesis and conclude that annual income is associated with the size of
the investment with respect to debentures. The higher absolute values of the adjusted
residual imply maximum deviation from expected and that particular category shows
significant contribution for deviation.
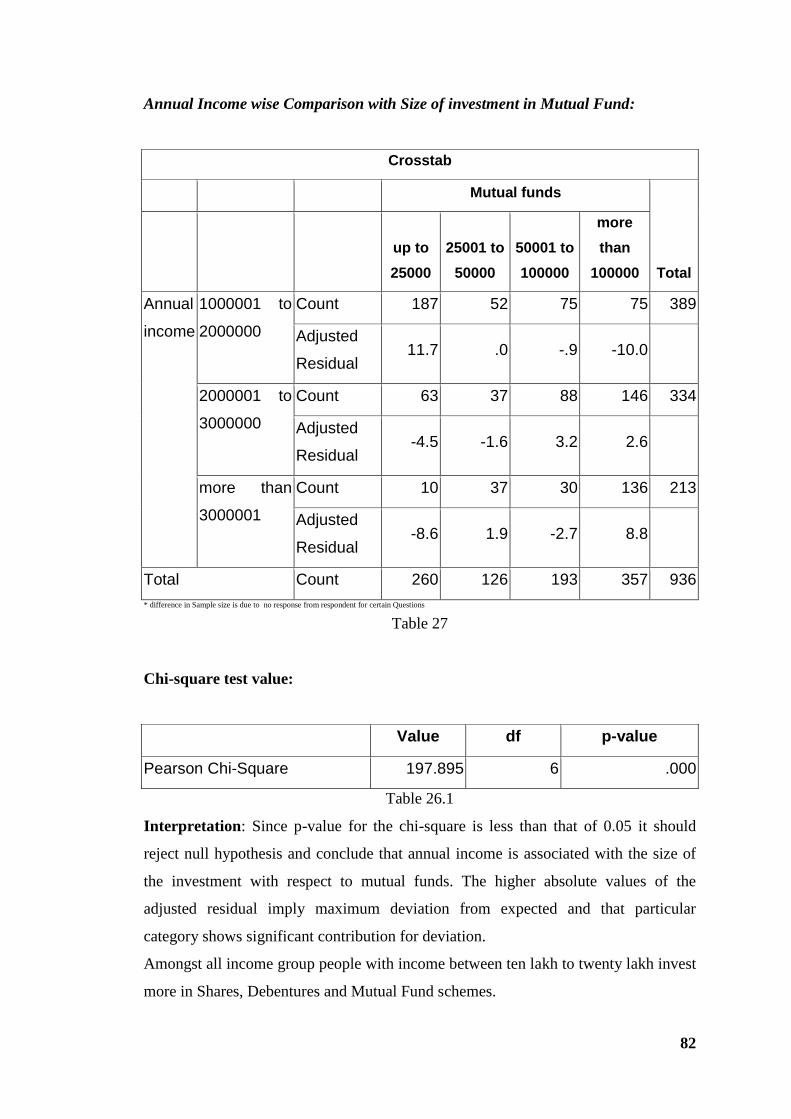
82
Annual Income wise Comparison with Size of investment in Mutual Fund:
Crosstab
Mutual funds
Total
up to
25000
25001 to
50000
50001 to
100000
more
than
100000
Annual
income
1000001 to
2000000
Count 187 52 75 75 389
Adjusted
Residual 11.7 .0 -.9 -10.0
2000001 to
3000000
Count 63 37 88 146 334
Adjusted
Residual -4.5 -1.6 3.2 2.6
more than
3000001
Count 10 37 30 136 213
Adjusted
Residual -8.6 1.9 -2.7 8.8
Total Count 260 126 193 357 936
* difference in Sample size is due to no response from respondent for certain Questions
Table 27
Chi-square test value:
Value df p-value
Pearson Chi-Square 197.895 6 .000
Table 26.1
Interpretation: Since p-value for the chi-square is less than that of 0.05 it should
reject null hypothesis and conclude that annual income is associated with the size of
the investment with respect to mutual funds. The higher absolute values of the
adjusted residual imply maximum deviation from expected and that particular
category shows significant contribution for deviation.
Amongst all income group people with income between ten lakh to twenty lakh invest
more in Shares, Debentures and Mutual Fund schemes.

83
Influence of investment on sartorial diversification of Shares and Mutual Fund
Schemes
To find out the influence on Investors by sartorial Diversification in Mutual Fund
Schemes, it formulates the fifth hypothesis as:
H06: There is no significant difference in investment by High Income Group
individual investor on level of diversification of Mutual Fund Schemes and
Shares.
H16: There is significant difference in investment by High Income Group individual
investor on level of diversification of Mutual Fund Schemes and Shares.
It considers all combination as an independent entity since all combinations are
important from the point of view of investor. The analysis is carried out in two
phases in the first phase it considered all combination irrespective of number of
observation large or small but in second phase it considers only those combinations in
which it has more than 15 observations.
Distribution of mutual fund schemes preferred for investment by investor:
Variable Code Variable Name
1 Growth scheme
2 Income Scheme
3 Balanced Scheme
4 Sector wise Scheme
5 Tax saving scheme
6 Index Fund
7 Special Investment plan
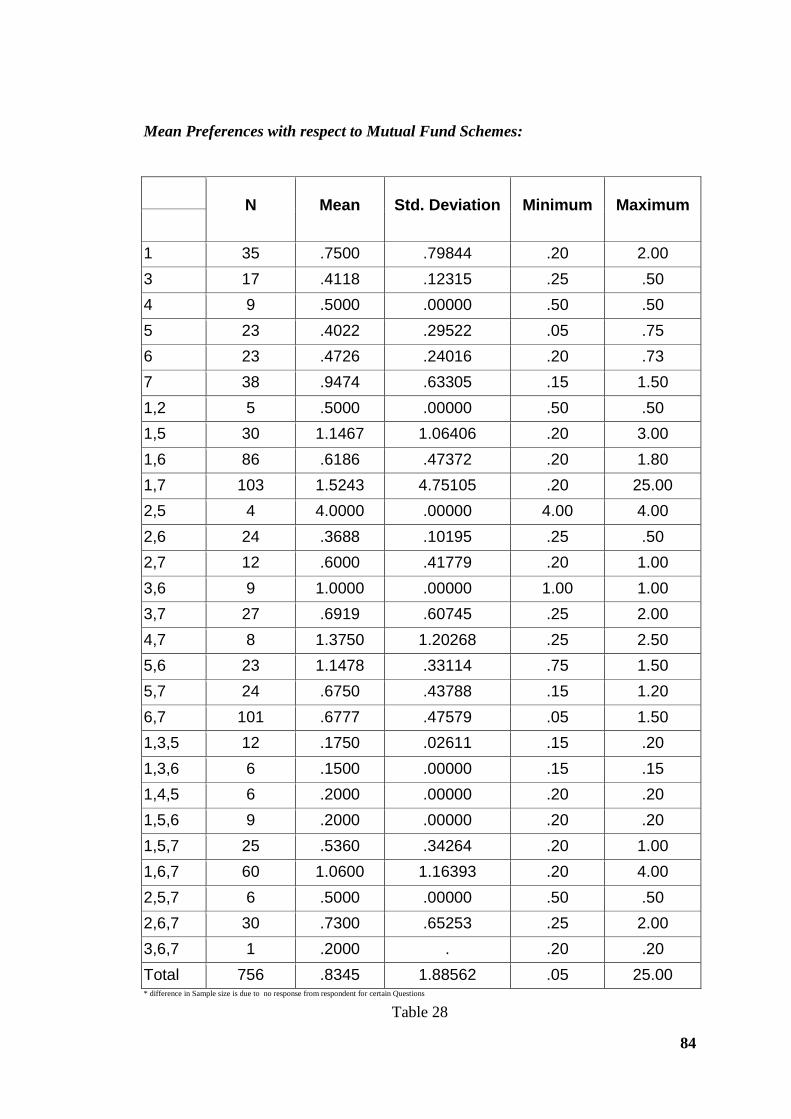
84
Mean Preferences with respect to Mutual Fund Schemes:
N Mean Std. Deviation Minimum Maximum
1 35 .7500 .79844 .20 2.00
3 17 .4118 .12315 .25 .50
4 9 .5000 .00000 .50 .50
5 23 .4022 .29522 .05 .75
6 23 .4726 .24016 .20 .73
7 38 .9474 .63305 .15 1.50
1,2 5 .5000 .00000 .50 .50
1,5 30 1.1467 1.06406 .20 3.00
1,6 86 .6186 .47372 .20 1.80
1,7 103 1.5243 4.75105 .20 25.00
2,5 4 4.0000 .00000 4.00 4.00
2,6 24 .3688 .10195 .25 .50
2,7 12 .6000 .41779 .20 1.00
3,6 9 1.0000 .00000 1.00 1.00
3,7 27 .6919 .60745 .25 2.00
4,7 8 1.3750 1.20268 .25 2.50
5,6 23 1.1478 .33114 .75 1.50
5,7 24 .6750 .43788 .15 1.20
6,7 101 .6777 .47579 .05 1.50
1,3,5 12 .1750 .02611 .15 .20
1,3,6 6 .1500 .00000 .15 .15
1,4,5 6 .2000 .00000 .20 .20
1,5,6 9 .2000 .00000 .20 .20
1,5,7 25 .5360 .34264 .20 1.00
1,6,7 60 1.0600 1.16393 .20 4.00
2,5,7 6 .5000 .00000 .50 .50
2,6,7 30 .7300 .65253 .25 2.00
3,6,7 1 .2000 . .20 .20
Total 756 .8345 1.88562 .05 25.00 * difference in Sample size is due to no response from respondent for certain Questions
Table 28
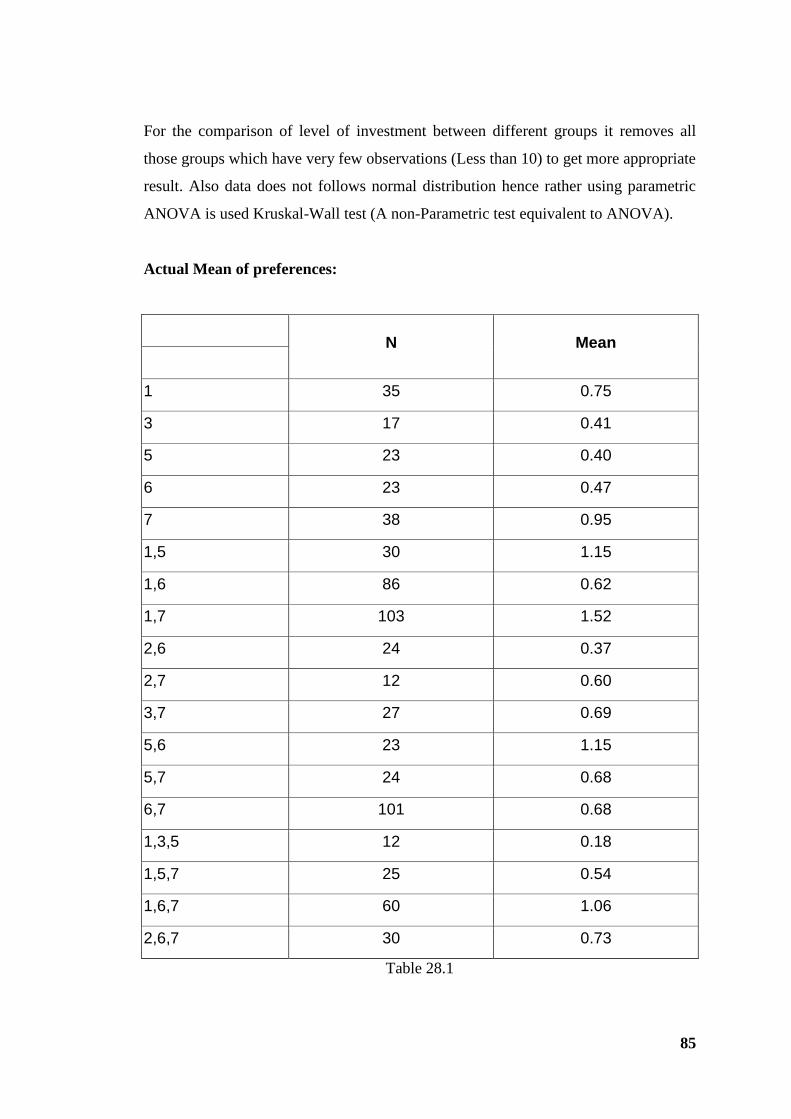
85
For the comparison of level of investment between different groups it removes all
those groups which have very few observations (Less than 10) to get more appropriate
result. Also data does not follows normal distribution hence rather using parametric
ANOVA is used Kruskal-Wall test (A non-Parametric test equivalent to ANOVA).
Actual Mean of preferences:
N Mean
1 35 0.75
3 17 0.41
5 23 0.40
6 23 0.47
7 38 0.95
1,5 30 1.15
1,6 86 0.62
1,7 103 1.52
2,6 24 0.37
2,7 12 0.60
3,7 27 0.69
5,6 23 1.15
5,7 24 0.68
6,7 101 0.68
1,3,5 12 0.18
1,5,7 25 0.54
1,6,7 60 1.06
2,6,7 30 0.73
Table 28.1
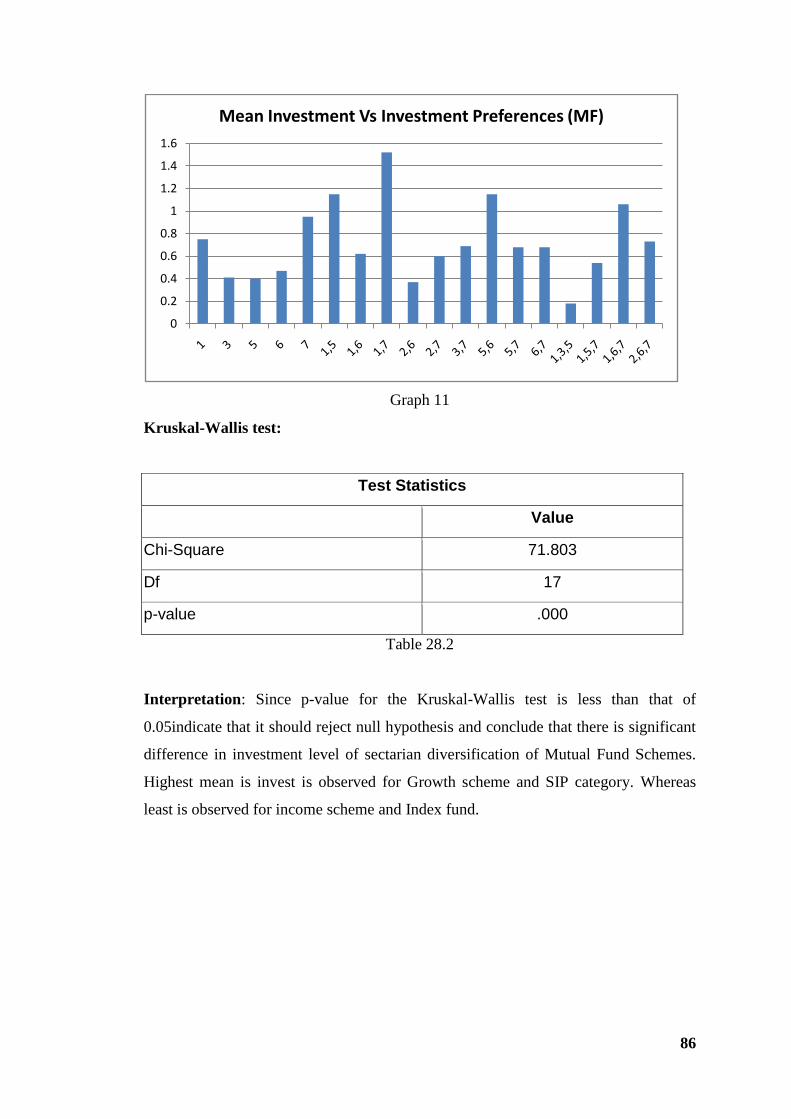
86
Graph 11
Kruskal-Wallis test:
Test Statistics
Value
Chi-Square 71.803
Df 17
p-value .000
Table 28.2
Interpretation: Since p-value for the Kruskal-Wallis test is less than that of
0.05indicate that it should reject null hypothesis and conclude that there is significant
difference in investment level of sectarian diversification of Mutual Fund Schemes.
Highest mean is invest is observed for Growth scheme and SIP category. Whereas
least is observed for income scheme and Index fund.
0
0.2
0.4
0.6
0.8
1
1.2
1.4
1.6
Mean Investment Vs Investment Preferences (MF)
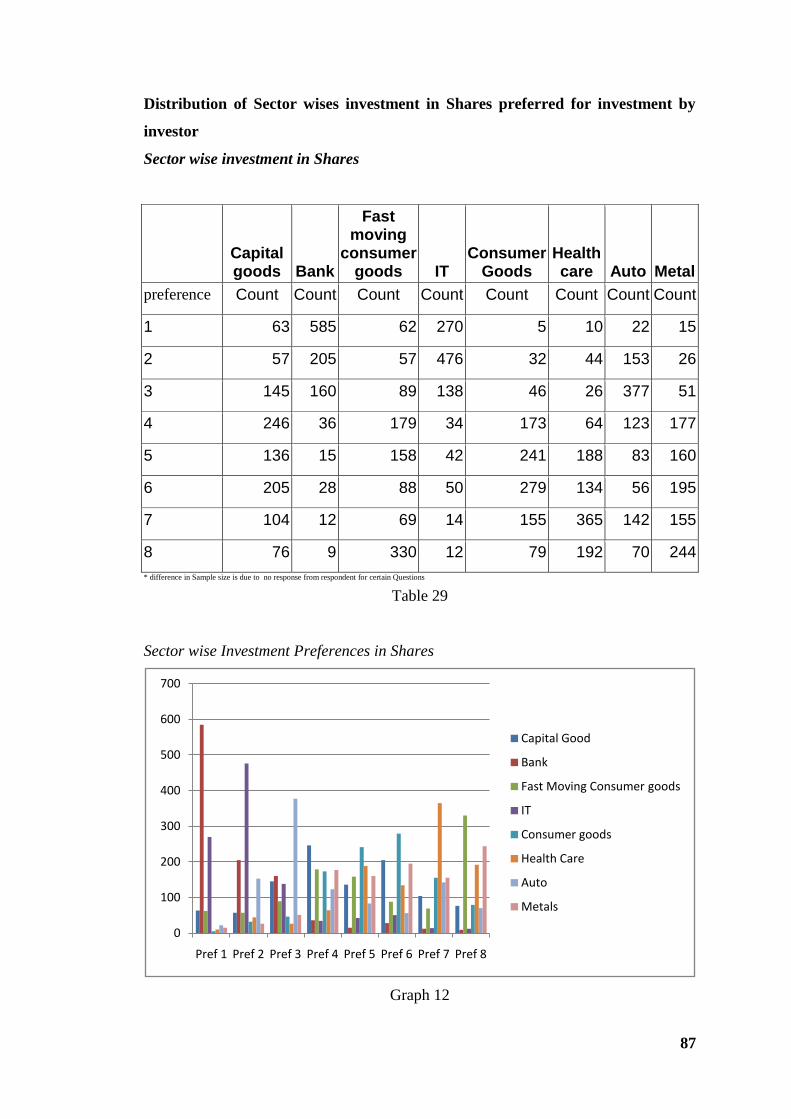
87
Distribution of Sector wises investment in Shares preferred for investment by
investor
Sector wise investment in Shares
Capital goods Bank
Fast moving
consumer goods IT
Consumer Goods
Health care Auto Metal
preference Count Count Count Count Count Count Count Count
1 63 585 62 270 5 10 22 15
2 57 205 57 476 32 44 153 26
3 145 160 89 138 46 26 377 51
4 246 36 179 34 173 64 123 177
5 136 15 158 42 241 188 83 160
6 205 28 88 50 279 134 56 195
7 104 12 69 14 155 365 142 155
8 76 9 330 12 79 192 70 244
* difference in Sample size is due to no response from respondent for certain Questions
Table 29
Sector wise Investment Preferences in Shares
Graph 12
0
100
200
300
400
500
600
700
Pref 1 Pref 2 Pref 3 Pref 4 Pref 5 Pref 6 Pref 7 Pref 8
Capital Good
Bank
Fast Moving Consumer goods
IT
Consumer goods
Health Care
Auto
Metals
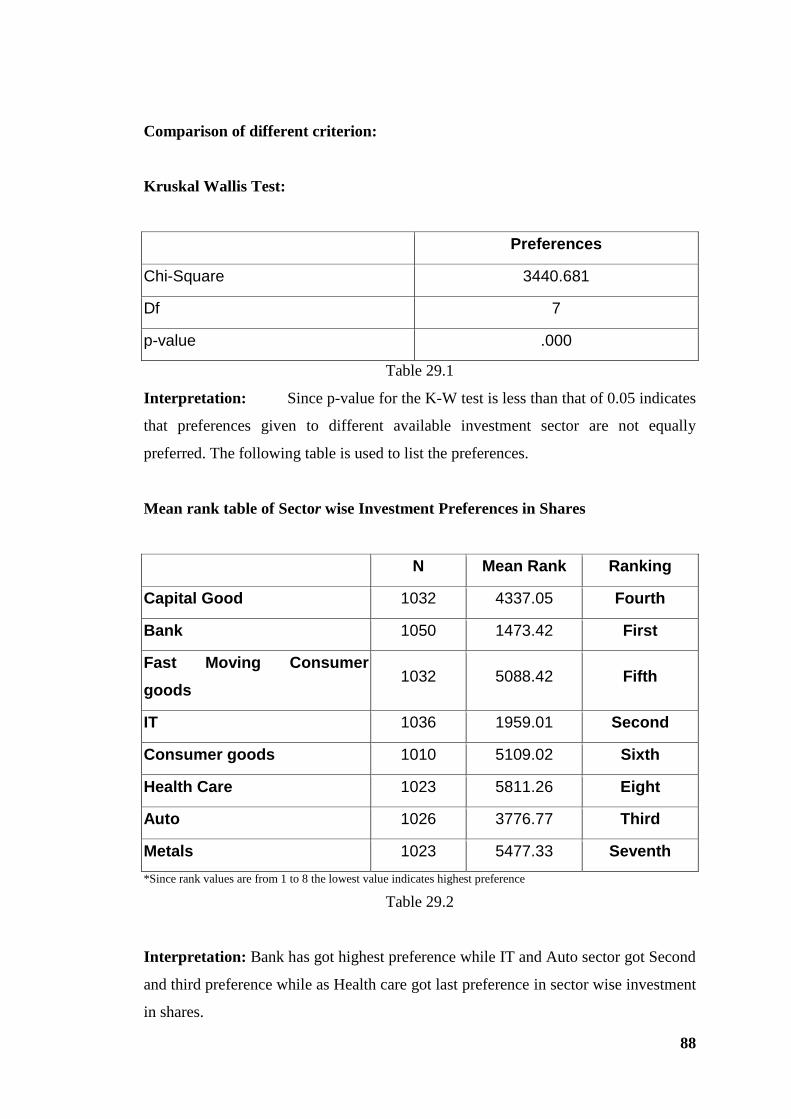
88
Comparison of different criterion:
Kruskal Wallis Test:
Preferences
Chi-Square 3440.681
Df 7
p-value .000
Table 29.1
Interpretation: Since p-value for the K-W test is less than that of 0.05 indicates
that preferences given to different available investment sector are not equally
preferred. The following table is used to list the preferences.
Mean rank table of Sector wise Investment Preferences in Shares
N Mean Rank Ranking
Capital Good 1032 4337.05 Fourth
Bank 1050 1473.42 First
Fast Moving Consumer
goods 1032 5088.42 Fifth
IT 1036 1959.01 Second
Consumer goods 1010 5109.02 Sixth
Health Care 1023 5811.26 Eight
Auto 1026 3776.77 Third
Metals 1023 5477.33 Seventh
*Since rank values are from 1 to 8 the lowest value indicates highest preference
Table 29.2
Interpretation: Bank has got highest preference while IT and Auto sector got Second
and third preference while as Health care got last preference in sector wise investment
in shares.
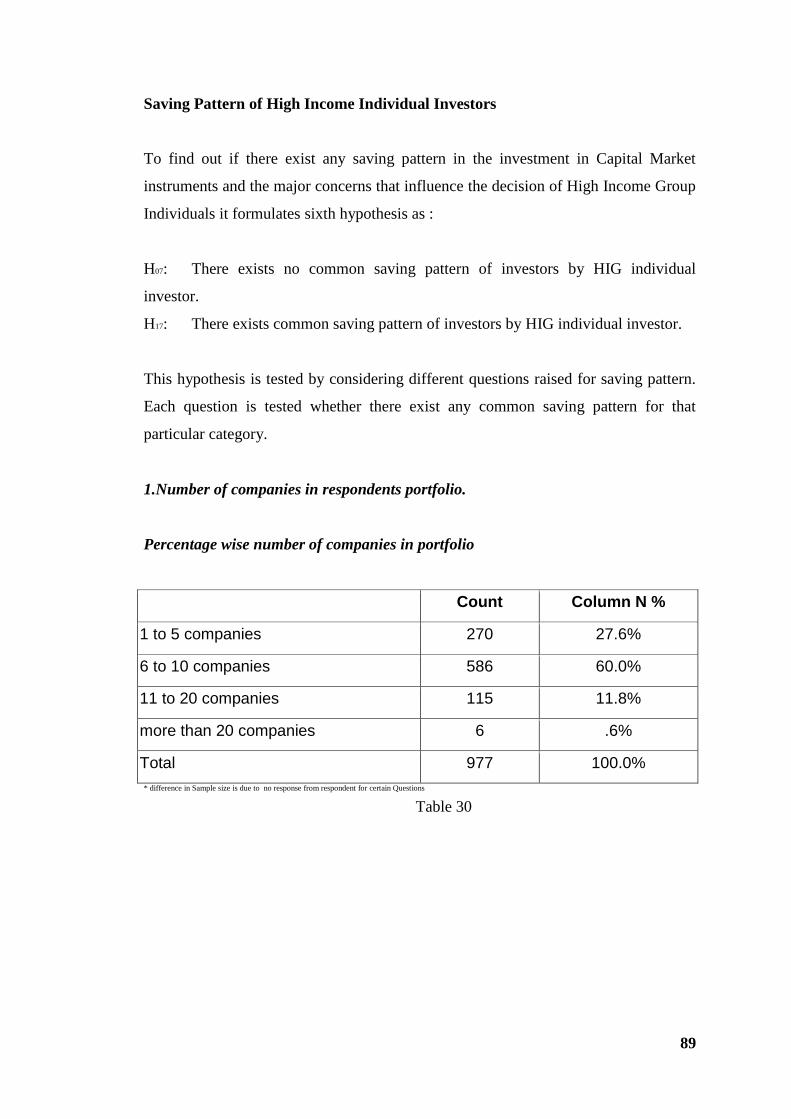
89
Saving Pattern of High Income Individual Investors
To find out if there exist any saving pattern in the investment in Capital Market
instruments and the major concerns that influence the decision of High Income Group
Individuals it formulates sixth hypothesis as :
H07: There exists no common saving pattern of investors by HIG individual
investor.
H17: There exists common saving pattern of investors by HIG individual investor.
This hypothesis is tested by considering different questions raised for saving pattern.
Each question is tested whether there exist any common saving pattern for that
particular category.
1.Number of companies in respondents portfolio.
Percentage wise number of companies in portfolio
Count Column N %
1 to 5 companies 270 27.6%
6 to 10 companies 586 60.0%
11 to 20 companies 115 11.8%
more than 20 companies 6 .6%
Total 977 100.0%
* difference in Sample size is due to no response from respondent for certain Questions
Table 30
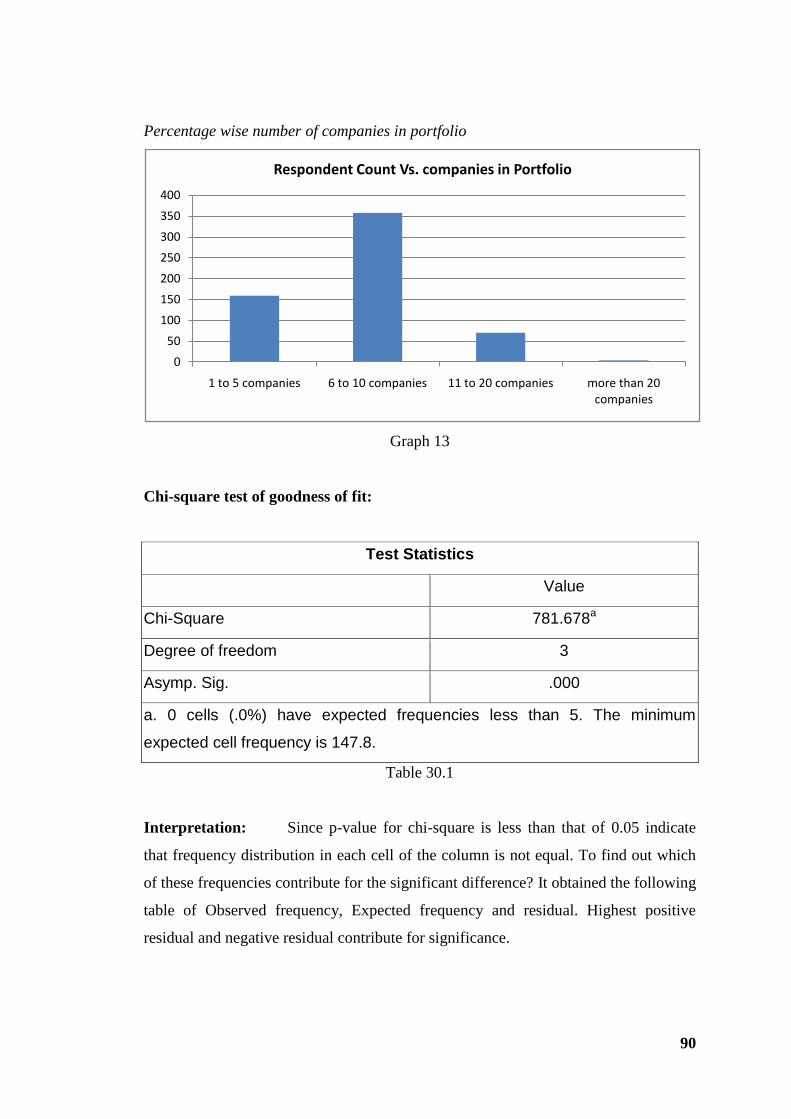
90
Percentage wise number of companies in portfolio
Graph 13
Chi-square test of goodness of fit:
Test Statistics
Value
Chi-Square 781.678a
Degree of freedom 3
Asymp. Sig. .000
a. 0 cells (.0%) have expected frequencies less than 5. The minimum
expected cell frequency is 147.8.
Table 30.1
Interpretation: Since p-value for chi-square is less than that of 0.05 indicate
that frequency distribution in each cell of the column is not equal. To find out which
of these frequencies contribute for the significant difference? It obtained the following
table of Observed frequency, Expected frequency and residual. Highest positive
residual and negative residual contribute for significance.
0
50
100
150
200
250
300
350
400
1 to 5 companies 6 to 10 companies 11 to 20 companies more than 20 companies
Respondent Count Vs. companies in Portfolio
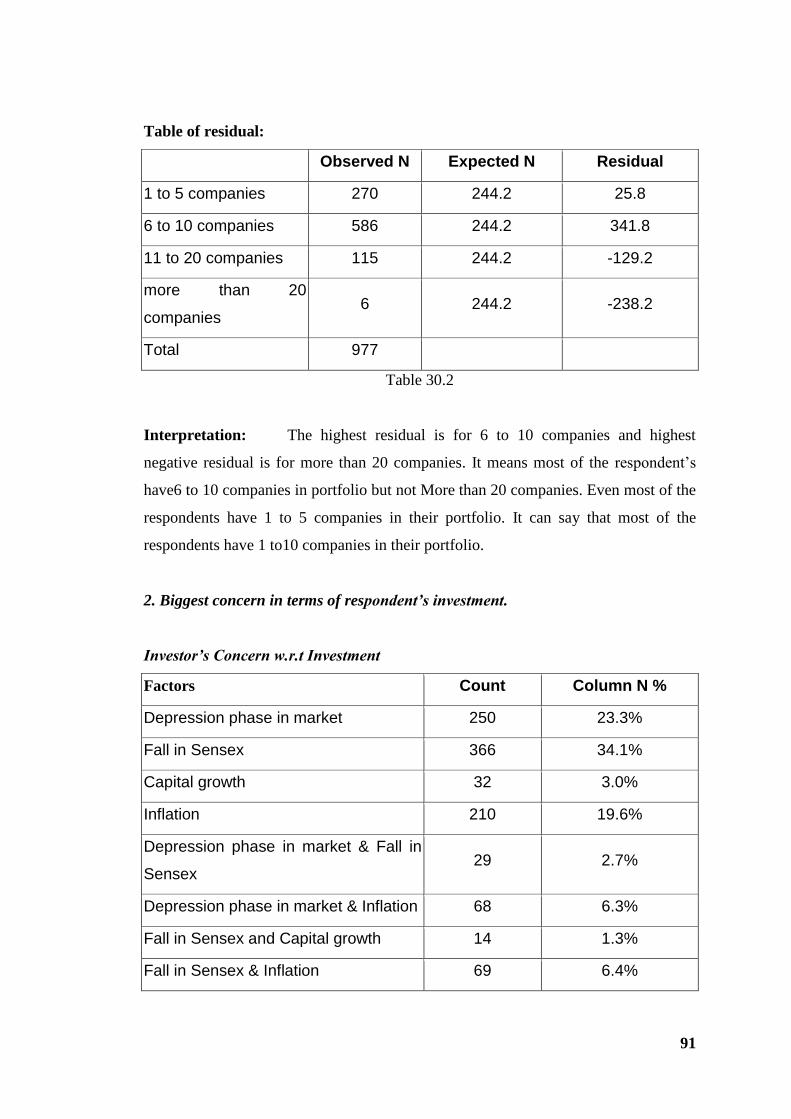
91
Table of residual:
Observed N Expected N Residual
1 to 5 companies 270 244.2 25.8
6 to 10 companies 586 244.2 341.8
11 to 20 companies 115 244.2 -129.2
more than 20
companies 6 244.2 -238.2
Total 977
Table 30.2
Interpretation: The highest residual is for 6 to 10 companies and highest
negative residual is for more than 20 companies. It means most of the respondent‘s
have6 to 10 companies in portfolio but not More than 20 companies. Even most of the
respondents have 1 to 5 companies in their portfolio. It can say that most of the
respondents have 1 to10 companies in their portfolio.
2. Biggest concern in terms of respondent’s investment.
Investor’s Concern w.r.t Investment
Factors Count Column N %
Depression phase in market 250 23.3%
Fall in Sensex 366 34.1%
Capital growth 32 3.0%
Inflation 210 19.6%
Depression phase in market & Fall in
Sensex 29 2.7%
Depression phase in market & Inflation 68 6.3%
Fall in Sensex and Capital growth 14 1.3%
Fall in Sensex & Inflation 69 6.4%
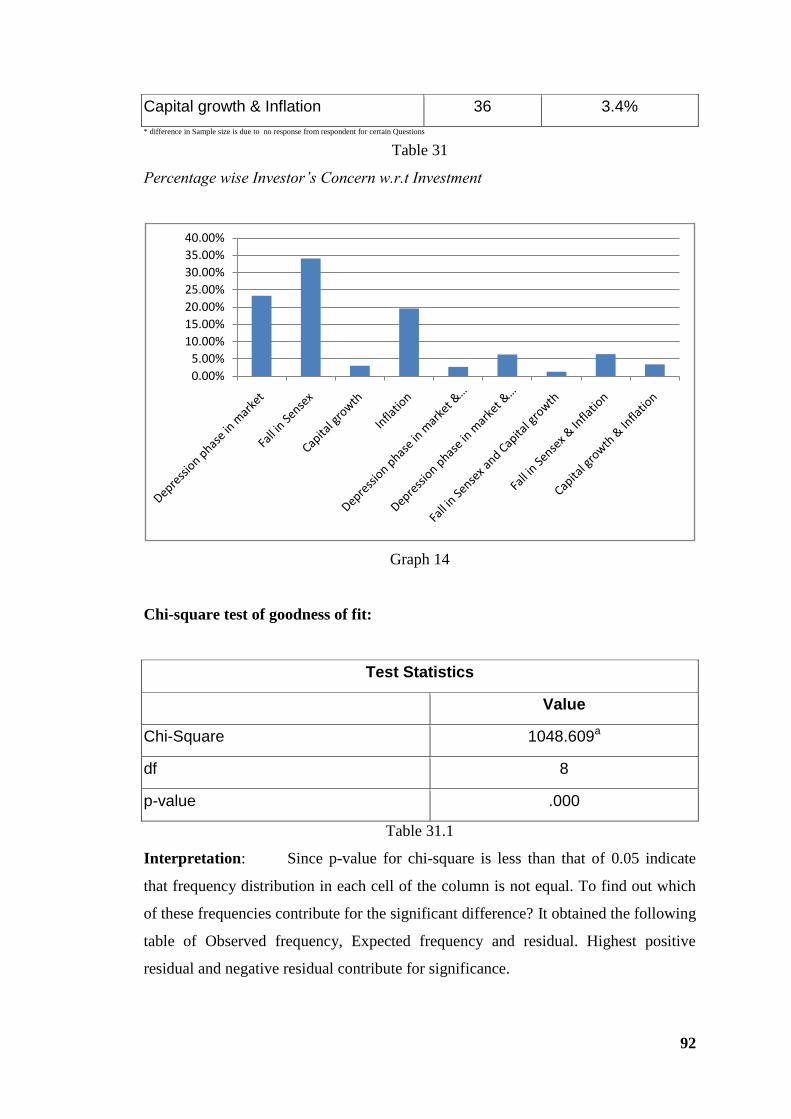
92
Capital growth & Inflation 36 3.4%
* difference in Sample size is due to no response from respondent for certain Questions
Table 31
Percentage wise Investor’s Concern w.r.t Investment
Graph 14
Chi-square test of goodness of fit:
Test Statistics
Value
Chi-Square 1048.609a
df 8
p-value .000
Table 31.1
Interpretation: Since p-value for chi-square is less than that of 0.05 indicate
that frequency distribution in each cell of the column is not equal. To find out which
of these frequencies contribute for the significant difference? It obtained the following
table of Observed frequency, Expected frequency and residual. Highest positive
residual and negative residual contribute for significance.
0.00%
5.00%
10.00%
15.00%
20.00%
25.00%
30.00%
35.00%
40.00%
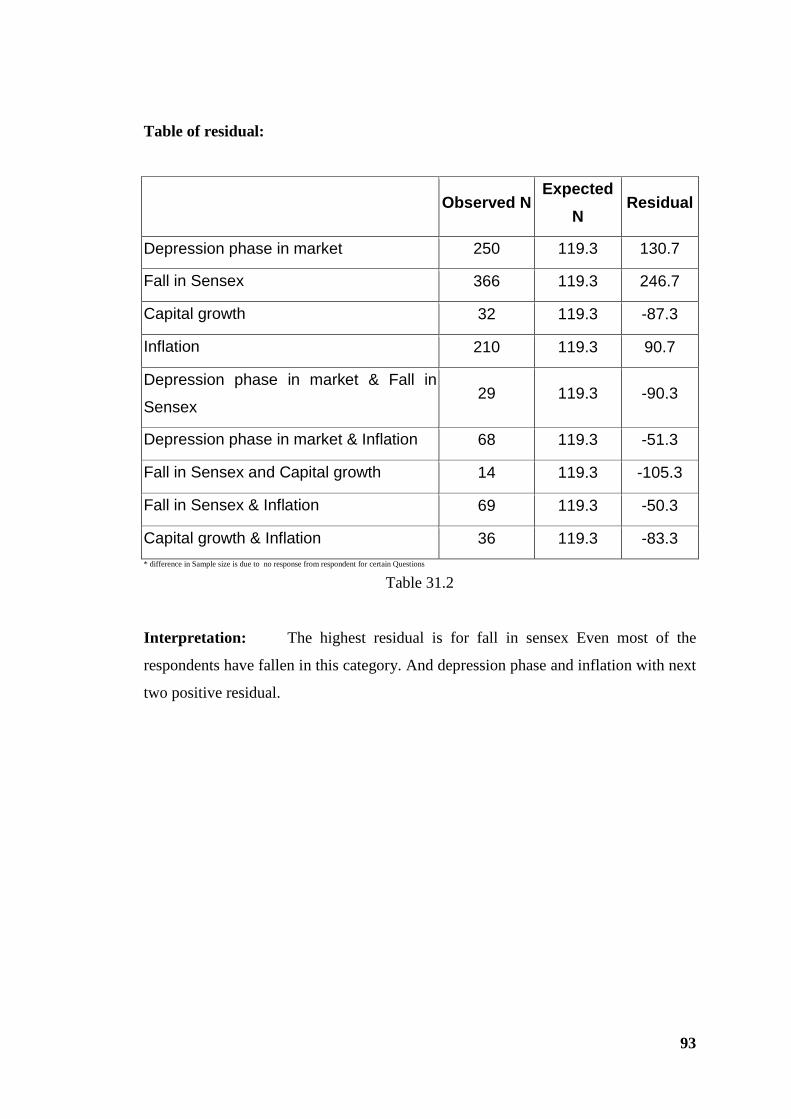
93
Table of residual:
Observed N
Expected
N Residual
Depression phase in market 250 119.3 130.7
Fall in Sensex 366 119.3 246.7
Capital growth 32 119.3 -87.3
Inflation 210 119.3 90.7
Depression phase in market & Fall in
Sensex 29 119.3 -90.3
Depression phase in market & Inflation 68 119.3 -51.3
Fall in Sensex and Capital growth 14 119.3 -105.3
Fall in Sensex & Inflation 69 119.3 -50.3
Capital growth & Inflation 36 119.3 -83.3
* difference in Sample size is due to no response from respondent for certain Questions
Table 31.2
Interpretation: The highest residual is for fall in sensex Even most of the
respondents have fallen in this category. And depression phase and inflation with next
two positive residual.
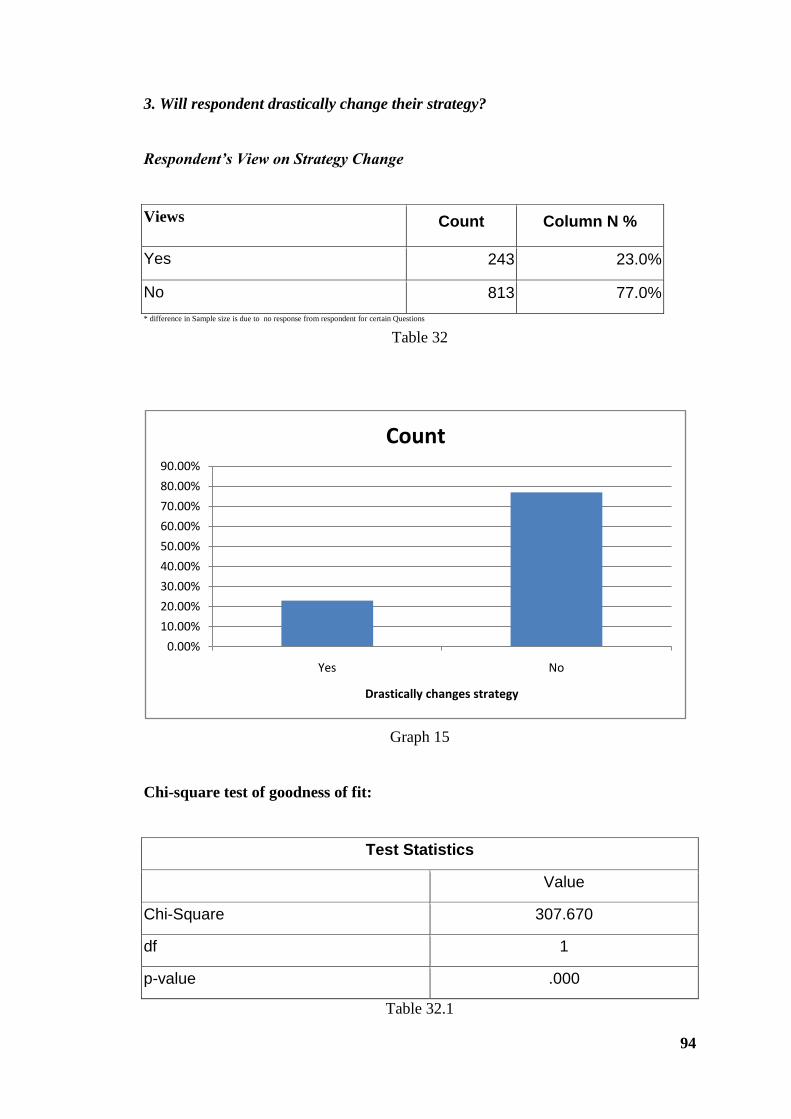
94
3. Will respondent drastically change their strategy?
Respondent’s View on Strategy Change
Views Count Column N %
Yes 243 23.0%
No 813 77.0%
* difference in Sample size is due to no response from respondent for certain Questions
Table 32
Graph 15
Chi-square test of goodness of fit:
Test Statistics
Value
Chi-Square 307.670
df 1
p-value .000
Table 32.1
0.00%
10.00%
20.00%
30.00%
40.00%
50.00%
60.00%
70.00%
80.00%
90.00%
Yes No
Drastically changes strategy
Count
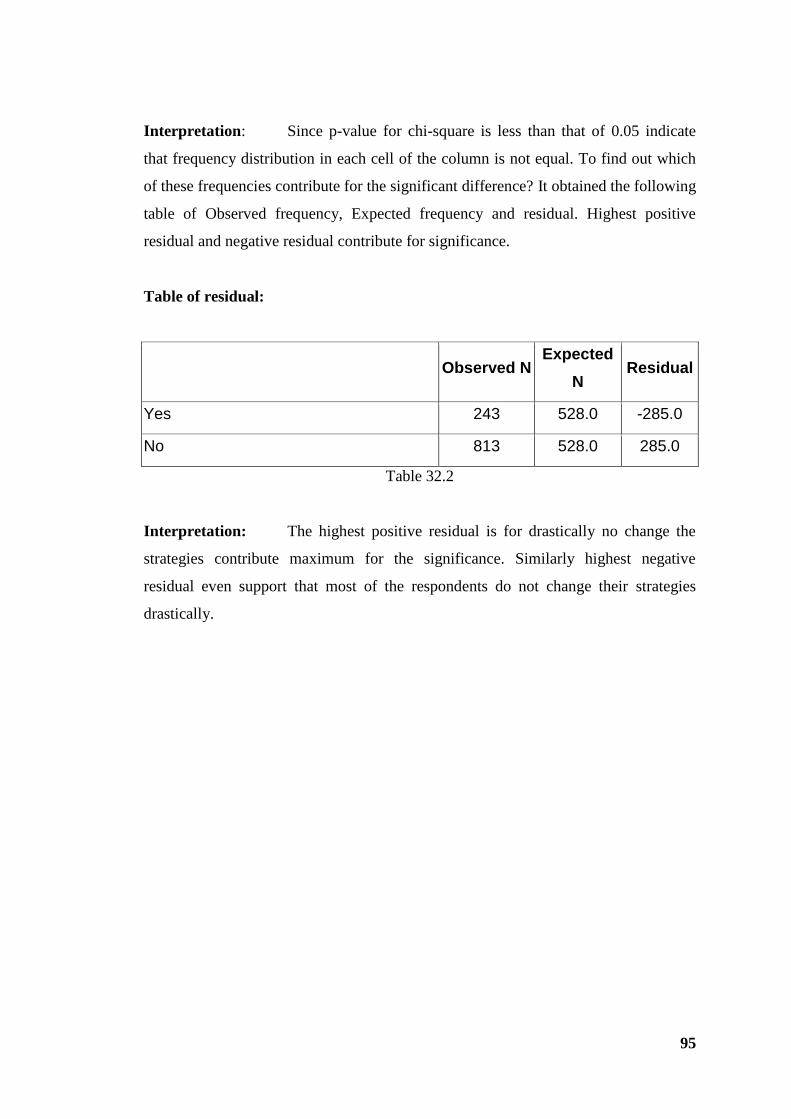
95
Interpretation: Since p-value for chi-square is less than that of 0.05 indicate
that frequency distribution in each cell of the column is not equal. To find out which
of these frequencies contribute for the significant difference? It obtained the following
table of Observed frequency, Expected frequency and residual. Highest positive
residual and negative residual contribute for significance.
Table of residual:
Observed N
Expected
N Residual
Yes 243 528.0 -285.0
No 813 528.0 285.0
Table 32.2
Interpretation: The highest positive residual is for drastically no change the
strategies contribute maximum for the significance. Similarly highest negative
residual even support that most of the respondents do not change their strategies
drastically.
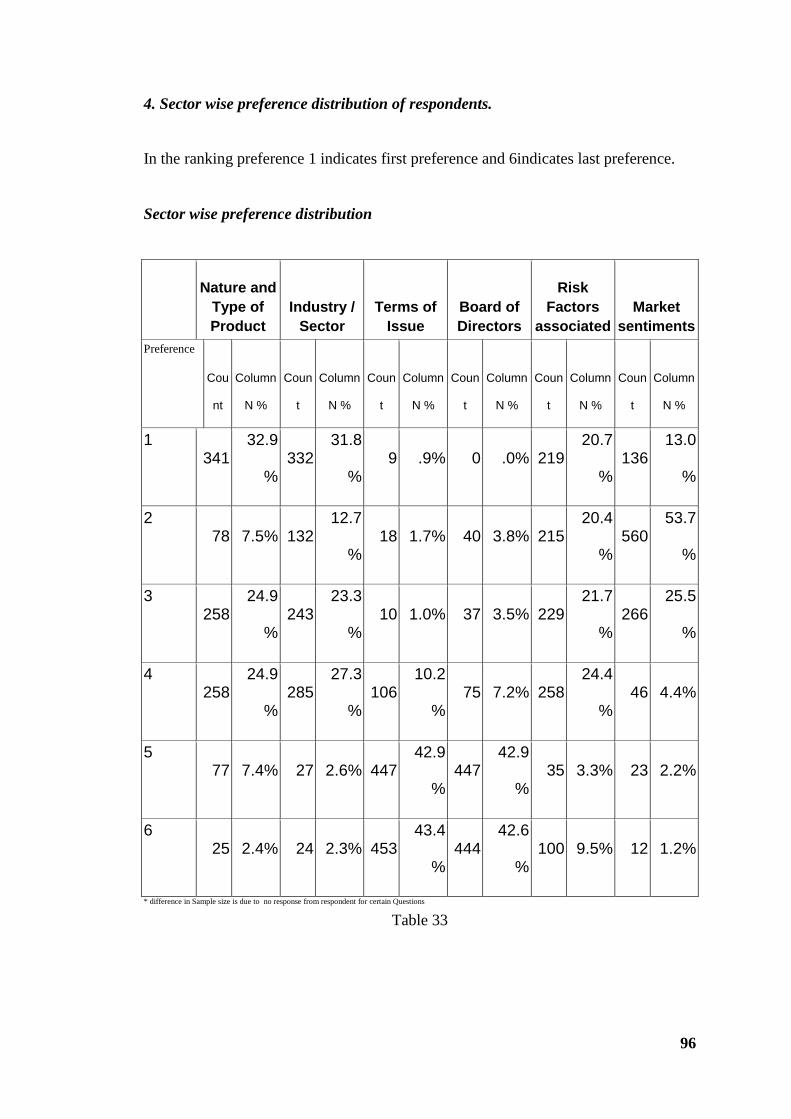
96
4. Sector wise preference distribution of respondents.
In the ranking preference 1 indicates first preference and 6indicates last preference.
Sector wise preference distribution
Nature and
Type of
Product
Industry /
Sector
Terms of
Issue
Board of
Directors
Risk
Factors
associated
Market
sentiments
Preference
Cou
nt
Column
N %
Coun
t
Column
N %
Coun
t
Column
N %
Coun
t
Column
N %
Coun
t
Column
N %
Coun
t
Column
N %
1 341
32.9
% 332
31.8
% 9 .9% 0 .0% 219
20.7
% 136
13.0
%
2 78 7.5% 132
12.7
% 18 1.7% 40 3.8% 215
20.4
% 560
53.7
%
3 258
24.9
% 243
23.3
% 10 1.0% 37 3.5% 229
21.7
% 266
25.5
%
4 258
24.9
% 285
27.3
% 106
10.2
% 75 7.2% 258
24.4
% 46 4.4%
5 77 7.4% 27 2.6% 447
42.9
% 447
42.9
% 35 3.3% 23 2.2%
6 25 2.4% 24 2.3% 453
43.4
% 444
42.6
% 100 9.5% 12 1.2%
* difference in Sample size is due to no response from respondent for certain Questions
Table 33
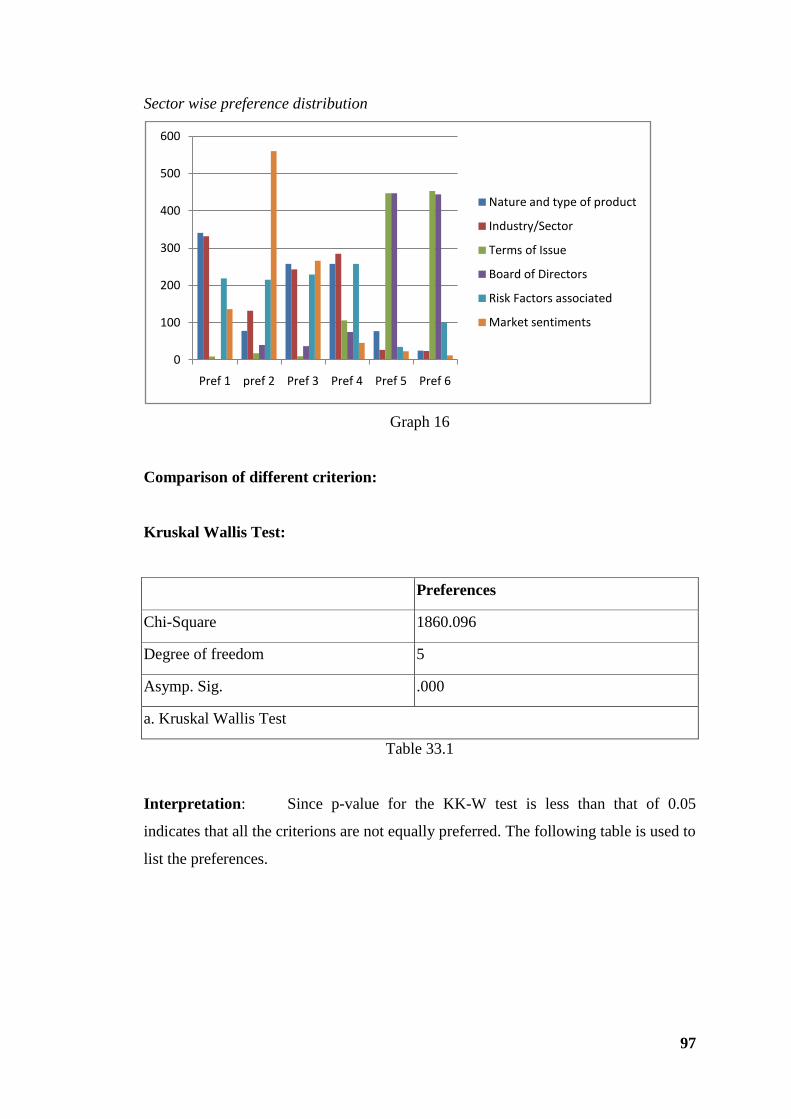
97
Sector wise preference distribution
Graph 16
Comparison of different criterion:
Kruskal Wallis Test:
Preferences
Chi-Square 1860.096
Degree of freedom 5
Asymp. Sig. .000
a. Kruskal Wallis Test
Table 33.1
Interpretation: Since p-value for the KK-W test is less than that of 0.05
indicates that all the criterions are not equally preferred. The following table is used to
list the preferences.
0
100
200
300
400
500
600
Pref 1 pref 2 Pref 3 Pref 4 Pref 5 Pref 6
Nature and type of product
Industry/Sector
Terms of Issue
Board of Directors
Risk Factors associated
Market sentiments

98
Mean rank table of Sector wise preference distribution:
N Mean Rank* Preference
Nature and type of product 1037 2326.04 Third
Industry/Sector 1043 2215.81 Second
Terms of Issue 1043 4923.01 Sixth
Board of Directors 1043 4861.16 Fifth
Risk Factors associated 1056 2576.34 Fourth
Market sentiments 1043 1897.94 First
*Since rank values are from 1 to 6 the lowest value indicates highest preference
* difference in Sample size is due to no response from respondent for certain Questions
Table 33.2
Interpretation: Market sentiment has got highest preference and terms of issue as
well as Board of directors got the last preference in the list of criterion while
operating in primary market.
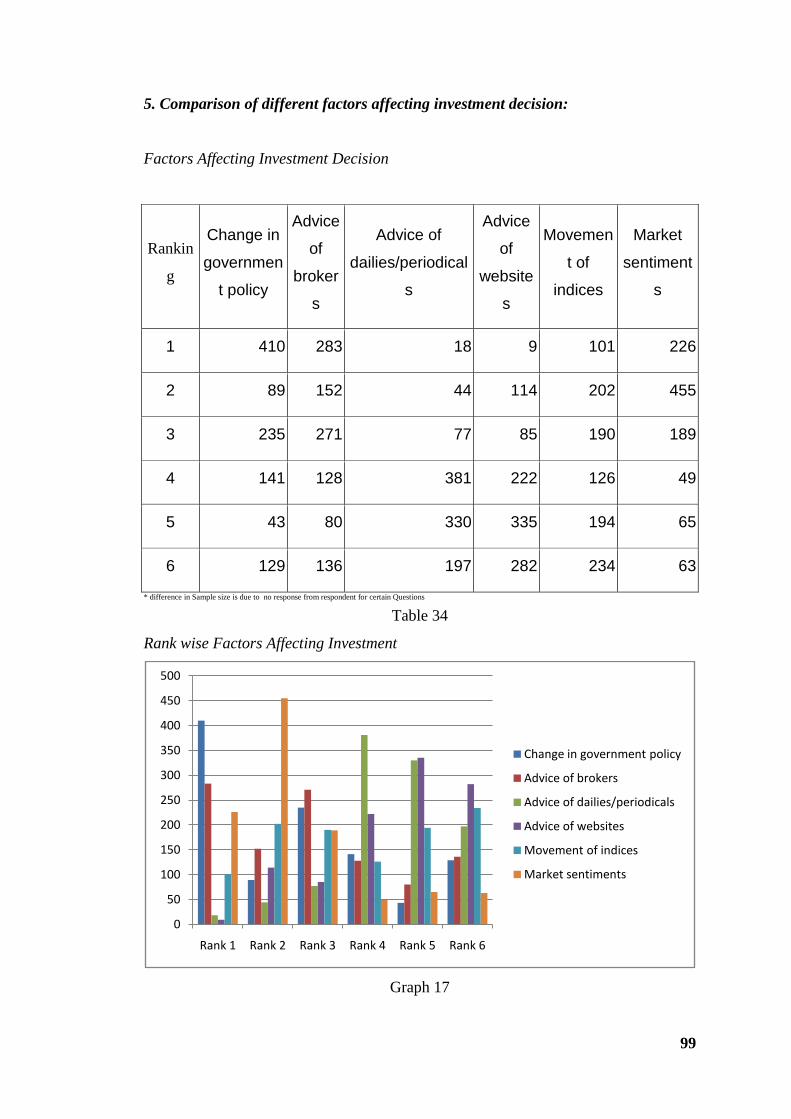
99
5. Comparison of different factors affecting investment decision:
Factors Affecting Investment Decision
Rankin
g
Change in
governmen
t policy
Advice
of
broker
s
Advice of
dailies/periodical
s
Advice
of
website
s
Movemen
t of
indices
Market
sentiment
s
1 410 283 18 9 101 226
2 89 152 44 114 202 455
3 235 271 77 85 190 189
4 141 128 381 222 126 49
5 43 80 330 335 194 65
6 129 136 197 282 234 63
* difference in Sample size is due to no response from respondent for certain Questions
Table 34
Rank wise Factors Affecting Investment
Graph 17
0
50
100
150
200
250
300
350
400
450
500
Rank 1 Rank 2 Rank 3 Rank 4 Rank 5 Rank 6
Change in government policy
Advice of brokers
Advice of dailies/periodicals
Advice of websites
Movement of indices
Market sentiments

100
Kruskal Wallis Test:
Preferences
Chi-Square 1446.771
Degree of freedom 5
Asymp. Sig. .000
a. Kruskal Wallis Test
Table 34.1
Interpretation: Since p-value for the KK-W test is less than that of 0.05
indicates that all the factors are not equally influence. The following table is used to
list the preferences for influencing investment decisions.
Mean rank table:
N Mean Rank* Preference
Change in government policy 1047 2327.72 Second
Advice of brokers 1050 2601.60 Third
Advice of dailies/periodicals 1047 4178.09 Sixth
Advice of websites 1047 4231.62 Fifth
Movement of indices 1047 3436.59 Fourth
Market sentiments 1047 2083.92 First
*Since rank values are from 1 to 6 the lowest value indicates highest preference
* diffierence in Sample size is due to no response from respondent for certain Questions
Table 34.2
Interpretation: Market sentiments has emerged as highest influencing factor and
terms of issue as well as Advice of dailies/periodicals and Advice of websites got the
last rank in the in the list of influencing factors.
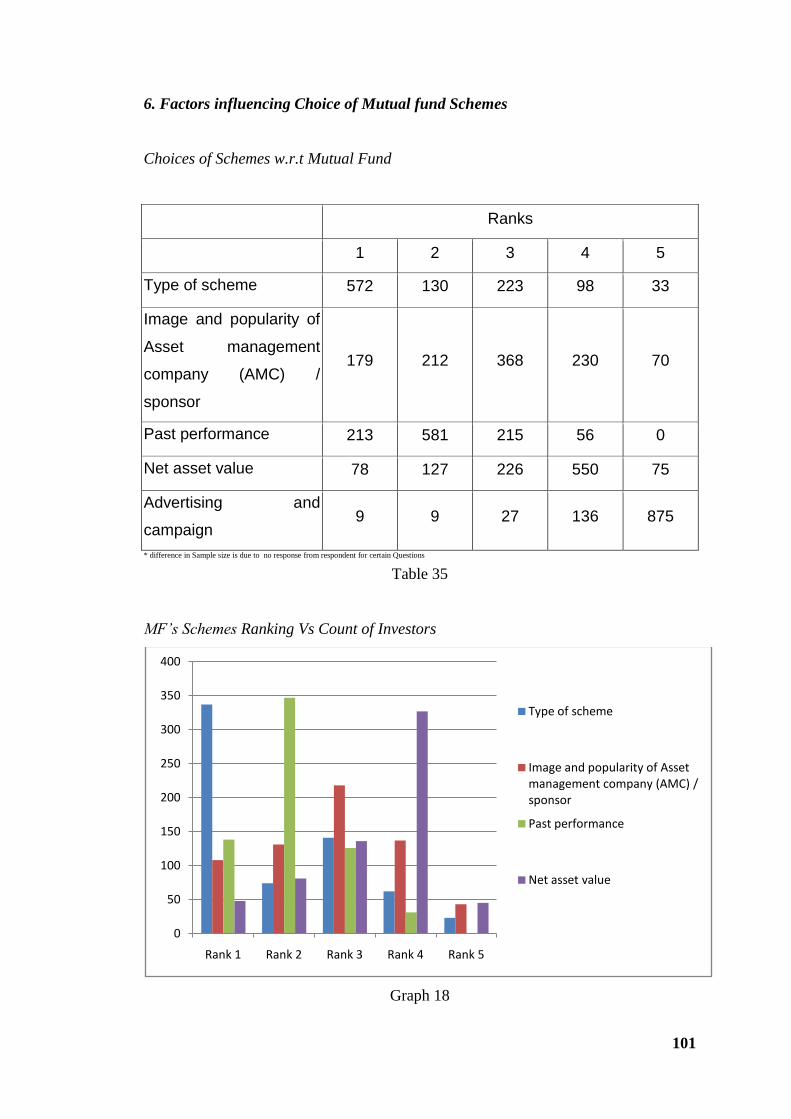
101
6. Factors influencing Choice of Mutual fund Schemes
Choices of Schemes w.r.t Mutual Fund
Ranks
1 2 3 4 5
Type of scheme 572 130 223 98 33
Image and popularity of
Asset management
company (AMC) /
sponsor
179 212 368 230 70
Past performance 213 581 215 56 0
Net asset value 78 127 226 550 75
Advertising and
campaign 9 9 27 136 875
* difference in Sample size is due to no response from respondent for certain Questions
Table 35
MF’s Schemes Ranking Vs Count of Investors
Graph 18
0
50
100
150
200
250
300
350
400
Rank 1 Rank 2 Rank 3 Rank 4 Rank 5
Type of scheme
Image and popularity of Asset management company (AMC) / sponsor
Past performance
Net asset value
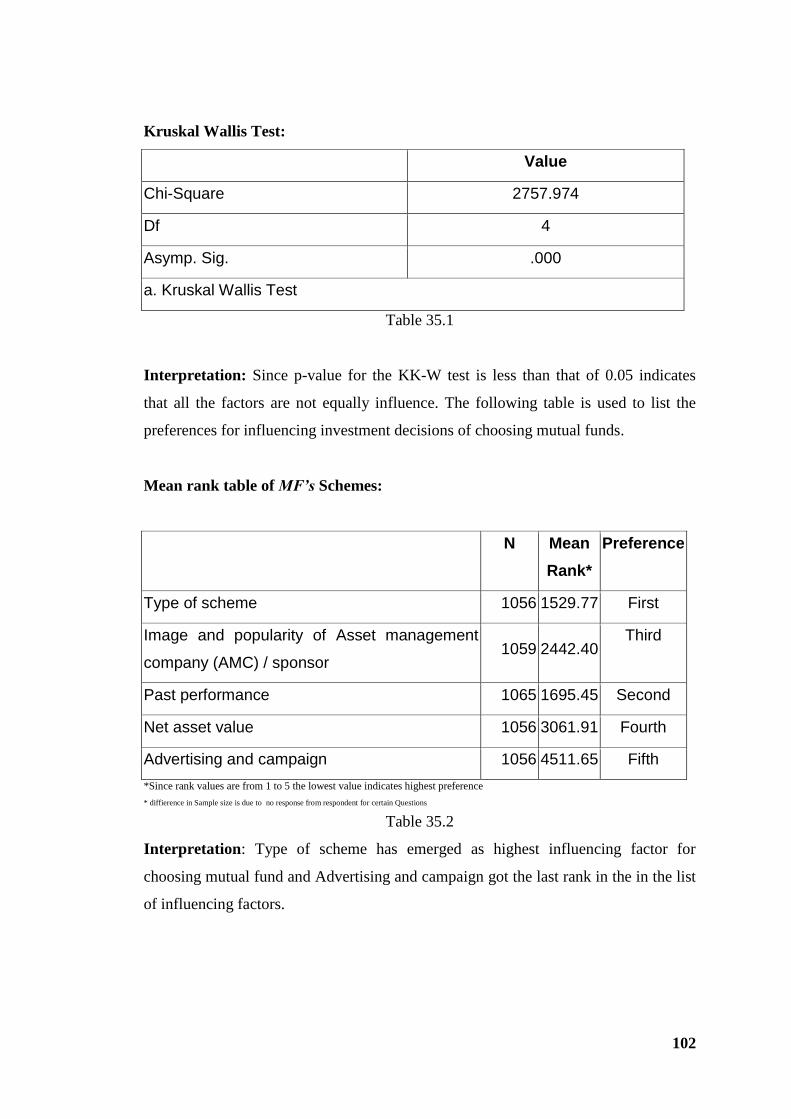
102
Kruskal Wallis Test:
Value
Chi-Square 2757.974
Df 4
Asymp. Sig. .000
a. Kruskal Wallis Test
Table 35.1
Interpretation: Since p-value for the KK-W test is less than that of 0.05 indicates
that all the factors are not equally influence. The following table is used to list the
preferences for influencing investment decisions of choosing mutual funds.
Mean rank table of MF’s Schemes:
N Mean
Rank*
Preference
Type of scheme 1056 1529.77 First
Image and popularity of Asset management
company (AMC) / sponsor 1059 2442.40
Third
Past performance 1065 1695.45 Second
Net asset value 1056 3061.91 Fourth
Advertising and campaign 1056 4511.65 Fifth
*Since rank values are from 1 to 5 the lowest value indicates highest preference
* diffierence in Sample size is due to no response from respondent for certain Questions
Table 35.2
Interpretation: Type of scheme has emerged as highest influencing factor for
choosing mutual fund and Advertising and campaign got the last rank in the in the list
of influencing factors.

103
Since for all the independent parameter it accepts that there exist pattern of saving for
that individual parameter. Hence it rejects the hypothesis at general level and
concludes that there exists pattern of investment. The pattern of investment is:
Category Pattern
Preferred sectors investment Bank, IT and AUTO
Number of companies in portfolio 6 to 10
Biggest concern in terms of your investment
Fall in sensex, Depression phase and
inflation
Drastically change in Strategy No
Most important criterion considered while
operating in primary Market
Market sentiments, Industry type and
Nature & Type of product.
factors affecting investment decision
Market sentiments, Government policies
and Advice from broker
Mode of trading for secondary market
operations Stock brokers or sub brokers
Factors influencing Choice of Mutual fund Type of Scheme and Past performance
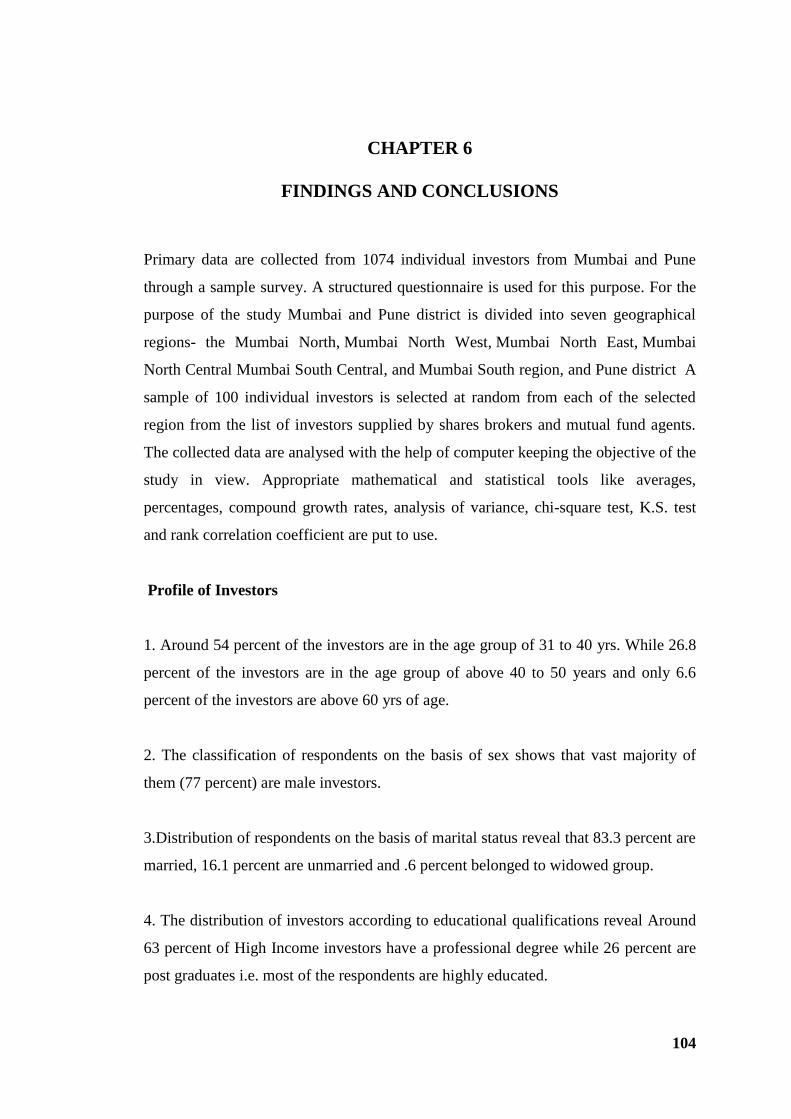
104
CHAPTER 6
FINDINGS AND CONCLUSIONS
Primary data are collected from 1074 individual investors from Mumbai and Pune
through a sample survey. A structured questionnaire is used for this purpose. For the
purpose of the study Mumbai and Pune district is divided into seven geographical
regions- the Mumbai North, Mumbai North West, Mumbai North East, Mumbai
North Central Mumbai South Central, and Mumbai South region, and Pune district A
sample of 100 individual investors is selected at random from each of the selected
region from the list of investors supplied by shares brokers and mutual fund agents.
The collected data are analysed with the help of computer keeping the objective of the
study in view. Appropriate mathematical and statistical tools like averages,
percentages, compound growth rates, analysis of variance, chi-square test, K.S. test
and rank correlation coefficient are put to use.
Profile of Investors
1. Around 54 percent of the investors are in the age group of 31 to 40 yrs. While 26.8
percent of the investors are in the age group of above 40 to 50 years and only 6.6
percent of the investors are above 60 yrs of age.
2. The classification of respondents on the basis of sex shows that vast majority of
them (77 percent) are male investors.
3.Distribution of respondents on the basis of marital status reveal that 83.3 percent are
married, 16.1 percent are unmarried and .6 percent belonged to widowed group.
4. The distribution of investors according to educational qualifications reveal Around
63 percent of High Income investors have a professional degree while 26 percent are
post graduates i.e. most of the respondents are highly educated.
105
5. The income wise classification of respondents shows that 39.9 percent have annual
income between Rs.1000000 to 2000000, 36.2 percent have annual income between
Rs.2000001 and 3000000, 23.8 percent have annual income more than 3000001.
6. 65.7 percent of the respondents have annual savings of more than 1lac while 13.2
percent have savings above 50 thousand i.e.it can conclude that most of the investors
are looking for investment and are aware of the options available in the market.
7. Around 36 percent of the investors have more than 10 yrs of market experience.
And only 14.5 percent of the investors have less than three years of market
experience. From the above data it can conclude that most of the population sample is
quite experienced with respect to investment in capital markets is concerned.
Level and pattern and Determinants capital Market investment
It can conclude that the most important reason for High Income Individual investors
to invest is ―Money required for emergency purposes‖ and ―to secure their lives after
retirement‖. And the least number of respondents invest in higher education. Around
36 % of the investors have more than 10 yrs of market experience. And 65.7% of the
respondents have annual savings of more than one lakh. And most important reason to
make investment is for emergency purpose and to secure their lives after retirement.
It is observe that there exists significant difference in the average investment in
different financial assets. Bank deposit, bond and other debt options, provident fund
and equity capital market options has resulted as prominent option for investment.
It can be concluded that there exists significant difference in the average investment
in different equity capital market assets. The rank table and table of descriptive
statistics reveal the fact that of these three options mutual fund is the most preferred
option and Debentures is the least preferred option while as shares are preferred next
to mutual funds and are very close to mutual funds.

106
For Above 50 yrs and above age group prefer Equity Capital Markets instruments like
Shares, Debentures and Mutual Fund Schemes, while those between 31 to 40 yrs of
age prefer Bank Deposits over other mode of investment.
Education does affect the investment pattern of the investor for this parameter. It may
conclude that people with Professional Degrees or Post graduation degrees have a
better understanding and willingness to invest in Capital Market Instruments.
Annual income does affect the investment pattern of the investor for this parameter. It
may conclude that higher income leads to higher investment in Capital Market
Instruments.
People in the age group of 31 to 50 yrs invest more in Shares, but invest up to 25000
only. People in the age group of 31 to 40 yrs invest in Debentures, but invest up to
25000 only. People in the age group of 31 to 40 yrs invest more in Mutual Fund
Schemes and investment more than 1 lakh per annum.
Male population invests more than females in Shares and Mutual Fund Schemes.
Shares and Debentures investment is up to 25000 only but more than one lakh of
investment is for Mutual Fund Schemes
Amongst all income group people with income between ten lakh to twenty lakh invest
more in Shares, Debentures and Mutual Fund schemes.
Amongst Mutual Fund Schemes highest preference to invest is observed for ―Growth
scheme‖ and‖ SIP ―category. while as least is observed for‖ income scheme‖ and
―Index fund‖.
―Bank‖ has got highest preference while ―IT‖ and ―Auto‖ sector got Second and third
preference while as ―Health care‖ got last preference
Number of companies in respondent‘s portfolio most of the respondent‘s have6 to 10
companies in portfolio but not more than 20 companies. Even most of the respondents

107
have 1 to 5 companies in their portfolio. It can be said that most of the respondents
have 1 to10 companies in their portfolio.
Comparison of different factors affecting investment decision ―Market sentiments‖
has emerged as highest influencing factor and ―terms of issue‖ as well as ―Advice of
dailies/periodicals and Advice of websites‖ got the last rank in the in the list of
influencing factors.
It may conclude that people with Professional Degrees or Post graduation degrees
have a better understanding and willingness to invest in Capital Market Instruments.
Higher income leads to higher investment in Capital Market Instruments. This
indicates that Gender do effect the investment pattern like Males prefer Equity Capital
Market Instruments and Bank Deposits more than females as mode of investment.
Male population invest more than females in Shares
Biggest concern in terms of respondent‘s investment is for ―Fall in sensex‖. Even
most of the respondents have fall in the category of ―depression phase‖ and ―inflation‘
with next two positive residual.
Will respondent drastically change their strategy -The highest positive residual is that
most of the respondents do not want to change their strategies drastically.
Based on the findings of the study, following conclusion have been arrived at. Since
for all the independent parameter it accepts that there exist pattern of saving for that
individual parameter. Bank, IT and Auto sector is the most preferred sector of
investment. Most of the respondents have 6 to 10 companies in their portfolio.
The Major concern in terms of investment is ―Depressing phase in the market‖ ,risk
associated with fall in sensex and rising inflation. The most important criterion
considered while operating in Equity Market is Market Sentiments and the industry
and Nature and type of Product. Among the various capital market instruments
available, Mutual Funds Schemes are the most preferred instruments among investors
followed by Shares and debentures. Majority of investors have an experience of more
than three years in capital market investment. But they have a relatively short period
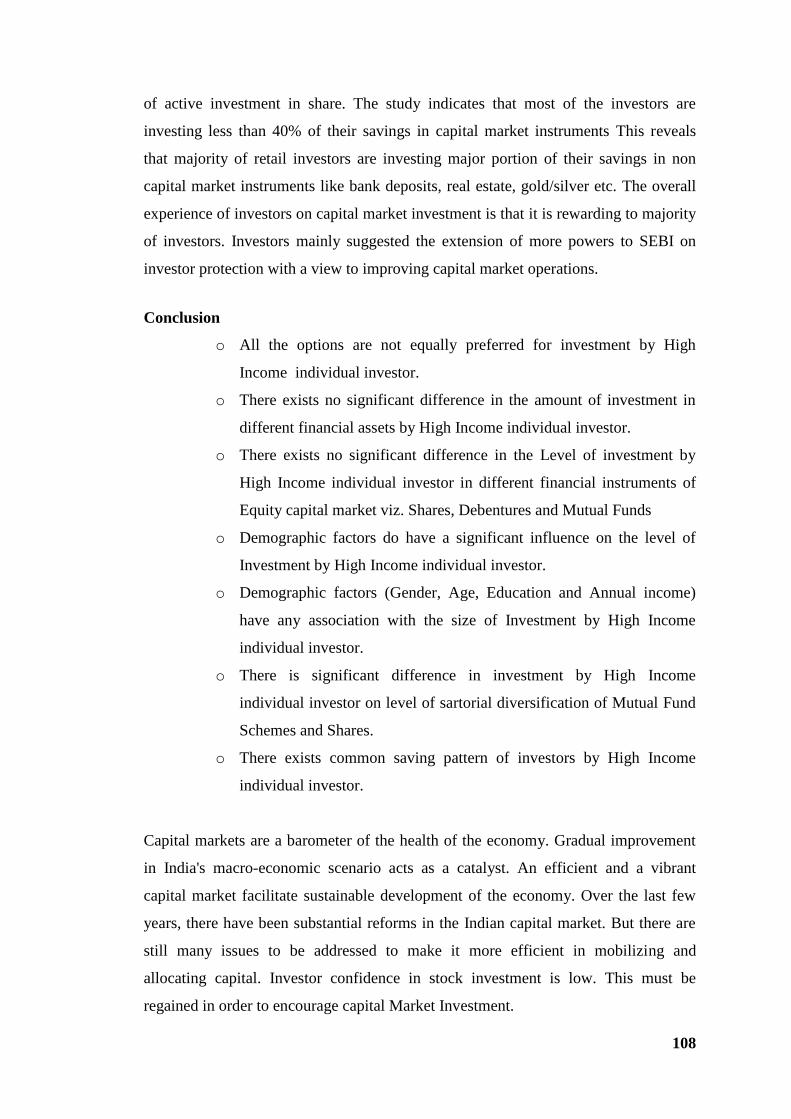
108
of active investment in share. The study indicates that most of the investors are
investing less than 40% of their savings in capital market instruments This reveals
that majority of retail investors are investing major portion of their savings in non
capital market instruments like bank deposits, real estate, gold/silver etc. The overall
experience of investors on capital market investment is that it is rewarding to majority
of investors. Investors mainly suggested the extension of more powers to SEBI on
investor protection with a view to improving capital market operations.
Conclusion
o All the options are not equally preferred for investment by High
Income individual investor.
o There exists no significant difference in the amount of investment in
different financial assets by High Income individual investor.
o There exists no significant difference in the Level of investment by
High Income individual investor in different financial instruments of
Equity capital market viz. Shares, Debentures and Mutual Funds
o Demographic factors do have a significant influence on the level of
Investment by High Income individual investor.
o Demographic factors (Gender, Age, Education and Annual income)
have any association with the size of Investment by High Income
individual investor.
o There is significant difference in investment by High Income
individual investor on level of sartorial diversification of Mutual Fund
Schemes and Shares.
o There exists common saving pattern of investors by High Income
individual investor.
Capital markets are a barometer of the health of the economy. Gradual improvement
in India's macro-economic scenario acts as a catalyst. An efficient and a vibrant
capital market facilitate sustainable development of the economy. Over the last few
years, there have been substantial reforms in the Indian capital market. But there are
still many issues to be addressed to make it more efficient in mobilizing and
allocating capital. Investor confidence in stock investment is low. This must be
regained in order to encourage capital Market Investment.

109
The present study is an attempt to provide inputs to policy makers, regulatory
authorities and stock exchanges for sharpening their focus to suit to the needs of the
High Income Group investors and to improve these investor‘s participation in the
capital markets. The results highlight that certain factors like education level,
awareness about the current financial system, age of investors frequency of
investment pattern, income level etc... make significant impact while deciding the
investment avenues of High Income Group investors. Capital markets firms should
look to engage these High Income Group retail investors with secure, efficient and
reliable process who understand their changing business environment, provide
investors with the opportunity to step into the future with greater confidence.

110
CHAPTER 7
RECOMMENDATIONS
Based on the findings presented in the study the following suggestions are offered:
Investors possess limited knowledge and information on products, their
benefits and risk attached, which acts as a deterrent to investment. As
education helps in better understanding of various instruments of Capital
Market and risk associated with it, so, financial awareness is to be identified &
literacy as a part of school curriculum would result in better awareness of
Capital Market Products for the new generation. An attempt has been done by
CBSE board, but other state and regional boards need to follow.
As per the study there exist a significance difference in the Level of
investment in Equity Capital Market Instruments i.e. High Income Group
Investors invest more in Indirect Participation Products like Mutual Funds.
However they have been guided by intermediaries /Financial Advisors to
invest in Commodities /Currency markets. Since High Income Investors are
not educated in new areas of Investment , they are given false promises and
are often misguided by these advisors. Hence there is a large scope for
investor education in upcoming area of Financial Asset class.
Current Study is limited to Capital Market , but other emerging assets have to
be included from time to time.

111
CHAPTER 8
BIBLIOGRAPHY
1. Agarwal, Krishna Kumar(2007),Capital Market in India , Anmol Publications
Private Limited, New Delhi.
2. Ahamed Naseem, (2000), Equity Price Behavior and Bonus Issues, Rajat
Publications, New Delhi.
3. Avadhani V.A, (1999), Investment and Securities Market in India , Himalaya
Publishing House, Mumbai.
4. Avadhani V.A.,(1996), Investment Management, Himalaya Publishing House,
Mumbai.
5. Abhay Pethee and Karnik Ajit. (2000), ―Do Indian Stock Markets Matter?
Stock Market Indices and Macro –Economic Variables‖, Economic and
Political Weekly, Vol. 35,(No.5),pg no.-349-356
6. Ajay Shah.(1999), ―Institutional Change in India‘s Capital Markets‖,
Economic and Political Weekly, Vol. 35, (No.3 and 4), pg- 95-113.
7. Amanulla S. and Kamaiah B(1998), Asset Price Behaviour in Indian Stock
Market: Is the ―CAPM‖ Still Relevant? , Journal of Financial Management
and Analysis, Vol.11,(No.1).
8. Anup Menon(2000), Derivarives- Will the Future see more Action?, The
Hindu Business Line, Vol 7,pg. No.299.
9. Agarwal P.C(1992), Suggestions on Scriptless Trading, Journal of Chartered
Secretary, Vol. 22, (No. 10), pg. 888.

112
10. Anshuman A S & Prakash Chandra R (1991), Small Equity Shareholdings:
The Repercussions, Journal of Chartered Secretary, Vol 21, (No. 7), pg- 562.
11. Alexender Sharpe William and Bailey (2002),Fundamentals of Investments,
Prentice Hall of India Publications, New York.
12. Balakrishan and Nartha S.S (1997),Security Markets in India , Kanishka
Publishers, New Delhi
13. Barua S .K, Raghunathan V & Varma J R (1992), Portfolio Management, Tata
McGraw-Hill Publishing, New Delhi.
14. Bhalla U.K (1983), Investment Management : Security Analysis and Portfolio
Management , S. Chand Publications, New Delhi.
15. Bhole L.M. (1996), Financial Institutions and Markets structure, Growth and
Innovations, Tata McGraw Hill Publishing, New Delhi .
16. BSE Annual Capital Market Review (2001), The Stock Exchange Foundation,
Mumbai
17. Bagchi Amiya Kumar(1999), Globalisation, Liberalisation and Vulnerability-
India and Third World, Economic and political Weekly, Vol.19, (No.45).
18. Baur M.M.(1995), Mutual Funds: The U.S. Experience. Finance India, Vol.9.
(No. 4).
19. Belgaumi M.S. (1995), Efficiency of the Indian Stock Market: An Empirical
Study, Vikalpa, Vol.20, (No. 2).
20. Bhole L.M.(1995), The Indian Stock Market An Empirical Study- Vikalpa,
Vol. 20, (No. 2).
113
21. Bhole L.M. (1995). The Indian Capital Market at Cross Roads, Vikalpa,
Vol.2,.(No.2).
22. Bal R K, Mishra (1990), Role of Mutual Funds in Developing Indian Capital
Market, Indian Journal of Commerce, Vol. 43, pg-. 165.
23. Balasubramaniam C.S(1980), Indexes of Ordinary Share Prices – An
Evaluation, Artha Vijnana, Vol. 22, (No. 4) ,(Dec) ,pg-. 552-564.
24. Balkrishnan(1984), Determinants of Equity Prices in India, Journal of
Management Accountant, Vol. 19, No. 12 (Dec), pg-. 728-730.
25. Barua S.K & Srinivasan G (1982), Experiment on Individual Investment
Decision Making Process, Indian Institute of Management, Ahmadabad, Vol.
No. 423, (Apr-June)
26. Barua S.K & Raghunathan V(1986), Inefficiency of the Indian Capital Market,
Vikalpa, Vol. 11, (No. 3),(Jul-Sept), pg-. 225-235.
27. Barua S K & Srinivasan G (1988), The Decision Process of Individuals under
Conditions of Risk : An Experimental Study, International Journal of
Management, Vol. 5, (No. 3), (Sept), pg-. 251-258.
28. BaruaS.K & Srinivasan G (1991), Experiment on Individual Investment
Decision Making Process, Sankhya, Vol. 53, (Series B), pg. 74-88.
29. Chandresekhara Rao, K. and Geetha T. (1996) Indian Capital Market, A.P.H
publishing Corporation, New Delhi.
30. Chandra Prasanna(1990), Investment Game: How to Win, Tata McGraw-Hill
Publications , New Delhi .
31. Charkham Jonathan and Simpson Anne,. (1999), Fair Shares, Oxford
University Press, New York.
114
32. Cherian V.K. (1993), The Scam and the Rajas of the Money Market, Har
Anand Publication, New Delhi
33. Cirvante V.R. (1956)., The Indian Capital Market Oxford University Press,
Mumbai.
34. Chandra Prasanna(1989), "Pricing of Public Issues", Chartered Financial
Analyst, (Jul-Aug), pg. 3-7.
35. Chitale R.P. (1995), Regulatory Framework for Securities Market, Journal of
Chartered Secretary, Vol.25. (No. 10).
36. Claessens, Stijin. (1995). The Emergence of Equity Investment in Developing
Countries: Overview, The World Bank Economic Review, Vol.9.(No.1).
37. Chandra Prasanna(1989), Individual Portfolio Management: Mistakes and
Remedies, Chartered Financial Analyst, (Sep-Oct), pg. 3-5.
38. Chandra Prasanna(1990), Indian Capital Market : Pathways of Development,
ASCI Journal of Management, Vol. 20, (No. 2-3) (Sept-Dec), pg-. 129-137.
39. Choudhury S K (1991), Seasonality in Share Returns: Preliminary Evidence
on Day-of-the-Week Effect, Journal of Chartered Accountant, Vol. 40,( No. 5)
(Nov), pg-407.
40. Chaudhury S K (1991), Short-run Share Price Behaviour : New Evidence on
Weak form of Market Efficiency, Vikalpa, Vol. 16, (No. 4) (Oct-Dec), p.17-
21.
41. Dixit R K(1986), Behaviour of Share Prices and Investment in India, Deep &
Deep Publications, New Delhi.
42. Dagli Paras.( 2001), Circa Capital Markets,. Business Standard, New Delhi.

115
43. Francis C.K (1991), "Towards a Healthy Capital Market", Yojana, Vol.
35,(Mar.1-15), pg 11-13.
44. Francis C.K (1991), "SEBI - The Need of the Hour", SEDME, Vol.
18,(No.3),pg. 37-41.
45. Gopalaswamy N. (1998), Corporate Governance. The New paradigm, Wheeler
Publishing., New Delhi.
46. Gopalswamy N.(2005), Capital market : The Indian Financial Scene,
Macmillan India Ltd, New Delhi.
47. Gopalaswamy N. (1994),Capital issues and SEBI Guidelines, South Asia
Publications, Delhi
48. Grewal S.S and Grewal Navjot (1994), Profitable Investment in Sshares,
Vision Books Publications, New Delhi
49. Gupta L.C.(1981) Rate of Return on Equities : The Indian Experience. Society
for Capital Market Research and Development, New Delhi.
50. Gupta Umaro Lal.(1972), Working of Stock Exchanges in India, Thomson
Press (India) Limited, New Delhi.
51. Gupta O P(1985), Behaviour of Share Prices in India: A Test of Market
Efficiency, National Publications, New Delhi.
52. Gupta L.G.(1987), Shareholders Survey – Geographic Distribution, Manas
Publications, Delhi.
53. Gupta L.C.(1991), Indian Shareowners – A Survey, Society for Capital Market
Research and Development, Journal of Economics, Vol. 53(Series B), pg-87.
116
54. Gupta L.C.(1993), Mutual Funds and Asset Preference: Household Investor
Survey, Society for Capital Market Research and Development, Journal of
Economics, Vol 41, pg-54-64.
55. Gupta L.C. (1997). The Roots of India‘s Stock Market Crisis, 1995-97, Delhi
Society for Capital Market Research and Development, Journal of Economics,
pg-55
56. Goud B.V. (1999), The depositary system, The Hindu Survey of Indian
Industry 1999, CDSL.
57. Gupta L.C. (1995.), SEBI well equipped to Enforce,. The Economic Times,
Vol. No. 34, pg no-..297.
58. Gupta L.C. (1996), Challenges before securities and Exchange Board of India,
Economic and Political Weekly, Vol.21,. (No.12).
59. Gupta L.C. and Utpal Choudhare K.(2000), Return on Indian Equities 1980-99
-The Sensex Portfolio, Economic and Political Weekly, Vol 35, (No.5).
60. Garai S (1989), "Corporate Over-All, performance as Judged by Investors: A
Canonical Correlation Analysis of Engineering Industrial Units", Decision,
Vol 16 (1), pg 53-65.
61. Gupta Ramesh (1991),Regulation of Securities Market in India: Some Issues ,
Chartered Secretary, Vol. 21.
62. Gupta Ramesh(1992), Development of the Capital Market in India: A
Regulatory Perspective, Vol. 997, (Jan-Mar), Indian Institute of Management,
Ahmedabad.
63. Hanson James, A. and Sanjay Kathuria., ( 1999), India: A Financial Sector for
the Twenty first Century, Oxford University Press, New Delhi.
117
64. Handbook of statistics on Indian Economy (1999- 2000),Reserve Bank of
India, Mumbai.
65. Henry Peter Blair (2000), Stock Market Liberalisation, Economic Reform,
and Emerging Market Equity Prices, Journal of Finance,Vol.55,(No.2).
66. India Securities Market – A Review – various issues., National Stock
Exchange of India Limited, Mumbai.
67. Iyer V.L.(1999),Taxman‘s SEBI Practice Manual, Taxmann Allied Services
(P) Limited, New Delhi.
68. Jawaharlal (1992),Understanding Indian Investors, Global Business Press,
New Delhi
69. Jayadev M.(1998), Investment Policy and Performance of Mutual Funds,
Kanishka Publishers, New Delhi.
70. Jain Nidhi.(1999), Restructuring Capital Markets, Journal of Chartered
Secretary, Vol.24.(No.9).
71. Jayanta Saha(1999), Share Buyback, The Management Accountant
Vol.34.(No.2).
72. Jha Raghabendra and Hari Nagarajan K.(1999), Market Integration, Price
Efficiency and Short- Run Dynamics. A Tale of Two National Stock Markets,
Economic and Political Weekly, Vol. 34, (No.3)
73. Jain P K(1979), "UTI & The New Issue Market", Artha Vijnana, Vol. 21,(No.
2), (June), pg-. 218.
74. Keynes J.M. (1936), General Theory of Employment, Interest and Money.
Macmillan Company, London.
118
75. Kevin. S (2006), ―Security Analysis and Portfolio Management‖, Prentice-
Hall of India, New Delhi.
76. Khan M.Y.(1978), New Issues Market and Finance for Industry in India,
Allied Publishers, Bombay.
77. Kathpal Meeta. (1993), Small Investor in the Stock Market Fray, Journal of
The Chartered Accountant, Vol.42,(.No.5).
78. Kothari Rajesh(1986), "Profile of Recent Developments in Indian Capital
Market", Prashanika, HCM-RIPA, Vol. 15, (No. 4) (Oct-Dec), pg-21.
79. Khan M Y(1977), New Issue Market and Company Finance, Economic &
Political Weekly, Review of Management, Vol. 12,pg. 11-21.
80. Khan M.Y.(1978), New Issues Market and Finance for Industry in India,
Allied Publishers, Bombay.
81. Machiraju H.R. (1995),The working of Stock Exchanges in India., Wiley
Eastern Limited Publishers, New Delhi.
82. Machiraju H. R. (1998), Indian Financial System., Vikas Publishing House
Private Limited, New Delhi.
83. Misra B.M.(1997), Fifty Years of the Indian Capital Market: 1947-97,:
Reserve Bank of India: Mumbai, Occasional Papers. Vol.18, ( Nos. 2&3).
84. Lamba Asjeet S. (1999). How Isolated is the Indian Stock Market; Empirical
Research Findings, Journal of Financial Management and Analysis. Vol.12, (
No.1).
85. Lal Jawahar(1992), "Investors' Understanding of Information: Some
Evidence",Journal of Chartered Secretary, Vol. 22, No. 3 (Mar), pg- 211

119
86. Lal T (1990), "Primary Capital Market : Some Reflections", Yojana, Vol.34,
pg. 9-12.
87. Mazumdar H (1959), Business Investment in India, J.B. Walters Publishing
Co., Cromington.
88. Madhu Panigrahi S(1996), Mutual Funds: Growth, Performance and
Prospects, Economic and Political Weekly, . Vol.31, (No.12).
89. Maiti Sajal Kumar(1997), Indian Capital Market- Some Emerging Trends In
India., Vol. 11, .( No.3).
90. Mayya M.R. (1999), ISE for Regional Centers, The Hindu Survey of Indian
Industry-199, Delhi.
91. Mohanthy Basudev. (1997). Slump in Securities Market – problems and
Strategies for the Sustainable Growth, Economic and Political Weekly, Vol
32,. (NO.42).
92. Mukherjee Sampat(1997), How to Beat the Market. The Management
Accountant , Vol.32.( No.5).
93. Mookerjee Raju (1988), "The Stock Market and The Economy : The Indian
Experience", Indian Economic Journal, Vol. 36( No. 2) (Oct-Dec), pg. 30-43.
94. Nartha S.S. (1992). Capital issues in India, Kanishka Publishers, New Delhi.
95. National Accounts Statistics(2011); Central statistical Organisation.
Government of India, Delhi.
96. Nagaishi Makito.(1999), Stock Market Development and Economic Growth-
Dubious Relationship, Economic and Political Weekly, Vol. 34, (No.29).
120
97. Nagaraj. R (1996), India‘s Capital Market Growth; Trends, Explanations and
Evidence, Economic and Political Weekly. Vol. 31. (Nos. 35&37).
98. Nagpal Nina (1993), Financial Instruments of the Future, Economic Times,
New Delhi
99. Patel G.S.(1987), Stock Exchanges in India- Emerging Scenario and
Challenges, The A.D. Shroff Memorial Trust, Bombay.
100. Pratap Chandra Biswal and Kamaiah B. (2000), Stock market of SEBI
Market Development in India: Is there any Trend Break? Bangalore, Journal
of Social and Economic Development, Vol. 3,( No. 1), pp. 40-55.
101. Pratip Kar. (2000), Survey of Indian Investors, Securities and
Exchange Board of India, Mumbai
102. Patil R.H. (2000), The Capital Market in 21st Century. Economic and
Political Weekly. Vol.35, (No.47).
103. Patil R.H. (2001), Industrial Finance and Capital Market; Changing
Scenario, Economic and Political Weekly. Vol. 34, ( No.4).
104. Premchnder. (1989), Protecting Debenture Holders in the Capital
Market. Vikalpa, Vol.14,( No.1).
105. Pandya V H (1992), "Securities and Exchange Board of India: Its Role,
Powers, Functions and Activities", Chartered Secretary, Vol. 22, (No. 9), pg.
783.
106. Pasricha S.N.(1979), "Fixed Investment Behaviour in India - A Survey
of Econometric Studies", Margin, Vol 12, pg. 115-130.
121
107. Puranik Alok (1992), "Role of Corporate Securities in Household
Saving and Private Corporate Sector Financing during Eighties - Some
Empirical Observations", Chartered Secretary, Vol. 22, No. 11 (Nov), pg. 991.
108. Rao Mohan (1998), Working of Mutual fund Organisations in India,
Kanishka Publishers , New Delhi.
109.
110. Raghu Palat. (1991), Shares for Investment and Wealth, India Book
Publishers, Bombay
111. Raghunathan V (1991), Stock Exchanges and Investments: Straight
Answers to 100 Nagging Questions, Tata McGraw Hill Publishing, New
Delhi.
112. Raghunathan V. (1994), Stock Exchanges and Investments, Tata
McGraw –Hill Publishing Company Limited, New Delhi
113. Saroja S (1992), Emerging Trends in the Capital Market in India,
Global Business Press, New Delhi.
114. Sachak, H.(1997). Mutual Funds in India – Marketing Strategies and
Investment Practices, Response Books, New Delhi
115. Sahini S.K. (1985), Stock Exchanges in India: Practices, Problems,
Prospects, North Publishing Corporation, New Delhi
116. Saroja S.(1991), Emerging Trends in the Capital Market in India,
Global Business Press, New Delhi.
117. SEBI guidelines on Capital Issues and Merchant Banking.(1994).
Securities and Exchanges Board of India, Mumbai.
122
118. Sharma A.K. and Batra G.S. (2000), Indian Stock Market Regulation,
performance and Policy Perspective. Deep and Deep Publications Private
Limited, New Delhi.
119. Singh, Pyarelal (1994), Indian Capital Market – A Functional Analysis,
Kanishka Publishers, Delhi.
120. State of the Capital Market 1989-90(1990), Securities and Exchange
Board of India, Mumbai
121. Tomy Varghese(.1999), A study of Individual Investors in the Capital
Market: Trends and Dimensions, Tata McGraw-Hill Publishing Company
Limited, New Delhi.
122. Uma Shashikant and Arumugan S.( 2000), A Profile of Indian Capital
Market, Kanishka Publishers, Delhi.
123. Yasaswy N J (1985), Equity Investment Strategy, Tata McGraw Hill
Publishing Company Ltd., New Delhi.
124. Yalawar Y B(1988), Bombay Stock Exchange : Rates of Return and
Efficiency, Indian Economic Journal, Vol. 35, (No. 4) (Apr-Jun), pg. 68-121.
125. Zahir M A & Khanna Yakesh (1982), "Determinants of Stock Prices in
India", Journal of Chartered Accountant. Vol. 30, (No. 8) .

123
ANNEXURE –I
QUESTIONNAIRE
My name is Anamika Mitra and I am a MPhil student at D Y Patil University, Navi
Mumbai. For my project, I am analysing High Income Individual Investors
preferences in Capital Market Investment with special reference to Mumbai and
Pune I am inviting you to participate in this research study by completing the
attached survey. The following questionnaire will require approximately 15 min to
complete. There is no compensation for responding nor is there any known risk. I
ensure you that all information will remain confidential and will not be disclosed to
anyone. If you choose to participate in this project, please answer all questions as
honestly as possible and return the completed questionnaires promptly.
Participation is strictly voluntary and you may refuse to participate at any time.
I. PERSONAL PROFILE (PLEASE TICK)
a. Name (Optional)
b. Address :
c. Phone number :
d. Age : 1. Upto – 30 � 2. 31- 40 � 3. 41-50 � 4. 51 – 60 � 5. Above 60 �
e. Sex : 1. Male � 2. Female �
f. Marital status : 1. Married � 2. Unmarried � 3. Widowed � 4. Divorced �
g. Education : 1. Below graduation � 2. Graduation � 3. Post graduation �
4. Professional degree �
h. Occupation :

124
i. Annual Income : 1. Upto 10,00,000 � 2. 1000001-2000000 � 3. 2000001-
3000000 � 4. . Above 3000000 �
j. Annual Savings : 1. Upto Rs.10000 � 2. Rs.10001-25000 � 3. Rs.250001-50000
4. Rs.50001-100000 � 5. Above Rs. 100000 �
2 What is the most important reason for you to make investment?
a) Security after getting retired � b) Money required for emergency
purpose. �
c) For the purpose of education � d) For saving Tax �
e) To meet daily expenses �
3 How many years of market experiences do you have in the capital market?
1. Less than 3 years � 2. 3 to 5 years �
3. 6 to 10 years � 4. More than 10 years �
4. What is your average savings in each Financial asset? (Specify the amount)
a) Capital market instruments (Shares-debentures & bonds) Rs.
b) Bank deposit Rs. c) Post office savings Rs.
d) Government security Rs. e) Insurance premium Rs.
f) Chit funds Rs. g) Provident funds Rs.
h) Others (specify) Rs.
5. Rank your investment in the following sectors (1 – 8)
1. Capital goods � 2. Bank � 3. Fast moving consumer goods �
4. IT � 5. Consumer Goods � 6. Health care �
7. Auto � 8. Metal �
6. How many companies your existing portfolio has?
1. 1 to 5 � 2. 6 to 10 �
3. 11 to 20 � 4. Above 20 �

125
7. Size Of Investment
7.1 What is your size of Annual Investment in shares? (please tick)
1. Upto Rs.25000 � 2. Rs.25001-50000 �
3. Rs.50001-100000 � 4. Above Rs.100000 �
7.2 What is your size of Annual investment in Debentures?
1. Upto Rs.25000 � 2. Rs.25001-50000 �
3. Rs.50001-100000 � 4. Above Rs.100000 �
7.3 What is your Annual size of investment in Mutual Fund Schemes? (please
tick)
1. Upto Rs.25000 � 2. Rs.25001-50000 �
3. Rs.50001-100000 � 4. Above Rs.100000 �
7.4 State your preferred Investment opinion for Future (please rank)
1. Shares � 2. Debentures � 3. Mutual Fund schemes �
8. Rank the factors that Hinder your Investment Plans / Expansion etc.,
1. Incurrent risk � 2. No promising return � 3. Liquidity problems �
4. Inflation� 5. Others (please specify)…
9. What is your biggest concern in terms of your investment getting affected?
1 Depression phase in market� 2. Fall in sensex�
3. Capital growth� 4. Inflation�
10. Will you continue with your investment in Capital Market?
If Yes…Will you drastically change your strategy?
Yes � 2. No �
11. Rank the most important criterion considered by you while operating in
Primary Market? (Rank in the order of preference)

126
1. Nature and Type of Product � 2. Industry / Sector �
3. Terms of Issue � 4 Board of Directors �
5. Risk Factors associated � 6. Market sentiments �
12. Which factors do influence you to take investment decision for investment in
market?
(Rank in the order of preference)
1. Change in government policy �2. Advice of brokers �
3. Advice of dailies/periodicals �4. Advice of websites �
5. Movement of indices �6. Market sentiments �
13. What mode of trading do you prefer for Secondary Market Operations?
1. NSE terminal �2. BSE terminal �3. Stock brokers or sub brokers �
14.1 What Factors Influence Your Choice Of Mutual Fund Scheme (Please Rank
Them) (1 – 5)
1. Type of scheme �
2. Image and popularity of Asset management company (AMC) / sponsor �
3. Past performance �4. Net asset value �
5. Advertising and campaign �
14.2 Which mutual funds scheme do you prefer to invest? (Please tick)
1. Growth scheme �2. Income scheme �
3. Balanced scheme �4. Sector wise scheme �
5. Tax savings scheme �6. Index fund �
7. Special investment plan (SIP) �
15. Over All Experience Of Investors On Investment (Please Tick Any One)
1. Highly rewarding �2. Moderately rewarding �
3. Not rewarding �4. Resulted in loss �
5. Resulted in heavy loss �

127
16. Do you agree that you have knowledge about various risks arising from
investments?
1 Strongly agree� 2. ) Agree � 3. Disagree�
17.. what are your suggestions for improving the attractiveness of capital market
investment (please tick)
1. Demutualise major stock exchanges �
2. Improve transparency in investment operations �
3. Introduction of rolling settlement to more shares �
4. Control excessive speculation and price (rigging by share brokers) �
5. Give more powers to SEBI on investors protection �
6. Please specify your suggestions �
18. If you decide to move out of Capital Market Investment what will be your
next
options and why?
1. Bank �2. Real Estate �
3. Bullion Market �4. Antiquities �
5. Insurance �
Why (Please tick)
1. Safety of the principal �2. Stability of return �
3. Profitability �4. Liquidity �
5. Any other…
19.Do you agree that you would sell off your investment if you require money
right away?
1. Strongly agree� 2. Agree� 3. Disagree �
20.Do you think that you have adequate insurance coverage in case you face huge
losses in your investment?
1. Yes � 2. No�