study on reaction between h s and sulfuric acid for h
TRANSCRIPT

Study on Reaction Between H2S and Sulfuric Acid For H2 Production
From a H2S Splitting Cycle
A Thesis Submitted to the College of Graduate Studies and Research
in Partial Fulfillment of the Requirements for the
Degree of Master of Science
in the Department of Chemical and Biological Engineering
University of Saskatchewan
Saskatoon
By
Patricia da Silva Nuncio
December, 2010
© Copyright Patricia da Silva Nuncio, December 2010. All rights reserved
i
COPYRIGHT
It is my consent that the libraries of the University of Saskatchewan may make this
thesis freely available for inspection. Besides, I agree that permission for copying of this
thesis in any manner, either in whole or in part, for scholarly purposes be granted
primarily by the professor(s) who supervised this thesis work or in their absence by the
Head of the Department of Chemical Engineering or the Dean of the College of
Graduate Studies. Duplication or publication or any use of this thesis, in part or in
whole, for financial gain without prior written approval by the University of
Saskatchewan is prohibited. It is also understood that due recognition shall be given the
author of this thesis and to the University of Saskatchewan in any use of the material
therein.
Request for permission to copy or to make any other use of the material in this thesis in
whole or in part should be addressed to:
The Head
Department of Chemical Engineering
University of Saskatchewan
105 Maintenance Road
Saskatoon, Saskatchewan
S7N 5C5 Canada

ii
ABSTRACT
Because of the high demand for hydrogen in the oil industries, new technologies
for hydrogen production are being investigated. The thermochemical splitting cycle is
one of them. Among the cycles that have been investigated, sulfur-iodine (S-I) water
splitting is the most studied. In the S-I cycle, there are three reactions: H2SO4
decomposition, Bunsen reaction and HI decomposition. A new thermochemical cycle
has been developed based on the S-I cycle, which is a H2S splitting cycle. In the H2S
cycle, there are also three reactions. The only difference between S-I and H2S cycle is
that the H2SO4 decomposition reaction is replaced by a reaction between hydrogen
sulfide and sulfuric acid which produces sulfur dioxide, elemental sulfur and water.
Research on this reaction has been done for many years, studying thermodynamic,
kinetics and mass transfer. This reaction produces sulfur, sulfur dioxide and water. The
SO2 produced is the used in the second reaction in the H2S cycle; the Bunsen reaction.
The main objective of this research was to find an operating condition to increase
the production of SO2 from the reaction between H2S and H2SO4. This study
investigated different conditions such as temperature, stirring rate and sulfuric acid
concentration to maximize the production of SO2. The temperature and stirring rate
range used in the reaction were from 120 to 160°C and from 0 to 400 rpm, respectively.
The sulfuric acid concentrations were between 90 and 96 wt%. The results showed that
increasing the temperature and the acid concentration in the reaction between H2S and
H2SO4, the SO2 produced from this reaction will increase. There is no need to apply
stirring in the reaction, because the stirring will increase the surface area which allows
the produced sulfur dioxide in the gas phase to be dissolved more in sulfuric acid

iii
solution, which favors the unwanted side-reaction between SO2 and H2S. A model that
was developed to predict the partial pressure change of SO2 in closed reactor. This
model was used to compare the data between experimental and simulation through
Matlab software. The simulated data was compared to the experimental data and the
results indicated that the model fits the data satisfactorily.
Additionally, study on the separation between the remaining sulfuric acid and
produced elemental sulfur from the reaction between H2S and H2SO4 were performed.
The mixture was placed in an oven at140°C of temperature for two hours. It was found
that all small droplets of sulfur produced during the reaction between hydrogen sulfide
and sulfuric acid agglomerated and the sulfuric acid solution became clearer.

iv
ACKNOWLEDGEMENT
I would like to acknowledge many people for their encouragement and
comments during my research. First, I would like to thank my supervisor, Dr. Hui Wang
for his support, invaluable guidance and time spent in helping me to complete my work
that is shown in this thesis. I am grateful for his patience and knowledge which were a
great importance to the direction of my work.
Secondly, I would like to express my deep gratitude to the member of my
advisory committee, Dr. Richard Evitts and Dr. Catherine Niu. for their revision,
encouragement and important suggestions which greatly improved my work.
Richard Blondin, Heli, Rlee Prokopishyn and Dragan Cekie for being always
helpful and giving a good support in the experimental difficulties.
My friends Morgan and Majak for giving me their advice and their constant
support.
Finally, my endless gratitude goes to my precious Canadian family, especially
Blaine and Colleen. Their patience, support, endless love throughout these years that I
have been in Saskatoon, gave me extra strength and motivation. I deeply thank you.

v
DEDICATION
Dedicated to
My parents
For all love, support and belief in me

vi
TABLES OF CONTENTS
COPYRIGHT i
ABSTRACT ii
ACKNOWLEDGEMENT iv
DEDICATION v
TABLE OF CONTENTS vi
LIST OF TABLES ix
LIST OF FIGURES x
NOMENCLATURE xii
Chapter 1 INTRODUCTION 1
1.1 Organization of the thesis 4
Chapter 2 LITERATURE REVIEW 5
2.1 Hydrogen production from natural gas 5
2.1.1 Steam methane reforming 5
2.2 Hydrogen production from thermochemical splitting cycle 7
2.2.1 S-I water splitting cycle 7
2.2.2 H2S recovery and H2S splitting cycle 9
2.3 Studies on the reaction between hydrogen sulfide and sulfuric
acid 14
2.4 Elemental sulfur 19
2.4.1 General properties 19
2.5 Knowledge gap and research objectives 21

vii
Chapter 3 EXPERIMENTAL METHODS 23
3.1 Experimental setup and procedure for the reaction between
H2S and H2SO4 23
3.1.1 Experimental setup 23
3.1.2 Experimental procedure for H2S and H2SO4 reaction 26
3.2 Materials and procedure for analysis of sulfur and H2SO4
content 27
3.2.1 Experimental materials 27
3.2.2 Description of the extraction apparatus 28
3.2.3 Procedure of the experiment 29
3.2.4 Solid sulfur sample analysis 30
3.2.5 Sulfuric acid sample analysis 31
Chapter 4 RESULTS AND DISCUSSION 32
4.1 Reproducibility 32
4.2 SO2 production 35
4.2.1 Effect of the temperature on SO2 production 41
4.2.2 Effect of stirring rate on SO2 production 44
4.2.3 Effect of changing sulfuric acid concentration
on SO2 production 46

viii
4.3 Simulation and kinetics studies on SO2 production 48
4.4 Sulfur production 53
4.4.1 Separation between H2SO4 and elemental sulfur 53
4.4.2 Sulfur crystal structure 56
Chapter 5 Conclusions and Recommendations 58
5.1 Conclusions 58
5.2 Recommendations 59
References 61
Appendix A Calibration curves for mass flow controllers 65
Appendix B Experimental raw data 67
Appendix C Praxair Material Safety Data Sheet (MSDS) for hydrogen
sulfide and EMD Material Safety Data Sheet (MSDS) for
sulfuric acid 81

ix
LIST OF TABLES
Table 4.1 Values of estimated Henry’s law constant at different H2SO4
concentrations and different temperatures 39
Table 4.2 Final SO2 amounts in the gas and liquid phases at the given
temperature 40
Table 4.3 Final SO2 amounts in the gas and liquid phases at different H2SO4
concentrations 40
Table 4.4 Values of kp1 and kp2 51
Table B.1 Experimental data for the effect of temperature on SO2
production 67
Table B.2 Experimental data for the effect of stirring rate on SO2
production 70
Table B.3 Experimental data for the effect of sulfuric acid concentration
on SO2 production 73
Table B.4 Experimental and simulation data for kinetics analysis
SO2 production 76

x
LIST OF FIGURES
Figure 1.1 Distribution of natural gas use in oil sands recovery
and upgrading 2
Figure 2.1 Annual global hydrogen production share by source 6
Figure 2.2 Flow diagram of Amine Process Plant 10
Figure 2.3 Schematic representation of H2S-splitting cycle 13
Figure 2.4 Pressure drop against time for the reaction between H2S and
H2SO4 15
Figure 2.5 The structure of S8 20
Figure 2.6 Forms of sulfur at different temperatures 21
Figure 3.1 Experimental setup for the study of kinetic modeling from the
reaction between H2S and H2SO4 25
Figure 3.2 Drawing of glass contact apparatus 28
Figure 4.1 The reproducibility experiment. Acid concentration = 96 wt%,
stirring rate = 400 rpm and temperature = 120°C 34
Figure 4.2 GC chromatogram of SO2 after the reaction between H2S
and H2SO4 37
Figure 4.3 Solubility of SO2 at different concentrations of sulfuric acid 38

xi
Figure 4.4 Effect of the temperature on SO2 production.
Acid concentration = 96 wt. % and stirring rate = 400 rpm.
The temperature was from 120 to 160°C. 43
Figure 4.5 Arrherius plot of the reaction between H2S and H2SO4 44
Figure 4.6 Effect of the stirrer speed on SO2 production. Acid
concentration = 96 wt % and the temperature = 120°C. 46
Figure 4.7 Effect of different sulfuric acid concentrations on SO2 production.
The temperature range was 120°C. No stirring rate applied. 48
Figure 4.8 Comparison between simulation and the experimental data 52
Figure 4.9 Changes in partial pressure of H2S, SO2 and in total pressure during
the reaction between H2S and H2SO4 53
Figure 4.10 Droplets of sulfur with the solution of sulfuric acid
after reaction 55
Figure 4.11 Droplet of elemental sulfur after staying 2 hours in the
oven at 140 °C. 55
Figure 4.12 X-ray powder diffraction analysis of commercial and produced
elemental sulfur from the reaction between H2S and H2SO4 57

xii
NOMENCLATURE
A0 Preexponential factor mol s-1 m-2 Pa-1
a Surface area m2Ea Activation energy kJ mol-1
K Constant
k Reaction rate constant mol m2 s1 Pa-1
P Pressure Pa
R Gas constant J mol-1
r Reaction rate mol s-1
T Temperature K
t time s
V Volume of gas phase m3
x Variable
[SO2] Concentration of SO2 mol L-1
Subscripts
G Gas
p Pressure
total Total pressure
1 Referred as to reaction 1
2 Referred as to reaction 2

1
Chapter 1
IntroductionFossil fuels are still the main energy source worldwide. Among fossil fuels,
oil is the most important energy supply. About 36 % of the global primary energy
comes from oil (WEO, 2009).
Canada’s oil resources have one of the largest reserves of crude oil in the
world. Canada has the second largest proven oil reserve in the world, just behind
Saudi Arabia (CAPP, 2009). The Canadian oil sand, tar sand, is a mixture of sand,
water and bitumen. The bitumen can be classified as crude bitumen or extra-heavy
crude oil (CAPP, 2009). According to the Alberta Chamber of Resources (2004),
the Canadian oil sand industry is an important energy source in North America. In
2007, Canadian production averaged 2.8 million barrels per day of crude oil and it
is predicted that by 2030 the Canadian oil production will reach 4.15 million
barrels per day of oil (NEB, 2008).
Canadian oil industries have high dependency on natural gas. Expanding
Canadian oil production brings some concerns such as the high consumption of
natural gas (Yildiz and Kazimi, 2006; Söderbergh, et al. 2007). In 2007, the
average of natural gas required for oil sands operations in Canada was 32 million
m3/day at standard temperature and pressure (NEB, 2008). The dependency of oil
on natural gas will continue to increase until 2030 (Schindler and Zittel, 2007).
Natural gas is the main source for the production of hydrogen which is used for the
upgrading and refining processes of oil (Balat, 2008). According to the Alberta

2
Chamber of Resources (2004), the hydrogen used from natural gas in the oil sand
industries is 11 cubic meters (400 ft3) per barrel (Figure1.1). Moreover, natural gas
is used in the bitumen extraction process to produce heat to generate steam and to
produce electricity to be used in the operations. Two methods are applied to extract
bitumen from oil sand: in-situ and mining recovery process. For in-situ process, the
demand of natural gas is 28 cubic meters (1000 ft3) per barrel and for mining, is 7
cubic meters (250 ft3) per barrel respectively (Figure1.1). In-situ extraction process
separates the bitumen from oil sand that is underground by using steam to heat it
which allows the bitumen be pumped by a well to the surface. On the other hand, in
the mining process, the oil sand is mined from the surface by using trucks and
shovels (Lee et al., 2007 and Levi, 2009).
Figure 1.1 Distribution of natural gas use in oil sands recovery andupgrading (Alberta Chamber of Resources, 2004).

3
In the oil upgrading process, one of the main objectives of the use of
hydrogen is to remove impurities such as the sulfur (Salary et al. 2008). The sulfur
content in the Canadian bitumen is 4.8 wt% (Lee et al., 2007 and Soderberg, 2005).
The sulfur removal is achieved through the hydrodesulfurization process (HDS)
which is a catalytic process that is the reaction between different sulfur compounds
such as mercaptans (RSH) and hydrogen to produce hydrocarbons and hydrogen
(Eq.1.1) (Speight, 1990; Kabe, 1999).
RSH + H2 → RH + H2S (1.1)
The demand of hydrogen is expected to increase in oil operations, not only because
of environmental regulations, which include lowering fractions of sulfur content in
the fuel decreasing pollutant gas emission, but also for having a high quality of oil
(Granovskii et al., 2006; Kothari et al., 2008). The supply of natural gas for
hydrogen production is considered insufficient to support the increase of oil
production from oil sand (NEB, 2008; Fanchi, 2005). Due to the high demand of
hydrogen, one of the important challenges of oil industry is to find other sources for
the production of hydrogen. Efforts are underway to reduce the dependency of oil
sand industry on natural gas. A new technology, H2S thermochemical splitting
cycle, has been developed with objective of producing hydrogen by decomposing
hydrogen sulfide. For this reason, his study focuses on enhancing SO2 production.
SO2 is needed in the cycle to be used in the Bunsen reaction which produces HI.
The HI then is decomposed into H2 and I2.

4
1.1 Organization of the thesis
This thesis is organized in five chapters. Chapter 1, Introduction, gives an
overview about the Canadian oil sand, and the consumption of natural gas for the
oil sand extraction methods and the dependency of natural gas for hydrogen
production. Chapter 2, Literature Review, reviews the technologies for hydrogen
production from natural gas and thermochemical splitting cycle. In addition, the
knowledge gap and the objectives of this research are presented. Chapter 3,
Experimental Methods, describes the experimental procedure to conduct the
reaction between H2S and H2SO4 for analyzing the SO2 production through the
final partial pressure and also describes the experimental procedure for the
separation between sulfuric acid and elemental sulfur. Chapter 4, Results and
Discussion, presents the effects of changing the operating conditions on the
reaction between H2S and H2SO4 for the SO2 production, the mathematical model
that was used to predict the partial pressure change of SO2 and shows the results
about the separation between the H2SO4 and elemental sulfur. Chapter 5,
Conclusions and Recommendations, summarizes conclusions made from the
discussion and present some suggestions for further development.

5
Chapter 2
Literature Review
This chapter presents a review on the technologies for hydrogen production
from natural gas and thermochemical splitting cycles. In addition, it presents a
review on the H2S recovery process and on the H2S splitting cycle. After describing
the H2S cycle which is composed of three main reactions (H2S oxidation, Bunsen
reaction and HI decomposition), a review is given on the studies on the H2S
oxidation reaction: reaction between hydrogen sulfide and sulfuric acid. Elemental
sulfur, sulfur dioxide and water are the products of this reaction. A description
about the properties of elemental sulfur is also included.
2.1 Hydrogen production from natural gas
2.1.1 Steam methane reforming
Forty eight percent of hydrogen production comes from natural gas. Coal
and petroleum are also other sources hydrogen production and produce 30 and 18%
respectively (Figure 2.1). Steam methane reforming is the process that produces
hydrogen by reacting steam and methane at high temperature (800ºC). Methane is
the main composition of natural gas.(Gary and Handwerk, 2001).

6
Figure 2.1 Annual global hydrogen production share by source (Balat, 2008).
Hydrogen production from methane by the steam reforming involves two
reactions: the steam reforming reaction and the water-gas shift reaction. In the
steam reforming reaction, methane reacts with steam at high temperature, between
760 and 816ºC, producing carbon monoxide and hydrogen Eq. (2.1).
CH4 + H2O → CO + 3H2 (2.1)
In the water-gas shift reaction, carbon monoxide reacts with steam at lower
temperatures (343-371ºC) compared to the steam reforming reaction producing
carbon dioxide and hydrogen as shown in Eq. (2.2) (Baade et al. 2001).
CO + H2O → CO2 + H2 (2.2)
30%
Global Hydrogen Production
6
Figure 2.1 Annual global hydrogen production share by source (Balat, 2008).
Hydrogen production from methane by the steam reforming involves two
reactions: the steam reforming reaction and the water-gas shift reaction. In the
steam reforming reaction, methane reacts with steam at high temperature, between
760 and 816ºC, producing carbon monoxide and hydrogen Eq. (2.1).
CH4 + H2O → CO + 3H2 (2.1)
In the water-gas shift reaction, carbon monoxide reacts with steam at lower
temperatures (343-371ºC) compared to the steam reforming reaction producing
carbon dioxide and hydrogen as shown in Eq. (2.2) (Baade et al. 2001).
CO + H2O → CO2 + H2 (2.2)
48%
30%
18%
4%
Global Hydrogen Production
Natural Gas
Oil
Coal
Electrolysis
6
Figure 2.1 Annual global hydrogen production share by source (Balat, 2008).
Hydrogen production from methane by the steam reforming involves two
reactions: the steam reforming reaction and the water-gas shift reaction. In the
steam reforming reaction, methane reacts with steam at high temperature, between
760 and 816ºC, producing carbon monoxide and hydrogen Eq. (2.1).
CH4 + H2O → CO + 3H2 (2.1)
In the water-gas shift reaction, carbon monoxide reacts with steam at lower
temperatures (343-371ºC) compared to the steam reforming reaction producing
carbon dioxide and hydrogen as shown in Eq. (2.2) (Baade et al. 2001).
CO + H2O → CO2 + H2 (2.2)
Natural Gas
Coal
Electrolysis

7
Thus, the overall reaction for the hydrogen production from steam reforming is
CH4 + 2H2O → CO2 + 4H2 (2.3)
2.2 Hydrogen production from thermochemical splitting cycles
There has been research on the production of hydrogen from renewable
sources such as thermochemical water splitting cycle in which the water is
decomposed into hydrogen and oxygen by using intermediate elements such as Cu,
Cl, and S, through chemical reactions (Naterer et al., 2009). The energy source in a
thermochemical cycle is usually thermal energy produced by a nuclear reactor
(Vitart et al., 2006). Cycles involving the sulfur family, including the sulfur-iodine
thermochemical cycle (S-I), have been extensively studied because it is one of the
promising method in long term for large-scale production of hydrogen, because of
the prospect of a lack of fossil fuel resources (Kane and Revankar, 2008; Vitart et
al.,2006).
2.2.1 S-I water splitting cycle
The S-I water splitting process has been investigated by General Atomics
(GA), who originally proposed it, Japan Atomic Energy Agency (JAEA) and the
French Atomic Energy Commission (CEA). In this cycle, there are three main
reactions involving sulfuric and hydriodic acid as intermediates (Huang and T-
Raissi 2005). The three reactions are:

8
H2SO4 decomposition
H2SO4(g) → H2O(l) + SO2(g) + 12
O2(g) ΔH(298.15K) = 174.264 kJ (2.4)
The sulfuric acid decomposition reaction is highly endothermic and requires
a temperature between 850 and 1000ºC. Because the reaction requires a lot of heat,
normally the primary heat source is a nuclear reactor. The products of the sulfuric
acid decomposition are water, sulfur dioxide and oxygen.
The Bunsen reaction, which is composed of water, sulfur dioxide and
iodine, produces two aqueous immiscible acidic phases: sulfuric acid (upper phase)
and hydroiodic acid (lower phase). This reaction operates at 120ºC. The Bunsen
reaction is not spontaneous and requires an excess of water to make the reaction
thermodynamically favorable. In addition, excess iodine is also required to help the
process to separate the mixture into two phases.
2H2O( ) + SO2(g)+ I2(l) → H2SO4(aq)+ 2HIaq ΔH(298.15K) = - 143.846 kJ (2.5)
After hydrogen iodide is extracted from hydroiodic acid solution, it goes to
be decomposed into hydrogen and iodine. The decomposition of hydrogen iodide is
also an endothermic reaction which requires a large amount of heat.
2HI(g) → H2(g) + I2(g) ΔH(298.15K) = -52. 718 kJ (2.6)
The overall reaction is:
H2O → H2 + 12
O2 (2.7)

9
Sulfuric acid decomposition is a more endothermic reaction than hydrogen
iodide decomposition (Wang, 2007). Therefore, there is research into more energy
efficient technologies for hydrogen production.
2.2.2 H2S recovery and H2S splitting cycle
Research into finding components that can be used in alternative methods of
producing hydrogen with low cost has been extensive. Hydrogen sulfide is one of
the compounds that has been investigated for hydrogen production through
electrochemical, thermal decomposition and thermochemical processes. H2S is
produced in large quantities during hydrodesulfurization in oil production and is an
undesired by-product in the petroleum industry that needs to be removed.
H2S is removed from the hydrocarbon gas stream by passing through the
amine treating unit that includes an absorber (contactor) and a regenerator (stripper)
(Figure 2.2). In the absorber, the sour gas which contains H2S passes through an
amine solution to produce a sweetened gas stream (free of hydrogen sulfide) and
acid gas. From the top of the absorber the purified sweetened gas is produced.
From the bottom of absorber the rich amine solution (amine solution and H2S acid
gas) is sent to the regenerator after heating with a heat exchanger by hot lean amine
that comes from the bottom of regenerator. In the regenerator, from the top, the
acid gas is separated from the amine solution and is sent to the processing unit:
Claus process (Figure 2.2) (Clark, 2006; Kohl, 1997).

10
Figure 2.2 Flow diagram shows the process of removing H2S and CO2 from the gasstreams by using amine solutions (Clark, 2006).
The Claus process is a widely used technique to recover elemental sulfur
from H2S (Kohl, 1997 ). There are three main chemical reactions in the Claus
process which are:
H2S + 12O2 → H2O + S (2.8)
H2S + 32O2 → H2O + SO2 (2.9)
2H2S + SO2→ 2H2O + 3S (2.10)
The reactions occur in two stages: thermal and catalytic stages. Reaction (2.8) and
(2.9) take place in the thermal stage (reaction furnace). Reaction (2.10) takes place
in the catalytic stage (catalytic converters).
During the thermal stage, the acid gas that comes from the amine
regenerator goes through a reaction furnace where the acid gas is burned at
temperatures between 1300 and 2000ºC. Sulfur dioxide and elemental sulfur are
formed in the thermal stage. Between 60 and 70% of elemental sulfur is produced

11
in this stage. The elemental sulfur goes to a condenser and then is sent to a
container.
In the catalytic stage, the remaining hydrogen sulfide reacts with sulfur
dioxide produced in the thermal stage which produces more elemental sulfur. The
sulfur is condensed in the same manner as the thermal stage. Usually, more than
one catalytic stage is used to maximize the efficiency of hydrogen sulfide
conversion. The final step of sulfur separation involves the incineration of effluent
gas or another treating unit, such as tail-gas treating, where the gas is prepared to be
exhausted to the atmosphere (Gary and Handwerk, 2007).
Considering that hydrogen sulfide is a waste, a new process for hydrogen
production was proposed: H2S thermochemical water splitting cycle.
The H2S splitting cycle is based on the S-I themochemical cycle. The
difference is that the H2SO4 decomposition reaction from S-I cycle is replaced by
the reaction between hydrogen sulfide and sulfuric acid in the H2S splitting cycle,
which is also called H2S oxidation reaction. The H2S cycle is composed of three
main reactions which convert hydrogen sulfide into hydrogen and sulfur through
chemical reactions (Wang, 2007):
H2S oxidation
H2S + H2SO4 → S + SO2+ 2H2O ΔH(298.15K) = - 59.636 kJ (2.11)
Bunsen reaction
2H2O + I2 + SO2 → H2SO4 + 2HI ΔH(298.15K) = - 143.846 kJ (2.5)

12
HI decomposition
2HI → H2 + I2 ΔH(298.15K) = - -52.718 kJ (2.6)
The overall reaction:
H2S → H2 + S (2.12)
The reaction between hydrogen sulfide and sulfuric acid produces elemental sulfur,
sulfur dioxide and water. SO2 produced by this reaction, can also react with H2S to
form sulfur and water in a second reaction (Wang, 2007):
2H2S + SO2 → 3S + 2H2O (2.13)
Because sulfur dioxide is needed for the Bunsen reaction, the reaction between
hydrogen sulfide and sulfur dioxide is undesirable for the H2S cycle. To avoid this
reaction, the sulfuric acid solution in the H2S oxidation reaction must be at a high
concentration, between 90 and 96 wt%, because by increasing the acid
concentration, the solubility of SO2 in the sulfuric acid solution will decrease
(Zhang et al., 1998). In addition, to avoid the reaction between H2S and SO2, the
temperature of H2S oxidation reaction has to be between 120 and 150ºC. A
schematic representation of the H2S –splitting cycle is shown below (Wang, 2007):

13
Figure 2.3 Schematic representation of H2S-splitting cycle (Wang, 2007).
The reaction between H2S and H2SO4 in the H2S splitting cycle requires
lower temperature comparing to the H2SO4 decomposition reaction in the S-I cycle.
In addition, the S-I cycle uses the nuclear reactor as energy source for the heat
needed in the reactions. This cycle is considered promising in a long term because
of the prospect that the nuclear energy, in the future, will be one of the main energy
sources. On the other hand, H2S splitting cycle is based on the large quantity of
waste of hydrogen sulfide is produced nowadays in the upgrading process of oil
production. Therefore, the hydrogen produced in this cycle is a good alternative to
be used in the upgrading and refining processes in oil production in a short term.
The H2S cycle is a new area to be studied. The study of the reaction
between hydrogen sulfide and sulfuric acid has been studied for a long time. In the
next section, a review on the kinetics and mass transfer studies on the reaction
between H2S and H2SO4 will be shown.

14
2.3 Studies on the reaction between hydrogen sulfide and
sulfuric acid
As mentioned in Section 2.2.2, the reaction between hydrogen sulfide and
sulfuric acid produces three products: elemental sulfur, sulfur dioxide and water.
Early studies (Zhang et al., 2000) have investigated possible reaction
pathways for the reaction of hydrogen sulfide with sulfuric acid. After conducting
thermodynamic analysis, such as determination of the heat of reaction, ΔHrxn, and
the Gibbs free energy change, ΔGrxn, it was concluded that the probable reaction
pathways when H2S reacts with concentrated sulfuric acid are:
H2S(g) + H2SO4(l) → S(s) + SO2(g) + 2H2O(l) (2.11)
2H2S(g) + SO2(g) → 3S(s) + 2H2O(l) (2.13)
After studying the possible reactions that occur when hydrogen sulfide
reacts with concentrated sulfuric acid solutions, the kinetic studies of these two
reactions (reaction (2.11) and reaction (2.13)) were investigated. It was determined
that the reaction between hydrogen sulfide and sulfuric acid (reaction 2.11) takes
place at the gas-liquid interface. According to Wang et al (2002a) , the reaction rate
can be determined in terms of the partial pressure (PH2S) in a constant volume
reactor (Eq.2.14). In this equation, kp1 is the rate constant of the reaction between
H2S and H2SO4, a represents the surface area between the gas and liquid.
rH2S1 = kp1aPH2S (2.14)

15
The reaction rate was measured by applying initial rate method following changes
in the reaction conditions as the reaction proceeded. The method of initial rate
analysis was applied because at the moment that the reaction between H2S and
H2SO4 starts, the conditions of the reaction system are well known, such as the
liquid surface that is clear and its surface area that is also known. To measure the
reaction rate, the influence of mass transfer and diffusion effects were eliminated.
For example, the produced solid state sulfur might block the reaction surface.
Therefore the reaction rate between hydrogen sulfide and sulfuric acid was
determined by using the recorded pressure drop against time in a constant volume
(Figure 2.4).
Figure 2.4 pressure drop against time for the reaction between H2S and H2SO4. Theslope in the graph at time zero gives the initial rate of the reaction (Wang etal.2003).

16
The order of the reaction and the reaction rate were obtained by correlating
the initial rates of reaction, -rH2S, and initial partial pressure, PH2S. In the study
Wang et al. ( 2002 a), sulfuric acid concentrations ranging from 88 to 100 wt%
were reacted with hydrogen sulfide at different temperatures, between 20 and 60
ºC. The results showed that the mass transfer and diffusion in the liquid phase at
time zero were insignificant. The interfacial area was also evaluated to see its
influence on the reaction rate. The conclusion was that the reaction rate was
proportional to the interfacial area; however, the interfacial area was independent of
the volume of the acid. To determine the order of the reaction between hydrogen
sulfide and sulfuric acid, the initial reaction rate was measured using different
initial partial pressures of hydrogen sulfide at fixed temperatures and acid
concentrations. Using concentrations between 88 and 100 wt % and temperatures
from 20 to 60 ºC, the results indicated that the reaction was first order with respect
to hydrogen sulfide pressure (Wang et al. 2002 a).
Following kinetics studies, the reaction between hydrogen sulfide and sulfur
dioxide (2.13) in the sulfuric acid solution was studied. There was no reaction when
dry hydrogen sulfide reacts with sulfur dioxide, the system required moisture in
order to react with each other. In order to omit the significant interaction between
H2S and sulfuric acid, sulfuric acid concentration had to be diluted. According to
Wang 2003, decreasing the acid concentration, the reaction between hydrogen
sulfide and sulfuric acid slows down. Moreover, using acid concentrations below
65 wt%, the reaction between H2S and H2SO4will not be effective. Therefore the

17
acid concentrations used were between 30 and 60 wt. %, and the temperatures were
between 20 and 50 ºC (Wang et al. 2002 b).
Using a similar method that was applied to measure the reaction rate for
reaction (2.11), the reaction rate for the reaction between H2S and SO2 in sulfuric
acid solution was measured by plotting pressure versus time at time zero. The
reaction rate was measured at the equilibrium between the partial pressure in the
gas phase, PH2S, and the concentration of SO2 in the liquid phase [SO2], (Eq. 2.15).
In this equation, a represents the surface area between gas and liquid and k’p2 is the
rate constant.
rH2S2 = k'p2aPH2S[SO2] (2.15)
The conclusion was that the reaction between hydrogen sulfide and sulfur
dioxide in sulfuric acid solution is second order reaction: first order with respect to
both H2S and to SO2. In addition, it could be concluded that the reaction occurred
only at the surface of the acid solution. The activation energy and pre-exponential
in reaction between hydrogen sulfide and sulfur dioxide were also analyzed and
both parameters were found to be independent of the acid concentration, contrary to
that of H2S oxidation reaction (Wang et al.2002 b).
As mentioned, the effect of mass transfer was avoided in order to study the
kinetics on the reaction between hydrogen sulfide and sulfuric acid. Until now, the
thermodynamics and kinetics studies of the reaction between hydrogen sulfide and
sulfuric acid helped to identify the parameters that have influence on the reaction.
In order to estimate parameters that can help scale-up a reactor for the reaction, a
study in mass transfer properties for gas-liquid reaction was also investigated.

18
The mass transfer for the gas-liquid reaction between H2S and H2SO4 was
studied using a packed column filled with ceramic Raschig rings (Wang et al.,
2004). The analysis was based on two-film theory which showed that when the
hydrogen sulfide was transferred from the gas phase to the surface of concentrated
sulfuric acid solution in the reaction, the overall H2S mass transfer resistance
consists of the gas phase mass transfer and surface reaction. A model was used to
estimate parameters in terms of packing material and operating conditions. The
effectiveness of the model was verified by estimating gas-liquid interfacial area of
the packed column filled with ceramic Raschig rings (Wang et al., 2004)
The comparison between reaction rate constant and mass-transfer
coefficient was able to demonstrate the rate-controlling regimes in terms of acid
concentration, temperature, and acid and gas flow rates. The knowledge from this
study will be suitable for further reactor scale-up calculations and controlling
variables for the H2S splitting cycle technology. Even though, studies on the
reaction kinetics, thermodynamics and mass-transfer have been well investigated in
the reaction between hydrogen sulfide and sulfuric acid, there is still a lack of
information about one of its products, elemental sulfur. When hydrogen sulfide
reacts with sulfuric acid, sulfur is produced and stays with remaining sulfuric acid
in the reactor. Therefore, separation process is important. Consequently, it is
important that to understand the dynamics of the sulfur and sulfuric acid solution
mixing to suggest a proper separation process. Moreover, the quality of the
produced sulfur is to be investigated to establish its commercial value.

19
2.4 Elemental sulfur
2.4.1 General properties
Sulfur is a non metallic component and can be found from natural deposits
such as volcanic sources and is a by-product of oil refining processes such as
recovery of hydrogen sulfide (H2S) (Holleman and Wiberg, 2001). The sulfur
originated from natural deposits is usually extracted through the Frasch process
which uses heated water (155°C) to melt the sulfur. Using compressed air, the
melted sulfur is then brought to the surface and is either allowed to solidify into
different shapes to sell in its liquid form (Chesworth, 2008). According to
Holleman and Wiberg (2001), 40% of the world sulfur production comes from
natural deposits and the rest most of it comes from H2S recovery process (Kutney
(2007); Holleman and Wiberg (2001)). The most common process for the recovery
of hydrogen sulfide is the Claus process as mentioned section (2.2.2). Commercial
uses of sulfur are in fertilizers, matches and insecticides.
Elemental sulfur has been studied for many years due to its many different
allotropes. According to Steudel and Eckert (2003), the allotrope of an element is
the different crystal structures that the molecule can be presented. There are more
than 20 molecular forms of sulfur with cyclo-octasulfur (S8) being the most stable
form at ambient temperature and pressure. S8 has crown- shaped form and yellow
color (Figure 2.5) (Steudel and Eckert, 2003). Sulfur atoms have ability to combine
each other to form chains of indefinite length and to form ring molecules. Some of
these molecular forms have more than one crystalline phase, which are represented
by Greek letters. The crystalline phases of sulfur which consists of ring molecules

20
are usually indicated as α, orthorhombic, β and λ, monoclinic. Sulfur allotropes
consisting of chains, polymeric forms, are indentified by the Greek letters ω and ψ
(Steudel and Eckert 2003).
Figure 2.5 The molecular structure of S8 (adapted from Schmit, 1978)
Orthorhombic sulfur or α-sulfur, is the most commercialized sulfur because
of its stability at standard temperature and pressure. Upon heating, the color of
sulfur becomes darker and when the temperature reaches about 96ºC, it is slowly
converted to monoclinic sulfur, β-S8. At 120ºC, β-sulfur melts to form liquid sulfur
which is also called λ-sulfur. (Nickless 1968; Meyer 1976).
Liquid sulfur has different physical properties upon increasing temperature.
For example, at melting point, 120ºC, sulfur has a honey-yellow color with low
viscosity. The sulfur color appearance goes darker until its boiling point, 444.4ºC,
and its viscosity increases to a maximum at about 187ºC (Steudel, 2003). The
figure 2.6 shows the different forms of sulfur by increasing temperatures. A change
occurs if the molten sulfur is kept above 120ºC for hours, rings containing from 5
to 30 sulfur atoms are formed in equilibrium with each other and S8. This mixture
is called π-sulfur. If the sulfur is slowly cooled, the sulfur forms changed by an
increase in temperature will reappear in reverse order.
S5
S4
S3
S2
S1
S7S6
S8

21
Figure 2.6 Forms of sulfur at different temperatures (Wiberg, et al., 2001).
Vapor sulfur consists mainly of S8, S7 and S6 molecules. S5, S4, S3 and S2
molecules are also present on small amounts. Increasing the temperature more of
the smaller molecules are formed: the S2 atoms start to decompose into to S atoms
with temperature higher than 1800 °C (Wiberg, et al., 2001).
2.5 Knowledge gap and research objectives
Although, the H2S splitting cycle has been studied for many years, there is
still a lack of information regarding maximizing SO2 production during the H2S
oxidation step. SO2 is required for hydrogen production through the subsequent
step in the H2S splitting cycle: Bunsen reaction. Therefore, in order to increase
hydrogen production, SO2 production must be maximized.
Another important point in H2S splitting cycle is the separation of the
produced sulfur from the acid. There is no data on how well is the separation
between the produced sulfur and remaining sulfuric acid after reaction. The product
sulfur may block the reaction surface area and consequently may negatively affect
the overall hydrogen production. Hence, understanding sulfur separation during the
H2S splitting cycle is crucial.
The main objective of this research is to maximize SO2 production in the
reaction of H2S with H2SO4, by changing the acid concentration, stirring rate and
temperature. Moreover, the phase separation between sulfuric acid and the
produced elemental sulfur will receive a special attention in this study.

22
In this chapter, some background information and technologies for
hydrogen production from natural gas and thermochemical splitting cycles were
introduced. Studies on the reaction between hydrogen sulfide and sulfuric acid
were reviewed as well the properties of elemental sulfur. The reason and the
objectives for this research were also covered. The following chapter will describe
the experimental procedure for studying the reaction between H2S and H2SO4 and
for the separation between sulfuric acid and elemental sulfur.

23
Chapter 3
EXPERIMENTAL METHODS
This chapter describes the experimental setup and procedure for the reaction
between H2S and H2SO4 and for the separation between sulfuric acid and elemental
sulfur.
3.1 Experimental setup and procedure for the reaction between
H2S and H2SO4
In this report the experimental setup and procedure are detailed for the
reaction between hydrogen sulfide and sulfuric acid for the analysis of sulfur
dioxide production and kinetics modeling.
3.1.1 Experimental setup
The experiment used mini-reactor, 300 ml, made of 316 stainless steel
(Model 5500, Parr Instrument Co, Moline, IL, USA) equipped with a magnetic
stirrer drive and supplied with a glass liner. The glass liner, ID 6.35 cm, was used
to protect the cylinder (reactor) from corrosive solutions such as sulfuric acid. The
reactor was equipped with block heater which was connected to the reactor
controller (Model 4848, Parr Instrument Co, Moline, Illinois, USA). The reactor
pressure was measured using the pressure transducer (Scadasense 4102, Control
Microsystems, Kanata, ON, Canada). The temperature of the reactor was monitored
using the reactor controller. A two-stage vacuum pump (Model 15601, Robinair
Co, Owatonna, MN, USA) was used to remove the air of the reactor and the feed

24
system that was connected to the reactor. The schematic diagram of the experiment
setup is shown in the Figure 3.1.

25
Figure 3.1 Experimental setup for the study of kinetic modeling from the reaction between H2S and H2SO4.
H2S cylinder
N2 cylinder
Vent
Vacuum pump
Reactorcontroller Reactor
Gas Chromatograph
NaOH absorber
N2 Mass flowcontroller
Gas reservoir
H2S Mass flowcontroller
Computer
Pressure transmitter

26
3.1.2 Experimental procedure for H2S and H2SO4 reaction
Three different concentrations of sulfuric acid solution were used to do the
reaction runs between hydrogen sulfide and sulfuric acid: 90, 93 and 96 wt %. In
addition, three different temperatures were used in the reaction: 120, 140 and
160°C. The H2SO4 concentrations of 90 and 93 wt % were prepared by diluting 96
wt% of acid solution. The concentration of each solution was determined by
titration using 0.1N sodium hydroxide solution and 0.5 % methyl orange solution
as indicator.
A known volume and concentration of sulfuric acid solution was charged
into the reactor and after that, the reactor was connected to the system. Nitrogen gas
was used in the system to check any leaks by using Swagelok liquid leak detector
(Snoop solution). After checking that the system didn’t have any leak, the vacuum
pump was used to remove the air from the reactor and the system. The sulfuric acid
solution was then heated to a temperature of 120°C. After the temperature reached
equilibrium, the gas reservoir was filled with pure H2S from the cylinder. The
following step was to introduce H2S from the gas reservoir into the reactor and the
reaction run overnight. In the next day, the reactor was purged with nitrogen for
about 2 hours to remove any SO2 produced in the reaction between hydrogen
sulfide and sulfuric acid. Some experimental runs were performed at temperature,
120°C, and did not use impeller. After performing this part, the reactor was setup
with an impeller. The experimental runs using stirring had the same procedure as
described without it. These runs were performed at three different temperatures
(120, 140 and 160ºC) and also three different stirrer speed (100, 200 and 400 rpm).

27
The mixture of remaining acid solution after reaction and elemental sulfur
produced was transferred from the glass liner to a beaker, which was placed in the
oven at temperature of 140°C for 2 hours to remove elemental sulfur from sulfuric
acid.
After 20 minutes of reaction, it was observed that the pressure remained
constant. The constant pressure was considered the final pressure of the reaction.
The final gas phase in the reactor was analyzed using Varian CP3800 gas
chromatograph (GC) equipped with pulsed flame photometric detector (PFPD).
3.2 Materials and procedure for analysis of sulfur and H2SO4
content
The material preparation, experimental procedure, analysis method to
determine the content of sulfuric acid in contact with elemental sulfur is described
in the following sections.
3.2.1 Experimental materials
Powder elemental sulfur (99.5%, -325 mesh, Alfa Aesar, Ward Hill, MA,
USA) and 96 wt% sulfuric acid (EMD Chemicals, Gibbstown, NJ, USA) were used
in this experiment. Two different concentrations of sulfuric acid were prepared: 88
and 96 wt%. The solution of 88 wt% was prepared by diluting 96 wt% of sulfuric
acid. The concentration of the solutions were determined by titration using standard
0.1M of sodium hydroxide (Sigma-Aldrich, Oakville, ON, Canada) with 0.1%
methyl orange solution (Sigma-Aldrich, Oakville, ON, Canada) as an indicator.
The contact of sulfuric acid and elemental sulfur was performed using a glass

28
contact apparatus in an oven (Memmert UE 200, Memmert GmbH). Two different
temperatures for the experiment were performed: 120 and 140°C.
3.2.2 Description of the extraction apparatus
The contact apparatus consists of three main chambers, 1, 2 and 3 (Figure
3.2). The glass stopper is composed of a long tube immersed in sulfur and a short
tube which is immersed in sulfuric acid solution. The sulfur and sulfuric acid
extraction tubes are connected to sampling chambers. The silicone tubing is
connected to each sampling chamber.
Figure 3.2 Drawing of glass contact apparatus: 1) Contact chamber; 2) Solidsampling chamber; 3) Liquid sampling chamber; 4) Glass stopper; 5) and 6)Silicone tubing.
4

29
3.2.3 Procedure of experiment for sulfuric acid separation
The experimental procedure is described below:
(1) A known amount of sulfur powder was placed in a 25 ml beaker.
The beaker was heated in the oven until the sulfur melted.
(2) The glass stopper was detached from the contact chamber and the inner
long tube was immersed in the molten sulfur in the beaker upon removal
from the oven. The molten sulfur was allowed to cool.
(3) The glass stopper was left standing in an appropriate place at room
temperature until the sulfur inside the long tube solidified, blocking the
orifice of the tube. This procedure prevents the sulfuric acid from entering
the inner long tube when closing the contact chamber.
(4) 12.614 ± 0.002 g of sulfur powder was weighed and placed in the
contact chamber. The sulfur was then melted in the oven at 120 °C for 2.5
hours.
(5) The contact chamber was taken out of the oven and 7 ml of sulfuric acid
was introduced to the chamber. Because the sulfur turned solid on contact
with the sulfuric acid, the contact chamber had to be placed again in the
oven for 1.5 hour to re-melt the sulfur.
(6) As soon as sulfuric acid with molten sulfur was removed from the oven,
the glass stopper was placed with the contact chamber.
(7) The apparatus was returned to the oven for 2 hours.

30
(8) Using a syringe connected in each silicone tube to draw the air out,
approximately 3 ml sample of molten sulfur and 3 ml of sulfuric acid were
taken to the sampling chamber. The collected samples were then analyzed.
3.2.4 Solid sulfur sample analysis
The collected sulfur in the sampling chamber turned solid after cooling
(rapidly after removed from oven). For this reason the sulfur sample had to be
melted again to be removed from the sampling chamber.
Each sulfur sample was melted for 1.5 hour. As soon as the sulfur sampling
chamber was out of the oven, the liquid sulfur was poured into 2 weighing papers.
These samples were then weighed and labeled as sulfur #1 and sulfur #2. After,
each sample was transferred to a filter paper, placed in a Buchner funnel using an
Erlenmeyer side arm flask hooked to a vacuum filter unit. Different amount of
water was used to wash each sample. For sulfur #1, 150 ml of water was added and
for sulfur #2, 200 ml. The water then was collected from these samples and
analyzed.
The two samples of sulfur were left aside to air dry for one hour. Each
sulfur sample, #1 and #2, was placed into 25 ml beaker to be melted in the oven for
1 hour at temperature of 120°C. The samples were removed from the oven and
broken up using a stainless steel spatula to produce fine particles. The procedure of
washing the ground sulfur samples and analyzing were the same as described for
solid sulfur sample.

31
3.2.5 Sulfuric acid sample analysis
During the heating of sulfuric acid and elemental sulfur in the contact
chamber, either using temperature of 120°C or 140°C, the sulfuric acid solution
presented color changed from clear a transparent to black. According to Steudel, R.
and Eckert, B. (2003), sulfuric acid can turn black due to oxidization of an organic
compound that is incorporated in the elemental sulfur. The concentration of sulfuric
acid solutions were determined by titration.
In this chapter a detailed description about the experimental setup and
procedure for the reaction between H2S and H2SO4 was presented. Moreover, the
procedure for the separation between sulfuric acid and elemental sulfur, and the
analysis method to determine the content of sulfuric acid in contact with sulfur
were described. Chapter 4 focuses on discussing the results on the effects of
temperature, stirring rate and acid concentrations on the production of sulfur
dioxide from the reaction between H2S and H2SO4. The results on the separation
between the sulfur produced from this reaction and the remaining sulfuric acid are
also discussed.

32
Chapter 4
Results and Discussion
This chapter discusses the effects of different operating conditions on the
production of SO2 from the reaction between H2S and H2SO4 and also discusses the
results on the separation between sulfuric acid and sulfur. This chapter is divided
into 4 sections. Section 4.1 shows the reproducibility of the data with the
experiments. Section 4.2 discusses the results of different operating conditions
(temperature, stirring rate and sulfuric acid concentration) applied on SO2
production. The results on the comparison between simulation and experimental
data at specific condition are shown on Section 4.3. The results about the separation
between the sulfur produced and the remaining sulfuric acid are presented in
Section 4.4 as well the structure of the produced sulfur.
4.1 Reproducibility of data
Reproducibility of the data is important to test the reliability of the
experiment measurements. For this reason, for each specific experimental condition
(temperature, stirring rate and acid concentration) applied in the reaction between
hydrogen sulfide and sulfuric acid to analyze the SO2 production, the experiment
was repeated; the total number of experiments was 20. Figure 4.1 shows the
pressure drop from two experimental runs performed under identical conditions:
using 96 wt% of sulfuric acid solution, a temperature of 120°C and stirring speed of
400 rpm.

33
For the analysis on the separation between sulfuric acid and elemental
sulfur, two acid concentrations, 87.54 ± 0.30 wt% and 96.22 ± 1.312wt%, were
used for the experiment. Titration analysis was performed three times for each
concentration of sulfuric acid solution used in separation. The uncertainties were
analyzed using the Student t test which calculated the confidence interval at the
95% (Eq. 4.1).
x= ∑ (xi- x)2
± ( t0.95 * s = ∑ (xi - x )2
N-1) (4.1)
Where xi represents each measurement, x is the mean value and N-1 is the degree
of freedom.

34
Figure 4.1 Duplicate experiments at acid concentration = 96 wt%, stirring rate= 400 rpm and temperature = 120°C.

35
4.2 SO2 production
After 20 minutes of the reaction between H2S and H2SO4, it was observed
that the pressure remained constant. The constant pressure was considered the final
pressure of reaction. Therefore, the final gas phase in the reactor was analyzed
using gas chromatography (GC) with pulsed flame photometric detector (PFPD) to
see if only SO2 was in the gas phase. Nitrogen gas was added to a certain pressure
for two reasons: to dilute the gas in the reactor before sending to GC analysis and
to have a sufficient pressure to maintain a gas flow for GC sampling time. Because
the PFPD method was used, the N2 could not be detected; consequently, the gas
chromatography results showed that only SO2 is in the gas phase with no trace of
remaining H2S (Figure 4.2). It was assumed that the vapor pressure of sulfuric acid
solution in different concentrations was insignificant for the different temperatures
applied (120, 140 and 160ºC). According to Perry (1997), the vapor pressure of
H2SO4 solutions, at temperature of 120°C, using 90, 93 and 96 wt% are 0.571 x
10-2 bar (8.282 x 10⁻² Psi), 0.186 x 10⁻² bar (2.70 x 10⁻² Psi) and 0.851 x 10⁻³ bar
(1.234 x 10⁻²Psi) respectively.
According to Zhang et al. (2000), the amount of SO2 produced from the
reaction between hydrogen sulfide and sulfuric acid has high dependency on the
acid concentration. Increasing sulfuric acid concentration increases the efficiency
of H2S oxidation (Figure 4.3); therefore enhances the production of SO2. Zhang et
al. (1998) developed a model to correlate the solubility of SO2 in different
concentrations of sulfuric acid at different temperatures. Henry’s constant and its
dependency on temperature could be determined from this correlation. Based on the

36
data shown in Table 4.1, Henry’s law was used to determine the amount of SO2 in
the liquid phase at different temperatures for a fixed H2SO4 concentration (96 wt%)
(Table 4.2), and amount of SO2 in liquid phase at different H2SO4 concentrations
for a fixed temperature (120°C) (Table 4.3). The equation of state for an ideal gas
was used to calculate the amount of SO2 in the gas phase for different temperature
and acid concentrations (Table 4.2 and 4.3).

37
Figure 4.2 GC chromatogram of SO2 after the reaction between H2S and H2SO4.

38
Figure 4.3 Solubility of SO2 at different concentrations of sulfuric acid.
79 wt% H2SO4 and 95.91 wt% H2SO4 (Zhang et al., 2000).

39
Table 4.1 Values of estimated Henry’s Law constant at different H2SO4concentrations and different temperatures (modified from Zhang et al., 1998).
Temperature(K)
H2SO4 concentration(wt%)
HmPa (kg H2SO4 solution)/mol
298 79.01 0.29 ± 0.02
298 95.91 0.23 ± 0.01
298 97.00 0.20 ± 0.01
383 79.01 1.99 ± 0.08
383 95.91 1.46 ±0.02
393 65.71 1.46 ± 0.08
393 75.19 1.80 ± 0.02
393 79.01 2.29 ± 0.09
393 84.37 2.09 ± 0.07
393 87.72 1.61 ± 0.06
393 95.91 1.84 ± 0.09

40
Table 4.2 Final SO2 amounts in the gas and liquid phases at different temperatures
Temperature(°C)
Amount of SO2 inliquid phase
(mol/H2S mol)
Amount of SO2 yieldin gas phase
(mol/H2S mol)
Total of SO2 produced(mol/H2S mol)
120 0.439 0.259 0.698
140 0.453 0.293 0.746
160 0.484 0.361 0.845
Table 4.3 Final SO2 amounts in the gas and liquid phases with differentconcentrations of H2SO4.
H2SO4 acidconcentration
(wt%)
Amount of SO2 inliquid phase
(mol/H2S mol)
Amount of SO2 ingas phase
(mol/H2S mol)
Total of SO2produced
(mol/H2S mol)
90 0.469 0.253 0.722
93 0.510 0.285 0.795
96 0.526 0.298 0.824

41
4.2.1 Effect of the temperature on SO2 production
An investigation into the effect of temperature on the production of SO2 in
the reaction between hydrogen sulfide and sulfuric acid was conducted. Three
different temperatures were used for the analysis: 120, 140 and 160 ºC. Using
temperatures higher than 160°C would oxidize the elemental sulfur. The
experiments were carried out using sulfuric acid with the concentration of 96 wt%,
and stirring rate was 400 rpm. In Figure 4.4, it can be observed that increasing
temperature resulted in an increase in the SO2 production.
In section 2.2.2 shows that in the H2S-H2SO4 reaction system there are two
reactions: the reaction between hydrogen sulfide and sulfuric acid (2.11) and the
reaction between hydrogen sulfide and sulfur dioxide (2.13). The two reactions are
parallel with respect to H2S, but consecutive with respect to SO2. They compete for
H2S consumption. However, a relatively faster second reaction will convert more
SO2 produced by the first reaction into elemental sulfur. Wang et al. (2003), has
shown that the Gibbs free energy change of reaction (2.13), increased with
increasing temperature, while for reaction (2.11), it was not significantly affected
by the temperature changes. This means that the spontaneity of reaction (2.13)
decreases with increasing temperature, while for reaction (2.11) it is unchanged.
2H2S + SO2 → 3S + 2H2O (2.11)
H2S + H2SO4 → S + SO2 + 2H2O (2.13)
Using the experiment results and Matlab software program, the reaction
constants, kp1 and kp2, were determined (detailed approach is further discussed in
section 4.3). The natural log of k as a function of the inverse temperature represents

42
the Arrhenius plot (Figure 4.5). The Arrhenius equation gives the relationship the
temperature and the reaction rate constant (Eq 4.2).
k = A0exp - EaRT
(4.2)
Where A0 is preexponential factor, Ea is activation energy, R is the gas constant
and T is the absolute temperature.
Figure 4.5 highlights two important findings: the rate constant of reaction
(2.11) is larger than that of reaction (2.13), and the increase of the rate constant of
reaction (2.11) with the increasing temperature is greater than that on reaction
(2.13). The activation energies and pre-exponential factors of reaction (2.11) and
reaction (2.13) are 40.1 kJ/mol and 3.6 x 10⁻² mol s-1m-2Pa-1 and 10.8 kJ/mol and
6.7x10⁻¹¹ mol s-1m-2Pa-1, respectively. The increase in temperature accelerates more
the reaction between H2S and H2SO4 (2.11) than the reaction between H2S and SO2
(2.13), resulting in more net SO2 production.

43
Figure 4.4 Effect of the temperature on the final SO2 production. Acidconcentration = 96 wt % and stirring rate = 400 rpm. Data recorded everysecond. The graph shows that increasing temperature, the final SO2 partialpressure also increases. Therefore, the optimum temperature is 160ºC.

44
Fig 4.5 Arrherius plot of the reaction between H2S and H2SO4. The figureshows that the increase on temperature affects more the rate constant of thereaction between H2S and H2SO4 than the reaction between H2S and SO2.
4.2.2 Effect of stirring rate on SO2 production
To study the effect of stirring rate on the SO2 production in the reaction
between hydrogen sulfide and sulfuric acid, experiments were performed using
constant temperature and acid concentration of 120ºC and 96 wt. %, respectively.
Four stirring rates were considered: 0, 100, 200, and 400 rpm. The maximum of
stirring rate that could be used in the reactor was 500 rpm that was not used in the
reaction because some of sulfuric acid solution would splash out of the reactor. As
shown in Figure 4.6, increasing stirring rate led to lower SO2 production. As the
stirring rate was increased from 0 to 100 rpm the final SO2 partial pressure
decreased from 2.61 x 10⁵ Pa to 2.14 x 10⁵ Pa. Further increases in stirring rate did
not result in significant decreases in the final SO2 partial pressure.
y = -4828,2x - 3,3265R² = 0,9848
y = -1295,8x - 23,426R² = 0,9982
-28
-26
-24
-22
-20
-18
-16
-140,00225 0,0023 0,00235 0,0024 0,00245 0,0025 0,00255 0,0026
ln(k
)
1/T (K)
ln(kp1)vs. 1/T
ln(kp2) vs.1/T

45
The effect of stirring rate can be attributed to variation on the reaction
surface area. The surface area was calculated based on the initial rate data. The
surface area when there was no stirring was calculated to be 2.55x10⁻³ m2, and for
the stirring rate of 100, 200, 400 rpm, it was determined to be ~ 4.56x10⁻³ m2; the
applied stirring caused a ~1.8 fold increase in the surface area.
Reaction (2.13) takes place between H2S and dissolved SO2 (Wang et al.,
2002b). SO2 has higher dissolution, in H2SO4 (Zhang et al., 1998); hence, due to
the low dissolution rate of H2S the reaction is bound to take place primarily at the
gas-liquid interface. As shown above, increasing stirring rate results in an
enlargement of this interface, and consequently, higher rate of reaction (2.13) and
ultimately lower SO2 production.

46
Figure 4.6 Effect of the stirrer rate on SO2 production. Acid concentration= 96 wt%. Temperature = 120⁰C. Data recorded every second. By no applyingstirring rate, the final SO2 partial pressure increased. The final SO2 partialpressure decreased when the stirring rate was from 100 to 400 rpm due to theincrease of the surface area.
4.2.3 Effect of changing sulfuric acid concentration on SO2
production
The effect of acid concentration on SO2 production was studied. Three
different concentrations of sulfuric acid solution were used to do the reaction runs
between hydrogen sulfide and sulfuric acid: 90, 93 and 96 wt %. These acid
concentrations were chosen because, based on previous studies, higher
concentration of sulfuric acid will decrease the solubility of SO2 in the liquid. The
experiments were performed at temperature of 120 ºC; no stirring was applied.
Time (s)
0 500 1000 1500 2000 2500
Pres
sure
(Pa)
0
1e+5
2e+5
3e+5
4e+5
5e+5
6e+5
No stirring100 RPM200 RPM400 RPM

47
Figure 4.7 shows that increasing acid concentration resulted in an increase SO2
production. Wang et al. (2002a) has shown that, at the acid concentration range of
90 to 96 wt. %, the rate of reaction 2.11 (between H2S and H2SO4) increases with
increasing acid concentration, while that of reaction 2.13 (between H2S and SO2) is
not significantly affected. Accordingly, it can be seen in the first segment of Figure
4.7 (<500 second) that higher pressure drop, reflecting higher reaction rate, is
observed as the acid concentration is increased.
Since, reaction (2.11) is enhanced as the acid concentration is increased;
more H2S is consumed via this reaction pathway, consequently, the amount of H2S
consumed by reaction (2.13) pathway decreases. Therefore, the overall effect of
increasing sulfuric acid concentration is an increase in SO2 production.

48
Figure 4.7 Effect of different sulfuric acid concentrations on SO2 production.Temperature = 120°C. No stirring rate applied. Data recorded every second.Higher the sulfuric acid concentration, higher is the pressure drop and reactionrate which will increase the final partial pressure.
4.3 Simulation and kinetic studies on SO2 production
The studies on kinetics of the two reactions (reaction (2.11) and reaction
(2.13)) that are involved in the H2S-H2SO4 system established the rate equation
(Eq. 2.14 and Eq. 2.15) for each of the reactions (Wang et al., 2002a and Wang et
al., 2002b).
H2S + H2SO4 → S + SO2 + 2H2O (2.11)
2H2S + SO2 → 3S + 2H2O (2.13)

49
As mentioned through the kinetics, the dependency on sulfuric acid concentrations
was determined on both reactions. In the reaction between hydrogen sulfide and
sulfuric acid, the reaction behaves as first order with respect to H2S. In addition, the
acid concentration affects the reaction rate on this reaction and in the reaction
between H2S and SO2.
rH2S1= kp1aPH2S (2.14)
rH2S2 = kp2aPH2S[SO2] (2.15)
Based on the rate equations (Eq.2.14 and Eq. 2.15), Wang (2003) developed a
mathematical model to predict the partial pressure of SO2 change in closed reactor
system. The model was used in the experiment to investigate if can be used in a
different reactor. The simulated result was compared with the experimental results
used on the section for effect of temperature on SO2 production (section 4.2.1),
which different temperatures were applied (120, 140 and 160°C), and the stirring
rate and the acid concentration were maintained at 400 rpm and 96 wt%,
respectively.
Ignoring sulfuric acid evaporation, it was assumed that the gas phase
comprises of H2S and SO2. Hydrogen sulfide is consumed by both reactions, while
SO2 is produced by reaction (2.11) and consumed by reaction (2.13). In addition
other assumptions were made such as the effect of the heat of the reaction is
ignored and the temperature during the measurement is constant; the amount of
water produced in the reaction is ignored and the change of sulfuric acid
concentration is insignificant; the produced sulfur does not block the surface under

50
strong stirring and the interfacial area is not changed during the measurement and
the mass transfer effect is negligible. Therefore, the changes of H2S and SO2 partial
pressures with time can be described by equations (4.3) and (4.4) (Wang, 2003).
dx1dt
= -K (kp1x1 + kp2x1x2) (4.3)
dx2dt
= K (kp1x1 - 12
kp2x1x2) (4.4)
Where:
K = RTGaVG
(4.5)
PH2S = x1
PSO2= x2
The boundary conditions are,
At t = 0, x1= initialP ; x2 = initial P = 0
The parameters K, kp1 and kp2 (Eq. (4.3), (4.4), (4.5)), respectively, are
constants that are independent of time. The temperature and volume of the gas
phase in the experiment, TG and VG, were constant.
The value of K, 7200 Pa m2 mol-1, was calculated through the equation 4.5. The
rate constant of reaction between H2S and H2SO4 (reaction (2.11)) and the reaction
between H2S and SO2 (reaction (2.13)) are kp1and kp2 , respectively. The initial
guess values for kp1and kp2 in the simulation were obtained from Wang (2003).
Using Matlab, the values of kp1and kp2were adjusted such that the simulated values
fit the experimental results (Table 4.4).

51
The comparison between the simulated and the experimental data is
presented in Figure 4.8, indicating a good fitness of the model.
Figure 4.9 shows the partial pressure for H2S and SO2 during the reaction
with sulfuric acid, 96 wt%. Through the simulation results, a graph could be built to
show the partial pressure of H2S and SO2 and the total pressure. The partial
pressure of H2S decreases with time until becomes zero, while the partial pressure
of SO2 increases with time until it reaches steady state. The total pressure is the
sum of the changes of H2S and SO2 partial pressures. This indicates that the final
gas is purely made of SO2 and this fact is confirmed by the GC results.
Table 4.4 Values of kp1and kp2 . The kp1and kp2 were determined by usingMatlab Tm program (R2 = 0.9992)
Temperature0(°C)
kp1mol s-1m-2Pa-1
kp2mols s-1m-2Pa-1
120 1.73 x 10⁻⁷ 2.473 x 10⁻¹²
140 2.784 x 10⁻⁷ 2.933 x 10⁻¹²
160 5.406 x 10⁻⁷ 3.352 x 10⁻¹²

52
Figure 4.8 Comparison between simulation and the experimental data. Theexperimental data was taken from the experiment which applied differenttemperatures (120, 140 and 160ºC) in the reaction between H2S and H2SO4 toanalyzed final SO2 partial pressure. This figure shows that the model fits the datawell.
Time (s)
0 500 1000 1500 2000 2500
Pres
sure
(Pa)
0
105
2x10⁵
3x10⁵
4x10⁵
5x10⁵
6x10⁵
Exp 160oCSim 160oCExp 140oCSim 140oCExp 120oCSim 120oC

53
Figure 4.9 Changes in partial pressure of H2S, SO2 and in total pressure duringthe reaction between H2S and H2SO4. Through the simulation results this graphwas built for the total pressure and for the partial pressure of H2S and SO2.
4.4 Sulfur production
4.4.1 Separation between H2SO4 and sulfur
The sulfur produced after the reaction between hydrogen sulfide and
sulfuric acid, stays with the remaining sulfuric acid. To investigate the separation
between H2SO4 solution and sulfur, the solution of sulfuric acid was heated with
commercial elemental sulfur in the contact chamber, using a temperature of 120ºC.
After collecting the sulfur from the sampling chamber, it was washed and the water
used for washing was analyzed by titration. The collected molten sulfur samples

54
did not show trace of acid solution. Titration results of the water samples collected
from washing the molten sulfur samples indicated neutral solutions; hence, absence
of acid content.
The change of the acid concentration using 88 and 96 wt% were analyzed
after the contacting experiments and the results of each concentration were 97.13
±0.34 wt% and 88.38 ± 0.07 wt%, respectively. The comparison between the acid
concentration before and after the experiment showed that the sulfuric acid
concentrations did not change significantly from their initial values. Therefore, it
can be concluded that there are not change of sulfuric acid concentration after being
in contact with elemental sulfur in the oven for two hours.
An analysis using the produced elemental sulfur with downgraded sulfuric
acid from the reaction between hydrogen sulfide and sulfuric acid was conducted.
During the reaction, droplets of sulfur were formed and stayed in the bottom of the
reactor in the solution of sulfuric acid (Figure 4.10) due to the sulfur being
hydrophobic. After the reaction, this two-phase mixture was transferred to a beaker
and was taken to the oven for two hours at 140°C. Through this analysis, the
sulfuric acid solution became clearer than before going to the oven. In addition, the
droplets of elemental sulfur agglomerate forming one large droplet (Figure 4.11).
Therefore, through the heating process there is good separation between elemental
sulfur and sulfuric acid solution.

55
Figure 4.10 Droplets of sulfur with the solution of sulfuric acid after reaction.
Figure 4.11 Droplet of elemental sulfur after staying 2 hours in the oven at
140 °C.
Dropletsof sulfur
Droplet ofsulfur

56
4.4.2 Sulfur crystal structure
According to Steudel and Eckert (2003), elemental sulfur has many
allotropes, Sα, orthorhombic sulfur, is the one that is commercially available. After
analyzing the separation between remaining sulfuric acid solution and sulfur, the
structure of produced elemental sulfur was investigated. The objective was to
compare the crystal structure between commercial sulfur and the sulfur produced
from the reaction between sulfuric acid and hydrogen sulfide. The sulfur samples
were taken to be evaluated in crystallography. The samples could not be analyzed
through the crystallography because single crystals of sulfur could not be found; for
this reason the samples were analyzed using X-ray powder diffraction (XRD)
which is used for very small crystallites. The results indicated that the crystal
structure of commercial and produced elemental sulfur presented the same
structure, α-sulfur (Figure 4.12).

57
Figure 4.12 X-ray powder diffraction analysis of commercial and producedelemental sulfur from the reaction between H2S and H2SO4. The graph shows thatthe produced elemental sulfur has the same structure of the commercial sulfur,therefore orthorhombic sulfur.

58
Chapter 5
Conclusions and Recommendations
5.1 Conclusions
The main objective of this thesis was to investigate different operating
conditions such as temperature, stirring rate and acid concentration to maximize
SO2 production in the reaction between hydrogen sulfide and sulfuric acid. In
addition, the phase separation between remaining sulfuric acid after reaction and
produced elemental sulfur were analyzed. According to the experimental results,
the following conclusions are made:
1. Increasing the temperature in the reaction between H2S and H2SO4
increased the SO2 production.
2. There is no need for applying stirring in the reaction between H2S and
H2SO4 in a close reactor system. The experimental results showed that more
SO2 was produced when no stirring was applied.
3. Higher initial H2SO4 acid concentration for the reaction between H2S and
H2SO4 resulted in more SO2 production.
4. There is a good fit when the experimental was compared with simulated
data using the two equation models (4.3 and 4.4). These equations can
simulate the partial pressure change of hydrogen sulfide and sulfur dioxide
dx1dt
= -K (kp1x1+ kp2x1x2) (4.3)
dx2dt
=K (kp1x1- 12
kp2x1x2) (4.4)

59
5. There is no sulfuric acid content in elemental sulfur after the reaction
between H2S and H2SO4 reaction. There is a good separation between
sulfuric acid and elemental sulfur after being heated.
6. According to X-ray diffraction analysis, elemental sulfur produced in H2S-
H2SO4 reaction has the same structure as the commercial elemental sulfur,
α-sulfur.
5.2 Recommendations
The parameters to maximize the production of SO2 on the reaction between
hydrogen sulfide and sulfuric acid were investigated. Further investigation needs to
be conducted to see to integrate the sulfur dioxide produced into the following
reaction, Bunsen reaction. In addition,
The study on the separation between remaining sulfuric acid and produced
elemental sulfur showed that the two components separate well after being heated.
Further research on the type of separator equipment and its material needs to be
investigated; moreover because sulfuric acid is also produced in the Bunsen
reaction, a study on how integrate both of acid solutions to be reused in the H2S
splitting cycle and how many times can be used on the reaction between hydrogen
sulfide and sulfuric acid.
The analysis on structure of produced elemental sulfur from the reaction
between H2S and H2SO4 showed that it can be commercialized. The literature
indicates that Canada is one of the countries that has high production on sulfur.

60
Research on use of the produced elemental sulfur from this reaction to be converted
into SO2 is suggested and also how the elemental sulfur will be stored.

61
References
Baade, W. F., Parekh, U. N. and Raman, V. S. “Hydrogen.” Kirk-Othmer
Encyclopedia of Chemical Technology, John Wiley and Sons, New York,
(2001).
Balat, M. “Potential importance of hydrogen as a future solution to environmental
and transportation problems.” International Journal of hydrogen Energy,
33(15), 4013-4029 (2008).
Cheswoth. W. “Encyclopedia of soil science.” Springer, Netherlands, (2008).
Clark, P. D. “ Sulfur and hydrogen sulfide recovery.” Kirk-Othmer Encyclopedia of
Chemical Technology, John Wiley and Sons, New York, (2006).
Fanchi, J. R. “Energy in the 21st century.” World Scietific, Hackensack, (2005).
Gary, J. H. and Handwerk,G. E. “Petroleum refining: technology and economics.”
M.Dekker, New York, (2001).
Gary, J. H. and Handwerk, G. E. “Petroleum refining: technology and economics.”
M.Dekker, New York, (2007).
Granovskii, M., Dincer, I. and Rosen, M. A. “Environmental and economic aspects
of hydrogen production and utilization in fuel cell vehicles.” Journal of
Power Sources, 157(1), 411-421, (2006).
Holleman, A. F. and Wilberg, E. “ Inorganic chemistry.” Academic Press, Berlin,
(2001).
Huang, C. and A.T-Raissi. “Analysis of sulfur-iodine thermochemical cycle for
solar hydrogen production. Part I: decomposition of sulfuric acid.” Solar
Energy, 78(5), 632-646, (2005).

62
Kabe, T., Qian, W. and Ishihara, A. “Hydrodesulfurization and
hydrodenitrogenation: chemistry and engineering.” Wiley-VCH, New York,
(1999).
Kane, C. and Revankar, S. T. “Sulfur-iodine thermochemical cycle: HI
decomposition flow sheet analysis.” International Journal of Hydrogen
Energy, 33(21), 5996-6005, (2008).
Kohl, A. L. and Nielsen, R. “Gas purification.” Gulf Publications, Houston,
(2007).
Kothari, R., Buddhi, D. and Sawhey,R. L. “Comparison of environmental and
economic aspects of various hydrogen production methods.” Renewable
and Sustainable Energy Reviews, 12(2), 553-563, (2008).
Kutney, G. “Sulfur: history, technology, applications and industry.” ChemTec
Publishing, Toronto, (2007).
Lee, S., Speight, J. G. and Loyalka, S. K. “Handbook of alternative fuel
technologies.” CRC Press, USA, (2007).
Levi, M. A. “The Canadian oil sands: energy security vs. climate change.” Council
on Foreign Relations, USA, (2009).
Naterer, G., Suppiah, S., Lewis, M. and Gabriel, K., Dincer, I., Rosen, M. A.,
Fowler, M., Rizvi, G., Easton, E.B. and Ikeda, B. M. “Recent Canadian
adances in nuclear-based hydrogen production and the thermochemical Cu-
Cl cycle.” International Journal of Hydrogen Energy, 34(7), 2901-2917,
(2009).
Nickless, G. “Inorganic sulphur chemistry.” Elsevier Publication Company, New
York-Amsterdam, (1968).
Perry, R.H. “Perry’s chemical engineers’ handbook”. McGraw-Hill, New York,
(1997).

63
Salary, R., Nasr, J., Reza, M., Amidpour, M. and Kamalinejad, M. “Design of oil
refineries hydrogen network using process integration principles.” Iran
Journal of Chemistry and Chemical Engineering, 27(4), 1-16, (2008).
Schindler, D. K. J. and Zittel, W. “Crude oil- the supply outlook.” Energy Watch
Group, 1-101, (2007)
Schmidt, M. “The scientific basis for pratical application of elemental sulfur”.
Advances in Chemistry, 165, (1978).
Soderbergh, B., Robelius, F. and Aleklett, K. “ A crash programme scenario for the
Canadian oil sands industry.” Energy Policy, 35(3), 1931-1947, (2007).
Soderbergh, B. “Canada’s oil sands resources and its future impact on global oil
supply.” MSc. Thesis, Uppsala University, Australia, (2005).
Speight, J. G. “Fuel science and technology handbook.” M.Dekker, New York,
(1990).
Steudel, R. “Liquid sulfur.” Topics in Current Chemistry, 230, 81-116, (2003).
Steudel, R. and Eckert, B. “Solid sulfur allotropes.” Topics in Current Chemistry,
230, 1-80, (2003).
Vitart, X., Le Duigou, A. and Carles, P. “Hydrogen production using the sulfur-
iodine cycle coupled to a VHTR: an overview.” Energy Conversion and
Management, 47(17), 2740-2747, (2006).
Wang, H., Dalla Lana, I. G. and Chuang, K. T. “Kinetics and mechanism of
oxidation of hydrogen sulfide by concentrated sulfuric acid.” Industrial and
Engineering Chemistry Research, 41(26), 6656-6662, (2002a).
Wang, H., Dalla Lana, I. G. and Chuang, K. T. “Kinetics of reaction between
hydrogen sulfide and sulfur dioxide in sulfuric acid solutions.” Industrial
and Engineering Chemistry Research, 41(19), 4707-4713, (2002b).

64
Wang, H., “A study of the gas-liquid reaction system of hydrogen sulfide and
sulfuric acid.” Ph.D. Thesis, University of Alberta, Canada, (2003).
Wang, H. “Hydrogen production from a chemical cycle of H2S splitting.”
International Journal of Hydrogen Energy, 32(16), 3907-3914, (2007).
Yildiz, B. and Kazimi, M. S. “Efficieny of hydrogen production system using
alternative nuclear energy technologies.” International Journal of hydrogen
Energy, 31(1), 77-92, (2006).
Zhang, Q., Wang, H., Dalla Lana, I. G. and Chuang, K. T. “Solubility of sulfur
dioxide in Sulfuric acid of high concentration.” Industrial and Engineering
Chemistry Research, 37(3), 1167-1172, (1998).
Zhang, Q., Dalla Lana, I. G., Chuang, K. T. and Wang, H., “Reactions between
hydrogen sulfide and sulfuric acid: a novel process for sulfur removal and
recovery.” Industrial and Engineering Chemistry Research, 39(7), 2505-
2509, (2000).
Web sites:
Alberta Chamber of Resources, (2004). “Oil sands technology roadmap.”Acessed:
October, 2010, http://www.acr-alberta.com/OSTR_report.pdf .
CAPP (Canadian Association of Petroleum Producers), (2009). “Canadian oil and
natural gas overview and outlook.” Acessed: October, 2010.
http://www.capp.ca/library/presentations/Pages/default.asp#JoyqKKul459F
NEB (The Canadian National Energy Board), (2008). “Canadian energy overview.”
Acessed: October, 2010. http://www.neb-one.gc.ca/clf-
nsi/rnrgynfmtn/nrgyrprt/nrgyvrvw/cndnnrgyvrvw2008/cndnnrgyvrvw2008-
eng.pdf

65
APPENDICES
Appendix A: Calibration curves for mass flow controllers
Figure A.1: Calibration curve for mass flow controller 5850S
(maximum flow: 1000mL/min).
R² = 0.9999
0
50
100
150
200
250
300
350
0 50 100 150 200 250 300 350
Act
ual F
low
(ml/m
in)
Reading Flow (ml/min)
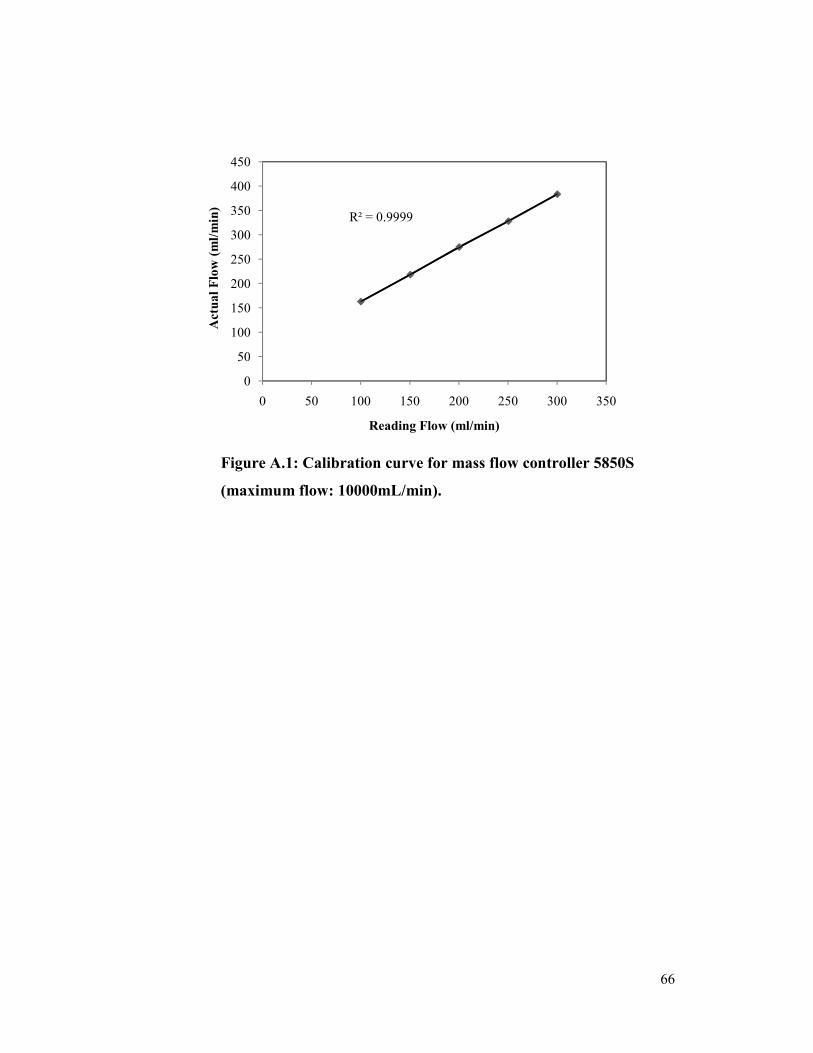
66
Figure A.1: Calibration curve for mass flow controller 5850S
(maximum flow: 10000mL/min).
R² = 0.9999
0
50
100
150
200
250
300
350
400
450
0 50 100 150 200 250 300 350
Act
ual F
low
(ml/m
in)
Reading Flow (ml/min)

67
Appendix B: Experimental raw data
The reading for the pressure for each experimental condition (temperature, stirring
rate and acid concentration) was through the transducer in which the unit of the
pressure was in Psi. Because the transducer read the pressure for every second, the
tables with experimental raw data presented in this appendix only shows the first 60
seconds after the reaction between H2S and H2SO4 started to save space.
Table B1: Experimental data for the effect of temperature on SO2 production
Temperatures(ºC)
120 140 160Time
(s)Pressure
(Psi)Pressure
(Psi)Pressure
(Psi)0 60.702 60.677 60.769
1 45.623 57.029 39.336
2 36.197 36.785 36.720
3 35.817 36.217 36.500
4 35.960 36.022 36.390
5 35.658 36.106 36.491
6 35.165 36.181 36.630
7 34.784 36.083 36.832
8 34.432 36.422 37.123
9 33.842 36.731 37.347
10 33.732 36.777 37.741
11 33.166 36.987 37.923
12 32.886 37.170 38.053
13 32.689 37.118 38.457
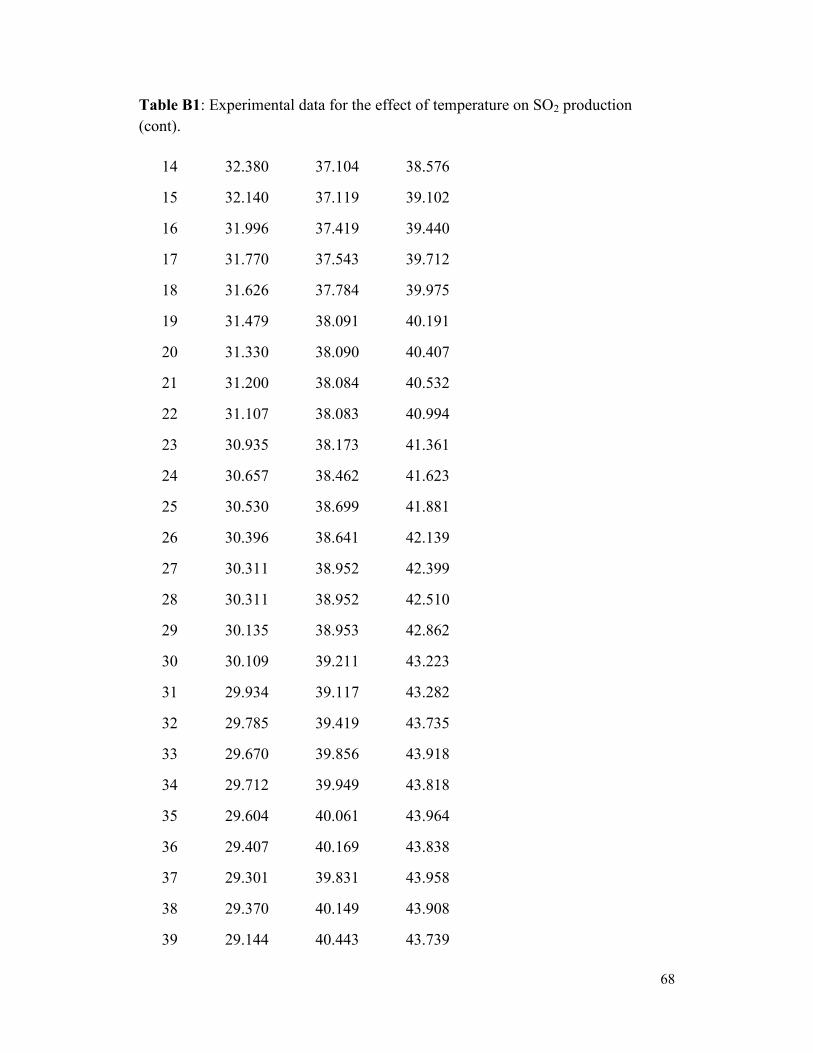
68
Table B1: Experimental data for the effect of temperature on SO2 production(cont).
14 32.380 37.104 38.576
15 32.140 37.119 39.102
16 31.996 37.419 39.440
17 31.770 37.543 39.712
18 31.626 37.784 39.975
19 31.479 38.091 40.191
20 31.330 38.090 40.407
21 31.200 38.084 40.532
22 31.107 38.083 40.994
23 30.935 38.173 41.361
24 30.657 38.462 41.623
25 30.530 38.699 41.881
26 30.396 38.641 42.139
27 30.311 38.952 42.399
28 30.311 38.952 42.510
29 30.135 38.953 42.862
30 30.109 39.211 43.223
31 29.934 39.117 43.282
32 29.785 39.419 43.735
33 29.670 39.856 43.918
34 29.712 39.949 43.818
35 29.604 40.061 43.964
36 29.407 40.169 43.838
37 29.301 39.831 43.958
38 29.370 40.149 43.908
39 29.144 40.443 43.739

69
Table B1: Experimental data for the effect of temperature on SO2 production(cont).
40 29.047 41.012 43.629
41 29.087 41.295 43.546
42 28.995 41.793 43.434
43 28.805 42.261 43.367
44 28.693 42.974 43.015
45 28.661 43.441 43.219
46 28.555 43.906 43.111
47 28.502 44.273 42.792
48 28.406 41.951 42.975
49 28.446 41.623 42.901
50 28.257 41.664 42.854
51 28.171 41.516 42.547
52 28.243 41.722 42.740
53 28.041 41.670 42.662
54 28.017 41.615 42.640
55 27.934 41.773 42.314
56 27.904 41.775 42.499
57 27.826 41.775 42.455
58 27.780 42.029 42.392
59 27.740 42.189 42.336
60 27.694 42.103 42.032

70
Table B2: Experimental data for the effect of stirring rate on SO2 production.
Stirring speed
No stirring 100 RPM 200 RPM 400 RPMTime
(s)Pressure
(Psi)Pressure
(Psi)Pressure
(Psi)Pressure
(Psi)0 56.089 60.571 60.421 61.498
1 49.583 36.015 35.172 42.890
2 31.614 35.626 35.192 35.683
3 30.742 35.381 35.080 35.585
4 29.902 35.291 33.866 34.446
5 29.233 33.777 33.120 33.552
6 28.682 32.773 32.417 32.177
7 28.164 32.143 31.754 31.254
8 27.940 31.142 30.559 30.462
9 27.486 31.065 29.669 29.736
10 27.101 30.363 28.940 28.807
11 26.902 30.015 28.243 27.778
12 26.715 28.970 27.711 27.619
13 26.462 28.105 26.960 26.541
14 26.149 27.424 26.601 25.755
15 26.099 26.898 25.678 25.144
16 25.779 26.278 25.490 24.595
17 25.691 25.549 24.627 24.242
18 25.524 25.201 23.898 23.472
19 25.357 24.437 23.512 23.024
20 25.216 23.797 23.040 22.294

71
Table B2: Experimental data for the effect of stirring rate on SO2 production (cont).
21 25.065 23.266 22.708 21.638
22 24.965 22.679 22.182 21.285
23 24.819 22.205 21.926 20.627
24 24.776 21.875 21.267 20.363
25 24.742 21.610 20.877 19.919
26 24.567 20.934 20.620 19.594
27 24.379 20.563 20.110 19.052
28 24.301 20.012 19.841 18.614
29 24.216 19.754 19.475 18.373
30 24.125 19.264 19.026 17.821
31 23.908 18.973 18.742 17.552
32 23.930 18.700 18.162 17.223
33 23.774 18.046 17.972 16.966
34 23.659 17.856 17.613 16.529
35 23.718 17.609 17.436 16.176
36 23.609 17.318 17.030 15.878
37 23.406 16.904 16.861 15.584
38 23.457 16.626 16.426 15.349
39 23.250 16.481 16.161 14.953
40 23.316 16.041 15.899 14.795
41 23.234 15.944 15.597 14.488
42 23.196 15.509 15.401 14.279
43 23.098 15.318 15.067 13.924
44 22.898 15.132 14.972 13.671
45 22.970 14.832 14.595 13.440
46 22.770 14.682 14.397 13.125

72
Table B2: Experimental data for the effect of stirring rate on SO2 production (cont).
47 22.848 14.380 14.229 13.032
48 22.659 14.255 13.971 12.703
49 22.725 13.970 13.805 12.589
50 22.543 13.796 13.459 12.294
51 22.622 13.602 13.289 12.094
52 22.398 13.250 13.070 11.837
53 22.475 13.131 12.907 11.565
54 22.307 12.989 12.725 11.487
55 22.362 12.848 12.547 11.221
56 22.191 12.675 12.406 11.111
57 22.139 12.419 12.169 10.758
58 22.233 12.288 12.006 10.643
59 22.032 12.105 11.771 10.473
60 22.122 11.884 11.641 10.278

73
Table B3: Experimental data for the effect of sulfuric acid concentration on SO2production.
Sulfuric acid concentration
90 wt% 93 wt% 96 wt%
Time (s) Pressure(Psi)
Pressure(Psi)
Pressure(Psi)
0 60.305 60.467 56.089
1 47.965 45.392 49.583
2 35.060 34.853 31.614
3 35.093 34.895 30.742
4 35.187 34.749 29.902
5 35.387 34.495 29.233
6 35.481 33.786 28.682
7 35.295 33.459 28.164
8 35.282 32.550 27.940
9 35.177 32.067 27.486
10 35.081 31.839 27.101
11 34.755 31.402 26.902
12 34.579 31.242 26.715
13 34.485 30.935 26.462
14 34.068 30.792 26.149
15 33.859 30.487 26.099
16 33.626 30.365 25.779
17 33.692 30.098 25.691
18 33.224 29.796 25.524
19 33.154 29.749 25.357
20 32.880 29.420 25.216

74
Table B3: Experimental data for the effect of sulfuric acid concentration on SO2production (cont).
21 32.713 29.291 25.065
22 32.561 29.213 24.965
23 32.404 29.115 24.819
24 32.263 28.807 24.776
25 32.109 28.664 24.742
26 32.033 28.550 24.567
27 31.780 28.402 24.379
28 31.652 28.309 24.301
29 31.546 28.143 24.216
30 31.485 28.098 24.125
31 31.262 27.966 23.908
32 31.153 27.816 23.930
33 31.070 27.864 23.774
34 30.885 27.652 23.659
35 30.828 27.549 23.718
36 30.653 27.467 23.609
37 30.554 27.396 23.406
38 30.432 27.268 23.457
39 30.307 27.156 23.250
40 30.216 27.093 23.316
41 30.069 26.994 23.234
42 30.069 26.915 23.196
43 29.875 26.806 23.098
44 29.770 26.775 22.898
45 29.718 26.669 22.970
46 29.597 26.588 22.770

75
Table B3: Experimental data for the effect of sulfuric acid concentration on SO2production (cont).
47 29.562 26.522 22.848
48 29.443 26.441 22.659
49 29.266 26.372 22.725
50 29.260 26.310 22.543
51 29.179 26.139 22.622
52 29.104 26.172 22.398
53 28.997 26.122 22.475
54 28.965 26.039 22.307
55 28.863 25.976 22.362
56 28.814 25.923 22.191
57 28.699 25.845 22.139
58 28.503 25.825 22.233
59 28.553 25.747 22.032
60 28.459 25.714 22.122

76
Table B4: Experimental and simulation data for kinetics analysis SO2 production.
Temperatures(ºC)
120 140 160Experimental
dataSimulation
dataExperimental
dataSimulation
dataExperimental
dataSimulation
dataTime (s) Pressure (Psi) Pressure (Psi) Pressure (Psi) Pressure (Psi) Pressure (Psi) Pressure (Psi)
0 61.498 61.498 60.006 60.006 60.352 60.352
1 42.890 61.433 34.843 59.887 51.329 60.190
2 35.683 61.244 34.959 59.550 42.065 59.733
3 35.585 60.944 34.753 59.021 37.730 59.026
4 34.446 60.541 34.718 58.324 36.904 58.111
5 33.552 60.046 34.269 57.485 36.368 57.026
6 32.177 59.467 32.766 56.523 35.965 55.803
7 31.254 58.815 31.732 55.460 35.643 54.475
8 30.462 58.100 31.096 54.311 35.316 53.065
9 29.736 57.325 30.029 53.095 34.602 51.598
10 28.807 56.500 29.443 51.826 33.387 50.098

77
Table B4: Experimental and simulation data for kinetics analysis SO2 production (cont).
11 27.778 55.631 28.524 50.518 33.126 48.578
12 27.619 54.724 28.149 49.180 32.032 47.055
13 26.541 53.787 27.295 47.827 31.320 45.539
14 25.755 52.824 27.057 46.466 30.680 44.039
15 25.144 51.839 26.157 45.103 30.060 42.570
16 24.595 50.838 25.635 43.746 29.474 41.134
17 24.242 49.826 25.137 42.400 28.747 39.736
18 23.472 48.804 24.687 41.070 28.541 38.379
19 23.024 47.778 24.325 39.757 27.869 37.071
20 22.294 46.751 23.630 38.468 27.594 35.811
21 21.638 45.725 23.468 37.206 27.044 34.599
22 21.285 44.701 22.879 35.974 26.510 33.440
23 20.627 43.686 22.400 34.771 26.133 32.335
24 20.363 42.676 22.088 33.600 25.767 31.281
25 19.919 41.675 21.553 32.461 25.417 30.275

78
Table B4: Experimental and simulation data for kinetics analysis SO2 production (cont).
26 19.594 40.683 21.449 31.359 24.953 29.321
27 19.052 39.704 20.872 30.290 24.830 28.413
28 18.614 38.732 20.588 29.257 24.406 27.554
29 18.373 37.772 20.052 28.259 24.065 26.739
30 17.821 36.825 19.663 27.296 23.845 25.967
31 17.552 35.892 19.467 26.369 23.478 25.239
32 17.223 34.977 19.035 25.476 23.253 24.553
33 16.966 34.077 18.789 24.615 23.039 23.903
34 16.529 33.195 18.453 23.789 22.896 23.292
35 16.176 32.331 18.288 22.994 22.625 22.718
36 15.878 31.482 17.909 22.231 22.290 22.176
37 15.584 30.654 17.512 21.497 22.121 21.666
38 15.349 29.842 17.369 20.796 21.921 21.188
39 14.953 29.048 17.006 20.122 21.725 20.735
40 14.795 28.272 16.911 19.476 21.462 20.313

79
Table B4: Experimental and simulation data for kinetics analysis SO2 production (cont).
41 14.488 27.514 16.577 18.857 21.355 19.914
42 14.279 26.775 16.432 18.266 21.081 19.540
43 13.924 26.054 16.032 17.701 20.954 19.190
44 13.671 25.349 15.858 17.158 20.796 18.863
45 13.440 24.665 15.590 16.642 20.607 18.554
46 13.125 23.996 15.364 16.147 20.471 18.265
47 13.032 23.346 15.202 15.674 20.310 17.997
48 12.703 22.712 15.050 15.223 20.133 17.743
49 12.589 22.094 14.910 14.792 20.054 17.506
50 12.294 21.495 14.586 14.380 19.765 17.283
51 12.094 20.911 14.432 13.987 19.667 17.075
52 11.837 20.344 14.292 13.612 19.516 16.880
53 11.565 19.791 14.029 13.255 19.419 16.697
54 11.487 19.253 13.927 12.914 19.369 16.526

80
Table B4: Experimental and simulation data for kinetics analysis SO2 production (cont).
55 11.221 18.732 13.695 12.587 19.325 16.365
56 11.111 18.224 13.632 12.276 19.055 16.217
57 10.758 17.731 13.424 11.980 18.933 16.077
58 10.643 17.252 13.243 11.697 18.978 15.947
59 10.473 16.788 13.125 11.430 18.833 15.825
60 10.278 16.336 12.892 11.173 18.633 15.709

81
Appendix C:
Praxair Material Safety data Sheet (MSDS) for hydrogen sulfide and
EMD Material Safety Data Sheet (MSDS) for Sulfuric acid solution

82

83

84

85

86

87

88

89

90

91

92

93

94

95

96

97

98