study on the economic impact of the paediatric … · study on the economic impact of the...
TRANSCRIPT

www.technopolis-group.com
December 2016
Study on the economic impact of the Paediatric
Regulation, including its rewards and incentives
Final Report, SANTE/2015/D5/023

Study on the economic impact of the Paediatric Regulation,
including its rewards and incentives
Final Report, SANTE/2015/D5/023
(Redacted version)
Technopolis |group|
Ecorys Nederland BV
empirica GmbH
Peter Varnai*
Kristine Farla
Paul Simmonds
Wija Oortwijn
Lars Meindert
Marien van Schothorst
Krijn Schiffers
Karl Stroetmann
Rainer Thiel
Strahil Birov
December 2016

i
Table of Contents
Abstract ......................................................................................................................................... 7
Executive summary .......................................................................................................................8
1 Introduction ......................................................................................................................... 13
1.1 Context of the study ...................................................................................................................................... 13
1.2 Objectives of the study .................................................................................................................................. 14
2 Regulatory costs to industry ................................................................................................ 16
2.1 Data collection and methodology ................................................................................................................. 16
2.2 The regulatory cost of testing medicine for the paediatric population ....................................................... 17
2.3 Comparison of costs under the US legislation ............................................................................................. 31
2.4 Comparison of R&D costs of paediatric trials with adult population trials ................................................ 36
3 The value and the costs of the rewards and incentives ...................................................... 38
3.1 Methodological framework ........................................................................................................................... 38
3.2 The six-month SPC prolongation (article 36) .............................................................................................. 45
3.3 The Orphan reward (article 37) .................................................................................................................... 63
3.4 The PUMA reward (article 38) ..................................................................................................................... 69
4 Overall assessment of the rewards ...................................................................................... 78
4.1 Relevance of the rewards .............................................................................................................................. 78
4.2 Effectiveness .................................................................................................................................................. 79
4.3 Efficiency ...................................................................................................................................................... 86
4.4 Assessment of the coherence ....................................................................................................................... 88
4.5 Assessment of the utility and potential for improvement ........................................................................... 91
5 Direct and indirect benefits .................................................................................................96
5.1 Literature review ........................................................................................................................................... 97
5.2 Results of the Delphi Survey ........................................................................................................................ 99
5.3 Results from the survey to industry ............................................................................................................ 113
6 Cost-benefit assessment model .......................................................................................... 115
Policy background and objectives ............................................................................................................................ 115
6.1 The cost-benefit analysis approach ............................................................................................................ 116
6.2 Cost-benefit assessment of selected medicinal products .......................................................................... 118
6.3 Estimation of cost and benefits medicinal products with compliant PIPs ............................................... 126

ii
6.4 Estimation of R&D spillovers resulting from the PIPs .............................................................................. 129
7 Summary and conclusions ................................................................................................. 133
Regulatory cost data and analysis ........................................................................ 138 Appendix A
Insights from literature with regard to the economic value of the Regulation .. 150 Appendix B
Reward data, limitations and analyses................................................................. 153 Appendix C
Socio-economic impact survey ............................................................................. 168 Appendix D
Cost-benefit assessment ....................................................................................... 170 Appendix E
Tables
Table 1 Overview of total costs of developing and executing PIPs ............................................................................. 18
Table 2 Overview of total costs of waiver applications ............................................................................................... 18
Table 3 Estimated costs of a PIP broken down to stages (based on data for completed phases only, between 2008-
2015), in millions of euro ............................................................................................................................................. 20
Table 4 Number of paediatric subjects involved in phase II and phase III clinical trials. ........................................ 25
Table 5 Estimated cost per subject, based on information on individual PIP and data on both completed and
incomplete phases ......................................................................................................................................................... 25
Table 6 Average planned duration of PIPs by submission year .................................................................................. 26
Table 7 Average estimated cost incurred by therapeutic areas and R&D phase, in millions of euro (based on data
for completed phases only) ........................................................................................................................................... 27
Table 8 Overview of estimated costs for ‘Written Requests’ ....................................................................................... 33
Table 9 Comparison of estimated cost of a paediatric clinical trial compared with average-out-of-pocket clinical
period costs, in millions of euros .................................................................................................................................. 37
Table 10 Number of SPCs per medicine per year in the EU-28: 2007-2012 and 2007-2015 ................................... 46
Table 11 Level of generic entrants after the loss of exclusivity ................................................................................... 50
Table 12 Substitution effects (based on volume) ......................................................................................................... 53
Table 13 Estimation of the economic value of the SPC-extension (in thousands of euro), by member state ........... 55
Table 14 Estimation of the economic value of the SPC-extension .............................................................................. 56
Table 15 Economic value per product (column 2-5: x €1,000) .................................................................................. 60
Table 16 Extrapolated economic value per product for all countries (column 4 and 5: x €1,000) ........................... 61
Table 17 Extrapolated economic value per product, patent expiry before 31-12-2015 (column 4 and 5: x €1,000) 62
Table 18 Overview of reimbursing countries for medicines with orphan reward ...................................................... 64
Table 19 Priority review vouchers granted under the RP-PRV65 ............................................................................... 68
Table 20 Overview of reimbursing countries (and * planned) for medicines with PUMA reward ........................... 70

iii
Table 21 Overview of possible future PUMA requests (article 30) ............................................................................. 72
Table 22 National incentives and benefits EU Member States .................................................................................. 90
Table 23 US Paediatric Regulation ............................................................................................................................... 94
Table 24 Survey response to Question 6, full results on health and wellbeing of children and cost of care ........... 111
Table 25 Overview of detailed data estimated and calculated for the benefit-cost estimates per medicinal product
...................................................................................................................................................................................... 122
Table 26 Price range of medicinal products .............................................................................................................. 127
Table 27 Estimated benefits by therapeutic area ...................................................................................................... 128
Table 28 Estimated rate of return to society of the Paediatric Regulation, in € millions ........................................ 131
Table 29 Population and target sample population of PIP/waiver applications ..................................................... 140
Table 30 Population and target sample population of PIP/waiver applications which received a final compliance
check ............................................................................................................................................................................. 140
Table 31 Target sample population and response rates of PIP/waiver applications ................................................ 141
Table 32 Population and response rates of PIP/waiver applications ........................................................................ 141
Table 33 Population and target sample population of PIP applications which received a final compliance check 142
Table 34 Overview of data on PIPs ............................................................................................................................ 145
Table 35 Categories available in IMS Health data ..................................................................................................... 153
Table 36 Availability/limitations of data .................................................................................................................... 156
Table 37 Data checklist ................................................................................................................................................ 159
Table 38 Coverage selected products in the dataset (EU-level) ................................................................................ 160
Table 39 Characteristics of the 8 products considered in this study ......................................................................... 160
Table 40 Limitations due to selection of most sold dosage ....................................................................................... 161
Table 41 Survey respondent profile, current position ............................................................................................... 168
Table 42 Survey respondent profile, paediatric sub-speciality ................................................................................. 168
Table 43 Leading causes of death for children, USA, 2013, per 100,000 population ............................................... 171
Table 44 Adverse drug effects as a cause of death in the EU-15, 1999 (deaths per million population) ................ 172
Table 45 ADE reports by age group ........................................................................................................................... 183
Table 46 Summary of ADE related variables used in the CBA model ....................................................................... 184
Table 47 Summary of ADR variables used in the CBA model ................................................................................... 187
Table 48 Summary of value for avoidable mortality variables used in the CBA model ........................................... 188
Table 49 Summary of avoidable hospitalisation variables used in the CBA model .................................................. 189
Table 50 Summary of avoided reduced quality of life variables used in the CBA model ......................................... 190
Table 51 Summary of avoided outpatient treatment variables used in the CBA model ........................................... 191
Table 52 Summary of avoided lost time by informal care giver variables used in the CBA model .......................... 191
Table 53 Summary of additional benefit per paediatric episode variables used in the CBA model......................... 192

iv
Table 54 Percentage of all episodes related to paediatrics ........................................................................................ 193
Table 55 Number of paediatric episodes (6 months) ................................................................................................. 194
Table 56 Serious paediatric ADE reports as % of all paediatric episodes ................................................................. 194
Table 57 Number of serious paediatric ADEs (6 months) ......................................................................................... 195
Table 58 Paediatric episodes and adverse events – detailed data for 8 medicines ................................................. 195
Table 59 Monopoly rents and net costs to health system payers ............................................................................. 198
Table 60 Cash benefits and financial return to health system payers ...................................................................... 199
Table 61 Intangible benefits and societal return ....................................................................................................... 201
Table 62 Overall benefit/cost ratio per medicinal product ...................................................................................... 202
Table 63 Variables selected for partial sensitivity analysis ....................................................................................... 204
Table 64 Sensitivity of variable ‘value of a statistical life’ ........................................................................................ 205
Table 65 Sensitivity of variable ‘prevalence of other serious adverse drug events’ ................................................ 206
Table 66 Sensitivity of variable ‘prevalence of other serious adverse drug experiences’ ........................................ 207
Table 67 Selected variable for Monte-Carlo analysis ............................................................................................... 208
Figures
Figure 1 Distribution of PIPs with regulatory data collected, by stage........................................................................ 17
Figure 2 Distribution of PIPs with regulatory data collected, by paediatric product stage ........................................ 17
Figure 3 Estimated total costs incurred in relation to the Paediatric Regulation (based on data for 2008-2015),
broken down to components, per year in millions of euro .......................................................................................... 19
Figure 4 Distribution of PIPs by the number of clinical studies agreed upon ............................................................ 24
Figure 5 Distribution curve of the planned duration of PIPs, in years ........................................................................ 26
Figure 6 Average cost incurred in relation to in-vitro studies and animal studies, by therapeutic area ...................28
Figure 7 Average cost incurred in relation to the development of a paediatric formulation, by therapeutic area .... 29
Figure 8 Average cost incurred in relation to phase II paediatric clinical trials, by therapeutic area ...................... 30
Figure 9 Average cost incurred in relation to phase III paediatric clinical trials ...................................................... 30
Figure 10 Estimated costs of paediatric investigations (related to the development of a drug), based on Li et al.
(2007) ............................................................................................................................................................................. 34
Figure 11 Estimated costs of a paediatric study, based on Li et al. (2007) .................................................................. 34
Figure 12 Distribution of PIPs that use or plan to use data generated for submission to the FDA (yes) versus those
that do not use data for submission to the FDA (no) ................................................................................................... 36
Figure 13 Monopoly vs competitive situation .............................................................................................................. 41
Figure 14 Calculation of the economic value (hypothetical situation) ....................................................................... 43
Figure 15 Geographical spread of granted SPCs in the EU in 2007-2015 (left) and 2007-2012 (right) ................... 49

v
Figure 16 Substitution effect of Drug C (illustrating the revenues over time) ........................................................... 55
Figure 17 Estimated economic value as a percentage of 6-month revenue, by INN .................................................. 60
Figure 18 Overview of the Orphan reward (market exclusivity) ................................................................................. 63
Figure 19 Development of revenues for an example drug ........................................................................................... 66
Figure 20 Priority Review Voucher .............................................................................................................................. 67
Figure 21 Development of revenues Buccolam ............................................................................................................ 73
Figure 22 Assessment of the economic value of the PUMA reward ........................................................................... 74
Figure 23 Are the objectives of the rewards provided by the Regulation relevant to your needs and objectives? .... 79
Figure 24 How effective are the rewards as a mechanism and means to achieve the objectives of the Paediatric
Regulation? .................................................................................................................................................................... 83
Figure 25 Delphi survey response to Question 1 .......................................................................................................... 99
Figure 26 Delphi survey response to Question 2 ....................................................................................................... 101
Figure 27 Delphi survey response to Question 3a ..................................................................................................... 103
Figure 28 Delphi survey response to Question 3b .................................................................................................... 104
Figure 29 Delphi survey response to Question 3c ...................................................................................................... 105
Figure 30 Delphi survey response to Question 4 ....................................................................................................... 106
Figure 31 Delphi survey response to Question 5 ........................................................................................................ 108
Figure 32 Delphi survey response to Question 6........................................................................................................ 109
Figure 33 Delphi survey response to Question 7 .........................................................................................................112
Figure 34 Overview of the relation between costs and benefits of medicine for children and the Paediatric
Regulation .................................................................................................................................................................... 116
Figure 35 Main elements of the cost-benefit model ................................................................................................... 118
Figure 36 Distribution of PIPs for sample and population, by decision year ........................................................... 143
Figure 37 Distribution of PIPs for sample and population, by decision type ........................................................... 143
Figure 38 Distribution of PIPs for sample and population, by therapeutic area ...................................................... 144
Figure 39 Potential savings in case of immediate generic entry ............................................................................... 152
Figure 40 Example of changes in weighted prices ..................................................................................................... 163
Figure 41 Model used to calculate the economic value of the SPC extension
Figure 42 Model to calculate the economic value of Orphan reward ........................................................................ 166
Figure 43 Model to calculate the economic value of PUMA reward .......................................................................... 167
Figure 44 FDA case selection of serious paediatric cases .......................................................................................... 186
Figure 45 Sensitivity test results for Drug A ............................................................................................................. 209
Figure 46 Sensitivity test results for Drug C .............................................................................................................. 210
Figure 47 Sensitivity test results for Drug G ...............................................................................................................211


7
Abstract
English
The current study is aimed at providing a review of the economic impacts of the Regulation
since it entered into force until the end of 2015. This study thus covers the following
dimensions: (i) Analysis of the regulatory costs to the pharmaceutical industry for meeting
legal obligations; (ii) Analysis of the economic value of the rewards/ incentives to the
pharmaceutical industry; (iii) Overall assessment of the rewards/ incentives to the
pharmaceutical industry; (iv) Analysis of the direct and indirect social and economic benefits;
and (v) Exploratory high-level cost-benefit assessment providing estimates of the broad
economic impacts. The regulatory costs analysis is based on data provided by PIP and waiver
applicants by means of a survey questionnaire and follow-up interviews. The analysis of the
economic value of the rewards and incentives is based on data available from IMS Health. A
consultation on the societal benefits of the Regulation was conducted through a two-stage
survey to expert stakeholders. The economic model developed here explores the cost-benefit
profile for eight medicinal products in detail, while extrapolates in relation to 108 additional
PIPs that have already received a positive statement of compliance. Spillover effects of the
R&D investment are also considered.
Franc ̧ais
L'étude en cours vise à fournir un examen des incidences économiques du règlement depuis
son entrée en vigueur jusqu'à la fin de 2015. Cette étude couvre les dimensions suivantes : (i)
Analyse des coûts réglementaires de l'industrie pharmaceutique pour le respect des
obligations légales ; (ii) Analyse de la valeur économique des récompenses et incitations à
l'industrie pharmaceutique ; (iii) Évaluation globale des récompenses et incitations à
l'industrie pharmaceutique ; (iv) Analyse des avantages sociétaux et économiques directs et
indirects ; et (v) Analyse coût-bénéfice exploratoire de haut niveau fournissant des
estimations sur les impacts économiques généraux. L'analyse des coûts réglementaires était
basées sur une consultation des demandeurs de PIP et de dérogation au moyen d'un
questionnaire d'enquête ainsi que d'entrevues de suivi. L'analyse de la valeur économique des
récompenses et incitations était basée sur les données disponibles d'IMS Health. Une
consultation sur les impacts sociétaux du Règlement a été menée à l'aide d'une enquête en
deux étapes auprès des parties prenantes. Le modèle économique développé ici explore le
profil coût-bénéfice pour huit médicaments en détail, alors qu’il extrapole par rapport à 108
PIPs supplémentaires qui ont déjà reçu un avis positif de conformité. Les effets de retombée
(‘spillover’) de l'investissement en R & D sont également pris en compte.

8
Executive summary
The Paediatric Regulation was enacted in the European Union in 2007 to encourage
development of suitable medicine for children, promote high quality research, improve the
information available on the use of medicines in children, and to prioritise the therapeutic
needs in this group.
The current study is aimed at providing a review of the economic impacts of the Regulation
since it entered into force until the end of 2015. This study covers the following dimensions:
Analysis of the regulatory costs to the pharmaceutical industry for meeting legal
obligations
Analysis of the economic value of the rewards/ incentives to the pharmaceutical industry
Overall assessment of the rewards/ incentives to the pharmaceutical industry
Analysis of the direct and indirect social and economic benefits
Exploratory high-level cost-benefit assessment providing estimates of the broad
economic impacts
The regulatory costs analysis aimed to capture and assess all the costs incurred by the
sponsors of paediatric clinical trials within the scope of Paediatric Investigation Plans (PIPs).
Cost estimates were based on a consultation of PIP and waiver applicants by means of a
survey questionnaire and follow-up interviews. The total cost of the Paediatric Regulation
incurred to industry is estimated to be €2,106m per year or €16,848m for the years 2008-
2015. The annual cost estimate includes €2,103m PIP-related compliance costs and €3.6m
costs for waiver applications. On average, the estimated costs made in relation to in-vitro
studies and animal studies and the development of a paediatric formulation are relatively
lower than the costs of Phase II and Phase III paediatric clinical trials, and some of the other
R&D costs incurred in relation to the PIP, such as pharmacokinetics and pharmacodynamics
studies. The variation in cost is also dependent on the number of modifications to the PIP,
the number of clinical studies, the number of paediatric subjects, the duration of the PIP, and
therapeutic area.
The analysis of the economic value of the rewards and incentives provided under the
Paediatric Regulation - in relation to the six-month SPC extension (article 36), the Orphan
reward (article 37) and the PUMA reward (article 38) - is based on a methodological
framework that considers the additional period of protection (from competition with generic
medicines) that is awarded to originator companies. Moreover, because the introduction of
generic medicines is delayed, society does not benefit from increased competition and lower
prices for the duration of the exclusivity extension and this effect is also accounted for in the
framework.
The analysis on SPC extensions covers 8 medicinal products which received SPC extensions
in the period between 2007-2012 and lost their exclusivity before the third quarter of 2014.
The analysis, based on data available from IMS Health, shows that there are significant
differences between products and countries. The data analysis shows that the price drop of
branded products often starts in the first quarter after the loss of exclusivity, this price drop
is often limited in scale (up to 10-20%). During the first and second year after the loss of

9
exclusivity, the branded prices decrease further, and there are significant differences between
products and countries. In stabilised market situations, the economic value as a percentage of
6-month revenue varies between 11% and 94%. The combined economic value (or monopoly
rent) of the 8 products is calculated to amount to €517m. The economic value was then
extrapolated in order to assess the magnitude of the ‘full’ economic value of the reward up to
December 2015. This includes an extrapolation of the economic value of the products studied
in detail to countries where SPC extension was granted but our datasets did not include those
geographies. In addition, the economic value of a further four products (with SPC extension
ending within the research period) was estimated based on the average economic value per
capita. The extrapolated economic value thus amounts to €926m between 2007-2015.
There are four products with Orphan reward to date that may be studied but since these are
still under protection it was not possible to estimate the economic value of the reward.
Projection of currently available data towards the loss of exclusivity in the future is
unreliable. However, the approach to estimate the economic value of Orphan rewards could,
in principle, be similar to the model used for the SPC extension, with the main difference
being the delay of two years rather than 6 months.
There are only two PUMAs that were authorised up to December 2015. Given the limitations
of the available data, it is not possible to project the economic value of these PUMA rewards.
There is however a fundamental difference with respect to estimating the SPC reward:
market exclusivity period for a product starts at the moment the PUMA reward is granted
instead of after a delay as for the SPC-extension. This implies that the ‘economic value’ covers
the ‘monopoly benefits’ a product receives from additional data exclusivity (8 years) and
market protection (2 years). A model was developed that could be applied in future studies.
An assessment of the rewards to industry is based on five specific evaluation criteria:
relevance, effectiveness, efficiency, coherence, and utility/potential for improvement. We
collected data through a survey to pharmaceutical companies, which was complemented with
interviews and desk research. The objectives of the reward scheme are deemed highly
relevant when considering that the rewards provide a way for organisations to sponsor and
support the development of paediatric medicines. Nevertheless, the rewards themselves
cannot guarantee capital allocation decisions that maximise value for companies or result in
positive return on investment in individual R&D programmes.
The Regulation and hence the combination of obligations and rewards is seen as effective to
shift focus to paediatric medicine development. As a result, the amount and quality of
research and information available for the paediatric population has already increased. Over
the period between 2007-2015, the share of paediatric trials among all clinical trials
increased 2.5-fold and over 100 PIPs were completed. Paediatric clinical research networks
have been set up involving academia and industry. Industry also changed their approach to
medicine development and now design their research and development plans incorporating
the paediatric population. The Regulation is considered as a commendable first step in the
right direction but there remain therapeutic areas where significant unmet need continues to
exist, such as in the field of paediatric oncology, and hence further steps and more time is
needed to achieve the expected impact. It is claimed that therapeutic areas covered by
research in children is driven mainly by commercial interest and reflecting the needs of the
adults rather than those of children.

10
It is noted that the effectiveness of the rewards is higher for high-volume products and lower
for indications with very limited patient numbers. Factors influencing effectiveness include
uncertainty (and discontinuity) in early product development, difficulty in recruitment of
paediatric subjects, compliance check procedures, and the time-limited nature and
complexity of obtaining the reward across member states once the clinical research is
completed.
The extent to which rewards were taken up by companies indicate that the 6-month SPC
extension is the main tool to incentivise and reward paediatric medicine development. The
effectiveness of the orphan and the PUMA rewards are not immediately obvious with very
few examples in the period 2007-2015. External factors, such as the continued off-label use of
cheaper and comparable medicinal products represents a disincentive for paediatric
medicine development. The lack of meaningful market exclusivity and unpredictable return
on investment (due to pricing and reimbursement practices) in a niche market makes it
difficult for PUMA to act as a strong incentive. The development of orphan drugs targeting
children is complex and costly with very small study populations. Nevertheless, stakeholders
consider the orphan designation as a strong incentive and expect to see an increase in orphan
rewards in the coming years. One of the drawbacks highlighted was the lack of choice for
companies between the orphan designation and SPC extension if the substance is also
registered for non-orphan indication.
Industrial stakeholders indicate that the PIP application and administrative procedures
consume significant resources. This would be seen as unattractive for smaller companies.
This is despite the fact that a more streamlined process is in place since 2014 and mandatory
“key binding elements” of a PIP are defined and thus the need for minor PIP modifications
are decreased. Further, engaging with the regulatory system is often found to be slow,
fragmented across different committees, thus resulting in additional costs and delays in
product development.
There are a number of initiatives in member states which are complementary to or extending
the implementation of the Regulation. For example, priority review of paediatric data and
clinical trial applications in member states aimed to provide accelerated access to paediatric
medicinal products. In addition, national legislation is available in some cases to reduce the
off-label use of medicines for children or to use financial incentives to encourage the use of
paediatric medicine. Paediatric research networks with industry/academia participation have
also been created and supported at the national level. Nevertheless, there is scope for
enhancing research collaboration through the mobilisation of EU research funds.
Public stakeholders indicate that the Regulation was set up from an overly narrow
perspective, excluding considerations for affordability, cost-effectiveness and budget
implications at the national level. From the public perspective, the effectiveness of the
Regulation may be viewed as somewhat reduced because public services may ultimately
decide not to pay for the registered paediatric medicines. The fact that the entry of generic
medicine to market is blocked for 6 months represents a high price to pay for a branded
product. Generic companies would consider important that SPC extension can only be
granted to the company that sponsors a paediatric study and is responsible for the
compliance with the PIP (market authorisation holder), not to other third parties.

11
The legislation in the US differs in various ways from the EU Regulation. The US has set up
and funds the Paediatric Trials Network (enabled by the Best Pharmaceuticals for Children
Act, BPCA) that, with over 100 clinical sites, conducts paediatric clinical trials and generates
paediatric data on products. BPCA also provides a financial incentive (6-month market
exclusivity) to companies to voluntarily conduct paediatric studies under a Pediatric Written
Request (WR). These WRs are issued based on a priority list, representing a balanced
portfolio of therapeutic areas and paediatric needs, without replicating research funded
elsewhere. The Pediatric Research Equity Act (PREA) on the other hand is mandatory and
requires an initial Paediatric Study Plan (PSP) at the end of Phase II. The EMA and FDA
collaborate within the framework of the international Paediatric Cluster to exchange
information, agree on scientific requirements and harmonise requests to sponsors. A current
special initiative is the Pediatric Rare Disease Priority Review Voucher awarded upon
approval of a new product application for rare paediatric disease indications. This is a
transferable voucher for sponsors to obtain a priority review of any subsequent drug
application.
A consultation on the societal benefits of the Paediatric Regulation was conducted through a
two-stage survey to expert stakeholders. This survey reveals a broadly positive view of the
regulation’s effect on medicines development. The majority of the respondents agree or
strongly agree that the number of paediatric research projects increased, that more quality
information is available on approved medicines for their use in paediatric population, and
that the awareness of health professionals for better evaluation of medicine for children has
increased. 84% of respondents indicate that there has been a measurable increase in the
numbers of medicines tested within paediatric populations in the period since the
implementation of the regulation. The survey revealed a broadly positive view about
improving research capacity and research collaboration, with a somewhat more neutral view
expressed about any improving trends in paediatric research funding. Regarding the
replacing of existing treatments for a paediatric condition (either by treatment with less
toxicity or enhanced efficacy), close to half of the respondents find that the regulation had led
to an increase. While 68% of the respondents find that there has been an increase in the
number of children treated with the right medicine at the right time with the right dose.
Almost 40% of respondents indicate they have seen improvements in child morbidity in their
field, which they would attribute to the regulation, which is encouraging at this point in time.
Moreover. the majority of stakeholders expect that the regulation will have measurable long-
term benefits, eg improving children’s school attendance, reducing time cares need to take off
work to care for children, increasing quality-adjusted life years for children, and decreasing
mortality rates of children with life-threatening illnesses. Positive societal benefits were also
reported as part of the survey to industry, eg it was reported that the Paediatric Regulation
evoked a change in culture and a significant shift in mind-set and helped encourage
paediatric development become a more integral part of the overall development of medicines
in Europe.
The Paediatric Regulation is expected to have a positive impact on improved treatment for
children and is expected to contribute to a reduction of adverse drug reactions. This, in turn,
is expected to improve the quality of life of children, avoid mortalities, hospitalisation costs,
ambulatory costs, lost time by informal carers, and is expected to lead to other improvements
related to better treatment for children. The (exploratory) cost-benefit analysis seeks to

12
contrast these benefits with the cost to society resulting from the extra monopoly rent
obtained by the sponsors of PIPs as a result of the Paediatric Regulation.
There are two products (Drug A and drug B) among the eight medicinal products studied
here with strongly favourable benefit-cost ratio when calculated over a 10-year period,
basically due to non-cash benefits. Drug A is an Asthma pill and provides €32m net benefit,
while drug B, a migraine pill provides €66m net benefit to society. All other medicinal
products have a negative benefit-cost ratio over 10 years.
Based on the aggregation of cash and non-cash benefits data for eight medicinal products, it
is estimated that these products yield overall benefits of €199m over a period of 10 years.
Overall cash cost to society (patients, health systems) from total monopoly rent to all
stakeholders (pharmaceutical industry, wholesalers, pharmacies, governments from value
added/sales tax) were estimated at €590m. As a result, the overall socio-economic benefit
cost ratio across these medicines is 0.34, the societal overall rate of return minus 66%. It is
expected that those PIPs that have already received a positive statement of compliance but
are not (yet) received a reward, on average, also have a positive effect on society resulting
from the change in labelling/safer medicine. Based on an exploratory extrapolation of cost
and benefits that may exist in relation to 108 of such additional PIPs, the benefit estimate
arrives at around €500m, which is closer to the estimated value of monopoly rents.
The investment in R&D made in relation to the PIPs, although a cost imposed on the
pharmaceutical industry, can also be viewed as an R&D investment towards new and
improved medicine that triggers further investment and contributes to the creation of jobs,
growth and innovative activity across (EU and non-EU) sectors. These so-called spillover
effects are estimated based on rates of return that are documented in related literature. The
more conservative estimated rate of return from an annual €2bn investment in R&D could,
after a period of 10 years, yield a total social return of around €6bn. This estimated social
return is significantly higher than the economic value of the SPC extension (excluding cost to
society in relation to other products and countries, as well as the dead weight loss in relation
to the SPC) suggesting that, in monetary terms, the benefits of the Paediatric Regulation
outweigh the costs.

13
1 Introduction
This study on the economic impact of the Paediatric Regulation, including its rewards and
incentives was commissioned by the European Commission DG SANTE in October 2015
(SANTE/2015/D5/023). The study was conducted by a consortium composed of Technopolis
Group, Ecorys Nederland BV, and empirica GmbH between November 2015 and October
2016. In the following sections, a short historical context is provided to the study before
reviewing the objectives and presenting results and conclusions.
1.1 Context of the study
The Paediatric Regulation on medicinal products for paediatric use (EC) No 1901/2006 was
enacted in the European Union in 2007 to encourage the development of suitable medicine
for children, promote high quality research, improve the information available on the use of
medicines in children, and to prioritise the therapeutic needs in this group.1 This is to be
achieved via a set of obligations, rewards and incentives for both new/on-patent products,
and off-patent products, with an additional set of tools for transparency, information and
research stimulation. The Regulation also provides that those developing a medicine
intended for paediatric use may request scientific advice from the European Medicines
Agency (EMA). This advice is free of charge and given on the design and conduct of clinical
trials required to demonstrate the quality, safety and efficacy of the medicine in the
paediatric population. Applicants may request scientific advice before the preparation of a
paediatric investigation plan (PIP), or to submit a PIP first and follow it up with a request for
scientific advice.
The PIP should set out all proposed studies necessary to support paediatric use of the
medicine, and include details of the timing and measures proposed to demonstrate quality,
safety and efficacy, the three Market Authorisation criteria. It is understood that due to the
nature of clinical trials with children, there would be increases in the cost and timescales of
drug development following implementation of the Regulation. Complying firms are
rewarded through extended exclusivity rights, SPC prolongation and extended market
exclusivity.
The EMA has an expert committee, the Paediatric Committee (PDCO), including members of
the Committee for Medicinal Products for Human Use (CHMP), experts from Member States,
and members representing patient associations and healthcare professionals. A network of
paediatric research networks (Enpr-EMA) has been created to foster collaboration within and
beyond the EU and across members, patient associations, academia and the pharmaceuticals
industry. The EMA is participating in regular Paediatric Cluster teleconferences with other
regulatory agencies, in particular, the US Food and Drug Administration, in order to
exchange information, agree on scientific requirements and harmonise requests to sponsors,
leading to joint publications and common commentaries.2
1 EMA, 2013. Successes of the Paediatric Regulation after 5 years (August 2007-December 2012)
2 See the following websites for more details:
http://www.ema.europa.eu/ema/index.jsp?curl=pages/partners_and_networks/general/general_content_000655.jsp&mid=
WC0b01ac0580953d98 and
http://www.fda.gov/ScienceResearch/SpecialTopics/PediatricTherapeuticsResearch/ucm106621.htm

14
There are several important transparency measures, including a database of Paediatric Trials
(EudraCT), a database of authorised products in the EU (EudraPharm), medicinal product
information, including waivers, deferrals, compliance and corresponding results. In addition,
there is an inventory of use in children by Member States, and an inventory of paediatric
needs by the PDCO.
The Paediatric Regulation also stipulates (Article 50 (3)) that in 2017, the Commission shall
present a report to the European Parliament and the Council on the experience acquired as a
result of the application of Articles 36, 37 and 38. The report shall include an analysis of the
economic impact of the rewards and incentives, together with an analysis of the estimated
consequences for public health of this Regulation.
1.2 Objectives of the study
The current study is aimed at providing a comprehensive review of the economic impacts of
the Regulation since it entered into force in January 2007 up to December 2015. The results
of this economic analysis will feed into a report that the Commission is due to present to the
European Parliament and the Council in 2017. Therefore, the current study will gather
relevant information, provide evidence and assess the current economic impact of the
Paediatric Regulation.
According to the requirements of the study, it focussed on the following four elements:
1. Quantifying and analysing the regulatory costs (administrative costs and other
compliance costs) of the Paediatric Regulation, excluding the cost of enforcement and
costs for public authorities;
2. Quantifying and analysing the economic value of the rewards and incentives provided
under the Regulation to the pharmaceutical industry (additional monopoly rent) and
evaluating its effect;
3. Quantifying and analysing the direct and indirect benefits in view of the aim of the
Regulation, which is to provide better medicines for children;
4. Providing estimates regarding a high-level cost-benefit assessment from an economic
perspective.
The structure of the report follows closely the above elements and presents findings in the
following sections:
Chapter 2 focuses on quantifying and analysing the regulatory costs to the
pharmaceutical industry for meeting the legal obligations detailed in the Regulation; both
the relevant administrative costs and other compliance costs, notably the R&D costs
required to fulfil the regulatory obligations.
Chapter 3 focuses on quantifying and analysing the economic value of the rewards/
incentives to the pharmaceutical industry provided under the Regulation and evaluating
its effect.
Chapter 4 presents an overall assessment of the rewards/ incentives to the
pharmaceutical industry.

15
Chapter 5 presents an analysis of the direct and indirect benefits (social and macro-
economic) of the Regulation based on available published data and stakeholder
perceptions.
Chapter 6 comprises a high-level cost-benefit assessment and providing estimates of the
broad economic impacts of the Regulation, considering direct costs (and potential
savings) to the healthcare payer as well as tangible and intangible benefits to the society
at large.
Chapter 7 provides a summary and key conclusions of the study.

16
2 Regulatory costs to industry
The Regulatory costs analysis aims to capture and assess all the costs incurred by the
sponsors of paediatric clinical trials within a Paediatric Investigation Plans (PIPs) or waiver
applications, in particular the pharmaceutical industry, for meeting the legal obligations
detailed in the Regulation for the period between 2008-2015. To the best of our knowledge,
there have been no previous studies that calculated the actual costs of PIPs and waivers for
the pharmaceutical industry. The objective here was to gather data directly from
pharmaceutical companies across two major cost items:
Administrative costs incurred for preparing, drafting and filing a PIP or waiver
application with the EMA, annual reporting on progress with the PIP and subsequent
modifications.
Research & Development (R&D) costs of a PIP, including costs incurred in relation to
preclinical studies, the development of a paediatric formulation, phase II and phase III
clinical studies.
2.1 Data collection and methodology
Cost estimates are based on a consultation of PIP and waiver applicants by means of a survey
questionnaire and follow-up interviews. The survey was sent to all PIP/waiver applicants that
have made 3 or more PIP or waiver applications and, in addition, participants of the EU
Framework Programme projects that submitted a PIP. The request to provide information on
specific PIPs was thus sent to 78 companies that submitted an estimated 870 PIP/waiver
applications. Note that the total number of PIP/waiver applications requested per company
was capped at a maximum of 10 for practical reasons, resulting in a target sample population
of 514 applications, representing 40% of the total population of 1,297 applications between
2007-2015. For additional information on survey design process and sampling frame, see
Appendix A.
The cost analysis is based on data collected from 26 organisations which includes 19
companies and 7 Framework Programme participants. Company data is collected with a
response rate of 24%, which is considered satisfactory due to the difficulty for companies to
retrospectively collect information on specific PIP costs incurred by different teams of staff
across the company and due to the confidential nature of such information. The 26
organisations that provided data voluntarily include several EFPIA member companies, one
non-profit organization and six small and medium-sized companies (SMEs).
In total, data was collected on 36 waiver applications from 11 organisations (not all
organisations submitted a waiver application) and on 85 PIPs from 24 organisations (two
organisations only submitted waiver applications). Figure 1 presents a breakdown of the
sample of PIPs according to their stage at the time of data collection. All of the PIPs had
completed the initial application phase. Only four of the 85 PIPs in our sample had not yet
started the R&D stage. The majority, 50 PIPs, were ongoing, 14 PIPs were discontinued and
17 PIPs had received a final compliance check. As presented in Figure 2, 11 of the PIPs in the
sample correspond to medicinal product marketed in at least one EU member state. This
represents a deliberate oversampling of PIPs that have received the final compliance check
and/or have been put on the market. The reason for this sampling was to gain information on
PIPs that have more complete data on late R&D phases. Cost information presented in the

17
following sections was estimated by analysing data obtained for the sample and using this
data to gross up figures to characterise the entire population.
Figure 1 Distribution of PIPs with regulatory data collected, by stage
Figure 2 Distribution of PIPs with regulatory data collected, by paediatric product stage
2.2 The regulatory cost of testing medicine for the paediatric population
2.2.1 Total cost of compliance with the Paediatric Regulation
The total cost of the Paediatric Regulation incurred to industry is estimated to be €2,106m
per year or €16,848m for the years between 2008-2015. This estimate includes €2,103m PIP-
related compliance costs and €3.6m costs for waiver applications.
The total cost of the PIPs is estimated based on an average of 107 first PIP decisions per year
for the period 2008-2015 (see Table 1). The estimated average incurred costs per PIP is,
based on our sample population, €19,608k which comprises of around €728k for the
4
50
14 17
0
10
20
30
40
50
60
1. Not started 2. Ongoing 3. Discontinued 4. Completed(final compliance
check)
50
6 4
11 14
0
10
20
30
40
50
60
1. Underdevelopment
2. Applicationfor marketingauthorisation
submitted
3. Marketingauthorisation in
EU obtained
4. Marketed inat least one EUmember state
5. Discontinued

18
administrative costs incurred in relation to filing an initial application and for subsequent
modifications of a PIP, and €18,879k for the R&D costs (4%:96%). R&D costs may include
costs related to:
In-vitro studies and animal studies
Development of a paediatric formulation
Phase II paediatric clinical trials - studies conducted to evaluate the efficacy and safety of
the medicine
Phase III paediatric clinical trials - studies conducted after the efficacy is demonstrated
and prior to the approval of the drug
Other R&D costs
The sample data suggests that an average of 2.9 clinical studies were agreed as part of the
PIPs and this implies an average estimated cost per study of €6,831k.
Table 1 Overview of total costs of developing and executing PIPs
Estimated annual costs
Total administrative and R&D costs of PIPs for the industry per year (2008-2015) €2,103m
Average cost per PIP €19,608k
Average administrative cost per PIP €728k
Average R&D cost per PIP €18,879k
Aggregation is based on an average of 107.3 first PIP decisions in 2008-2015 (858 first PIP decisions in 2008-
2015 in total).
The total cost of the waiver application is estimated based on a calculated average number of
50.4 waiver decisions per year for the period 2008-2015 (see Table 2). The average cost of the
waiver application is €70k, which is about 10% of the estimated average cost of a PIP
application. The cost of waiver applications, as reported by companies, comprises of labour
costs for literature searches, expert discussions, regulatory and administrative activities.
Some waivers were reported to have incurred costs for additional studies (e.g. pre-clinical
studies) and some waivers were not accepted in the first instance and there were subsequent
costs linked to appeals. All costs reported by companies for waivers were included in the
calculations.
Table 2 Overview of total costs of waiver applications
Estimated annual costs

19
Estimated annual costs
Total administrative costs of waiver applications for the industry per year (2008-2015) €3,548k
Average cost per waiver application €70k
Aggregation is based on an average of 50.4 waiver applications in 2008-2015.
2.2.2 Variation in costs by study phase
Figure 3 presents a breakdown of the total estimated costs to industry by cost category. It is
clear that the R&D costs are the largest component of executing a PIP and that there is
considerable variation in the estimated cost for each of the R&D phases.
Figure 3 Estimated total costs incurred in relation to the Paediatric Regulation (based on data for 2008-2015),
broken down to components, per year in millions of euro
The annual administrative costs linked to PIPs are estimated to be €78m and this comprises
of the preparation of the initial application, modification and reporting, and other
administrative costs. The preparation of an initial application costs on average €0.4m (Table
3). Note that this average cost estimate, and the other average cost estimates presented in
this section, are often incurred over multiple years. As presented in Table 3, all PIPs incur
some administrative costs, even when the PIP is discontinued. Note that only 55% of the PIPs
in our sample was reported to incur additional administrative costs in relation to annual
reporting requirements or PIP modifications. In the event that a PIP was discontinued, 29%
of the PIPs incur these additional administrative costs.
€ 2.106
€ 4 € 78 € 28 € 77
€ 341
€ 902
€ 676
€ -
€ 500
€ 1.000
€ 1.500
€ 2.000
€ 2.500
Mil
lio
ns

20
In-vitro and animal studies are estimated to cost industry €28m each year. 40% of the PIPs
include such in-vitro and/or animal studies. On average, the cost of in-vitro and animal
studies is €0.8m. If the PIP is discontinued, around 36% of those have already incurred this
type of cost before termination.
The total development cost of paediatric formulations is estimated to be €77m per year. 47%
of the PIPs incur this type of cost and 29% of the PIPs that are discontinued incur this type of
cost. On average, the cost of the development of paediatric formulations, if any cost is
incurred, is €1.6m.
Table 3 Estimated costs of a PIP broken down to stages (based on data for completed phases only, between
2008-2015), in millions of euro
Average Median
Standard
deviation
% of PIPs
incurring
cost
% of PIPs
incurring
cost if PIP is
discontinued
Preparation of the initial PIP application € 0.4 € 0.1 0.7 100% 100%
Annual reporting and further PIP
modifications € 0.1 <€ 0.1 0.3 55% 29%
Other administrative costs € 0.2 - 0.5 42% 21%
In-vitro studies and animal studies € 0.8 € 0.5 0.9 40% 36%
Development of a paediatric formulation € 1.6 € 0.9 1.7 47% 29%
Phase II paediatric clinical trials € 7.3 € 1.7 14.3 48% 21%
Phase III paediatric clinical trials € 15.7 € 1.5 22.4 72% 36%
Other R&D costs € 14.4 € 1.2 22.1 44% 21%
The combined annual cost of phase II and phase III clinical trials to industry is €1,243m:
€341m for phase II clinical trials and €902m for phase III clinical trials. Note again that not
all PIPs include costs for a given PIP category (or stage). As indicated in Table 3, only 48% of
the PIPs have incurred or are expected to incur phase II R&D trial costs and 72% have
incurred or are expected to incur phase III R&D trial costs. In some cases, there may be no
clear distinction between phase II and phase III costs and some survey respondents have
included costs under either phase II or phase III. However, for 38% of the PIPs, data on both
phase II and phase III costs is provided. On average, cost for a phase II paediatric trial is

21
€7.3m (median €1.7m) and average cost for a phase III paediatric trial amount to €15.7m
(median €1.5m). The standard deviation of the larger cost estimates, as that for phase III
paediatric clinical trials, is substantially higher – indicating that there is a high variation
between costs incurred and, as expected, some of the more extreme values include very high
cost estimates. As described in the next section, there are a number of factors that drive the
cost of a PIP stage.
An additional estimated €676m is incurred by industry each year in relation to ‘other’ types
of R&D costs. 44% of the PIPs for which we have collected cost data included such ‘other’
costs. On average, the other types of cost amount to €14.4m (median €1.2m). We are not able
to fully separate the lower cost elements from the higher cost elements. However, the cost
data that falls below the median [with range of approximately €7k-€1,000k] are in relation to
observational studies, the preparation of study outlines, medical writing for clinical plan
including data and database management, coordination activities and transaction costs,
extrapolation studies and literature study to support extrapolation, other cross-functional
paediatric project costs, pharmacokinetics and pharmacodynamics (PK/PD) studies, and
bioavailability, modelling. Cost data that is above the median [with range of approximately
€1m-€74m] are related to sponsor management costs, pharmacokinetics and
pharmacodynamics (PK/PD) studies, pharmacogenomics (PGx) analysis, bioavailability,
modelling and simulation studies, and costs related to supporting phase II and III trials.
2.2.2.1 Attrition
It should be noted that a considerable proportion of PIPs are discontinued and this
represents costs incurred by the industry for activities that will not bring any potential
reward or revenue to the company. Moreover, discontinued PIPs also place undue burden on
paediatric patients involved in associated clinical trials. According to a study of PIPs in the
EMA database between 2007-2010, 21% of agreed PIPs were subsequently abandoned
because of discontinuation of the adult development programme for the product.3
The total estimated administrative and R&D costs of PIPs that are already discontinued (16%
of the PIPs in our sample) amounts to €144m per year, 7% of total estimated costs. This is
likely to be an underestimation of the total cost incurred in relation to discontinued PIPs
because several of the PIPs that have been labelled as ‘ongoing’ may be discontinued at a later
stage in the execution of the PIP.
Any costs associated with waiver applications, albeit much smaller, can likewise be
considered as sunk costs to industry – incurred in compliance with the Paediatric Regulation.
2.2.3 Data limitations
In order to produce a cost estimate for the industry, organisations were asked to include only
the fraction of their costs that was specifically related to the PIP and to exclude costs related
to adult drug development from that of paediatric drug development. Many of the clinical
trials however are mixed trials and organisations may have had difficulty to completely
separate out costs (even though no such difficulty was reported to the study team). This
means that all costs reported are considered ‘incurred’ to comply with the Paediatric
3 Escher Report. Improving the EU system for the marketing authorisation of medicines: Learning from regulatory practice
(2014). p 19

22
Regulation. Without the Paediatric Regulation, costs would not have been incurred unless an
organisation would have voluntarily committed to invest in medicine development for
children.
Note that incurred costs presented in this study remain cost estimates based on self-
reporting by organisations that voluntarily engaged with the study and provided cost data
input. These estimates were provided as best point estimates, however, some of these costs
may be overestimations or underestimations. Based on an analysis of industries’ practice of
pricing drugs, e.g. for (US) Medicare recipients, Angell argues that pharmaceutical
companies tend to overestimate (R&D) costs.4
As discussed in the next section, there are a large number of potential cost drivers, however,
our survey questionnaire was not able to capture all potentially relevant cost components,
and further, data supplied by organisations does not allow for a uniform coverage of all
dimensions, allowing a robust analysis of every dimension. Despite these limitations, we have
been able to extrapolate total cost incurred by industry using the PIP as the unit of reference
(and with data obtained on both completed and incomplete phases). Nevertheless, our cost
estimates remain subject to possible overestimation or underestimation, e.g. if sample data is
not fully representative. In particular, our average and median cost estimates for the ‘other
cost’ category is based on reported incurred costs, sometimes in relation to an ongoing PIP.
As a result, there is potential for underestimation in this category.
The cost estimate reflects the costs industry incurred during the years 2008-2015. The cost
estimate may not be an accurate reflection of costs that industry will incur in the future as a
result of the Paediatric Regulation. During the years 2008-2015, on average, there were 107
decisions on initial PIP applications. Note that since 2012 onwards, the number of initial PIP
decisions is stabilising at around 90 per year. This means that projected annual cost to
industry, based on the current estimations, is 84% of the cost figures presented above.
Similarly, there is a decreasing trend in the number of modifications per PIP and this will
reduce somewhat the administrative costs of the PIP (EMA 10-year report). Likewise,
organisational learning (both for industry and EMA) may contribute to more efficient/less
costly PIP procedures over time.
Other cost items which represent significant costs to industry, related to providing medicine
to children, but were out of scope for the current study to assess the compliance cost to
industry of evaluating and developing paediatric medicine are the following:
Cost of long-term safety and efficacy monitoring after marketing authorisation
Legal costs of SPC extension (reward) after a positive compliance check
Obtaining marketing authorisation for the paediatric medicine
Marketing costs of authorised paediatric medicine
Manufacturing and distribution costs of authorised paediatric medicine
4 See Marcia Angell (2004). The Truth About the Drug Companies. Random House NY

23
2.2.4 Cost drivers
There are a number of cost drivers that influence the cost incurred in relation to a given PIP
and contribute to explain the significant variations in estimated costs between PIPs.
2.2.4.1 Number of modifications to the PIP
Olski et al. (2011)5 investigated the modifications proposed by the Paediatric Committee
(PDCO) of the European Medicines Agency to the PIP applications submitted by companies
from 2007 to 2009. Of the 257 PIP applications that had been submitted at the time, the
PDCO requested major modifications to 38%. These requests included the development of
age-appropriate formulations (11%), expansion of the scope of clinical programmes (6%),
addition of a phase II/III study (17%) and the inclusion of additional age groups (13%),
generally younger ones.
It is possible that engaging with the Scientific Advice Working Party (SAWP) to request free
scientific advice may decrease future PIP costs. Based on our survey results, for 8% of PIPs (7
of 85) scientific advice was thought to have decreased the overall PIP costs – reduction in
studies that had been initially planned or benefit of clearer development plan. However, for
7% of PIPs (6 of 85) scientific advice was thought to have increased overall PIP costs – since
additional studies were suggested. Other PIPs in our sample were seen not to have benefited
from scientific advice, possibly because no scientific advice was sought. According to EMA’s
10-year report, there has been an increase in scientific advice sought by companies.
Nevertheless, even if a PIP has been agreed, a PIP applicant may request modifications of the
PIP at a later stage, eg to reduce sample size of paediatric subjects in the clinical trial6. Survey
respondents reported that the number of modifications to the PIP was seen as a burden and
often delayed the execution of the PIP significantly (and possibly also the launch of the
associated adult drug) and thus the burden and costs associated can extend beyond the
administrative costs involved with requesting a modification. Despite these considerations,
many PIPs have been modified once or more, however, according to EMA’s 10-year report,
the number of modifications is decreasing over time, possibly as a result of organisations’
learning curve.
2.2.4.2 Number of clinical studies
The number of clinical studies that are part of a PIP differ considerably across the PIPs
sampled. Based on the survey data, the average number of clinical studies that are agreed
upon is 2.9. This is slightly higher than the average number of exclusively paediatric trials per
PIP which is 2.4 (Draft 10-year report, EMA/EudraCT). However, only around 18% of the
PIPs in our sample involved 3 clinical studies. Just over half of the PIPs involved only one or
two clinical studies. Two of the PIPs in the sample did not involve a clinical study (only e.g. a
5 Olski, T.M. et al., 2011. Three years of paediatric regulation in the European Union. European Journal of Clinical
Pharmacology, 67(3), pp.245–252.
6 Article 22 of the Regulation states: “If, following the decision agreeing the paediatric investigation plan, the applicant
encounters such difficulties with its implementation as to render the plan unworkable or no longer appropriate, the applicant
may propose changes or request a deferral or a waiver, based on detailed grounds, to the Paediatric Committee.”

24
literature review). The highest number of clinical studies that was reported as part of a PIP is
13 (see Figure 4).
Note that there is considerable variation in cost between the different R&D stages, ie phase II
and phase III are considerably more expensive than in-vitro/animal studies and the
development of a paediatric formulation. However, in our sample, not all PIPs incurred costs
(or expecting to incur costs) in all categories/stages. It is clear that those PIPs that will
involve multiple stages, and include phase II and phase III trials, will be more expensive.
In relation to the number of clinical studies that are part of a PIP, there are also important
differences in the number of sites and the locations of sites and associated wage differentials.
Figure 4 Distribution of PIPs by the number of clinical studies agreed upon
2.2.4.3 Number of paediatric subjects
The survey collected data on the number of paediatric trial subjects that were involved in
phase II and phase III studies, recognising this can be an important cost driver. If a phase
had not started, the number of paediatric trial subjects was reported as zero and if the phase
was ongoing the number of paediatric trial subjects include the number of patients that had
been involved up to that date. The data summary is presented in Table 4. We also note that in
some instances, costs had already been accruing before paediatric trial subjects were
enrolled. We understand this to be in relation to preparatory costs of screening as well as
difficulties to recruit subjects. For example, the target age of paediatric subjects and the
conditions for participation in paediatric trials play a role in recruitment and drive costs.
In our sample, on average, 66 [0-900] paediatric trial subjects participated in phase II
clinical trials and, on average, 154 [0-2,000] paediatric trial subjects participated in phase III
clinical trials. If the phase was completed, on average, 43 [1-154] paediatric trial subjects
participated in phase II clinical trials and, on average, 292 [18-2,000] paediatric trial subjects
participated in phase III clinical trials. Note that the median of paediatric trial subjects that
participated in completed phases is similar to the median calculated for the overall sample.
Moreover, it was found that the majority of paediatric trial subjects are located in the EU.
0%
5%
10%
15%
20%
25%
30%
0 1 2 3 4 5 6 7 8 9 10 11 12 13

25
Table 4 Number of paediatric subjects involved in phase II and phase III clinical trials.
Average Median Min Max
Number
of
observati
ons
Total number of paediatric trial subjects that
participated in the phase II clinical trial(s)
66
(79% EU) 16 0 900 37
Total number of paediatric trial subjects that
participated in the phase III clinical trial(s)
154
57% EU) 54 0 2,000 62
Total number of paediatric trial subjects that
participated in the phase II clinical trial(s) - If phase is
completed
43
(74% EU) 19 1 154 17
Total number of paediatric trial subjects that
participated in the phase III clinical trial(s) - If phase is
completed
292
(52% EU) 55 18 2,000 21
Table 5 presents a breakdown of the average estimated cost per subject. These calculations
are based on values of individual PIPs and using data on both completed and incomplete
R&D phases. This yields an average cost per subject of €377k and a median cost estimate of
€77k for phase II; for phase III, we calculate an average cost of €244k and likewise a median
cost estimate of €77k. The median estimates may be considered a more helpful indication of
cost per subject7. We however recognise that the sample dataset underlying our cost estimate
per subject for phase II and phase III trials involves large variations and thus significant
uncertainties remain in these cost estimates.
Table 5 Estimated cost per subject, based on information on individual PIP and data on both completed and
incomplete phases
Average Median Minimum Maximum Number of
observations
Phase II €377k €77k €20k €3.5m 27
Phase III €244k €77k €1k €4.0m 44
7 The average cost estimates calculated using data on both completed and incomplete R&D phases are significantly higher than
estimates that can be calculated using data on completed phases only: for phase II, the average number of subjects is 43, the
average estimated cost of the trial is € 7.3m, and thus the average cost per subject is €170k. For phase III, the average number of
subjects is 292, the average estimate cost of the trial is €15.7m and the average cost per subject is only €54k.

26
2.2.4.4 Duration of a PIP
The average planned duration of a PIP, from the date of initial application to the planned
completion date, is 7 years [0-23] (calculation based on EMA data)8 with a considerable
variation between the expected duration of PIPs – as illustrated in Figure 5. It is also
expected that the average duration of PIPs that are discontinued, based on the date of
submission up to the point that they are discontinued, will be lower than 7 years.
Moreover, an analysis of the average duration of PIPs sorted by the initial submission year
shows that the PIPs filed in the initial years of the Regulation, especially in 2008, had a lower
than average expected duration (Table 6). It may well be that those PIPs were less
burdensome (in cost and time) as many of these products had generated significant clinical
data, and probably originate under Article 8. It should be noted that because only a relatively
smaller number of PIPs were submitted in the first years following the enactment of the
Paediatric Regulation, it is likely that the overall effect on estimated cost to industry is small.
The higher than average planned duration for PIPs submitted in the year 2010 is driven by a
large number of PIPs in the therapeutic area Pneumology – Allergology. It is not known why
the planned duration of this group of PIPs is significantly above average.
Figure 5 Distribution curve of the planned duration of PIPs, in years
Table 6 Average planned duration of PIPs by submission year
Submission year
Average planned duration/
years
2007 5.2 (13)
8 PIPs that had a planned completion date registered prior to the initial application date are excluded.
0 5 10 15 20 25
Years

27
Submission year
Average planned duration/
years
2008 4.7 (24)
2009 6.4 (48)
2010 13.1 (125)
2011 6.7 (61)
2012 5.7 (87)
2013 6.0 (142)
2014 5.8 (145)
2015 5.6 (152)
Based on 797 PIPs, number of observations per year in parenthesis (source: EMA PIP database)
2.2.4.5 Therapeutic area
The cost of filing and executing a PIP is also related to the therapeutic area. For example, it
will be more challenging to recruit clinical trial subjects for some indications in certain
therapeutic areas than others, resulting in a notable difference in the average number of
paediatric subjects involved in the trial. Table 7 presents a breakdown of the average cost
incurred in different therapeutic areas, by R&D phase, calculated using data for completed
phases only. The cost figures are merely indicative as it relies on a small number of
observations and cost drivers other than the therapeutic area may be at play. However, it may
well illustrate the degree of variation across a range of therapeutic areas. It shows, for
example, that costs incurred in relation to Haematology-Hemostaseology are generally lower
than the total average R&D costs. And, for example, costs related to infectious diseases are
likewise below average R&D costs estimates but not the costs related to the development of a
paediatric formulation, which are estimated to be higher than average.
Table 7 Average estimated cost incurred by therapeutic areas and R&D phase, in millions of euro (based on
data for completed phases only)
In-vitro studies
and animal
studies
Development of a
paediatric
formulation
Phase II
paediatric
clinical trials
Phase III paediatric clinical
trials
Cardiovascular
diseases € 1.2 [€0.3-€2.0]
Infectious € 0.5 [€0.1-€1.2] € 3.2 [€0.6-€6.7] € 1.9 [€1.0-€3.7] € 12.5 [€3.0-€22.0]

28
In-vitro studies
and animal
studies
Development of a
paediatric
formulation
Phase II
paediatric
clinical trials
Phase III paediatric clinical
trials
diseases
Endocrinology, -
gynaecology-
fertility-
metabolism
€ 0.7 [€0.1-€1.6] € 0.6 [€0.5-€0.8] € 0.9 [€0.4-€1.7] € 5.7 [€1.0-€15.7]
Neurology € 2.5 [€1.7-€3.3]
Oncology € 0.5 [€0.3-€1.0]
Haematology-
Hemostaseology € 0.1 [€0.0-€0.1] € 1.4 [€0.3-€3.0] € 2.5 [€0.3-€5.2] € 8.7 [€1.8-€15.4]
Overall average
costs € 0.8 € 1.6 € 7.3 € 15.7
Average estimated costs incurred by therapeutic areas are based on a minimum of two data points per PIP
category
Figure 6 Average cost incurred in relation to in-vitro studies and animal studies, by therapeutic area
€ 0,0
€ 0,5
€ 1,0
€ 1,5
€ 2,0
€ 2,5
€ 3,0
Mill
ion
s
Average
Infectious diseases
Endocrinology, -gynacology-fertility-metabolism
Neurology
Oncology
Haematology-Hemostaseology

29
Figure 7 Average cost incurred in relation to the development of a paediatric formulation, by therapeutic area
€ 0,0
€ 0,5
€ 1,0
€ 1,5
€ 2,0
€ 2,5
€ 3,0
€ 3,5
Mill
ion
s
Average
Cardiovasculardiseases
Infectious diseases
Endocrinology, -gynacology-fertility-metabolism
Haematology-Hemostaseology

30
Figure 8 Average cost incurred in relation to phase II paediatric clinical trials, by therapeutic area
Figure 9 Average cost incurred in relation to phase III paediatric clinical trials
€ 0,0
€ 1,0
€ 2,0
€ 3,0
€ 4,0
€ 5,0
€ 6,0
€ 7,0
€ 8,0
Mill
ion
s
Average
Infectious diseases
Endocrinology, -gynacology-fertility-metabolism
Haematology-Hemostaseology
€ 0,0
€ 2,0
€ 4,0
€ 6,0
€ 8,0
€ 10,0
€ 12,0
€ 14,0
€ 16,0
€ 18,0
Mill
ion
s
Average
Infectious diseases
Endocrinology, -gynacology-fertility-metabolism
Haematology-Hemostaseology

31
2.2.4.6 Collaboration with networks
Based on the survey results, 18% of PIPs involved a collaboration with a research network.
This included informal networks and consultations with paediatricians and formal networks
such as the European Paediatric Formulation Initiative (EUPFI), the Task-force in Europe for
Drug Development for the Young (TEDDY), the Medicines for Children Research Network
(MCRN), and the Innovative Therapies for Children with Cancer (ITCC). In some cases, there
may have been a monetary benefit from engaging in research collaborations. It is likely that
collaborations with academic partners not only help to drive more effective paediatric
research but also test drugs within the paediatric population at a lower cost.
2.3 Comparison of costs under the US legislation
The US has a different approach than that of the European Union to engaging with the
pharmaceutical industry. The US recognised the need for a paediatric exclusivity provision in
the FDA Modernization Act in 1997. Later, the Pharmaceuticals for Children Act (BPCA,
2002) and Pediatric Research Equity Act (PREA, 2003) came to represent a two-tier system
and the major cornerstones of the paediatric medicine development in the US. The FDA
Safety and Innovation Act (FDASIA) made BPCA and PREA permanent in 2012. While PREA
authorises the FDA to require paediatric assessments (triggered by a new drug application, or
new indication, active ingredient, dosage form, etc and hence mandatory), BPCA provides a
financial incentive to companies to voluntarily conduct paediatric studies under a paediatric
Written Request (WR), often initiated by the sponsor. The WR considers public health
benefits, availability of other medicinal products for the same indication, as well as the actual
feasibility of the study design. Note that the initial Pediatric Study Plan (iPSP) is only
required in PREA after the completion of adult Phase II trials. In addition, FDASIA also
introduced the (transferable) Priority Review Voucher Program for rare paediatric disease
indications. The US Government Accountability Office (GAO) published a report in March
2016 and concluded that since innovative medicinal product development typically takes 10
years before regulatory submission can take place, it may be too early to see the results of its
effectiveness.9
There are two prominent studies published in the US that calculate the costs of paediatric
clinical trials for the pharmaceutical industry (Li et al. 200710; Baker-Smith et al. 200811).
Li et al. (2007) selected one drug from each of the following therapeutic areas: cancer, central
nervous system, cardiovascular system, psychiatry, endocrinology, gastro-intestinal system,
infectious diseases and an ‘other’ category (based on EMA therapeutic area classifications).
The costs for paediatric clinical trials were estimated separately for each drug. This
estimation was based on detailed information regarding the clinical trials in the final study
reports which were submitted to the FDA, and included investigative site costs, contract
research organization costs, pharmaceutical company costs, and core laboratory costs in
9 GAO-16-319. United States Government Accountability Office: Report to Congressional Committees. RARE DISEASES: Too
Early to Gauge Effectiveness of FDA’s Pediatric Voucher Program. March 2016
10 Li, J.S. et al., 2007. Economic Return of Clinical Trials Performed Under the Pediatric Exclusivity Program. JAMA, 297(5),
pp.480–488. Available at: http://jama.jamanetwork.com/article.aspx?doi=10.1001/jama.297.5.480. 11 Baker-Smith, C.M. et al., 2008. The economic returns of pediatric clinical trials of antihypertensive drugs. American Heart
Journal, 156(4), pp.682–688.

32
relation to adult/mixed trials. The clinical trials for which costs were assessed included 13 to
1,088 patients, took 6 to 64 months and were conducted on 1 to 118 sites, most of them in the
US. Additional details of the trials considered in the estimations included the pre-study
preparation and recruitment, data processing, analysis, reporting and drug distribution as
well as initiation visits, monitoring, management and close-out of sites. The cost estimation
of these factors was based on three separate global cost and procedure benchmarking
databases and an internal pricing tool of a laboratory service for those clinical studies that
needed core laboratory services. Li et al. provided a ‘low’ and a ‘high’ estimate, with the
authors stating that, according to their experience, the high estimate is more likely to be
accurate in the context of paediatric clinical trials. Note that this approach differs from the
approach taken in the current study where product-specific incurred costs were estimated by
the sponsors of the trials.
Li et al. concluded that the costs for pharmacokinetic studies range between $655,139 to
$7.1m (median $894,941) and between $655,829 to $21m (median $2.3m), respectively, and
the costs for an efficacy study range between $1.8m to $12.9m (median $6.5m) – see also
Table 8 for adjusted cost estimates. This resulted in a range of costs for a WR between $5.1m
and $43.8m (median $12.3m), which included 1 to 8 clinical trials per request. After
adjusting for macro-economic changes12 this amounts to a cost per WR between €5.6m and
€47.9m (median €13.5m). Based on the data presented in the study of Li et al., we calculate
that the median cost per enrolled subject is €42.7k, which is lower than the median costs
presented in this study in relation to phase II and phase III R&D trials, which is € 77k.
Some of the authors of the first study conducted a second analysis, focussing on nine drugs
for the same indication, hypertension (cardiovascular diseases), in order to achieve a general
estimate of paediatric trial costs for drugs with this clinical indication (Baker-Smith et al.
200813). From 1997 to 2004, the FDA received final study reports for 12 antihypertensive
drugs, and the authors included in their sample all of those drugs which had a completed
final study report (24 in total) and were comparable in their clinical trial design, being all
orally administered. 75% of the studies were conducted in children, the remaining 25%,
which are bioequivalence/bioavailability studies, were conducted in adults. The authors
estimated the costs and cash-outflows with the same method as in their first study, providing
low and high estimates for each clinical trial. As in the previous study, the costs included
investigative site costs, contract research organization costs, pharmaceutical company costs,
and core laboratory costs. Not included were the costs of formulation changes, marketing
costs and distribution costs. The clinical trials for this sample of drugs included 16 to 441
patients over 6 to 50 months and were conducted on 1 to 78 mostly US sites.
Estimated adjusted-costs per WR for these nine range from €4.2m to €15.5m (median
€6.6m), which includes the cost of bioequivalence/bioavailability studies. 41% to 73% of costs
of clinical trials were related to coordination (linked that the cost incurred by a coordinating
centre), including the cost of site management and project management.
12 Costs adjusted for inflation capture the increase in inflation (21.4%) between 2005 (costs reported in the study are adjusted to
2005 US dollars) and 2015. We use http://www.usinflationcalculator.com/. Cost are converted from US dollar costs to Euros
(exchange rate for 2015 - 0.9009). We have used https://www.oanda.com/currency/average
13 Baker-Smith, C.M. et al., 2008. The economic returns of pediatric clinical trials of antihypertensive drugs. American Heart
Journal, 156(4), pp.682–688.

33
As presented in Table 8, the adjusted-median cost for efficacy and safety clinical trials,
similar to phase II trials, is lower for the study of Bakker-Smith et al (€4.7m) which looks at
hypertension than the adjusted-median costs presented in Li et al. (€7.1m), which covers a
range of drugs. Both figures are higher than the estimated median costs for phase II R&D
trials that is presented in this study (€1.7m). Median costs for efficacy and safety clinical
trials and pharmacokinetic studies per subject (see Table 8) are roughly less than half of the
median cost estimates presented in this study in relation to phase II and phase III trials
(€77k).
Table 8 Overview of estimated costs for ‘Written Requests’
Median and range Li et al. et al.
2007
Median and range Baker-Smith
et al. 2008
Cost
per
written
request
Efficacy and safety clinical
trials (phase II)
€ 7.1m [€0m - €14.1m] €4.7m [€2.3m - €14.1m]
Pharmacokinetic studies €1.0m [€0.7m - €7.8m] (single-dose)
€2.5m [€0.7m - €23.0m] (multi-dose)
€0.9m [€0.6m - €2.0m]
Cost
per
subject
Efficacy and safety clinical
trials (phase II)
- €35k [€21k- €56k]
Pharmacokinetic studies - €32k [€15k - €52k]
We recalculate the financial cost data per trial from our sample dataset and present the
results along with the study of Li et al. We aggregate the cost elements of phase II, phase III
and other R&D costs to reflect the overall R&D cost related to paediatric drug development
and adjust this cost estimate for inflation and exchange rates. We thus compare this average
cost estimate with the average cost estimate of presented earlier in the current study. Figure
10 presents an overview of the adjusted cost data of Li et al14 in various therapeutic areas.
Whilst the average costs presented in the current study are intended to reflect average cost to
industry, it should be noted that the data from Li et al. is not intended to be representative of
the industry. The adjusted average cost estimate based on the data of Li et al. amounts to
€21m, higher than our €18m cost estimate for phase II, phase III and ‘other’ R&D costs. We
likewise note the high variation in costs related to paediatric investigation for different drugs:
ranging from €6m to €48m. However, when the US and EU cost estimates are compared per
study, the variations become less pronounced (Figure 11). The average cost of a paediatric
14 Costs are adjusted for inflation to capture the increase in inflation (24.27%) between 2005 (trial costs were estimated in 2015
US dollars) and 2015. We use http://www.usinflationcalculator.com/. Cost are converted from US dollar costs to Euros
(exchange rate for 2015 - 0.9009). We have used https://www.oanda.com/currency/average. Figure 10 presents cost by
therapeutic area. Data on indication from Li et al. is used to categorise the cost estimates using the therapeutic area
categorisation used by EMA.

34
study according to Li et al is €7m, with individual therapeutic areas ranging from €3m to
€11m, while the calculated cost per study is €6m in the current study.
Figure 10 Estimated costs of paediatric investigations (related to the development of a drug), based on Li et al.
(2007)
Figure 11 Estimated costs of a paediatric study, based on Li et al. (2007)
€ 48 € 44
€ 21 € 20
€ 16
€ 12 € 9 € 9
€ 6
€ 21 € 18
0 €
5 €
10 €
15 €
20 €
25 €
30 €
35 €
40 €
45 €
50 €
Mil
lio
ns
€ 11 € 11
€ 9
€ 8
€ 6 € 6 € 6 € 5
€ 3
€ 7 € 6
0 €
2 €
4 €
6 €
8 €
10 €
12 €
Mil
lio
ns

35
2.3.1 Harmonisation of submissions to EMA with submissions to the FDA
In 2007, EMA and FDA established the Paediatric Cluster to discuss (through monthly
teleconference) product-specific paediatric development issues under a confidentiality
agreement (now also joined by Japan, Canada and Australia). The objective of these
exchanges is to enhance the science of paediatric trials (discussions on end points, safety and
feasibility issues) and to avoid exposing children to unnecessary trials. Since 2007, the FDA
and EMA have exchanged information on a total of 413 products and held 132 discussions on
general topics.15 A Common Commentary has been developed as a tool to inform paediatric
trial sponsors about non-binding discussions at the Paediatric Cluster of products that have
been submitted to both FDA and EMA.
Our survey to industry also asked if the data from a PIP was also used to apply to the FDA. A
breakdown of the results is presented in Figure 12. Data from 54% PIPs were suggested to be
(partially) used to apply to the FDA and/or discussions with the FDA were in progress. This
includes submissions as part of PREA and data included in waiver applications. Only a small
proportion (3%) of these PIPs were discontinued, possibly after submission to the FDA.
Data for the remaining PIPs was reported to not be used for applying to the FDA – a larger
proportion of these PIPs (15%) were discontinued. Reasons for not using the PIP data as part
of a submission to the FDA include the following:
PIP was discontinued before application was filed with the FDA
PIP applicant received a waiver for orphan drugs
PIP was initiated post-US approval
FDA and EMA did not agree on a harmonised plan – different study design requested
Despite some of the difficulties in harmonising the submissions to EMA with those to the
FDA, there are substantial opportunities for data sharing. This joint approach has the
potential to contribute to lower regulatory costs to companies overall and thus enhanced
efficiency.
15 http://www.fda.gov/ScienceResearch/SpecialTopics/PediatricTherapeuticsResearch/ucm106621.htm

36
Figure 12 Distribution of PIPs that use or plan to use data generated for submission to the FDA (yes) versus
those that do not use data for submission to the FDA (no)
2.4 Comparison of R&D costs of paediatric trials with adult population trials
Two studies specified particularities of paediatric clinical trials, which are likely to lead to
higher costs for these trials compared to the ones with adult patients (Mathis & Rodriguez
200916; Upadhyaya et al. 200917). These included the limited number of patients available for
trials, since the physiological changes in children require conducting separate studies for
different age groups and to assess the patients’ unique growth and development regularly
during clinical trials. One industry survey respondent remarked that “the many scientific,
ethical and practical complexities involved have traditionally made paediatric studies more
challenging, costly and time-intensive than those conducted in adults”.
This suggests that cost per trial subject is likely to be higher for paediatric studies. In this
section we compare the average cost estimates presented in this study with that available in
the literature looking at the cost involved in adult/mixed trials.
DiMasi et al. (2016)18 provide estimates for industry ‘out-of-pocket’ clinical period costs for
investigational compounds. Table 9 presents a breakdown comparing the paediatric cost
16 Mathis, L. & Rodriguez, W., 2009. Drug therapy in pediatrics: A developing field. Dermatologic Therapy, 22(3), pp.257–261.
17 Upadhyaya, H.P., Gault, L. & Allen, A.J., 2009. Challenges and Opportunities in Bringing New Medications to Market for
Pediatric Patients. Journal of the American Academy of Child & Adolescent Psychiatry, 48(11), pp.1056–1059.
18 DiMasi, J., Grabowski, H., and Hansen, R. (2016). Innovation in the pharmaceutical industry: new estimates of R&D costs.
Journal of Health Economics, 47.
0%
10%
20%
30%
40%
50%
60%
Notdiscontinued
Discontinued Notdiscontinued
Discontinued
Yes Yes No No

37
estimates with the data of DiMasi et al, for phase II and phase III. Cost estimates of DiMasi et
al. are adjusted for inflation and exchange rate differences19.
The result shows that the average cost of paediatric phase II and phase III clinical trials are
only a small fraction (14% for phase II and 7% for phase III) of the cost estimates published
by DiMasi et al. It is possible that part of the €14.4m allocated to ‘other R&D costs’ element
in the data survey of the current study (Table 3) may be linked to phase II or phase III clinical
trials. However, even with full attribution of these costs to either clinical trial phases, the
average cost of a paediatric trial would remain significantly lower than the average cost
estimate of adult/mixed clinical trial in the work of DiMasi et al.(2016). It should also be
noted that the standard deviations presented by DiMasi et al. are comparatively high
suggesting a relatively larger variation in the underlying data.
One possible explanation for the cost differential is that adult clinical trials may involve a
relatively larger number of trial subjects. Also, clinical trials for adult population is more
likely to involve double blind placebo controlled confirmatory studies, which, depending on
the therapeutic area, may differ in size and scope. Additional analysis of available evidence is
needed to compare the costs per subject of paediatric trials with those of adult population
trials.
Table 9 Comparison of estimated cost of a paediatric clinical trial compared with average-out-of-pocket clinical
period costs, in millions of euros
Phase II
paediatric
clinical trial
cost
Phase II
clinical trial
cost (based
on DiMasi et
al)
Phase II
paediatric
clinical trial
cost as a
percentage
of phase II
clinical trial
cost
Phase III
paediatric
clinical trial
cost
Phase III
clinical trial
cost (based
on DiMasi et
al)
Phase III
paediatric
clinical trial
cost as a
percentage
of phase III
clinical trial
cost
Average € 7.3 € 53.7 14% € 15.7 € 234.0 7%
Median € 1.7 € 41.0 4% € 1.5 € 183.2 1%
Standard
deviation 14.3 50.8 22.4 153.3
Source: average-out-of-pocket clinical period costs are based on Di Masi et al. (2016)
19 Costs adjusted for inflation capture the increase in inflation (1.7%) between 2013 (trial costs were estimated in 2015 US
dollars) and 2015. We use http://www.usinflationcalculator.com/. Cost are converted from US dollar costs to Euros (exchange
rate for 2015 - 0.9009). We have used https://www.oanda.com/currency/average

38
3 The value and the costs of the rewards and incentives
This chapter presents the results of the analysis of the economic value of the rewards and
incentives provided under the Paediatric Regulation in relation to the six-month SPC
prolongation (article 36), the ‘orphan’ reward (article 37) and the PUMA reward (article 38).
First presented is the methodological framework, which was developed to assess the overall
value and costs of the rewards provided by the Regulation, followed by the results of the
analysis for each of the three rewards.
3.1 Methodological framework
In this section, we first present and discuss the main principles underlying the
methodological framework that we developed for analysing the value and costs of the
rewards. Thereafter, we present the methodological framework, as well as the data and
approach used in the analysis.
3.1.1 The main principles underlying the methodological framework
The focus of the analysis is on the value and costs of the three main rewards to industry
provided by the Regulation. The concept of value and costs covers three main elements:
The Regulation aims to stimulate investments and research with regard to the 1.
development of medicines for children. In accordance with recital 2 and recital 6 of the
Regulation (EC) no 1901/2006 “many of the medicinal products currently used to treat
the paediatric population have not been studied or authorized for such use. Market forces
alone have proven insufficient to stimulate adequate research into, and the development
and authorisation of, medicinal products for the paediatric population. (…) The
establishment of a system of both obligations and rewards and incentives has proved
necessary to achieve these objectives.”
The Regulation rewards pharmaceutical companies via a (temporary) protection against 2.
the regular forces of competition in the pharmaceutical market. This protection is
arranged via the creation or extension of temporary exclusivity rights. Under the
Regulation these rights are data exclusivity, market exclusivity and market protection.
As a result of the temporary exclusivity rights, the pharmaceutical companies could profit 3.
from a longer period of protection. In practice this means that the market entry of new
(generic) competition is delayed and that originator companies can charge ‘monopoly
prices’ for a longer period.
3.1.1.1 Addressing market failures20
The main driver for the introduction of the Regulation was the absence of sufficient numbers
of suitable and authorised medicinal products for the paediatric population. The reason for
the lack of paediatric medicines is related to the existence of market failures that have
inhibited medicinal product development. Medicine for children can be regarded, to some
extent, as a public good that contributes to the health and wellbeing of current and future end
20 Based on: Ecorys, ‘Competitiveness of the EU Market and Industry for Pharmaceuticals - Volume I: Welfare Implications of
Regulation’, December 2009, Chapter 3 and 4; and Ecorys ‘How well does regulation work? The cases of paediatric medicines,
orphan drugs and advanced therapies’, November 2015.

39
users. The willingness for originator companies to invest in R&D in relation to new medicine
is reduced because competitors will be able to trace the product components at the time the
product is launched, hence eroding potential profits the originator can accrue. The so-called
free-riders forgo the large R&D investment made by the originator in relation to product
development. In the case of paediatric medicines, the attractiveness to invest is often reduced
further when the target group of patients is small in size and heterogeneous.
According to economic theory these market failures can be partially resolved by the
introduction of temporary market exclusivity rights (e.g. patent protection), which allow the
originator to accrue monopoly level profits from the product developed for a longer period of
time. The additional profits are a reward for the (risky) R&D investments made in relation to
product development.
3.1.1.2 The creation or extension of temporary exclusivity rights21
In the European Union, the development of new medicinal products can be protected by a
patent that is filed at the national patent office of individual Member States or via a single
patent application at the European Patent Office (EPO). In the latter case, which is used by
the majority of pharmaceutical companies, a national validation of the ‘European patent’ is
still necessary. The European patent is granted by the EPO for each Member State where the
patent owner wishes the patent to exist and to be enforceable.22 In Europe (and the US),
patent protection may be obtained for up to 20 years,23 starting from the moment the patent
application is filed at the patent office of the territory concerned.24 Note that to compensate
the R&D investment made in relation to a new chemical entity (NCE), the patent can be
extended by a maximum of 5 years (i.e. 25 years of patent protection in total). However,
patent protection does not guarantee that the ‘product information’ (which is also valuable to
the society as a whole) cannot be used during the period of patent protection. Within the
limitations of the patent right, the information is available in the public domain and can be
used by others for further R&D.
For medicinal products the specific market protection consists of (i) an eight year period of
‘data exclusivity’25 and (ii) a two year period of ‘market protection’26. This means that a
21 Based on: Ecorys, ‘Competitiveness of the EU Market and Industry for Pharmaceuticals - Volume I: Welfare Implications of
Regulation’, December 2009, Chapter 3 and 4; and Ecorys ‘How well does regulation work? The cases of paediatric medicines,
orphan drugs and advanced therapies’, November 2015.
22 European Commission, DG Competition, 2009, Pharmaceutical Sector Inquiry, final report. The criteria EPO uses for granting
a patent are based on the European Patent Convention (EPC) of 1973 and later amendments to the EPC.
23 These 20 years is based on WTO-agreements. The ‘Agreement on Trade Related Aspects of Intellectual Property Rights’
(TRIPS) determines that patent protection must be available for inventions for at least 20 years. See also:
https://www.wto.org/english/thewto_e/whatis_e/tif_e/agrm7_e.htm.
24 The Sector Inquiry states that this period of 20 years reflects the assessment by the legislator that the end of this period is the
point in time where the cost to society of continued patent protection (lack of competition, prices above the marginal costs, extra
profits to the patent holder), starts exceeding the benefits (research, investments, etc.). See: European Commission, DG
Competition, 2009, Pharmaceutical Sector Inquiry, final report.
25 Data exclusivity: period of time during which a company cannot cross-refer to the data in support of another marketing
authorisation; See: http://www.ema.europa.eu/docs/en_GB/document_library/Presentation/2013/05/WC500143122.pdf.
26 Market protection: period of time during which a generic, hybrid or biosimilar cannot be placed on the market, even if the
medicinal product has already received a marketing authorisation. In case of a ‘new indication’, the period of market protection
will be extended to three years. Available via:
http://www.ema.europa.eu/docs/en_GB/document_library/Presentation/2013/05/WC500143122.pdf.

40
generic application can be submitted to the EMA eight years after the patent is filed and a
generic product can be launched after ten years. Another type of protection exists for
medicines with an orphan designation which have received a marketing authorisation. For
these medicines, no other application for a marketing authorisation for a similar product in
the same therapeutic indication will be considered by the competent authority for a period of
ten years.27 The period of market exclusivity granted under the orphan reward (article 37, see
also section 3.3) is extended by two years if the application for a marketing authorisation
includes the results of all studies conducted in compliance with an agreed Paediatric
Investigation Plan (PIP). The PUMA reward (article 38, see section 3.4) gives the
manufacturer an 8-year period of data exclusivity. After these 8 years, there is an additional
period of two years of market protection.
In the 1990s, a supplementary protection certificate (SPC) was created for medicinal
products.28 The main reason for this was to provide the originator companies an extension of
the protection granted by the primary patent, due to the usual delay between the filing of a
patent application and the authorisation for market launch, which substantially reduced the
period in which a patent owner can commercially exploit the patent for a medicinal product.
Not all patents are eligible for an SPC. The SPC has a variable duration (from zero to a
maximum of five years), and as a result the holder of both a patent and a SPC should be able
to enjoy an overall maximum of 15 years of exclusivity from the time the medicinal product in
question first obtains authorisation to be placed on the market in the European Union.29
Following article 36 it is possible to reward the holder of a patent or SPC with a six-month
extension of the duration of the SPC (see also section 3.2). This reward can be granted if an
application for marketing authorisation includes the study results as agreed in the PIP. Please
note that the extension period of six months was not undisputed at the time of drafting and
adopting the Paediatric Regulation. While the proposal of the Commission for the Regulation
contained the six-month period, some Member States suggested shortening the six-month
SPC prolongation (e.g. to three months) because the measure would delay the entry of
generic medicines too much. Others suggested determining variable extension periods which
should depend on the financial returns. Finally, the six-month SPC prolongation was
retained, in combination with the obligation to conduct an assessment of the economic
impact, provided enough information is available.30
3.1.1.3 Economic value of the rewards
Under the Paediatric Regulation pharmaceutical companies may benefit from eg a
prolongation of the SPC, granting the companies market exclusivity for a longer period of
time. The resulting higher profits, ie the economic value of the rewards, for these
pharmaceutical originator companies also results in higher costs for healthcare. The impact
on the pharmaceutical companies and healthcare system is described in the following
sections.
27 EMA, see slide 18: http://www.ema.europa.eu/docs/en_GB/document_library/Presentation/2013/05/WC500143122.pdf.
28 Council Regulation No 1768/92 concerning the creation of a supplementary protection certificate for medicinal products.
29 European Commission, DG Competition, 2009, Pharmaceutical Sector Inquiry, final report, p. 111-113.
30 Dunne, ‘Regulation on medicines for paediatric use’ in: Paediatric respiratory reviews (2007) 8, 177–183.

41
3.1.2 Methodological framework for estimating the economic value of exclusive rights31
The assessment of the economic value of the reward is based on the following key
assumption. As a result of the market exclusivity extension, there is a delay in the shift from
the (higher) monopoly prices to the (lower) competitive market prices. This delay in the
change of price is calculated to represent the economic value of the rewards.
The standard economic theory states that in a competitive market situation, the price of a
product equals the marginal costs of that product. The main explanation for this equilibrium
is that, due to the price pressure from other competitors, it is not possible for a company to
charge a relatively higher price without losing market share. In a situation of market
exclusivity competitive market pressure is absent (or very small) and the monopolist is able
to charge above the marginal cost price. This higher price corresponds, in comparison with
the competitive market situation, with a lower quantity of product sales. This model is
presented in the figure below.
Figure 13 Monopoly vs competitive situation
Note in a competitive situation, the price (Pc) equals the marginal costs and results in a certain quantity of sold
products (Qc). In a monopolistic situation, the monopolist can charge a higher price (Pm) which leads to a lower
quantity sold (Qm). The underlying assumption is here that a company, who wants to maximize the profit, should
set the output (quantity) on the level that the marginal revenues equal the marginal costs.
A monopolist benefits from a higher price but, because prices are relatively higher, forgoes
some opportunity to sell. The ‘surplus’ is represented by rectangle A (profit for the company)
and triangle C (loss for the company) in the figure above. As a result of the monopoly price
and quantity, consumers lose a ‘surplus’ of rectangle A and triangle B in the figure.
31 Based on: Pindyck, R.S. and Rubinfield, D.L., ‘Microeconomics’, 5th edition, 2001, chapter 10.

42
Rectangle A represents the profit accrued by the monopolist and the loss for the
(potential) consumer.
Triangle B and C represent the deadweight loss from monopoly power and loss to society:
even if the monopoly profits are regulated to zero, the surplus for the society as a whole is
lower than in a competitive situation. 32
The standard economic theory as described above is used to capture the impact from the
Paediatric Regulation on pharmaceutical companies and on the healthcare system. In this
case, the market is first represented by a monopolist that has exclusivity rights and then
shifts towards a competitive market situation as a result of generic entry. In the situation of
the Paediatric Regulation, the granted exclusivity rights prolong the monopolistic market
situation.33
3.1.3 Estimating the economic value of exclusivity rights
The methodological framework which is used in this study is a combination of the economic
principle of the ‘deadweight loss from monopoly power’, the applied research of Nelson
(2012) and the approach presented by DG COMP (2009), see Appendix C. In order to assess
the ‘economic value’ of the rewards, two dimensions need to be taken into account.
The rewards compensate the originator companies with a longer period of protection
from the introduction of competing generic medicines and policies which favour the
prescription of generic medicines
Because the introduction of generic medicines is delayed, society does not benefit from
increased competition and lower prices for the duration of the exclusivity extension
This is illustrated in the figure below.
32 Pindyck, R.S. and Rubinfield, D.L., ‘Microeconomics’, 5th edition, 2001, section 10.4.
33 In case of the PUMA reward the monopolistic market situation is not prolonged, but created: it did not exist before the
granting of the PUMA reward.

43
Figure 14 Calculation of the economic value (hypothetical situation)
Note that in this study t represents 1 quarter (3-month period)
The figure above shows the actual revenue development of an originator product with a
reward.34 The revenue starts to drop at the moment the exclusivity right ends (vertical line at
t=0) and a generic producer enters the market. At a certain moment (t=5) the market reaches
a new equilibrium. Without the additional reward the generic producer can enter the market
earlier and the revenue drop of the originator will start (six month) earlier. In combination
with the actual revenue development of the originator company, the shaded area represents
the ‘economic value’. This is a temporary ‘benefit’ for the originator company and a
temporary ‘loss’ for the society. In line with the approach of DG COMP (2009), we shift the
actual curve (“Originator – actual development”) six month to the left (“Originator –
hypothetical development”) and estimate the difference between the two curves.35
Note that this is a simplified model for illustration purposes. In reality, there are several
other factors which influence the economic value of the reward which may affect the
revenue/price drop curves across EU Member States.
When interpreting national sales data from comparative perspective, it is important to
account for the proportion of patients on treatment and the manufacturer price. The
originator company may follow a different pricing strategy by anticipating the moment
the exclusivity right expires and lower the price gradually or keep the price stable for a
longer period if there is still no generic product.
The economic value of the reward can also be influenced by the availability of competing
(generic) products which function as an alternative or substitute. If there is no generic
34 This examples refers to (i) a SPC extension, or (ii) an orphan reward. In case of the PUMA-reward, there is a reversed dynamic
(the start instead of the end of an exclusive right). See also section 3.5.
35 Note that there is another approach to calculate the economic value. In this approach one calculates, for the two quarters
before the SPC-expiry, the difference between (i) the actual revenue of the originator (dark blue line) and (ii) the revenues of the
originator in the new equilibrium (dotted red line). The area of this rectangle represents the ‘economic value’. The result of this
second approach is equal to the primary approach, the project team tested this for a few products.
t= -5 t= -4 t= -3 t= -2 t= -1 t=0 t=1 t=2 t=3 t=4 t=5 t=6
Re
ve
nu
es (p
rice
tim
es v
olu
me)
Originator - actual dvelopment Originator - hypothetical development
Generic entry

44
medicine available, the revenues of the originator product may remain stable after the
expiration of the exclusivity right. This factor also relates to the existence of clinical
guidelines and the willingness of patients to switch between different brands of
medicines. A recommendation on using a particular drug is very likely to have a positive
effect on the sales of the drug. The results from the interviews conducted in this study
confirm that in some Member States patients want to continue using the (branded)
medicines they are familiar with, despite a substantial price difference. If this is the case,
the pressure on the originator company to lower the price is limited.
Finally, national (reimbursement) policies and regulation are important factors
that influence prices. European countries use different approaches regarding the pricing
of generics. Some countries (e.g. France) use prescriptive pricing (regulated prices), other
countries (e.g. Sweden, Netherlands) apply free pricing36. Different approaches to the
pricing of generics among European countries can lead to substantial variation between
originator and generic prices37. Also, countries may emphasise the prescription of generic
products through national policies (e.g. Sweden38). Beside that there exist incentives to
keep the originator price high in certain countries, due to the fact that other countries use
those prices as a reference price in determining the reimbursement price they pay.
In sections 3.2-3.4 we present the results of estimating the economic value per type of
reward. In addition to calculating the economic value a number of other relevant elements
were determined. These elements are in line with the analysis of DG COMP as described in
Appendix C:
Generic entry and time to entry - The actual level of generic entrants after the loss of
exclusivity (probability of generic entry and number of generic entrants) as well as the
time it requires a generic producer to enter the market with a generic product after the
loss of exclusivity;
Price change - The change in (branded) prices due to generic entry. The estimations are
based on the price level prior and after the loss of exclusivity. The price change is
calculated for the long-run and for specific periods (if possible: 1-4 years after the loss of
exclusivity);
Generic penetration - The shares of generic producers (in terms of volume39) in the period
after the loss of exclusivity and in comparison to the shares of the originators;
Substitution effects - Where relevant we will also pay attention to substitution effects,
which implies that within the same therapeutic class, volume is shifting from one product
(INN) to another.
See Appendix C for more details on the approach taken to determine these effects.
36 Simoens, S., 2012, A review of generic medicine pricing in Europe, GaBI Journal, 1(1), p. 8-12.
37 McKee, M., Stuckler, D. and Martin-Moreno, J.M., 2010, Protecting health in hard times, BMJ, 341:c5308.
38 Hassali, M. et al., 2014, The experiences of implementing generic medicine policy in eight countries: A review and
recommendations for a successful promotion of generic medicine use. Saudi Medical Journal. 22:491-503.
39 In this specific case we choose volume (number of sold single units) over revenues, due to the fact that the price differences
between branded and generic products disturb the overall picture. The volume data is more accurate in terms of the relative
share of generic and branded products after the loss of exclusivity.

45
3.2 The six-month SPC prolongation (article 36)
Under article 36 of the Regulation it is possible to reward the holder of a patent or SPC with a
six-month extension of the duration of the SPC (see also section 3.1). This reward can be
granted if an application for marketing authorisation includes the study results as agreed in
the PIP.40
The section below provides a brief description of the actual use of the reward in practice. The
section thereafter presents the results of the analysis, which covers the generic entry, the
envisaged price changes, the level of generic penetration, substitution effects and finally the
economic value.
The analysis for this section is based on IMS Health data provided by the European
Commission for period between 2008-2014 (the last available data point is the 3rd quarter of
2014). The scope and limitations of the dataset are described in Appendix C. The analysis in
this report covers products which (i) received a SPC extension in the period between 2007-
2012 and (ii) lost their exclusivity before the third quarter of 2014. This choice for this period
is related to the need to have enough observations in the data after the loss of the exclusivity.
The data available for the study covered 14 products which received the SPC extension in this
period (see also Table 10). However, five products received the reward but were still under
protection in the third quarter of 2014. For one product, available data did not allow to make
a distinction between protected and non-protected products with an SPC extension. See
Appendix C for a detailed description. The remaining eight products are used in the analysis.
The analysis also builds on interviews with pharmaceutical industry.
3.2.1 Actual use of the six-month SPC prolongation
Over the period 2007-2015 the SCP reward was granted to 32 different medicinal products.
In total there were 311 extensions, as not all medicinal products received the six-month
extension in each Member State.41 For Losartan for example the producer received the SPC-
reward in eleven countries, while for Caspofungin this concerned 19 countries. An overview
is presented in Table 10 below.42 The data available for the study included 14 products
but for the analysis only used eight products were included. Products are excluded
from the data analysis due to patent expiry after 2015 and in one case (Drug D) a
product was excluded from the data analysis due to differentiation issues; the SPC
product could not be isolated from the non-SPC products.
40 Regulation (EC) No 1901/2006 on medicinal products for paediatric use, in combination with the Council Regulation No
1768/92 concerning the creation of a supplementary protection certificate for medicinal products.
41 European Medicines Agency; the annual publications by the Paediatric Committee (PDCO) and the 5-year Report to the
European Commission (2012 on the experience acquired as a result of the application of the Paediatric Regulation
(EMA/428172/2012). The EMA indicated that these annual (survey) reports are not complete: it is estimated they have a
coverage of approximately 80% of the actual number of granted SPCs.
42 Note that from the total number of paediatric drugs, we excluded (i) duplicates, (ii) applications with pending status. Drugs
with associated names were merged.

46
Table 10 Number of SPCs per medicine per year in the EU-28: 2007-2012 and 2007-2015
No Marketing authorisation holder Brand name INN 2007-
09 2010 2011 2012
Total
07-12 2013 2014 2015
Total
07-15
1 Bristol-Myers Squibb Pharma EEIG Orencia Abatecept 7 6 3 16 1 17
2 AbbVie Ltd Humira Adalimumab 13 13
3 AstraZeneca AB Arimidex a.a.n. Anastrazole 2 10 12 12
4 Otsuka Pharmaceutical Europe Ltd Abilify Aripiprazole 1 1
5 Actelion Registration Ltd Tracleer Bosentan 11 11
6 Merck Sharp & Dohme Cancidas Caspofungin 7 6 1 1 15 3 1 19
7 Sanofi BMS Plavix a.a.n. Clopidogrel 4 5 9 9
8 Janssen-Cilag International NV Prezista Darunavir 9 9
9 Bristol-Myers Squibb Pharma EEIG Baraclude Entecavir 4 7 11
10 Pfizer Limited Enbrel Etanercept 5 5 4 1 1 11
11 Merck Sharp & Dohme Ezetrol a.a.n. Ezetimibe 4 4
12 Novartis Europharm Limited Glivec Imatinib 1 7 5 13
13 Janssen Biologics B.V. Remicade Infliximab 6 6 1 1 8
14 Novo Nordisk A Levemir Insulin detemir 3 3
15 Sanofi-Aventis Deutschland GmbH Lantus Optisulin Insulin-glargine 4 4 5 1 10
16 Les Laboratoires Servier Corlentor/Procoralan Ivabradine 5 5
17 Pfizer Xalatan a.a.n. Latanoprost 11 11 11
18 Merck Sharp & Dohme Inc. Cozaar a.a.n. Losartan 10 1 11 11

47
No Marketing authorisation holder Brand name INN 2007-
09 2010 2011 2012
Total
07-12 2013 2014 2015
Total
07-15
19 Merck Sharp & Dohme Singulair Montelukast 4 5 9 9
20 Boehringer Viramune Nevirapine 2 8 10 10
21 Merck Sharp & Dohme (Europe)
Inc. Maxalt Rizatriptan 11 11 1 1 13
22 AstraZeneca AB Crestor a.a.n. Rosuvastatin 7 7
23 J. Uriach y Compañía, S.A. Rupafin Rupatadine 2 2 4
24 Pfizer Limited Tygacil Tigecycline 9 9
25 Boehringer Spiriva Tiotropium
bromide 13 1 14
26 Otsuka Pharmaceutical Europe Ltd Samsca Tolvaptan 8 8
27 Alcon Laboratories (UK) Ltd Travatan Travoprost 3 3
28 Sanofi Pasteur MSD Gardasil Vacc.
papillomavirus 3 7 10
29 Roche Registration Limited Valcyte Valganciclovir 2 3 5
30 Novartis Pharma AG Diovan a.a.n. Valsartan 10 2 12 12
31 Pfizer Limited Vfend Voriconazole 6 10 16
32 Novartis Zometa a.a.n. Zoledronic acid 11 2 1 14 14
Total 19 45 32 49 145 36 29 102 31
Based on the Annual Reports to the European Commission (prepared by the Section Paediatric Medicines of EMA). Notes: (i) the numbers represent the decisions to
grant a SPC-extension; the actual period to use the reward may be years later; (ii) the granted SPCs for atorvastatin, colesevelam, paclitaxel albumine and sitagliptin were
not reported in the Annual Reports. The list including these four products was published after conducting the analysis.


49
In terms of the geographical spread of the SPC extensions, there is a clear distinction between
the Member States who joined the EU after 2003 (EU-13) and the other Member States (EU-
15). The countries with the highest number of SPCs are located in West and North Europe
(EU-15). According to interviewees, this relates to original design of the patents in the EU-15
Member States: SPC extensions fit better with the patents granted in these Member States.
Figure 15 Geographical spread of granted SPCs in the EU in 2007-2015 (left) and 2007-2012 (right)
Based on the annual reports to the European Commission, prepared by the Paediatric Medicines Office of EMA
3.2.2 Generic entry and time to enter
We assessed the actual level of generic entrants after the loss of exclusivity, as well as the
time it requires a generic producer to enter the market. The analysis covers the level of
generic entry per country and per product. The results of the analysis are presented in the
Table below. Based on the data analysis of the eight selected products two main observations
can be made:
Generic entry - the analysis shows that for all eight products there exists generic entry. The
number of entrants43 varies between products and countries. The largest numbers of entrants
can be found in countries such as France, Germany, and Italy. In these countries, the number
of entrants is substantial for certain products - Drug A, Drug E, Drug F, Drug H and (in some
cases more than 20 companies enter the market). However, other countries, like The
Netherlands, Ireland, and especially Sweden, also show a substantial number of generic
entrants, although their number varies across the different drugs.
43 These are individual companies. The data is cleaned for duplications.

50
Time to enter –the data shows that the average time it takes a generic producer to enter the
market with a generic product (after the loss of exclusivity) is relatively short. Again, there
exist substantial differences between countries and products. For all products there is generic
entry in the first quarter in at least five countries. In Germany, Italy, Ireland, the
Netherlands, Sweden and the UK market entry is visible for nearly all products44 (with a very
few exceptions) in the first quarter after the loss of exclusivity.
Table 11 Level of generic entrants after the loss of exclusivity
International Non-proprietary Name
Drug
E
Drug
H
Drug
F
Drug
A
Drug
C
Drug
B
Drug
G
Drug
I
Austria
First entry (quarter) Q1 Q1 Q1 Q1 Q1
No. of entries in 1st quarter 8 2 12 2 4
No. of entries in 2nd quarter 4 7 12 11 6
Max. no. of generic entries until Q3/14 16 16 20 14 11
Belgium
First entry (quarter) Q1 Q1 Q1
No. of entries in 1st quarter 3 7 1
No. of entries in 2nd quarter 5 7 1
Max. no. of generic entries until Q3/14 9 10 2
Finland
First entry (quarter) Q1 Q1 Q1 Q1
No. of entries in 1st quarter 8 5 11 6
No. of entries in 2nd quarter 13 6 16 7
Max. no. of generic entries until Q3/14 19 9 16 9
France
First entry (quarter) Q1 Q1 Q1 Q1 Q1
No. of entries in 1st quarter 18 13 4 14 3
No. of entries in 2nd quarter 20 18 4 15 4
Max. no. of generic entries until Q3/14 26 28 5 26 10
Germany
First entry (quarter) Q1 Q1 Q1 Q1 Q1 Q1 Q1 Q1
44 With a few exceptions: Ireland (Drug C, Drug B), the Netherlands (Drug I), UK (Drug A).

51
International Non-proprietary Name
Drug
E
Drug
H
Drug
F
Drug
A
Drug
C
Drug
B
Drug
G
Drug
I
No. of entries in 1st quarter 26 17 26 22 4 11 21 14
No. of entries in 2nd quarter 35 21 33 27 6 15 26 20
Max. no. of generic entries until Q3/14 47 34 47 29 6 18 32 31
Ireland
First entry (quarter) Q1 Q1 Q1 Q1 Q1 Q1
No. of entries in 1st quarter 8 6 9 10 11 8
No. of entries in 2nd quarter 11 7 10 12 12 9
Max. no. of generic entries until Q3/14 16 16 14 17 16 9
Italy
First entry (quarter) Q1 Q1 Q1 Q1 Q1 Q1 Q1 Q1
No. of entries in 1st quarter 11 21 12 13 0 7 13 5
No. of entries in 2nd quarter 13 22 15 18 1 7 17 9
Max. no. of generic entries until Q3/14 31 30 27 36 2 10 32 12
Netherlands
First entry (quarter) Q1 Q1 Q1 Q1 Q1 Q1 Q1 Q2
No. of entries in 1st quarter 9 8 9 2 3 6 6 0
No. of entries in 2nd quarter 9 7 11 8 3 7 7 2
Max. no. of generic entries until Q3/14 10 9 13 9 4 7 9 4
Portugal
First entry (quarter) Q1 Q1 Q1
No. of entries in 1st quarter 3 1 1
No. of entries in 2nd quarter 3 1 5
Max. no. of generic entries until Q3/14 4 22 11
Romania
First entry (quarter) Q1
No. of entries in 1st quarter 2
No. of entries in 2nd quarter 13
Max. no. of generic entries until Q3/14 17
Spain
First entry (quarter) Q1 Q1 Q1

52
International Non-proprietary Name
Drug
E
Drug
H
Drug
F
Drug
A
Drug
C
Drug
B
Drug
G
Drug
I
No. of entries in 1st quarter 24 5 9
No. of entries in 2nd quarter 25 6 10
Max. no. of generic entries until Q3/14 32 7 14
Sweden
First entry (quarter) Q1 Q1 Q1 Q1 Q1 Q1 Q1 Q1
No. of entries in 1st quarter 8 9 12 8 0 7 7 2
No. of entries in 2nd quarter 18 8 18 14 0 7 9 4
Max. no. of generic entries until Q3/14 23 15 23 17 0 11 15 11
UK
First entry (quarter) Q1 Q1 Q1 Q1 Q1 Q1 Q1
No. of entries in 1st quarter 9 5 6 5 3 7 6
No. of entries in 2nd quarter 9 5 11 5 2 7 6
Max. no. of generic entries until Q3/14 12 12 12 6 5 11 10
Based on IMS Health data. Note that Q3/2014 is the end of the sample data. Drug D was eliminated from the
analysis.
3.2.3 The envisaged price changes (branded and generic products)
In a competitive market, the pressure of generic entry is expected to lower the prices of
branded products after the loss of exclusivity. The change in price level prior and after the
loss of exclusivity was assessed45 (if possible: 1-4 years after the loss of exclusivity). Please
note that again there exist significant differences between countries and products.
The data analysis shows that the price drop of branded products often starts in the first
quarter after the loss of exclusivity. However, this price drop is often relatively limited (up to
10-20%). During the first and second year (after the loss of exclusivity) the branded prices
decrease further, but with larger differences between products and countries. For example, in
the Netherlands the price drop after two years varies from 42-60%, while in Germany this
varies between 4 and 24%. When the branded prices are weighted for the sold volumes, the
price drops in the end are often substantial (in some cases up to > 95%). The underlying data
shows that branded products often keep a higher price than the generic competitor but that
the sold volumes of branded products are very low.
For most of the selected products, the starting price of the generic entrant after the loss of
exclusivity is significantly lower than the price of the branded products. Italy is an example of
a rather aggressive generic pricing strategy: in the first quarter after the loss of exclusivity the
generic prices are 30-40% of the original branded price (relative price reduction of 60-70%).
45 The price change is calculated for the long-run and for specific periods (if possible: 1-4 years after the loss of exclusivity).

53
At the end of the data period (Q3/2014), a lot of generic prices are 10-30% of the original
branded price.
3.2.4 The level of generic penetration
The loss of the exclusivity results in the entry of relatively cheap generic products and (often)
in a substantial drop in the prices of branded products. As can be expected, the generic entry
will also have an influence on the market share of the originator product. In the data analysis,
we assessed the level of generic penetration: the relative share of generic products in the total
volume (branded and generic products) in the period after the loss of exclusivity.
The findings show that the level of market penetration of generic products differs per country
and per product. In some cases, the share of generic products in the total volume is above 70-
90% (e.g. Sweden and the Netherlands), while in other cases the level of generic penetration
is much lower (e.g. Belgium and Italy). There seem to be two main explanations for these
differences. First, the national policies in relation to the prescription and reimbursement of
generic products differ. In the interviews conducted it was confirmed that, especially in
Sweden and the Netherlands, the use of generic products is lobbied for after the loss of
exclusivity. For Italy, several interviewees indicated that the ‘push’ towards generic drugs is
much softer and that patients often have a preference for the branded product they are
familiar with. Second, the generic penetration seems to be related to the price strategy of
both the generic and the originator product. In the UK for example, the price for generic
products for Drug B is only 5% below the originator price (which also shows a relatively small
price drop of 5-12% after the loss of exclusivity).
3.2.5 Substitution effects
The sales of a medicinal product are influenced by the presence or absence of other products
with the same active substance or which are in the same therapeutic class (Anatomical
Therapeutic Chemical (ATC)). E.g. a new product can reduce the volume of a product which
is already on the market. These effects are called substitution effects. We distinguish two
types of substitution effects: within the same active substance or with other active
substances.
If present, the substitution effect can be derived from a decrease in volume. The variation (in
index numbers) of the volume data per product is presented in Table 12. The reference
volume is the volume of the 1st quarter of 2008. Variation of the volume is expected in a
dynamic market. Normally, the volume will increase as time passes, because of market
penetration. When the volume substantially decreases, it may be due to substitution effect.
When a volume decreases with more than 20% (<80% in Table 12), desk research was
conducted to confirm or reject the presence of a substitution effect. The two products with a
volume decrease of more than 20% are Drug A and Drug C.
Table 12 Substitution effects (based on volume)
INN Minimum Maximum Difference Mean
Drug A 73.20% 133.40% 60.20% 109.10%

54
INN Minimum Maximum Difference Mean
Drug B 100.00% 168.10% 68.10% 140.20%
Drug C 31.90% 125.70% 93.80% 88.10%
Drug D 91.50% 114.80% 23.30% 103.40%
Drug E 80.40% 113.50% 33.00% 99.40%
Drug F 99.00% 165.30% 66.30% 131.90%
Drug G 97.60% 153.10% 55.50% 124.10%
Drug H 100.00% 113.20% 13.20% 107.10%
Drug I 86.00% 135.50% 49.50% 108.50%
Based on IMS Health data. Note: the volumes include both adult and paediatric usage.
In case of Drug A, the decrease of the volume was not constant. The volume recovered within
a couple of quarters. However, the volume decrease of Drug C was substantial. In case of
Drug C, a substitution is taking place from the moment a new tablet with the same active
substance enters the market (see Figure 16 below). Drug C is an anti-HIV drug with a six-
month paediatric extension until July 2013. After patent expiry, lower revenues of Drug C
due to generic entry is expected. However, from the last quarter of 2011, the revenues were
already decreasing. This is caused by the entrance of extended-release tablets. The volume of
these tablets was increasing to the detriment of the normal tablets (200-mg). These
extended-release tablets were protected by a new patent. Therefore, the potential market for
the generic companies was reduced, because the patients were switching to another agent.
This can be considered as a substitution effect (with the same active substance).

55
Figure 16 Substitution effect of Drug C (illustrating the revenues over time)
Based on IMS Health data. Notes: (i) the normal tablets of 200-mg were sold per single unit (blue) through
hospitals and sold per 60 units through retail (green); (ii) the red product refers to new extended-release (RT)
tablets; (iii) the revenues are based on list prices, the actual prices may be different (iv) the revenues include both
adult and paediatric usage.
3.2.6 Economic value
In section 3.1 we described the overall methodology to assess the ‘economic value’ of the
rewards. In the situation of the SPC-extension, the granted reward implies that the loss of the
exclusivity is six months later than the situation without reward. Based on the available data
we estimated per product and per country the economic value which the SPC extension
represents. The methodology how this was calculated is described in Appendix C. The results
of the data analysis are shown in the tables below. Please note that the time the market
needed to reach a new equilibrium differs per country and per product and that in some cases
there is no new equilibrium yet.
Table 13 Estimation of the economic value of the SPC-extension (in thousands of euro), by member state
Country 6-month
revenue
Revenue with
SPC extension
Revenue
without SPC
extension
Economic value
Economic value
as a % of 6-
month revenue
Austria 18,388 56,971 47,420 9,551 51.9%
Belgium 6,190 18,388 16,274 2,114 34.2%
Finland 11,286 24,372 17,719 6,653 58.9%
0%
10%
20%
30%
40%
50%
60%
70%
80%
90%
100%
Total revenue Drug C
TAB 200MG 1 TAB 200MG 60 RT TABS

56
France 158,533 390,639 307,833 82,806 52.2%
Germany 277,522 703,345 566,845 136,500 49.2%
Ireland 16,246 48,270 41,084 7,187 44.2%
Italy 138,990 314,522 232,905 81,616 58.7%
Luxembourg 1,511 4,132 3,524 607 40.2%
Netherlands 71,025 146,274 86,918 59,356 83.6%
Portugal 9,388 24,204 19,527 4,677 49.8%
Spain 56,411 117,504 94,949 22,556 40.0%
Sweden 28,669 54,571 30,167 24,404 85.1%
UK 118,070 304,956 226,100 78,857 66.8%
Based on IMS Health data. Notes:(i) the revenues are based on list prices, the actual prices may be different; (iii)
revenues include both adult and paediatric usage. (Slovenia is excluded for reasons of confidentiality)
Table 14 Estimation of the economic value of the SPC-extension
International on-
proprietary Name
Economic value as a
% of 6-month
revenue
Time to
equilibrium
Equilibrium
Austria Drug E 49.5% 8 quarters
Drug H 57.2% 6 quarters
Drug F 39.9% 8 quarters
Drug G 56.6% 7 quarters
Belgium Drug E 68.1% 8 quarters
Drug F 27.7% 8 quarters
Drug C 46.5% 5 quarters No
Drug B 8.7% 5 quarters No

57
International on-
proprietary Name
Economic value as a
% of 6-month
revenue
Time to
equilibrium
Equilibrium
Finland Drug E 59.5% 8 quarters
Drug H 63.2% 6 quarters
Drug F 61.5% 8 quarters
Drug G 53.5% 7 quarters
France Drug E 51.8% 8 quarters
Drug F 45.5% 8 quarters
Drug B 22.9% 5 quarters No
Drug G 65.2% 7 quarters
Drug I 7.2% 6 quarters No
Germany Drug E 71.2% 8 quarters
Drug H 10.9% 6 quarters
Drug F 26.5% 8 quarters
Drug A 43.9% 7 quarters No
Drug C 22.9% 5 quarters No
Drug B 46.0% 5 quarters No
Drug G 47.4% 7 quarters
Drug I 56.5% 6 quarters No
Ireland Drug E 36.2% 8 quarters
Drug H 43.6% 6 quarters
Drug F 41.2% 8 quarters

58
International on-
proprietary Name
Economic value as a
% of 6-month
revenue
Time to
equilibrium
Equilibrium
Drug A 60.4% 7 quarters No
Drug G 29.7% 7 quarters
Italy Drug E 71.2% 8 quarters
Drug H 20.2% 6 quarters
Drug F 57.7% 8 quarters
Drug A 54.2% 7 quarters No
Drug C 50.6% 6 quarters No
Drug B 52.7% 5 quarters No
Luxembourg Drug E 62.1% 8 quarters
Drug H 60.1% 6 quarters
Drug A 36.4% 7 quarters No
Drug C 47.6% 5 quarters No
Drug B 0.0% 5 quarters No
Drug G 43.2% 7 quarters
Netherlands Drug E 93.6% 8 quarters
Drug H 78.7% 6 quarters
Drug F 91.9% 8 quarters
Drug A 75.4% 7 quarters No
Drug C 47.4% 5 quarters No
Drug B 55.2% 5 quarters No

59
International on-
proprietary Name
Economic value as a
% of 6-month
revenue
Time to
equilibrium
Equilibrium
Drug G 86.1% 7 quarters
Portugal Drug C 438% 5 quarters
Drug G 50.3% 7 quarters
Slovenia Drug A 31.0% 7 quarters No
Spain Drug A 39.3% 7 quarters No
Drug C 52.4% 5 quarters
Drug B 23.7% 5 quarters No
Sweden Drug E 87.5% 8 quarters
Drug H 79.8% 6 quarters
Drug F 92.7% 8 quarters
Drug A 88.9% 7 quarters No
Drug B 68.3% 5 quarters No
Drug G 87.5% 7 quarters
Drug I 60.9% 6 quarters No
UK Drug E 79.2% 8 quarters
Drug H 47.9% 6 quarters
Drug F 88.8% 8 quarters
Drug I 37.1% 6 quarters No
Based on IMS Health data. Notes:(i) the revenues are based on list prices, the actual prices may be different; (ii)
revenues include both adult and paediatric usage; (iii) Drug D was eliminated from the analysis.
The table shows the estimated economic value in absolute terms and as percentage of the
revenue in the half year (last two quarters) before the loss of exclusivity. The analysis shows
that the economic value varies between products and countries. In stabilised market

60
situations, the economic value as a percentage of 6-month revenue vary between 10.9%
(Germany – Drug H) and 93.6% (The Netherlands – Drug E). Figure 17 shows the variation
in economic value, as a percentage of 6-month revenue per INN for the available countries.
Figure 17 Estimated economic value as a percentage of 6-month revenue, by INN
Based on IMS Health data. Notes: Revenues include both adult and paediatric usage.
Table 15 Economic value per product (column 2-5: x €1,000)
INN (# of included
countries)
6-month
revenue
Revenue with
SPC ext.
Revenue
without SPC
Economic
value
Economic value as % of
6-month revenue
Drug A (8) xxxxxxx € 270,309 € 212,187 € 58,122 50.7%
Drug B (8) xxxxxxx € 65,646 € 51,541 € 14,105 43.4%
Drug C (7) xxxxxxx € 26,271 € 16,916 € 9,355 49.5%
Drug E (11) xxxxxxx € 540,988 € 394,491 € 146,497 67.8%
Drug F (10) xxxxxxx € 458,454 € 353,237 € 105,217 61.7%
Drug G (9) xxxxxxx € 451,678 € 338,457 € 113,221 58.1%
Drug H (9) xxxxxxx € 208,701 € 177,518 € 31,183 39.0%
Drug I (4) xxxxxxx € 189,866 € 150,317 € 39,548 46.0%
Total € 913,432 € 2,211,913 € 1,694,664 € 517,249 56.6%
Based on IMS Health data. Notes: (i) between brackets is the number of countries covered in the analysis; (ii)
revenues include both adult and paediatric usage; (iii) Drug D was eliminated from the analysis.
3.2.7 Extrapolation of the data
Due to limitations in the availability of data and in the data itself (see Appendix C), it was not
possible to calculate for all countries and products the ‘full’ economic value of the reward.
We used the available data to make an extrapolation in order to assess the (magnitude of the)
‘full’ economic value of the reward. Please note that this extrapolation is based on
0%
10%
20%
30%
40%
50%
60%
70%
80%
Drug E Drug F Drug G Drug A Drug C Drug I Drug B Drug H

61
assumptions and that the actual economic value may differ from our estimations. The
extrapolation is done in two steps.
The first step is to estimate the economic value of the reward for the countries that are
missing in the current set of eight products. Although in these countries an SPC-extension
was granted, the dataset available for the study did not include data on these countries.
Based on the ‘revenue and economic value per capita’46, the 6-month revenue and the
economic value for the missing countries was estimated47. In the table below we show per
INN the estimated economic value for the increased number of countries (the new
number of countries is mentioned in the third column). The new estimated economic
value, €628m, increased with 22% compared to the original estimated economic value of
€517m.
The second step in the extrapolation is to include the (four) products for which the period
of exclusive rights, including the SPC-extension period, ended within the research period
taken into account (December 2015), which is after the date of the dataset available for
the study (third quarter 2014). We also included Drug D, for which the data did not allow
to make a distinction between protected and non-protected products with an SPC
extension. Based on the total population in the specific countries associated with the
specific year in which the patent expires and ‘revenue and economic value per capita’ of
the eight products in our dataset (see Table 16), we made an estimation of the 6-month
revenue and the economic value of the SPC reward for the products. Based on this second
step in the extrapolation, the adjusted economic value, €926m, increased with 79% in
comparison to the original estimated economic value of €517m. Please note that the
therapeutic areas of autoimmune diseases, diabetes mellitus and antipsychotics are not
covered in the original set of eight products, which increases the uncertainty of the
extrapolation.
Table 16 Extrapolated economic value per product for all countries (column 4 and 5: x €1,000)
INN Therapeutic area No.
EU
MS
6-month
revenue
(x 1,000 €)
Economic
value
Economic
value as % of
6-month
revenue
Time to
stabilizat
ion
Equil-
ibrium?
Drug A xxxxxxxxxxxx 9 117,571 59,599 50.7% 7 quarters Yes
Drug B xxxxxxxxxxxx 13 42,922 18,623 43.4% 5 quarters Yes
Drug C xxxxxxxxxxxx 10 25,535 12,629 49.5% 5 quarters Yes
Drug E xxxxxxxxxxxx 12 219,703 149,003 67.8% 8 quarters No
Drug F xxxxxxxxxxxx 11 173,315 107,019 61.7% 8 quarters No
46 The economic value per capita is based on the calculated economic value per product and country, divided by the total
population in the specific countries associated with the specific year in which the patent expires. The population is based on
Eurostat-data.
47 For the missing countries, the economic value is calculated by multiplying the average ‘economic value per capita’ with the
population size.

62
INN Therapeutic area No.
EU
MS
6-month
revenue
(x 1,000 €)
Economic
value
Economic
value as % of
6-month
revenue
Time to
stabilizat
ion
Equil-
ibrium?
Drug G xxxxxxxxxxxx 12 318,272 184,862 58.1% 7 quarters No
Drug H xxxxxxxxxxxx 11 85,183 33,196 39.0% 6 quarters No
Drug I xxxxxxxxxxxx 14 138,335 63,617 46.0% 6 quarters Yes
Total 1,120,836 628,548
56.1%
Average 140,105 78,569
Based on IMS Health data. Note: revenues include both adult and paediatric usage.
Table 17 Extrapolated economic value per product, patent expiry before 31-12-2015 (column 4 and 5: x €1,000)
INN Therapeutic area No. of countries 6-month
calculated
revenue
Economic value
SPC extension
8 products (see table above) N/A 1,120,836 628,548
Drug J xxxxxxxxxxxxx 8 105,808 58,898
Drug K xxxxxxxxxxxxx 10 143,744 80,015
Drug L xxxxxxxxxxxxx 11 152,006 84,614
Drug M xxxxxxxxxxxxx 1 27,232 15,159
Drug D xxxxxxxxxxxxx 9 104,709 58,286
Total 1,654,335 925,521
Based on IMS Health data. Note: revenues include both adult and paediatric usage.
3.2.8 Limitations
With regard to estimating the economic value, a number of specific considerations need to be
made.
It is important to emphasise that the analysis is to some extent determined (and limited
to) by the type and quality of the data that is available. As the steps for the extrapolation
of the data show, the dataset available for the study is not including data on all products
and /or countries which - in an ideal situation - would have been part of our dataset. The
need to use assumptions results in uncertainty about the estimations. This margin of
error in (especially) the extrapolation is strengthened by the fact that individual
medicines often differ significantly in terms of strategic (pricing) behaviour of the
originator and generic company and underlying market dynamics.
Further, it is uncertain to what extent the available data is reflecting a fully realistic
situation. The list prices for example (as used in the IMS Health database), are hardly
used in practice. In some countries additional margins are added on top of the list prices
for service providers, such as for example pharmacists. At the same time, pharmaceutical
companies may negotiate reimbursement prices with national health authorities and

63
health insurances, which may result in a discount on the prices of the medicines. Despite
these opposite price dynamics, we expect that the list price as presented in the IMS
Health database is an underestimation of the ‘real’ price which at the end is paid by the
health care payer. This would imply that also the calculated economic value of the SPC
reward is an underestimation of the actual economic value. Uncertainty also exists in
relation to the reported volumes in the IMS Health dataset. For some products and/or
countries the dataset (only) contained hospital or retail data. This implies that in reality
the volumes (and also the revenues) are higher than the reported values in the dataset
and that the calculated economic value of the SPC-reward is an underestimation of the
actual economic value. Within the scope of this study (and the available dataset), it was
not possible to assess the magnitude of these (presumed) underestimations.
A third consideration is that a substantial share of the economic value of the SPC-reward
lies in the future. The research shows that a lot of SPC-extensions are granted in the last
couple of years, but (due to the fact that the product is still under protection) not
‘effectuated’ yet. Table 9 shows that especially in 2015 a lot of decisions on SPC-
extensions are taken, which will materialize in the upcoming years.
A final consideration is that the estimated size of the SPC-reward (i.e. the estimated
economic value) does not always have a direct link to the ‘efforts’ (investments, R&D,
etc.) the pharmaceutical companies made during the 2008-2014 period.48 The SPC-
reward is linked to a specific product, while efforts and investments of pharmaceutical
companies are often spread over a broad portfolio of products, activities and investments.
3.3 The Orphan reward (article 37)
This section presents the results of the analysis of the orphan reward (Article 37). It is
possible to grant 10 years of market exclusivity to new medicinal products which are
designated as an orphan medicinal product. In line with Article 37 this 10-year period can be
extended by two years49 if the application for a marketing authorisation includes the results
of all studies conducted in compliance with an agreed PIP50. This situation is summarised in
the figure below.
Figure 18 Overview of the Orphan reward (market exclusivity)
48 For this study, we used IMS Health data which covered this period. See Appendix C for more details.
49 EC Regulation 1901/2006
50 If an orphan product development falls in the scope of Article 7 or 8 of the Paediatric Regulation, a paediatric development is
mandatory, unless a waiver is agreed.

64
Source: Frias, Z. EMA. Workshop for Micro, Small and Medium Sized Enterprises EMA. 26 April 2013. Data
exclusivity, market protection and paediatric rewards. Available at
http://www.ema.europa.eu/docs/en_GB/document_library/Presentation/2013/05/WC500143122.pdf
Until mid-2016, four orphan-designated products have successfully fulfilled the requirements
of article 37 of the Regulation, thereby becoming eligible for the specific reward.51
Xagrid (Anagrelide) is a medicine for the reduction of the platelet count in patients at risk
of essential thrombocythemia. Xagrid has been granted EU marketing authorisation in
November 2004 and is currently reimbursed in eleven countries (see table below). The
decision on the agreement of a PIP (required for the orphan reward) was taken in
February 2014.52
Tobi Podhaler (Tobramycin) is a suppressive treatment of chronic pulmonary infection in
adults and children aged 6 years and older with cystic fibrosis. Tobi Podhaler has been
given EU marketing authorisation in July 2011 and is reimbursed in eleven countries (see
table below). The decision on the agreement of a PIP (required for the orphan reward)
was taken in September 2014.53
Kuvan (Sapropterin) is a treatment for phenylketonuria (PKU). EU marketing
authorisation was granted in December 2008.54 The product is currently available in
eleven countries. The decision for the orphan reward was taken in July 2015.
Soliris (Eculizumab) is medicine for the treatment of paroxysmal nocturnal
hemoglobinuria. Soliris has been authorised in June 2007 and currently available in ten
countries (see table below). The decision on the agreement of a PIP (required for the
orphan reward) was taken in April 2016.55
Table 18 below shows an overview of the EU Member States that reimburse some of the
products. In total, 16 EU Member States provide reimbursement. Only in four Member States
all four products are reimbursed (Denmark, France, Luxemburg and the Netherlands).
Table 18 Overview of reimbursing countries for medicines with orphan reward
BE BG CZ DK EE EL FI FR HU LU LV NL RO SI SK SE
Xagrid
Tobi Podhaler
51 EMA, annual reports to the European Commission on companies and products that have benefited from any of the rewards
and incentives in the Paediatric Regulation. Another product is currently under assessment by the CHMP of EMA and may be
authorised in 2016 (personal communication European Commission).
52 EMA, see: http://www.ema.europa.eu/ema/index.jsp?curl=pages/medicines/pips/EMEA-000720-PIP01-09-
M02/pip_000411.jsp&mid=WC0b01ac058001d129.
53 EMA, see: http://www.ema.europa.eu/ema/index.jsp?curl=pages/medicines/pips/EMEA-000184-PIP01-08-
M02/pip_000088.jsp&mid=WC0b01ac058001d129.
54 EMA - Kuvan, EU/3/04/199. Available at:
http://www.ema.europa.eu/ema/index.jsp?curl=pages/medicines/human/orphans/2009/11/human_orphan_000010.jsp&mi
d=WC0b01ac058001d12b.
55 EMA, see: http://www.ema.europa.eu/ema/index.jsp?curl=pages/medicines/pips/EMEA-000876-PIP05-
15/pip_001430.jsp&mid=WC0b01ac058001d129.

65
BE BG CZ DK EE EL FI FR HU LU LV NL RO SI SK SE
Soliris
Kuvan
Based on market reports.
3.3.1 General market trends
Compared to the IMS Health data available for the SPCs, the data available for these four
products is limited in scope and ‘quality’. This is mainly due to the fact that all four products
are still under protection (no generic entry). This implies that our analysis of available data is
also limited56 and only shows some general market trends. See Appendix C for more details.
Moreover, there is also limited data coverage over the different reimbursing countries. As a
result, only the data for one product is presented.57
Price development – For most of the countries, the price at the end date of our sample
(Q3-2014) shows a relatively small decrease over time (up to 10%). This is for example
the case in Bulgaria, the Czech Republic, Finland and the Netherlands. In Sweden, the
price shows first a small increase, followed by a small decrease; specific details were not
revealed.
Revenue development – The data shows that, after the EU marketing authorisation (July
2011), there is a gradual increase over time in the revenues. This mainly results from the
fact that the moment the product becomes available in a country (and is reimbursed)
varies. In the Netherlands for example the sales start in the final quarter of 2011, while for
France this is in the second quarter of 2012. The next figure shows the development in
revenues for ten Member States over the period 2011-2014. France and the Netherlands
represent the biggest share of the revenues.
56 As described before: the IMS Health data available for this study covers the period 2008-2014. The last available data point is
the 3rd quarter of 2014. The scope and limitations of the dataset are described in Appendix C.
57 Due to restriction in the IMS Health license to present individual product data, the description of the market development is
limited and does not reveal absolute values.

66
Figure 19 Development of revenues for an example drug
Based on IMS Health data. Note: the absolute revenue figures cannot be revealed for confidentiality reasons.
Covered countries: Bulgaria, Czech Republic, Estonia, Finland, France, Luxembourg, Netherlands, Slovakia,
Slovenia and Sweden. Note: the revenues include both adult and paediatric usage.
3.3.2 Economic value
Due to the fact that the four products are still under protection, it is not possible to estimate
the economic value of the orphan reward. At the same time, a projection of the current data
towards the moment of loss of exclusivity in the future is unreliable. This is mainly related to
the data availability (see above) and the uncertainty about the effects of generic entry (ie, will
there be generic entry? what will be the effect on the prices?). Nevertheless, the approach to
estimate the economic value could be similar to the approach used for the calculation of the
rewards from the SPC-extension, the main difference would be that the delay is two years
(eight quarters) instead of two quarters.
In relation, Kreeftmeijer-Vegter et al. (2014) observed that after the Regulation came into
force, it takes longer for a developer to obtain marketing authorisation for a paediatric
medicine for rare diseases.58 The exact causes of this phenomenon are not yet clear, but some
have argued that it may be due to restrictive development conditions.59 These barriers may
have a negative impact on the ‘popularity’ of the reward. The interviews conducted within
this study indicate that in some cases companies chose to withdraw the orphan designation
following completion of the PIP and prior to obtaining marketing authorisation, in order to
create the opportunity to benefit from the SPC prolongation (higher financial return). This
choice varies per product and depends on the market circumstances (e.g. expected profit,
expected generic entry, etc.).
58 Kreeftmeijer-Vegter 2014 The influence of the European paediatric regulation on marketing authorisation of orphan drugs for
children. Orphanet J Rare Dis. 2014 Aug 5;9:120
59 Shen 2014 New Financial and Research Models for Pediatric Orphan Drug Development - Focus on the NCATS TRND
Program. Pharmaceut Med. 2014 Feb 1;28(1):1-6.

67
With regard to the situation in the US, we found some relevant literature on the economic
value of the vouchers which are used. These insights are presented below. Please note that
these insights cannot be directly compared with the EU.
In the US, medicines for rare diseases (less than 200,000 people affected) benefit from
an Orphan Drug Exclusivity (ODE) of 7 years, after approval of a New Drug Application
(NDA) or a Biologics License Application (BLA).60 Section 505(A) of the Modernization
Act provides for a six-month period of marketing exclusivity as an incentive to industry to
conduct studies requested by the FDA.61 The applicant must fulfil the following
conditions: be in receipt of a written request of FDA, submit study reports after receipt of
the written request and meet the conditions of the written request. If this type of
medicines is tested in children, with success, the six-month exclusivity add-on comes on
top of the market exclusivity period of 7 years or patent protection period.62 In the EU,
the six-month SPC prolongation cannot be used in combination with the orphan
exclusivity.
The Rare Paediatric Disease Priority Review Programme (RP-PRV) of the FDA is another
incentive that stimulates the development of medicines for rare paediatric diseases. If the
disease affects human beings not older than 18 years and this disease is also included in
the Orphan Drug act, the developer can get a Priority Review Voucher. This system was
introduced in 201463 and can be used for any subsequent drug of the developer to
expedite the review of a drug in their pipeline or the voucher can be sold to another
company.64 This system is summarised in the figure below.
Figure 20 Priority Review Voucher
60 Orphan Drug Act and 21 CFR 316.31
61 U.S. Food and Drug Administration (FDA) Qualifying for Pediatric Exclusivity Under Section 505A of the Federal Food, Drug,
and Cosmetic Act: Frequently Asked Questions on Pediatric Exclusivity (505A), The Pediatric "Rule," and their Interaction
[Internet]. Accessed on: 25 March 2016. Available at:
http://www.fda.gov/Drugs/DevelopmentApprovalProcess/DevelopmentResources/ucm077915.htm
62 CDER Patents and exclusivity May 2015
63 FDA. 2012. Safety and Innovation Act, Section 908 the "Rare Pediatric Disease Priority Review Voucher Incentive Program".
64 Melissa S. Tassinari 2012 Pediatric Regulations 2012: Permanent Laws and New Provisions under FDASIA

68
Source: Regulatory Explainer: Everything You Need to Know About FDA’s Priority Review Vouchers. 2015. Online available at:
http://www.raps.org/Regulatory-Focus/News/2015/07/02/21722/Regulatory-Explainer-Everything-You-Need-to-Know-
About-FDA’s-Priority-Review-Vouchers/.
The programme, however, is an experiment - once three vouchers are awarded (which is
currently the case), the programme’s efficacy and impact on the development of new drugs
for rare paediatric diseases will need to be assessed by the Government Accountability Office
(GAO) (2016). After the assessment, the Congress can make the programme permanent.65
It has been estimated that by using this voucher the review process could be shortened from
18 months (average) to 6 months.66 The economic impact of this voucher is estimated at
$US300m.67 This is an indication of the economic impact, because it is not clear for which
new medicine the voucher will be used. Each medicinal product serves a unique market and
they are hard to compare. On December 31, 2015, there have been 11 requests for a RP-PRV.
Of these, six requests have been granted, two have been denied and three are still under
review.68 Of the six awarded vouchers three have already been sold (see Table 19).
Table 19 Priority review vouchers granted under the RP-PRV65, 69
Year Disease Drug Company Sold
2014 Morquio A Syndrome Vimizim (elosulfase alfa) Biomarin Sold for $67.5m
2015 High-risk neuroblastoma Unituxin (dinutuximab) United Therapeutics Sold for $350m
2015 Rare bile acid synthesis disorders Cholbam Asklepion Sold for $245m
2015 Hereditary orotic aciduria Xuriden Wellstat -
2015 Hypophosphatasia Strensiq (asfotase alfa) Alexion -
2015 Lysosomal acid lipase (LAL) deficiency Kanuma (sebelipase alfa) Alexion -
Another approach to determine the economic value of this reward is to ask the
pharmaceutical industry how much money they want to spend to buy a priority
review voucher. Robertson et al. conducted a study on this subject and it appeared
that pharmaceutical companies are willing to pay $US94m for a priority review
voucher. The researchers also asked about how much holders of a voucher would
expect to receive when selling it. On average, the holders would expect to receive
$US188m.70 Based on this information, it can be concluded that the impact of the
65 The Business of orphan drugs is booming. Suzanne Shelley, Contributing Editor, August 26, 2015. Available from:
http://pharmaceuticalcommerce.com/brand_communications?articleid=27627
66 David B. Ridley. 2006. Developing Drugs For Developing Countries. Health Affairs 25, no. 2 (2006): 313–324
67 David B. Ridley. 2010. Introduction of European priority review vouchers to encourage development of new medicines for
neglected diseases. Lancet 2010; 376: 922–27
68 United States Government Accountability Office (GAO) ‘Rare diseases: too early to gauge effectiveness of FDA’s pediatric
voucher program’ March 2016 [Internet] Accessed on: 25 March 2016. Available at:
http://www.gao.gov/assets/680/675544.pdf
69 Priority Review Voucher ‘Recipients’ [Internet] Accessed on: 25 March 2016. Available at: http://priorityreviewvoucher.org/
70 Robertson AS, Stefanakis R, Joseph D, Moree M (2012) The Impact of the US Priority Review Voucher on Private-Sector
Investment in Global Health Research and Development. PLoS Negl Trop Dis 6(8): e1750.

69
priority review voucher can be roughly estimated at hundreds of millions ($US),
depending on the level of acceleration of the review process. As multiple requests for
a RP-PRV have been made by the industry, GOA suggests that other incentives, such
as the additional period of “market exclusivity” may be more effective to incentivise
drug development than priority review vouchers (i.e., there is not yet any evidence
that the programme has been effective in achieving its goal).71
3.4 The PUMA reward (article 38)
In this section, we present the assessment of the paediatric use market authorisation (PUMA)
reward (article 38). The introduction of the PUMA reward served two main objectives. The
first objective is to increase research on paediatric drugs, the second is to reduce off-label
prescriptions of medicines to children. It appeared that the ‘regular’ market forces
insufficiently stimulated relevant research aimed at the specific development and
authorisations of paediatric medication. The main barriers relate to (i) costs and benefits,
and (ii) the research and approval process. The costs of paediatric studies are, compared with
the size of the potential market, often financially unprofitable for pharmaceutical companies.
In addition, the design of clinical trials of paediatric medicine can be difficult (due to the
small population size), while the approval process can take a long time.72 In order to solve
these issues, the PUMA reward was instigated by the European Commission, as a part of the
Paediatric Regulation.
As described in section 3.1, the granted PUMA will provide the manufacturer with an 8-year
period of data exclusivity. During this period, the marketing authorisation dossier of the
PUMA cannot be used in support of an application, the latter needed to be substantiated by
the results of pre-clinical tests and of clinical trials. Generic applications cannot be submitted
during this period.73 After these 8 years, there is an additional 2 years of market protection.
During this period the generic product can be approved, but cannot be placed on the market.
These 2 years of market protection can be extended with an additional year, when in the data
exclusivity period an additional authorisation is acquired for one or more therapeutic
indications which bring significant clinical benefit in comparison with existing therapies.
Please note that the PUMA does not ensure market exclusivity. Other pharmaceutical
companies will be able to conduct their own studies on the same product as the one of the
originator company, and apply for a PUMA themselves.74 A PUMA will only be granted when
the medicines are intended solely for the use in children.75
In this section, we describe the actual use of the PUMA-reward, present some general market
trends, discuss, to the extent possible, the economic value of the reward and assess a number
71 GAO. (2016). Rare Diseases. Too early to gauge effectiveness of FDA’s Pediatric Voucher Program. Report to Congressional
Committees. GAO-16-319. Available at: http://www.gao.gov/assets/680/675544.pdf
72 Rocchi F., Paolucci P., Ceci A. & Rossi P. (2010) ‘The European paediatric legislation: benefits and perspectives’ Italian
Journal of Pediatrics 36:56 P. 1-7.
73 Hathaway, C. Manthei, J. and Schere, C. (2009) ‘Exclusivity strategies in the United States and the European Union’. Food
and Drug Law Institute Available at: https:/www.lw.com/upload/pubcontent/_pdf/pub2655_1.pdf.
74 Permanand G., Mossialos E. & McKee M. (2007) ‘The EU’s new paediatric medicines legislation: serving children’s need’
Archives of Diseases in Childhood p. 808-811.
75 Rocchi F., Paolucci P., Ceci A. & Rossi P. (2010) ‘The European paediatric legislation: benefits and perspectives’ Italian
Journal of Pediatrics 36:56 P. 1-7.

70
of specific hypothesis from 2004. Because only two products received the PUMA-reward, the
analysis of the available data is limited76 and we are therefore only able to show some general
market trends. See Appendix C for more details.
3.4.1 Actual use of the PUMA reward
Until now, two PUMAs have received a positive opinion from the EMA’s Committee for
Medicinal Products for Human use (CHMP).
On the 5th of September 2011, the first PUMA was granted to Buccolam (midazolam), for the
treatment of prolonged, acute, convulsive seizures in paediatric patients from the age of 3
months to 18 years.77 It was developed by Auralis, a specialized pharmaceutical company that
developed technically complex products, in collaboration with Therakind (specialized
paediatric drug development company). Auralis was acquired by ViroPharma in May 2010, so
before the submission of the PUMA-reward.78 The second PUMA was granted to Hemangiol
(propranolol), from the company Pierre Fabre, for the treatment of proliferating infantile
haemangioma on the 21st of February 2014.79,80
Both Buccolam and Hemangiol are reimbursed currently in 10 (different) countries. An
overview of the status is provided in the next table. Reimbursement for Hemangiol is
expected for the Czech Republic and Italy in the fourth quarter of 2015, as well as for Belgium
(Q1 2016), Greece (Q3 2016) and Slovakia (Q4 2016).
Table 20 Overview of reimbursing countries (and * planned) for medicines with PUMA reward
Buccolam (midazolam) Hemangiol (propranolol)
Denmark Austria
Finland Denmark
France France
Germany Germany
76 As described before: the IMS Health data available for this study covers the period 2008-2014. The last available data point is
the 3rd quarter of 2014. The scope (and limitations) of the dataset is described in Appendix C.
77 EMA (European Medicines Agency) ‘European Medicines Agency gives first positive opinion for paediatric-use marketing
authorisation’ Press release 24-06-2011 Available at:
http://www.ema.europa.eu/ema/index.jsp?curl=pages/news_and_events/news/2011/06/news_detail_001287.jsp&mid=WC0
b01ac058004d5c1.
78 Watson J. & Nowacki K. (2015) ‘The first paediatric use marketing authorisation: a case study’ Therapeutic Innovation &
Regulatory Science 49(2) p. 297-301
79 EMA (European Medicines Agency) ‘European Medicines Agency gives first positive opinion for paediatric-use marketing
authorisation’ Press release 21-02-2014 Available at:
http://www.ema.europa.eu/ema/index.jsp?curl=pages/news_and_events/news/2014/02/news_detail_002030.jsp&mid=WC
0b01ac058004d5c1.
80 Rani N., Budhwaar V. & Nanda A. (2015) ‘A comprehensive study on the regulation of pediatrics in Us, Eu and India: present
status and future prospective’ Advances in Chemistry and Biochemistry Sciences 2 1 p. 1-12

71
Greece the Netherlands
Ireland Portugal
Italy Romania
Spain Slovenia
Sweden Spain
UK Sweden
Czech Republic *
Italy *
Belgium *
Greece *
Slovakia *
Based on public market reports, e.g. http://www.londonstockexchange.com/exchange/news/market-
news/market-news-detail/SHP/12060064.html
Within the context of this study, the EMA provided an overview of products (Table below)
that relate to possible future PUMA requests (article 30 of the Paediatric Regulation).81 This
overview is only a subset of the number of PIP applications ‘intended for future PUMA’. An
application is recorded as ‘intended for future PUMA’ if the developer is already the
marketing authorisation holder.82 The overview indicates for which medicines there has been
a first PIP application (subsequent modification procedures are excluded from this overview).
Some of these PIP applications completed in the past, resulted in an orphan reward under
article 37 (Tobi Podhaler) or a PUMA-reward (Buccolam and Hemangiol). Several PIP
applications in this overview have been completed, but there is no further information
available if the developer applied for a PUMA-reward, SPC-extension or orphan-reward.
Some PIPs will be completed later in 2016/2017 (e.g. budesonide).
81 EMA 19-02-2016 ‘PIP applications for future PUMA’
82 If this is not the case, it will be ‘an application for marketing authorisation which is not authorised in the Community at the
time of entry into force’ and falls under article 7. This means that this application will be classified in a different way in the EMA
databases.

72
Table 21 Overview of possible future PUMA requests (article 30)
Substances Application
Number
Submission
date Name
Decision
No.
Decision
date
Influenza virus surface
antigens
EMEA-000149-PIP01-
07 08/02/2008
Decision
published P/40/2009 23/03/2009
Tobramycin EMEA-000184-
PIP02-14 14/03/2014
Decision
published P/0184/2014 06/08/2014
Glucose (monohydrate) EMEA-000221-PIP01-
08 04/04/2008
Decision
published P/45/2009 24/03/2009
Idursulfase EMEA-000294-
PIP02-12 08/10/2012
Decision
published P/0194/2013 29/08/2013
Midazolam (as the
Hydrochloride salt )
EMEA-000395-
PIP01-08 08/10/2008
Decision
published P/155/2009 11/08/2009
Human immunoglobulin EMEA-000415-PIP01-
08 07/11/2008
Decision
published P/165/2009 14/08/2009
Propiverine EMEA-000502-
PIP01-08 30/01/2009 Clock stop 00/00/0
Propranolol
hydrochloride
EMEA-000511-PIP01-
08 27/02/2009
Decision
published P/194/2009 07/10/2009
Levonorgestrel EMEA-000606-
PIP01-09 22/05/2009
Decision
published P/75/2010 05/05/2010
Ciprofloxacin EMEA-000675-PIP01-
09 14/08/2009 Clock stop 00/00/0
Fluconazole EMEA-000676-
PIP01-09 14/08/2009 Clock stop 00/00/0
Diclofenac sodium EMEA-000879-
PIP01-10 10/02/2010 Clock stop 00/00/0
Risperidone EMEA-001034-PIP01-
10 11/10/2010
Decision
published P/167/2011 06/07/2011
Budesonide EMEA-001120-PIP01-
10 13/12/2010
Decision
published P/0285/2011 30/11/2011
White soft paraffin /
Liquid paraffin
EMEA-001789-
PIP02-15 26/10/2015 Clock stop 00/00/0

73
3.4.2 General market trends
The PUMA reward for Buccolam (midazolam) was granted in September 2011 and for
Hemangiol (propranolol) in February 2014. Due to the fact that the dataset available for the
study ends in the third quarter of 2014, especially the data for Hemangiol is very limited. For
Hemangiol data is only available for France (Q1-3 2014) and for Germany (Q3-2014).83 See
Appendix C for more details. As a result, only the data for Buccolam is presented here.84
Price development – The data shows that in all available countries the price for Buccolam
is fixed, from the moment of introduction to the end date of the sample. Between
countries there exist substantial differences in the price level: up to 47% between the
highest and the lowest price.
Revenue development – After the PUMA-reward in September 2011, the revenues for
Buccolam show a slow increase for the different countries. The strongest grow is recorded
in the UK, while other countries show a much lower grow curve. The next figure shows
the development in revenues for eight Member States over the period 2011-2014.
Figure 21 Development of revenues Buccolam
Based on IMS Health data. Note: the absolute revenue figures cannot be revealed for confidentiality reasons. It is
not known why the revenues in Germany and France show a strong decrease again in the second and third quarter
of 2014; (ii) data include both adult and paediatric usage.
83 France includes only hospital data; Germany includes hospital and retail data.
84 Due to restriction in the IMS Health license to present individual product data, the description of the market development is
limited and does not reveal absolute values.

74
3.4.3 Economic value
With regard to the assessment of the economic value of the PUMA-reward, the same
principles can be applied as described in the presentation of the methodological framework.
However, there is a fundamental difference: at the moment a PUMA-reward is granted the
period of data exclusivity starts (instead of delayed as for the SPC-extension). This implies
that the ‘economic value’ covers the ‘monopoly benefits’ a product receives from additional
data exclusivity (8 years) and market protection (2 years). These benefits end at the moment
this period of exclusivity ends and (maybe) generic products enter the market. This situation
is presented in the figure below.
Figure 22 Assessment of the economic value of the PUMA reward
In the figure above, the light blue dotted line represents the off-label revenues which already
exist in the market (and continues in a situation without the PUMA85). Currently, one PUMA
is granted, the revenues for this product (red line) are expected to increase86 and stabilise.
Given the objective of the PUMA, we further assume that the level of off-label use/off-label
revenue will reduce (grey line; although the extent to which is uncertain).87 At the moment of
the loss of exclusivity, it is expected that a generic product will enter the market (black line)
and take over the revenues from the PUMA product. The shaded area between the PUMA
revenues and the off-label revenues88 represents the economic value of the PUMA-reward.
Given the current limitations of the available data, it is not possible to project the economic
value of the PUMA reward. For Hemangiol we only have a few observations (one to three
quarters for two countries). For Buccolam more observations are available, but still the
85 In the figure, we suppose that the off-label use stays constant over time. In practice, off-label use may change.
86 In the figure, we suppose that there are no revenues before the PUMA was granted.
87 Interviews show that despite the presence of the PUMA-product, off-label use will most likely not disappear.
88 Also without the PUMA product there would exist off label use. This can be seen as the counter factual situation.

75
projections are not reliable. It is uncertain at which level the currently increasing revenues
will stabilise and what the impact of the loss of exclusivity will be. The relevant market
dynamics are expected to be fundamentally different from (for example) the analysis of the
SPC-extension.
3.4.4 Assessment of specific hypothesis
Within the context of this study a number of specific hypotheses were formulated which are
assessed in the following sections. The hypotheses were:
Hypothesis 1: PUMA incentives are too weak to make an actual change
Hypothesis 2: PUMA is most likely to be effective where a child-specific formulation or
dosage form is required (as this will lead to preferential prescribing over non-child-
adapted products)
Hypothesis 3: PUMA attracts mainly SMEs rather than bigger pharmaceutical companies
Hypothesis 4: PUMA channels public R&D funds towards the most profitable areas of
research, rather than into the development of medicinal products that are most needed
among the paediatric population
3.4.4.1 Strength of the PUMA incentives
The RAND study89 stated in 2004 that the PUMA incentive was likely to be relatively weak
(in comparison to the SPC-extension). The main arguments for this statement were the
limited scope of the data protection (limited to children), the limited market potential and
lack of market exclusivity (see box below). The RAND study further concludes that there are
concerns regarding the attractiveness of the PUMA and the impact on the producers of
generic medicines. The incentive for data and market exclusivity are not effective for these
off-patented products and the market opportunities seem to be insufficient in contrast to the
economic risks for the development of these paediatric medicines (low return on
investments).
With two positive opinions since the regulation came into force in 2007, it is clear that the
pharmaceutical industry did not make full use of the PUMA, as was intended by the
Regulation. This is also illustrated by the fact that the European Commission adapted its
guideline by letting EMA accept PIPs for a PUMA that cover only certain age groups.90
The literature on the effectiveness of the PUMA is not extensive, but nevertheless confirms
that the instrument is not very attractive. The Global Research in Paediatrics (GRIP) network
indicated that the Paediatric Regulation as a whole has ‘paved the way for paediatric
development, but the PUMA concept is seen as unsuccessful.91 The main reason for this is
89 RAND (2004), Extended Impact Assessment of a Draft EC Regulation on Medicinal Products for Paediatric Use.
90 EMA (2014) ‘European Medicines Agency gives second positive opinion for a paediatric-use market authorization: Hemangiol
recommended for the treatment of proliferating infantile heamangioma’ Press release EMA 21 February 2014. – Commission
Guideline on the format and content of Paediatric Investigation Plans, Official Journal of the EU, 27.9.2014, C 338, p.1.
91 GRIP (Global Research in Paediatrics) ‘Public Consultation on Paediatric Report: the joint GRIP response’ European Union
Seventh Framework Programme (FP7/2007-2013)26-11-2012 and European Commission ‘General report on experience
acquired as a result of the application of the paediatric regulation (article 50(2) of regulation (EC) No 1901/2006) – ‘Experience
Acquired’ and ‘Lessons Learnt’ (Sanco/D5/FS/(2012)1251190).

76
that the PUMA incentive does not protect the pharmaceutical formulations. In addition to
this, health care professionals are allowed to prescribe other products (containing the same
active substance) than the PUMA product off-label. The GRIP states that, ‘unless there will be
more valuable benefits provided in the future, it is unlikely that the PUMA will be more
attractive in the coming years’. The PUMA should cover additional protection to cover the
special paediatric dosages to create a significant incentive for the pharmaceutical companies.
In this way, it prevents Member States to use off-label generic medicines. A simplified
procedure for the PUMA might make it more attractive for pharmaceutical companies. The
GRIP states further that academic networks are more interested in (re)developing off-patent
products. With the instigation of the EU Seventh Framework Programme (FP7), which
provides research funds from 2007-2013, scientific and clinical research will be stimulated.
In a broader context, other authors suggest that especially the financial prospects are a
limitation to license off-patent medicines for paediatric indications and that the target
population for a PUMA is too small.92 National reimbursement rules may not offer rewards
that cover research costs for off patent medicines and investment sources for paediatric
research among generic companies may be lacking. The interviews that were conducted
confirmed that the attractiveness of the PUMA is limited, despite the fact that it can be
interesting for individual companies (like in the case of Buccolam and Hemangiol). The main
experienced barriers seem to be the uncertainty about the future benefits (small market,
national regulation which may limit the revenues) in combination with other more attractive
rewards such as the SPC-extension.
3.4.4.2 Effectiveness in relation to child-specific formulation or dosage
The next hypothesis is whether the PUMA is likely to be effective where a child-specific
formulation or dosage form is required, as this may lead to preferential prescribing over non-
child-adapted products.
The literature suggests that pharmaceutical companies seem to worry that market exclusivity
will not prevent physicians by continuing to use competitor medicines off-label with the same
active ingredient at lower costs. Substitution at the pharmacy level for cheaper, adult-form
medicines might also take place.93 Besides that, substitution practices of off-patent
trademark medicines for generic medicines (or medicines that show similar therapeutic
effect) is wide-spread among many of the European member states.94 The use of non-child
adapted medicines (off-label use of drugs), is extensive in hospital as well as outpatient care.
Paediatric patients in hospital care are at risk of receiving at least one drug off-label. Almost
all patients in neonatal hospital care are exposed to at least one medicine off-label.95 This
suggests that the most vulnerable paediatric group (neonates) has the highest exposure to the
off-label use of drugs (and potential wrong doses), because there is no child-specific dosage
form. In some countries like the UK, products can be introduced on the market without
92 Boon, W.P.C., et al. Improving the EU system for the market authorisation of medicines. Leiden: Escher, 2014.
93 George B. & Tiwari J. (2014) ‘A balance scorecard of the European Paediatric Regulation’ International Journal of
Pharmaceutical Sciences and Nanotechnology 7 (3) p.2529-2535.
94 Mensonides-Harsema M.M. & Otte A. (2011) ‘European regulatory framework on the use and development of pharmaceuticals
and radiopharmaceuticals for pediatrics’ Hellenic Journal of Nuclear Medicine p.43-48
95 Kimland E. & Odlind V. (2012) ‘Off-label drug use in pediatric patients’ Clinical Pharmacology & Therapeutics 91 (5) p.796-
801

77
market authorisation (e.g. hospital preparations). These products are always cheaper than
authorised products. In the UK, hospitals often kept using medicines off-label for children.
This was also the case for Buccolam, because the non-authorised product (used in hospitals)
was cheaper.96 A prohibition of unlicensed versions of comparable medicines which follow
the PUMA procedure would be an enhancement to encourage further use of the PUMA
procedure.97 This is already the case in some European member states as for example
Denmark. Based on these arguments we conclude that while this hypothesis is valid in
theory, the day-to-day practice shows that the PUMA ‘label’ does not prevent physicians to
prescribe non-child-adapted products.
3.4.4.3 Company size of PUMA applicants
With the introduction of the PUMA, it was expected that PUMA applicants were likely to be
small and medium-sized enterprises (SME).98 As described there are currently two PUMAs
granted by the EMA. The first PUMA is granted to ViroPharma for Buccolam and the second to Pierre
Fabre for Hemangiol. According to the strict definitions of the EC, both companies do not qualify as
an SME99 Nevertheless, the interviews conducted suggest (and confirm) that it is more
attractive for SMEs to apply for a PUMA than bigger pharmaceutical companies. The main
reason for this is the fact that this type of niche markets are often (first) served by small and
specialized players. In the case of ViroPharma, the presence of the PUMA-reward was an
interesting asset for Shire in the acquisition process.
3.4.4.4 Risk of diversion of public R&D funding
Finally, we assessed the risk that the PUMA may draw public R&D funds towards the most
profitable areas of research, rather than into the development of medicinal products that are
most needed among the paediatric population. The interviewees suggest that the risk exists,
but is limited. This is highlighted by the small number of PUMA applications. According to
Medicines for Europe, investments in some paediatric studies and specific paediatric
indications (rewarded by the 6-month prolongation) are mostly driven by the commercial
decision of a company. They suggest that pharmaceutical companies (engaged with the
Paediatric Regulation) are steering into the direction of the profits and not in the direction of
the needs. The PUMA does not provide sufficient measures and (financial) incentives to
stimulate the research on existing medicines for paediatric use. This prevents pharmaceutical
companies to engage in the PUMA procedure.
96 Information from interview.
97 Watson J. & Nowacki K. (2015) ‘The first paediatric use marketing authorisation: a case study’ Therapeutic Innovation &
Regulatory Science 49(2) p. 297-301.
98 A SME has a staff headcount of which is lower than 250 persons, a turnover lower than €50m or a balance sheet total which is
lower than €43m. See: Website European Commission: ‘Growth, Internal Market, Industry, Entrepreneurship and SME’s’
Available at: http://ec.europa.eu/growth/smes/business-friendly-environment/sme-definition/index_en.htm.
99 Financial information Pierre Fabre. Available at: http://www.evaluategroup.com/View/2737--co-
coInfo/company/pierre_fabre. ViroPharma (Buccolam) is not a SME as the turnover and balance sheet total are higher than
under the EC-definition. However, the number of employees for ViroPharma is lower than described under the definition above
(<250 persons). Also Pierre Fabre Laboratories is not an SME, as the number of employees is much higher than described under
the definition of the EC. Also, the turnover and balance sheet are higher than the EC definition.

78
4 Overall assessment of the rewards
This section provides the assessment of the rewards of the Regulation. This assessment is
based on five specific evaluation criteria: (i) relevance, (ii) effectiveness, (iii) efficiency, (iv)
coherence and (v) utility.100 Before we discuss the different evaluation criteria, the objective
of the Regulation and the assessed rewards should be clear.
The overall objective of the Regulation is to improve the health of children in Europe by
facilitating the development and availability of medicines for children aged 0 to 17 years. In
the Regulation the following objectives are formulated.101 These objectives are effectuated,
amongst others, via the three described rewards.
Facilitate the development and accessibility of medicinal products for use in the
paediatric population
Ensure that medicinal products used to treat the paediatric population are subject to
ethical research of high quality and are appropriately authorised for use in the paediatric
population
Improve the information available on the use of medicinal products in the various
paediatric populations.
In the next sections, we assess the Paediatric Regulation according to the evaluation criteria.
We conclude with a brief section on potential improvements. The lessons learnt from the US
Paediatric Regulation rewards are also taken into account.
The analysis is based on the results of a survey of pharmaceutical companies (Appendix A).
27 organisations responded to the open questions, of which 6 were SMEs and 1 was non-
profit organisation, including 7 organisations conducting paediatric studies funded by FP7.
The analysis of survey results is complemented by interviews with industry representatives
and desk research.
4.1 Relevance of the rewards102
48% of the survey respondents state that the objectives of the rewards provided by the
Regulation are relevant (relevant or highly relevant) to organisations’ needs and objectives.
Some respondents note that the reward incentivised organisations to sponsor and support
the development of paediatric medicines, including in rare/orphan disease. However, at the
same time, respondents claimed that as a result of the necessary additional costs involved
with submitting PIPs, individual organisations may not be able to achieve a positive return
on investment. The group of respondents that find the objectives of the rewards are only
somewhat relevant share this view – the regulation may not lead to the capital allocation
decisions that maximize value. Another concern is related to the delay in securing a reward in
terms of data protection and patent extension. Reasons for which respondents argue that the
100 See also the EC better regulation guidelines: http://ec.europa.eu/smart-regulation/guidelines/tool_42_en.htm.
101 Consideration 4 of the Paediatric Regulation. This consideration also mentions that: children will not be subjected to
unnecessary trials or delaying the authorisation for adult medicines in achieving this overall objective.
102 Relevance refers to the question whether the original objectives of the Regulation are still valid.

79
objectives of the rewards provided by the Regulation are not relevant to organisations’ needs
and objectives include the following:
Organisations not extending an SPC or filing a PUMA;
Lack of market for paediatric-only products in the paediatric population and therefore no
opportunity to generate a significant income over a 6-month period;
Concern over a mismatch between PDCO-required development of indications in
therapeutics areas where the company has no expertise (in the development of paediatric
indications) and/or needs to plan a separate development for children.
Figure 23 Are the objectives of the rewards provided by the Regulation relevant to your needs and objectives?
Source: Technopolis survey, based on 27 responses
4.2 Effectiveness103
Below we present the insights from the various sources on the overall effectiveness of the
Regulation, including specific considerations towards the three rewards.
4.2.1 Overall effectiveness of the Rewards – insights from data and literature
Objective 1 - One of the explicit goals of the Regulation is to facilitate the development and
accessibility of medicinal products for use in the paediatric population. Related to this is the
objective to reduce the off-label use of medicinal products in the paediatric population. The
paediatric investigation plan (PIP) and the related rewards (SPC-reward, but also the PUMA-
reward) are the main tools to achieve this goal.
103 Effectiveness relates to the question whether the Regulation has been successful in achieving (or progressing) towards the
objectives mentioned above. See also: Ecorys, ‘How well does regulation work? The cases of paediatric medicines, orphan drugs
and advanced therapies’, Final report, Ministry of Health, Welfare and Sport, 9 November 2015.
44%
4%
22%
26%
4%
Highly relevant
Relevant
Somewhat relevant
Not relevant
Other

80
The previous sections have shown that especially the number of SPC-rewards show a large
uptake over the period 2007-2015. For the orphan-reward and the PUMA-reward on the
other hand the actual number of granted rewards is rather low (see sections 3.3-3.4). These
mixed results raises questions especially about the effectiveness of the orphan and the
PUMA-reward, but stress at the same time the relative attractiveness of the SPC-reward. The
latter is in line with previous publications of for example by the EMA. In the report of the
EMA on the experience acquired as a result of the application of the Paediatric Regulation
(2012)104, it is stated that 31 out of 152 new medicines have been centrally authorised for
paediatric use since 2007.105. This number might increase in the future, because of new
products in the pipeline and the completion of PIPs for which the conduct of paediatric
studies has been deferred. In addition, a considerable number (72) of new paediatric
indications were approved with regard to variations on authorised medicines and 26 new
pharmaceutical forms were authorised for paediatric use.106 Based on these observations,
we conclude that the SCP-reward was effective and facilitated the development and
accessibility of paediatric medicinal products. The Orphan-reward and the PUMA-
reward were not deemed as effective.
Objective 2 - Regarding the objective to ensure ethical research of high quality, we noted
that development of medicinal products for paediatric use is now an integral part of the
business for the pharmaceutical sector and individual companies. Whether this qualifies as
‘ethical research of high quality’ cannot be judged based on the information sources we have.
Nevertheless, the effect in ‘volume’ is visible. Recent information on the number of
applications submitted for a PIP illustrates the (volume) effect of the rewards. By the end of
2015, in total, 858 PIP applications received an initial decision from the Paediatric
Committee (PDCO) of the EMA. Based on data analysis from EudraCT, the proportion of
paediatric trials as a percentage of all trials increased from around 7.5% (188 exclusively
paediatric trials) in 2007 to 18.0% (473 exclusively paediatric trials) in 2015. The number of
PIPs receiving positive opinion on compliance check (i.e., ‘completed’) was 99 by the end of
2015, and 116 PIPs by August 2016. As stated above (relevance), the relatively low number of
completed PIPs is mainly due to the long development cycle of a medicinal product; this
often takes more than 10 years. Since the Paediatric Regulation came into force, there has
been limited progress in the paediatric oncology drug development. Unmet needs in
paediatric oncology drug development are ‘restricted increases in early phase paediatric
oncology trials, regulatory pressure to propose early PIPs, lack of innovative trial designs and
no new incentives to develop drugs against specific paediatric targets’.107 Based on this we
conclude that the rewards were effective in increasing the volume of paediatric research, but
that it is not clear whether it classifies as ‘ethical research of high quality’.
104 European Medicines Agency. 5-year Report to the European Commission. General report on the experience acquired as a
result of the application of the Paediatric Regulation. EMA/428172/2012. London: EMA, 2012.
105 Of these, 10 met the conditions of the general authorisation requirements of Article 7 of the Regulation.
106 European Commission. Report from the Commission to the European Parliament and the Council. Better Medicines for
Children — From Concept to Reality General Report on experience acquired as a result of the application of Regulation (EC) No
1901/2006 on medicinal products for paediatric use. COM(2013) 443 final. Brussels: European Commission, 2013.
107 Vassal, G., Rousseau, R., Blanc, P., Moreno, L., Bode, G., Schwoch, S., ... & Saha, V. (2015). Creating a unique, multi-
stakeholder Paediatric Oncology Platform to improve drug development for children and adolescents with cancer. European
Journal of Cancer, 51(2), p. 218-224.

81
Objective 3 - With regard to the objective to improve the information available on the use of
medicinal products in the various paediatric populations, articles 45 and 46 of the Regulation
apply. These Articles require that generated study data in the paediatric population must be
submitted to national competent authorities to evaluate, for example, whether amendments
are needed with regard to the Summary of Product Characteristics (SmPC). It appears,
however, that not all SmPCs are updated. For example, in 2011, still one-third of (Estonian)
children were exposed to prescription medicines not labelled for paediatric use.108 Although
there are paediatric medicines on-label, off-label use of prescription medicines still exists
significantly in outpatient settings. For example, in the UK, products can be introduced on
the market without market authorisation (e.g. hospital preparations). According to a
stakeholder, hospitals will not stop using medicines off-label because the other comparable
medicinal product is often more expensive (e.g. in the case of Buccolam).
Another measure that is relevant in this context is the European Network for Medicines
Research at EMA (Enpr-EMA). This is a paediatric clinical research network, set up in 2009,
to improve the quality of research of medicines in children. In addition, the EU provides
funding to stimulate research in the field (Article 40) - i.e., research is ongoing targeting at
least 25 off-patent medicines (active substances) with a total budget of more than €98m.109,110
The PDCO has a crucial role in increasing high-quality research and promoting the
development and authorisation of medicines for children.111 For example, since 2008
approximately 18,000 paediatric study reports were published with information from the
developer.
4.2.2 Overall effectiveness of the Regulation – insights from the survey and interviews
Three companies (out of 27 survey respondents) consider the regulation to be highly effective
in achieving its objectives, stating that without the regulation, the organisation would not
have committed to the development of paediatric medicine. It was noted that the
effectiveness is higher for high-volume products and lower for indications with very limited
patient numbers.
Interviewees provided a number of reasons to explain why, in their opinion, the Regulation
has been effective. First, the Regulation has changed the priority given to paediatric
development and has increased the amount of research and information available for the
paediatric population. Second, the Regulation has been very effective in changing how
companies approach paediatric research, conducting their research and incorporating the
paediatric population in their development plans. However, it also (third point) created
additional obligations and additional costs to bring new medicines to the market.
Stakeholders indicate that the obligations have brought the biggest impact in terms of
108 Lass, J., Irs, A., Pisarev, H., Leinemann, T., & Lutsar, I. (2011). Off label use of prescription medicines in children in
outpatient setting in Estonia is common. Pharmacoepidemiology and drug safety, 20(5). p. 474-481.
109 European Medicines Agency. 5-year Report to the European Commission. General report on the experience acquired as a
result of the application of the Paediatric Regulation. EMA/428172/2012. London: EMA, 2012.
110 European Commission. Report from the Commission to the European Parliament and the Council. Better Medicines for
Children — From Concept to Reality General Report on experience acquired as a result of the application of Regulation (EC) No
1901/2006 on medicinal products for paediatric use. COM(2013) 443 final. Brussels: European Commission, 2013
111 Dempsey E.M. & Connolly K. (2014) ‘Who are the PDCO?’ European Journal of Pediatrics 173 p. 233-235

82
increasing paediatric research and ultimately resulting in more medicines approved for
children.
Interviewees also indicate that there are some difficulties in achieving the objectives of the
rewards. The complexity of the regulatory environment and the process has increased, which
is considered rigid by industry stakeholders. Furthermore, there is too much focus on
regulatory compliance instead of facilitating product development. These compliance checks
result in a delay in assessment. Interviewees report also fragmented administration and
regulation: the interaction between the Paediatric Regulation and ’regular’ pharmaceutical
legislation is not optimal. Some of the requirements of the Regulation have been superseded
by other regulations which might lead to double reporting. In addition to this, it is stated that
the Regulation has met most of its objectives with combinations of incentives and obligations
to promote research in paediatric indications and testing in children. Significant relevant
data has been collected by companies from studies in children. Nevertheless, from a public
perspective the effectiveness of the Regulation is somewhat reduced because some public
services may decide not to pay for the registered paediatric medicines. There are multiple
barriers on the national level which may hinder the introduction of paediatric medicines on
the national level. A few national authorities indicated that the Regulation was set up from an
overly narrow perspective, excluding affordability, cost-effectiveness and budget implications
at the national level.
The survey respondents that state that the Regulation is somewhat effective or not effective
argued that complications exist because reaching eligibility for rewards is difficult due to the
following:
PIP required very early in the product development, where uncertainties is significant
and product discontinuity is likely;
Paediatric subject recruitment difficulties;
Potential imbalance between investment and reward;
Study delays and additional time needed to conduct the necessary paediatric research and
to complete the necessary regulatory approval procedures;
Complexity of actually obtaining the reward once the research is completed in part in
relation to:
Compliance check procedures
Type II variation assessed by CHMP (and not PDCO)
Necessity to submit the updated marketing authorisations from all 28 Member States
(Article 36) with necessary translations (even if the SPC extension application is only
to be made to a subset of Member States)
Variations of protocols by Local Regulatory Authorities and Ethics Committees and
national patent offices, adding complexity and delay;
The deadline for SPC extension by national patent offices is 2 years prior to SPC
expiry; the corresponding PIP and the associated regulatory procedures must have
been fully completed by that time.
According to Art 36(3) of the Paediatric Regulation, in order to be able to apply for
rewards the medicinal product must have been registered in all EU Member States

83
(MS). However, many non-centralised products are not approved in all MS for a
variety of reasons.
Respondents also claimed that the proportion of PIPs that have been granted an SPC
extension is relatively low. PUMA rewards are argued to not be effective because these do not
take into account the pricing and reimbursement rules in some Member States. One
respondent argued that the regulation generated a disadvantage to the organisation in the
global market due to the delay the PIP imposed on market authorisation.
Figure 24 How effective are the rewards as a mechanism and means to achieve the objectives of the Paediatric
Regulation?
Source: Technopolis survey, based on 27 responses
4.2.3 Specific considerations about the SPC reward
The Regulation linked to the SPC reward is an incentive for companies to develop medicinal
products for use in children. For this purpose, companies need to agree a PIP before
submitting marketing authorisation (rather than complete a PIP since completion may be
deferred). There have been concerns raised by companies with regard to the PIP. According
to the industry filing the PIP application takes significant time to complete because the
applications are too broad. In addition to this, the requirements of the Regulation are
perceived as stringent because the time limit to submit a PIP application is very early (end of
clinical trial phase I) and the PIP application has to be overly detailed. The combination of
these two issues makes it very hard for companies to engage in flexible product development.
During the development phase of a medicine there is high uncertainty with regard to the
benefit risk profile which may require adaptations of the study design. This makes it difficult
for companies to complete a PIP without any modifications of the initially agreed
programme. However, the EC and the EMA have mitigated this recently by clarifying in the
new EC guideline and in the EMA procedural advice that filing the PIP application at the
beginning or during phase II is acceptable. One stakeholder felt that there is a significant lack
11%
48%
19%
22%
Highly effective
Somewhat effective
Not effective
Other

84
of transparency during the process of assessment of SPC grants. The main reason for this is
that there may be different procedures required for individual SPC extensions per country.
In addition to this, some stakeholders argued that the SPC extension results in a loss for
society because generic entrance is blocked for 6 months. This six-month period is deemed
very expensive in terms of paying the price for a branded product. This issue is described in
more depth under ‘efficiency’. Others indicate that society is obtaining the benefit of the
clinical studies and the results of the studies and of the formulations for the paediatric
population, regardless whether the product comes to the market or not. Developers of
medicines indicate that the development costs are increasing, but the benefits of the potential
SPC extension are reducing (compared to the costs). In particular, many compounds have
more than one agreed PIP, nevertheless, companies can only secure reward for the non-
orphan PIP that is attached to the first regulatory submission.
Overall the SPC reward is seen valuable by stakeholders and as a minimum incentive for the
studies in paediatric population. There are however several factors which hinder the
effectiveness of the SPC reward. For example, stakeholders indicate significant barrier at the
level of the national health authorities in terms of timeliness of issuing updated marketing
authorisations that contain the paediatric compliance statement. The process is also
bureaucratic and labour intensive, especially for non-centrally approved products, when
products are approved individually by the national MS health authorities.
Compared to the PUMA and the Orphan designation, the route to a potential SPC reward is
considered obligatory according to stakeholders. With the PUMA and the Orphan
designation, there is the option to choose to pursue various forms of product development for
new products and relevant variations to existing products.
4.2.4 Specific considerations about the Orphan reward
Several interviewees indicate that the Orphan reward is not working well in view of the low
number of orphan medicinal products that have obtained the reward since the instigation of
the Paediatric Regulation. However, interviewees expect that there will be more relevant
results in the future. One of the main reasons for the small amount of orphan designations is
that the development of orphan drugs targeting children is complex and costly because the
study population is very small. From a legal perspective, stakeholders stated that Article 37 is
not clear because it concerns marketing authorisation. When the Regulation came into force,
there were already several orphan products on the market (Orphan Regulation 2000). If
these products were developed further for a new indication targeting children, this is not
covered by Article 37 of the Paediatric Regulation because this Article is only focussing on the
development of new products.
The difficulty to draft a PIP application for rare diseases has also been described in the
literature (Kreeftmeijer-Vegter et al, 2014), focussing on orphan medicines. These authors
concluded that the Regulation “added complexity to the research and development and
regulatory process of orphan medicinal products, exemplified by the applicant’s investment
time and effort in drafting a PIP application”. This complexity has led to a minor impact on

85
the availability of orphan drugs for children and has increased time to marketing
authorisation.112
In addition, the therapeutic areas covered by research in children are currently reflecting
more clearly the needs of adults instead of those of children, although research in children
younger than 2 years seems to be increasing.113 The proportion of clinical trials of all trials
(adults and children) has increased over the last years (7.4% in 2008, 10.4% in 2012 and
12.4% in 2014). However, note that over time the number of adult clinical trials decreased
while the number of paediatric clinical trials increased.116
Interviewees indicate that the two additional years can be very valuable for an orphan
product when a company has invested in the development. However, they also indicate there
is a drawback in the Regulation because it is not permitting a company to choose between the
2-year extension to orphan exclusivity or the 6-month SPC extension available for other, non-
orphan products. The orphan reward may also bring other important incentives in the
market place. This might be pricing and reimbursement advantages or positive acceptance
and recognition of clinicians and stakeholders for an orphan drug, which may contribute to
the effectiveness of the Regulation.
According to other interviewees, the orphan designation is one of the strongest incentives.
However, in some cases where the substance is also registered for non-orphan indication the
value of the patent extension may be greater than that of the additional exclusivity depending
on the life cycle of the drug.
4.2.5 Specific considerations about the PUMA-reward
Until now two PUMA applications have been granted. It appears that there is no significant
interest from product developers and academic networks for this award. The main reason for
this is that the costs outweigh the potential revenue/profit as the return on investments in
developing paediatric drugs is lower (or uncertain) compared to the development of adult
drugs.
According to the interviewees, the investment in clinical trials for paediatric use is practically
impossible in view of the high costs of studies and very low and unpredictable return on
investments for new paediatric medicinal products. This makes it difficult for the PUMA to
be a strong incentive. According to stakeholders, there are various reasons why the PUMA
does not provide effective exclusivity. The main reason is that there might already be generics
in the market because medicines are no longer protected by patents/SPCs or Orphan market
exclusivity. This protection relates to the paediatric data/indication only and therefore
restrains generic applications for that particular indication and their reliance on that
particular data only. It is difficult to ensure that generics are not used for that protected
indication when they are available on the market in some kind of pharmaceutical dosage
form, for a different indication (off-label use/compounding).
112 Kreeftmeijer-Vegter, A.R., de Boer, A., van der Vlugt-Meijer, RH, de Vries, P.J. The influence of the European paediatric
regulation on marketing authorisation of orphan drugs for children. Orphanet Journal of Rare Diseases; 2014 (9):120.
113 European Commission. Report from the Commission to the European Parliament and the Council. Better Medicines for
Children — From Concept to Reality General Report on experience acquired as a result of the application of Regulation (EC) No
1901/2006 on medicinal products for paediatric use. COM(2013) 443 final. Brussels: European Commission, 2013.

86
One of the interviewees indicates that the main reason to ask for a PUMA was for the
administrative protection of the data. In addition to this, without the PUMA there would be
no access to certain price procedures and it was financially attractive. Barriers for companies
to use the PUMA includes off-label competition by generics and compounding and the high
investment costs of clinical development. There is no certainty about the level of reward a
company will ultimately get considering the price and volume of the product sold.
According to interviewees, applying for a PUMA is an overly rigid process because there
needs to be absolute compliance. There is no possibility to explain little deviation from the
opinion. From a public stakeholders’ perspective it represents a risk that a company might
increase the price of a product when it is introduced as a registered product. Overall, the
PUMA reward is therefore not sufficient and effective in its current form to achieve the
objectives it was intended to do. The PUMA reward could be more effective with incentives
linked to easier route for pricing and reimbursement.
4.3 Efficiency
Efficiency (or inefficiency) normally relates to the relationship between the resources used by
an intervention (like the rewards of the Regulation) and the changes generated by the
intervention (e.g. more research and more approved paediatric medicines). This relationship
is assessed in more detail in Chapter 2 (costs) and Chapters 5-6 (costs and benefits). Here,
the focus is on the aspects of ‘attractiveness’ of the reward, as most stakeholders refer to it.
4.3.1 Insights from literature
EMA reported that the objectives of the Regulation could be achieved more efficiently,
especially “the agreement and conduct of studies in PIPs, requiring feasible studies with
children, identifying priority medicines for use in children, progressing regulatory science on
paediatric medicine development, decreasing administrative burden by decreasing the
number of minor changes to agreed PIPs”.114 This has been addressed through the change of
the Commission guideline in 2014, through establishing a more streamlined process and by
introducing the concept of (mandatory) “key binding elements” of a PIP.115 Nowadays, a PIP
only needs to be modified, if the company believes that one of these key binding elements
should be changed. This substantially reduces the risk of PIP modifications for “minor”
changes.
Because of the strict PIP requirements, pharmaceutical companies need to invest
considerable amounts of time and resources to develop and execute the PIPs. Since
the outcome of this process is less than certain, this makes paediatric drug
114 European Medicines Agency. 5-year Report to the European Commission. General report on the experience acquired as a
result of the application of the Paediatric Regulation. EMA/428172/2012. London: EMA, 2012.
115 European Medicines Agency (EMA) ‘Paediatric investigation plans’ [Internet] Accessed on: 25 March 2016. Available at:
http://www.ema.europa.eu/ema/index.jsp?curl=pages/regulation/general/general_content_000608.jsp&mid=WC0b01ac058
0925b1b

87
development relatively unattractive for small companies, such as biotechnology
companies and start-ups.116
Also, mainly large pharmaceutical companies (‘blockbuster’ drugs) have benefited so far from
the SPC extension. The orphan drug reward and the PUMA reward have been awarded to a
total of six products only. Especially, the PUMA is felt to be inefficient by stakeholders, as
also stated in the EC report Better medicines for children.117 The PUMA appears not to be an
attractive incentive for companies and SMEs to develop or repurpose already marketed
drugs. Another reason for the relatively low number of PUMA rewards is the niche market in
which the pharmaceutical companies have to operate. This creates uncertainty. Generic
companies face a similar problem. It is considered relatively too costly to conduct clinical
trials in a niche market.
Although generic companies are supportive of the Regulation, they have the opinion that the
6-month SPC prolongation is not efficient, because it is not addressing the therapeutic fields
with the highest unmet needs. Overall, the incentives work better for new medicines still
under patent protection.
4.3.2 Insights from stakeholders
There is consensus amongst survey respondents that the 6-month extension to SPC that can
be granted as a reward for completion of required paediatric studies is the most attractive.
The SPC reward is seen as ‘valuable’ for the completion of an agreed PIP and the associated
regulatory procedures, are seen as more efficient. However, the procedure towards an SPC
reward is overly complex. The (long) time needed to conduct the necessary paediatric
research and the fact that only one SPC may be extended under the Regulation, results in
difficulties. Other complexities/difficulties around the SPC reward are:
Difficulties in extending the SPC in EEA countries like Norway and Iceland, although they
benefit from all the research conducted
Difficulties on the national level with the different patent offices
For some products the SPC lasts longer than the orphan reward and a company cannot
choose between these two rewards.
It is indicated by stakeholders that the orphan designation reward is also efficient. The two-
year extension of market protection period in case of orphan drugs is seen as valuable,
although only four orphan rewards have been granted to date. According to stakeholders the
reward provides a return on investment for developing paediatric formulation and obtaining
more specific data in children. Most of the orphan drugs do not have an SPC, so market
exclusivity extension is important. In some cases, companies may not receive any reward
after completing the PIP because the OMP status is not retained. Stakeholders indicate that
there are also difficulties with not being able to choose between the rewards and not having
the assurance that the reward is received after complying with the regulation.
116 Vassal, G., Rousseau, R., Blanc, P., Moreno, L., Bode, G., Schwoch, S. & Saha, V. (2015). Creating a unique, multi-stakeholder
Paediatric Oncology Platform to improve drug development for children and adolescents with cancer. European Journal of
Cancer, 51(2), p. 218-224.
117 European Commission (2013) ‘Better medicines for children from concept to reality’ COM (2013) 443 FINAL

88
According to stakeholders the PUMA reward is the least efficient because it does not offer
meaningful market exclusivity. A PUMA is granted to off-patent products which are already
subject to generic competition. Despite the intention of an innovative company to invest in
the preparation and the conduct of a PIP and associated regulatory procedures, the resulting
PUMA is not likely to provide any commercial value. In addition to this, generic products will
in many cases (continue to) be prescribed off-label for the newly authorised paediatric
indication. Market access for a PUMA product is often a problem in addition to off-label use.
One stakeholder noted that a company may conduct all relevant research, create new
paediatric formulation, and register the product for reimbursement. But this registered
product is often not prescribed by doctors in European countries because there is a cheaper
alternative (compound).
Overall, the assessment shows that especially the SPC-reward is an (attractive) instrument
that drives companies to carry out more research on paediatric medicines. For the orphan
and PUMA-reward, the incentive is much smaller and pharmaceutical companies often do
perceive these rewards as inefficient (or unattractive).
4.4 Assessment of the coherence118
The assessment of coherence focuses on whether there are overlaps/complementarities
between the rewards and related EU or Member State action. In Table 22 we describe
initiatives and rewards which are instigated by several EU member states.119 This information
is derived from the annual reports published by the EMA from 2012-2014.120 Most of the
initiatives and benefits are complementary and there appears to be some overlap – see also
Table 22. For example, with regard to facilitating the development and accessibility of
medicinal products for use in the paediatric population, we encountered countries that focus
on prioritised reviews of the clinical trials and data for paediatric medicines (Austria, Poland
and Spain). Prioritising certain research might facilitate the accessibility of paediatric
medicinal products in a way that these medicines will be faster on the market. Second, some
EU member states like the United Kingdom and France are providing national legislation to
diminish the off-label use of medicines for children, aimed at facilitating the development of
paediatric medicines. In the UK, the Pharmaceutical Price Regulation Scheme (PPRS)
provides financial incentives to encourage the use of paediatric medicines (initiated in
2014).121 In France, a legal framework was introduced to regulate and reduce the use of off-
label medicines in combination with a legislation to supervise the prescription of medicines
for indications for which the medicines are not licensed (initiated in 2013).122 In Italy,
physicians are allowed to prescribe certain non-authorised medicines when they are included
in an official list defined by the Technical Committee of AIFA (Law 648/96). These medicines
are then reimbursed by the Italian NHS. However, this approach allows for more off-label
118 The evaluation of coherence involves looking at a how well or not different actions work together.
119 European Medicines Agency (2012-2014) ‘Annual Report to the European Commission’
120 The annual EMA reports on rewards and benefits include a section on MS rewards/incentives:
http://ec.europa.eu/health/human-use/paediatric-medicines/index_en.htm
121 Website UK Government (2014) ‘Guidance Pharmaceutical Regulation Scheme 2014’ [Internet]. Accessed on 25 March 2016.
Available at: https://www.gov.uk/government/publications/pharmaceutical-price-regulation-scheme-2014
122 Website Agence Nationale de Sécurité du Médicament et des Produits de Santé (ANSM) [Internet]. Accessed on: 25 March
2016. Available at: http://ansm.sante.fr/

89
use of medicines in children.123 In Spain, prices for paediatric medicines are excluded from
the reference pricing system and individually priced. The national initiatives might support
the Paediatric Regulation in its implementation across the EU.
Research networks are also financially supported by countries to stimulate paediatric
research. In the United Kingdom, the Medicines for Children Network has been initiated,
specifically focussing on the development of medicines for children. In Austria, a research
platform for paediatric research was created for the academia and the industry to stimulate
cooperation in the development of paediatric medicines. These research networks provide a
platform for paediatricians to pool their experiences and, in this way, improve the
information available on the use of medicinal products and the best treatments available for
children.124
In the area of paediatric (academic and hospital) research there are a number of large
consortia which are involved in product development projects. Several organisations support
this paediatric research by stimulating international cooperation and connecting existing
networks. Examples of these organisations are European Society of Development for
Pharmacology and the European Network of Paediatric Networks. In the Netherlands, a
consortium with the industry has been created. In addition to this, the Netherlands was
planning to build a research infrastructure (with support from the Ministry of Health) for
medicines research for children. However, an adult structure has finally been set up in
cooperation with the industry.
123 Prada, M., Bertozzi C., Proietti B., Urbinati D., Intexo, IMS Health, The Italian 648/96 list: Approvals, rejections and methoid
in AIFA’s evaluation process between January 2013 and October 2015. ISPOR Scientific Presentation. Available at:
http://www.intexo.it/wp-content/uploads/2016/07/2015-ISPOR-648-Law.pdf
124 Website O.K.ids. Available at: http://www.okids-net.at/kinder-familie. Accessed on: 2-3-2016

90
Table 22 National incentives and benefits EU Member States
Country National incentives and benefits
Austria Prioritised review of clinical trial applications. Clinical trial applications are
immediately screened by an assessor. A prioritized scientific review is
performed, if necessary.
Priority setting 2012
Austria Consortium to implement a platform for paediatric research for both
academia and industry. http://www.okids-net.at/
Research Network 2014
Italy Reimbursement of medicines: several medicines have been included in a list
according to Italian Law 648. These medicines are not licensed in Italy for
specific paediatric indications. However, Law 648 allows physicians to
prescribe medicines where no therapeutic alternatives are available
(including for paediatric patients, in specific therapeutic indications, and
after having received a positive opinion from the Italian Medicine Agency's
Commissione Tecnico Scientifica). After this the medicine will be reimbursed
by the National Health System. Law 648 is applicable on off-label indications
for products specifically marketed in Italy, or for products which are not (yet)
marketed in Italy. It is important to notice here that the inclusion of a
medicine in the list of Law 648 does not modify the SmPC and therefore, the
paediatric indications of these 'listed' medicines remain unauthorised and
not extendable to other Member States.
Reimbursement 2012
Spain Special measures for pricing of paediatric medicines. Pharmaceutical forms
specifically intended for the treatment of paediatric population are excluded
from the system of prices of references (Royal Decree 16/2012)
Pricing 2012
Slovenia Fee waiver for clinical trials with the paediatric population Incentive 2012
France The introduction of a new legal framework with the aim to reduce and
regulate the use of off-label medicines was implemented in combination with
a related decree for 'Temporary Recommendations for Use'. This legislation
was provided as 'a regulatory process for temporarily supervising the
prescribing of medicines for indications for which they are not licensed'. This
legislation applies to any medicinal product and may therefore have an
impact on the use of medicines in children for which off-label prescription is
frequent. At the moment of publishing the 2013 annual report of the EMA, it
was too early to assess the impact of this new legislation in paediatrics.
Regulation 2013
Poland Priority review of paediatric data decided on a case-by-case basis Priority setting 2013
Spain Paediatrics and perinatal medicines are considered priorities (by "Instituto
de Salud Carlos III", decision on 11th of June 2013). The legislation was
instigated to fund strategic health actions as part of a state programme for
investigation of social objectives.
Priority setting 2013
United Kingdom Medicines for Children Research Network. The UK Government provides
support for the NIHR Medicines for Children Network (MCRN). This
network provides infrastructure across all of England to support the delivery
of paediatric medicines studies (although not direct funding).
http://www.mcrn.org.uk/
Research Network 2013

91
4.5 Assessment of the utility125 and potential for improvement
In terms of the number of medicines that has become available, there is already a visible
positive impact.126 However, the impact of the regulation on research quantity and quality in
children stemming from PIPs is not yet clear.127 Funding is an important aspect to support
the development of paediatric medicines. Expanding funding options for research into
paediatric medicines, e.g. via ‘Horizon 2020’ or other relevant EU Research funds (e.g.
Innovative Medicine Initiative) might provide (also for companies) a framework for
investment in paediatric research.128
4.5.1 View of Medicines for Europe
According to Medicines for Europe, several measures could be taken to improve the effects of
the Paediatric Regulation. At this moment, it is possible for multiple stakeholders to receive
the six-month extension. Medicines for Europe would like to be ensured that the SPC
prolongation should be awarded only to the market authorisation holder and just for one
SPC. It has to be excluded that certificates, which are granted to third parties, will receive 6-
month SPC prolongations too. This means that the SPC reward should be granted exclusively
to the company who sponsors the paediatric studies and is responsible for the compliance
with the PIP.
A second (legal) improvement of the six-month SPC prolongation proposed by Medicines for
Europe is to remove the possibility of “negative term SPCs”. When a market authorisation
procedure for a product takes more than 5 years after filing for a patent, than the SPC will
extend the patent protection for that certain product over the 5 years. However, if this period
to obtain market authorisation takes less than five years, the formula gives a negative term:
Term = ([date of 1st MA in the EEA] – [date of filing of corresponding patent]) – 5 years
The market authorisation procedure for paediatric medicines often takes longer compared to
the procedure for comparable products in adult use.129 The Regulation therefore should
govern whether or not an applicant is able to obtain SPC protection. By permitting the
125 Utility: to what extent do the changes/effects of an intervention satisfy (or not) stakeholders' needs?
126 European Medicines Agency. 5-year Report to the European Commission. General report on the experience acquired as a
result of the application of the Paediatric Regulation. EMA/428172/2012. London: EMA, 2012.
127 Kreeftmeijer-Vegter, A.R., de Boer, A., van der Vlugt-Meijer, RH, de Vries, P.J. The influence of the European paediatric
regulation on marketing authorisation of orphan drugs for children, Orphanet Journal of Rare Diseases; 2014 (9):120
128 Ruggieri, L., Giannuzzi, V., Baiardi, P., Bonifazi, F., Davies, E. H., Giaquinto, C., ... & Rabe, H. (2015). Successful private–
public funding of paediatric medicines research: lessons from the EU programme to fund research into off-patent medicines.
European journal of pediatrics, 174(4),p. 481-491.
129 Forresters, December 2011 ‘The CJEU allows negative term SPCs’
United Kingdom Financial incentives to encourage use of paediatric medicines including
PUMA. The Pharmaceutical Price Regulation Scheme (PPRS) is a mechanism
used by the UK Department of Health to control the prices of branded
prescription medicines supplied to the NHS by regulating the profits that
companies can make on their NHS sales. This is an incentive in a way that it
provides support for research and development (R&D) through allowing
R&D in the assessment of a company's profitability of its business with the
NHS.
Regulation 2014

92
granting of negative term SPCs, the Court of Justice of the EU has reduced the time frame
from 5 years to 4 years and 6 months from the filing of a patent before SPC protection
becomes a possibility. In this situation, companies will benefit from the paediatric extension
of their SPC and might gain more profits out of the SPC prolongation. Only an amendment of
the SPC Regulation (amending Article 13, Regulation 469/2009) could change this situation.
The transparency around the SPC procedure could also be improved, according to Medicines
for Europe. However, measures on Member State level are needed to achieve this, through
national legislation and within the IP offices governed by a different legislative regime. In
addition, incomplete PIP applications, missing data in the PIP applications, should not be
tolerated by EMA.
The effect of the PUMA reward could be improved by taking into account various practical
aspects, for example legal and payer aspects.
In the past, there have been several withdrawals from the orphan designation procedure.
According to the Medicines for Europe, the reason for this is that it is not possible to receive
the Orphan designation for both an orphan and a non-orphan designation. This makes a SPC
more valuable for pharmaceutical companies compared to an orphan designation, also
because there are potentially more benefits in the SPC reward. When a product has an orphan
designation, the product cannot receive a SPC extension, even if these products have SPC
pending. There are currently court cases regarding the SPCs. In some countries, patent offices
receive specific training about the SPC procedure under the national regulatory system (e.g.
the Netherlands). As a result, there is more flexibility in the way these patent offices deal with
SPC submission from companies.
4.5.2 View of other stakeholders
Based on the interviews with stakeholders and the survey to industry, a number of potential
improvements have been listed to enhance the positive effects of the rewards.
Suggestions to reduce cost via a revision of the PIP process include the following:
Streamline the PIP modification process
Split PIP requirements in short term objectives which are more manageable to achieve
before patent expiry and granting the reward, and long term commitments to be fulfilled
Adopt a more flexible approach with a ‘full’ PIP in case of new and innovative drugs, and
a different (lighter) approach for Article 30 (off-patent) drugs
Improve guidance on PUMA in relation to orphan drug submissions
Continue and increase inter-agency collaboration to facilitate global paediatric programs
Increase transparency, share best practice and paediatric experience and publishing
aggregate data for those products that achieve the exclusivity incentive
Revise Article 8 - Article 8 was intended as a bridging step when the Regulation was
adopted, to ensure products already on the market would be developed further for
children. According to the interviewees, this transition period is over, as all products that
were on the market at the time of the adoption of the Regulation are now off-patent. This
calls for the elimination of Article 8 for products that were already subject to Article 7,
allowing future PIPs for the same product to be exempted.

93
Suggestions to reduce cost via simplification and revision of PIP authorisation process are the
following:
Committees could match protocol and endpoint designs more appropriately to common
care practices in order to develop trials that can be executed in member countries.
Revise the current form of Article 36(3) and allow the SPC extension also when not all
Member States have approved the product.
Base reward decisions on a positive compliance check (only)
Centralise SPC extensions in Europe
Harmonise advice and requirements across interested Institutions (PDCO, CHMP and
EC) through enhanced internal coordination (for example as in the FDA). Applicants
currently need to engage with advice from different bodies and this unnecessarily
complicates the process. The different entities could also share their opinion at the time
the company works with the PDCO (e.g. requests by the PDCO will be accounted for in
the procedural part for the registration).
Harmonise national processes - More measures regarding pricing and reimbursement at
the national level could be taken by national authorities. In addition, a more streamlined
process with the patent offices is preferred to remove barriers at the national level.
Suggestions to increase the incentive are the following:
Introduce an extension of regulatory data protection for products not patent/SPC
protected
Revise the deadline for the extension applications taking into account the length of the
PIP completion and the completion of the associated regulatory procedures
Make the six-month extension of protection applicable to all types of protection (not just
an SPC)
Extend the period of market protection, rather than SPC extension
Link the value of the rewards to the medical need in children and the real development
cost
Allow sponsors to choose between a prolongation of data exclusivity or of patent
protection according to their situation. For some products, the SPC reward lasts longer
than the orphan exclusivity. Allow the sponsor to choose the kind of reward that is the
most valuable for a particular product. For non-protected orphan products there are
cases where market exclusivity extension instead of the PUMA route would be preferable
Allow the possibility of getting the SPC extension even with delayed paediatric drug
development
Increase the period of SPC protection
Apply SPC extension to “any compound on patent” that is held by the company
Create incentives for further voluntary PIP
Create a level-playing-field and extend the Regulation to Iceland and Norway (EEA). The
regulation has not yet been fully implemented in those markets; these countries benefit
from the inclusion of the paediatric studies data into the approved products’ SmPC

94
(because they are part of the EU medicines regulatory system), but they do not grant the
corresponding reward
Enforce the regulation at the national level and eg eradicate the use of state substitution
of unlicensed medicines or off-label use after a PUMA has been approved.
4.5.3 Potential for improvement – Lessons to be learned from the US
Before the introduction of the Paediatric Regulation in Europe, the EU has lagged behind the
United States in issues concerning paediatric drug formulations.130 The table below provides
a brief overview of the development of US paediatric legislation.131
Table 23 US Paediatric Regulation
1994 1997 2002 2003 2007
Paediatric
Labelling Rule
Paediatric Rule
FDAMA: Food and
Drug
Administration
Modernization Act
BPCA: Best
Pharmaceutical For
Children Act
PREA: Paediatric
Research Equity
Act
FDAAA: Food and
Drug
Administration
Amendments Act
The current legislation stems from 2007 and includes a six-month patent extension for
paediatric medicines in exchange for new data generated by adequate paediatric trials. An
important contrast between the EU and the US Paediatric Regulation concerns the timeframe
of the development plan. The PIPs (EU) need to be agreed at the end of Phase I, while the
Paediatric Study Plans (PSPs) in the US need to be agreed at the end of Phase II. The
incentives differ as there are differences in statutes and regulations that govern paediatric
drug development.132
Another difference concerns funding of research for medicines in children. The funding of
research provided by the EU (FP7 paediatric projects) is limited compared to a similar
funding programme set up in the US (Paediatric Trials Network). In this programme
paediatric clinical trials were funded with a 3 to 4 times higher rate compared to European
studies.133 Another difference is the fact that the amount of researchers from academic or
public research institutions involved in paediatric research is relatively low in Europe.
However, in the US creation of paediatric research networks are not mandated via the
Regulation. Also, a difference is that the US legislation was designed to generate additional
paediatric data and balances between mandatory requirements and voluntary incentives.
130 Breitkreutz J. (2008) ‘European perspectives on paediatric formulations’ Commentary Clinical Therapeutics 30:11 p. 2146-
2154
131 Zisowsky J, Krause A, Dingemanse J. Drug development of pediatric populations: regulatory aspects. Pharmaceutics 2010; 2:
364-388. Review.
132 Ecorys Nederland B.V. ‘How well does regulation work? The cases of paediatric medicines, orphan drugs and advanced
therapies’, Rotterdam: November 2015.
133 Ruggieri, L., Giannuzzi, V., Baiardi, P., Bonifazi, F., Davies, E. H., Giaquinto, C., ... & Rabe, H. (2015). Successful private–
public funding of paediatric medicines research: lessons from the EU programme to fund research into off-patent medicines.
European journal of pediatrics, 174(4),p. 481-491.

95
When new data is generated by adequate paediatric clinical trials, the voluntary US
legislation offers patent prolongation in exchange. This in contrast with the EU legislation
which was designed to mandate full registration of all new drugs for children, whenever there
is a potential of paediatric use.134
Company efforts seem to be more encouraged and awarded in the US than in the EU (e.g. 6-
month prolongation as a reward for ‘’voluntary engagement’ in paediatric studies). In the EU,
companies need to comply with additional requirements. Authors have suggested to
coordinate European and US PIPs in order to avoid duplication and to accelerate
development in for example specific (cancer) diagnoses.135 Benefits under the US legislation
can be categorised as:
The economic value of improved paediatric health outcomes from greater access to
medicines (better label information from appropriate studies of paediatric
pharmacotherapy);
The value of the pharmaceutical innovation stimulated by the 6-month market exclusivity
provision.136
134 Rose K. (2014) ‘European Union pediatric legislation jeopardizes worldwide, timely future advances in the care of children
with cancer’ Clinical Therapeutics 36 (2) p. 163-177
135 Snyder, K. M., Reaman, G., Avant, D., & Pazdur, R. (2013). The impact of the written request process on drug development in
childhood cancer. Pediatric blood & cancer, 60(4), p. 531-537.
136 Vernon, J. A., Shortenhaus, S. H., Mayer, M. H., Allen, A. J., & Golec, J. H. (2012). Measuring the patient health, societal and
economic benefits of US pediatric therapeutics legislation. Pediatric Drugs, 14(5) p. 283-294.

96
5 Direct and indirect benefits
This chapter presents an analysis of the societal benefits of the Regulation and measuring
direct and indirect benefits: societal impacts of more effective paediatric treatments as well
as other potential impacts related to creating innovative supply chains from research
institutes and contract research services to the industry, creating new scientific environment
and knowledge, and promoting the rights of children through better access to appropriate
health care.
In addition to data collected via the survey to industry, the analysis builds on a two-stage
survey (Delphi) to expert stakeholders. The survey questionnaire was sent to experts from
across the EU, with 116 people ultimately completing the survey (Phase I Delphi), although
some respondents did not answer every question. The background and paediatric sub-
speciality of Phase I and Phase II participants are presented in Appendix D. The survey to
expert stakeholders was developed based on an exploratory telephone consultations and
pilots to uncover issues linked to social and broader economic impacts in the paediatric drug
development value chain. The survey collected qualitative and quantitative estimates for the
various dimensions of the impact as well as provided a set of open questions to identify
further benefits of the Regulation and their impact channels.
The design of the survey questions builds on the evidence gathered via the systematic
literature review and the secondary data analysis. This provided an outline of potential
benefits/impact drivers of the Paediatric Regulation. The focus of the social impact analysis is
to estimate to what extent better treatment (due to more effective medicinal products)
reduces the costs of paediatric healthcare treatment due to shorter periods of hospitalisation
or fewer adverse drug reactions (ADRs). This may lead to significant reductions in paediatric
healthcare expenditure and increased overall savings from reduced child morbidity and
mortality. We consider possible monetary and non-monetary impacts. We focus on the
following dimensions:
Availability of and access to medicines result in better treatments and better QoL for
children
Reduction of child-health expenditure, savings from reduced morbidity/ mortality,
increased school attendance, and decreased time taken off by parents for caring for their
children and adverse drug events
To estimate the monetary value of social savings from improved medical treatment of
children as a result of the Paediatric Regulation is very difficult. Vernon et al137 use US data
on discounted life-years, then authors calculate value-added life-years. It is assumed that if
off-labelling would have been on-labelling, this would have resulted in a 1% reduction of
mortality. The authors then calculate the value of this reduction in mortality using
discounted life year valuations. Therefore, using data on hospitalisation and mortality rates
in the EU one could refine the model. It should be noted that life year calculations differ
137 Vernon, J.A. et al., 2012. Measuring the patient health, societal and economic benefits of US pediatric therapeutics
legislation - Technical Appendix. Pediatric Drugs, 14(5), pp.283–294.

97
across countries. The EuroVaQ project138 looking at the European Value of a Quality Adjusted
Life Year provides a starting point on computing life year valuations across the EU.
An economic assessment of the second-degree effects of the Regulation, notably, on the
research framework created, activities of specialised research centres and CROs, public-
private funding created for paediatric medicine, new research knowledge established, and
networks formed. A good example is the European Network of Paediatric Research that aims
at fostering high-quality paediatric research; helping with the recruitment of patients for
paediatric clinical trials; and enabling collaboration between stakeholders.
5.1 Literature review
One of the chief aims of the 2007 EU Paediatric Regulation is protecting the health of
children by improving the availability of medicines and dosage information for children. The
regulation also intends to stimulate research into paediatric medicines. Thus, the regulation
is directly linked to societal impacts such as improved health of children, decreased disease
burden and costs to national health systems. Greater availability of published data on the
efficacy and safety of medicines will potentially lead to better use of medicines in children.139
For instance, benefits are expected from new paediatric indications, inclusion of special
(class) warnings, specification of dose regimens, timely development of paediatric friendly
formulations, and better quality of the clinical evidence.140
One of the direct consequences of the new regulatory requirements such as PIPs, even for
authorised medicinal products that are currently protected by patents, is the development of
formulations and dosages more appropriate for paediatric age groups.141,142 However, of all
the approved PIPs, only 26% and 35% of medicines included trials in young infants and
neonates, respectively (Hoppu et al. 2012). Moreover, some authors also argue143 that PIP
decisions can lead to the recruitment of vulnerable children to questionable studies. A similar
observation has been made with regard to the PREA in the US. For instance, the necessity of
4 proton pump inhibitor trials for gastrointestinal reflux disease in children has been
138http://research.ncl.ac.uk/eurovaq/EuroVaQ_Final_Publishable_Report_and_Appendices.pdf
139 Hoppu, K. et al., 2012. The status of paediatric medicines initiatives around the world-what has happened and what has not?
European Journal of Clinical Pharmacology, 68(1), pp.1–10.
140 Stoyanova-Beninska, V. V. et al., 2011. The EU paediatric regulation:. Effects on paediatric psychopharmacology in Europe.
European Neuropsychopharmacology, 21(8), pp.565–570. Available at: http://dx.doi.org/10.1016/j.euroneuro.2010.06.011
141 Challis, J., 2011. The impact of the Paediatric Regulation on existing medicinal products. Regulatory Rapporteur, 8(10),
pp.4–7.
142 Olski, T.M. et al., 2011. Three years of paediatric regulation in the European Union. European Journal of Clinical
Pharmacology, 67(3), pp.245–252.
143 Rose, K., 2014. European union pediatric legislation jeopardizes worldwide, timely future advances in the care of children
with cancer. Clinical Therapeutics, 36(2), pp.163–177. Available at: http://dx.doi.org/10.1016/j.clinthera.2014.01.009; Rose, K.
& Kopp, M.V., 2015. Pediatric investigation plans for specific immunotherapy: Questionable contributions to childhood health.
Pediatric Allergy and Immunology, 26(8), pp.695–701. Available at: http://doi.wiley.com/10.1111/pai.12500; Rose, K. &
Walson, P.D., 2015. The contributions of the European Medicines Agency and its pediatric committee to the fight against
childhood leukemia. Risk Management and Healthcare Policy, 8, pp.185–205.

98
questioned as there are differences of opinion among clinicians regarding the condition and
its diagnosis.144
Between 2007 to 2011, the PDCO made decisions about 682 PIPs; 29 PIPs were completed.
Of these, 24 led to new paediatric indications and 77 new formulations. 5 PIPs were
completed but did not support the drug’s use in children.145 Similarly, in the US, the BPCA
led to 200 labelling changes and 48 instances of new/enhanced paediatric safety information
following paediatric clinical trials.146
In terms of drugs for rare diseases i.e. orphan drugs, the Regulation did not result in
significantly more market authorisations for orphan drugs with a paediatric indication (58%
before and 64% after 2007), but did increase the time required to achieve market
authorisation.147
Another explicit goal of Paediatric Regulation is the reduction in off-label use of drugs. A
study from Denmark by Haslund-Krog et al showed that PIPs covered only a small
proportion of the drugs that were being used off-label.148 In Finland, the new legislation has a
minor or no impact on off-label use in paediatric inpatients in specialised care: 51% of off-
label prescriptions in 2011 vs. 22% in 2001, for new-borns; 21% vs. 5%, for less than two-
year-old children; and 24% vs. 3%, for children.149 These results show that the needs of
neonates and children are not yet being fully met by the Regulation. In fact, out of 682 PIPs
at the end of 2011, only 110 involved neonates (Turner et al. 2014).
In Europe, the Paediatric Regulation has also led to the creation of a European network of
Paediatric Research at the European Medicines Agency (Enpr-EMA). This consists of
national and European networks and centres for paediatric research. However, once the
initial support for these networks decreased, most networks have not been able to secure
sustainable income because enough trials have not been forthcoming or planned trials have
been deferred (Hoppu et al. 2012).
A study of the Utah Medicaid Program in the US estimated that a 6-month extension of
patent exclusivity cost $2.2m over 18 months following the original expiry date and if
extrapolated to the entire US population, the cost was estimated at $430.2m.150 Moreover,
144 Kuehn, B.M., 2012. Laws Boost Pediatric Clinical Trials, But Report Finds Room for Improvement. Jama, 307(16), p.1681.
Available at: http://jama.jamanetwork.com/article.aspx?doi=10.1001/jama.2012.508.
145 Turner, M.A. et al., 2014. Paediatric drug development: The impact of evolving regulations. Advanced Drug Delivery
Reviews, 73, pp.2–13. Available at: http://dx.doi.org/10.1016/j.addr.2014.02.003.
146 Mathis, L. & Rodriguez, W., 2009. Drug therapy in pediatrics: A developing field. Dermatologic Therapy, 22(3), pp.257–261.
147 Kreeftmeijer-Vegter, A.R. et al., 2014. The influence of the European paediatric regulation on marketing authorisation of
orphan drugs for children. Orphanet journal of rare diseases, 9(1), p.120.
148 Haslund-Krog, S. et al., 2014. The impact of legislation on drug substances used off-label in paediatric wards-a nationwide
study. European journal of clinical pharmacology, 70(4), pp.445–52. Available at:
http://www.ncbi.nlm.nih.gov/pubmed/24398969.
149 Lindell-Osuagwu, L. et al., 2014. Prescribing for off-label use and unauthorized medicines in three paediatric wards in
Finland, the status before and after the European Union Paediatric Regulation. Journal of Clinical Pharmacy and Therapeutics,
39(2), pp.144–153
150 Nelson, R.E. et al., 2011. Patent extension policy for paediatric indications: An evaluation of the impact within three drug
classes in a state medicaid programme. Applied Health Economics and Health Policy, 9(3), pp.171–181.

99
only a minority of these drugs were prescribed to paediatric patients. Furthermore, the
BPCA’s contribution was estimated to be 3.6m life years gained over the 1997-2009 period;
using $100,000 per life-year, this yields $360 billion gross economic benefits according to
Vernon et al. 2012 (for more discussion, see Appendix E.1.1).
While there have been more paediatric clinical trials (about 4 times more) over the last
decade,151 which have greatly contributed to knowledge regarding paediatric medicinal
products, certain areas of paediatric pharmacology are still under-explored, such as rare
conditions and neonates (see, Turner et al. 2014).
5.2 Results of the Delphi Survey
5.2.1 Development of clinical trials within the paediatric population
Figure 25 Delphi survey response to Question 1
Source: Technopolis survey. The number of respondents for each sub-question are: 108, 110 and 112.
For this first question, the survey revealed a broadly positive view overall of the EU Paediatric
Regulation’s effect on medicines development.
A majority of survey respondents stated that the Paediatric Regulation had led to a situation
where all European medicines in development consider clinical trials within the paediatric
population. 54% of respondents judged the EU Paediatric Regulation to have had a positive
or highly positive effect on companies’ behaviour already (2015) in respect to their
consideration of clinical trials within paediatric populations for all medicines under
151 Pansieri, C. et al., 2014. Neonatal drug trials: impact of EU and US paediatric regulations. Archives of Disease in Childhood -
Fetal and Neonatal Edition, 99(5), p.F438. Available at: http://fn.bmj.com/cgi/doi/10.1136/archdischild-2013-305900.
0%
10%
20%
30%
40%
50%
60%
Strongly positive Positive Neutral Negative Strongly negative
Please reflect on the following statement in your area of expertise: The EU Paediatric Regulation has led to a situation where
ALL European medicines in development consider clinical trials within the paediatric population...
Overall effect of the Regulation on this aspect
The situation at the end of 2015
The likely situation at the end of 2020

100
development in Europe. Around 15% of respondents recorded a negative view about this
statement, suggesting the regulation has yet to create a situation where all medicines in
development will consider paediatric clinical trials.
The survey found that a larger majority expect the regulation will have had an important and
positive effect on European medicines development by 2020. Over 70% of respondents
signalled a positive view of the likely situation at the end of 2020. Positive developments
referred to include the initiation of early consultation of clinicians by sponsors to better
consider patients’ needs and improvements in the data on dosing, safety, and efficacy in
children.
The swing in positive votes between 2015 and 2020 is largely driven by the switching of votes
from neutrals to positives. The proportion of sceptics was largely unchanged: around 14% of
survey respondents view the likely situation at the end of 2020 negatively as compared with
around 15% for 2015. Respondents provided additional comments in which they expressed
reservations about progress and notable concerns included the following:
Relatively small number of marketing authorisations of paediatric medicines, to date
Slow progress in certain therapeutic areas e.g. oncology, psychiatry as well as in
neonatology
Concerns over the PIP waivers granted
Scarce (EU) funding provision to sustain future paediatric medicine developments
Continued use of off-label medicines for children
Concerns over long delays in the process and deferrals

101
5.2.2 Increase in research, awareness and information
Figure 26 Delphi survey response to Question 2
Source: Technopolis survey. The number of respondents for each sub-question are: 107, 108, 105, and 106.
Survey respondents were asked to what extent they agree with four statements (see Figure
26).
69% of the respondents agree or strongly agree that the number of paediatric research
projects is increased. 16% of the respondents disagree or strongly disagree with this
statement, one of whom went on to write that there has not been enough progress, and to list
several studies in support of that position. One of the references included a study by Van Riet
et al. (2016)152 that analysed the availability of licenced paediatric drugs and the development
of new indications or new routes of administration for the paediatric population. This study
concludes that “further research in some areas of paediatric drug development is required in
order to ensure that paediatric drugs are age-appropriate and of the required standards, e.g.
safety of excipients, acceptability testing”.
65% of the respondents agree or strongly agree with the statement that more quality
information is available on approved medicines for their use in paediatric population (i.e.
product label and summary of product characteristics). 15% of the survey respondents
disagree with this statement.
152 Van Riet et al (2016). Paediatric Drug Development and Formulation Design a European Perspective. AAPS PharmSciTech
0%
10%
20%
30%
40%
50%
60%
70%
Strongly agree Agree Neutral Disagree Strongly disagree
Please indicate your agreement with the following statements, in your area of expertise:
The number of paediatric research projects (ie scientific research to understand paediatricphysiology/ pathology, excluding clinical trials) is increased
More high-quality information is available on approved medicines for their use in paediatricpopulation (ie. product label and summary of product characteristics)
The awareness of health professionals is increased on the need to better evaluate new and oldmedicines in the paediatric population (ie need to obtain relevant information about risk, benefit,safety, or efficacy)
The awareness and understanding of the general population is increased on the need to performpaediatric clinical research, leading to increased participation in paediatric clinical trials

102
87% agree that the awareness of health professionals has increased as regards the need to
better evaluate medicines in the paediatric population. A small minority, 7% of the
respondents, disagrees with this statement. A wider range of international paediatric
networks (e.g. TEDDY, PENTA, PRINTO) and research consortia have been established in
Europe, some with the support from the European Commission (EC) and following the
introduction of the Paediatric Regulation. GRiP (Global Research in Paediatrics) and
SMART (Small Medicines Advanced Research and Training) are developing training
programmes to increase the quality and the methodological level of paediatric clinical
research. As a result, public-private partnerships have been able to mobilise the scientific
and clinical community to devise clinical development plans that are acceptable to regulators
and conduct clinical studies.
There is no consensus as to whether the awareness of the general population has increased as
regards the need to perform more paediatric clinical research or the related need for
increased participation in paediatric clinical trials. 47% of respondents judged that the
awareness of the general population has increased, following the introduction of the
regulation. For example, one respondent noted that the regulation had made it easier to
explain the importance of allowing children to participate in clinical trials. A significant
minority (27%) of respondents disagreed. Several respondents went on to write that
awareness of these issues outside of the pharmaceutical industry remains poor. One
contributor wrote that more time is needed to see any substantive effect of the regulation on
the increased awareness among the general population, simply as a result of the long
development phase, deferrals, modifications to PIPs etc., (only a small proportion of
paediatric products have labelling changes as a result of the regulation). Several other
respondents argued that the impact on awareness would have been greater if more (EC)
support had been devoted to communications campaigns. Respondents referenced several
papers that explain the importance of communication, including an earlier study by the
RCPCH (2012) highlighting the practical challenge faced by those wishing to increase
volumes of paediatric research due to the general difficulties of engaging patients and other
members of the public in trials in part because of a limited appreciation of the importance of
such work.153
153 RCPCH (2012) Turning the Tide
http://www.rcpch.ac.uk/system/files/protected/page/Turning%20the%20Tide%20Full%20Report.pdf Research Capacity
Survey: http://www.rcpch.ac.uk/system/files/protected/page/Research survey report FINAL (wingsan).pdf Infants, Children’s
and Young People’s Child Health Research Charter: http://www.rcpch.ac.uk/improving-child-health/research-and-
surveillance/infants-children-and-young-people’s-research-charte

103
5.2.3 Changes in the evaluation, testing and approval of paediatric medicine
Figure 27 Delphi survey response to Question 3a
Source: Technopolis survey. The number of respondents is 67.
Question 3 invited respondents to estimate the effect of the regulation on the number of
medicines being tested through clinical trials in the paediatric population, and to indicate
extent of any such change, see Figure 27.
The overall results are encouraging, with 84% of respondents indicating that there had been a
measurable increase in the numbers of medicines tested within paediatric populations in the
period since the implementation of the regulation, with more than a third suggesting the
regulation had led to an increase of 20% or more. Respondents felt that without the
regulation, the paediatric studies, agreed as part of a PIP, would not have taken place.
16% of respondents reported no observable change. One respondent noted that a number of
waivers had been granted. Another respondent argued that while the European Clinical
Trials Database (EudraCT) shows there has been an increase in paediatric clinical trials, it
may not in whole be the result of the Paediatric Regulation as the increase mirrors a wider
trend of increasing numbers of adult and mixed clinical trials.
0%
5%
10%
15%
20%
25%
30%
35%
40%
Increased by 20%or more
Increased by 10-20%
Increased by about5-10%
No changeobserved
As a result of the introduction of the Paediatric Regulation the number of medicine evaluated and tested in the paediatric
population within clinical trials...

104
Figure 28 Delphi survey response to Question 3b
Source: Technopolis survey. The number of respondents is 63.
The survey asked people to indicate if, as a result of the introduction of the Paediatric
Regulation, the number of tested medicines available for approved use in children had
increased (Figure 28). The majority of survey respondents indicated that there was an
increase (67%) and 43% of respondents estimated that the increase was in the range 5-10%.
In addition, respondents flagged the fact that many PIPs are still ongoing, and some have
been deferred, and that more medicines would be approved in the near future. For example,
in oncology or psychopharmacology, a substantial proportion of the drugs that are used to
treat children are still used off-label and, in particular in this therapeutic area, there may not
be sufficient research/support for research154 A study by David C. Radley et al. (2006) found
that 73% of off-label use had little or no scientific support.155 A 2009 study by Alicia Bazzano
et al. found that 62% of U.S. paediatric visits from 2001-2004 included off-label prescribing,
with younger children at higher risk of receiving off-label prescriptions.156
154 See also the study of Persico et al. (2015). Unmet needs in paediatric psychopharmacology: Present scenario and future
perspectives. Eur Neuropsychopharmacol, 25(10): 1513-31.
155 David C. Radley; Stan N. Finkelstein; Randall S. Stafford (2006). Off-label Prescribing Among Office-Based Physicians.
Archives of Internal Medicine 166 (9): 1021–1026.
156 Alicia Bazzano MD MPH; Rita Mangione-Smith MD; Matthias Schonlau PhD; Marika Suttorp MS; Robert Brook MD ScD
(2009). Off-label prescribing to children in the United States outpatient setting. Ambulatory Pediatrics 9
0%
5%
10%
15%
20%
25%
30%
35%
40%
45%
Increased by 20% ormore
Increased by 10-20%
Increased by about5-10%
No change observed
As a result of the introduction of the Paediatric Regulation the number of tested medicine available for approved use in children
(ie. marketing authorisation obtained for paediatric use)...

105
Figure 29 Delphi survey response to Question 3c
Source: Technopolis survey. The number of respondents is 72.
On the question of prescription, a small majority of respondents, 58%, indicated that medical
practitioners are increasingly prescribing approved medicines according to their licensed
indication for children, as a result of the Paediatric Regulation.
The majority of respondents that reported an increase in prescriptions, estimated the scale of
that increase was in the range of 5-10%. Several contributors went on to provide written
comments noting the large volume of PIPs that are yet to achieve marketing authorisation
and the natural time lag that this creates, with only limited numbers of new or newly
indicated medicines available to be prescribed.
Survey respondents also noted that paediatric drug development had been swifter in some
therapeutic areas, e.g. antibiotics, and less swift in others, e.g. oncology and tuberculosis.
Respondents also noted that paediatric drug development for infants and neonates is
particularly slow (lagging); and that many medicines have not yet been tested and are
currently often used off-label.
0%
5%
10%
15%
20%
25%
30%
35%
40%
45%
Increased by 20%or more
Increased by 10-20%
Increased by about5-10%
No changeobserved
As a result of the introduction of the Paediatric Regulation the number of approved medicine that has been prescribed for children according to their licensed indication by medical
practicioners...

106
5.2.4 Change in research capacity, funding and collaboration
Figure 30 Delphi survey response to Question 4
Source: Technopolis survey. The number of respondents for each sub-question are: 92, 96 and 95.
In question 4, respondents were asked to indicate the extent to which they agreed with each
of three statements about paediatric research (see Figure 30): Increased paediatric research
capacity is available in the public and/or private sectors; Increased public and/or private
research funding is available for paediatric research; and More extensive and sustainable
research collaboration is available across private and public sector (i.e. leading to knowledge
sharing, co-investment, or product development partnerships).
The survey revealed a broadly positive view about improving research capacity (60% in
agreement) and research collaboration (65%), with a somewhat more neutral view expressed
about any improving trend in paediatric research funding in the period since the introduction
of the regulation. A substantial proportion of the respondents are neutral (neither agree not
disagree) and a slightly smaller proportion disagree/strongly disagree (18%, 28% and 18%)
with these statements.
Survey respondents provided several arguments that explain the lack of consensus around
the statements:
Capacity building: several respondents argued that developments had been very positive
and that, as a result of the regulation, institutions had been able to build bigger teams
working with clinical trials in children. However, other respondents wrote that the
0%
10%
20%
30%
40%
50%
60%
Strongly agree Agree Neutral Disagree Strongly disagree
Please indicate your agreement with the following statements in your area of expertise:
Increased paediatric research capacity (ie trained researchers) is available in the public and/orprivate sectors
Increased public and/or private funding is available for paediatric research
More extensive and sustainable research collaboration is available across private and publicsector (ie leading to knowledge sharing, co-investment, or product development partnerships)

107
expansion in research capacity had been patchy and looked very different across
therapeutic areas and institutions. It was argued that (in some cases) capacity building
was considered only after the regulation came into force and that as no specific funding
was available for infrastructure development, one inevitably saw rather uneven progress.
Research funding: one contributor argued that when the paediatric legislation came into
force, there was an increase in funding and paediatric research collaboration but that this
increase in funding had been interrupted and industry continues to focus on adult drug
development and less on paediatric drug development, where financial returns are less
interesting.157 Other contributors noted that there is substantial variation in the support
for paediatric drug development across national governments. Several others remarked
on the shortcomings of the Commission’s main research instruments, FP7 and Horizon
2020, stating that the funding instruments were poorly adapted to the needs of clinical
trials in children.
Collaboration: In some therapeutic areas the regulation is thought to have increased
multi-stakeholder dialogue and cooperation, e.g. on childhood cancer drug development
but in other therapeutic areas collaboration was reported to be poor still with no new
networks for collaboration having been established. Also, it was suggested that the
regulation had led to more industry-led research, while having had little or no effect on
the volume of collaborative research (public private) or investigator-led research (public,
academic).
The RCPCH (2012) Turning the Tide report find that only 5% of research funding is spent on child health research

108
5.2.5 Changes in the treatment of the paediatric population
Figure 31 Delphi survey response to Question 5
Source: Technopolis survey. The number of respondents for each sub-question are: 75, 76 and 85.
Survey respondents were asked to reflect on whether the introduction of the Paediatric
Regulation had led to an improvement in the treatment of the paediatric population on one
or more of three dimensions: i.e. less toxic medicines; more efficacious medicines; increases
in the numbers of children and young people treated with the right medicines at the right
time and with the right dosages, see Figure 31. Regarding the replacing of existing
treatments for a paediatric condition (either by treatment with less toxicity or enhanced
efficacy), close to half of the respondents stated that the regulation had led to an increase
(47%, 51%). While 68% stated that there had been an increase in the number of children
treated with the right medicine at the right time with the right dose. In all three cases, most
respondents opted for an increase of around 5%-10% in the numbers of ‘correct’ treatments.
Several respondents wrote stating they had difficulty in attributing changes in treatment to
the Paediatric Regulation alone, while others acknowledged that there had been some limited
progress, involving quite small steps so far as regards to efficacy and toxicity in general but
more progress around specific treatments such as anti-rheumatic, immunosuppressive drugs
and anti HIV drugs.
0%
10%
20%
30%
40%
50%
60%
Increased by 20% ormore
Increased by 10-20% Increased by about 5-10%
No change observed
Please provide an estimate of the change you have observed in the following aspects (in your area of expertise) as a result of the introduction of the
Paediatric Regulation
Existing treatment for a paediatric condition has been replaced by a new licensed treatmentwhich was shown to have less toxicity in clinical trials
Existing treatment for a paediatric condition has been replaced by a new licensed treatmentwhich was shown to have enhanced efficacy in clinical trials
The number of children treated with the right medicine at the right time with the right dose

109
Others noted that the regulation has begun to make a difference, however, the rather complex
and involved development process inevitably slows the rate of progress and arguably reduces
the absolute potential for change:
The need for certain drugs and for age-appropriateness of drug forms and formulations
still exist. To date, only a small percentage (24 out of 135, about 18% of the total for 2007-
2013 according to one survey respondent) of active substances included in the Priority
Lists of off-patent drugs issued are subject of an agreed paediatric development in a
PIP”158.
A very low number of PUMAs are granted, i.e. only 2.
Paediatric off-label use has not been reduced.159
5.2.6 Health and wellbeing of children and cost of care
Figure 32 Delphi survey response to Question 6
Source: Technopolis survey. The number of respondents for each sub-question are: 66, 70, 70, 62, and 69.
158 E.g. see http://www.ema.europa.eu/docs/en_GB/document_library/Other/2016/05/WC500206082.pdf for an updated list
of existing therapeutic needs in the paediatric population. See also van Riet-Nales, DA, et al, 2011
159 Lindell-Osuagwu et al 2014, Piñeiro Pérez et al 2014
0%
10%
20%
30%
40%
50%
60%
70%
80%
The number ofepisodes due to
adverse drugreactions (ie.
incidence of ADRs)
The number ofepisodes due tonew treatment of
children (ie. betterdosing, safety, and
efficacy)
Child morbidity andmortality due to
new treatment ofchildren
The number ofhospital bed daysper episode due to
adverse drugreactions
The cost of care forthe above conditionhas changed due
to new clinicalpractice
Please provide an estimate of the change you have observed in the following aspects (in your area of expertise) as a result of the introduction of the
Paediatric Regulation
Increase No significant change observed Reduction

110
Question 6 invited respondents to judge the effect of the regulation on several wider issues,
from child morbidity to the costs of care. These wider effects are difficult to identify and
measure in any definitive sense, and so we invited people simply to provide an indication of
the direction of any changes they had observed in their own area of expertise and which they
would feel confident in attributing to the introduction of the regulation.
Survey respondents were asked to indicate any observed change (as a result of the Paediatric
Regulation) on: adverse drug reactions (ADRs), the number of episodes, child morbidity, the
number of hospital bed days due to ADRs, and on the cost of care. As expected, people found
the five questions difficult to answer, however, around 60% of all respondents did provide
answers.
For each impact type, 40-70% of respondents indicated that they had observed no significant
change. While most people had not yet observed any meaningful changes, there was a
significant minority of respondents that judged the regulation to have had a positive impact
on these different dimensions (i.e. reduction in the value of these indicators).
Almost 40% of respondents indicated they had seen improvements in child morbidity in their
field, which they would attribute to the regulation. Around 30% of respondents had observed
improvements in other impact types, from the incidence of ADRs to the number of related
hospital bed days.
20% of the survey respondents find that the number of episodes due to new treatment of
children has increased160 and 35% of the survey respondents indicated that the cost of care
had increased due to new clinical practices / prescriptions. New products developed for
paediatric use can be relatively more expensive, e.g. there can be cost increases related to the
licencing of new medicines.
In addition to inviting respondents to indicate the broad direction of travel, the survey asked
people to estimate the degree of change they had observed, see Table 24. On child morbidity,
29% of the respondents judged morbidity had improved by 5-10%, 4% argued that it had
improved by 10-20% and 6% argued it had decreased by 20% or more. The cost of care was
the one dimension where a large minority (35%) indicated there had been a negative impact,
with the new treatments and treatment regimens leading to an increase in costs, possibly
leading to issues of accessibility.
160 Note that the authors of this paper have no clear understanding why this should be the case and whether respondents may
have misunderstood the question: The chart suggests that around 33% of respondents have seen a reduction in the number of
episodes as a result of the use of more efficacious paediatric drugs or more appropriate dosing regimens. The chart also suggests
that 20% of respondents have seen an increase in the numbers of episodes, as a result of better drugs / dosing. This last point
seems counter-intuitive.

111
Table 24 Survey response to Question 6, full results on health and wellbeing of children and cost of care
The number
of episodes
due to adverse
drug reactions
(i.e. incidence
of ADRs)
The number
of episodes
due
to new treatm
ent of
children (i.e.
better dosing,
safety, and
efficacy)
Child
morbidity and
mortality due
to new treatm
ent of children
The number
of hospital
bed days per
episode due
to adverse
drug reactions
The cost of
care for the
above
condition has
changed due
to new clinical
practice
Increased by 20% or more 0% 4% 0% 0% 16%
Increased by 10-20% 0% 0% 1% 0% 10%
Increased by about 5-10% 2% 16% 0% 0% 9%
No significant change 71% 46% 60% 71% 43%
Reduced by 5-10% 20% 26% 29% 16% 12%
Reduced by 10-20% 5% 9% 4% 13% 9%
Reduced by 20% or more 3% 0% 6% 0% 1%
Source: Technopolis survey. The number of respondents for each sub-question are: 66, 70, 70, 62, and 69.

112
5.2.7 Long-term benefits
Figure 33 Delphi survey response to Question 7
Source: Technopolis survey. The number of respondents for each sub-question are: 97, 97, 96 and 96.
Question 7 invited respondents to go one step further in considering wider socio-economic
impacts. In addition to estimating the impact of the Paediatric Regulation on Health and
wellbeing of children and the cost of care, respondents were asked to indicate if, in the long-
term, the regulation would have a measurable benefit on:
Children’s school attendance
Time cares need to take off work to care for children
Quality-adjusted life years for children
Mortality rates of children with life-threatening illnesses
As presented in Figure 33, the majority of respondents, i.e. 60%, 57%, 78%, and 69%
respectively, expect there will be measureable benefits. The remainder of respondents are
either unclear about the impact or judge there will be no measurable benefits (9%-14%).
Some of the respondents that answered negatively are of the opinion that there are no better
treatments on the market at this point in time, and for this reason there can be no
measurable improvements in these wider areas. Another respondent questioned the degree
to which long-term benefits attributable to the Regulation will be measurable, while arguing
that there will be desirable benefits of many kinds, in terms of more age-appropriate
0%
10%
20%
30%
40%
50%
60%
70%
80%
90%
An increase in children'sschool attendance
A reduction in the timecarers need to take offwork to care for their
children
An increase in quality-adjusted life years for
children
A reduction in mortalityof children with life-
threatening illnesses
Given your answers above, do you think that in the long-term there will be measurable benefits as a result of more effective treatment of children:
No Yes Unclear

113
formulations, the facilitation of easier, more precise dosing, and the availability of paediatric
dosing information.
Amongst those that were positive with regards to measuring longer-term benefits, several
noted that there have been benefits already in disease areas that will eventually have a
positive impact e.g. mortality. It was also noted that developments in the treatment of
neonates will take another 10-20 years to flow through to measurable impacts, and that such
developments are dependent on, amongst other, continued funding.
Various other benefits were mentioned, and these are listed below:
Benefits to patients and consumer groups
Greater awareness on paediatric needs and the importance of testing drugs in the
paediatric population
Greater awareness in the level of health literacy of the general population
Involvement of the paediatric population in early discussions on drug development
Increase in evidence based prescriptions / dosing information
Availability of more age-appropriate formulations
Social benefit in pursuing better medicine for children and access to licensed
medication
Opportunity for greater awareness about the costs of medical care
Early access to new treatments and medications via clinical trials which may also e.g.
lead to shortened disease profiles, shorter hospital / treatment periods, better health,
and a decrease of health care costs
Benefits to industry
Change of culture, more inclusive focus on developing new and improved medicine
for the paediatric population
Increase in competiveness within the European market producing benefits to
taxpayers and patients, e.g. the EU market is becoming more attractive for FDI
because the Paediatric Regulation offers a stable regulatory framework; opportunities
for commercial clinical trial investment and attracts research from outside the EU
Increase in jobs and growth as a result of the increased investment in R&D
5.3 Results from the survey to industry
The survey to industry asked to indicate the wider benefits of the Paediatric Regulation. In
response, one survey participants noted that, “despite modest achievements so far in terms of
rewards, the societal benefits from the Paediatric Regulation cannot be underestimated”.
Several survey respondents remarked that the regulation has provided access to new and
improved medicine. Some respondents referred to an improvement of the quality of care
provided to the patients and others referred to better health in children. Moreover,
respondents referred to the development of more age appropriate formulation as well as a
reduction in off-label use.

114
Several survey respondents find that the regulation generated new training, research
capacities and knowledge to industry, eg about PK/correct dosing, safety and efficacy of
medicines in children.
Several survey respondents find that the regulation generated new knowledge for
prescribers, and has led eg to basing paediatric dosing more on scientific studies, better
information on the importance of well tested / approved medications for children and the
importance of correct dosing. Other comments included the increase in documentation of
error rates in diluting for off label use and the increase in more updated product
information. One respondent finds that the regulation led to the development of
dissemination/communication strategies that have addressed laymen and the healthcare
professionals’ community as well.
Several respondents commented in the fact that the regulation has improved networks:
Increase in the involvement of researchers from academia or public research
institutions in paediatric drug development programmes
Integration of patients and families into the design and conduct of research and trials
increasing their awareness and competence
Setup of public-private collaborations sharing of ideas, business, opportunities and
innovation
Development of collaborations with clinicians enquiring other pharmaceutical and
clinical developments
Creation of new research networks
Some survey respondents remarked that the Paediatric Regulation evoked a change in
culture. One respondent reported a significant shift in mind-set within pharmaceutical
companies and noted that the regulation helped encourage paediatric development
become a more integral part of the overall development of medicines in Europe.
Another respondent remarked that the regulation put the paediatric issues at the core
of the European agenda and another remarked that it has become an integral part of the
overall development of medicines in Europe.

115
6 Cost-benefit assessment model
This chapter describes the development of a cost benefit assessment model of the Regulation
based on a systematic overview of all relevant impacts (both direct and indirect) of the
measure. The model is populated as far as possible with realistic data to arrive at an
exploratory analysis of the costs and benefits of the Regulation in the period between 2007-
2015.
Policy background and objectives
The Paediatric Regulation is based on the assumption that Paediatric Investigation Plans
(PIPs) will lead to a better understanding of the positive and negative impacts the use of a
given medicinal product may have on treating children with it. A core effect expected is that a
switch from off-label to on-label use will improve treatment by a better focused application of
the medicine to cases where its effect is most probable, and that adverse drug reactions will
be reduced. Pharmaceutical companies have argued that the extra cost resulting for health
systems from extending the supplementary protection certificate (SPC) by 6 months, and
thereby granting the marketing authorisation holder a 6-month bonus on its monopoly rent,
is more than justified by the additional benefits resulting from this for society, particularly
due to the many deaths of children avoided.161
Figure 34 illustrates the relation between the launch of new and improved medicine for
children and the positive effect on society from improved medicine. This relation is explored
in section 6.2, where the estimated benefits are presented, which may be derived from
adverse drug reactions (ADRs) avoided due to the improved information on how to apply
better medicinal products under analysis to children. These benefits are to be contrasted with
the cost to society resulting from the extra monopoly rent obtained by pharmaceutical
industry, wholesalers, pharmacies and in some countries by governments from extra value
added/sales tax levied.
The WHO defines an ADR as “a response to a drug which is noxious and unintended, and
which occurs at doses normally used in man.” Obviously, in a concrete instance, it is very
difficult to indeed prove that it was a particular drug, and not any other of the many
potentially intervening variables, that caused the harm to the patient. And quite often they
are confounded with adverse drug events (ADEs), defined as “any injury occurring at the time
a drug is used, whether or not it is identified as a cause of the injury.” Subsets of ADEs are
some types of medication errors (MEs), ADRs, and other “undesirable experience associated
with the use of a medical product in a patient.” Note that “associated” does not imply a causal
relationship as for ADRs. In the end, only data available from FDA and EMA remained as a
base to estimate the type and prevalence of ADEs. These data do not single out ADRs, i.e. the
percentage of adverse events having a causal relationship to the drug under investigation
remains unknown, but is in any case lower.
The incidence of an ADE relates to a specific child undergoing a therapeutic intervention with
the medicine in question. For this study, it is termed a treatment episode – a core concept for
161 Vernon, J. A., Shortenhaus, S. H., Mayer, M. H., Allen, A. J., & Golec, J. H. (2012). Measuring the patient health, societal and
economic benefits of US pediatric therapeutics legislation. Pediatric Drugs, 14(5), 283-294.

116
the benefit-cost analysis. Consequently, in order to approach the issue of ADEs, a first step in
our overall calculations to populate the Cost-Benefit Model was to arrive at a rough estimate
of the number of paediatric treatments resulting from the use of the medicinal product under
investigation during the 6-month extra SPC period. In line with this, all of the data reported
cover this 6-month period unless otherwise stated. It should be noted that no valid, reliable -
and therefore comparable - and representative data on ADRs are available. The CBA model
builds on limited data and assumptions.162
Figure 34 also explains that those PIPs that have already received a positive statement of
compliance, but not (yet) granted SPC extension, are expected to have a positive effect on
society resulting from the change in labelling/safer medicine (level 2 analysis). These benefits
are presented in section 6.3. Finally, it is thought that the R&D investment the
pharmaceutical industry undertakes in compliance with the Paediatric regulation has positive
spillover effects (level 1 analysis – highest level analysis). Section 6.4 elaborates on this
hypothesis.
Figure 34 Overview of the relation between costs and benefits of medicine for children and the Paediatric
Regulation
6.1 The cost-benefit analysis approach
A generic socio-economic cost benefit analysis (CBA) is a systematic overview, analysis and
summary of all impacts (both financial and non-financial) of a (policy) measure, which are
deemed relevant for decision making. The aim of a CBA is to determine whether a measure is
desirable, i.e. whether from the point of view of the respective decision making person or
body the expected benefits exceed those of the expected costs involved – be it at the level of a
private organisation, a public body, or society. In cases where alternative paths of action are
available, it will also help to identify the most advantageous alternative.
162 The context of such studies usually relates only to a certain setting like a single or a group of hospitals at the secondary or
tertiary level, the ambulatory setting of emergency rooms, community centres etc. in a certain town or region, often also
concerning only a given disease.

117
In the healthcare system, this can be done from different perspectives, taking into account
those costs and benefits that impact on a particular entity: the private perspective of a given
stakeholder, the patient’s perspective, the healthcare system perspective or the social welfare
perspective, in which also external costs and benefits are taken into account and transfers
(e.g. taxes) are left out. In all perspectives the CBA method calculates the net present value
(NPV) of current and future socio-economic cost and benefits of a specific intervention, a
project, or a policy and its implementation strategy and measures.
The CBA can be applied - in principle - to any context and policy decision situation, be it in
the public arena or a commercial context. It will depend on the decision-maker's perspective
which benefits and costs, measured in which fashion, and based on which assumptions,
expectations, extrapolations should enter into the overall "equation". It is this feature which
allows to test assumptions or expectations and their likely impact, and to choose from
alternative application scenarios and options which have the highest likelihood to achieve a
particular policy objective.
There are very little literature or grey reports available discussing the issue of the potential
socio-economic return on the extra monopoly rent reaped by pharmaceutical companies
holding a market authorisation for a medicine which was awarded an extra 6-month SPC
after successful execution of a PIP. These extra costs accrue to the healthcare system and to
each individual patient concerned – either directly or via contribution to healthcare related
taxes and health insurance payments. It is assumed that children which take the medicine in
question, and indirectly others, will considerably benefit from better treatment outcomes.
These benefits may relate to:
Improved paediatric care through added precision in the use of pharmacotherapy in
paediatric populations
Reduced ADRs and burden of paediatric diseases
Shorter periods of hospitalisation
In return, these benefits may contribute to lower consumption of medicinal products through
better targeting of treatment. However, it is also possible that these benefits will lead to an
increase in the consumption of medicinal products as a result of the potential improved
access to medicines. This means that more children could be treated with the right medicine.
Improved access to medicines may also imply marginally lower liability cost for health service
providers (resulting in lower insurance premiums).
The following graph summarises the main elements of the cost-benefit model:

118
Figure 35 Main elements of the cost-benefit model
As an example, we describe one of the main elements of the model, the benefits derived from
“avoided lost time by informal carers”. To estimate the (social) costs of informal care services
required for all more serious cases requiring hospitalisation, we assert that 90% of inpatient
cases also require informal care services. Based on the estimate for hospital days mentioned
above, it is assumed that in each such case, on average, 9 days are lost. As the monetary value
of the informal carer gross salary per year, we use the average value for Germany, which is
towards the higher end across the countries covered by the 8 medicines studied here. The
benefits are estimated as 20% saved from the cost of the total lost time by informal carers.
The other elements of the model are described in Appendix section E.3
6.2 Cost-benefit assessment of selected medicinal products
6.2.1 Types of medicinal products covered and related ADEs
This analysis represents a bottom-up approach, based on a detailed benefit model and cost
data (‘economic value’) calculated in Chapter 3, and covers eight medicinal products for
which sufficient data were available. Seven are for treating a chronic disease and one for an
acute disease. They cover a diverse spectrum of seven different diseases. Five of these are
used on-label for certain age groups of children, while for three drugs, although PIP studies
were negative, data indicate their continued use in children.
Of these eight products, five show low to marginal percentages of all episodes related to
paediatrics (0.09%; 0.21%; 0.33%; 0.83%; 1.48% - in absolute numbers: 323; 770; 1,017;

119
3,209; 4,351). Three have with 7.4%, 9.5% and 37.6% significant shares (absolute: 12,644;
206,986; 405,096).
Making use of FDA and EMA statistics and paediatric safety review reports for the products
included, the absolute numbers of ADEs (note: not ADRs, the numbers of which are lower)
for the eight drugs were estimated at 0.17, 0.25, 0.87, 1.27, 1.47, 2.00, 4.22, 34.30. The values
of serious paediatric ADE reports as percentage of all paediatric episodes, ranging from
0.0002% to 0.41%. Only for a single drug deaths of children were reported as ADEs. Relating
those data to a six-month period, an absolute number of 0.25 deaths due to an ADE was
estimated. Note that these figures are derived from mathematical computations and
therefore are not reported in integers.
In the literature, there is quite some discussion around sometimes significant underreporting
of ADRs, ADEs and medication errors. On the other hand, using ADE data leads to
overestimation of ADRs. Also, FDA safety reports use prescriptions per patient (sometimes
over 10 and more years) as a reference base, which also leads to overestimation of ADEs on a
treatment episode base in case the patient obtains more than one prescription during this
period. Furthermore, both EMA and FDA note some overreporting (double reports on the
same ADE), particularly on deaths, and some error in reporting. For the benefit calculations,
the ADE data is adjusted upwards by 100% (doubling) data for deaths, and 200% to 400% (3
to 5 times) for less serious events to account for likely underreporting.
6.2.2 Estimating monopoly rents
To estimate the true costs to national/regional (government) payers and statutory health
insurances, monopoly rents as calculated in Chapter 3 for the pharmaceutical industry need
to be increased by the extra revenue accruing to other beneficiaries like wholesalers,
pharmacies as well governments (wherever VAT or sales tax is levied on medicinal products).
In Germany, e.g., this additional monopoly rent amounts to 32% of industry monopoly rent.
Because in some countries no wholesalers may be involved or no sales tax is levied on
prescription medicinal products, it is assumed that, on average across the EU, the monopoly
rent to industry accounts for 87.5% of overall rent, and only 12.5% accrue to other
beneficiaries. This renders an extra cost to society estimate of €590m.
In order to arrive at the cost to health system payers (national or regional health services
respectively statutory health insurances) this sum needs to be reduced by the (co-)payments
charged to patients, respectively their parents. These vary widely across EU member states.
We introduced the simple assumption that for each (adult and paediatric) treatment episode
the Third-Party Payer receives a lump sum of €5. For the eight medicines overall net extra
cost for the 6-month extension is then estimated at €551m to health systems, or more than
half a billion Euros. The co-payments by patients of €38.5m are not accounted for as extra
costs, because we assume that they may have taken anyhow these or other medicines for
which similar co-payments would have to be paid.
This does not hold for one medicinal product. Due to the low price per treatment episode, the
full cost of the monopoly rent is allocated solely to patients.

120
6.2.3 Benefits derived from cash savings due to ADRs avoided
To estimate potential benefits to health systems from cash savings from avoidable ADRs we
assumed that they might be reduced by 20% based on estimates in the literature. They will
result from hospital stay and outpatient encounters (emergency room visits and ambulatory
services) avoided. For the six-month period, the cumulative estimate across all drugs is for
avoidable hospitalisation costs €32,000 and outpatient treatment € 5,000, or overall €
37,000 (over a range of €97 to €31,000 per drug). For 10 years, this sums up to € 741,000.
Compared to the overall monopoly rent estimated at more than half a billion Euros, these
savings are marginal, leading to benefit-cost ratios of almost zero or a negative return of 99%.
Even increasing the estimate for the number of ADEs by another ten times would not lead to
any significant results for this item.
6.2.4 Intangible benefits due to ADRs avoided
In a further step, various non-cash or intangible benefits were estimated. They concern
benefits expected from improved actual treatment of children, which result in reduced
mortality, improved quality of life (QoL) experiences due to long-term disabilities, and time
saved by informal carers. Furthermore, in order to account for further benefits not accounted
anywhere else, we add a hypothetical benefit of €10 per each treatment episode.
For four medicinal products with very few paediatric treatment episodes compared to all
treatment episodes the benefits estimated are considerably higher than for the cash benefits,
but still marginal, with less than €100,000 for the 6-month period, and less than €2,000,000
for 10 years. Also the 6-month and 10-year benefit-cost ratios are marginal to negligible.
On the other hand, for the product with the largest share of paediatric treatment episodes the
estimated value is very different. We arrived at estimated overall intangible benefits of almost
€5m for 6 months, or €100m for ten years. For ten years, we obtained a benefit/cost ratio of
1.5, or a positive rate of return of 50%. For one of the products – the medicine for acute
treatment where extra costs accrue only to patients due to higher co-payments, but not to
healthcare systems – 10-year intangible benefits are estimated at €80m, leading to a societal
benefit/cost ratio of above 5 or a rate of return of more than 400% for this medicinal product.
Overall, the greatest benefits are derived from two rather generic and very rough estimates
concerning “avoidable reduced quality of life” and a catch-all “additional benefit per
paediatric episode” set at €10. The latter term is used as an estimate of a generic benefit for
all due to better treatment options (valued at €5); and in addition, to also account for any
other significant ADEs (the number of which is unknown) we apply another €5 per episode.
These items are not discussed in the literature, but introduced here to account for any other
events and benefits not covered by the earlier items.
Intangible benefits for avoidable reduced quality of life are estimated at €2,840,000 across
all medicines (range: €6,120 to €2,470,000); for the ten-year period, the estimate is
€56,800,000. This value is directly related to the number of paediatric episodes and the
estimated number of serious adverse events, where the Asthma medicine far outstrips all
others. Even higher intangible benefits are estimated for the catch-all additional benefit per
paediatric episode of €10. Of course, they are directly related to the absolute number of
episodes and the percentage of episodes related to paediatrics. Here two drugs are
particularly notable: the Asthma medicine with €2,070,000 and the Migraine one with

121
€4,050,000 for 6 months (the range for other medicines is comparably low: €3,200 to
€126,500). The sum across all medicines is €6,340,000 for 6 months and €126,800,000 for
10 years.
Considering the other intangible benefit estimates cumulated across all drugs, deaths avoided
do not contribute to a significant extent to the benefits estimated (€360,000 for 6 months or
€7,200,000 for 10 years; only one product is involved); this is due to the low number of
reports on death events. For intangible costs to informal carers, the total value across all
medicines is €9,400 (with individual values ranging from €22 to €8,000) and €188,000 for
ten years.
6.2.5 Overall benefit-cost ratio estimate for the eight medicinal products
There are two products (Drug A and Drug B) among the eight medicinal products studied
here with strongly favourable benefit-cost ratio when calculated over a 10-year period,
basically due to non-cash benefits. Drug A is an Asthma pill and provides €32m net benefit,
while Drug B, a migraine pill provides €66m net benefit. All other medicinal products have a
negative benefit-cost ratio over 10 years. Aggregating cash and non-cash benefits data for all
eight medicinal products, overall benefits of €199m for 10 years are estimated. Overall cash
cost to society (patients, health systems) from total monopoly rent to all stakeholders
(pharmaceutical industry, wholesalers, pharmacies, governments from value added/sales
tax) are estimated at €590m. The overall socio-economic benefit-cost ratio across all
medicines is 0.34, the societal overall rate of return minus 66%. A detailed calculation is
available in Appendix E.

122
Table 25 Overview of detailed data estimated and calculated for the benefit-cost estimates per medicinal product
Drug
identification
letter
Notes Drug E Drug H Drug F Drug A Drug C Drug B Drug G Drug I Sums /
Average
Indication /
diagnosis;
pharmaceutical
dose form;
intake time
interval
xxxxxxxxxx x xxxxxxxxx
xxxxxxxxxx
xxxxxxxxxxx
xxxxxxxx
xxxxxxxxxx
xxxxxxxxxx xxxxxxxxxx xxxxxxxxxxx
xxxxxxxxxxxl
xxxxxx xxxxx
xxxxxxl xxxxxxxxxxx
xxxxxxxxxxx xxxxxxxxx
xxxxxxxxx
Paediatric
application No paediatric
dosage
recommendations
found (intended:
xxxxxxxxxxxt )
No paediatric
dosage
recommendations
found
For children 6
years or older,
the
recommended
dose is 0.7
mg/kg orally
once a day.
• 6-14 years
of age: one
5-mg
chewable
tablet
• 2-5 years
of age: one
4-mg
chewable
tablet or one
sachet of 4-
mg oral
granules
• 12-33
months of
age: one
sachet of 4-
mg oral
granules
patients 15
days or older
is 150
mg/m2
orally once a
day for 14
days
followed by a
maintenance
dose of 150
mg/m2
orally twice a
day
• 6 years or
older and
weight less
than 40kg:
initial dose
of 5 mg
orally once
• 6 years or
older and
weight 40kg
or greater:
initial dose
of 10 mg
orally once
For
children, no
more than1
dose in any
24-hour
period
should be
given.
For children
from 6 to 16
years, an
initial dose of
1.3 mg/kg
once a day,
followed by a
maintenance
dose of up to
2.7 mg/kg
(up to 160
mg) once a
day titrated
according to
patient
response.
The safety
and efficacy
in children
and
adolescents
below 18
years of age
have not
been
established
(intended:
xxxxxxxxxx
xxxxxxxxx)
No. of
countries
covered
EU-11 EU-11 EU-10 EU-8 EU-9 EU-9 EU-11 EU 4
Avoidable Assumption is that a
child that avoids
-€ -€ -€ 360,521 € -€ -€ -€ -€ 360,521 €

123
mortalities (I) death will live on
average another 72
years in "normal"
healthy.
Avoidable
hospitalisation
cost (II)
75 € 117 € 685 € 27,231 € 1,966 € 404 € 932 € 592 € 32,003 €
Avoidable
outpatient
treatment (III)
22 € 31 € 184 € 3,768 € 529 € 109 € 251 € 159 € 5,053 €
Avoidable lost
time by
informal carers
(IV)
22 € 34 € 201 € 7,986 € 577 € 118 € 273 € 174 € 9,385 €
Avoidable
reduced quality
of life (V)
12,240 € 18,000 € 105,840 € 2,469,319
€
303,602 € 62,402 € 144,000 € 91,440 € 3,206,844 €
Sum of
additional
benefits per
paediatric
episode (VI)
32,089 € 7,697 € 43,509 € 2,069,862
€
10,173 € 4,050,960
€
126,440 € 3,226 € 6,343,957 €
Total benefits
paediatrics (I +
II + III + IV + V
+ VI)
44,448 € 25,880 € 150,420 € 4,938,687
€
316,847 € 4,113,994
€
271,897 € 95,591 € 9,957,764 €
Cash cost -
industry
monopoly rent
- of SPC
extension
wholesale based
industry revenue
146,496,778 € 31,183,348 € 105,217,160 € 58,121,640
€
9,355,013 € 14,105,120
€
113,220,733
€
39,548,178 € 517,247,970
€

124
Cost - other
stakeholders'
monopoly rent
- of SPC
extension
revenue accruing to
wholesalers,
pharmacies,
government(s) (VAT
tax) - at an average
14% on industry
revenue
20,509,549 € 4,365,669 € 14,730,402 € 8,137,030 € 1,309,702 € 1,974,717 € 15,850,903 € 5,536,745 € 72,414,716 €
Total monopoly
rent
167,006,327 € 35,549,017 € 119,947,562 € 66,258,670
€
10,664,715 € 16,079,837
€
129,071,636
€
45,084,923 € 589,662,686
€
minus revenue
from co-
payments of
patients
Assumption of € 5
per episode, varies
greatly across
countries
7,529,141 € 1,171,257 € 1,469,912 € 2,753,208
€
53,440 € 16,079,837
€
7,616,872 € 1,832,860 € 38,506,528
€
Net cash cost to
healthcare
system
(statutory
insurances or
NHS)
159,477,186 € 34,377,760 € 118,477,650
€
63,505,461
€
10,611,275
€
-€ 121,454,764
€
43,252,063
€
551,156,158
€
Cash benefits
(avoidable
hospital, out-
patient
[ambulatory]
costs) (II + III)
97 € 148 € 870 € 31,000 € 2,495 € 513 € 1,183 € 751 € 37,056 €
Non-cash
(intangible)
benefits
(avoidable
mortality,
reduced QoL,
informal carers
costs + add.
benefits per
episode) (I + IV
+ V + VI)
44,351 € 25,732 € 149,550 € 4,907,688 € 314,352 € 4,113,481 € 270,714 € 94,839 € 9,920,707 €

125

126
6.3 Estimation of cost and benefits medicinal products with compliant PIPs
6.3.1 Introduction
The Paediatric Regulation was a first, most important step (“milestone”) to improve the on-
label prescribing of medicines for children. However as noted also in other studies, so far
only a small start was achieved. As most results from PIPs and other measures are still to
come, “however only the children and adolescents of tomorrow” will fully profit.163 Our
estimates attempt to cover this perspective for tomorrow by aggregating estimated benefits
over a period of ten years.
Furthermore, planning and executing PIPs and other measures, improving labelling and
generating more knowledge on the treatment of children are only “one half of the solution”.
As long as the second half of the solution is not assured, as long as the new knowledge is not
translated into adjusted paediatric prescriptions and clinical practice for better healthcare for
children, the overall impact will remain small. Knowledge as such may have intellectual,
intangible value in satisfying our curiosity, but as long as it is not diffused and applied in
paediatric healthcare provision, it does not generate tangible social or economic value. A
basic estimate of such potential benefits is estimated. This estimate remains speculative.
Basis of the following data and ‘level 2’ calculations of benefits and costs is a list of 119 PIPs164
which passed the compliance check and were approved by EMA as compliant with the
requirements for acceptance. From these, the eight medicinal products covered earlier
already obtained the extra 6-month SPC extension and are excluded from the following
calculations. This leaves us with 111 PIPs relating to medicinal products. Of these, 21 still
qualify for such an extension.165 The remaining 90 PIPs do not qualify or we do not know
their status. 3 of these were excluded due to probable double counting because they relate to
the same active ingredient (INN), which leaves us with 87 PIPs for consideration.
6.3.2 Characteristics of drugs covered by PIPs
From a comprehensive German study166, it is known that the relative distribution of
paediatric prescriptions for the top five therapeutic areas (overall about 35.2 m prescriptions
for 2011) in Germany is about as follows:
Pulmonary/ENT diseases: 60%
Infectious diseases: 22%
Central nervous system incl. pain: 17%
Cardiological/heart diseases: 1%
Oncology: 0.1%
163 Afentaki, A. (2014). Arzneimittel für Kinder und „Off-Label-Use“ 5 Jahre nach Inkrafttreten der EU-Verordnung (EG) Nr.
1901/2006. Bundesgesundheitsblatt-Gesundheitsforschung-Gesundheitsschutz, 57(9), p. 1118
164 Source: EMA. 10-year report on PIPs
165 This number attempts to exclude double-counting of PIPs for the same drug where we had information on identical active
ingredients (INN).
166 Afentaki, A. op. cit.

127
Classifying the 108 (87 + 21) PIPs according to these areas plus the categories vaccines and
others, we obtain the following results:
Pulmonary/ENT diseases: 7
Infectious diseases: 15
Central nervous system incl. pain: 4
Cardiological/heart diseases: 6
Oncology: 7
Vaccines: 13
Others: 56
“Others” include therapeutic areas like Dermatology, Diagnostics, Endocrinology-
Gynaecology-Fertility-Metabolism, Gastroenterology-Hepatology, Haematology-
Hemostaseology, Immunology-Rheumatology-Transplantation, Neonatology-Paediatric
Intensive Care, Nutrition, Ophthalmology, Psychiatry, and Uro-Nephrology.
With respect to the type of disease, these can be classified as follows:
19 acute
9 acute/chronic
60 chronic (incl. cancer)
13 vaccines
7 unknown
Reliable prices for these drugs are difficult to establish. Table 26 presents the ranges
estimated based on intensive web searches. Mutatis mutandis, it seems that the overall
distribution of these PIPs reflects to a great extent the distribution of the eight medicines
analysed earlier across these categories.
Table 26 Price range of medicinal products
Price range No. of medicinal products
0.01 – 1.00 € 8
1.01 – 5.00€ 15
5.01 -10.00 € 9
10.01 € - 50.00 € 20
> 50.00 € 26
Unknown 30

128
6.3.3 Estimating future benefits and costs
Except for the benefits and costs estimated in the previous section, we do not have any
reliable or meaningful estimates at hand. As a very first and speculative estimate, we apply
the following logic for estimating benefits.
The earlier results have shown that cash benefits are in all probability marginal to negligible,
so they are not considered. It should be remembered that the most relevant intangible
generic benefit for all paediatric patients due to better treatment options was set at €5, and
that in addition, to also account for "significant" ADEs (the number of which is unknown), we
applied another €5 per episode. Therefore, here we only estimate intangible benefits of a
generic kind; but we increase the value per paediatric episode from €10 as used in our earlier
estimates to a mean value of €15 to also cover in a cursory manner all other intangible
benefits as well.
Due to the severity of oncology incidents with children, we double the estimated benefit per
episode to €30. On the other hand, for vaccines we reduce it to €10 to reflect their overall
safety and relatively low ADR incidence rate.
The estimates of the paediatric episodes per drug are derived from the estimates per drug for
the eight drugs analysed earlier – taking into account the therapeutic indication, plus setting
them into some proportion to the overall relevance of the therapeutic area as indicated by the
prescribing figures above for Germany. This then allows us to estimate the values presented
in the table below.
Table 27 Estimated benefits by therapeutic area
Therapeutic area No. of PIPs
in this area
Estimated paediatric
episodes per drug for
10 years
Generic overall
intangible benefits
in € per episode
Sum of all intangible
benefits in €
Pulmonary/ENT diseases 7 1,500,000 15 € 157,500,000
Infectious diseases 15 500,000 15 € 112,500,000
Central nervous system
incl. pain
4 400,000 15 € 24,000,000
Cardiological/heart
diseases
6 50,000 15 € 4,500,000
Oncology 7 5,000 30 € 1,050,000
Vaccines 13 5,000,000 10 € 650,000,000
Others 56 20,000 15 € 16,800,000

129
Therapeutic area No. of PIPs
in this area
Estimated paediatric
episodes per drug for
10 years
Generic overall
intangible benefits
in € per episode
Sum of all intangible
benefits in €
Sum € 968,350,000
6.3.4 Estimating costs to health system payers
Estimating overall cash costs to health system payers is similarly difficult and speculative. It
is assumed that of the above PIPs only 21 may be granted an additional 6-month SPC. These
cover the following therapeutic fields:
Pulmonary/ENT diseases: 2
Infectious diseases: 5
Cardiological/heart diseases: 4
Oncology: 1
Vaccines: 1
Others: 8
Making use of our earlier estimates for the 8 drugs analysed in the preceding section, we set
the extra costs resulting from the 6-month monopoly rent of the marketing authorisation
holders at a value of about €50m for the first three therapeutic fields covered by 11 PIPs, and
at €20m for the other 10. Then we arrive at an overall estimate of 11 x €50m plus 10 x €20m
equal to €750m in monopoly costs.
6.3.5 Summary of results
Comparing these projected first estimates for the 108 extra PIPs, one may contrast the
estimated overall intangible benefits of €970m with the estimated extra monopoly costs of
€750m. This would lead to a socio-economic benefit-cost ratio of about 1.30 for the 10-year
period, or a rate of return of 30% for these additional PIPs.
Adding this “surplus” of €220m to the cash and intangible benefits reported in the previous
section, our benefit estimate arrives at roughly €500m. This does not fully cover the
estimated monopoly cash cost to health systems estimated there at €590m, but improves the
overall balance considerably.
6.4 Estimation of R&D spillovers resulting from the PIPs
Finally, we attempt to estimate the broader socio-economic benefits results from the private
sector investment into paediatric R&D (level 1 analysis). The estimation of R&D spillovers is
separate from the estimation of the health benefits achieved in relation to new and improved
medicine. The positive spillover effects constitute of additional jobs, growth and innovative
activity across (EU and non-EU) sectors that would not have happened if it were not for the
R&D investment made in relation to the Paediatric Regulation. The investment in R&D,
although a cost imposed to the pharmaceutical industry, can also be viewed as an R&D
investment towards new and improved medicine that triggers further investment and growth.

130
This section presents a preliminary analysis of the so-called social rate of return from R&D
investment which is equal to the sum of the following:
Private rate of return to the organisation
The return to the pharma sector, including to generic companies
The return to other sectors in the economy
Several studies have estimated rates of return from investment in R&D although the
literature in the field of pharmaceutical R&D development is scarce. Annual reporting by
GSK (2013, pp. 4 and 2015, p. 4)167 notes that the estimated internal rate of return of R&D
investments is 13% and, in 2013, long-term targets are set at 14%. An earlier study by Garau
and Sussex (2007) also refers to a 14% private rate of return168. We will use 14% to estimate
the private rate of return following € 2,026m investment in R&D (excluding administrative
costs, see Chapter 2) in relation to PIPs, see Table 28.
We have not identified estimates of intra-industry and across industry rates of return in the
literature specifically related to R&D investment in the pharmaceutical industry. One
literature review (Health Economics Research Group and RAND, 2008) summarises the
rates of return from different types of R&D investment in different sectors and also provides
estimates for the rate of return from UK investment in medical research169. The study finds
that most literature estimates that the total social rate of return from private investment is
around 50%, eg 51% as used in Garau and Sussex (2007). Moreover, the study summarises
that the total social rate of return from public investment is at least 20% and could be as high
as 67%, with a more conservative best estimate of 30%. Because the R&D spent in relation to
the Paediatric Regulation is an imposed investment rather than a strategic company decision,
the 30% rate of social return feels more appropriate than the higher rate of return that is
associated with private R&D investment. We assume that the intra-industry and across
industry rate of return is equal to the difference between the total social rate of return and the
private rate of return and amounts to 16%170.
It should be noted that in the case of spillovers from private investment in R&D, the
literature refers to three types of spillovers: improving the productivity of other firms’ R&D,
encouraging entry of potential competitors, and a reduction of production costs171. In the case
of the Paediatric Regulation not all three spillovers may be equally present and the spillover
effect might be different in relation investment in paediatric-only trials. Overall, knowledge
spillovers are likely to contribute to additional growth and investment.
167 http://www.gsk.com/media/325156/annual-report-2013.pdf and http://www.gsk.com/media/1017500/annual-report-2015.pdf 168 Garau M, Sussex J. Estimating Pharmaceutical Companies’ Value to the National Economy. Case study of the British Pharma
Group. London: office of Health Economics; 2007.
169 Frontier Economics (2014). Rates of return to investment in science and innovation, A report prepared for the Department
for Business, Innovation and Skills (BIS)
170 Because of the method of calculating the intra-industry and across industry rate of return and because we have not
‘discounted’ the 14% rate of return, the private rate of return may also be overestimated and the intra-industry and across
industry rate of return may be overstated. 171 Health Economics Research Group, Office of Health Economics, RAND Europe. Medical Research: What’s it worth?
Estimating the economic benefits from medical research in the UK. London: UK Evaluation Forum; 2008

131
Following the study by the Health Economics Research Group and RAND, the above
presented rate of return implies that the R&D investment “implies that for an extra €1
invested in cardiovascular research this year, the UK’s GDP will be €0.30 higher next year
and every year thereafter, than it otherwise would have been” (pp. 40). Based on this
estimate, if all of the €2,103m industry spent in relation to the Paediatric Regulation were to
yield a 30% social rate of return, that would be equivalent to €608m of GDP every year
thereafter.
This degree of perpetuity may be overstated in the case of the Paediatric Regulation and we
expect that, in practice, the spillover effect follows a decay curve with an innovation and
restructuring phase, following by the diffusion and increase in demand (generics entering the
market), and sometime thereafter, a point in time where R&D investment and innovation
becomes obsolete. According to a study by Zagame et al (2012), the cumulative effect of an
R&D investment can take up to 15 years to accrue but can be preceded by negative rate of
return. Following the study, investment benefits from approximately a 10-year period of
growth.
For simplicity we assume a linear rate of return with, on average, a total social rate of return
of 30% (this is unlikely to be the case and the biggest returns will be experienced in the
earlier years) and a maximum cumulative return on investment 10 years after the initial R&D
investment. Based on a 30% total social rate of return the total return on investment to
society after 10 years amounts to €6,078m and the intra-industry and across industry rate of
return after 10 years amounts to €3,242m (see Table 28).
Considering the 10-year period, both the private and intra-industry and across industry rates
of return are larger than the initial investment suggesting a healthy return.
The economic value of the SPC extension was estimated (extrapolated based on actual data)
for 12 products that accrued economic value until 2015 for relevant EU member states to
amount to €742k. The estimated social return is significantly higher than this economic value
of the SPC extension (excluding cost to society in relation to other products and countries, as
well as the dead weight loss in relation to the SPC). Despite the crude methodology used to
estimate the effect of spillovers and the challenge to gross up the value of the direct loss to
society as a result of the Paediatric Regulation (ie the reward to industry), it suggests that the
benefits of the Regulation outweigh the costs.
Table 28 Estimated rate of return to society of the Paediatric Regulation, in € millions
Estimated rate of return
from € 2,026 investment in
R&D
Private rate
of return
Intra-industry and across
industry rate of return Total social return
From private
investment
From public
investment
(preferred
estimate)
From private
investment
From public
investment
(preferred
estimate)
14% 37% 16% 51% 30%

132
Estimated rate of return
from € 2,026 investment in
R&D
Private rate
of return
Intra-industry and across
industry rate of return Total social return
From private
investment
From public
investment
(preferred
estimate)
From private
investment
From public
investment
(preferred
estimate)
After 1 year € 284 € 750 € 324 € 1,033 € 608
After 2 years € 567 € 1,499 € 648 € 2,067 € 1,216
After 5 years € 1,418 € 3,748 € 1,621 € 5,166 € 3,039
After 10 years € 2,836 € 7,496 € 3,242 € 10,333 € 6,078
Estimated total R&D costs of PIPs for the industry per year (2008-2015) was estimated at €2,026m, excluding
administrative costs, see Chapter 2.

133
7 Summary and conclusions
The current study is aimed at providing a review of the economic impacts of the Regulation
since it entered into force. This study thus covers the following dimensions:
Analysis of the regulatory costs to the pharmaceutical industry for meeting the legal
obligations
Analysis of the economic value of the rewards/ incentives to the pharmaceutical
industry
Overall assessment of the rewards/ incentives to the pharmaceutical industry
Analysis of the direct and indirect social and economic benefits
Exploratory high-level cost-benefit assessment providing estimates of the broad
economic impacts
The regulatory costs analysis aimed to capture and assess all the costs incurred by the
sponsors of paediatric clinical trials within the scope of Paediatric Investigation Plans (PIPs).
Cost estimates were based on a consultation of PIP and waiver applicants by means of a
survey questionnaire and follow-up interviews. The total cost of the Paediatric Regulation
incurred to industry is estimated to be €2,106m per year or €16,848m for the years 2008-
2015. The annual cost estimate includes €2,103m PIP-related compliance costs and €3.6m
costs for waiver applications. On average, the estimated costs made in relation to in-vitro
studies and animal studies and the development of a paediatric formulation are relatively
lower than the costs of Phase II and Phase III paediatric clinical trials, and some of the other
R&D costs incurred in relation to the PIP, such as pharmacokinetics and pharmacodynamics
studies. The variation in cost is also dependent on the number of modifications to the PIP,
the number of clinical studies, the number of paediatric subjects, the duration of the PIP, and
therapeutic area.
The analysis of the economic value of the rewards and incentives provided under the
Paediatric Regulation - in relation to the six-month SPC extension (article 36), the Orphan
reward (article 37) and the PUMA reward (article 38) - is based on a methodological
framework that considers the additional period of protection (from competition with generic
medicines) that is awarded to originator companies. Moreover, because the introduction of
generic medicines is delayed, society does not benefit from increased competition and lower
prices for the duration of the exclusivity extension and this effect is also accounted for in the
framework.
The analysis on SPC extensions covers 8 medicinal products which received SPC extensions
in the period between 2007-2012 and lost their exclusivity before the third quarter of 2014.
The analysis, based on available data from IMS Health, shows that there are significant
differences between products and countries. The data analysis shows that the price drop of
branded products often starts in the first quarter after the loss of exclusivity, this price drop
is often limited in scale (up to 10-20%). During the first and second year after the loss of
exclusivity, the branded prices decrease further, and there are significant differences between
products and countries. In stabilised market situations, the economic value as a percentage of
6-month revenue varies between 11% and 94%. The combined economic value (or monopoly

134
rent) of the 8 products is calculated to amount to €517m. The economic value was then
extrapolated in order to assess the magnitude of the ‘full’ economic value of the reward up to
December 2015. This includes an extrapolation of the economic value of the products studied
in detail to countries where SPC extension was granted but our datasets did not include those
geographies. In addition, the economic value of a further four products (with SPC extension
ending within the research period) was estimated based on the average economic value per
capita. The extrapolated economic value thus amounts to €926m between 2007-2015.
There are four products with Orphan reward to date that may be studied but since these are
still under protection it was not possible to estimate the economic value of the reward.
Projection of currently available data towards the loss of exclusivity in the future is
unreliable. However, the approach to estimate the economic value of Orphan rewards could,
in principle, be similar to the model used for the SPC extension, with the main difference
being the delay of two years rather than 6 months.
There are only two PUMAs that were authorised up to December 2015. Given the limitations
of the available data, it is not possible to project the economic value of these PUMA rewards.
There is however a fundamental difference with respect to estimating the SPC reward:
market exclusivity period for a product starts at the moment the PUMA reward is granted
instead of after a delay as for the SPC-extension. This implies that the ‘economic value’ covers
the ‘monopoly benefits’ a product receives from additional data exclusivity (8 years) and
market protection (2 years). A model was developed that could be applied in future studies.
An assessment of the rewards to industry is based on five specific evaluation criteria:
relevance, effectiveness, efficiency, coherence, and utility/potential for improvement. We
collected data through a survey to pharmaceutical companies, which was complemented with
interviews and desk research. The objectives of the reward scheme are deemed highly
relevant when considering that the rewards provide a way for organisations to sponsor and
support the development of paediatric medicines. Nevertheless, the rewards themselves
cannot guarantee capital allocation decisions that maximise value for companies or result in
positive return on investment in individual R&D programmes.
The Regulation and hence the combination of obligations and rewards is seen as effective to
shift focus to paediatric medicine development. As a result, the amount and quality of
research and information available for the paediatric population has already increased. Over
the period between 2007-2015, the share of paediatric trials among all clinical trials
increased 2.5-fold and over 100 PIPs were completed. Paediatric clinical research networks
have been set up involving academia and industry. Industry also changed their approach to
medicine development and now design their research and development plans incorporating
the paediatric population. The Regulation is considered as a commendable first step in the
right direction but there remain therapeutic areas where significant unmet need continues to
exist, such as in the field of paediatric oncology, and hence further steps and more time is
needed to achieve the expected impact. It is claimed that therapeutic areas covered by
research in children is driven mainly by commercial interest and reflecting the needs of the
adults rather than those of children.
It is noted that the effectiveness of the rewards is higher for high-volume products and lower
for indications with very limited patient numbers. Factors influencing effectiveness include
uncertainty (and discontinuity) in early product development, difficulty in recruitment of

135
paediatric subjects, compliance check procedures, and the time-limited nature and
complexity of obtaining the reward across member states once the clinical research is
completed.
The extent to which rewards were taken up by companies indicate that the 6-month SPC
extension is the main tool to incentivise and reward paediatric medicine development. The
effectiveness of the orphan and the PUMA rewards are not immediately obvious with very
few examples in the period 2007-2015. External factors, such as the continued off-label use of
cheaper and comparable medicinal products represents a disincentive for paediatric
medicine development. The lack of meaningful market exclusivity and unpredictable return
on investment (due to pricing and reimbursement practices) in a niche market makes it
difficult for PUMA to act as a strong incentive. The development of orphan drugs targeting
children is complex and costly with very small study populations. Nevertheless, stakeholders
consider the orphan designation as a strong incentive and expect to see an increase in orphan
rewards in the coming years. One of the drawbacks highlighted was the lack of choice for
companies between the orphan designation and SPC extension if the substance is also
registered for non-orphan indication.
Industrial stakeholders indicate that the PIP application and administrative procedures
consume significant resources. This would be seen as unattractive for smaller companies.
This is despite the fact that a more streamlined process is in place since 2014 and mandatory
“key binding elements” of a PIP are defined and thus the need for minor PIP modifications
are decreased. Further, engaging with the regulatory system is often found to be slow,
fragmented across different committees, thus resulting in additional costs and delays in
product development.
There are a number of initiatives in member states which are complementary to or extending
the implementation of the Regulation. For example, priority review of paediatric data and
clinical trial applications in member states aimed to provide accelerated access to paediatric
medicinal products. In addition, national legislation is available in some cases to reduce the
off-label use of medicines for children or to use financial incentives to encourage the use of
paediatric medicine. Paediatric research networks with industry/academia participation have
also been created and supported at the national level. Nevertheless, there is scope for
enhancing research collaboration through the mobilisation of EU research funds.
Public stakeholders indicate that the Regulation was set up from an overly narrow
perspective, excluding considerations for affordability, cost-effectiveness and budget
implications at the national level. From the public perspective, the effectiveness of the
Regulation may be viewed as somewhat reduced because public services may ultimately
decide not to pay for the registered paediatric medicines. The fact that the entry of generic
medicine to market is blocked for 6 months represents a high price to pay for a branded
product. Generic companies would consider important that SPC extension can only be
granted to the company that sponsors a paediatric study and is responsible for the
compliance with the PIP (market authorisation holder), not to other third parties.
The legislation in the US differs in various ways from the EU Regulation. Although not
mandated by legislation, the US has set up and funds the Paediatric Trials Network (enabled
by the Best Pharmaceuticals for Children Act, BPCA) that, with over 100 clinical sites,
conducts paediatric clinical trials and generates paediatric data on products. BPCA also

136
provides a financial incentive (6-month market exclusivity) to companies to voluntarily
conduct paediatric studies under a Pediatric Written Request (WR). These WRs are issued
based on a priority list, representing a balanced portfolio of therapeutic areas and paediatric
needs, without replicating research funded elsewhere. The Pediatric Research Equity Act
(PREA) on the other hand is mandatory and requires an initial Paediatric Study Plan (PSP) at
the end of Phase II. The EMA and FDA collaborate within the framework of the international
Paediatric Cluster to exchange information, agree on scientific requirements and harmonise
requests to sponsors. A current special initiative is the Pediatric Rare Disease Priority Review
Voucher awarded upon approval of a new product application for rare paediatric disease
indications. This is a transferable voucher for sponsors to obtain a priority review of any
subsequent drug application. However, there is no legislation to address the challenge of new
drug development when no adult indication exists.
CA consultation on the societal benefits of the Paediatric Regulation was conducted through a
two stage survey (Delphi) to expert stakeholders. This survey reveals a broadly positive view
of the regulation’s effect on medicines development. The majority of the respondents agree or
strongly agree that the number of paediatric research projects increased, that more quality
information is available on approved medicines for their use in paediatric population, and
that the awareness of health professionals for better evaluation of medicine for children has
increased. 84% of respondents indicate that there has been a measurable increase in the
numbers of medicines tested within paediatric populations in the period since the
implementation of the regulation. The survey revealed a broadly positive view about
improving research capacity and research collaboration, with a somewhat more neutral view
expressed about any improving trends in paediatric research funding. Regarding the
replacing of existing treatments for a paediatric condition (either by treatment with less
toxicity or enhanced efficacy), close to half of the respondents find that the regulation had led
to an increase. While 68% of the respondents find that there has been an increase in the
number of children treated with the right medicine at the right time with the right dose.
Almost 40% of respondents indicate they have seen improvements in child morbidity in their
field, which they would attribute to the regulation, which is encouraging at this point in time.
Moreover, the majority of stakeholders expect that the regulation will have measurable long-
term benefits, eg improving children’s school attendance, reducing time cares need to take off
work to care for children, increasing quality-adjusted life years for children, and decreasing
mortality rates of children with life-threatening illnesses. Positive societal benefits were also
reported as part of the survey to industry, eg it was reported that the Paediatric Regulation
evoked a change in culture and a significant shift in mind-set and helped encourage
paediatric development become a more integral part of the overall development of medicines
in Europe.
The Paediatric Regulation is expected to have a positive impact on improved treatment for
children and is expected to contribute to a reduction of adverse drug reactions. This in return
is expected to improve the quality of life of children, avoid mortalities, hospitalisation costs,
ambulatory costs, lost time by informal carers, and is expected to lead to other improvements
related to better treatment for children. The (exploratory) cost-benefit analysis seeks to
contrast these benefits with the cost to society resulting from the extra monopoly rent
obtained by the sponsors of PIPs as a result of the Paediatric Regulation.

137
There are two products (Drug A and drug B) among the eight medicinal products studied
here with strongly favourable benefit-cost ratio when calculated over a 10-year period,
basically due to non-cash benefits. Drug A is an Asthma pill and provides €32m net benefit,
while Drug B, a migraine pill provides €66m net benefit. All other medicinal products have a
negative benefit-cost ratio over 10 years. Based on the aggregation of cash and non-cash
benefits data for eight medicinal products, it is estimated that these eight products yield
overall benefits of €199m over a period of 10 years. Overall cash cost to society (patients,
health systems) from total monopoly rent to all stakeholders (pharmaceutical industry,
wholesalers, pharmacies, governments from value added/sales tax) were estimated at
€590m. As a result, the overall socio-economic benefit cost ratio across these medicines is
0.34, the societal overall rate of return minus 66%. It is expected that those PIPs that have
already received a positive statement of compliance but are not (yet) received a reward, on
average, also have a positive effect on society resulting from the change in labelling/safer
medicine. Based on an exploratory extrapolation of cost and benefits that may exist in
relation to 108 of such additional PIPs, the benefit estimate arrives at around €500m, which
is close to the estimated value of monopoly rents.
The investment in R&D made in relation to the PIPs, although a cost imposed on the
pharmaceutical industry, can also be viewed as an R&D investment towards new and
improved medicine that triggers further investment and contributes to the creation of jobs,
growth and innovative activity across (EU and non-EU) sectors. These so-called spillover
effects are estimated based on rates of return that are documented in related literature. The
more conservative estimated rate of return from an annual €2bn investment in R&D could,
after a period of 10 years, yield a total social return of around €6bn. This estimated social
return is significantly higher than the value of the SPC extension (excluding cost to society in
relation to other products and countries, as well as the dead weight loss in relation to the
SPC) suggesting that, in monetary terms, the benefits of the Paediatric Regulation outweigh
the costs

138
Regulatory cost data and analysis Appendix A
Scope of the survey to industry A.1
We designed a survey to PIP and waiver applicants inquiring about the specific cost elements
related to paediatric drug development. The relevant costs include all of the following
internal and outsourced costs that have been completed to date:
Administrative costs of a PIP / waiver application
R&D costs:
Cost incurred in relation to in-vitro studies and animal studies for paediatric
indications
Cost incurred in relation to the development of a paediatric formulation
Cost incurred in relation to phase II paediatric clinical
Cost incurred in relation to phase III paediatric clinical trials
Other costs incurred in relation to completing a paediatric investigation plan (eg,
modelling and simulation/ extrapolation studies, data management costs,
coordination costs)
Cost incurred or expected in future in relation to long-term safety and efficacy
monitoring after marketing authorisation
The survey excluded costs incurred in relation to marketing, legal costs of SPC extension
(these costs will be estimated in a separate study issued by the European Commission), and
manufacturing/distribution costs. The survey additionally asked PIP applicants to indicate:
Collaborations with a research network (eg the European Network of Paediatric Research
at the European Medicines Agency) in relation to completing a paediatric investigation
plan
Estimated benefit resulting from the scientific advice received from EMA (ie reduced
costs incurred)
Whether the applicant filed or is planning to file an application to the FDA in the USA
using the information generated by the PIP
A set of open-ended questions about the relevance, effectiveness, efficiency, coherence
and utility of the paediatric regulation
Survey design process A.2
In reference to the tender specification, we prepared a draft cost data questionnaire. This
draft was improved in several stages. First, during the inception phase of the study, we
received a number of comments from the steering group that were used to modify the first
draft of the cost data questionnaire.
We conducted a first pilot of the questionnaire with representatives of one pharmaceutical
company (Merck Group). We shared our draft data questionnaire and discussed it in detail in
a follow-up telephone meeting.

139
We then conducted a second pilot with EFPIA member companies (coordinated by EFPIA
Regulatory Affairs division) to which we submitted our improved data questionnaire. The
study team received written comments on the questionnaire from over 10 companies and
discussed these comments in a teleconference with EFPIA and member organisations. The
main points discussed included the following:
The commercially sensitive nature of the information requested
Feasibility to complete the data provision
Relevance of costs resulting from the Paediatric Regulation other than costs related to
PIP
Planned timeline
Underlying cost drivers of PIPs and the degree of representativeness
Following the teleconference with EFPIA and EFPIA member organisations, the study team
consulted with DG SANTE and EMA and updated the data questionnaire using the feedback
received. As described below, several modifications to the design were incorporated.
The information requested from companies is commercially sensitive. Therefore we
communicated to the companies invited to partake that:
All data received is treated in strict confidence and, as registered data manager under
the UK Data Protection Act 1998,
We have established processes to ensure the security of the data and information that
we collect and hold.
Only aggregate data will be part of our reports to the European Commission and will
not be attributed to individual companies.
If necessary, bilateral confidentiality agreements can be agreed upon (which a handful
of companies have taken up).
Because companies with a large number of PIP and waiver applications were concerned
about the feasibility to complete all data provision the study team looked into ways to
reduce the data request by capping the data request to individual companies to maximum
10 PIP/waiver applications. Companies that have 3-10 applications were requested to
provide information on all applications.
Other major cost items linked to paediatric medicine development, ie legal costs linked to
SPC extension, HTA requirements, medicine manufacturing and distribution costs were agreed
not to be in scope for this study. (Note that the review of SPC legislation will be the subject of a
separate EC study). Costs associated with long-term safety and efficacy monitoring is however
deemed within scope to evaluate the overall impact on the development costs of paediatric
medicines and thus a separate survey question is now included for these costs.
The proposed 3-week data collection period was judged too short to collect relevant data
from various company departments internally. In order to avoid unnecessary delays, we
maintained a 3-4 week deadline in our official invitation but have agreed to a more
flexible deadline whenever companies indicated that more time was needed to complete
the survey. This extension of deadline was thought to apply mostly to the companies that
have submitted 10 PIPs or more. In reality the data collection process extended over
several months.

140
Consideration of cost drivers is carried forward in the design of the sampling frame
Design of sample population A.3
The total number of PIP/waiver applications with decisions dates for the years 2007-2015 is 1,297. We
used web-scraping to download the data from the EMA website. This data was cleaned and structured
to identify the company names and e-mail addresses of all applicants that have applied to EMA
for three or more PIPs or waivers. This resulted in the selection of 78 companies and this group
submitted an estimated number of 870 PIP applications/waiver applications. The total number of
applications requested per company was however capped at a maximum of 10 for practical reasons
(see above). Nevertheless, companies that submitted more than 10 applications were invited to submit
data on additional PIPs. The capping of applications resulted in a target sample population of 514
applications, 40% of the total population.
Table 29 Population and target sample population of PIP/waiver applications
Population Target population Target population as a percentage
of total population
1,297 514 40%
A total of 26 companies applied for more than 10 PIP/waiver applications. We pre-selected the
applications requested from this group of companies on the basis of four criteria to maintain
representativeness of the sample and avoid the arbitrariness of companies ‘cherry-picking’ their PIPs.
In order to collect data on cost incurred in relation to phase II and phase III paediatric
clinical trials, preference was given to PIPs that received a compliance check (hence
providing more complete data set). In the total population 94 PIPs had received a final
compliance check. The target population of PIPs with a compliance check is 82, or 89% of the
total population.
Table 30 Population and target sample population of PIP/waiver applications which received a final
compliance check
Population Target population Target population as a percentage
of total population
94 82 87%
Our sampling frame also uses the following criteria:
Decision year – the sample should be representative of the costs incurred over the time-
frame, we use decision year as a proxy
Decision type – the cost of the Regulation is expected to differ between application types
Therapeutic area – conducting clinical trials in some therapeutic areas is thought to be
costlier than in others.

141
Submitting the survey A.3.1
The pre-populated survey was sent by e-mail to 78 companies on the 8th of February. The
survey was sent and addressed to the contact(s) most commonly listed in reference to the PIP
on the website of EMA. We screened the e-mails and sought to identify alternative e-mail
addresses whenever the e-mail address was no longer in use. Sometimes the e-mail address
was a generic e-mail address of a company and sometimes a personalised e-mail address.
Additional contacts from EFPIA were put in copy. A covering e-mail provided a succinct
overview of the study objectives and attached to the e-mail were the prepopulated
questionnaire and the letter confirming the validity of this study from DG SANTE. The
companies invited to partake were asked to confirm receipt of the e-mail and were asked to
return the completed survey by 3 March. Using the same survey template 18 EU Framework
Programme participants that were likely to have submitted a PIP were approached and asked
to contribute to the data collection. Companies were offered a prolonged deadline of 31
March 2016, which lapsed and we received the last submissions in mid-June.
Response rates A.3.2
Out of the 78 invitations sent to companies 19 companies returned cost data on PIP/waivers,
although not always for the complete set of PIPs/waivers for which we had requested data.
We were notified that in some cases PIPs requested concerned products that had been
transferred from the target company and were no longer part of the company product
portfolio. In another cases companies merged or split since the PIP application date.
Given our target sample population of 514 PIP/waiver applications (excluding FP7
participants that altogether only submitted a small number of PIPs), we have a response rate
of 24%, which is relatively high for this type of exercise, especially considering the difficulty
to retrieve this type of data retrospectively. Given the total population of 1,297 applications
this is a sample size of 9%.
Table 31 Target sample population and response rates of PIP/waiver applications
Target population Sample population
Response rate, given total number
of applications included in the
data request
514 121 24%
Table 32 Population and response rates of PIP/waiver applications
Population Sample population Proportion of the total number of
applications
1,297 121 9%

142
Table 33 Population and target sample population of PIP applications which received a final compliance check
Population Sample population Proportion of the total number of
applications
94 17 18%
In reference to the sampling frame we observe the following:
Decision year - see Figure 36– the distribution of the sample by decisions year is roughly
aligned with the distribution for the overall population of PIPs. There exists a slight
undersampling for the year 2010 and a light oversampling for the year 2014. Although
our data request is limited to costs incurred over the period 2008-2015, in practice a
small number of PIPs were registered to have had a modification in 2016 and this latest
reference date is reported below (this is not expected to have influenced cost estimations).
Decision type – see Figure 37 –we compare the number of decisions agreeing on a PIP
relative to the number of decisions related to applications for modification of our sample
and the population. We find that there is a slight oversampling of decisions related to
application for modifications – which is related to the fact that there is a small number of
PIPs that were registered as not having any agreed modifications at the time the data was
downloaded that resulted in having had a modification at the time of data provision. We
expect this slight oversampling to not be of major concern although it could slightly
inflate some of the administrative costs related to filing a PIP.
Therapeutic area – see Figure 38 - the distribution of the sample by therapeutic area is
roughly aligned with that of the sample population (based on data from the EMA 10 year
report) and more data was collected on the therapeutic areas for which a relatively larger
number of PIPs was submitted: eg Endocrinology, -gynaecology-fertility-metabolism,
Haematology-Hemostaseology, Oncology, Immunology-Rheumatology-Transplantation,
and Infectious diseases. Relatively fewer data was collected in the ‘other’ category’
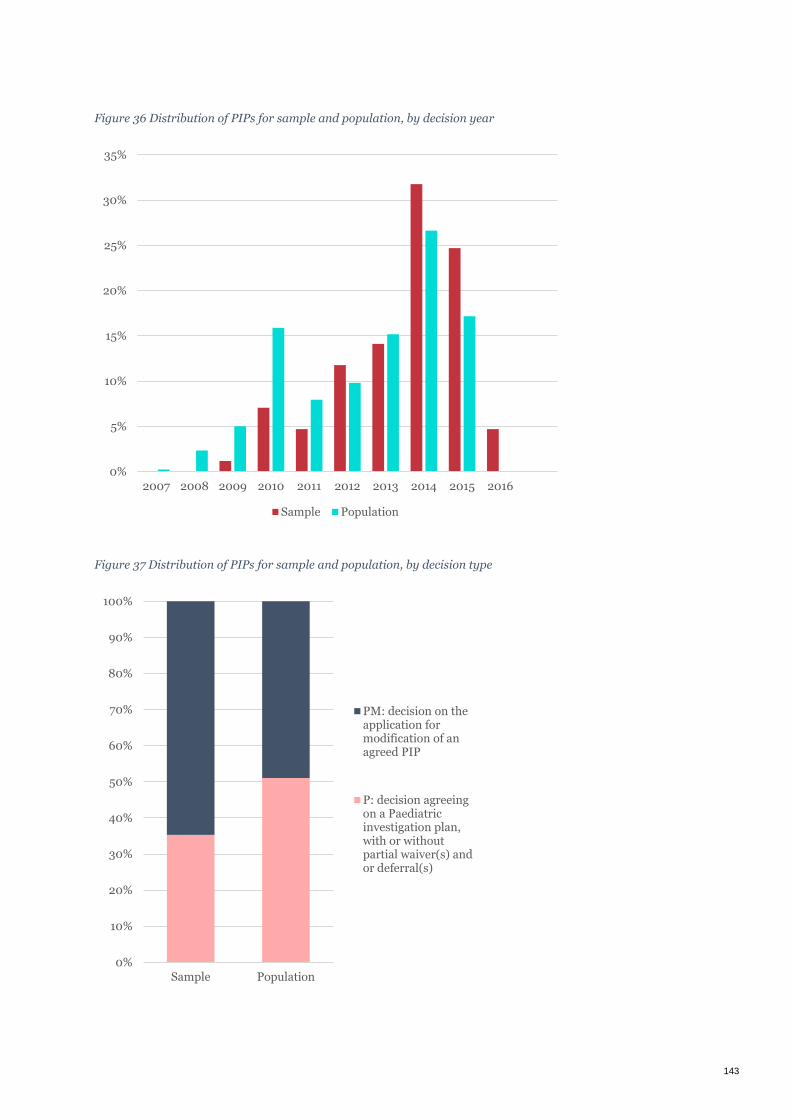
143
Figure 36 Distribution of PIPs for sample and population, by decision year
Figure 37 Distribution of PIPs for sample and population, by decision type
0%
5%
10%
15%
20%
25%
30%
35%
2007 2008 2009 2010 2011 2012 2013 2014 2015 2016
Sample Population
0%
10%
20%
30%
40%
50%
60%
70%
80%
90%
100%
Sample Population
PM: decision on theapplication formodification of anagreed PIP
P: decision agreeingon a Paediatricinvestigation plan,with or withoutpartial waiver(s) andor deferral(s)

144
Figure 38 Distribution of PIPs for sample and population, by therapeutic area
Source: data on the population is from the EMA 10-year report
Data treatment and scaling up costs A.4
For each of the organisation from which we have collected data we set up a process of
clarification/follow-up and (re-)formatting before entering cost data into an aggregate
database. This included a process of carefully distinguishing between ‘missing data’ (where
the companies were unable to provide response) and denoting cases where no costs were
incurred.
For the administrative costs some data was collected on estimated total number of hours
spent. As part of our cleaning process, the associated cost per hour was verified to be in line
with expectations. Although there are differences in the FTE rates in relation to function and
year as well as salary differences across EU member states, no abnormalities in the data were
detected.
Table 34 presents an overview of the data collected on PIPs. Although we collected data 85
PIPs, in some instances organisations were unable to report cost data for each of the various
phases. Also, some organisations did not incur any cost for a specific phase (because the
phase was not a requirement of the PIP) and this is taken into account as part of the
approach to scale-up.
Estimating the cost to industry involves several steps. First data is aggregated for each PIP
phase. This yields an estimate cost figure for costs incurred during 2008-2015 for the sample.
0% 5% 10% 15% 20% 25% 30%
Endocrinology, -gynacology-fertility-metabolism
Haematology-Hemostaseology
Oncology
Immunology-Rheumatology-Transplantation
Infectious diseases
Neurology
Other
Cardiovascular diseases
Vaccines
Psychiatry
Gastroentology-Hepatology
Dermatology
Pneumology-allergology
Population Sample

145
Next, this estimate cost figure is weighted by multiplying the average cost incurred for our
sample by the total number of initial PIP decisions made over the period 2008-2015, which is
858 (or 107.3 on average per year)172. Gross estimates are divided by 8 and presented as
annual estimated cost figures.
A similar approach is used to scale-up cost to industry in relation to waivers, however, in this
case we refer to the total number of full waivers granted during 2008-2015 which is 403 (or
50.4 on average per year)173.
Average and median cost figures for each phase are calculated based on only the sub-set of
data that reflect a complete (R&D) phase174.
Table 34 Overview of data on PIPs
Percentage of PIPs for
which organisations
reported to have incurred
costs
Percentage of PIPs
with completed phase
Labour cost incurred for preparation of the initial application 85% (72) 100%
Labour cost of annual reporting and further PIP modifications 46% (39) 100%
Other costs incurred in relation to preparing and modifying an
application 38% (32) 100%
In-vitro studies and animal studies 31% (26) 81%
Development of a paediatric formulation 36% (31) 45%
Phase II paediatric clinical trials 35% (30) 60%
Phase III paediatric clinical trials 55% (47) 43%
Other R&D costs incurred in relation to completing a paediatric
investigation plan 42% (36) -
172 EMA 10 year report
173 EMA 10 year report
174 The robustness of the estimate of total cost to industry is verified by scaling-up the average cost estimates using the total
number of initial PIP submissions for 2008-2015 and accounting for the probability of PIPs entering a given phase (based on
organizations reporting of whether a cost was incurred or not). Using this alternative approach to scaling-up the average R&D
costs are €22m rather than €19m, which is fairly close. The later cost estimate is considered more robust because it builds on a
larger sample.

146

147

148

149

150
Insights from literature with regard to the economic value of Appendix B
the Regulation
Although the availability of literature on the ‘economic value’ of the Regulation is limited, the
key principles described above can be found in publications which focus on the US and the
EU.
The US paediatric regulation175 was introduced in 1994 and asked developers to screen the
availability and quality of paediatric data in order to complement the information on the
labels. In 1997, the Food and Drug Administration Modernization Act (FDAMA) introduced a
six-month SPC extension (the ‘Paediatric Exclusivity Provision’) for products with paediatric
data: a developer had to submit a written request to get this extension, even if the data did
not prove the safety and efficacy of paediatric use. Since 2003 the legislation requires
paediatric assessments for all new medicinal products (active ingredients, dosages etc.).,176, 177
There are three studies about the economic impact of the six-month SPC prolongation in the
US. In 2012, Nelson et al. studied the economic impact (from a payer perspective) of the
patent extensions in statins, ace inhibitors and selective serotonin reuptake inhibitors
(SSRI).178 The authors linked the economic impact to the cost for society due to the delayed
generic market entry.
Nelson estimated the economic impact on the Utah Medicaid drug programme at $2.2m and
on all the Medicaid programmes in the US at $430m.179 The decrease of reimbursement cost
after exclusivity expiration per product was estimated at 3.8% to 24.4% within 18 month after
the expiration date of the original patent.180 In 2008, Baker-Smith et al already conducted a
similar analysis.181 The latter author calculated the ‘rate of economic return to cost’. This is a
comparison of the net return during and after the (additional) six-month marketing
exclusivity period. 182 Baker-Smith observed that there was a big variation between the
economic returns (and costs) of 9 orally administered anti-hypertensive drugs (from 1997
until 2004). The main conclusion of this study was that the Paediatric Exclusivity Provision
“has generated highly variable, yet lucrative returns to industry sponsors”. This is mainly
175 Final Rule 59 FR 64242.
176 FDA. 2013. Guidance for Industry and Review Staff: Paediatric Information Incorporated Into Human Prescription Drug and
Biological Products Labeling (good review practice).
177 Hoppu et al. 2012. ‘The status of paediatric medicines initiatives around the world- what has happened and what has not?’
European Journal of Clinical Pharmacology 68 p. 1-10.
178 Nelson et al 2011. Patent extension policy for paediatric indications: an evaluation of the impact within three drug classes in a
state Medicaid programme, Applied Health Economic Health Policy. 2011 May 1;9(3):171-81.
179 Note that the Medicaid programme is a joint federal and state programme that covers medical costs for people with limited
income and resources in the US. The Medicaid programme does, however, not reimburse all medical costs. (Source:
https://www.medicare.gov/your-medicare-costs/help-paying-costs/medicaid/medicaid.html).
180 The total costs of the six-month SPC prolongation were based on an assessment of 14 different medicines (divided in three
classes) over a period of 18 months after original patent expiration date.
181 Baker-Smith. 2008. The economic returns of paediatric clinical trials of antihypertensive drugs.
182 Explanation: Estimates of net economic return per drug were calculated based upon cash outflows and cash inflows adjusted
to their 2005 values. Net return-to-investment ratios were calculated to reflect 6 months of marketing exclusivity by averaging
cash inflows over 3 years to obtain an estimate of average annual cash inflow and dividing this value by 2 to obtain a 6-
monthestimate.

151
caused by large sale volumes, while the medicinal product is still under protection. The ‘rate
of economic return to cost’ varied between 4 and 65. The study of Li183, which used the same
approach, likewise resulted in the same conclusions, only with a broader representation of
the paediatric exclusivity program (more different indications). This study shows a rate of
economic return to cost from (minus) −1 to 74.
Literature which assesses the European situation is scarce. Medicines for Europe published
in 2012 a position paper in which they (amongst others) estimate the ‘costs’ of the SPC
extension: the SPC extension results in a six-month delay of the price fall, which can be
expected after the loss of patent exclusivity.184 Medicines for Europe claims that the SPC
extension resulted in 2012 in approximate €2.3bn loss of savings for European healthcare
systems.
With regard to pharmaceuticals in general, the sector enquiry of DG COMP (2009) analysed
the functioning of the pharmaceutical market and examined the reasons for observed delays
in the entry of generic medicines to the market and the apparent decline in innovation.185 The
sector enquiry did not assess the ‘economic value’ of the relevant exclusivity rights, but
focused on the effect of delays in the market entry of generic medicinal products. In the
econometric analysis DG COMP assessed the post-entry change in the average price level and
the generic producers' market share. Three important elements were (amongst others) taken
into account. First, the change in average drug prices at the end of the sample relative to the
price level prior to loss of exclusivity. This ‘price drop’ is calculated for the long-run and for
specific periods (1-4 years after the loss of exclusivity). Second, this should be combined with
the time it takes a generic product to enter the market (time to entry). Third, the share of
generic producers, after the loss of exclusivity (in comparison with the share of the
originators). In fact, this represents the market penetration of the generic product.
DG COMP confirmed that, due to several factors, there exists a delay of generic market entry.
For the sample of medicines studied in the inquiry the average time to enter the market (after
loss of exclusivity) was more than seven months. For the most selling medicines it took about
four months. With regard to the price drop, DG COMP observed that the price of generic
medicines during the first year after loss of exclusivity was, on average, 25% lower than the
price of the originator medicines (prior to the loss of exclusivity). Two years after entry,
prices of generic medicines were on average 40% below the former originator price. In terms
of market share (volume), DG COMP saw that the share of generic companies was
approximately 30% after one year and 45% after two years. Medicines for Europe indicated
that, compared to the sector enquiry in 2009, the pressure on generic prices increased (e.g.
due to mandatory price cuts).186
183 J. S. Li. 2007. Economic Return of Clinical Trials Performed Under the Pediatric Exclusivity Program
184 European Generic Medicines Association, ‘EGA contribution to EC public consultation on general Report on experience
acquired as a result of the Application of the Paediatric Regulation’, November 2012.
185 European Commission, DG COMP. 2009. Sector enquiry of the pharmaceutical market. See:
http://ec.europa.eu/competition/sectors/pharmaceuticals/inquiry/.
186 European Commission, DG COMP. 2009. Sector enquiry of the pharmaceutical market. See final report, consideration 1556-
1560.

152
With regard to the methodological framework for this study, the analysis of DG COMP of the
potential savings for society is of particular interest. They assessed the potential savings that
might be realised if generic medicines enter the market immediately after the loss of
exclusivity (instead of the average time to enter of seven month). This is illustrated by the
grey area in the Figure below.
Figure 39 Potential savings in case of immediate generic entry
DG COMP. 2009. Sector enquiry of the pharmaceutical market. Final report, consideration 216-217
In the analysis, DG COMP shifted the actual curve (‘index for average time to entr’) seven
month to the left (‘index if entry was immediate’) and estimated the difference between the
curves, which represents the potential savings for society.

153
Reward data, limitations and analyses Appendix C
Data used in the analysis C.1
Structure of the dataset C.1.1
Through a third party agreement with the European Commission and the Intercontinental
Marketing Services Health (IMS Health), the project team obtained relevant data for this
study. This dataset contains quarterly sales and volume data (i.e. revenues and units sold).
The variables together enabled the calculation of price per unit. The dataset contained data
from the 1st quarter of 2008 until the 3rd quarter of 2014.
The table below shows the six categories available within the dataset. The first category is the
International non-proprietary name (INN), which is the globally recognised way of naming
pharmaceutical active substances.187 The second category contains the countries in which the
INN is sold, distinguishing between sales distributed through hospital and retail. When there
is no distinction between hospital and retail data, this category is coded as ‘combined’. The
third category is the company which sells the specific product. This company can be the
manufacturer with the marketing authorisation, the parallel import company or the national
distributor. The fourth category is the brand name of the product. Each INN can enclose
several brand names. Each branded product contains the same active substance (cat. 1).
Besides this active substance, a branded product can contain other pharmaceutical
substances. The fifth category covers the type of product, i.e. non-generic or generic product.
When the type of product is unknown, this category is coded as ‘uncategorised’. The sixth
category contains the product characteristics, covering the specific route of administration,
the dosage and the package size.
Table 35 Categories available in IMS Health data
Category Description
1. International non-proprietary name
(INN)
2. Country
3. Company
4. Brand
5. Type of product
6. Package/dose
187 World Health Organization. Guidelines International non-proprietary name (INN). Available at:
http://www.who.int/medicines/services/inn/en/

154
We obtained data for 22 products to calculate the economic value and the secondary
outcomes of the corresponding awards: 14 products with a six-month supplementary
protection certificate (SPC) extension, 6 products with an Orphan Designation and an
approved Paediatric Investigation Plan and, 2 products with a Paediatric-Use Marketing
Authorisation Plan (PUMA). We selected the 22 products based on the yearly reports of
European Commission (2007-2015)188 and expert opinion. The specific countries per product
for which we requested data are specified in the table below.
Data limitations C.2
The datasets obtained did not fully comprise the requested data in terms of product and
country coverage. The limitations stated below are thus the limitations of the dataset, not of
the methodology of the analysis. The latter will be discussed in the next section.
Product limitations (category 1) C.2.1
The selection of products and countries was based on the year in which the award was
granted.189 This year is not the same year as the year in which the patent extension starts.
This additional protection starts when the ‘basic’ protection ends. Therefore, some products
had to be excluded, because the date of patent expiry was outside the timeframe of the
dataset (Q1 2008-Q3 2014).
Out of the 22 requested products, 14 products were excluded: 5 products with an SPC
extension, all (6) products with an Orphan Designation and an approved PIP and, all (2)
products with PUMA were excluded.
Beside these 14 excluded products, we excluded Drug D. For this drug the data did not allow
distinction between protected and non-protected products by the SPC extension. The month
of the patent expiry of the SPC extension was August 2013. However, the data showed generic
entries from 2008 and onwards. These generic products are products with an alternate
salt,190 and were therefore allowed to enter the market. In the dataset obtained, the salts used
in Drug D products were not identifiable. Therefore, we excluded this product from further
analysis.
Country limitations (category 2) C.2.2
Since a patent extension has to be granted by the national authority, the geographical
coverage differs per product (see Table 2). Not all marketing authorisation holders request
patent extensions in all countries. The countries in which they requested patent extensions
are listed in the column ‘countries requested’. However, not all countries were present in the
datasets obtained. For example, no data were available for Cyprus, Malta, Denmark, Iceland
and Liechtenstein. Only partial (retail turnover only) data were available for the Netherlands,
188 European Commission. Medicinal products for human use. Medicines for Children. Available at:
http://ec.europa.eu/health/human-use/paediatric-medicines/index_en.htm
189 European Commission. Medicinal products for human use. Medicines for Children. Available at:
http://ec.europa.eu/health/human-use/paediatric-medicines/index_en.htm
190 INN insight, available at: http://www.genericsweb.com/index.php?object_id=XXX

155
Latvia, Greece, Luxembourg and Estonia. Combined data only were available for Slovenia
(note that combined data means that there is no distinction between hospital and retail data).
Type of product limitations (category 5) C.2.3
This study focussed on the entry of generic products and the effects of these entries.
Therefore, it was important that distinction is made between non-generic and generic
products in each country as key variables. For Luxembourg and Slovenia, there was no such
distinction made and, for this reason, data from these two countries were excluded from
further analysis.
Package/dosage limitations (category 6) C.2.4
The dataset obtained did not contain specific Defined Daily Dose (DDD) information. DDD is
a standardised measure of medicine use per day. The dataset however contained all available
dosages and package sizes on the market and, as a result, we could consider comparable
dosages by converting the size of the package into comparable single units. Extrapolations
were then made to the entire dataset (see below).

156
Table 36 Availability/limitations of data
# INN Brand
name
Award Countries requested Missing countries Date of
patent
expiry
In-
cluded
Counties with
limitations
1 Infliximab Remicade SPC Sweden, Italy, France Denmark, Luxembourg, The
Netherlands
February 2015 No N/A
2 Insulin Lantus SPC Italy, Sweden, Ireland Denmark May 2015 No N/A
3 Etanercept Enbrel SPC France, Sweden, Ireland, Italy The Netherlands August 2015 No N/A
4 Abatacept Orencia SPC Germany, France, Austria,
Luxembourg, Italy, UK, Ireland,
Sweden, Finland, Portugal, Romania,
Denmark, Estonia, Slovenia,
The Netherlands, Bulgaria
December
2017
No N/A
5 Caspofungin Cancidas SPC Italy, UK, Austria, Ireland, Romania,
Slovenia, Greece, Netherlands,
Germany, France, Belgium, Finland,
Portugal, Sweden,
Denmark April 2017 No N/A
6 Nevirapine Viramune SPC Belgium, Germany, Italy, Luxembourg,
Netherlands, Portugal, Spain, Sweden,
UK
Denmark July 2013 Yes Netherlands (retail only)
Luxembourg
(uncategorised)
7 Zoledronic
Acid
Zometa
a.a.n.
SPC Austria, Finland, France, Germany,
Ireland, Italy, Luxembourg,
Netherlands, Portugal, Romania,
Slovenia, Sweden, UK
Denmark May 2013 Yes Netherlands (retail only)
Luxembourg and
Slovenia (uncategorised)
8 Rizatriptan Maxalt SPC Belgium, France, Germany, Italy,
Luxembourg, Netherlands, Spain,
Sweden, UK
Denmark , Ireland August 2013 Yes Netherlands (retail only)
Luxembourg
(uncategorised)
9 Latanoprost Xalatan SPC Austria, Finland, Germany, Ireland,
Italy, Luxembourg, Netherlands,
Denmark January 2012 Yes Netherlands (retail only)

157
# INN Brand
name
Award Countries requested Missing countries Date of
patent
expiry
In-
cluded
Counties with
limitations
Portugal, Sweden, UK Luxembourg
(uncategorised)
10 Anastrazole Arimidex SPC Austria, Belgium, Finland, France,,
Germany, Ireland, Italy, Luxembourg,
Netherlands, Sweden, UK
Denmark February 2011 Yes Netherlands (retail only)
Luxembourg
(uncategorised)
11 Montelukast Singulair SPC Germany, Ireland, , Italy,
Luxembourg, Netherlands, Slovenia,
Spain, Sweden
Denmark February 2013 Yes Netherlands (retail only)
Luxembourg and
Slovenia (uncategorised)
12 Clopidogrel Plavix SPC Italy, Germany, Spain, Finland,
Ireland, Sweden, Portugal, Belgium
Denmark August 2013 Yes Expiry dates in countries
differ from expected
expiry date.
13 Losartan Cozaar SPC Austria, Belgium, Finland, France,
Germany, Ireland, , Italy, Netherlands,
Sweden, UK,
Denmark March 2010 Yes No
14 Valsartan Diovan SPC Austria, Finland, France, Germany,
Ireland, Italy, Luxembourg,
Netherlands, Portugal, Sweden, UK
Denmark November
2011
Yes Netherlands (retail only)
Luxembourg
(uncategorised)
15 Anagrelide Xagrid Orphan France, Finland, Greece, Norway,
Belgium, Luxembourg, Sweden,
Estonia, Romania, Hungary
Denmark No N/A
16 Eculizumab Soliris Orphan Belgium, France Denmark, Finland, Greece,
Hungary, Luxembourg, The
Netherlands, Romania,
Slovenia
No N/A
17 Sapropterin Kuvan Orphan Belgium, Czech Republic, Estonia,
France, Greece, Hungary, The
Netherlands
Denmark, Latvia,
Luxembourg, Slovakia
No N/A

158
# INN Brand
name
Award Countries requested Missing countries Date of
patent
expiry
In-
cluded
Counties with
limitations
18 Tobramycin Tobi
Podahler
Orphan France, Czech Republic, Finland,
Luxembourg, Estonia, Bulgaria,
Slovakia, Netherlands, Sweden,
Slovenia
Denmark No N/A
19 Midazolam Buccolam PUMA France, UK, Ireland, Germany, Italy,
Spain, Finland, Sweden, Greece
Denmark No N/A
20 Propranolol Hemangiol PUMA France, Portugal, Sweden, Austria,
Netherlands, Germany, Spain,
Romania, Slovenia
Denmark No N/A

159
Data cleaning C.3
Data check C.3.1
Before data cleaning, each data category was checked for irregularities. A checklist regarding
these irregularities in the data can be found below.
Table 37 Data checklist
Category Description Check
1. INN - Check if there is one active substance
2. Country - Check which countries are included
- Check if the countries contain hospital and retail data.
3. Manufacturer - Check if the manufacturer of the non-generic product is the same as the company to whom the
reward is granted
4. Brand - Mark other products with independent market authorisations, which are not protected by the
SPC/Orphan/PUMA-extension.
5. Type of
product
- Check if there are uncategorised products, besides the non-generic and generic products
6. Package: dose - Check how many different packages/doses are presented. Highlight different
products/characteristics.
Data cleaning C.3.2
The following steps were taken to prepare the data for analysis:
Mark (label) the quarter in which the patents expires 1.
Exclude products with independent market authorisations, not protected by SPC 2.
extension (category 4)
Exclude non-categorised products (category 5) 3.
Make an overview of the different packages/dosages (category 6) 4.
Exclude packages/dosages with a different route of administration (not protected by the 5.
SPC extension) (category 6)
Sum the quarterly revenues of every different dosage. Create percentages of these 6.
quarterly sums, divided by the total of the dataset, minus excluded products.
Select most sold dosage 7.
Highlight the different sizes of the packages 8.
Extract revenue and volume of the packages of the selected dosage ranked on country and 9.
generic/non-generic
Convert different sizes of the packages into single units (e.g. the volume of a package of 10.
60 pieces has to be multiplied by 60)
Create totals of the revenues of all the non-generic/generic products and the overall total 11.
Create totals of the volumes of all the non-generic/generic products and the overall total 12.

160
Regarding step 6, the coverage of the selected products is presented below. We found that in
5 products the coverage of the most sold dosage is higher than 70%. In the three other
products this coverage is lower than 70%. However, there is no way to increase this
percentage, because these products do have more than one product which is frequently sold.
Table 38 Coverage selected products in the dataset (EU-level)
INN Minimum Maximum Difference Mean C.I. 95%
Drug E 74.6% 89.5% 14.9% 82.8% 2.7%
Drug D 81.9% 99.8% 17.8% 90.5% 3.7%
Drug H 88.3% 99.5% 11.2% 97.6% 1.8%
Drug F 55.2% 64.6% 9.3% 59.4% 1.4%
Drug A 58.1% 78.3% 20.2% 67.1% 3.0%
Drug C 78.5% 91.4% 12.8% 83.9% 2.0%
Drug B 71.7% 76.1% 4.4% 74.1% 0.6%
Drug G 28.3% 41.1% 12.8% 33.3% 2.6%
Drug I 50.9% 70.4% 19.6% 65.8% 3.1%
The characteristics of the included products are presented below. We present the therapeutic
area of the indication of the product, the excluded brands (step 2) and packages (step 5), the
selected product with the highest revenue share (step 7) and the maximum sales per quarter.
Table 39 Characteristics of the 8 products considered in this study
INN Therapeutic
area
Excluded
products
Most sold dose Included
/packages
Max. sales
per quarter
Drug E xxxxxxxx xxxxxxxxxx xxxxxxxxxxx xxxxxxxxxxx xxxxxxxxxxx
Drug
D
xxxxxxxx xxxxxxxxxx xxxxxxxxxxx xxxxxxxxxxx xxxxxxxxxxx
Drug
H
xxxxxxxx xxxxxxxxxx xxxxxxxxxxx xxxxxxxxxxx xxxxxxxxxxx
Drug F xxxxxxxx xxxxxxxxxx xxxxxxxxxxx xxxxxxxxxxxxxxxx
xxxxxxxxxxxx
xxxxxxxxxxxxxxxx
xxxxxxxxxxx
Drug A xxxxxxxxx xxxxxxxxxx xxxxxxxxxxxx Xxxxxxxxxxx
xxxxxxxxxxx
xxxxxxxxxxx
xxxxxxxxxxxx
Drug C xxxxxxxxx xxxxxxxxxx xxxxxxxxxxxx xxxxxxxxxxx xxxxxxxxxxxx
Drug B xxxxxxxx xxxxxxxxxx xxxxxxxxxxxxxxx 1, 2, 3, 6, 12, 18 € 23,017,875

161
INN Therapeutic
area
Excluded
products
Most sold dose Included
/packages
Max. sales
per quarter
Drug G xxxxxxxx Xxxxxxxxxx
xxxxxxxxxx
xxxxxxxxxxxxxxx xxxxxxxxxxxx,
xxxxxxxxxxxxx
xxxxxxxxxxxxxx
xxxxxxxxxxx
Drug I xxxxxxxx Xxxxxxxxxx
xxxxxxxxxx
xxxxxxxxxx
Xxxxxxxxxxxx
xxxxxxxxxxxx800Y/1ML
xxxxx
xxxxxxxxxx xxxxxxxxxxx
Assumptions C.4
To clean and prepare the data for analysis, we had to make some assumptions. The two
assumptions, related to selection of the most sold dosage and converting the different
package sizes, are stated below:
1 . Selecting the most sold dosage should be based on the coverage of the total revenues.
Explanation: the most important coverage is the percentage of the revenues and not
of the volumes. Because when small package is sold many times, it does not have a big
impact on the revenues. The average coverage should be covering the total revenue
with 70% (see Table 38)
2 . The price per single unit is not dependent on the size of the package.
Explanation: the packages of the most sold dosage are converted into single units (e.g.
one tablet). Converting the size of packages into single units is feasible and
accountable. This is proven by the comparison of price/unit for different package
sizes.
Limitations due to data cleaning C.5
Due to the selection of the most sold dosage, the less sold dosages were excluded from the
analyses. Ideally, the most sold product covers the hospital and retail data, and non-generic
and generic products per country. For some products one of these four variables could not be
covered, due to the selection of the most sold dosage, see table below.
Table 40 Limitations due to selection of most sold dosage
Product Country Limitation
Drug B Belgium Only non-generic products
Drug I Ireland Only generic products
Drug I Italy Only generic products
Drug I Romania Only generic products
Drug I Finland No products
Drug I Austria Data gap

162
Product Country Limitation
Drug C Sweden Only non-generic products
Methodology of data analysis C.6
In this section, the methodology of the data analysis is presented for the five relevant aspects:
generic entry, time between patent expiring and entry of generic, price- and volume effects,
substitution effects and the economic value of the rewards.
Generic entry C.6.1
From the 1st quarter of 2008 until the 3rd quarter of 2014, the number of generic products are
extracted. The two selection criteria for extraction were labelled as generic product in the
dataset and a registered volume higher than zero. After the extraction, the number of generic
entries in the quarters after the patent expiry were counted and presented in tables.
In the dataset, a non-generic product was sometimes labelled as generic product (especially
in the data from the Netherlands). These products were manually traced and corrected; these
products could be found in two ways: entering the market before the patent expiry and a
relatively high price compared to the other generics.
Time-to-event data C.6.2
Due to quarterly data, the first generic entry happened for (almost) all products in the first
quarter after the loss of exclusivity. Therefore, the time to entry was zero in most of the cases.
When the data is suitable for time-to-event analyses, we used survival analysis. With this type
of analysis, the duration from the beginning of the observation until the event happens could
be measured. The censored events are also included in this analysis. These analyses result in
a probability of generic entry after time t.
Price- and volume effects C.6.3
Price- and volume effects are presented as a result of generic entry. The dataset contained
only revenue and volume data.
After converting the different packages per dosage volume per single unit, the price was
calculated. The revenues per quarter per product divided by the volume per unit results in the
price per single unit. Note that the prices derived from the dataset were not corrected for
inflation.
The next step is to go from prices per single product to average price per category (non-
generic, generic product). The average price per category was not calculated based on the
individual prices. For these prices, the total revenue per category was divided by the total
volume in single units per category. This method corrects for volume differences, the so
called weighted prices. Besides the weighted prices per category, the weighted overall prices
were also calculated. This overall price showed the extent to which the market is served by
non-generic and generic products. The share of the generic products is reflected in the
weighted total prices. An example of these weighted prices is presented in the figure below.

163
When the total (weighted) line is moving to the generic (weighted) line, the generic share of
the total volume is increasing.
Figure 40 Example of changes in weighted prices
Presentation of absolute prices, besides the issue of confidentiality, is often not easy to read
and certainly not easy to interpret. The calculated prices per category and the total prices are
converted into index prices. The first price available in the dataset (1st quarter of 2008 in
most cases) is the reference price. The index prices of the total weighted prices and the
weighted non-generic prices per products are based on the first available prices of the
corresponding category. However, index prices of the weighted generic prices are based on
the first available price of the weighted non-generic prices. The index prices of the generic
products are relative to the price of the non-generic products.
Due to the use of index prices, the average price changes per product are easy to read and
interpret. Subsequently, the price drop is calculated, based on the index prices.
Volume data was available in the dataset. After extracting the non-generic and generic
products of the most sold dosage and after converting the packages of different sizes into
single units, the market share of both categories was calculated. The market share is
presented as percentages. Percentages facilitate the comparison of market share between
products.
The methods described in the previous sections enabled us to calculate:
Price drop (long run): percent drop between the price before the loss of exclusivity and
the price in the 3rd quarter of 2014
Price drop per year: percent drop between the price before the loss of exclusivity and the
price at 1, 2, 3 and 4 year(s) after first generic entry
Generic market share (long run): volume share of generics in the 3rd quarter of 2014
0,0%
20,0%
40,0%
60,0%
80,0%
100,0%
120,0%
1 2 3 4 5 6 7 8
Pri
ce c
han
ge
Time (quarter)
Total (weighted) Non-generic price (weighted) Generic price (weighted)

164
Generic market share per year: volume share of generics in 1st, 2nd, 3rd and 4th year
after first generic entry
Substitution effects C.7
Substitution effects can occur for products with the same active substance or for products
with other active substances within the same therapeutic class. These effects are identified by
evaluating the total volume of the product. Index numbers of the volumes were created. The
reference volume of these index numbers was the first available volume in the dataset, the 1st
quarter of 2008 in most cases. Subsequently, the volume changes (in percentages) were
calculated, based on the index numbers of the volume. When the volume was decreasing
with more than 20%, there could be a substitution effect. However, the dataset we analysed
did not include data of other active substances within the same therapeutic class. Therefore,
the occurrence of a substitution effect was determined by literature review and patent
research.
In case of the Orphan reward, this effect is unlikely, due to niche market of these paediatric
drugs.
Methodology to calculate the economic value of SPC extension C.8
In order to calculate the economic value of the SPC extension reward, we make use of the real
data (revenues) that covers the time when the SPC extension occurred and generate
hypothetical data to describe a situation without SPC extension. The total revenue of
calculated with SPC extension minus the total revenue calculated without SPC extension is
the actual economic value of the SPC extension reward (shaded area in the figure below).
Figure 41 Model used to calculate the economic value of the SPC extension
t= time in quarters (3 months)

165
Real situation (with SPC extension) C.8.1
This situation uses the available sales data to calculate actual revenues. The total revenue in
this situation covers the period from two quarters before the SPC extension expiry (t= -2)
until the revenue stabilises after the SPC extension. The quarter in which the SPC extension
expires, is labelled as t=0.
From the dataset it can be derived that stabilisation of the revenue for the products studied
occurs sometime between t=2 to t=6. Note that for example when the stabilisation occurs in
t=3, the period from expiry to stabilisation takes 1 year (t=0 -> t=3). Stabilisation is
dependent on the time delay between SPC expiry and entry of generics, which is distinct in
each country (related to external factors such as drug policy, drug prescribing patterns, etc.).
Hypothetical situation (without SPC extension) C.8.2
This situation is based on hypothetical data when the product would not benefit from SPC
extension. The total revenue in this situation covers the period from the quarter of the SPC
extension expiry (t= 0) until the budget stabilises after the SPC extension plus 2 quarters.
The length of this time period should be the same compared to the real situation. In this
hypothetical situation, the revenue of the product of the first two selected quarters should be
lower compared to the revenue of the product of the first two selected quarters in the real
situation, because of the earlier patent expiry.
Assumptions C.8.3
There is a time lag before the full effect of the 6-month extension disappears. It is
assumed that in the hypothetical situation, without SPC extension, the same pattern
(relaxation curve) occurs, only 6 months earlier.
Stabilisation of revenue after the patent expiry is considered complete when the revenues
of both situations are approximately equal.
Methodology to calculate the economic value of Orphan reward C.9
For the orphan products currently on the market, it was not possible to calculate the
economic value due to limited availability of real data, stemming from the time of marketing
authorisation and time to patent expiry. However, the model presented above and illustrated
in the figure below, is following the same reasoning. The only difference is that time is in
years and not in quarters.

166
Figure 42 Model to calculate the economic value of Orphan reward
t=time in years
Assumptions C.9.1
Due to the niche market of paediatric orphan drugs, the generic entry will not be as fast as
in the 'regular market' (SPC market).
There is a time lag before the full effect of the 2-year extension disappears. It is assumed
that in the hypothetical situation, without the orphan reward, the same pattern
(relaxation curve) occurs, only 2 years earlier.
Stabilisation of revenue after the patent expiry is considered complete when the revenues
of both situations are approximately equal.
Methodology to calculate the economic value of PUMA reward C.10
Also for the PUMA products currently on the market, it was not possible to calculate the
economic value due to limited availability of real data, stemming from the time of marketing
authorisation and time to patent expiry.
For the economic value of the PUMA reward, the difference between the revenues of the last
10 years, before the expiration of the PUMA reward, minus the expected revenues of 10 years
without a data/market protection is calculated, see figure below. The revenue of these 10
years without data/market protection (light blue line) is based on revenues of generic
products with the same active substance plus a potential premium for prescribing drugs
which are also effective in children.
After 10 years of protection, the revenues of the PUMA-holder could still be higher than the
revenues of the generic products with the same active substance, due to consumer
preferences and delay in generic entry. Therefore, the period over which the economic value
should be calculated, may be longer than 10 years.

167
Figure 43 Model to calculate the economic value of PUMA reward
t=time in years
In this calculation, the redistribution from off-label use to on-label use, by measuring the
potential revenue decrease of adult medicines (medicines used by children as off-label
drugs), needs to be taken into account. This information (if available) will be identified based
on literature review and/or expert opinion.
Assumptions C.10.1
Due to the niche market of PUMA drugs, we expect that the generic entry will not be as
fast as the 'regular market'.
There is a time lag before the full effect of the 10-year extension disappears, hence the
expression ’10 years (or more)’ is used.
Stabilisation of revenue after the patent expiry is is considered complete when the
revenues of both situations are approximately equal.

168
Socio-economic impact survey Appendix D
Profile of survey respondents D.1
Table 41 Survey respondent profile, current position
Phase I Delphi Phase II Delphi
Researcher at Higher Education Institute/ Public Research Institute/ Charity 41 3
Clinician in Hospital 32 3
Government/ regulatory affairs officer 10 1
Patient representative 8 1
Other (e.g. Researcher at Contract Research Organisation, Research funding
programme officer, Clinician in outpatient clinic, Clinical assessor, Family
practitioner, Non-profit organisation, Hospital Pharmacist, etc. )
25 2
Total 116 10
Table 42 Survey respondent profile, paediatric sub-speciality
Phase I Delphi Phase II Delphi
Oncology 22 2
Neonatology/paediatric intensive care 16 1
Psychiatry 5 1
Gastroenterology/hepatology 4 1
Infectious diseases 4 0
Pneumonology/allergy 4 1
Uro-nephrology 4 0
Cardiovascular diseases 3 1
Endocrinology/metabolic diseases 3 1

169
Phase I Delphi Phase II Delphi
Neurology 2 1
Other (including Immunology/rheumatology, Haematology, Anaesthesiology,
Orthopaedic diseases, Pain, Transplantation, multidisciplinary, Paediatric
Pharmacology, Palliative care, Paediatric trial management, and unspecified)
49 1
Total 116 10
Survey D.2

170
Cost-benefit assessment Appendix E
Selected literature review on cost and benefit E.1
A review of the Vernon paper191 E.1.1
A “leading article” published in “Pediatric Drugs” in 2012 on “Measuring the patient health,
societal and economic benefits of US pediatric therapeutics legislation” estimated the gross
economic benefits from the Best Pharmaceuticals for Children Act (BPCA) of 1997 to amount
to approximately US$ 360 billion. However, this is not a financial/economic or cash flow
benefit, but rather a social or intangible benefit based on some strong assumptions. In
particular, it assumes
an extra US$ 5.9 billion (in 2009 values) of pharmaceutical R&D expenditure generated
from 1997 to 2009 (13 years) due to the BPCA192
“1 US life-year produced per US$1,659 invested in pharmaceutical R&D”
a “life year value” of US$ 100,000
In summary, it is asserted that for the past the benefit/cost ratio to society for such
(marginal) investment increase was 100,000/1,659 = 60.3193. In other words, for every extra
dollar spent society would reap a “benefit” worth more than 60 dollars.
Considering the future, similar high benefits are forecasted: “Depending on the scenario
considered, the present value economic benefits of reauthorizing the BPCA range from $136
billion, for a 5-year continuation of the policy with a 6-month market exclusivity extension, to
$923 billion, assuming a permanent reauthorization of the market exclusivity extension.”194
Note that, overall, potential total benefits of more than 1 trillion US$ may be presumed.
Earlier in the same paper, in a hypothetical example, for a single medicinal product these
estimates are presented: “The pediatric clinical research that identified the (previously
unknown) optimal and/or appropriate dosing in children for safe and effective treatment
added an additional 107 500 present value life-years, with a dollar value equivalent to
between $10.7 billion and $18.7 billion.”
It must be noted that all of these considerations focus on the single key assumption, that
relevant benefits will result from death avoided,195 and not from cash savings or non-death
191 Vernon, J. A., Shortenhaus, S. H., Mayer, M. H., Allen, A. J., & Golec, J. H. (2012). Measuring the patient health, societal and
economic benefits of US pediatric therapeutics legislation. Pediatric Drugs, 14(5), 283-294.
192 Ibid., p. 291-292: This is based on the assumption that of the total R&D expenditure „historically, only 25% of pharmaceutical
products have had sufficient clinical data to support a pediatric labelling,“ that „average R&D productivity can serve as a
reasonable approximation of marginal R&D productivity when changes in R&D expenditures are small relative to baseline R&D
levels“, and that therefore the 6-month extension will trigger 5% more expenditures („As a baseline, we observe that in 1996, the
average market exclusivity period for a new molecular entity with market size greater than $100m (2005 $US for the 12-month
period prior to generic entry) was 10.04 years.“
193 60.3 is equal to a (social or societal) return on investment of 5,930% (five thousand nine hundred thirty percent: 6,030 minus
100).
194 Ibidem, p. 293
195 Ibid., p. 287: „The mortality assumption is a key structural component of the model.“

171
related intangible benefits. Reflecting on this, one may consider that death is a very rare
incidence with children. Of the 32,848 deaths in children between 0 to 14 years old (in the
USA in 2013)196 more than 48% of death occurred around birth and more than 71% of death
occurred before the first birthday. The majority of deaths are not related to a specified
disease but rather to other causes related to perinatal events and accidents.
According to the study, 23,440 deaths occurred in children under age 1 in the year 2013.197
Of these, neonatals (under 28 days) account for 15,867 (68%), and postneonatals (28 days–
12 months) for 7,573 (32%). For the 1 to 14 year old, 9,408 deaths are recorded. For these, by
far the most dominant cause of death was accidents rather than disease-related incidences.
The following table presents an extract from a more comprehensive document reporting inter
alia on the leading causes of death for the USA by age groups (Death rates by age for the 15
leading causes of death in 2013: United States Rates on an annual basis per 100,000
population):
Table 43 Leading causes of death for children, USA, 2013, per 100,000 population
Leading causes of death (ICD 10
codes) Under 1 year 1–4 5–14 Sum 15–24
Accidents (unintentional injuries)
(V01–X59,Y85–Y86) 29.3 8.3 3.7 41.3 26.4
Diseases of heart (I00–
I09,I11,I13,I20–I51) 7.8 1.1 0.4 9.3 2.1
Malignant neoplasms (C00–C97) 1.6 2.1 2.2 5.9 3.4
Influenza and pneumonia (J09–
J18) 4.5 0.6 0.3 5.4 0.4
Septicemia (A40–A41 3.9 0.3 0.1 4.3 0.3
Cerebrovascular diseases (I60–I69) 2.7 0.2 0.2 3.1 0.3
Chronic lower respiratory disease
(J40–J47) 0.6 0.4 0.4 1.4 0.4
Source: Jiaquan Xu, M.D. et al, op. cit. Own excerpt from “Death rates by age for the 15 leading causes of death in
2013: United States Rates on an annual basis per 100,000 population”
The data in table Table 43 show that accidents are by far the most prevalent cause of death
for children aged 0-14. As a cause, they occur 4.4 times more than diseases of the heart, 7
times more than cancer, and 7.6 times more than influenza and pneumonia, the most
important diseases accounting for the death of children. For the 14-24 years age group, the
rates are even higher (i.e. 7.8 to 88). At the same time, this table identifies those disease areas
196 In the absence of similarly detailed data and to compare with the paper mentioned, we make use of USA data here.
197 For all data, see Jiaquan Xu, M.D.; Sherry L. Murphy, B.S.; Kenneth D. Kochanek, M.A.; and Brigham A. Bastian, B.S (2016).
Deaths: Final Data for 2013. National Vital Statistics Reports, Volume 64, Number 2 February 16, 2016. U.S. DEPARTMENT OF
HEALTH AND HUMAN SERVICES, Centers for Disease Control and Prevention, National Center for Health Statistics. National
Vital Statistics System.

172
where pharmaceutical/clinical research may have the highest impact on the avoidance of
death in children.
In this context, also the data reported by WHO respectively in the Rand study198 on
“Extended Impact Assessment of a Draft EC Regulation on Medicinal Products for Paediatric
Use - Prepared for the European Commission” indicate that death due to adverse drug
reactions (ADRs) is relatively uncommon in young people:
Table 44 Adverse drug effects as a cause of death in the EU-15, 1999 (deaths per million population)
Entire population 0-24 year olds
Austria 0.12 0.00
Belgium 3.05 0.00
Denmark 0.19 0.00
Finland 0.00 0.00
France 11.07 0.32
Germany 6.27 0.50
Greece 0.00 0.00
Ireland 1.34 0.00
Italy 0.33 0.13
Luxembourg 18.48 0.00
Netherlands 2.72 0.62
Portugal 1.30 0.31
Spain 3.94 0.49
Sweden 8.13 0.00
United Kingdom 0.77 0.11
Source: WHO Mortality Database
198 Oortwijn et al. Extended Impact Assessment of a Draft EC Regulation on Medicinal Products for Paediatric Use. Prepared for
the European Commission. Rand Europe, 2004, p. 33

173
The deaths of children of age 0-15199, according to the US death data register amounts to
32,848 deaths for 2013, of which 3,993 were caused by accidents, and 15,867 to perinatal
events. In total, 12,988 deaths are related to diseases, where medicines could play a
considerable role in treatment. The Vernon paper may have overstated some of the ADEs in
children. Another paper finds that “Each year, approximately 26 500 American children (to
age 18 years) die from ADRs.”200
A more reasonable plausibility calculation on this issue may be as follows:
In 2013, the overall death was 2,596,993 for the US. Deducting from this perinatal deaths of
children (15,867) and overall deaths by accident (130,557) leaves 2,450,569 deaths mostly
from diseases. The US Institute of Medicine landmark study on “To err is human”201
estimates that at least 44,000 and as many as 98,000 people die in any given year from
medical errors202 that occur in hospitals. From all adverse events that led to death, over half
“resulted from medical errors and could have been prevented.”203 204This implies that almost
another half of all deaths resulted from other ADEs which may be caused by medicines.
Assuming this number is the mean of 44,000 and 98,000 we calculate with 71,000 deaths.
On the base of 2,450,569 deaths for all, this leads to a death rate of 0.029 or 2.9%. Applying
this to the about 13,000 deaths of children <15 years old related to diseases, we obtain a
figure of 377 deaths which may be due to ADEs. How many of these events are indeed due to
ADRs, i.e. where there exists a causal relationship to the drug(s) administered, is unknown.
Assuming this ratio to be 50%, we arrive at a death figure of about 190. Next, noting that off-
label use of paediatric medicines may be anywhere between 25% and 50%, taking the mean
value of this as 37.5 and assuming that off-label use is causing somewhat more ADRs causing
death, one can estimate that perhaps 40% to 50% of death may be related to off-label use, or
as a mean value of 45%, out of 190 around 85 deaths per year.
How many of these deaths could be avoided by switching from off-label to on-label use is an
unknown variable; we would expect it to be anywhere between 10% and 25% or, for a value of
20%, 17 deaths overall, in relation to the US population (and, keeping everything else
constant, approximately 27 deaths in relation to the EU population).
199 Jiaquan Xu, M.D. et al, op. cit. The next age bracket, for which data are reported, is 15 to 24. See
200 Carleton, B. C., & Smith, M. A. (2006). Drug safety: Side effects and mistakes or adverse reactions and deadly errors? British
Columbia Medical Journal, 48(7), with reference to Lazarou J, Pomeranz BH, Corey PN. Incidence of adverse drug reactions in
hospitalized patients: A meta-analysis of prospective studies. JAMA (1998) 279:1200-1205.
201 Kohn, L. T., Corrigan, J. M., & Donaldson, M. S. (Eds.). (2000). To err is human: building a safer health system (Vol. 6).
National Academies Press.
202 Examples given are overdose during chemotherapy, the wrong leg amputated, death during “minor” surgery due to a drug
mix-up. Ibid., p. 1
203 Ibid., p. 1
204 Studies performed in Europe indicate that the situation is similar across healthcare systems. A recent update on the USA led
to the result that since 2000 not significant change has happened.

174
Economic return to industry of clinical trials performed under the US paediatric E.1.2
exclusivity programme205
In 1997, the US Congress authorised the Food and Drug Administration (FDA) to grant 6-month
extensions of marketing rights through the Pediatric Exclusivity program if industry sponsors
complete FDA-requested paediatric trials. On the one hand, the program has been praised for creating
incentives for studies in children. On the other hand, it has been criticised as a “windfall” to the
innovator drug industry. The paper reports on analysing this issue for the period 2002 – 2004. Data
from 59 therapeutic agents were submitted to the FDA. The authors obtained the final study reports
from 9 drugs in a broad range of therapeutic areas, guided by a specific selection algorithm. It turned
out that “the distribution of net economic return for 6 months of exclusivity varied
substantially among products.” The “net return ranged from (−)$8.9 million to (+)$507.9
million.” The ratio of return to cost ranged from −0.68 for one product to between 2.31
(131%) and 73.6 (7,260%) for the remaining ones.
Assessment by the German Bundesinstitut für Arzneimittel und Medizinprodukte E.1.3
(BfArM)
The assessment undertaken by the German Federal Institute for Medicinal Products is of a
more qualitative nature, attempting to trace certain developments since implementation of
the EC Paediatric Regulation 1901/2006 and its practical relevance for treatment in
Germany.206 Based on data obtained from EMA and the “Heads of Medicines Agencies
(HMA)”207 they report that until December 2011 1,144 PIPS were submitted to EMA. 74%
were for new, not yet authorised medicines, 24% pursuant to Art. 8 for products still under
protection, and 2% for patent-free products pursuant to Art. 30. By Feb. 2014 the numbers
had increased to 1,556 applications, 329 waivers, 715 accepted PIPs, and 54 finished ones,
without significant shifts in their respective proportions.
These data are then contrasted with the prescription behaviour of German physicians when
treating young people 0-17 years old. For the five most relevant indications, the 20 most
prescribed active ingredients (ATC codes) in 2011 were identified for each field, and for two
groups of patients – those 0-11 and 12-17 years old. Due to overlap, overall 124 active
ingredients were included into further analysis. Data concern only the ambulatory sector.
One objective was to explore whether the medicines were on-label for children. Overall,
around 90% of all prescriptions focused on the top 20 active ingredients in each field:
Pulmonary/ENT diseases: 18m prescriptions (85% on the top 20 ingredients)
Infectious diseases: 7.4m (97%)
Central nervous system incl. pain: 5.6m (94%)
Cardiological/heart diseases: 235,000 (75%)
205 Li, J. S., Eisenstein, E. L., Grabowski, H. G., Reid, E. D., Mangum, B., Schulman, K. A., ... & Benjamin, D. K. (2007).
Economic return of clinical trials performed under the pediatric exclusivity program. Jama, 297(5), 480-488.
206 All data and information in the following section relate to Afentaki, A. (2014). Arzneimittel für Kinder und „Off-Label-Use “5
Jahre nach Inkrafttreten der EU-Verordnung (EG) Nr. 1901/2006. Bundesgesundheitsblatt-Gesundheitsforschung-
Gesundheitsschutz, 57(9), 1111-1119
207 „The Heads of Medicines Agencies (HMA) is a network of the heads of the National Competent Authorities (NCA) whose
organisations are responsible for the regulation of medicinal products for human and veterinary use in the European Economic
Area.“ http://www.hma.eu/abouthma.html

175
Oncology 29,000 (91%)
Around 77% of all active ingredients were identified as “on-label” use for children, 18.5% as
“off-label”, and 5% as “undefined”. The highest rate – 37% - of off-label use was in oncology
for children up to 11 years old, whereas for infectious disease-related prescriptions no off-
label use was identified.
In our context, it is relevant that for the 124 most often prescribed active ingredients only one
was still under patent protection because the others were authorised long before 2007.
Nevertheless, for 16% of these ingredients a PIP had been accepted, noting that 74% of all
submitted PIPs relate to new ingredients, which therefore cannot yet be prescribed.
In summary, the assessment concludes that so far only very few studies have been finalised,
whereas most are still in the planning or implementation stage, particularly those concerned
with new active ingredients. The Paediatric Regulation was a first, most important step
(“milestone”) to improve the on-label prescribing of medicines for children, but so far, only a
modest start was achieved. As most results from PIPs and other measures are still to come,
“however only the children and adolescents of tomorrow” will fully profit.208
Review of the Extended Impact Assessment of a Draft EC Regulation on Medicinal E.1.4
Products for Paediatric Use
It us useful to revisit the impact predictions made by the Rand study on “Extended Impact
Assessment of a Draft EC Regulation on Medicinal Products for Paediatric Use,” undertaken
for the European Commission in 2003/4.209 Inter alia, it pointed out that
“The Regulation will cost money”, and “consumers will have to pay higher average prices
for medicines for paediatric and adult use.”
“Better testing, safer medicines, and the greater availability of tested medicines will
improve health care for children and reduce the prevalence of ADRs and the burden of
childhood disease.” ... “Although the extent of the reduction in costs cannot easily be
determined, it will most likely more than compensate for the increase in average drug
prices brought about by the delay in the marketing of generic alternatives.”
“The main social impact will be that the increased availability of medicines tested for use
in children – without a substantial rise in medicinal prices – will provide the
opportunity210 to avoid preventable ADRs, raise the quality of medicinal treatment for
children, and thus improve their quality of life. The proposed Regulation will therefore
achieve its highest objective.”
Perhaps most interesting, particularly in view of the results from the German study, is the
final assessment: “The higher objective of the Regulation –the very reason why it was drafted
in the first place– is to improve the health of the children of Europe. The proposed
Regulation provides one half of the solution. By changing the economics and legal
preconditions of the production of medicines, the Commission hopes to steer consumers
208 Ibid., p. 1118
209 Oortwijn et al., op. cit., pp. 81-86
210 Italics by the study team

176
(health care professionals and households) towards tested and, hence, safer and more
effective medicines. If the tested medicines are indeed prescribed, children will receive better
treatment, involving shorter hospitalisation and lower drug consumption, and enjoy a higher
quality of life. A number of risks and uncertainties remain, but the most likely ones do not
substantially threaten the impact of the Regulation. Choice remains the most uncertain
factor: the readiness of the industry to focus on the development of paediatric medicines, the
response of generic drug manufacturers to the incentives of the PUMA, and the willingness of
health care professionals to prescribe tested medicines. The final piece –regulating
prescription practices– will have to be provided by policy makers in the health care
domain.”211
In other words, planning and executing PIPs and other measures, improving labelling and
generating more knowledge on treatment of children are only “one half of the solution”. As
long as the second half of the solution is not assured, as long as the new knowledge is not
translated into clinical practice and widely applied for better healthcare for children, the
overall impact will remain small. Knowledge as such may have considerable intellectual,
intangible value in satisfying our curiosity, but as long as it is not diffused and applied in
paediatric healthcare provision, it does not generate economic or social value.
Defining and identifying adverse drug reactions and events E.2
Adverse drug reactions (ADRs) E.2.1
Following widespread discussions in the literature212, the key benefits to be considered derive
from major and minor adverse drug reactions (ADRs) avoided due to the improved
information on how to better apply the medicinal product under analysis to children (switch
from off-label to on-label use, identification of new paediatric indications, etc) and the
improved therapeutic outcomes there from.
The WHO defines ADRs as: “a response to a drug which is noxious and unintended, and
which occurs at doses normally used in man for the prophylaxis, diagnosis, or therapy of
disease, or for the modifications of physiological function.” 213ADRs are injuries caused by
taking a medication. They are appreciably harmful or unpleasant reactions, resulting from an
intervention related to the use of a medicinal product, which predicts hazard from future
administration and warrants prevention or specific treatment, or alteration of the dosage
regimen, or withdrawal of the product. Adverse drug reactions are classified into six types
(with mnemonics): dose-related (Augmented), non-dose-related (Bizarre), dose-related and
time-related (Chronic), time-related (Delayed), withdrawal (End of use), and failure of
therapy (Failure).”214
211 Italics by the study team
212 Smyth RM, Gargon E, Kirkham J, Cresswell L, Golder S, et al. (2012) Adverse drug reactions in children–a systematic review.
PLoS One 7: e24061.
213 http://www.who.int/medicines/areas/quality_safety/safety_efficacy/trainingcourses/definitions.pdf
214 Edwards, I. R., & Aronson, J. K. (2000). Adverse drug reactions: definitions, diagnosis, and management. The Lancet,
356(9237), 1255-1259.

177
Adverse drug events (ADEs) E.2.2
ADEs injuries occurring at the time a drug is used, whether or not it is identified as a cause
of the injury. The American Food and Drug Administration (FDA) defines ADEs as “any
undesirable experience associated with the use of a medical product in a patient.”
EMA defines an Adverse Event as “any untoward medical occurrence in a patient or clinical
trial subject administered a medicinal product and which does not necessarily have a causal
relationship with this treatment. An adverse event can therefore be any unfavourable and
unintended sign (e.g. an abnormal laboratory finding), symptom, or disease temporally
associated with the use of a medicinal product, whether or not considered related to the
medicinal product215.”
Concerning the severity of such ADEs, it has been proposed to classify them as216:
Significant
serious, and
life threatening
It follows that ADRs are a subset of ADEs.
According to FDA, a “serious adverse event” is one when the patient outcome is one of the
following:217
Death
Life-threatening
Hospitalization (initial or prolonged)
Disability or Permanent Damage
Congenital Anomaly/Birth Defect
Other Serious (Important Medical Events)
The rare disability impact seems to be mostly of a temporary nature218, but some can be life-
long.
Medication errors (MEs) and ADEs E.2.3
A related concept is that of medication error. It has been defined as “any incorrect or
wrongful administration of a medication, such as a mistake in dosage or route of
administration, failure to prescribe or administer the correct drug or formulation for a
particular disease or condition, use of outdated drugs, failure to observe the correct time for
administration of the drug, or lack of awareness of adverse effects of certain drug
combinations.”219 Typical errors relate to “underdose, overdose, wrong drug choice, error in
215 http://www.ema.europa.eu/docs/en_GB/document_library/Scientific_guideline/2013/05/WC500143294.pdf
216 Holdsworth, M. T., Fichtl, R. E., Behta, M., Raisch, D. W., Mendez-Rico, E., Adams, A., ... & Greenwald, B. M. (2003).
Incidence and impact of adverse drug events in pediatric inpatients. Archives of pediatrics & adolescent medicine, 157(1), 60-65.
217 http://www.fda.gov/Safety/MedWatch/HowToReport/ucm053087.htm
218 Holdsworth, M. T , Ibid.
219 http://medical-dictionary.thefreedictionary.com/medication+error

178
frequency, error in timing, excessive infusion rate, lack of premedication, wrong route, drug
interaction, and dispensing error.”220 It follows that medication errors may lead to an ADE or
even an ADR, but they do not always have an adverse clinical consequence.221 “Several studies
suggest that about one third of ADEs are associated with medication errors and are thus
preventable.”222 This implies that ADEs and MEs are distinct sets, but have an overlapping
subset.
Validity and reliability of data reported in studies – a summary E.2.4
In their study on “How are medication errors defined?” Lisby et al. note: “In the Harvard
Medical Practice studies of adverse events in hospitals, medication errors were found to be
the main contributor constituting around one in five of the events, which were subsequently
confirmed in comparable studies and studies of adverse drug events (ADEs).” The
documented prevalence of medication errors “ranged from 2% to 75% with no associations
found between definitions and prevalence... It appears that definitions and methods of
detection rather than being reproducible and reliable methods are subject to the individual
researcher’s preferences.”223 They also found that a certain set of studies from institutions in
Boston reported consistently low “occurrence of medication errors ranging from 2% to 8%
regardless of whether intercepted errors were included or not, suggesting consistency in error
detection methods. However, prevalence in the two studies from Europe exceeded the
American studies by as much as eight times, despite use of virtually identical definitions. No
obvious circumstances can explain these extreme differences, apart from use of data
collection methods.”224
In summary, the widely differing conceptual definitions of the terms used, their
operationalisation, and in particular their empirical measurement in a specific context
explain the absence of overriding consistent, comparable and reliable data on ADRs, ADEs
and MEs prevalence. The context of such studies usually relates only to a certain setting like a
single or a group of hospitals at the secondary or tertiary level, the ambulatory setting of
emergency rooms, community centres etc. in a certain town or region, often also concerning
only a given disease – all of this leading to the widely divergent results as e.g. summarised in
the study on “Adverse drug reactions in children.”225
Objective of the modelling approach and reporting of adverse drug events by medicine E.2.5
agencies
The focus of this study is on estimating the potential socioeconomic impact of the Paediatric
Regulation, specifically in relation to new knowledge generated by successful and
220 Holdsworth, M. T , Ibid.
221 Carleton, B. C., & Smith, M. A. (2006). Drug safety: Side effects and mistakes or adverse reactions and deadly errors?. British
Columbia Medical Journal, 48(7), 329.
222 Kaushal, R., Bates, D. W., Landrigan, C., McKenna, K. J., Clapp, M. D., Federico, F., & Goldmann, D. A. (2001). Medication
errors and adverse drug events in pediatric inpatients. Jama, 285(16), 2114-2120.
223 Lisby, M., Nielsen, L. P., Brock, B., & Mainz, J. (2010). How are medication errors defined? A systematic literature review of
definitions and characteristics. International Journal for Quality in Health Care, 22(6), 507-518.
224 Ibidem, p. 516
225 Smyth RM, Gargon E, Kirkham J, Cresswell L, Golder S, et al. (2012) Adverse drug reactions in children–a systematic review.
PLoS One 7: e24061.

179
unsuccessful PIPs. The PIP investigations contribute to improving “the information available
on the use of medicinal products in the various paediatric populations.”226 In other words, the
major objective of a PIP is to generate new knowledge so that a given medicinal product may
be used on-label rather than off-label or not at all when treating a child and can help prevent
ADEs. Also, a recommendation to not use the medicine for this population may be the
outcome of a successful PIP.
The benefits resulting when applying this new knowledge are to be contrasted with “the
maximum cost [which] will concern the added ‘monopoly rent’ resulting from a six-month
patent extension” to the healthcare system respectively the payers.227
Given the above-discussed situation on reliably measuring ADEs, we use the EMA and FDA
data from their pharmacovigilance resources for our purposes.
European Medicines Agency (EMA) E.2.6
The EMA is responsible for the development, maintenance and co-ordination of
EudraVigilance (European Union Drug Regulating Authorities Pharmacovigilance), “a system
for reporting suspected cases of adverse reactions to a medicine” within the European
Economic Area (EEA) and globally. It collects for authorised medicinal products, amongst
others, “individual case safety reports (ICSRs): A document providing information related to
an individual case of a suspected side effect due to a medicine.” Information is collected on
both “serious” and “non-serious” suspected adverse reactions. The purpose is the “early
detection and evaluation of possible safety signals: Information on a new or known adverse
event that is potentially caused by a medicine and that warrants further investigation. Signals
are generated from several sources such as spontaneous reports, clinical studies and the
scientific literature.”228 These quotes contain the terms suspected adverse reaction, suspected
side effect, and adverse event. Therefore ISCRs are limited to events in which causality is
suspected, and hence not every adverse event should be reported. We assume for our
purposes that the term adverse drug event probably best characterises the information
collected.229
It also includes information on medication errors: “Pharmacovigilance legislation requires
reporting of medication errors that result in adverse reactions to EudraVigilance.” And
Directive 2010/84 (EC) in its recital (5) stipulates: “For the sake of clarity, the definition of
the term ‘adverse reaction’ should be amended to ensure that it covers noxious and
unintended effects resulting not only from the authorised use of a medicinal product at
226 Recital (4) of the Regulation; cf. also Art. 2 2.: „‘paediatric investigation plan’ means a research and development programme
aimed at ensuring that the necessary data are generated determining the conditions in which a medicinal product may be
authorised to treat the paediatric population“
227 http://www.fda.gov/Safety/MedWatch/HowToReport/ucm053087.htm, p. 9
228
http://www.ema.europa.eu/ema/index.jsp?curl=pages/regulation/general/general_content_000258.jsp&mid=WC0b01ac058
00241de
229 Blake, K.V. Et al. (2014) in their paper “Comparison between paediatric and adult suspected adverse drug reactions reported
to the European medicines agency: implications for pharmacovigilance” (Pediatric Drugs, 16(4), 309-319) do not even discuss
this issue and just assume that they are writing about ADRs.

180
normal doses, but also from medication errors and uses outside the terms of the marketing
authorisation, including the misuse and abuse of the medicinal product.”230
US Federal Drug Administration (FDA) E.2.7
In the USA the information is more clearly defined, FDA consistently talks only about
“adverse event and medication error” reporting: Its “Adverse Event Reporting System
(FAERS) is a database that contains information on adverse event and medication error
reports submitted to FDA. The database is designed to support the FDA's post-marketing
safety surveillance program for drug and therapeutic biologic products.”231
Making use of ADE data from regulatory agencies E.2.8
As EMA and FDA seem to primarily collect information and data on ADEs, this is the concept
which will be applied in what follows, and we will make use of their data as far as possible as
input to our benefit-cost model.
For what follows, it is to be observed that, e.g., ADEs resulting from medication errors cannot
be prevented through data obtained from executing PIPs. Rather, these types of challenges
need investment in better understanding of unexpected events and medication management
processes. “Two paradigms have been suggested to explain precursors to medication errors
and develop interventions to prevent them: accident theory and high-reliability
organizational theory.”232
As ADEs are defined as any injury occurring at the time a drug is used, whether or not it is
identified as a cause of the injury, the number of ADEs registered is probably considerably
larger than the number of correctly identified ADRs for the same medicine. The later requires
an active analysis of a cause-effect relationship, which may be difficult to establish. This can
be illustrated by the following examples:
In a “Pediatric Focused Safety Review: Diovan®”233 at an FDA Pediatric Advisory Committee
Meeting (June 23, 2009)234 on, amongst others, pediatric exclusivity studies, information on
two ADE reports concerning deaths were observed, but in both cases these were not ADRs.
The drug is an angiotensin II receptor blocker (ARB) and administered to treat high blood
pressure. The “Safety Assessment” of the two deaths was as follows:
“(South Africa) 1 year old female with HTN, complex congenital urologic anatomy,
recurrent UTI, on multiple medications
Died during OL [open label] phase after developing severe vomiting and diarrhea
Death ascribed to gastroenteritis
230 http://www.ema.europa.eu/docs/en_GB/document_library/Presentation/2013/03/WC500139871.pdf
231 http://www.fda.gov/Drugs/GuidanceComplianceRegulatoryInformation/Surveillance/AdverseDrugEffects/
232 Carleton, op. cit.
233 A product included in the later detailed analysis.
234
http://www.fda.gov/downloads/AdvisoryCommittees/CommitteesMeetingMaterials/PediatricAdvisoryCommittee/UCM168549

181
(India) 1 year old male with multiple congenital anomalies and comorbidities, including
single kidney, HTN and on multiple medications
Died from pneumonitis 11 days after discontinuation from OL [open label] study
participation due to hepatitis.”
In the same report, for the USA for the period 1996 to 2008 three deaths of children <17
years old are reported due to “transplacental exposure”, i.e. death of unborn babies, a
situation not susceptible to a PIP study. FDA excluded them from their final tabulation of
ADEs.
In an FDA clinical paediatric review of Anastrazole235 (also covered later by detailed
assessment) these statements on ADEs reported should be noted: “Three patients (10.7%)
experienced four serious adverse events [SAEs]... Two patients experienced femoral fractures
(one patient had two such events) and one had a right ovarian cyst. None of these SAEs was
judged related to the study treatment.” And: “A total of 24 (85.7%) patients experienced at
least one adverse event. Adverse events that occurred with a frequency >10% (i.e. in ≥3
patients) were upper respiratory tract infection (21.4%), cough (17.9%), pharyngitis (14.3%),
pyrexia (14.3%), arthralgia (10.7%), ear infection (10.7%), gastroenteritis (10.7%) and
nasopharyngitis (10.7%). With the possible exception of arthralgia, all the above-listed AEs
represent commonly encountered childhood illnesses and symptoms.”236
For the purpose of this study, data on ADRs would be the correct reference base. Clinical
trials on a specific drug can help to improve labelling information to avoid ADRs, but they
will not allow to prospectively avoid ADEs not related to labelling advice. However, as no
(reliable) sources with representative data of ADRs related to the medicinal products under
investigation are available, we have to make do with ADE reports. This implies that in all
likelihood the data on ADEs used overestimate the potential impact a PIP may have on future
ADRs.
The basic elements of the modelling approach E.3
This section presents the modelling approach and its basic structure. The various variables
and their interpretation are discussed, followed by a summary table of the initial results
achieved.
An initial structuring of cost and benefit indicators allows conceptualizing in detail the
features of the cost-benefit analysis model. Such structuring as depicted below also exhibits
the data needs of the cost benefit analysis (CBA). The CBA model builds on the analysis
presented in previous chapters. The indicator development and model conceptualisation help
validating (i) availability of relevant data and access, and (ii) filling information and
knowledge gaps relevant for the exploratory CBA.
The CBA model of the economic impact of the Paediatric Regulation was developed foremost
as a conceptual tool, which can be used flexibly dependent on data availability, stakeholder
235 CLINICAL REVIEW of Anastrozole by Dragos Roman. FDA, September 5, 2007, p. 8; available at
http://www.fda.gov/downloads/Drugs/DevelopmentApproval Process/DevelopmentResources/ucm129540.pdf
236 Ibid., p. 55

182
perspective, and policy need. The model is populated with realistic data (1) to generate
meaningful results regarding overall impact on healthcare systems, and (2) to test if the
model is sufficiently robust.
In the following sections, we discuss the indicators and data relevant to costs and benefits of
the Regulation. Paediatric Regulation foresees a six-month extension of the supplementary
protection certificate (SPC)237 after completion of a paediatric investigation plan (PIP)238 and
upon receiving positive statement of compliance. In line with this extension period, initially
our reference for calculating costs and benefits will also be for a six-month time span, and
calculate (or estimate) all the variables required as input for populating the Cost-Benefit
Model. Of course, the period for which benefits may accumulate can be extended to for a
longer, e.g. 10 years in order to gross-up the results.
In the current study, we aim to evaluate the economic aspect of the Paediatric Regulation
and, in addition, effort was also made to include, to a lesser extent, aspects of social/societal
benefits.
Measuring the prevalence of adverse drug events in Europe E.3.1
Research indicates that, depending on the country and the period, between 23% and 50% of
the medicines prescribed for children were not tested for use in the specific age group (off-
label use) and that only a limited number of medicinal products was developed specifically
with children in mind. This absence of specifically tested products often leaves doctors with
no alternative but to use products ‘off-label’ with the associated higher risks of inefficacy or
adverse reactions.239
The incidence of an ADE relates to a specific child undergoing a therapeutic intervention with
the medicine in question. For this study, it is termed a treatment episode. Consequently, in
order to approach the issue of ADEs, a first step in our overall calculations to populate the
Cost-Benefit Model is to arrive at a rough estimate of the number of paediatric treatments
resulting from the use of the medicinal product under investigation during the 6 month extra
SPC period. The starting point is the overall wholesale revenue obtained by the marketing
authorisation holder (industry) for the medicinal product as identified in relation to the 6
months SPC extension, plus quantity information on the drugs involved (like number of
tablets to which the revenue relates).240
Depending on the medicinal drug, the average duration of a treatment episode can vary
greatly. For example, a medicinal product, which is prescribed for a chronic disease, needs to
be taken by the patient during a prolonged period, maybe even during its remaining lifetime.
237 http://ec.europa.eu/health/sites/health/files/files/paediatrics/2012-09_pediatric_report-annex1-2_en.pdf, Annex II
238 Ibidem, p. L 378/2. A PIP “is the document upon which the development and authorisation of medicinal products for the
paediatric population should be based. The paediatric investigation plan should include details of the timing and the measures
proposed to demonstrate the quality, safety and efficacy of the medicinal product in the paediatric population. Since the
paediatric population is in fact composed of a number of population subsets, the paediatric investigation plan should specify
which population subsets need to be studied, by what means and by when.” And in Art. 2. 2): “‘paediatric investigation plan’
means a research and development programme aimed at ensuring that the necessary data are generated determining the
conditions in which a medicinal product may be authorised to treat the paediatric population”
239 SANTE/2015/D5/023, p. 1
240 These calculations are based on wholesale list prices. In reality, depending on the context, the price paid may vary, probably it
is somewhat lower. On the other hand, it is known that not all paid for and dispensed medications are indeed taken by patients.

183
The treatment of infectious diseases like influenza, on the other hand, last on average
between five and ten days usually. Therefore, the average duration is an important variable in
the CBA model. Based on the typical dosage information found in the patient information
leaflet and in combination with information about the typical duration of the treatment, the
average number of a medicine’s units (tablets, drops, puffs...) per episode was derived. This
information was then discussed with an experienced pharmacist and corroborated or
adjusted. Dividing the quantity information by the number of units per episode, the total
number of treatment episodes was calculated.
For example, Drug B is used to treat migraine headache. If the first pill does not help, the
patient should be given another one at least two hours later, but not more than three in 24
hours. For children, however, a maximum dose of 1 pill per day is proposed. Therefore, we
assume that on average one migraine episode requires only 1.5 pills, based on the observation
that it seems that often the package size is 2 pills, and that some children will take 2 pills over
2 days.
For estimating the share of treatment episodes relating to paediatrics only, the cases of
reported ADRs in the EudraVigilance database are taken. Data is provided there by national
medicines agencies, physicians, patients and others more or less in relation to the actual
distribution of therapeutic interventions – the intake of the prescribed medicine – across the
whole population. The number of ADE reports for babies and children up to the age of 17
(due to fixed categorisation in the database) are represented as share of all reports – the
figure used in our calculations. Because not all reports provide age information, this figure is
a lower estimate, because all reports with no age reference are counted by us as reports for
adults. These data were, as far as possible, checked against and corroborated by FDA data. An
example may illustrate this:
In its “Pediatric Focused Safety Review” of Singulair (active ingredient: montelukast
sodium) the USA FDA reported these figures on prescriptions for montelukast by patient
age.241 About 38% of all patients were below the age of 17.
When checking against the ADE reports data as published by EMA,242 we obtain very similar
percentage data concerning “the number of individual cases identified in EudraVigilance for
Montelukast”: it is “7,606 (up to June 2016)”. The reported numbers of individual cases by
age group are presented in the table below.
Table 45 ADE reports by age group
Age Group Cases %
Not specified 1,349 17.7%
241 Kalra, D. Gatti J. Pediatric Postmarketing Pharmacovigilance and Drug Utilization Review: Singulair (montelukast). 2
September 2014. Department of Health and Human Services Public Health Service Food and Drug Administration Center for
Drug Evaluation and Research Office of Surveillance and Epidemiology
http://www.fda.gov/downloads/AdvisoryCommittees/CommitteesMeetingMaterials/PediatricAdvisoryCommittee/UCM414065
242 https://bi.ema.europa.eu/analyticsSOAP/saw.dll?PortalPages. http://www.adrreports.eu/en/search.html

184
Age Group Cases %
0-1 month 51 0.7%
2 months – 2 years 416 5.5%
3-11 years 1,789 23.5%
12-17 years 585 7.7%
18-64 years 2,579 33.9%
65-85 years 776 10.2%
More than 85 years 61 0.8%
Total 7,606 100.0%
This yields 37.4% of all reports which can be definitely allocated to below 18-year-old
patients. From this we deduce that similarly in Europe about 38% of all treatment episodes
relate to patients below the age of 18 years. The handling of these variables in our model is
summarised in the table below.
Table 46 Summary of ADE related variables used in the CBA model
Indicator name Number of paediatric treatments resulting from the use of a medicinal product during the 6-month
SPC extension
Variables Medicinal product revenues during 6 months SPC extension (€)
Average amount of units of the medicinal product per episode (tablets, drops, puffs...)
Average price per one unit of the medicinal product (€)
Share of treatments with the medicinal product relating to paediatrics only (%)
Formulae Revenues / (Dosage per episode * Average price per unit dose) * Share relating to paediatrics
Example Drug A is used to treat chronic respiratory diseases such as asthma. The average dosage per episode
is one tablet daily, every day. For the six-month observation period in this assessment, this
amounts to approx. 182 pills. With the average market price of the product and the product
revenues for the six-month period known (data available for eight EU countries), the total number
of episodes is calculated to be 430,000. With about 38% of all reported ADR cases occurring in the
population under 17, the share of treatments relating to paediatrics is estimated to be approx.
161,800 treatment episodes.
In a further step, we arrive at an estimate of how many ADEs may have resulted from these
episodes. Usually, no detailed data on this are available from European sources. However,

185
FDA indirectly reports such data, eg as can be illustrated for Singulair (active ingredient:
montelukast sodium).
As noted above, during the period March 26, 2012- September 26, 2013 FDA registered
8,798,502 patients “receiving dispensed prescriptions for Montelukast”.243 244 During the
same period, 1,148 reports on adverse events were received for adults (17 years and older),
and 731 for children:
Note that the US/FDA data use as a comparator the “Nationally Estimated Number of
Patients that Received A Dispensed (...) Prescription From U. S. Outpatient Retail
Pharmacies, Stratified by Age.” (Source: IMS Vector One®: Total Patient Tracker (TPT))245
This implies that independent of the number of treatment episodes an individual patient is
counted only once.246 Compared to our ‘treatment episode’ approach, using such data will
lead to some overestimation of the prevalence of ADEs because a single patient may
encounter some to even many such episodes. This implies an overestimation of the actual
number of ADEs when applying a treatment episode approach.
A detailed analysis then led to the following results for children with respect to the reliability
of these reports, as presented in Figure 44. In summary, for the overall 3,307,328
dispensations for patients below the age of 17, overall 548 “serious pediatric cases” were
reported, of which 140 concern “serious pediatric reports (including death, life-threatening,
hospitalization or disability)”, including “4 deaths”.247
243 Erica D. Radden. Pediatric Focused Safety Review: Singulair (montelukast sodium). Pediatric Advisory Committee Meeting
September 23, 2014, Office of New Drugs, Center for Drug Evaluation and Research, Food and Drug Administration.
http://www.fda.gov/downloads/AdvisoryCommittees/CommitteesMeetingMaterials/PediatricAdvisoryCommittee/UCM417346
244 This does not imply that all prescribed and dispensed medicines were indeed taken. It is known that up to 40% and more of
prescribed medicines are not picked up, and that of the dispensed ones 25% and more are not taken by patients after reading the
drug information provided. The scientific institute of the large German statutory health insurance AOK, in its report „Zu Risiken
und Nebenwirkungen: Lesen Sie die Packungsbeilage?“ (by Nink, Katrin / Schröder, Helmut (2005). Wissenschaftliches Institut
der AOK -WIdO (ed.), WIdO-Materialien Bd. 53, Bonn) estimated this value, based on representative interviews with patients, at
around 28% (p. 56). See also Sarah Almanie (2015). ECONOMIC IMPACT OF WASTE IN PRESCRIBING, DISPENSING, AND
MEDICATION CONSUMPTION IN THE UNITED STATES. Virginia Commonwealth University thesis, VCU Scholars Compass:
“The rate of abandoned prescriptions also had a wide range in the literature (from 3.27% to 28.3%).”
245 Donna L. Snyder. Slides for “Pediatric Focused Safety Review: ... Drug B benzoate.” Pediatric Advisory Committee Meeting,
April 21, 2014, FDA
246 Note however: “Because of patients aging during the study period (“the cohort effect”), patients may be counted more than
once in the individual age categories. For this reason, summing across years is not advisable and will result in overestimates of
patient counts.” Ibidem.
247 When neither FDA review or other reports nor a detailed web search delivered any indication of death from ADEs (or ADRs),
we assumed that such events were absent.

186
Figure 44 FDA case selection of serious paediatric cases
Source: based on Donna L. Snyder. Slides for “Pediatric Focused Safety Review: ... Rizatriptan benzoate.”
Pediatric Advisory Committee Meeting, April 21, 2014, FDA
Overall, this yields an estimated 0.0166% ADRs per episode. Translating this to the 161,800
episodes calculated for EU countries for the 6 month SPC period, we obtain a rough estimate
of 27 ADRs for the EU countries included in the analysis.
In cases where no FDA data were available, a complementary approach based on the
EudraVigilance data base reports248 was performed. To illustrate this again for Drug A, we
take the total number of ADE reports for children below the age of 18 in EudraVigilance,
which is 2,844. Then, based on the assumption that this figure covers at least 10 years249, we
set it into relation to the 6 month period under consideration (i.e. we divide it by 20); this
renders us a value of 142. Next, noting that only 23.5 % of all reports in EudraVigilance relate
to the European Economic Area (EEA), we multiply it by this figure, which gives us 33.4
ADEs. Comparing this with the 34.3 ADEs calculated for our period and for Europe based on
the FDA data leads to an almost identical result. Although this is not a proof that this
approach is the most appropriate, we compared the results also against other medicinal
products and find a surprisingly close approximation. Furthermore, the surprising
conformity between FDA and EMA data should suggest that across the developed countries
248 On the quality of these data, EMA on ist website http://www.adrreports.eu/en/data_quality.html reports as follows: „Data
quality - The European Medicines Agency is responsible for hosting and maintaining EudraVigilance, a system designed for
collecting reports of suspected side effects, used for evaluating the benefits and risks of medicines during their development and
monitoring their safety following their authorisation in the European Economic Area (EEA). - The data displayed on this website
through the web reports are submitted electronically to EudraVigilance by national medicines regulatory authorities and by
marketing-authorisation holders (pharmaceutical companies). As a result, the Agency has limited control over the completeness
or accuracy of the information available.
The Agency does carry out quality reviews in EudraVigilance, which includes identifying duplicate reports, performing the
coding of the reported medicines and reported active substances, and providing feedback on the quality of information sent by
national medicines regulatory agencies and marketing-authorisation holders.
249 In reality, they will usually cover several more years as they report over the whole life cycle of a medicine, but such data is not
available.

187
reporting of ADEs is relatively reliable and consistent. The handling of this variable and
calculation in our model is summarised in Table 47.
Table 47 Summary of ADR variables used in the CBA model
Indicator name Number of paediatric ADRs per 6 month SPC extension
Variables Number of paediatric episodes
Number of paediatric ADRs as % of episodes
Number of paediatric ADRs
Number of reported serious ADR cases
Formulae Number of serious paediatric cases/dispensations for paediatric population * number of paediatric
episodes
Example For Drug B, from 3,307,328 dispensations for patients below the age of 17, overall 548 serious
paediatric cases were reported, This amounts to 0.0166% ADRs per episode. Divided by the 161,800
episodes calculated for the 6 month SPC period, the result is 27 ADRs for the EU countries included
in the analysis.
Benefits from avoided mortalities E.3.2
Wherever any information on very serious ADRs resulting in death was available, the
respective figures were used for our calculations. To refer to the earlier example of
Montelukast, FDA reported a total of 4 paediatric serious case reports concerning death as
resulting from the 3,307,328 dispensations for patients below the age of 17. Relating this to
all serious ADRs of 548, this implies that here 0.73% of all validated reports concern a death
of a child; relating this to the 3,307,328 dispensations for patients below the age of 17, the
death ratio is 0.00012%. For our European values, this implies a hypothetical absolute
number of deaths of 0.196.
As no empirical data are available on the impact of a PIP on the reduction of ADRs, we
assume in all instances that the value is a reduction by 20%. This seems to be a relatively high
value which is based on the perhaps quite optimistic assessment found in the literature, that
20% of all ADRs can be avoided.250 Considering the many reasons causing an ADE, like
prescription mistakes, wrong dispensations, contraindications with multi-morbid patients
taking a variety of drugs, inadequate patient education etc., it becomes obvious that many
ADE cases are not related to unknown or wrong dosage or similar causes.251 In our example,
the hypothetical death number would be reduced to 0.157.
Next, the number of years a child would have lived after avoidance of a death are estimated
(average years lost per death). Assuming that the average age of such a child would be 9,
250 Rottenkolber D, Schmiedl S, Rottenkolber M, et al. (2011) Adverse drug reactions in Germany: direct costs of internal
medicine hospitalizations. Pharmacoepidemiol Drug Saf 2011;20:626–34.
251 Cf. Smyth, RMD et al. (2012). Adverse drug reactions in children – A systematic review. PLOS One, 7/3, e24061

188
which is the average of 0 - 18 years, and that the average life expectancy at birth for a
European citizen is 81 (2014),252 we arrive at an estimate of the years of life gained of 72.
To attach an economic value to a statistical life (VSL) per year is an elusive exercise. As an
average person contributes through taxes and other payments as much as it consumes in
terms of uprising and education, security, traffic and public utility infrastructure usage,
health and social care, social security and old-age receipts etc. One may conclude that
contributions and consumptions are on average equal and hence that no value (VSL) should
be attached from an economic point of view.
Nevertheless, various methods and values have been discussed in the literature,253 and WHO
guidelines suggest that countries should aim to spend between one and three times their
Gross Domestic Product (GDP) per capita for one of their citizens per QALY gained from a
health-related treatment. This puts the value of a life in Luxembourg between $111,162 –
$333,486, the value in Mexico between $10,307 – $30,921 etc.254 For our purposes, we use
€50,000 as the value of a statistical life per year, because it is an “international standard
most private and government-run health insurance plans worldwide use to determine
whether to cover a new medical procedure.”255
The value for avoidable mortalities is again assumed to be 20%.
Table 48 Summary of value for avoidable mortality variables used in the CBA model
Indicator name Avoided mortalities
Variables Number of reported serious ADEs
Number of reported deaths from ADEs
Total mortalities from ADRs for the period
Avoidable mortalities as % of ADR cases
VSL (Value of a statistical life) per year
Average years lost per death
Formulae (Number of reported deaths from ADR cases/Number of reported serious ADR cases (total
mortalities from ADR) * number of paediatric cases) * Avoidable mortalities as % of ADR cases *
VSL (Value of a statistical life) per year * Average years lost per death
252 http://ec.europa.eu/eurostat/statistics-explained/index.php/Mortality_and_life_expectancy_statistics
253 See Adlard, N., Kinghorn, P., & Frew, E. (2014). Is the UK NICE “Reference Case” influencing the practice of pediatric
quality-adjusted life-year measurement within economic evaluations? Value in Health, 17(4), 454-461; Molinari, N. A. M.,
Ortega-Sanchez, I. R., Messonnier, M. L., Thompson, W. W., Wortley, P. M., Weintraub, E., & Bridges, C. B. (2007). The annual
impact of seasonal influenza in the US: measuring disease burden and costs. Vaccine, 25(27), 5086-5096; Alex Mayyasi (2016).
How Children Went from Worthless to Priceless. http://priceonomics.com/the-price-of-a-child/ and the literature mentioned
in these references.
254 Ashenfelter, O. (2006). Measuring the value of a statistical life: problems and prospects. The Economic Journal, 116(510),
C10-C23
255 https://en.wikipedia.org/wiki/Value_of_life

189
Benefits from hospitalisation avoided E.3.3
To estimate the percentage of cases in need of hospitalisation, we used data from FDA
paediatric reviews when available. For other medicines, we had to apply values derived from
the literature for ADEs in general. Smyth et al. report that across the outpatient children
population 97.1% of ADE did only require ambulatory treatment.256 In line with this, we
assert that only 3% of all cases required hospitalisation.
The mean length of stay in days is taken from data of HSCI which report a mean stay of 8.6
days for ADEs.257 This is supported by Rottenkolber et al., who estimate the average inpatient
length-of-stay due to ADRs to be 9.3 days.258 It should be noted that looking at more recent
data on e.g. the cost of a ”Healthcare Resource Group (HRG)” event (or the cost of a “spell” –
the “period from admission to discharge within a single provider”) for various paediatric care
categories in England, the mean length of stay is probably considerably lower, at least in
some countries.259
Mean cost per bed day are set at around €576, based on WHO data (mean of 8 EU high and
low income countries in WHO-report 2008, inflated to 2015 by the ECB (European Central
Bank) inflation index for hospital care. Comparing this value with other data, it seems a
reasonable estimate.260
Total hospitalisation costs are then calculated as 3% of all serious ADEs, each case requiring
on average 9 days of hospitalisation at a daily cost of €576.
The value for avoidable hospitalisations is again set at 20%.
Table 49 Summary of avoidable hospitalisation variables used in the CBA model
Indicator name Avoidable hospitalisation
Variables % of cases in need of hospitalisation
Mean length of stay in days
Mean cost per bed day
Hospitalisation costs
Avoidable hospitalisation (Rottenkolber et al. 2011 and estimates)
Formulae Number of paediatric ADRs * % of cases requiring hospitalisation*mean length of stay in
days*mean cost per bed day (hospitalisation costs)*% of avoidable hospitalisations
Example Citing the narrative above, the 3% of all serious ADEs in need of hospitalisation, is multiplied by the
number of ADR cases as calculated earlier. This is multiplied by the mean length of stay of an
average of 9 days (as taken from data of the NHS England HSCI, supported by Rottenkolber et al.
for Germany), and multiply that with a mean cost per bed day as set at €576. Avoidable
hospitalisation cost is estimated at 20% of all hospitalisations.
256 Smyth, RMD et al. (2012). Op. cit
257 Health and Social Care Institute (HSCI).
258 Rottenkolber et al., op. cit.
259 See NHS reference costs 2013 to 2014 at: https://www.gov.uk/government/publications/nhs-reference-costs-2013-to-2014
260 Department of Health UK (2014). National schedule of references costs 2012–13 for NHS trusts and NHS foundation trusts,
London.

190
Benefits from other serious Adverse Drug Events avoided E.3.4
To account for other serious adverse drug events avoidable like those resulting in life-
threatening events, disability, or permanent damage we introduce a separate benefits
category. As seen earlier for Montelukast (FDA note on “Case selection of Serious Pediatric
Cases”), in some instances, where such events occurred, FDA reports specifically on such
reports received. In the Montelukast instance, 140 “pediatric serious cases” are reported, of
which 4 relate to death, and probably most – if not all – others to hospitalisation, for which
we account in a separate category. But to also take into account the possibility of a certain
number of other serious cases relating to life-threatening events, disability, or permanent
damage, we assume that 5% of these “pediatric serious cases” may relate to this. 5% of 136
(140 minus 4 death reported) leads to around 7 of such other serious adverse drug events.
For all other medicinal products, where no extra paediatric serious cases are reported for
death, inpatient hospitalisation, etc. we use the same percentage. We assume that this more
than sufficiently accounts for the probability that such cases may occur.
In order to calculate the cost of such a case, we furthermore assume that it will result in a
20% reduction in quality of life (QoL) over the rest of life (for 72 years), or 20% per value of a
statistical life year (0.2 x 72 x 50,000). Here we also calculate the benefit as 20 % of such
cases avoided.
Table 50 Summary of avoided reduced quality of life variables used in the CBA model
Indicator name Avoided reduced quality of life/other serious adverse drug events avoided
Variables Prevalence of other serious adverse drug experience
Prevalence of other serious adverse drug experience (absolute)
Reduced quality of life
Formulae Number of paediatric ADRs * % of prevalence of other serious adverse drug experience * value of a
statistical life per year * average years lost per death * reduced quality of life
Benefits from ambulatory services/outpatient treatment avoided E.3.5
The percentage of cases treated in outpatient care facilities is calculated as the overall
number of cases minus those accounted for by death and by hospitalisation. For the mean
costs related to visits to primary care physicians, such as GPs, an average cost value of €50 is
used.
In addition, we assert that a certain percentage of such cases will attend or require emergency
room attendance. No data on this are available for different countries; therefore, we use our
own estimate of 20% of such cases emerging.
For the mean cost of emergency room attendance a value of €400 is applied, based again on
our own estimate. Again, benefits in terms of avoidable outpatient treatments is set at 20% of
overall costs calculated for this category.

191
Table 51 Summary of avoided outpatient treatment variables used in the CBA model
Indicator name Avoided outpatient treatment
Variables % of cases treated in outpatient care facilities
Mean costs related to visits to primary care physicians, such as GPs
Share of ADR cases requiring emergency room attendance
Mean costs of emergency room attendance
Outpatient treatment total
Avoidable outpatient treatment
Formulae (number of paediatric ADRs*% of cases treated in outpatient care facilities*mean costs related to
visits to primary care physicians, such as GPs)+(share of ADR cases requiring emergency room
attendance*mean costs of emergency room attendance)*avoidable outpatient treatment
Benefits from informal care services avoided E.3.6
To estimate the (social) costs of informal care services required for all more serious cases
requiring hospitalisation, we assert that 90% of inpatient cases require also informal care
services. Based on the estimate for hospital days mentioned above, it is assumed that in each
such case on average 9 days are lost. As the € value of the informal carer gross salary per year
we insert the average value for Germany, which is towards the higher end across the
countries covered by the 8 medicines. The benefits are estimated as 20% saved from the cost
of the total lost time by informal carers.
Table 52 Summary of avoided lost time by informal care giver variables used in the CBA model
Indicator name Avoided lost time by informal carers
Variables % of inpatient cases requiring informal care
Average days lost
Informal carer gross salary per year
Total lost time
Formulae (Number of paediatric ADRs * % of cases requiring hospitalisation*% of inpatient cases requiring
informal care*average days lost*informal carer gross annual salary/12 months/ 19,24 average
working days per month)*% of avoidable hospitalisations
Additional proxy benefit for better treatment per paediatric episode E.3.7
The value for so called additional benefits per paediatric episodes serves as a proxy for
missed benefits deriving potentially from better treatment but not captured by any of the
other benefits variables included in the model. This value is by nature difficult to monetarise
precisely and is prone to over- or underestimation.
Consequently, to account for any other benefits not covered by the benefit categories
explored so far, we impute a value of €10 for each of the paediatric episodes.

192
Table 53 Summary of additional benefit per paediatric episode variables used in the CBA model
Indicator name Additional benefit per paediatric episode
Variables proxy value for missed benefits from better treatment
Formulae Number of paediatric episodes* proxy value for missed benefits from better treatment
Intermediary results from the exploratory cost-benefit assessment E.4
Preliminary observations E.4.1
The estimated overall socio-economic benefits thus comprise of:
Economic/financial benefits in cash, i.e. those which indeed result in cash savings to be
expected by the statutory health insurances and national/regional national health
services across Europe, depending on the type of health system financing approach in the
respective countries
Intangible/societal benefits
These benefits are contrasted with the overall cash costs to national/regional healthcare
systems respectively the public (statutory) health insurances, the monopoly rents accruing to
the stakeholders benefitting from the 6-month SPC. These stakeholders are not only the
marketing authorisation holders (“industry”), but also at least in some health systems also
wholesalers, pharmacies and the government through levying sales taxes.
From these data, we calculate the respective benefit/cost ratios for the 6-month extension
period.
This result is then simply extrapolated towards a ten-year period by multiplying the net
benefits for these initial 6 months by 20, and setting it in relation to the overall costs
(monopoly rent) calculated for the extra 6-month SPC. When estimating the cost to Third-
Party Payers like health insurances, we have to deduct the co-payments charged to patients.
We abstain from discounting future benefits, because given the present capital market
environment for more and more (public) debts virtually no interest is charged.261
Therapeutic characteristics of medicinal products covered by the detailed assessment E.4.2
Seven of the eight medicinal products covered by the detailed analysis in WP 2, and the data
of which are used in our benefit-cost assessment for detailed assessment are for treating a
chronic disease. The other medicinal product for treating an acute disease. Altogether, the
products have to be taken by the patients:
Daily (six medicines)
Once (at most twice within two days; one medicine for an acute disease)
261 http://www.bbc.com/news/business-32284393: “Interest rates are now negative, below zero, for a growing number of
borrowers, mainly in the financial markets. It means in effect they are being paid to borrow someone else's money.”

193
Once (1 medicine; the infusion may be administered again at a later date)
They cover a wide spectrum of diseases, whereby we mention here the main (adult)
indication for the respective medicine:
Asthma
Cancer (breast cancer)
Cardiology (high blood pressure; 2 medicines)
Eye (Ocular hypertension and open-angle glaucoma)
HIV
Migraine
Osteoporosis.
Of these 8 medicines,
5 are used on-label for certain age groups of children
3 are still used in children262 although PIP result were negative.
In summary, these medicinal products cover a wide and diverse spectrum of medicinal
products, which have successfully finalised a PIP.
Paediatric episodes and adverse events E.4.3
This section presents a summary and detailed data on paediatric treatment episodes and
estimates of related ADEs. All values are calculated for the 6-month SPC period.
Mathematically, this leads to sometimes rather “uneven” numbers, whereas in reality, of
course, all events come in discrete numbers.
Table 54 provides a summary overview of the percentage of all episodes, related to paediatric
treatment interventions. For four of the drugs this value is below 1%, and for one of them
even 0.09%. Remembering that for 3 medicines no on-label information has been
forthcoming, this is not surprising. Only one drug has a very sizeable paediatric share of
about 38% compared to the overall number of episodes, i.e. including treatment of adult
patients.
Table 54 Percentage of all episodes related to paediatrics
% of episodes related to paediatrics Absolute number of drugs Individual % values
< 1% 4 0.09%; 0.21%; 0.33%; 0.83%
1% - < 5% 1 1.48%
5 - <10% 2 7.39%; 9.52%
10% + 1 37.6%
262 ADE reports available for all drugs from both FDA and EMA for children and adults separately

194
Closely related to the above results is the absolute number of paediatric episodes we
estimated for the 6-month period. For two medicines, this value is below 1,000, for three
below 5,000. And only two achieve more than 100,000 – the highest value is 405,000. This
last value refers to the medicine for an acute disease, Migraine. The other medicine of this
group is for treating Asthma.
Table 55 Number of paediatric episodes (6 months)
Number of paediatric episodes Number of drugs Individual values
< 1,000 2 323; 770
1,000 - < 5,000 3 1,017; 3,209; 4,351
5,000 - <100,000 1 12,644
100,000 + 2 206,986; 405,096
Data on our estimate of serious paediatric ADE reports given as % of all paediatric episodes
are reported in Table 56. Except for the Osteoporosis medicine with 0.39% and the HIV
medicine with 0.41% of all episodes, the share for all other drugs is with below 0.04% (and as
low as 0.0002%) relatively to quite low. To account for likely underreporting, we multiplied
the number of ADEs entering our calculations by 2 (for death, which is regularly reported and
to some extend even over-reported – FDA and EMA mention double reporting in several
instances), and up to five for less serious events.
Table 56 Serious paediatric ADE reports as % of all paediatric episodes
Serious paediatric ADE reports as % of
all paediatric episodes Absolute number of drugs Individual % values
< 0.010% 2 0.00021; 0.005%
0.010% - < 0.025% 2 0.016; 0.017%
0.025% - <0.05% 2 0.032%; 0.034%
0.05% + 2 0.394; 0.414%
From these percentages, the following numbers of serious paediatric ADEs per period (6
months) were estimated263. Only for the drug with the largest proportion of paediatric
episodes, the Asthma medicine, this value is with 34 considerable. As already mentioned, in
our later calculations we apply considerably higher values to take account of possible
underreporting.
263 As already mentioned, these figures are derived from mathematical computations and therefore are not reported in integers.

195
Table 57 Number of serious paediatric ADEs (6 months)
Number of serious paediatric ADEs Number of drugs Individual values
< 1 3 0.17; 0.25; 0.87
1 - < 5 4 1.27; 1.47; 2.00; 4.22
5 - < 25 0
25 + 1 34.30
All of the above tables are derived from the detailed data as reported for each of the 8
medicines in the following overview table:
Table 58 Paediatric episodes and adverse events – detailed data for 8 medicines
Drug
identifica
tion
letter
Explanatory
note
Drug
E Drug H
Drug
F
Drug
A Drug C Drug B
Drug
G Drug I
Indicatio
n /
diagnosis
;
pharmac
eutical
dose
form;
xxxxx
xxxxx
Xxxxxx
xxxxxx
Xxxxx
xxxxxx
Xxxxx
xxxxx
Xxxxxxxx
xxxxxxxx
Xxxxxxx
xxxxxxx
Xxxxxx
xxxxxx
Xxxxxxx
xxxxxxxx
xxxxxxxx
xxxxxxxx
xxxxxxxx
xxxxxxxx
xxxxxxxx
% of
episodes
related to
paediatri
cs
EudraVigilance
data mirror the
actual
distribution of
therapeutic
interventions
across the
population. The
number of ADR
reports for
babies and
children up to
the age of 17 are
calculated as
share of all
reports on
originator
medicine.
0.21% 0.33% 1.48% 37.59
% 9.52% 7.39% 0.83% 0.09%
Paediatri
c
episodes
3,209 770 4,351 206,98
6 1,017 405,096 12,644 323

196
Drug
identifica
tion
letter
Explanatory
note
Drug
E Drug H
Drug
F
Drug
A Drug C Drug B
Drug
G Drug I
Number
of
serious
paediatri
c ADE
reports
as % of
all
paediatri
c
episodes
per
period
Based on
paediatric review
reports by the
FDA where
available (for a
given period).
Complemented
by estimates
based on
EudraVigilance
data for a six-
month period
0.005
% 0.032% 0.034%
0.017
% 0.414%
0.00021
% 0.016% 0.394%
Number
of
serious
paediatri
c ADEs
No. of paediatric
episodes x % of
ADE episodes
related to
paediatrics x
0.01
0.17 0.25 1.47 34.30 4.22 0.87 2.00 1.27
Monopoly rents and net costs to health system payers E.4.4
Next, we briefly summarise the data on monopoly rents and net costs to health system payers
estimated as reported in Table 59 further below. Starting point are the pharmaceutical
industry (marketing authorisation holders) monopoly rents as calculated in Chapter 3. As
these data are based on wholesale prices, they do not reflect the true costs to health systems,
respectively the national/regional payers and the statutory health insurances – depending on
the national approach to financing of healthcare services.
Additional beneficiaries are pharma wholesalers, pharmacies as well the government (where
VAT or sales tax is levied on medicinal products), all of which may also participate in this
monopoly rent. Based on research by the German Ministry of Health, 2010264 it is estimated
that in Germany – the by far largest European market -, the monopoly rent to industry
accounts for only 75.5% (industry revenue from wholesalers) of overall monopoly rent. 4.5%
accrue to wholesalers, 4% to pharmacies, and 16% to the state from sales tax/VAT.
In some countries or regions, e.g. with NHS systems, no wholesalers may be involved, or in
others no sales tax may be levied on medicines. To account for this, we assume that on
average the monopoly rent to industry accounts for 87.5% of overall rent, i.e. 12.5% accrue to
other beneficiaries (half of the percentage accruing to them in Germany). 12.5% of 87.5% are
14.3% - this is the percentage value by which the monopoly rent estimated in Chapter 3 was
increased for our purposes.
264 http://www.bundesgesundheitsministerium.de/fileadmin/redaktion/pdf_misc/Infografiken-Arzneimittelpreise.pdf Data are
for March 2010.

197
To arrive at final overall costs to the “system”, this sum needs to be reduced by an estimate of
the (co-) payments charged to patients respectively their parents. A reasonable estimate of
these co-payments from patients is almost impossible to make due to the very wide variation
in the regulations in each of the countries concerned. Whereas e.g. in Germany no co-
payments are required for paediatric prescriptions, in some countries a fixed amount of
around or somewhat more than € 5 per prescription is mandatory. In others the co-payment
is not fixed but depends on the overall annual burden from prescription medicines, and this
may vary from patients who have to pay for the total price of the medicinal product to others
with a heavy burden of medical expenses who have to pay only a small percentage or even
nothing. Furthermore, the income situation of the family or the patient may also affect the
co-payment amount.
To account for this reduction in costs accruing to the final payer,265 we introduced the simple
assumption that for each (adult and paediatric) treatment episode the Third-Party Payer
receives a lump sum of €5. This allows us to arrive at a reasonable estimate for the overall net
cost to the healthcare system as reported in the below table on Monopoly rents and net costs
to health system payers.
As can be seen in Table 59, for these 8 medicines overall net extra cost for the 6-month
extension is estimated at €551m to health systems, or more than half a billion Euros. Of the
monopoly rent, €517 m accrue to industry, and €72.4 m to other stakeholders benefitting
(wholesalers, pharmacies, states). The co-payments by patients of €38.5 m are not accounted
for as extra costs, because we assume that they may have taken anyhow these or other
medicines for which similar co-payments would have to be paid.
Note that this does not hold for one medicinal product – drug F. Due to the low price per
treatment episode, the full cost of the monopoly rent is allocated solely to patients. Because
of the low number of pills per episode (usually one – at most 2 over two days - for a child per
treatment episode) and the low costs, our assumptions imply that Third-Party Payers do not
encounter extra costs because the full costs are covered by patient payments, i.e. in this case
patients will indeed pay fully for the extra monopoly rent. Of course, without the existence of
the monopoly rent, their payments would be considerably lower during the 6-month period.
Note that our assumptions cover, as an average, all countries where a product is marketed.
For a single country, like in Germany, also for this drug the statutory health insurances would
pay the extra cost rather than the patients, because for children no co-payments are due in
Germany.
265 Depending on the concrete situation of the specific medicinal product, the price per episode and the co-payment rules in the
respective country, this argument may not hold, because without the extra SPC patients nevertheless would have to make co-
payments of this – or a somewhat lower - amount. If this holds, the extra cash costs to health systems would be up to about 10%
more in the given scenario than reported in the table, and equal to “Total monopoly rent”.

198
Table 59 Monopoly rents and net costs to health system payers
Drug identification
letter Explanatory note Drug E Drug H Drug F Drug A Drug C Drug B Drug G Drug I Sum
Total benefits
paediatrics (I + II + III +
IV + V + VI)
44,448€ 25,880€ 150,420€ 4,938,687€ 316,847€ 4,113,994€ 271,897€ 95,591€ 9,957,764€
Cash cost - industry
monopoly rent - of SPC
extension
Wholesale based
industry revenue 146,496,778€ 31,183,348€ 105,217,160€ 58,121,640€ 9,355,013€ 14,105,120€ 113,220,733€ 39,548,178€ 517,247,970€
Cost - other
stakeholders' monopoly
rent - of SPC extension
Revenue accruing to
wholesalers, pharmacies,
government(s) (VATax)
- at an average 14% on
industry revenue
20,509,549€ 4,365,669€ 14,730,402€ 8,137,030€ 1,309,702€ 1,974,717€ 15,850,903€ 5,536,745€ 72,414,716€
Total monopoly rent Total monopoly rent to
all stakeholders 167,006,327€ 35,549,017€ 119,947,562€ 66,258,670€ 10,664,715€ 16,079,837€ 129,071,636€ 45,084,923€
589,662,686
€
Minus revenue from co-
payments of patients
Revenue to health
systems from co-
payments of patients;
Assumption of € 5 per
episode, varies greatly
across countries
7,529,141€ 1,171,257€ 1,469,912€ 2,753,208€ 53,440€ 16,079,837€ 7,616,872€ 1,832,860€ 38,506,528€
Net cash cost to
healthcare system
(statutory insurances or
NHS)
159,477,186€ 34,377,760€ 118,477,650€ 63,505,461€ 10,611,275€ 0 121,454,764€ 43,252,063€ 551,156,158€

199
Cash benefits and financial return to health system payers E.4.5
Table 60 summarises the estimates relating to the potential avoidance of ADRs and the cash
savings resulting there from for health system payers. This concerns hospital stay and
outpatient encounters (emergency room visits and ambulatory services) avoided, all of which
would have direct cost implications.266 Except in the case of the Migraine medicine, the
resulting values are negligible, particularly in view of the monopoly rents reported above, and
the results would remain negligible even if we increased the number of ADEs included in the
calculations by 10 (or even more). Such a figure would imply that only 2 in 100 ADEs are
reported on average, i.e. a rate of underreporting of 50. For the migraine product no benefit-
cost ratio is given, because all monopoly rent cost accrue to patients.
Table 60 Cash benefits and financial return to health system payers
Drug
identification
letter
Drug E Drug H Drug F Drug A Drug C Drug B Drug G Drug I Sum
Cash benefits
(avoidable hospital
and out-patient
[ambulatory] costs)
97 € 148 € 870 € 31,000
€ 2,495 € 513 € 1,183 € 751 € 37,056 €
Financial (cash)
benefit-cost ratio for
a 6-month period
0.000 0.000 0.000 0.000 0.000 - 0.000 0.000 0.000
Cumulative
financial (cash)
benefit-cost ratio
after 10 years
0.000 0.000 0.000 0.010 0.005 - 0.000 0.000 0.001
The implications of these estimates and calculations are that, based on the assumptions made
and the exploratory calculations undertaken, the cash costs of more than half a billion Euro
are not to any noticeable extent compensated for by equivalent cash savings. This holds for
all medicinal products covered by our analysis. Whereas we estimated more than half a
billion Euro in monopoly income to various stakeholders, the estimated cash savings are with
€37,000 for the 6-month period, or €741,000 for a ten-year period, negligible. The reasons
for this are twofold: the very low use of most products for paediatric populations – with the
exception of drug D (and drugs E and F to a lesser extent), and the usually very low number
of ADEs. Even after 10 years, the estimated cumulative financial benefit-cost ratio across all 8
drugs is with 0.00134 virtually zero. This translates into a financial rate of return of almost
minus 100%.267
266 Note that this assumption implies that marginal cost is equal to average cost. In a fee-for-service system this will hold,
whereas in a national or regional public health service system this may not be the case.
267 In financial or capital markets, this would imply total loss of investment.

200
Intangible benefits and societal return E.4.6
When taking non-cash (intangible) benefits into consideration, the picture changes
somewhat. Here we subsume benefits expected from improved actual treatment of children,
which result in:
Reduced mortality
Improved quality of life (QoL) experiences due to long-term disabilities
Time saved by informal carers
Furthermore, in order to account for further benefits not accounted anywhere else we add a
hypothetical benefit of € 10 per treatment episode.
The results are presented in the following table:

201
Table 61 Intangible benefits and societal return
Drug
identification
letter
Drug E Drug H Drug F Drug A Drug C Drug B Drug G Drug I Sum
Non-cash
(intangible) benefits
(avoidable mortality
and disabilities,
improved QoL,
informal carers costs
avoided, plus
additional benefits
per episode) (I + IV
+ V + VI)
44,351 € 25,732
€
149,550
€
4,907,6
88 €
314,352
€
4,113,48
1 €
270,714
€
94,839
€
9,920,707
€
Intangible (non-
cash) benefit-cost
ratio for a 6-month
period
0.000 0.001 0.001 0.077 0.030 - 0.002 0.002 0.018
Cumulative
intangible benefit-
cost ratio after 10
years
0.006 0.015 0.025 1.546 0.592 - 0.045 0.044 0.360
For four medicinal products with very few paediatric treatment episodes compared to all
treatment episodes (the values are 0.21% for drug E, 0.33% for drug H, 1.5% for drug F and
0.09% for drug I), the benefits estimated are also here very marginal with less than € 100,00
for the 6-month period. Also the 6-month and 10-year benefit-cost ratios are very marginal to
negligible. A ratio value of 1,000 would signal a rate of return of 0.00%, i.e. they all have very
high negative rates of return for this short period.
For the product with the largest share of paediatric treatment episodes – drug A with 38% -
the situation is very different. This asthma drug has an estimated intangible benefit/cash cost
ratio of 0.077 for 6 months. For ten years, we obtain a benefit/cost ratio of 1.546, or a
positive rate of return of 55%.
The next highest values are estimated for drug C, the HIV medicine. Its comparable values
are 9.5% for the share of paediatric treatment episodes, 0.030 for the 6-month benefit-cost
ratio, and for the 10-year period a ratio of 0.592 or a negative rate of return of 41% is
estimated.
Aggregating the data for the seven medicinal products included into the above benefit-cost
calculations, an overall 6-month benefit-cost ratio of 0.018 is estimated, and for the 10 year
period a ratio of 0.36 or a negative rate of return of 64%. In other words, whereas the extra

202
cost due to the monopoly rent are estimated at more than half a billion Euro, the overall
intangible benefits estimated sum up to almost € 200m after 10 years.
Looking also at the Migraine drug B, for which no extra costs to the health system arose, we
can nevertheless compare the estimated overall monopoly rent of €16m with the estimated
non-cash benefits. For the six-month period, we estimate intangible benefits of around €4m,
which implies that already after two years a hypothetical break-even point would be reached.
Over a 10-year period very substantial benefits of around €80m would accumulate, implying
a hypothetical benefit-cost ratio of 5 ((€4 [for 6 months] x 20 [six months periods])/€16), or
a rate of return of 400%. Adding these €80m to the €191m estimated for the seven other
products, overall benefits of €199m for 10 years are estimated, to be contrasted with costs of
more than half a billion Euros.
Summary data and results of the exploratory cost-benefit E.5
assessment
Estimating the overall benefit/cost ratio per medicinal product E.5.1
Adding up cash and non-cash benefits as estimated above, and setting them into a ratio to the
estimated net cash cost resulting from the monopoly rent for the extra 6-month SPCs to
health systems, the following values are obtained:
Table 62 Overall benefit/cost ratio per medicinal product
Drug
identificatio
n letter
Drug E Drug H Drug F Drug A Drug C Drug B Drug G Drug I All drugs
Non-cash
(intangible)
benefits
(avoidable
mortality,
reduced QoL,
informal
carers costs +
add. benefits
per episode)
(I + IV + V +
VI)
44,448 € 25,880 € 150,420
€
4,938,68
8€
316,847
€
4,113,99
4 €
271,897
€ 95,590 € 9,957,763€
Total socio-
economic
benefit-cost
ratio for a 6-
month period
0.000 0.00075 0.001 0.078 0.030 0.000 0.002 0.002 0.018
Total
cumulative
benefit-cost
ratio for 1 0
years
0.006 0.01506 0.025 1.555 0.597 0.000 0.045 0.044 0.361

203
The highest value for the 6-month period is estimated for drug A with 0.078, followed by an
already very low value of 0.016 for drug C. It may be remembered that for drug A about 38%
of all treatment episodes relate to paediatric use, and that drug C boosts the next highest
value with almost 10%. For the five other medicines, the overall benefit-cost ratio is
negligible and more or less zero.
When calculating the same values for a ten-year period, drug A is the only drug which
achieves a positive benefit-cost ratio of 1.555 or 55.5% rate of societal return. Next in line is
drug C with 0.31 or minus 69%. All other drugs show also for this long-term value negligible
results. Taking also into account drug B – a drug for which we did not estimate extra
monopoly cost to health systems because all extra costs are covered by patients’ co-payments
– then this would achieve the by far highest rate of return of more than 400% (as mentioned
above in section 4.3.6).
Extrapolating the cumulative result across the seven drugs over twenty 6-month periods or
10 years in a linear fashion without discounting delivers an overall cumulative benefit-cost
ratio of only 0.35 or about minus 65%. Depending on expectations about the future, this
result may change considerably:
If discounting is introduced, i.e. in case during coming years interest rates for public
organisations will rise again above 1% or 2%, this rate will decrease considerably, because
all costs are experienced “now”, whereas estimated benefits will accumulate only over an
extended period of unknown length.
If we assume that over time new treatment regimens are introduced, new drugs enter the
market, etc., then benefits will decrease to some or even a greater extent, and again the
benefit-cost ratio will decrease even further.
On the other hand, in case it is assumed that the knowledge about the new insights
gained from the PIPs and on-label use will diffuse more widely and lead to a further
increase in on-label use for some of the medicines, then the benefit-cost ratio may even
somewhat increase with time.
Comprehensive, detailed data per medicinal product E.5.2
A comprehensive overview of the results of the exploratory benefit-cost assessment
performed, based on the data, estimates and assumptions detailed above is available in the
Confidential annex. More details on each of the medicinal products are provided in a
separate data sheet for each in this report.
Sensitivity analyses E.6
Based on the initial exploratory cost-benefit assessment, we undertook a comprehensive
sensitivity analysis, which included the following steps:
Partial sensitivity analysis E.6.1
On the variables judged on the one hand most uncertain and, on the other hand, most
relevant for the results of the benefit/cost analysis, a partial sensitivity analysis was
performed. We thus identify the most sensitive and uncertain ones in terms of data

204
availability and robustness of underlying assumptions and estimates. In a Monte Carlo
sensitivity analysis, the identified most sensitive variables are subsequently varied together,
but independently of each other, in order to test the robustness of the overall results.
In the following table the list of variables examined is depicted, including the reasoning for
their selection and our assessment of their uncertainty. :
Table 63 Variables selected for partial sensitivity analysis
Variable Selection criteria for partial sensitivity analysis
Number of paediatric episodes
(+100% and – 50%)
This is used as a proxy variable, because it will lead to a doubling (respectively cutting by
half) of all estimates for ADEs and the benefits calculated for the reduced incidence of
such events.
A major uncertainty in the data stems, on the one hand, from the fact that ADE reporting
itself is only a next best approximation to the number of paediatric ADRs, which implies
an overestimation of the real number of adverse reactions; and on the other hand, from
the assumed underreporting of ADEs.
It should be remembered that, in order to be on the save side, we increased the estimates
for death by 100% already in the earlier estimates, and those for other adverse events up
to 400% or five-fold.%.
VSL (Value of a statistical life) per
year (+100%)
Economically valuing life in monetary terms is a difficult undertaking. As there is no
standard concept for the financial value of a specific human life, any estimate is highly
sensitive to preferences and perspectives.
To take care of this uncertainty, we also calculate with the VSL doubled.
Avoidable hospitalisation (+ or -
50%)
This data relates to Rottenkolber D. et al (2011), but is also based on own estimates and is
inherently difficult to assess in the absence of actual data, given also the probable
variation across disease domains and medications.
We varied this variable by +/- 50%
Avoidable outpatient treatment (+or
- 50%) Same as above.
Prevalence of other serious adverse
drug events (+100% or – 50%)
No data exists on the prevalence of other serious consequences of ADRs such as
permanent disabilities or chronic diseases, and the consequent change in quality of life.
Any estimates, similar to studies in general on ADE and ADR incidence rates must be
viewed with circumspection.
To account for the inherent uncertainty, we increase the number of such events by 100%
and also decreased it by 50%.
Additional benefit in € per
paediatric episode (+ 100% or
another € 10 versus a decrease by
50% to € 5)
The value for what we called additional benefits per paediatric episode serves as a proxy
for missed benefits deriving potentially from better treatment but not captured by any of
the other benefit variables included in the model. This value is by nature very difficult to
monetarise precisely and is prone to over- or underestimation.
We undertook calculations based on variation of +100% or a value of € 20 versus a
decrease by 50% to € 5.

205
Number of paediatric episodes and ADEs (+ 100% versus – 50%) E.6.2
Doubling of the number of paediatric episodes leads, of course, also to a doubling of the
estimated absolute number of ADEs by +100%, and thereby to a doubling of all benefit
categories estimated, and of all benefit-cost ratios.
Reducing the estimates of paediatric episodes by 50%, i.e. cutting them by half, will similarly
half all benefit and ratio estimates.
The same holds for doubling or cutting by half the estimates of ADEs without changing the
estimates for paediatric episodes.
When considering this, it may be remembered that the estimates for the overall percentage of
all treatment episodes arising in the paediatric context are probably quite valid as
demonstrated by comparing USA and European data. The same would apply to the absolute
number of paediatric episodes, which are based on reliable market data.
Value of a Statistical Life (VSL) per year (+100%) E.6.3
The variation by +100% shows that on average we can observe an improvement in the
benefit-cost ratios by 67%, with considerable variation across medicines. As death is not a
major factor here, this is almost exclusively due to its indirect impact on the benefits
estimated for a reduction in other serious consequences of ADRs such as permanent
disabilities or chronic diseases, leading to a reduced quality of life (QoL).
Table 64 Sensitivity of variable ‘value of a statistical life’
Variable: Value of a
statistical life Estimated change: +100 % from initial calculation
Drugs E H F A C B G I
Total cumulative benefit-cost
ratio after 10 years – Initial
calculation
0.006 0.015 0.025 1.555 0.597 n.a. 0.045 0.044
Benefit-cost ratio – + 100% of
events 0.007 0.026 0.043 2.447 1.169 n.a. 0.068 0.086
Change of ratio in % 27.5% 69.6% 70.4% 57.3% 95.8% n.a. 53.0% 95.7%
For drugs C and I the impact is most pronounced. The number of overall paediatric episodes
estimated for them is very low, and cash items are negligible. The only relevant benefit item
is the indirect impact of the increased value used for VSL on the benefit estimates resulting
from the assumed reduction of other very serious drug reactions (reduced QoL).

206
The opposite holds for drug E, here the impact of a doubled value for VSL is very small. This
is due to the relatively very low number of ADEs. It follows that almost all benefits result
from the assumed lump sum benefits allocated to each paediatric episode resulting from
better treatment options (a value of €5 was asserted) plus avoided other "significant" ADEs
(here also a value of € 5 was estimated).
Avoidable hospitalisations (+/-50%) E.6.4
The calculations with an increase of this variable by 50%, as well as a decrease, show no
noticeable change in overall benefit-cost ratios (less than 1% change observed).
Avoidable outpatient treatments (+/-50%) E.6.5
The calculations with an increase of this variable by 50%, as well as a decrease, show no
noticeable change in the overall benefit-cost ratios (less than 1% change observed).
We did not include the number of deaths related to paediatric episodes into our sensitivity
estimates as a separate variable, because such events were reported for only one of the eight
medicinal products. And even for this drug a further doubling (we already increased it by
100% to account for potential underreporting) of the absolute numbers would increase the
benefits and rations only by about 7%.
Prevalence of other serious adverse drug events (+100% or minus 50%) E.6.6
This factor accounts for the possibility that up to 5% of all very serious ADEs estimated may
result in a rather serious life-long adverse reaction leading to a 20% decrease in QoL over the
rest of the life of the child, based on 72 extra years.
The variation by +100% causes on average an increase in estimated benefits by 66%. The
reduction by 50% leads to an average decrease of minus 33%
Table 65 Sensitivity of variable ‘prevalence of other serious adverse drug events’
Variable: Prevalence of
other serious adverse
drug events
Estimated change: +100 % or minus 50% from initial calculation for 10 years
Drugs E H F A C B G I
Total cumulative benefit-cost
ratio after 10 years – Initial
calculation
0.006 0.015 0.025 1.555 0.597 n.a. 0.045 0.044
Benefit-cost ratio – + 100% of
events 0.007 0.026 0.043 2.333 1.169 n.a. 0.068 0.086
Change of ratio in % 27.5% 69.6% 70.4% 50.0% 95.8% n.a. 53.0% 95.7%
Benefit-cost ratio – minus
50% of events 0.005 0.010 0.016 1.167 0.311 n.a. 0.033 0.023

207
Variable: Prevalence of
other serious adverse
drug events
Estimated change: +100 % or minus 50% from initial calculation for 10 years
Change of ratio in % -13.8% -34.8% -35.2% -25.0% -47.9% n.a. -26.5% -47.8%
Earlier, when exploring a 100% increase in the VSL, we noted that “for drugs C and I the
impact is most pronounced. The number of overall paediatric episodes estimated for them is
very low, and cash items are negligible. The only relevant benefit item is the indirect impact
of the increased value used for VSL on the benefit estimates resulting from the assumed
reduction of other very serious drug reactions (reduced QoL).” As the benefits due to the
avoidance of other serious adverse drug events are directly connected to the VSL, it is not
surprising that the relative impact on benefit-cost ratios is very similar.
Additional benefit in monetary value per paediatric episodes (+100% or – 50%) E.6.7
The increase by +100% to € 20 shows that, on average, we can observe an improvement in
the benefit-coast ratios by 32%. Whereas for drug A the value almost doubles with 72%, i.e.
almost all benefits are derived from this variable, the increase with slightly more than 3% is
very small for drugs E and H. For both of them the values estimated for serious paediatric
ADEs as % of all paediatric episodes per period are the highest of all medicines, which
implies that here the comparably highest benefits are derived from avoidance of ADRs and
not from this variable.
Cutting the estimated benefit amount by half to only € 5 gives a reduction by minus 16% on
average, with considerable variations across drugs (from minus 1.6% to minus 36%).
Table 66 Sensitivity of variable ‘prevalence of other serious adverse drug experiences’
Variable: Prevalence of
other serious adverse
drug experiences
Estimated change: +100 % from initial calculation
Drugs E H F A C B G I
Benefit-cost ratio – Initial
calculation (10 €) 0.006 0.015 0.025 1.555 0.597 n.a. 0.045 0.044
Benefit-cost ratio – + 100%
(to 20 €) 0.010 0.020 0.033 2.207 0.616 n.a. 0.066 0.046
Change in % 72.2% 29.7% 28.9% 41.9% 3.2% n.a. 46.5% 3.4%
Benefit-cost ratio – minus
50% (to 5 €) 0.004 0.013 0.022 1.229 0.588 n.a. 0.034 0.043

208
Change in % -36.1% -14.9% -14.5% -21.0% -1.6% n.a. -23.3% -1.7%
Reviewing these results, four major variables were selected for the next step, the Monte Carlo
analysis:
Number of paediatric episodes
VSL (Value of a statistical life) per year
Prevalence of other serious adverse drug experience impacting on QoL
Additional benefit in € per paediatric episode
Monte Carlo sensitivity analysis E.7
This analysis is based on a random sampling process, which approximates the expected
values for the benefit/cost ratios and their variance. The input variables are permitted to vary
within defined symmetric (plus and minus) boundaries at random, and it is assumed that
their probabilities are not interdependent. We assume a discrete uniform distribution, i.e. a
symmetric probability distribution whereby a finite number of values (here in steps of ten or
more) are equally likely to be observed; every one of n values has equal probability 1/n. A
Monte-Carlo analysis allows us to obtain an initial indication of the likely uncertainty range
of the overall assessed value, the benefit/cost ratio, and the implied time period when for a
specific drug the societal break-even point may be reached.
Based on the above identified most sensitive and uncertain parameters and the results
obtained via the partial sensitivity analyses, we selected variables and these uncertainty
boundaries for undertaking the Monte-Carlo analysis, see the table below.
Table 67 Selected variable for Monte-Carlo analysis
Variable Range of variable value applied to Monte Carlo simulation
Number of paediatric episodes (+50% and
– 50%)
The respective value is varied across a range between (0.5 x initial value) and (1.5
x initial value)
VSL (Value of a statistical life) per year
(+50% and -50%) Variation between € 25,000 and € 75,000
Prevalence of other serious adverse drug
events (+50% and – 50%)
The respective percentage value is varied across a range between (0.5 x initial
value) and (1.5 x initial value)
Additional benefit in € per paediatric
episode (+50% and -50%) Variation between € 5 and € 15
When varying all these variables simultaneously in one simulation (contrasted with only one
variable per simulation in the partial sensitivity analysis) and using 1,000 iterations, we

209
receive a more complete picture of the margins of our estimates. To this end, the 5%, 50%
and 95% quintiles are used to derive the worst, typical and best case scenarios.
The Monte Carlo sensitivity analysis was performed for three typical drugs of our sample of
eight. The selection criteria are meant to match three different profiles in terms of their
application (chronic or acute disease domain) and rate of ADE episodes in the paediatric
population.
Drug x is prescribed for a chronic respiratory disease and has a relatively high share of
episodes relating to paediatrics
Drug x is prescribed for treatment of HIV infections and has a comparatively medium
share of episodes relating to paediatrics
Drug x is a chronic disease drug for treating high blood pressure and has a comparatively
low to very low share of episodes relating to paediatrics
Monte-Carlo simulation for drug A E.7.1
The simulation for drug A shows that an average overall societal benefit is expected of close
to €4.7m in the 6 months of the extension period. The cumulative benefits in the typical case
would reach the break even point seven years after the SPC extension was granted.
For the 95% quintile, the Monte Carlo analysis delivers an estimate of € 7.7 m, which would
allow reaching the break-even point already in year 4. On the other hand, looking at the other
end for the 5% quintile, the break-even point would be obtained only after eleven years. Such
a spread of 7 years (11 minus 4) is quite considerable, underlining the experimental character
of our exploratory assessment.
Figure 45 Sensitivity test results for Drug A
Quintile Total societal benefits (6
months)
6-month benefit-cost
ratio
Break even
€M
€20 M
€40 M
€60 M
€80 M
€100 M
€120 M
€140 M
€160 M
€180 M
1 2 3 4 5 6 7 8 9 10
Sensitivity and benefit-cost ratio break even analysis
Net cost to system 5% Quantile 50% Quantile 95% QuantileYears

210
5% quintile 2,912,994 € 0.046 Year 11
50% quintile 4,667,788 € 0.074 Year 7
95% quintile 7,673,738 € 0.121 Year 4
For drug F, it was estimated that the full cost of monopoly rent would be covered by co-
payments of patients. If this were not the case, and the full cost of around €16m would have
to be covered by the health systems, the 50% quintile value were the breakeven would be
reached is 2 years – based on overall benefits of €4m for the 6-month period, and the spread
would be about 1 year for the optimistic estimate (5% quintile), and close to 3 for the
pessimistic estimate (95% quintile).
Monte-Carlo simulation for drug C E.7.2
The simulation for drug C shows that an average overall societal benefit is expected of almost
€290,000 in the 6 months of the extension period. The cumulative benefits would reach the
breakeven point only 18 years after the 6-month SPC extension was granted.
For the 95% quintile, the Monte Carlo analysis delivers an estimate of € 663,000, which
would allow reaching the break-even point already in year 8. On the other hand, looking at
the other end for the 5% quintile, the break-even point would be obtained only after 43 years.
Figure 46 Sensitivity test results for Drug C
Quantile Total societal benefits (6
months)
Benefit-cost ratio Break even
5% quintile 122,477 € 0.012 Year 43
50% quintile 287,797 € 0.027 Year 18
95% quintile 663,271 € 0.063 Year 8
€M
€2 M
€4 M
€6 M
€8 M
€10 M
€12 M
€14 M
1 2 3 4 5 6 7 8 9 10
Sensitivity and benefit-cost ratio break even analysis
Net cost to system 5% Quantile 50% Quantile 95% QuantileYears

211
Monte-Carlo simulation for drug G E.7.3
The simulation for drug G, which can be regarded as exemplary also for the remaining 4
drugs for which even lower benefit-cost rations were estimated earlier, shows minute benefits
in comparison to the costs for the health system payers. Even in the optimistic scenario, a
break-even point would be reached only after about 140 years, and for the 50% quintile we
obtained a value of 234 years, for the 5% quintile of 407 years.
Figure 47 Sensitivity test results for Drug G
Quantile Total benefits paediatrics Benefit-cost ratio Break even
5% quantile 149,248 € 0.001 Year 407
50% quantile 259,221 € 0.002 Year 234
95% quantile 432,383 € 0.004 Year 140
In summary, when considering the results for all eight drugs, the Monte Carlo simulation
delivers quite interesting results: When considering a considerable variability in the four
major drivers of benefits by plus and minus 50% in our estimates,
For the optimistic268 estimates (95% quintile), one medicine will reach its break-even 1.
point already after 1 year, one after 4 and a third one after 8 years; five drugs will take 140
or more years even in this scenario
For the average scenario, the periods are 2, 7 and 18 years, and more than 230 for the 2.
other 5 drugs
268 This implies, e.g., higher numbers of ADRs.
€M
€20 M
€40 M
€60 M
€80 M
€100 M
€120 M
€140 M
1 2 3 4 5 6 7 8 9 10
Sensitivity and benefit-cost ratio break even analysis
Net cost to system 5% Quantile 50% Quantile 95% QuantileYears

212
For the low estimates (5% quintile), the estimated number of years is 3, 11, 43 years and 3.
more than 400.

213

technopolis |group| United Kingdom
3 Pavilion Buildings
Brighton BN1 1EE
United Kingdom
T +44 1273 204320
www.technopolis-group.com