study on the introduction of carbon pricing instruments in
TRANSCRIPT

1
Study on the Introduction of Carbon Pricing
Instruments in Pakistan
– Final Version –
July 2019

2
Table of Contents
TABLE OF CONTENTS ............................................................................................................................................... 2
ACKNOWLEDGMENTS .............................................................................................................................................. 4
ACRONYMS USED .................................................................................................................................................... 5
EXECUTIVE SUMMARY ............................................................................................................................................. 7
1. INTRODUCTION AND SCOPE OF THE STUDY ............................................................................................... 13
2. CARBON PRICING: AN INTRODUCTION TO THE CONCEPT .......................................................................... 19
2.1 WHAT IS CARBON PRICING? ................................................................................................................ 19 2.2 HOW DOES CARBON PRICING WORK? ................................................................................................. 19 2.3 WHAT IS THE DIFFERENCE BETWEEN CARBON PRICING AND CLIMATE FINANCE? .............................. 21 2.4 WHAT ARE THE RATIONALES FOR INTRODUCING CARBON PRICING? ................................................. 22 2.5 CO-BENEFITS OF CARBON PRICING ..................................................................................................... 27 2.6 SPECIFICITIES ABOUT CARBON PRICING IN DEVELOPING COUNTRIES ................................................ 29 2.7 ACCEPTABILITY OF CARBON PRICING.................................................................................................. 30
3. APPROACHES FOR CARBON PRICING .......................................................................................................... 32
3.1 MAIN APPROACHES ............................................................................................................................. 32 3.1.1 Carbon taxation / direct pricing .................................................................................................. 32 3.1.2 Cap-and-trade mechanism / Emissions trading system......................................................... 35 3.1.3 Hybrid approaches and combinations of approaches ............................................................ 38
3.2 KEY FEATURES OF CARBON PRICING MECHANISMS ............................................................................ 39 3.2.1 Scope and coverage ................................................................................................................... 39 3.2.2 Stringency of the instrument ...................................................................................................... 40 3.2.3 Setting a cap in the ETS ............................................................................................................. 41 3.2.4 Stability and predictability ........................................................................................................... 42 3.2.5 Discounts and rebates ................................................................................................................ 43 3.2.6 Flexibility........................................................................................................................................ 44 3.2.7 Use of offsets................................................................................................................................ 44 3.2.8 Monitoring, Reporting and Verification (MRV) ......................................................................... 45 3.2.9 Allocation and redistribution of revenues ................................................................................. 46
3.3 CARBON PRICING AT THE INTERNATIONAL AND REGIONAL LEVEL ...................................................... 47
4. ANALYSIS OF THE NATIONAL CONTEXT OF PAKISTAN ................................................................................ 59
4.1 SOCIO-ECONOMIC CONTEXT ............................................................................................................... 59 4.2 POLICY FRAMEWORK AND ANALYSIS OF CLIMATE CHANGE SECTOR .................................................. 62
4.2.1 National Policy Framework on Climate Change...................................................................... 63 4.2.2 National framework on climate change and synergies with carbon pricing ........................ 65 4.2.3 Greenhouse Gas Emissions Profile of Pakistan ..................................................................... 67 4.2.4 Experiences of Pakistan with market-based approaches and climate finance ................... 69
4.3 SECTORAL ANALYSIS ........................................................................................................................... 71 4.3.1 Energy ................................................................................................................................................ 71 4.3.2 Transport ........................................................................................................................................... 85 4.3.3 Industry .............................................................................................................................................. 88 4.3.4 Agriculture and Forestry .................................................................................................................. 91 4.3.5 Waste Management ......................................................................................................................... 92
4.4 STAKEHOLDERS ANALYSIS ................................................................................................................. 95 4.5 SWOT ANALYSIS AND READINESS ASSESSMENT TO CARBON PRICING ............................................. 97
5. DESIGN OPTIONS FOR CARBON PRICING IN PAKISTAN ............................................................................ 102
5.1 CAP-AND-TRADE / EMISSIONS TRADING ........................................................................................... 102 5.2 CARBON TAXATION ............................................................................................................................ 118

3
5.2.1 Adjustment of the Petroleum Development Levy to a carbon tax ...................................... 119 5.2.2 Economy-wide carbon tax ........................................................................................................ 121 5.2.3 Carbon tax on coal..................................................................................................................... 122
5.3 HYBRID APPROACHES ....................................................................................................................... 123 5.4 SUMMARY .......................................................................................................................................... 124
6. RECOMMENDATIONS AND WAY FORWARD ............................................................................................. 129
ANNEX I – ANALYSIS OF POLICY DOCUMENTS OF PAKISTAN AND THEIR SUPPORT TO THE INTRODUCTION OF CARBON PRICING INSTRUMENTS ........................................................................................................................ 144

4
Acknowledgments
This study was conceptualized, coordinated and prepared by João Aleluia with the contributions of
Syeda Hadika Jamshaid and Nicolas Muller. Valuable research assistance was provided by Mariana
Beira Pacetta, Shiyi Zhang, Supriya Dharkar and James Tops. General guidance was provided by the
CI-ACA team of the UNFCCC Secretariat, in particular Nicolas Muller and Monique Nardi, as well as
by Jens Radschinski, UNFCCC Regional Collaboration Center Bangkok. Sardar Mohazzam assisted in
initial stages of the research and took part in consultation meetings in Pakistan.
The authors would also like to express their gratitude for the comments and feedback provided by the
National Review Committee that was established to assess the findings, recommendations and overall
quality of the study, in particular: Farrukh Iqbal Khan, Director, Ministry of Foreign Affairs; Irfan Yousuf,
Director (CDM), Alternative Energy Development Board; Ghulam Samad, Director, Center for
Environment Economics and Climate Change, Pakistan Institute of Development Economics (PIDE);
Muhammad Omar, Director (UN-II), Ministry of Foreign Affairs; Saadullah Ayaz, National Project
Coordinator, UNDP, Ministry of Climate Change; and Niaz Ullah Khan, Sectoral Expert, UNDP,
Ministry of Climate Change.

5
Acronyms Used
AEDB Alternative Energy Development Board
ASEAN Association of South-East Asian Nations
BUR Biennial Update Report
CAGR Compound Annual Growth Rate
CDM Clean Development Mechanism
CI-ACA Collaborative Instruments for Ambitious Climate Action
CNG Compressed natural gas
CO2 Carbon dioxide
CO2e Carbon dioxide equivalent
COP UNFCCC Conference of Parties
CORSIA Carbon Offsetting and Reduction Scheme for International Aviation
CPEC China Pakistan Economic Corridor
CPI Carbon Pricing Instrument
CPPA Central Power Purchasing Agency
DISCO Distribution company
EPA Environmental Protection Agency
ETS Emissions trading scheme
FAO Food and Agriculture Organization
FBR Federal Board of Revenue
FCPF Forest Carbon Partnership Facility
FY Fiscal year
GCF Green Climate Fund
GCISC Global Change Impact Studies Centre
GENCO Power generation company
GHG Greenhouse gases
GNI Gross national income
IEA International Energy Agency
IPCC Intergovernmental Panel on Climate Change
IPP Independent Power Producer
IPPU Industrial Processes and Product Use
JI Joint Implementation
LNG Liquefied natural gas

6
LPG Liquefied petroleum gas
mmcfd Million cubic feet per day
MGD Million gallons per day
MOCC Ministry of Climate Change
MRV Measuring, Reporting and Verification
NAMA Nationally Appropriate Mitigation Action
NC National Communication
NCCP National Climate Change Policy
NDC Nationally Determined Contribution
NEECA National Energy Efficiency and Conservation Authority
NEPRA National Electric Power Regulatory Authority
NGO Non-governmental organization
NTDC National Transmission Distribution Company
OECD Organization for Economic Co-operation and Development
OGRA Oil and Gas Regulatory Authority
PBS Pakistan Bureau of Statistics
PCAP Pakistan Clean Air Programme
PDL Petroleum Development Levy
PEPCO Pakistan Electric Power Company
PMR Partnership for Market Readiness
PPIB Private Power Infrastructure Board
REDD Reduced emissions from deforestation and forest degradation
Rs. Pakistani Rupee
SAARC South Asian Association for Regional Cooperation
SWOT Strengths Weaknesses Opportunities Threats
TDS Tariff differential subsidy
toe Ton of oil equivalent
UNDP United Nations Development Programme
UNFCCC United Nations Framework Convention on Climate Change
USD United States Dollar
WAPDA Water and Power Development Authority
WCI Western Climate Initiative

7
Executive Summary
Carbon pricing is widely recognized as one of the most efficient and straightforward approaches for
curbing the emission of greenhouse gases (GHG). In recognition of this, a growing number of countries
has developed, or is in the process of developing, carbon pricing instruments as one of the approaches
to support the implementation of Nationally Determined Contributions (NDCs).
While Pakistan does not explicitly mention carbon pricing on its NDC, several policy documents
provide the basis for the introduction of these instruments. For instance, the National Climate Change
Policy (2012) makes reference to a carbon tax as part of mitigation measures that can support GHG
emission reductions in the energy sector. Additionally, both the National Climate Change Policy and its
implementation framework (2013) refer to the introduction of incentive schemes to support mitigation
efforts. While the reference to “incentives” is formulated in a generic manner in these documents (e.g.
in the form of “economic incentives” to promote the upgrade of industrial processes and technologies;
“financial incentives” for commercial transport systems to reduce emissions), they clearly lay out the
basis for the consideration of a carbon pricing instrument in Pakistan.
In addition to this, there are several benefits that Pakistan could harness with the adoption of a
carbon pricing instrument. A price signal on GHG emissions could accelerate the deployment of
climate-friendly solutions, such as renewable energies and energy efficiency, boosting investments in
these sectors and reducing the vulnerability of the country to energy imports. There is, as well, a
significant potential for tapping several “co-benefits” from reducing GHG emissions. Among these, the
reduction of local air pollutants, such as particulate matter, nitrogen oxides or sulphur oxide. In
developing countries such as Pakistan, co-benefits from reduced air pollution alone are estimated to
the tune of at least 50 USD per tCO2e abated. A carbon pricing instrument can also be an important
source of revenue for a government, enabling the implementation of public policies and programmes.
Set against this background, the aim of this study was to assess and recommend a set of options for
the introduction of carbon pricing instruments in Pakistan. To this end, it was conducted a review of
international good practices on carbon pricing and an analysis of Pakistan’s national context. This was
the basis for analyzing how different carbon pricing approaches could be tailored to fit the unique
context of Pakistan. In essence, these consist of two options: carbon taxation (or “direct pricing”) and
the establishment of an emissions trading system (ETS).
From a technical standpoint a carbon tax is, in principle, the most amenable instrument for
implementation in any given jurisdiction. It is easy to understand as an economic instrument, it typically
entails low implementation costs, and it enables a broad coverage of emissions. A carbon tax can also
be introduced by building upon tax collection systems already existing in a country, and its application
“upstream” – i.e. at the point of imports or fuel production – enables a government authority to only
regulate a few control points while ensuring a wide coverage of the instrument “downstream”.

8
However, the level of political support for a carbon tax is usually low, so as its acceptance among
business entities and the general public. The research and consultations conducted as part of this
study strongly suggest that this would be no different in Pakistan. More so in the context of the
declining competitiveness of some industries vis-à-vis international peers and the general perception
that the existing taxation regime is already too onerous to taxpayers. In addition to this, recent
research suggests that effective economy-wide carbon taxes may require strong price signals, thus
potentially requiring a complex set of instruments to redistribute revenues and mitigate negative
impacts on businesses and households.
The introduction of a broad carbon tax therefore entails some challenges and risks in Pakistan. In fact,
this is an experience that is not entirely new to the country, as previous attempts to introduce a carbon
tax, in 2013 and 2017, respectively, did not manage to gather sufficient support from different
government agencies. Nonetheless, opportunities do exist in Pakistan for implementing a carbon tax
with a more specific scope. In particular, adjusting the already existing Petroleum Development Levy
(PDL), to reflect the GHG emissions of the fuels covered represents a relatively smooth and low-risk
option. This option would build on existing fiscal structures, involve relatively low administrative costs,
and leave low-income households mostly unaffected. This levy could subsequently be expanded to
other fuels. On the other hand, and as potential drawbacks, as demand in the transport sector is
typically inelastic, such tax would mostly lead to revenue generation more than actual GHG emission
reductions. Yet, such revenues could serve to support climate action and environmental protection
goals.
This study also analysed the option of adopting an economy-wide carbon tax, which could be applied
to businesses and end-users alike. While this would ensure an additional source of income to the
government, as noted above the study found that this option would have a low level of political and
public acceptability in Pakistan. Nevertheless, if the national Government opts for such instrument, key
success factors in design will be in ensuring it does not disproportionally affect the most vulnerable
strata of the population, that the competitiveness of companies targeted is not jeopardized, and that
the proceeds from the tax are returned to those most affected by it while seeking “revenue neutrality”
to the extent possible. In this respect, it is strongly recommended that international good practice can
be taken as reference, namely the experiences of Canada’s Province of British Columbia on their
economy-wide carbon tax.
With regards to emissions trading, the assessment indicates that the establishment of such system
holds significant potential in Pakistan. To start with, this is an option that enables a much higher
degree of flexibility than a carbon tax to both policymakers and covered entities alike. This flexibility is
in the form, for example, of leaving to the discretion of companies how to comply with their emissions
cap (e.g. either by a reduction of their own GHG emissions or through the purchase of emission units
from other participants). The least polluting entities may also be able to generate income in case they
sell their allowance surplus. Another advantage of an ETS is that the national government can shape

9
an ETS as it wishes. In particular, it can protect industrial sectors exposed to international competition
by distributing “free” emission allowances. It can also decide on the overall effort required from
participants in the ETS and on the relative contribution of the various sectors.
The study assessed in detail the opportunity and feasibility of a domestic ETS in Pakistan, considering
a lead time of at least four years for ETS implementation. Conservative estimates found that a
domestic ETS could include at least 121 facilities, corresponding to an emissions volume of 168.2
MtCO2e, or approx. 26% of the total domestic emissions estimated by 2023. This suggests that a
domestic ETS would have a sufficient number of participants, be relevant in terms of coverage and be
sufficiently liquid for an effective carbon price to form. Even at 5 USD per allowance, the resulting
market could have a value of 841 million USD. Under such conditions, each one percent of emission
allowances sold could generate 8.41million USD in revenues.
One recommendation of the study is that a domestic ETS should initially focus in capping CO2
emissions from key sectors with large emissions and strong mitigation potential, prioritizing power
generation and industrial sub-sectors such as cement, refineries, fertilizers and steel production.
Progressive inclusion of more sectors/facilities in the ETS could be done step-wise, depending on
relevance, readiness and complexity of inclusion. Sectors not included in the ETS could be considered
as a source of offsets to support ETS covered entities meeting their compliance obligations (usually in
the range of 5-10% of their total allowances). Given the high level of interest of the government in the
generation of offsets from forestry-related activities, especially following the success of the “Billion Tree
Tsunami” initiative, this is a sector recommended for consideration as a source of ETS offsets.
A key feature of an ETS is that emissions are in the form of tradable units. Accordingly, a domestic
ETS could be linked with other ETS systems or sell part of its emission allowances to third parties. This
represents a major opportunity for Pakistan since the country could sell emission units, attract
investments in climate-friendly solutions, and profit from the strong associated “co-benefits”. Although
rules for implementing such cooperative climate action under Article 6 of the Paris Agreement are still
being negotiated internationally, Pakistan could already position itself as prime supplier of emission
units by leading in the adoption of best practices for generating transferable mitigation outcomes units.
In terms of cooperation, synergies could be explored, among others, with China, not only because it is
a strategic partner of Pakistan in the context of the China-Pakistan Economic Corridor (CPEC)
initiative, but also in light of its experiences on carbon pricing instruments and its expected role as host
of the largest ETS in the world, the China national ETS, whose operational launch is foreseen for early
2020. The study provides recommendations on how linkages with the China national ETS could be
sought, which could include an initial stage of information exchange, and the consideration for similar
design elements to those of China (e.g. similar sectoral coverage, framework for the Monitoring,
Reporting and Verification of emissions (MRV), etc.) in case Pakistan decides to develop an ETS of its
own.

10
While the potential for a domestic ETS was found to be significant, this option also entails a number of
challenges and risks. Among these, the relative complexity of setting-up a system of this kind
(especially if compared with a carbon tax), the low familiarity of companies with the instrument, and the
need for certain governing elements to be in place. These include, for example, the existence of GHG
emission data at the facility level for covered sectors, the establishment of an MRV framework, and the
set-up of the necessary legal and administrative infrastructure for the well-functioning of the system
(e.g. in the form of registries, trading platform, legal instruments, etc.). The establishment of an ETS
therefore requires a long-term perspective.
The study also analysed “hybrid approaches” that could be considered by the Government of
Pakistan. These pertain to options that differ from the sole implementation of emissions trading or a
carbon tax and which, in some cases, try to combine elements of both instruments. One of such
considered approaches is the establishment of an Emissions Reduction Fund, similar to what Australia
has implemented, to fund domestic emission reduction projects from the general budget. However, this
option was found unfitting for a “cash-constrained” country such as Pakistan. Another hybrid approach
analysed consists in the introduction of a carbon tax on large-scale emitters (the power generation and
industrial sectors), which could then transition to an ETS. Despite advantages in terms of feasibility,
this option would face resistance from industries.
All in all, the study notes that the establishment of a domestic ETS is the option expected to result in
the highest benefit and have the greatest impact overall, despite the long lead times anticipated with its
development and the possible concerns on the competitiveness of industries covered. At the same
time, the study also finds that gradually adjusting the Petroleum Development Levy to reflect the
carbon intensity of fuels could be a straightforward opportunity to price GHG emissions under a
polluter-payer principle in the short-run. Given the discrepancy between sectors which could achieve
mitigation action for implementing the NDC and those which could be a source of funding, it is
proposed the consideration of these two options to complement each other. A carbon pricing
architecture combining instruments is therefore proposed, where revenues from taxing transportation
fuels through the PDL could be raised and used in a national climate fund to finance emission cuts
through a domestic ETS. This study provides recommendations on how these options could be
implemented in Pakistan, and outlines a set of activities that could be considered on the way forward.
Among recommended next steps, the following could be prioritized:
i) Carry out consultations with Ministries, Federal Agencies, Provinces and Industries with
the aim of raising awareness about carbon pricing, discuss possible roles and responsibilities in
the context of a future carbon pricing architecture, and the identification of initiatives for capacity
building and piloting.
ii) Take steps towards the development of a domestic ETS assuming sufficient political backing
is garnered, which should include:

11
- Definition of the institutional set-up of the ETS and preliminary rules/principles for the system,
including specific roles for the participants involved, in particular federal and provincial
governments, the Pakistan Climate Change Authority (which was proposed to fulfil the
functions of an “ETS regulator”), and the Pakistan Climate Change Fund (proposed as both
the recipient and distributor of funds raised from a carbon pricing instrument);
- Establishing an MRV infrastructure to track GHG emissions at the entity/facility level, focusing
in the development of specific monitoring and reporting guidelines and a framework for
accrediting third party verifiers. The MRV infrastructure should build on existing or planned
MRV processes (e.g. those already in place for preparing the national GHG inventory) and
other closely related initiatives (e.g. energy auditing of major energy consumers);
- Setting-up the legal and regulatory instruments to operationalize the ETS, prioritizing the
requirements to establish the MRV infrastructure, which should include an MRV law or
regulation;
- Preparation of a list/inventory of major emitters in Pakistan in the energy and industrial
sectors with the aim of assessing GHG emission levels, determining emissions intensity per
sub-sector, and coming up with emissions benchmarks;
- Setting-up of an emissions registry to track unit holdings of participants, the achievements of
the system, and the potential of exporting units to third parties, including internationally;
- Piloting certain elements of the future ETS (e.g. compliance with MRV procedures, the trading
of emissions), focusing on large-scale emitters (e.g. power generation, cement production),
and on sub-sectors/companies with an interest in reporting GHG emissions (e.g. as a
requirement of export markets or investors).
iii) Discuss collaboration with China on carbon pricing with a focus on ETS development,
which could be initiated in the framework of the CPEC initiative and include the following
activities:
- A process of information-sharing on China’s experiences in developing its national and
provincial ETS systems, which could be conducted in the form of policy dialogues or technical
workshops;
- Identification of areas for alignment and knowledge transfer with a view of possible linkages
among ETS systems, especially in the following areas: sectoral coverage, institutional
architecture including a model for federal/provincial integration, regulatory and legal
instruments, and MRV infrastructure;
- Development of a collaboration platform (e.g. in the form of a roadmap, MoU) based on a
vision to establish linkages among systems and the conduct of piloting and capacity building
activities (e.g. involving facilities implemented in Pakistan from investments in the scope of
CPEC).
iv) Take steps towards the development of a carbon tax based on the PDL, which should
include:

12
- To hold discussions with concerned ministries on the feasibility of this option, in particular the
Ministry of Finance and the Federal Bureau of Revenue, with a view of obtaining
endorsement and support for implementation;
- In case of sufficient support, come up with the specific modalities for this carbon pricing
option, in particular the methodology(ies) for determining the carbon pricing component of the
PDL, the necessary steps for formal approval, and the new mechanisms (if any) for
reinvesting the proceeds raised by the tax.
v) Focus on “readiness” elements that would benefit Pakistan regardless of whether a
carbon pricing instrument is formally adopted in the future, in particular the establishment of
an MRV infrastructure that would better enable Pakistan to keep track of its GHG emissions and
support NDC implementation.
In case Pakistan decides to advance towards developing a carbon pricing instrument, it should take
advantage of the learnings from more than 15 years of international experiences in the design and
implementation of such instruments. This study sheds light on several good practices from around the
globe that could be a reference or inspiration to Pakistan, in particular those of the following
jurisdictions:
Indonesia, as a country which, just like Pakistan, ranks as a lower-middle income country and
has a population of over 200 million. Indonesia has established a robust MRV framework, which
includes specific provisions for the reporting of emissions at the facility level in the power sector,
and has recently decided to take steps towards the development of a national ETS.
China, as a strategic partner to Pakistan and future host of the world’s largest national ETS.
China’s experiences could also resonate with the specific circumstances of Pakistan, for instance
on the national/sub-national setup and the central roles given to Provinces in piloting and
implementation.
British Columbia, as a “textbook” case-study on how an economy-wide carbon tax could be
successfully implemented. British Columbia’s tax is an instrument with broad coverage, supported
by a successful communication plan, and with no negative effects on economic growth.
Canada, as country which, just like Pakistan, has a federal system where a number of powers
and responsibilities are delegated to Provinces. In the Canadian carbon pricing system, Provinces
are allowed to set-up a mechanism of their own (i.e. ETS, tax or hybrid) provided they meet
certain requirements set by the federal government.
Sri Lanka, as a country that is also part of SAARC and which exhibits levels of economic
development comparable to those of Pakistan. Sri Lanka initiated a number of “readiness”
activities in 2018 with the aim of enhancing the role of carbon pricing in meeting the goals set on
its NDC.

13
1. Introduction and scope of the study
Pakistan consistently ranks among the countries most vulnerable to climate change1,2 and is already
facing severe climate-related impacts. An assessment conducted by Pakistan’s National Disaster
Management Authority revealed that climate-induced disasters have resulted in an economic loss of 4
billion USD between 1994 and 20133. As of 2015, federal expenditures related to the negative effects
of climate change were between 5.8 and 7.6% of total budgetary expenditures4.
At the same time, Pakistan’s greenhouse gas (GHG) emissions are still relatively modest, standing at
405 MtCO2e for a population of 189.5 million in 2015, or just 2.1 tCO2e on a per capita basis.
Nevertheless, GHG emissions in Pakistan have been increasing at 6% per year and, in view of rapid
economic growth, they could even rise to 1,603 MtCO2e by 20305.
Faced with the gravity of the global climate crisis and with GHG emission patterns inconsistent with a
GHG concentration level which gives a reasonable chance of maintaining the global warming below
2ºC above pre-industrial levels, the 195 Parties to the United Nations Framework Convention on
Climate Change (UNFCCC) agreed in the Paris Agreement to: i) limiting global warming to 2°C above
pre-industrial while pursuing efforts to limit the temperature increase to 1.5°C; ii) fostering climate
resilience and low GHG emissions development; iii) reaching a global peak of GHG emissions as soon
as possible; and iv) achieving a globally neutral carbon balance in the second half of this century.
As part of this effort, Parties agreed to undertake and communicate ambitious successive Nationally
Determined Contributions (NDC), and to formulate and communicate long-term low GHG emission
development strategies, in the context of common but differentiated responsibilities and respective
capabilities in light of different national circumstances. Pakistan signed the Paris Agreement on 22
April 2016, and ratified it on 10 November 2016, the same date it submitted its first NDC6,7. In the NDC,
Pakistan communicated the intention of reducing GHG emissions by up to 20% compared to projected
GHG emissions in 2030, provided that international support is made available.
It is in light of this need of articulating economic development with the reduction of GHG emissions that
carbon pricing has emerged as one of the most relevant approaches for the consideration of
policymakers. Simply put, carbon pricing consists in putting a price signal on GHG emissions. The
1 ND-GAIN, ND-GAIN Country Index, accessed January 2019, <https://gain.nd.edu/our-work/country-index/rankings/> 2 German Watch, Global Climate Risk Index 2018, accessed January 2019, <https://germanwatch.org/sites/germanwatch.org/
files/publication/20432.pdf> 3 UNFCCC, Pakistan’s Intended Nationally Determined Contribution (PAK-INDC), accessed September 2018, <https://www4.
unfccc.int/sites/submissions/INDC/Published%20Documents/Pakistan/1/Pak-INDC.pdf>
4 Ibid. 5 UNFCCC, Pakistan’s Intended Nationally Determined Contribution (PAK-INDC), 2016, Ibid. 6 United Nations Treaty Collection, Paris Agreement, accessed February 2019, <https://treaties.un.org/Pages/ViewDetails.
aspx?src=TREATY&mtdsg_no=XXVII-7-d&chapter=27&clang=_en> 7 UNFCCC, NDC Registry (interim), accessed January 2019, <https://www4.unfccc.int/sites/ndcstaging/Pages/Home.aspx>

14
major instruments that exist for pricing carbon are emissions trading and carbon taxation. Through
their adoption, the societal, economic, and environmental costs associated with GHG emissions are
“internalized” back to the sources of emissions. The price signal thereby created is an efficient way of
encouraging a shift in practices, including on consumption and investment patterns, towards low-
carbon options while at the same time supporting sustainable development goals.
Carbon pricing is widely recognized as one of the most important, efficient and straightforward
approaches for minimizing GHG emissions. This view is widely shared among economists8,9 and is
also echoed in the IPCC “Special Report: Global Warming of 1.5 ºC”10. Similarly, Decision 1/CP.21
(Adoption of the Paris Agreement) by the UNFCCC Conference Of Parties (COP) explicitly recognizes
the important role of carbon pricing11.
Set in this context, a growing number of Parties are considering or have been implementing carbon
pricing as one of the approaches for shifting to a low carbon development model and for implementing
their current and future Nationally Determined Contributions (NDCs) under the Paris Agreement. This
also includes a growing number of developing countries. While at the theoretical level, carbon pricing is
considered as a straightforward approach, elaborating a workable carbon pricing approach entails a
certain level of complexity12. Indeed, carbon pricing never exists in isolation but always in the social,
economic, political, regulatory and institutional circumstances of the jurisdiction where it is
implemented13.
In particular, developing countries would need to ensure that carbon pricing does not compromise but
instead supports the achievement of development objectives 14 . For this reason, identifying and
designing a carbon pricing approach which can fit into a country’s very own circumstances and
development objectives may involve significant effort and expertise. Fortunately, the Paris Agreement
clearly recognizes the need for supporting developing countries implementing their NDCs15.
8 High-Level Commission on Carbon Prices, Report of the High-Level Commission on Carbon Prices, 2017, <https://www.
carbonpricingleadership.org/report-of-the-highlevel-commission-on-carbon-prices/> 9 IISD, Nordhaus Nobel Recognizes What We've Long Known: Carbon pricing works, accessed October 2018,
<https://www.iisd.org/library/nordhaus-nobel> 10 IPCC, Global Warming of 1.5 ºC, 2018, <https://www.ipcc.ch/sr15/>
11 UNFCCC, Report of the Conference of the Parties on its twenty-first session, held in Paris from 30 November to 13 December
2015, 2015, <https://unfccc.int/resource/docs/2015/cop21/eng/10a01.pdf> 12 See, for example: J. Adly, The Political Economy of Carbon Pricing Policy Design , 2017, <https://www.belfercenter.org/sites/
default/files/files/publication/aldy-ets-tax-final.pdf>
13 The World Bank and OECD propose six principles for successful carbon pricing, the so called “FASTER” principles. The first principle pertains to “Fairness”, meaning that successful carbon pricing policies should reflect the “polluter pays” principle and
contribute to distributing costs and benefits equitably, avoiding disproportionate burdens on vulnerable groups. Source: World Bank, The FASTER principles for successful carbon pricing: an approach based on initial experience, 2015,
<http://documents.worldbank.org/curated/en/901041467995665361/The-FASTER-principles-for-successful-carbon-pricing-an-
approach-based-on-initial-experience> 14 High-Level Commission on Carbon Prices, Report of the High-Level Commission on Carbon Prices, 2017, Ibid. pp 19
15 As per Article 11.3 of the Paris Agreement: “All Parties should cooperate to enhance the capacity of developing country
Parties to implement this Agreement. Developed country Parties should enhance support for capacity-building actions in
developing country Parties”.

15
Based on the growing interest by developing countries to consider carbon pricing and the associated
need for support, donors announced during COP-22 the launch of the project Collaborative
Instruments for Ambitious Climate Action (CI-ACA) as a voluntary initiative to provide the support
needed. The CI-ACA project is currently supported by the Governments of Germany, Norway, Québec,
Sweden and Switzerland. The project has a global scope and is being implemented in a number of
jurisdictions worldwide, such as the Dominican Republic in the Caribbean or Senegal in West Africa. In
Asia, the project has been implemented in countries of ASEAN and in Pakistan.
In Pakistan, activities in the scope of CI-ACA were initiated at the end of 2017, with the organization of
a National Consultation on Carbon Pricing, held on 21 December 2017 in Islamabad in collaboration
with Pakistan’s Ministry of Climate Change16. The consultation confirmed the great interest on the
concept of carbon pricing. On the one hand, as a basis for driving a vision of prosperity fuelled by
renewable energy and energy efficiency; on the other as a potential foundation for participation in
future carbon markets internationally. The consultation concluded with the decision to launch an in-
depth technical study on a possible carbon pricing instrument for Pakistan, which could help Pakistan
following a low-carbon development trajectory while taking into account its development objectives.
The purpose of this study is therefore to explore and analyse the opportunity for Pakistan to introduce
carbon pricing considering both the domestic and international context, and in particular by: i)
identifying strengths, weaknesses, opportunities and threats; ii) looking at the different carbon pricing
approaches which exist and global good-practices; and iii) how these approaches could be tailor-made
to fit the unique context of Pakistan. As such, the present study does not intend to prescribe a solution
to national decision-makers in their sovereign policy choices, but rather to inform the discussion on
instruments for mitigation action and low-carbon development.
Among its objectives, the study intends to assess how carbon pricing could support the achievement of
the current and future NDCs of Pakistan, spur low-carbon development, and also to strengthen
Pakistan’s ability to participate in current and future carbon market activities, in particular as part of
cooperative approaches under Article 6 the Paris Agreement. In order to achieve its proposed
objectives, the preparation of this study followed a step-wise approach consisting of:
A review of the main existing carbon pricing approaches, explaining from the theoretical to the
practical level their principles, commonalities, differences, and describing elements and
parameters which can be customized to develop unique country-specific solutions;
A review of the status-quo of carbon pricing and carbon markets at the international level,
looking, among others, at specific case studies from selected jurisdictions which could serve
as reference to Pakistan;
16 For further details see: UNFCCC, Pakistan Explores Carbon Pricing, 2018, <https://unfccc.int/news/ pakistan-explores-
carbon-pricing>

16
An analysis of relevant elements of the domestic context which need to be factored in when
considering the development of a domestic carbon pricing approach. This would need to
consider elements such as: i) the socioeconomic context and national policy objectives; ii) the
climate change and energy policy frameworks; iii) the current and evolving GHG emissions
profile of Pakistan; iv) groups of stakeholders which would be directly or indirectly involved or
impacted by a carbon pricing instrument; and v) the “readiness” status and existing gaps.
The diagram of Figure 1.1 below summarizes the approach adopted in the preparation of this study. As
can be observed, three main components underpinned this work: i) an understanding of the general
principles of carbon pricing; ii) empirical know-how acquired from international experiences; and iii) a
thorough understanding of the national circumstances and priorities. Based on these elements,
opportunities for carbon pricing were identified and analysed for Pakistan, with specific
recommendations made on the way forward.
Overall approach
The instruments
Features which can be
customized
General principles of carbon pricing
International experience on carbon pricing
Examples
Lessons learned
National context of Pakistan
National circumstances
(economic, social,
environmental, institutional)
National priorities
Options and recommendations for Pakistan
Theory
Pra
ctice
Global National
Analysis
WP WP
WP
WP
WP
WP = work package with deliverables
with quality-check
Figure 1.1 – Approach adopted in the preparation of the study.
The CI-ACA team based in UNFCCC’s head office in Bonn, UNFCCC’s Regional Collaboration Center
for Asia-Pacific in Bangkok, and the Ministry of Climate Change, which acted as the national focal point
for this study, have directly supervised its conceptualization and preparation. Additionally, a National
Steering Committee was established to oversee the preparation of the study. More specifically, the
Committee was tasked with the following functions17:
i) To oversee the conduct of the study;
17 From the Terms of Reference of the Steering Committee.

17
ii) To advise and approve the methodology proposed for the study, work plan and timelines, and
the consideration of any policy, institutional or technical aspect in relation to which a carbon
pricing model could fit in;
iii) To validate the framework and design options for carbon pricing recommended by the study
and approve the final recommendations and way forward;
iv) To carry forward the study recommendations under the framework of the Paris Agreement, or
as considered appropriate in the context of national strategic priorities.
The National Steering Committee was established in September 2018, and it is composed of
representatives from federal ministries, officials from provincial government departments, the
academia, research institutes, the private sector and several individual experts. The first meeting of the
National Steering Committee was held on 11 October 2018, Islamabad, and marked the official kick-off
of the study. The meeting approved the approach proposed for preparing the study, its outline, and
tentative timelines. With respect to the latter, while the initial objective of the CI-ACA team was to have
the study completed by 31 December 2018, concerns raised during the first National Steering
Committee meeting, particularly on the need of conducting a thorough analysis, the complex nature of
the subject, its relevance to the national context as a basis to support decision-making processes, and
the consultations/meetings required for data collection, led to an extension of the deadline for the study
completion. The National Steering Committee met for a second time on 4 July 2019, on which
occasion the outcomes of this study were presented, discussed and eventually endorsed. Prior to this
meeting, a national review committee was established with a number of national experts in order to
thorough analyse the study and provide recommendations on the way forward for the consideration of
the National Steering Committee members. The timeline for the study preparation is presented in the
figure below:
2018
Consultation
First Steering
Committee meeting
In-desk review
completion
Final Steering
Committee
meeting
2019
Work plan
and study
outline
finalized
Study milestone
Legend
First draft of
study
Draft of the
study
submitted
for national
review
Final version of
study based on
national review
September October November December January February April May June JulyMarch
Figure 1.2 – Indicative timeline for study preparation with reference to the main milestones and stakeholder
consultations conducted.

18
The study is structured into six chapters: Chapter 2, which follows this introduction, provides an
overview of carbon pricing concepts, shedding light on key definitions and elements, such as how
carbon pricing works in practice, differences and synergies in relation to climate finance, and ways
carbon pricing can fit into national and development priorities.
Chapter 3 introduces the two main existing approaches for putting a price on carbon emissions:
taxation or direct pricing, and emissions trading. A third approach, consisting of hybrid systems or a
combination of approaches, is also introduced. The chapter discusses the merits and drawbacks of
each approach, as well as key features related to their design and implementation, such as scope,
mechanisms to ensure predictability, or the use of offsets. The chapter finalizes with an overview of the
global state of the art of carbon pricing, presenting experiences and lessons learned from a number of
jurisdictions worldwide.
Chapter 4 presents an analysis of the national country context. Special attention is devoted to the
national climate change framework and how existing policies and goals are in line – and could be
supported – by the introduction of a carbon pricing instrument. The analysis examines the major
economic sectors of Pakistan, discussing how they could be impacted and integrated within the
context of a carbon pricing instrument. The analysis also identifies stakeholders in Pakistan that could
play an important role on carbon pricing and, as a way of summary, presents a SWOT analysis and a
“readiness” assessment of Pakistan in relation to the adoption of carbon pricing.
Based on the analysis of the preceding chapters, Chapter 5 proposes a set of carbon pricing options
for the consideration of the Government of Pakistan. For the options identified, the chapter analyses
and discusses design elements as well as challenges and opportunities related to their introduction in
the context of Pakistan.
Chapter 6 distils the main findings of the study and lays out a set of recommendations on the way
forward. In total, 13 key recommendations are provided. This chapter also proposes a number of
follow-up activities to this study in case the Government of Pakistan decides to further explore the
opportunities for developing carbon pricing instruments nationally.
Last but not least, some of the recommendations of this study were supported by an additional “sub-
study”, which analysed in detail the potential for an ETS in Pakistan. This sub-study was developed
with the objective of providing a more robust assessment on the feasibility and viability of such
approach for pricing GHG emissions in Pakistan.18
18 This study is available as a separate document.

19
2. Carbon pricing: an introduction to the concept
Before considering carbon pricing as one of the possible approaches for addressing rising GHG
emissions in the context of Pakistan, this chapter sheds some light on the concept of carbon pricing by
addressing the following questions:
i) What is carbon pricing?
ii) How does carbon pricing work?
iii) What is the difference between carbon pricing and climate finance?
iv) What are the rationales for introducing a carbon pricing mechanism?
v) What are the “co-benefits” of carbon pricing?
These questions are addressed in sections 2.1 to 2.5, respectively. Then, the chapter elaborates on a
set of specific elements related to carbon pricing (Section 2.6) and the importance of building
acceptability to the concept, (Section 2.7), particularly in developing countries.
2.1 What is carbon pricing?
In short: Carbon pricing consists in putting a price signal on greenhouse gases (GHG) emissions.
Carbon pricing pertains to the mechanisms through which the societal, economic, and environmental
costs associated with emitting greenhouse gases revert to the sources of those emissions in the form
of a price on carbon dioxide (CO2) and/or other GHGs19 emitted. As such, carbon pricing aims to
ensure that the costs associated with GHG emissions – or at least part of these – are incorporated into
the economic system.
Without carbon pricing, individual stakeholders responsible directly or indirectly for emissions have no
self-interest in changing their behaviors to minimize their impacts on climate. This situation, whereby
the actions of individual stakeholders go against the general welfare of the society, is commonly known
as “tragedy of the commons”20. Carbon pricing is therefore an approach that aims to instill a shift away
from this paradox: individual stakeholders have an incentive to act according to the general welfare.
2.2 How does carbon pricing work?
In short: Carbon pricing works by directly steering patterns of behaviour, operation, consumption,
investment and planning towards low-carbon solutions among all stakeholders in the society. With
19 GHG include: methane (CH4), nitrous oxide (N2O), hydrofluorocarbons (HFCs), perfluorocarbons (PFCs), and sulphur
hexafluoride (SF6).
20 See for example <https://www.econlib.org/library/Enc/TragedyoftheCommons.html>

20
carbon pricing, stakeholders have a direct incentive to save money with each unit of carbon
reduced.
Direct impact: internalization of the costs of carbon emissions
For many years, it has been argued that the challenges of large and rising GHG emissions cannot be
effectively and efficiently tackled until the multiple decisions through which GHG are emitted include
the environmental costs involved. This process is referred to as “internalizing the cost of climate
change”. An overview of the way carbon pricing works on various types of stakeholders is provided in
the table below:
Type of stakeholder Direct effect of carbon pricing
Large-scale emitters Direct incentive to reduce GHG emissions in operations to save
money.
Direct incentive to switch to less GHG intensive inputs and use inputs (e.g. energy /raw materials) more efficiently in order to be more
competitive.
Investors Direct incentive to invest in more climate friendly solutions as these
will have a competitive advantage.
Government (decision-makers and planners)
Incorporation of climate costs associated with GHG emissions in
planning and public investment decisions.
Consumers Incentive to reduce their carbon footprint as more climate-friendly
consumption and behaviors save money (e.g. either by shifting to less GHG intensive goods and services and/or by lowering the consumption of
GHG intensive goods and services).
Table 2.1 – Effects of carbon pricing per type of stakeholder.
Carbon pricing changes relative prices (but not necessarily the overall cost) of products and services to
reflect all direct and indirect GHG emissions in a way so that firms, consumers, and policy-makers will
take into account the costs of climate change on their decisions. It relies on the empirical fact that
when decision-makers consider an investment or the purchase of goods/services, they are more
reactive to a price signal than to the environmental impacts of their decision.
By affecting all levels of decision – from planning investments, operations to consumption – carbon
pricing triggers a cascading effect as the signal to reduce emissions is provided over the whole
economic chain. In terms of timing, carbon pricing acts in two ways as presented in the table below:
Timing of impact Description of the impact of carbon pricing
Short-term Emissions reduction
In the short term, entities responding to carbon pricing will try to modify their
behavior, operations and consumption patterns for their own economic benefit.

21
Long-term Low-carbon growth
Medium and long-term decisions in terms of purchase and investments will be made by a broad range of stakeholders to account for carbon pricing, leading
to the deployment of more climate-friendly infrastructure, from power grids, production sites, city-planning, individual buildings, means of transportation, etc. This includes opting for solutions that: i) are more energy-efficient; ii) favor
renewable energy technologies, iii) avoid, capture and/or destroy GHG
emissions; and iv) incorporate carbon-neutral or low carbon inputs.
Table 2.2 – Impacts of carbon pricing in the short and long-term.
Indirect impact: utilization of revenues raised
In addition to the direct impact of discouraging all types of actions, decisions and behaviors that
contribute to GHG emissions, carbon pricing can also work indirectly if revenues are raised and
reinvested in initiatives and programs that reduce emissions, fund low-carbon development and/or
contribute to climate change adaptation. This would for example be the case if part of the revenues
raised is placed in investment funds directed at climate protection. Section 3.2.9 sheds light on
possible options for the recycling of revenues raised from pricing carbon.
2.3 What is the difference between carbon pricing and climate finance?
In short: Carbon pricing sets a signal to the economy; climate finance provides means to respond
to it.
Carbon pricing should not be confused with climate finance. While carbon pricing gives a signal for
reducing emissions, climate finance is the financial means for achieving this. Climate finance is defined
as “finance that aims at reducing emissions, and enhancing sinks of greenhouse gases and aims at
reducing vulnerability of, and maintaining and increasing the resilience of, human and ecological
systems to negative climate change impacts.”21
The two concepts are related in the following ways: climate finance enables a response to carbon
pricing by providing the means to invest accordingly. Examples of carbon finance include regular loans,
soft loans, grants, bonds and other types of financial instruments. In this context, it should be noted
that carbon pricing can fully work by responding to the price signal if financing for more climate-friendly
solutions is available. The IPCC special report: Global Warming of 1.5°C, asserts that pricing policies
need to be complemented by de-risking financial instruments, and also that access by developing
countries to low-risk and low-interest finance through multilateral and national development banks
would have to be facilitated.
21 Source: UNFCCC, 2014 Biennial Assessment and Overview of Climate Finance Flows Report, 2014,
<https://unfccc.int/files/cooperation_and_support/financial_mechanism/standing_committee/application/pdf/2014_biennial_asses
sment_and_overview_of_climate_finance_flows_report_web.pdf>

22
2.4 What are the rationales for introducing carbon pricing?
In short: Carbon pricing sets a homogeneous signal to reduce GHG emissions. It enables
emission reductions to happen where they are the most cost-effective instead of favouring specific
sectors, measures and technologies.
The rationales for introducting carbon pricing in a given jurisdiction are typically related to a number of
aspects, such as their cost-efficiency and the “neutrality” of the instrument. This section sheds light on
some of the most relevant of these.
Cost-efficiency: Economists widely agree that carbon pricing is not only the single most effective way
to reduce emissions22, but also the most cost-effcient way of doing so23,24,25. Indeed, studies have
found that both at the theoretical and practical levels carbon pricing approaches are the most cost-
effective instruments to reduce emissions, especially when compared with alternatives26 (see Figure
2.1 below).
Eff
icie
ncy
Effectiveness
CA
RB
ON
PR
ICE
(Mark
et-
based)
NO
PR
ICE
(Com
mand a
nd c
ontr
ol)
Emissions Coverage
Low High
Broad cap-
and-trade
Economy-wide
carbon tax
Energy mix
targets
Single-sector
cap-and-trade
Project
mechanism
Performance
standards
Baseline-and-
credit
Figure 2.1 – Efficiency and effectiveness of instruments that direclty or indirectly put a price on GHG emissions27.
Recent research also suggests that bolder climate action through carbon pricing only has very limited
impacts on economic growth and employment28, and even net positive impacts, while delivering
22 LSE and Grantham Research Institute on Climate Change and the Environment, What is a carbon price and why do we need
one?, 2018, <http://www.lse.ac.uk/GranthamInstitute/faqs/what-is-a-carbon-price-and-why-do-we-need-one/>
23 High-Level Commission on Carbon Prices, Report of the High-Level Commission on Carbon Prices, 2017, Ibid. 24 M. Mehling and E. Tvinnereim, Carbon pricing and the 1.5° C target: near-term decarbonisation and the importance of an
instrument mix, 2018, Carbon and Climate Law Review, 12 (1), pp. 50-61 25 A. Baranzini et al., Carbon pricing in climate policy: seven reasons, complementary instruments and political economy
considerations, 2017, <https://onlinelibrary.wiley.com/doi/pdf/10.1002/wcc.462> 26 OECD, Effective Carbon Prices, 2013, <https://www.oecd-ilibrary.org/environment/effective-carbon-prices_9789264196964-
en> 27 D. Hone, Putting the Genie Back: Solving the Climate and Energy Dilemma, 2017. Emerald Publishing Limited.

23
additional sustainable development benefits – so-called “co-benefits” – which can equal or exceed the
costs incurred with GHG emission reductions.
Neutrality: Instead of dictating where, how and who should reduce emissions, a carbon price provides
a uniform economic signal to emitters and their GHG sources, allowing them to decide to either
transform their activities and reduce emissions, or continue emitting and paying for the emissions.
What makes carbon pricing unique is that while GHG emissions sources are heterogeneous, they are
treated in a homogeneous way. As a result, the overall environmental goal is achieved in the most
flexible and least-cost way to society, as households, firms, and governments alike get to choose the
most cost-effective course of action to reduce emissions.
In short: For “cash-constrained” jurisdictions, carbon pricing has the advantage of not requiring
upfront financing per se. Nevertheless, recycling of revenues may need to occur for mitigating
impacts and ensuring acceptability.
No upfront funding in mitigation measures: An aspect which is typically overlooked when
considering a mitigation instrument is the need for upfront financing. Instruments that
disproportionately rely on up-front funding may be ill-suited for cash-constrained jurisdictions as they
may further amplify budgetary constraints. A brief comparison of carbon pricing with other instruments
is provided below:
Type of instrument Observations Need for upfront
funding?
Fossil fuel tax
Often not fuel neutral as the various fuel rates applied
often translate in very different costs per tCO2e emitted.
The instrument does not address the avoidance of emissions from sources unrelated to fossil fuel (in
particular process-related emissions).
No
Market for energy efficiency certificates
Only focuses on energy efficiency gains with no incentive
for the adoption of fuels with a lower carbon intensity. No
Payments for renewable energy or Market for renewable energy certificates
Only incentivizes power generation from renewable sources, thus not providing the same level of incentive for mitigation action through alternative means (e.g.
energy efficiency).
The instrument does not address emission reducitons
outside the power generaiton sector.
Yes
No
Payment for emission reductions
Limited participation due to barriers such as awareness
about the instrument, capabilities and transaction costs,
in particular for small-scale interventions.
Limited coverage which is restricted to specific targeted
projects/programmes mobilized.
Yes
28 EDF, New analyses agree carbon pricing is a powerful solution, 2018, <http://blogs.edf.org/markets/2018/ 08/23/new-
analyses-carbon-pricing-is-a-powerful-solution/>

24
Renewable energy or energy efficiency mandates
May favour (and force) some types of mitigation action
where the mandate applies, while failing to mobilize the
mitigation potential elsewhere. No
Table 2.3 – Comparison of carbon pricing with other instruments that directly result in GHG emission reductions.
In short: Carbon pricing can be combined with other instruments; however, it needs to be
ensured that this combination is not detrimental but instead results in synergies.
Combination of instruments: Carbon pricing does not imply an impediment to the use of other
instruments. For example, while carbon pricing provides a uniform signal for curbing emissions across
sectors covered, a specific policy could still exist to favour the deployment of renewable energies, as
the interest for deploying renewable energy is not limited to curbing GHG emissions but may also be
driven by other priorities such as reduced dependence from energy imports. On the other hand, the
simultaneous use of several approaches should be carefully considered, as the overlapping of
instruments can result on their weakening and additional costs to society.
In short: Carbon pricing steers away economies from GHG-intensive development and prevents
investments in future “stranded assets”.
Carbon pricing as a means of avoiding the “lock-in” of carbon intensive infrastructure: Carbon
“lock-in” refers to a situation where carbon-intensive infrastructure persists over time, inhibiting the
uptake of lower-carbon alternatives and the transition towards a low-carbon economy. For example, a
coal-fired power plant commissioned now could, in principle, operate beyond 2060 given their 40 to 50
years’ lifespan. Once built, such plants could contribute to locking-in countries into a high GHG
emitting-scenario.
The paradox of a carbon-intensive infrastructure and the need for deep decarbonization may either
result in a failure to achieve sufficient mitigation action or in a sub-optimal economic situation where
part of the infrastructure becomes “stranded”, as these assets become obsolete before the end of their
originally intended economic lifetime. By providing a signal that the cost of GHG emissions will be
factored into decision-making processes, carbon pricing can reduce the carbon lock-in and the
corresponding economic risk of stranded assets.29
In short: Carbon pricing addresses the unfair situation where those likely to be most affected by
climate change – the poor, the vulnerable and future generations – are not those most
responsible for GHG emissions.
29 WBCSD, Why carbon pricing matters – a guide for implementation, 2018, <https://docs.wbcsd.org/2018/04/CARBON_Pricing
_Report.pdf>

25
Ethics and fairness: Carbon pricing can help correct two types of injustice related to carbon pollution.
Firstly, intergeneration climate injustice, which refers to the fact that those most affected by climate
change are often the poor and vulnerable, which have a very minor contribution to GHG emissions
compared to those responsible for GHG emissions and who also benefit the most from associated
economic activities. Secondly, intra-generational climate injustice, which refers to the fact that those
suffering the most from climate change are the young and the generations to come. As such putting a
price on carbon emissions can support preventing the unfair accumulation of a “climate debt” that is
passed to future generations as it reduces the costs that these generations would need to pay due to
climate change.
Views on carbon pricing by key stakeholders and institutions: Strong consensus has emerged
around the potential of carbon pricing to address GHG emission and simultaneously deliver crucial
social and economic benefits to countries in all stages of development.30 This view is strongly backed
by very several sources of thinking, who call for the mainstreaming of carbon pricing as a key policy to
reduce emissions, avoid carbon “lock-in” and support the achievement of sustainable development
goals. Table 2.4 summarizes the views of prominent supporters of carbon pricing.
The use of carbon pricing to address climate change is supported, inter alia, by the following range of
stakeholders: international organizations and institutions, leading economists, major universities (e.g.
Massachusetts Institute of Technology, Yale University, University College London), 73 countries and
22 states, provinces and cities, and more than 1,000 businesses and investors.31 In addition, 27 Nobel
laureates, 4 former Chairs of the US Federal Reserve, and 15 former Chairs of the Council of
Economic Advisers have recently united behind the concept of a carbon tax and dividend as a
solution32.
Representatives of international organizations
Organization / Person Statement
World Bank Group
Kim Yong Kim, President (2012-2019)
“There is a consensus among scientists and economists that carbon pricing
is the best way to signal to economies that the behavior has to change.”33
“Now, many leaders in industry and government are looking to carbon
pricing tools as cost-effective mechanisms for creating incentives for climate
action. They see the triple dividend of carbon pricing: its contributions to the
health of the environment and the public; the revenue it generates; and the
innovation and critical investments in clean and low-emission technologies
that it can drive.”34
30 World Bank, The FASTER principles for successful carbon pricing: an approach based on initial experience, 2015, Ibid. 31 World Bank, 73 Countries and Over 1,000 Businesses Speak Out in Support of a Price on Carbon, 2014,
<http://www.worldbank.org/en/news/feature/2014/09/22/governments-businesses-support-carbon-pricing> 32 Climate Leadership Council, Economists’ Statement on Carbon Dividends, accessed November 2018,
<https://www.clcouncil.org/economists-statement/> 33 France24, Carbon taxes necessary in climate fight: World Bank chief, 2018, <https://www.france24.com/en/20180919-carbon-
taxes-necessary-climate-fight-world-bank-chief>
34 Carbon Pricing Leadership Coalition, Leadership Report 2017-2018, Washington, DC: World Bank.

26
United Nations
António Guterres, Secretary-General
“Carbon pricing can unleash innovation and provide the incentives that
industries and consumers need to make sustainable choices. As we strive
for greater ambition in implementing the Paris Agreement, I urge all
governments and stakeholders to ramp up action on this key instrument for
meeting the climate challenge and seizing the opportunities of a resilient and
low-carbon future.”35
Organisation for Economic Co-operation and Development (OECD)
Angel Gurría, Secretary-General
“Pricing carbon correctly is a concrete and cost-effective way to slow climate
change. We are wasting an opportunity to steer our economies along a low-
carbon growth path and losing precious time with every day that passes.”36
International Monetary Fund (IMF)
Managing Director Christine Lagarde
“Climate change casts a growing shadow over our well-being and especially
the well-being of our children,” [...] “The best way to address the problem
would be to put a price on carbon, such as by taxing carbon emissions.”37
International Panel on Climate Change
Global Warming of 1.5 ºC report
“Explicit carbon prices remain a necessary condition of ambitious climate
policies”
Economists
Organization / Person Statement
High-Level Commission on Carbon Prices
Joseph Stiglitz and
Nicholas Stern, Co-Chairs
and Nobel Laureate
economists
“The world’s transition to a low-carbon and climate-resilient economy is the
story of growth for this century. Our report builds on the growing
understanding of the opportunities for carbon pricing, together with other
policies, to drive the sustainable growth and poverty reduction which can
deliver on the Paris Agreement and the Sustainable Development Goals.”
Jean Tirole, 2014 Nobel
Laureate in Economic Sciences
“Putting a price on carbon is the only effective way to curb emissions to combat climate change”.
William Nordhaus & Paul Romer, 2018 Nobel
Laureates in Economic Sciences
“Economic theory suggests that the best remedy for such externalities is a
pollution charge – a charge on carbon emissions, or what is now called a
carbon tax. A carbon tax raises the price of carbon emissions to reflect its
social costs. It provides powerful incentives to reduce emissions and, as my
fellow laureate Paul Romer has shown, to develop new low-carbon
technologies.”
“All we need to do is create some incentives that get people going in that
direction, and that we don't know exactly what solution will come out of it —
but we'll make big progress. The policy is very simple. If you just commit to a
tax on the usage of fuels that directly or indirectly release greenhouse
gases, and then you make that tax increase steadily in the future ... people
will see that there's a big profit to be made from figuring out ways to supply
energy where they can do it without incurring the tax.”
35 Environmental Defense Fund, Leaders Commit to Regional Cooperation on Carbon Pricing in the Americas, 2017,
<https://www.edf.org/media/leaders-commit-regional-cooperation-carbon-pricing-americas> 36 OECD, Few countries are pricing carbon high enough to meet climate targets , 2018, <http://www.oecd.org/ctp/tax-policy/few-
countries-are-pricing-carbon-high-enough-to-meet-climate-targets.htm> 37 Bloomberg, Lagarde Says World Needs to Spend More to Meet Development Goals, 2018,
<https://www.bloomberg.com/news/articles/2018-09-17/lagarde-says-world-needs-to-spend-more-to-meet-development-goals>

27
Economists and thought leaders in Pakistan and the SAARC region
Organization / Person Statement
Dr. Hafiz A Pasha “Energy taxes effectively act as carbon taxes and reduce the negative
impact of emissions on the environment.”38
Dr. Ishrat Husain
Dean and Director of the Institute of Business Administration, Karachi
“In the area of fiscal policy, carbon tax is not only an effective source of
government revenue, but can also put the brakes on carbon dioxide
emissions through fossil fuels and other carbon intensive industries. The
yields from this tax can be utilized for subsidising the development of
alternate renewable energy sources39.
Dr. Anwar Shah
Economist, Director of the Centre for Public Economics, Chengdu/Wenjiang
“A carbon tax levied by governments in developed countries was efficient,
an effective revenue-generator, and an environmental safeguard.
Developing countries could consider the introduction of a local analogue.”40
Table 2.4 – Views on carbon pricing of renown individuals working with international organizations, economists
and thought leaders in Pakistan and the SAARC region.
2.5 Co-benefits of carbon pricing
In short: Health co-benefits resulting from carbon pricing can more than compensate for the costs
incurred with the instruments, especially in developing countries.
In addition to the GHG emission reduction benefits that carbon pricing may support unleash, there are
several other benefits – usually referred as “co-benefits” – that can result from adopting the
instrument(s). In fact, for certain jurisdictions some of these benefits are considered more urgent
priorities than the curbing of GHG emissions, such as the reduction of local air pollutants or the
opportunity to raise additional revenues. This section elaborates on some of these benefits.
Revenue-raising
A carbon pricing approach can be conceived as a revenue generation mechansim. These revenues
can be utilized for multiple public policy purposes. Depending on how the proceeds are utilized, carbon
pricing could support reducing wealth disparities if used as a progressive redistribution mechanism for
low-income households. Section 3.2.9 further elaborates on revenue resdistribution aspects.
Environmental and health benefits
Imposing a price on carbon emissions can lead to significant environmental and health benefits. The
emissions of GHG and other pollutants usually share the same causes – the combustion of fossil fuels
38 H. Pasha, Energy taxation, 2018, <https://epaper.brecorder.com/2018/01/30/9-page/697042-news.html> 39 SDPI, Pathways to Sustainable Development, 2016, <https://www.sdpi.org/publications/files/SDCAnthology-2014-Pathways-
to-Sustainable-Development.pdf> 40 Governance Institute Network International, A Workshop on Collaborative Research on South Asia Tax Systems, 2010,
<http://www.ips.lk/wp-content/uploads/2017/09/gini.pdf>

28
– but also the same solutions to reduce them, i.e. shifting away from fossil fuels41. Air pollution from
fossil fuels and various emission intensive products have been linked to numerous health issues. For
example, a study by Ambasta et. al (2018)42 reveals that air pollution from fossil fuels leads to
detrimental health effects, which include premature mortality and cardiorespiratory diseases.
Overall, studies indicate strong health co-beenfits from carbon which compensate many or all of the
direct economic costs of climate policy43. One finding in particular is that for the 20 largest emitting
countries, health co-benefits would on average still compensate the economic impact of pricing carbon
as high as $57.5 per ton of CO2, while not even incorporating the climate co-benefits. Similar findings
are noted on a study conducted by the Grantham Research Institute on Climate Change and
Environment, which estimated that health co-benefits resulting from the reduction of local pollutant
emissions could be conservatively put at 50 USD/tCO2 in a developing country.44 Other studies45,46
indicate that developing countries would have the strongest health co-benefits from mitigation policies,
in particular India, China and other East-Asian countries.
In short: Carbon pricing has no discernable impact on employment. If well implemented, carbon
pricing can even benefit the economy with increased investments, employment opportunities,
lower income disparity and reduced impacts associated with fossil fuel imports (trade balance,
vulnerability). Ideally, carbon pricing should be introduced along with a phasing-out of fossil fuel
subsidies.
Economic and geostrategic benefits
Several economic co-benefits can be derived from carbon pricing policies, in particular:
Employment creation: the implementation of carbon pricing can lead to a change in employment
patterns across regions. Carbon pricing can result in a decline of jobs in carbon intensive
industries, while fostering green jobs and technologies that enable a low-carbon economy. Most
models suggest that even strong low-carbon policies have only a minor impact on employment,
and depending on the type of policy, the net impact on employment can be positive47.
41 CPLC Research Conference, Martina Sanchez. 42 A. Ambasta, and J.J. Buonocore, Carbon pricing: A win-win environmental and public health policy, 2018, Canadian Journal of
Public Health,109(5-6), pp. 779-781. doi:10.17269/s41997-018-0099-5 43 See for example: S. Cuevas and A. Haines, Health benefits of a carbon tax, 2015, The Lancet. 387. 10.1016/S0140-
6736(15)00994-0. 44 LSE and Grantham Research Institute on Climate Change and the Environment, Multiple benefits from climate change
mitigation, 2017, <http://www.lse.ac.uk/GranthamInstitute/wp-content/uploads/2017/11/Multiple-benefits-from-climate-
action_Hamilton-et-al-1.pdf> 45 G. Nemet et al., Implications of Incorporating Air-Quality Co-Benefits into Climate Change Policymaking, 2010,
<https://www.researchgate.net/publication/231138406_Implications_of_Incorporating_Air-Quality_Co-Benefits_into_Climate
_Change_Policymaking> 46 A. Markandya et al., Health co-benefits from air pollution and mitigation costs of the Paris Agreement: a modelling study, 2018,
Lancet Planet Health, 2018(2), pp. 126-33, <https://www.thelancet.com/action/showPdf?pii=S2542-5196%2818%2930029-9> 47 See, for example: The New Climate Economy, Better Growth, Better Climate, 2014,<http://static.newclimateeconomy.report/
wp-content/uploads/2014/08/BetterGrowth-BetterClimate_NCE_Synthesis-Report_web.pdf>

29
Investment opportunities: carbon pricing provides an incentive for companies to seriously invest
in new technologies in order to remain competitive and reduce costs.
Reduction in income disparity: depending on how revenues from pricing carbon are
redistributed, it can result in a reduction of income disparity and poverty. This is in particular the
case if revenues are directly returned to citizens, for example on a per-capita basis or in the form
of development projects benefiting low-income households.
Improvement in trade balance: by fostering a reduction in fossil fuel use, carbon pricing can
improve the trade balance of a country. In particular, for fossil fuel importing countries, this would
translate into reduced costs with imports and a higher use of indigenous renewable energy
sources.
Reduced vulnerability to energy imports: curbing fossil fuel imports and switching to domestic
sources of renewable energy reduces the economic and geostrategic vulnerability of countries, in
particular by reducing their exposure to fluctuations in fossil fuel prices.
Reduction in fossil fuel subsidies: carbon pricing should ideally be implemented with the
phasing-out of fossil fuel subsidies. These subsidies translate into a “negative” price on GHG
emissions, and the introduction of a carbon pricing instrument would in fact eliminate this burden.
The removal of fossil fuel subsidies could bring several economic benefits, such as the reduction
of the fiscal resources used in subsidies or the reduction in “excessive” energy consumption due
to the absence of a price that reflects the actual costs of the fuels48.
Visibility and policy impact
Another benefit of implementing carbon pricing is the visibility and “momentum” it can create. Putting a
price on carbon emissions not only demonstrates a commitment to climate protection; it also
encourages action by peers by strengthening the global momentum towards climate action. While
implementation of carbon pricing initially started in high-income countries, middle-income countries and
even low-income countries have joined the common vision that the cost of GHG emissions should be
reflected in economic systems. Least developed countries currently considering implementing carbon
pricing include, among others, Bangladesh, Ethiopia and Senegal. In addition to that, Finance
Ministers of the V20 (a platform of the most climate-vulnerable countries) have committed in their 2017
declaration to price carbon emissions by 2025.49
2.6 Specificities about carbon pricing in developing countries
Much experience exists from the design and implementation of carbon pricing in developed countries
with the first carbon tax implemented in Finland in 1990. Studies conducted ex-post indicate that such
policies have had neutral or even positive effects on competitiveness and gross domestic product
48 UNEP, Fossil fuel subsides – Policy Brief, 2014.
49 V20, 4th V20 Ministerial Communique – Bali, 2018, <https://www.v-20.org/category/v20-official-communications/>

30
(GDP)50. In the past, there was a commonly held belief that carbon pricing could not be a policy option
for emerging economies, and thus should be handled as a small-scope intervention available to high-
income countries only. However, existing evidence on carbon pricing has put these predictions to rest.
In the case of developing countries, similar benefits can be achieved from the implementation of
carbon pricing. Achieving this requires, however, well-designed policies that suit national
circumstances. For developing countries, the following specificities need to be taken into account in the
development of carbon pricing instruments:
Competing policy priorities: policy priorities in developing countries are generally related to
poverty reduction, economic growth and employment creation 51 , 52 . As such, reducing GHG
emissions tends to be considered a low priority. A solution is to design climate policies that are well
aligned with development priorities in order to ensure synergies among these objectives.
Collection of income: carbon pricing can expand the tax collection basis. This is the case of
jurisdictions where tax collection, such as income tax, is limited and where capacities or resources
to expand collection are also limited.
Significant co-benefits: as developing countries may have had so far less resources dedicated to
environmental protection, co-benefits from mitigation action may hold a larger potential, especially
given the air quality issues faced by several jurisdictions.
Positive distributional effects: studies show that carbon pricing in developing countries would
have mostly a positive impact in the reduction of wealth disparity but only if carbon pricing
approaches are designed in ways that do not negatively affect the vulnerable and the poor.
Differences in revenue recycling approaches: different approaches for recycling revenues may
have to be devised in order to achieve economic and social development goals. For example, in
several developing countries a significant part of the economy is still informal and outside the tax
system, and therefore a strategy of returning revenues from a carbon pricing system based on
income tax cuts would only benefit the “better-off” share of the population covered by the income
tax.
2.7 Acceptability of carbon pricing
In short: The acceptability of carbon pricing is essential for its success. It will largely depend on
measures implemented to mitigate its negative impacts as well as the way benefits generated are
communicated.
50 A. Pegels, Taxing Carbon as an instrument of green industrial policy in developing countries, 2016, <https://www.die-
gdi.de/en/discussion-paper/article/taxing-carbon-as-an-instrument-of-green-industrial-policy-in-developing-countries/> 51 A. Krupnick et al., The Ancillary Benefits and Costs of Climate Change Mitigation: a Conceptual Framework,
<http://www.oecd.org/environment/cc/2049184.pdf>
52 Ibid.

31
Acceptance of a carbon pricing approach should be considered a top priority for a number of reasons.
First of all, failure to build and firm-up acceptance for carbon pricing could not only bear a short to mid-
term political cost but also create long-term opposition to the concept as a whole. This could potentially
lead to jurisdictions having to resort to more costly and less efficient approaches to tackle climate
change until the concept of carbon pricing could be re-considered later in the future.
Existing experience indicates that a carbon pricing policy is more acceptable when revenues are
earmarked for environmental purposes or redistributed towards those that are negatively affected by
them. In addition, acceptability can increase when people experience positive effects after a policy has
been implemented. Acceptability for carbon pricing is therefore based on sound design as well as
proper communication on its benefits and impacts53.
53 For a comprehensive account of approaches for communicating carbon pricing, see: PMR, Guide to Communicating Carbon
Pricing, 2018, <http://documents.worldbank.org/curated/en/668481543351717355/Guide-to-Communicating-Carbon-Pricing>

32
3. Approaches for carbon pricing
With the essential background and theory provided in Chapter 2, this chapter elaborates on the
different approaches that exist for carbon pricing – carbon tax, emissions trading and hybrid
approaches – and discusses their different merits and drawbacks (Section 3.1). As the development of
a carbon pricing instrument entails making certain choices, the chapter will then shed light on the main
design elements that can be tailor-made to the specific circumstances of the jurisdiction where the
instrument is implemented (Section 3.2). This is followed by Section 3.3, which provides a snapshot of
the status of carbon pricing around the world and introduces a number of case studies with lessons
learned from the design and implementation of these instruments.
3.1 Main approaches
As countries evaluate the most effective carbon pricing plan for their countries, they have two main
options: i) carbon taxation, and ii) emissions trading systems (ETS), also usually known as “cap-
and-trade”. Carbon tax and ETS differ in a number of ways. Under a carbon tax, the regulator sets a
price on GHG emissions. These will be reduced based on the reaction of covered participants to the
price signal given to the economy by the tax. Under an ETS, the regulator limits the amount of GHG
emissions allowed, either through a fixed or variable cap. The price for GHG emissions results from the
market balance established between this limit imposed in GHG emissions (the cap) and the demand
for emitting GHGs. To achieve compliance, participants are required to surrender emission rights
corresponding to their emissions. Trading enables participants to buy and sell these emission rights.
Besides these two main approaches, several hybrid schemes derived from the combination of both or
of other instruments have also been proposed and/or applied. These three main design options are
introduced in this chapter.
3.1.1 Carbon taxation / direct pricing
General concept
A carbon tax directly establishes a price on CO2 emissions by defining a tax rate on these emissions,
usually based on the carbon content of the fossil fuels covered. The tax rate is usually expressed in
monetary terms per unit of CO2 emitted (e.g. on USD per tCO2e basis). This means that entities
covered by a carbon tax are required to pay a fee as a function of their emission levels. Therefore,
entities covered or indirectly impacted have a self-interest to cut their emissions to avoid paying the
carbon tax. The entities covered by the tax – i.e. the sources of emissions – represent the tax base.
Under a carbon tax, the price is known, giving a high level of investment certainty. The aggregated
impact of the carbon tax is, however, difficult to estimate, both ex-ante and ex-post:

33
Ex-ante: setting the tax at the level needed to achieve a specific outcome may require
modelling the cost of reducing emissions relative to a specific target, which means that
limitations or inaccuracies in the model will result in a deviation from the intended emissions
reduction target(s);
Ex-post: evaluating the real impact of a carbon tax might be complex and involve a large range
of uncertainties.
In short, with a carbon tax the regulator has to cope with a major uncertainty, as the environmental
outcome – i.e. the level of emissions reduced – is difficult to predict.
Objectives of a tax on carbon emissions
As many different parameters can be considered to design a carbon tax system, policy-makers need to
set the objectives to achieve by implementing the carbon tax. Usually, jurisdictions that adopt a carbon
tax have the following objectives:
Carbon taxes designed mostly to raise revenues: to this end, the tax should in principle have a
broad tax base and minimize the scope for rebates and compensation measures which would
reduce the revenues obtained from the tax;
Carbon taxes designed mostly to lower GHG emissions: for this purpose, the price signal should
be maximized and applied to sectors with the highest mitigation potential. A high tax rate would
however require measures to mitigate negative impacts and the acceptability among those
targeted by the tax, for example by offering rebates on the tax (e.g. a share of emissions not
taxed) and/or the recycling/returning of revenues for the benefit of those affected.
Point of regulation
A carbon tax can be applied either upstream (for example at the level of fuel production or importer) or
downstream (at the level of emitters). If applied downstream at the level of emitters (in general, large-
scale emitters), a carbon tax can be considered as a springboard towards the introduction of an ETS. If
applied upstream, the tax enables a large coverage of dispersed downstream sources of emissions
(e.g. vehicles).
Complexity level
The implementation of a carbon tax is, in general, technically easier than in the case of other carbon
pricing instruments:
Simplicity in design: implementing a carbon tax “only” requires the jurisdiction to be able to
levy taxes and to have the ability to determine and verify emissions at the point of application;

34
Short implementation timeframe: in recent years, countries have been able to put in place
carbon taxes in a very short period of time. Colombia is a case in point54;
Relatively low administrative costs: by typically taking advantage of already existing fiscal
and institutional structures, administrative costs of a carbon tax tend to be comparatively low.
Acceptability
As a tax, carbon taxation may face significant opposition from taxpayers (households, businesses) as
well as political parties and even different government agencies. Therefore, the introduction of a
carbon tax may require efforts in awareness raising and communication 55 , the identification of
concerns of actors impacted through consultations, and in addressing the issues identified. This aspect
was already discussed in Section 2.7 but for carbon pricing approaches in general.
Introducing a carbon tax
Carbon taxes should ideally be implemented in a jurisdiction in conjunction with a broader fiscal reform
process. The interaction of the new tax with the pre-existent fiscal instruments is crucial for its
effectiveness. In this context, a series of good practices may be considered by the jurisdiction adopting
a carbon tax:
Integrating the carbon tax with existing instruments (fees, levies, charges, etc.) which already
apply to GHG emitting activities or sources, both directly (e.g. fuel taxes) or indirectly (e.g.
existence of energy savings mechanisms or feed-in tariffs) so as to ensure consistency to the
extent possible with the level of charges on GHG emissions;
Considering the interaction of the tax within its broader environment, i.e. with other existing
instruments or fiscal elements and how these would complement or conflict with the carbon tax;
Avoiding the introduction of a carbon tax at unfavourable points in time, for example when the
stakeholders impacted face certain hardships (e.g. high unemployment rate) or are at risk of
being affected by high prices increases which are not related to the carbon tax but which could be
mistakenly blamed on it.
Optimal operation
Carbon taxes are “classic” market-based instruments and so the effects they produce depend on how
the market in question responds to them. In general terms, the price signal provided by a carbon tax
will have greater mitigation effects in liberalized markets with highly elastic demand56. With regards to
the operation of a carbon tax, the following observations can be made:
54 IETA, 2018, “Colombia: An Emissions Trading Case Study”, < https://www.ieta.org/resources/Resources/Case_Studies_
Worlds_Carbon_Markets/2018/Colombia-Case-Study-2018.pdf> 55 On this subject, see for example: PMR, Guide to Communicating Carbon Pricing, 2018, Ibid.
56 PMR, Carbon Tax Guide: A Handbook for Policy Makers, 2017, World Bank, Washington, DC.

35
Carbon taxes work better in market-driven economies where individual stakeholders (households,
businesses, etc.) would seek to reduce emissions for their own economic benefit;
To achieve emission reductions, taxes are best applied in elastic markets/sectors where the price
signal can lead to substantial changes in direct and/or indirect emissions (i.e. changes in the
consumption of fossil fuels goods and services such as electricity);
Applying a carbon tax in markets/sectors with low elasticity of demand (where the response to the
carbon price is limited or slow) will mostly result in revenues generated to tax authorities. These
revenues could, however, be “recycled” in order to encourage more climate action in other
sectors, so that even sectors with low elasticity of demand can contribute to emission reductions.
3.1.2 Cap-and-trade mechanism / Emissions trading system
General concept
An Emission Trading System (ETS) – also known as “cap-and-trade” – is a tradable-permit system for
GHG emissions. It sets a limit (the cap) determined by the regulator on the amount of GHG that can be
emitted. Entities covered by the ETS need to hold one emissions permit (designated as “allowance”)
for each tonne of GHG emitted. However, entities have the flexibility of selling and buying these
emission units. The sum-total of emission units reflects the size of the cap in the ETS. Under this
approach, the price on carbon emissions will depend on the balance between the supply and demand
of the emission units. With an ETS, the environmental outcome is known and is reflected on the
emissions cap. However, the resulting price is not known in advance and is usually challenging to
estimate.
An ETS is the most cost-efficient carbon pricing approach as it enables a high degree of flexibility to
both the regulating entity and the entities covered. In particular, participants can choose between
lowering their own emissions or buying compliance units from other participants that have emitted
below their emissions limit. Participants with a large mitigation potential may be able to mobilize it by
selling their surplus of emission allowances. Participants with a limited mitigation potential would need
to buy emission allowances from others, in fact creating a demand and funding the emission
reductions of other participants/installations. The market therefore lays out the ground for emission
cuts to occur at the lowest possible cost among the participants of the system.
Point of regulation
The point of regulation for an ETS is generally “downstream”, i.e. at the level of where emissions take
place (e.g. power plants, large-scale industrial facilities, etc.), which are large enough to justify the
costs associated with implementing and operating an ETS (see Point 3.2.1 below). Nonetheless, some
sectors with an upstream point of regulation could also be included under the scope of the ETS.

36
Allocation of allowances
Regulators can choose how allowances are made available to the ETS participants. There are two
possible approaches for allowance allocation: “auctioning” and “free allocation”. Both are described in
the table below:
Auctioning Consists in selling auctions to the ETS participants through public auctions. This method
allows the government to raise revenues through the sale of allowances; however, this
implies a cost to the participant. This method is therefore mostly used for sectors which are
not exposed to international competition (e.g. power generation).
Free allocation Free allocation consists in handing out for free the emission allowances to participants,
enabling them to cover all or part of their compliance obligations. Handing out allowances
for free reduces the cost of participants in achieving compliance. This approach is therefore
used to limit the so-called “carbon leakage” risk (i.e. companies relocating to other
jurisdictions where carbon pricing instruments are not in place). Two main approaches
exist for the free allocation of allowances:
Grandfathering: consists in handing out free allocations on the basis of historical
emissions. While grandfathering tends to protect the status-quo as emitters receive a
quantity of allowances based on their past emissions, it is generally accepted by
participants without much opposition.
Sectoral benchmark: consists in handing out free allowances based on a reference level
applicable to all entities in a certain sector/product. The benchmark is typically expressed
in the number of allowances per unit of output (e.g. tCO2e per ton of cement clinker). With
this approach, the activity level considered can either be based on international benchmark
values, historical values, or on actual measured output.
Table 3.1 – Approaches for allowance distribution in an ETS.
In practice, an ETS may use different approaches for the allocation of allowances, depending in
particular on the sector considered and the risk of carbon leakage. It has also been observed that
several ETS have started with free allocation to ease concerns of participants on compliance costs,
while gradually shifting towards auctioning.
Complexity
An ETS is generally more complex to develop and operate than a carbon tax. Among several reasons,
this is due to the higher number of design parameters that need to be considered, the need to
establish an institutional and legal infrastructure to support the market, and the set-up of an MRV
framework for effective operation. Some of the most complex and critical choices in designing an ETS
relate to the cap setting and allowance distribution. Nevertheless, with well over 10 years of experience
available in the design and continued operation of ETS worldwide, understanding what ensures a
successful ETS and how to overcome difficulties has greatly improved.

37
Acceptability
Compared to a carbon tax, the level of political acceptability of an ETS is generally higher57. In
particular, an ETS typically only covers a rather limited number of large-scale emitters which are often
businesses. Such entities are most of the time already used to complying with a number of
environmental regulations. In this connection, covered entities tend to have a higher level of
awareness as well as a sound understanding of economic instruments for environmental purposes.
This reduces misperception risks and increases the ease of designing cost-effective mitigation
measures. Furthermore, the limited number of entities covered makes outreach and consultations less
complex.
An ETS, as a carbon pricing instrument, does not directly impact end-user consumers. However, it
should be noted that it may impact them indirectly, for example in case the price of emissions is
reflected in higher electricity prices. This may require compensation or “alleviation” measures as a
means of ensuring acceptability.
Optimal operation
For an ETS to be well-functioning, a number of conditions need to be met, namely the following:
Adequacy of the emission cap, which should be set based on the desired level of ambition over
time;
Interventions from the system regulator should be minimized so that participants have
confidence that the market is free from arbitrary intervention;
The effort delivered through the cap-and trade system is fair across sectors as well as among
individual participants;
Sufficient levels of capacity and familiarity have been built among participants as a condition for
effective participation;
An adequate regulatory oversight with enforcement is made available, and that this oversight is
perceived as neutral and non-discriminatory;
Participants have the means to respond to the price signal. This requires they have access to the
means and solutions (e.g. technologies, fuels, human resources, etc.) needed to implement the
required mitigation action(s).
In addition to the above, it should be highlighted that a well-functioning market for emission allowances
can only exist if two important conditions are met. First of all, that the market is balanced and is not
dominated by a small number of participants representing an overwhelming share of GHG emissions
and therefore own the majority of allowances. A second element is the need to ensure market liquidity,
57 See, for example: A. Pegels, Taxing Carbon as an Instrument of Green Industrial Policy in Developing Countries, 2016, Ibid.

38
i.e. that the market has a sufficient number of participants in order to enable the regular trading of
allowances, leading to the continuous formation of a market price of CO2 emissions.
3.1.3 Hybrid approaches and combinations of approaches
While most systems in operation globally fall into the categories of ETS or carbon tax, there is a variety
of carbon pricing mechanisms that blend elements of the two or even combine them into further
instruments. In addition, an increasing number of jurisdictions is using both a form of carbon tax and
ETS, either in the same or different sectors. Combinations of instruments can also be used to respond
to the specific needs and characteristics of the country's emissions profile. Examples of these
combinations could be an ETS with a price floor and/or ceiling, or taxation schemes that accept
emissions reduction units to lower tax liabilities58. Additionally, the transition from a certain instrument
to another is also possible (e.g. from a carbon tax to an ETS).
Overall, international developments on carbon pricing indicate there is an inclination towards
articulating the best of both worlds: i.e. the price stability of a carbon tax with the flexibility/tradability
which is a key feature of an ETS. A non-exhaustive list of such possible combinations is provided in
the table below:
Combination/blending modality
Notes and observations
ETS + offsets An ETS is applied to specific sectors, while credits for emission reductions
achieved outside covered sectors can be generated and used for
compliance under the ETS. This combination allows sourcing compliance
units at a cost lower than that of the ETS and extends the price signal to
other sectors in the form of an incentive for emission reductions. Several
jurisdictions which have implemented an ETS allow the use of offsets (e.g.
the EU ETS, the Korean ETS, etc.)
ETS + price control
mechanism
An ETS is operated but mechanisms to control the price apply to ensure
either a minimum price and/or a price ceiling. This solution increases the
investment certainty for curbing emissions by guaranteeing a price range for
allowances. The United Kingdom is an example of a jurisdiction that has
introduced a carbon price floor.
ETS + carbon tax
(overlap)
The entities covered by an ETS also face a carbon tax, ensuring that even if
allowance prices drop dramatically, a carbon price would still apply to them.
The combination can be achieved either through imposing a carbon tax
upstream (on fuel importers/producers) or by levying a tax on emission
allowances surrendered.
ETS + carbon tax (in
different sectors)
Specific sectors are covered by an ETS while other sectors outside the ETS
scope are covered by a carbon tax. Examples of jurisdictions adopting this
modality are Mexico or Portugal. Both instruments can be linked if revenues
from the tax are reinvested in the ETS, for example by purchasing and
58 M. Bennet, Australian Climate Change Mitigation Law in the Era of the Paris Agreement, 2018, <https://api.research-
repository.uwa.edu.au/portalfiles/portal/33118427/THESIS_DOCTOR_OF_PHILOSOPHY_BENNETT_Michael_Bruce_2018.pdf
>
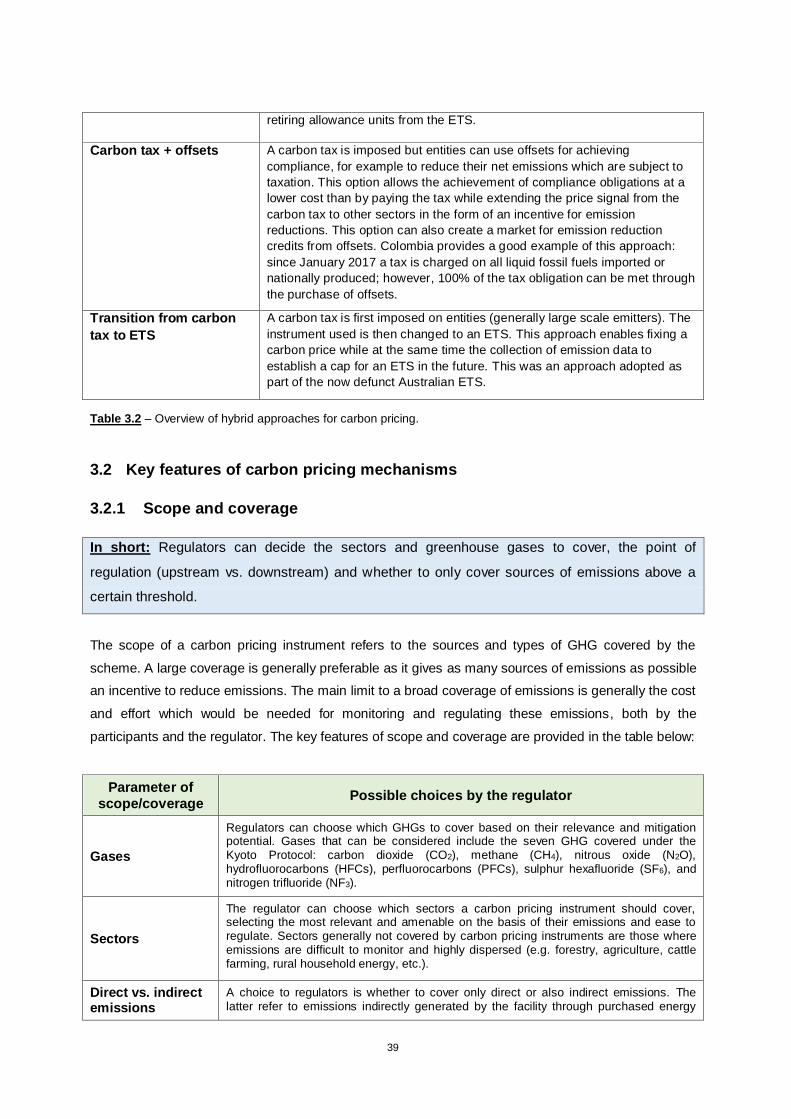
39
retiring allowance units from the ETS.
Carbon tax + offsets A carbon tax is imposed but entities can use offsets for achieving
compliance, for example to reduce their net emissions which are subject to
taxation. This option allows the achievement of compliance obligations at a
lower cost than by paying the tax while extending the price signal from the
carbon tax to other sectors in the form of an incentive for emission
reductions. This option can also create a market for emission reduction
credits from offsets. Colombia provides a good example of this approach:
since January 2017 a tax is charged on all liquid fossil fuels imported or
nationally produced; however, 100% of the tax obligation can be met through
the purchase of offsets.
Transition from carbon
tax to ETS
A carbon tax is first imposed on entities (generally large scale emitters). The
instrument used is then changed to an ETS. This approach enables fixing a
carbon price while at the same time the collection of emission data to
establish a cap for an ETS in the future. This was an approach adopted as
part of the now defunct Australian ETS.
Table 3.2 – Overview of hybrid approaches for carbon pricing.
3.2 Key features of carbon pricing mechanisms
3.2.1 Scope and coverage
In short: Regulators can decide the sectors and greenhouse gases to cover, the point of
regulation (upstream vs. downstream) and whether to only cover sources of emissions above a
certain threshold.
The scope of a carbon pricing instrument refers to the sources and types of GHG covered by the
scheme. A large coverage is generally preferable as it gives as many sources of emissions as possible
an incentive to reduce emissions. The main limit to a broad coverage of emissions is generally the cost
and effort which would be needed for monitoring and regulating these emissions, both by the
participants and the regulator. The key features of scope and coverage are provided in the table below:
Parameter of scope/coverage
Possible choices by the regulator
Gases
Regulators can choose which GHGs to cover based on their relevance and mitigation potential. Gases that can be considered include the seven GHG covered under the Kyoto Protocol: carbon dioxide (CO2), methane (CH4), nitrous oxide (N2O), hydrofluorocarbons (HFCs), perfluorocarbons (PFCs), sulphur hexafluoride (SF6), and nitrogen trifluoride (NF3).
Sectors
The regulator can choose which sectors a carbon pricing instrument should cover, selecting the most relevant and amenable on the basis of their emissions and ease to regulate. Sectors generally not covered by carbon pricing instruments are those where emissions are difficult to monitor and highly dispersed (e.g. forestry, agriculture, cattle farming, rural household energy, etc.).
Direct vs. indirect emissions
A choice to regulators is whether to cover only direct or also indirect emissions. The latter refer to emissions indirectly generated by the facility through purchased energy

40
(e.g. in the form of electricity and/or heat). For the sake of simplicity and for avoiding pricing GHG emissions twice (e.g. at the level of power production and power consumption), most carbon pricing systems only cover direct GHG emissions.
Type of entity covered
The regulator can choose to cover either facilities/installations or legal entities (those who are the owners of sources of emissions). The rationale for an ETS to cover emissions at the facility level is that this enables the collection of more accurate information on GHG emissions.
Point of regulation
Regulators can choose to cover emission either “downstream”, i.e. at the point where they occur (e.g. power plants, cement factories, landfills, vehicles, etc.) or “upstream”, i.e. at the level of production or import of fossil fuels.
When making a decision on this, regulators should consider the complexity and cost of conducting the MRV of emissions at the level targeted. For example, for carbon taxes applied to road transportation, the point of regulation chosen is generally upstream.
Carbon taxes are usually regulated upstream – whereby the tax would only be applied
to specific fossil fuels – or at the level of large-scale emitters.
For an ETS, the point of regulation is usually at the level of the facilities/entities that are
large sources of emissions. For this reason, almost all ETS cover the power sector and heavy industries. Nevertheless, some ETS, such as the California ETS, also includes distributers of fuels for transportation and domestic uses.
Emissions
threshold
If GHG emissions are covered downstream (for example at the level of emitters), policy-makers can decide to only cover entities with annual GHG emissions above a certain threshold. Covering GHG emissions from a source entails costs related to MRV, both by entities covered and the regulator, who will enforce provisions. Therefore, the trade-off between broad coverage and cost/effort should be considered.
Table 3.3 – Design options for deciding on the scope and coverage of a carbon pricing instrument.
3.2.2 Stringency of the instrument
In the context of carbon pricing, “stringency” refers to the level of ambition of the instrument. The level
of stringency can be expressed or understood in different ways.
In the case of a carbon tax, the price level at which it is set indicates the ambition of the instrument. In
this respect, the response of the entities covered by the tax to the price signal would be in mobilizing
mitigation opportunities in the form of costs saved up to the level the tax is set. In the case of an ETS,
the ambition level is set through the emission cap compared to business-as-usual (BAU) emissions. An
emission cap higher or equal to BAU has no ambition; conversely, a cap substantially lower than BAU
can be considered ambitious.
Setting the right level of stringency is one of the most complex tasks in the design of a carbon pricing
instrument, and therefore a number of key considerations should be taken into account. On the one
hand, a low level of stringency should be avoided as it would fail to deliver on the objectives of curbing
GHG emissions. In addition, it may “lock-in” too low ambition levels for years, which may be difficult to
subsequently correct while reducing confidence in carbon pricing as an economic instrument. A level of
stringency that is too severe will eventually result in a carbon price that may be perceived as too high.
This can lead to strong resistance by entities covered by the scheme, especially for industries exposed
to international competition.

41
Stringency levels may therefore need to evolve over time, in line with the targets proposed by countries
on their NDCs. Switzerland is a case in point on how a carbon tax was adjusted to meet specific
targets. In 2008, Switzerland implemented a carbon tax on all fossil fuels starting at CHF 12 per tCO2e
(approx. 12 USD/ tCO2e), reaching CHF 36 in 2014 (approx. 35.5 USD/ tCO2e). The law underpinning
the tax mandated an increase in the carbon tax rate in case the interim climate targets were not
achieved. For example, if the 2012 target to cut emissions was not achieved (consisting of a 21%
reduction compared to the 2010 baseline), the tax would jump to CHF60 in 2014.59
3.2.3 Setting a cap in the ETS
In short: Setting the cap “right” in an ETS requires a delicate balance between cost and ambition.
Estimating future emission levels can be particularly challenging, especially in the context of
developing countries. Instead of setting up an ETS with a fixed amount of allowances, countries
can set variable caps based on real outputs and/or build in price management mechanisms.
As noted in the point above, the stringency of an ETS is reflected in the level of the emissions cap that
is set. Setting the emissions cap is one of the most challenging tasks to the regulator: if the cap is set
too low, this will result in low carbon prices which would be insufficient to incentivize emission
reductions. If the cap is too stringent, it would create a strong scarcity of emission allowances and
hence high prices.
Difficulties in setting the cap can be further aggravated due to unpredictable events. In the case of the
European Union ETS (EU ETS), the economic crisis of 2008 led to an unexpected drop in production
levels and associated GHG emissions. In order to address these challenges, several approaches can
be adopted by the regulatory entity:
Initiate the ETS with a trial phase: a trial or pilot phase with a low ambition level could be useful
to obtain actual data on emissions of the entities covered, based on which the emission caps of
future phases could be determined with lower risks of emission overestimation;
Intensity-based cap: instead of being fixed, emission caps can be set proportionally to the
activity level (e.g. GWh of power produced, tonnes of products manufactured/consumed). This is
achieved by multiplying this activity level by the emissions intensity of the facility. This approach
may be particularly well suited for developing countries as it eliminates the need to forecast
activity levels.
Market management measures: a number of market management measures can be deployed
to overcome problems created by an inadequate cap. These measures are detailed in point 3.2.4
below. 59 For further details, see:
<https://www.ezv.admin.ch/dam/ezv/de/dokumente/abgaben/A%20MML/Min%C3%B6St/anhang1_vo_co2.pdf>

42
Initiate the ETS with a fixed price: this eliminates the risk related to price uncertainty due to the
uncertainties in the level at which the emissions cap is set. An example of this approach is
Australia’s plans to introduce an ETS in July 2012, which was eventually repealed in July 2014.
The concept of the ETS was to first set a fixed carbon price and then to determine the future
emission cap based on the GHG emissions resulting from this level60.
3.2.4 Stability and predictability
Decades of experience with carbon pricing have shown that price stability and predictability are
essential elements of the instrument that is developed. In particular, they are important to give the
private sector certainty to invest in technologies and measures that lead to emission reductions.
In the case of carbon taxes, these are stable by definition as the applicable price signal is set in
advance. As climate ambition would, in principle, need to be ramped-up over time, a government can
set a plan for gradual increases in carbon prices. Announcing well in advance future increases would
enable stakeholders to plan accordingly and hence contribute to the predictability of the instrument.
In the case of an ETS, the price signal on GHG emissions fluctuates as a function of the
supply/demand balance of the system, leading to less stability and predictability. Nevertheless, market
management measures can be introduced to better match supply and demand. The following table
provides an overview of some market management measures that can be considered in the design of
an ETS:
Measure Explanation
Price floor For the auctioning of emission allowances, a “reserve price” applies: no
emission allowance will be sold under this minimum price (i.e. the price floor).
Top-up fee Consists of a fee that is levied at the time of surrendering allowances, and
which could be made to correspond to the difference between the market or
average price of the allowance and its “desired” or targeted level.
Price ceiling The regulator makes an unlimited number of allowances available at the price
ceiling, whereby the price cannot exceed this level.
Price-triggered
allowance release
If the market price exceeds certain levels, additional emission allowances are
made available to the market. This can, for example, be done by setting a cap
and only releasing allowances under certain price conditions.
Quantity based
mechanism
Through this approach, a reserve withholding allowances is established:
If the number of allowances in circulation exceeds a certain level (“long
market”), emission allowances are placed in the reserve;
If the number of allowances in circulation is under a certain level (“short
market”), emission allowances are released from the reserve.
60 WWF, Australia’s Emissions Trading Scheme: Implications of an Early Move to a Flexible Price, 2013,
<www.wwf.org.au/ArticleDocuments/360/pub-policy-brief-australias-emissions-trading-scheme-16jul13.pdf.aspx>

43
Delegated
intervention
A designated body (e.g. committee) is authorized to intervene if certain
conditions occur (e.g. in case allowance prices fall out of designated ranges).
Such body, much like a central bank, is entrusted with a clear mandate and
purpose (price or quantity) for intervening.
Table 3.4 – Market management measures to support stability and predictability in an ETS.
3.2.5 Discounts and rebates
In short: Different forms of rebates and discounts can be used to cut part of the cost entities pay
on their emissions, whether under a carbon tax or an ETS, while preserving the price level which
sets the incentive.
Under a carbon pricing instrument, the price per tCO2e applied to covered entities is not necessarily
the same as the cost per tCO2e, and therefore the distinction between the two concepts needs to be
considered. In addition, different forms of rebates and discounts can be applied in order to cut part of
the costs while preserving the price level which sets the incentive. The equation below relates these
concepts in the form of an equation, and they are further developed in Table 3.5.
Cost from carbon pricing = [ (Specific price per tCO2e) X (Amount in tCO2e) – Rebates]
Concept General definition Meaning in the context of carbon pricing
Cost An expense incurred with
something
The expense associated with the application of carbon
pricing, for example for one tCO2e.
Price The value placed on a
certain item
The value of one tCO2e under the instrument:
- In an ETS, this is the market value of one emission
allowance;
- Under a carbon tax, this is the applicable rate of the
carbon tax expressed in money per tCO2e.
Rebates and
discounts
A partial refund or
reduction of the sum due
as per the applicable
price
Examples in the context of a carbon pricing instrument:
- Under a carbon tax, a certain share/amount of emissions
for which the tax does not apply;
- Under an ETS, a certain share of emission allowances
handed out for free (known as “free allocation”) to cover
part of the emission compliance.
Table 3.5 – Concepts of “cost”, “price”, “rebate and discounts” in the context of carbon pricing.
A key advantage of rebates and discounts is that by mitigating the cost of carbon pricing for entities
covered, they can enable the preservation of a stronger price signal while reducing the impact on those
most affected. For example, low-income households could receive rebates or discounts on their energy
bills to cut the cost carbon pricing would otherwise put on them. Additionally, rebates for energy-

44
intensive industries exposed to international competition can alleviate concerns over distortions in
relation to their competitiveness.
The use of rebates should, however, be considered carefully and given to those who really need it in
order to ensure that the cost of carbon is reflected as much as possible in the economy. The structure
of rebates should overall not weaken the incentive to reduce emissions. Rebates should therefore be
prioritized to: i) industries facing international competition based on their carbon intensity, and to ii)
low-income households which are impacted by higher energy prices.
3.2.6 Flexibility
In short: Regulators may enable the use of flexibility mechanisms to participants covered by a
carbon pricing instrument. These include the use of offsets and, in the case of ETS, the banking
and borrowing of allowances.
In the context of carbon pricing, flexibility mechanisms pertain to all measures which can provide more
freedom and opportunities to covered entities for achieving compliance. One possible measure to
provide flexibility which can be used both under ETS and carbon taxes alike is the use of offsets
(covered in the following section). In addition to that, specific measures can increase the flexibility for
compliance in the context of ETS, namely the banking and borrowing of allowances:
- Banking refers to the use of emission allowances from a certain year for compliance in future
years. Allowing banking over long periods of time can strengthen the confidence of participants
in the market. For example, if participants expect that future prices may be higher (e.g. due to a
a more constrained cap in the future), they may implement deeper emission cuts in the short
term to save emission allowances for future use when prices are higher.
- Borrowing refers to the possibility given to ETS participants of using allowances in future years
for compliance in the present. While this option enhances compliance flexibility, this can be seen
as a means of delaying mitigation actions. Therefore, most ETS either do not allow or put strong
restrictions on allowance borrowing.
3.2.7 Use of offsets
In short: Regulators can decide whether emission reduction credits from activities implemented
outside the scope of the carbon pricing mechanism can be used for compliance. Allowing the use
of offsets gives additional flexibility for compliance and sets an incentive to cut emissions in
sectors outside the scope of the carbon pricing instrument.
A key decision by regulators is whether to allow the use of offsets for compliance under the carbon
pricing mechanism. Offsets are credits for emission reductions achieved outside the scope of the
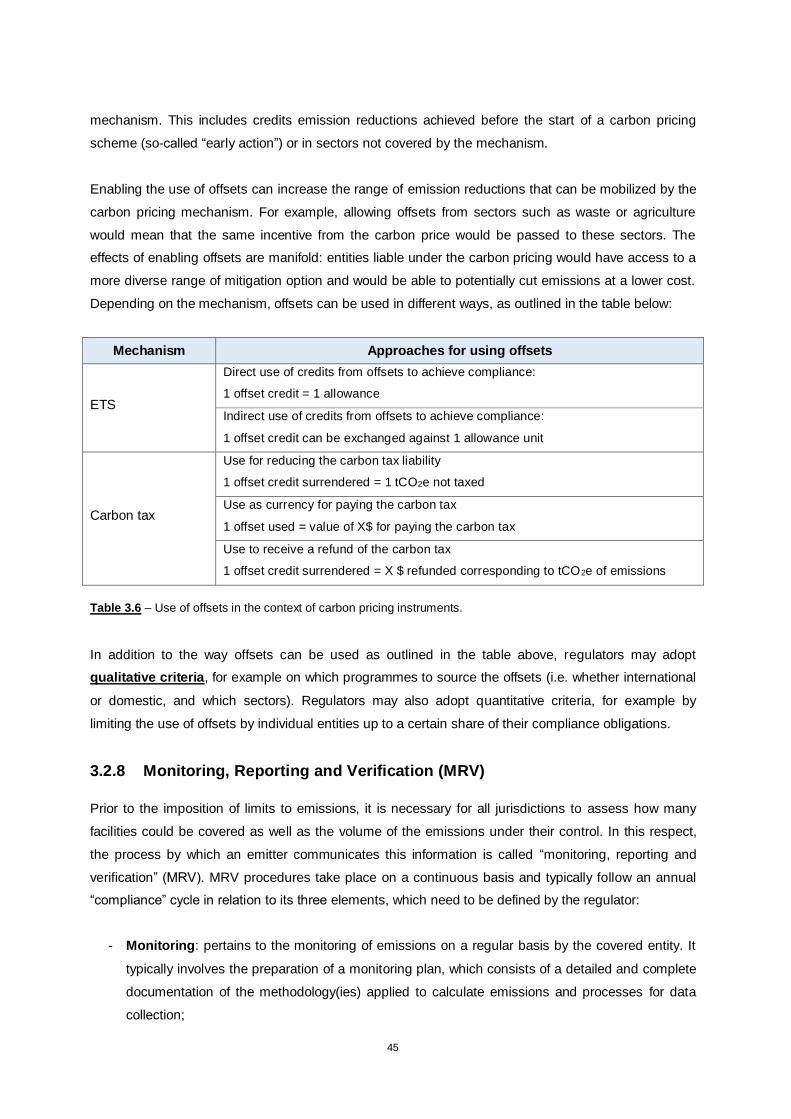
45
mechanism. This includes credits emission reductions achieved before the start of a carbon pricing
scheme (so-called “early action”) or in sectors not covered by the mechanism.
Enabling the use of offsets can increase the range of emission reductions that can be mobilized by the
carbon pricing mechanism. For example, allowing offsets from sectors such as waste or agriculture
would mean that the same incentive from the carbon price would be passed to these sectors. The
effects of enabling offsets are manifold: entities liable under the carbon pricing would have access to a
more diverse range of mitigation option and would be able to potentially cut emissions at a lower cost.
Depending on the mechanism, offsets can be used in different ways, as outlined in the table below:
Mechanism Approaches for using offsets
ETS
Direct use of credits from offsets to achieve compliance:
1 offset credit = 1 allowance
Indirect use of credits from offsets to achieve compliance:
1 offset credit can be exchanged against 1 allowance unit
Carbon tax
Use for reducing the carbon tax liability
1 offset credit surrendered = 1 tCO2e not taxed
Use as currency for paying the carbon tax
1 offset used = value of X$ for paying the carbon tax
Use to receive a refund of the carbon tax
1 offset credit surrendered = X $ refunded corresponding to tCO2e of emissions
Table 3.6 – Use of offsets in the context of carbon pricing instruments.
In addition to the way offsets can be used as outlined in the table above, regulators may adopt
qualitative criteria, for example on which programmes to source the offsets (i.e. whether international
or domestic, and which sectors). Regulators may also adopt quantitative criteria, for example by
limiting the use of offsets by individual entities up to a certain share of their compliance obligations.
3.2.8 Monitoring, Reporting and Verification (MRV)
Prior to the imposition of limits to emissions, it is necessary for all jurisdictions to assess how many
facilities could be covered as well as the volume of the emissions under their control. In this respect,
the process by which an emitter communicates this information is called “monitoring, reporting and
verification” (MRV). MRV procedures take place on a continuous basis and typically follow an annual
“compliance” cycle in relation to its three elements, which need to be defined by the regulator:
- Monitoring: pertains to the monitoring of emissions on a regular basis by the covered entity. It
typically involves the preparation of a monitoring plan, which consists of a detailed and complete
documentation of the methodology(ies) applied to calculate emissions and processes for data
collection;

46
- Reporting: consists in the formal communication of a covered entity to the regulator on its GHG
emissions in a given period of time and under the specific pre-established parameters defined by
the regulator.
- Verification: pertains to the process of reviewing the data provided by the regulated company in
order to ensure its quality, reliability and accuracy. In order to ensure the transparency of the
process, verification should be carried out by a third-party.
Carbon pricing therefore builds on a solid foundation of MRV. While this creates the need to develop or
further develop the related MRV system, it also means that once established, jurisdictions have an
effective instrument for quantifying and managing their emissions. As such, the resulting MRV
infrastructure enables strong synergies with the national accounting of GHG emissions.
3.2.9 Allocation and redistribution of revenues
One of the most important aspects in the design of a carbon pricing instrument is on how the revenues
generated by the instrument can be used. Indeed, these are important determinants on how carbon
pricing can impact the economy and be accepted by the society as a whole. For every country, the
design of carbon pricing implies a well-crafted balance between incentivizing low-carbon behavior and
mitigating adverse distributional consequences61. Optimal solutions for using the revenues would
largely differ based on the structure of the economy. As such, deciding on the use of revenues can
pose both a challenge and an opportunity to policymakers.
In deciding the most suitable option for reinvesting funds from a carbon pricing instrument,
governments can tailor the recycling framework to avoid or minimize the potential side effects of the
instrument and raise the acceptability and effectiveness of the scheme. The array of options for
revenue use ranges from a spectrum of non-government interference, when there is revenue
neutrality, to government-directed uses, where revenues are used in the form of increased spending to
serve one or multiple objectives, climate or non-climate-related.
If revenues are distributed neutrally, that means that the public budget balance is unaltered, and
revenues are either returned to households or businesses or offset by reductions in other taxes. 62 This
can be undertaken in two different ways:
Direct Transfers: revenues are directed back to households or businesses. Transfers allow
recipients to be directly compensated by the burden posed by the mechanism such as in the
61 E. Combet et al., Carbon Tax and Equity: The Importance of Policy Design, 2010, <https://halshs.archives-ouvertes.fr/halshs-
00692516/file/Combet_Hourcade_Ghersi_Th_ery_2010_Carbon_Tax_and_Equity.pdf> 62 Partnership for Market Readiness (PMR), Carbon Tax Guide: A Handbook for Policy Makers, 2017, World Bank. Ibid.

47
form of increased prices of energy and food affecting especially low-income households63, or
risks to companies such as a decrease in competitiveness or “carbon leakage”.
Tax cuts: revenues are used to reduce the burden of the tax system by cutting non-carbon
taxes, like income taxes, or increasing minimum tax exemption levels.64 While this strategy
can favor efficiency (as this approach requires only minimal efforts for managing the
redistribution), the choice of the taxes being cut can lead to fairness distortions if a progressive
tax is reduced. In addition, the benefits may also not be as easily perceivable as in the case of
a direct transfer. Therefore the political acceptability can be lower.
If revenues are used to meet government policy objectives through specific public policies, climate-
related or not, they are said to expand government spending, which can be geared towards the
general budget or earmarked for specific purposes, climate-related (green earmarking), or non-climate-
related (non-climate earmarking).
General budget: revenues are sent to the overall budget, and can be used for multiple
purposes, including the reduction of public debt. This approach avoids administrative costs and
gives governments higher flexibility in determining how to use the funds. The potential drawback
is that this comes at a loss in transparency on how the funds raised from carbon pricing are
eventually used, and hence a likely lower level of political acceptance.
Green earmarking: the allocation of revenues is restricted to specific environmental uses. For
example, it can serve mitigation and/or adaptation purposes through investments in
decarbonization (R&D, building infrastructure and technology, supporting renewables, etc.), or
compensate environmentally affected groups. The allocation of revenues under this modality
could be made in numerous ways, e.g. in the form of grants, loans, tax reductions, subsidies or
direct cash transfers.65
Non-climate earmarking: the allocation of revenues is restricted to specific non-climate
purposes. These include, for example, certain social goals such as on education, health or
poverty alleviation, possibly enabling synergies with the Sustainable Development Goals
(SDGs).
3.3 Carbon pricing at the international and regional level
Global state-of-the-art overview
Scandinavian countries were the first nations, globally, to have introduced carbon pricing instruments.
Finland set up its carbon tax in 1990, which was followed by Norway and Sweden in 1991, and
63 D. Marron & A. Morris, How should governments use revenue from corrective taxes?, 2016, Tax Policy Center.
64 Climate Change Connection, Revenue Recycling, accessed November 2018, <https://climatechangeconnection.org/solutions/
carbon-pricing/revenue-recycling/> 65 Carbon Pricing Leadership Coalition, What Are the Options for Using Carbon Pricing Revenues, Executive Briefing CPLC.

48
Denmark in 1992. These taxes have been levied continuously up until today, and in the ensuing years
a growing number of jurisdictions would follow suit.
As of 31 December 2017, 45 national and 24 sub-national jurisdictions were explicitly pricing GHG
emissions66. These instruments cover an annual volume of 8 GtCO2e, corresponding to approximately
15% of global GHG emissions in 2017. If implemented and scheduled for implementation carbon
pricing initiatives are considered as a whole, GHG emission coverage would equate to 20% of the
global total, or 11 GtCO2e. This increase will be motivated, first and foremost, by the entering into force
of China’s national ETS, which is expected to be fully rolled out in 2020.
Table 3.7 below displays the jurisdictions that have a carbon pricing instrument in place, year of
introduction of the instrument, share of emissions covered by the instrument, and carbon price as of
2017. It may be noted that 19 national and 2 sub-national jurisdictions levied a carbon tax, whereas
ETS were operational in 57 jurisdictions – 34 national and 23 sub-national. It may be noted as well that
some jurisdictions have adopted both an ETS and a carbon tax, with the remark that these do not
necessarily target the same sector. For example, 48% of Canada’s Alberta Province GHG emissions
are covered under the Carbon Competitive Incentive Regulation (CCIR), a baseline-and-credit ETS
which applies to facilities emitting more than 100 tCO2e per year. A carbon tax is levied to 42% of
emissions and to facilities outside the scope of the Alberta ETS.
Carbon taxes Emissions trading systems
Jurisdiction Year
introduced
Share of emissions
covered (%)
Price on 1 April 2018
(USD/tCO2e)
Jurisdiction Year
introduced
Share of emissions
covered (%)
Price on 1 April 2018
(USD/tCO2e)
Finland 1990 36% 77 EU 2005 45% 16
Poland 1990 4% <1 Alberta 2007 48% 23 Norway 1991 60% 4-64 New Zealand 2008 52% 15 Sweden 1991 42% 139 Switzerland 2008 11% 8
Denmark(i) 1992 45% 25-29 RGGI 2009 21% 4 Slovenia 1996 24% 21 Tokyo 2010 20% 6 Estonia 2000 3% 2 Saitama 2011 18% 6
Latvia 2004 15% 6 California 2013 85% 15 British Columbia 2008 70% 27 Québec 2013 85% 15 Liechtenstein 2008 26% 101 Beijing 2013 45% 9
Switzerland 2008 33% 101 Guangdong 2013 60% 2 Ireland 2010 33% 25 Shanghai 2013 57% 6 Iceland 2010 55% 36 Shenzhen 2013 40% 7
Japan 2012 65% 3 Tianjin 2013 55% 1 UK(ii) 2013 25% 25 Kazakhstan 2013 50% N/A France 2014 40% 55 Chongqing 2014 40% 4
Mexico 2014 46% 1-3 Hubei 2014 35% 2 Spain(iii) 2014 2% 25 Rep. Korea 2015 68% 21 Portugal 2015 26% 8 Fujian 2017 60% 3
Chile 2017 42% 5 Ontario 2017 82% 15
66 World Bank and Ecofys, State and of Carbon Pricing 2018 (May), 2018, Washington, DC. Doi: 10.1596/978-1-4648-1292-7

49
Alberta 2017 42% 23
Colombia 2017 24% 6 Range – 3 – 70% <1 – 139 Range 11 – 85% 1 – 23
Table 3.7 – Carbon taxes and Emissions Trading Systems in operation at the end of 201767.
(i) In Denmark different carbon tax apply to fossil fuels and f luorinated gases
(ii) Pertains to UK’s carbon price floor
(iii) Carbon tax in Spain only covers fluorinated gases
It may also be observed the wide range of carbon prices in place across jurisdictions, which are as low
as 1 USD/tCO2e in the Tianjin ETS pilot and as high as 139 USD/ tCO2e as the Swedish carbon tax.
Yet, prices observed on these jurisdictions need to be understood and contextualized in relation to the
goals envisaged with the instrument adopted. Spain, for example, has in place a carbon tax of 25
USD/tCO2e which is only applicable to fluorinated gases, thereby covering just 2% of the total national
emissions of GHG with this specific instrument. In the case of Sweden, even though it exhibits the
highest carbon tax among all jurisdictions, the tax is not levied to industrial facilities taking part in the
EU ETS, whose average allowance price was 16 USD/tCO2e in 2017.
As discussed in the different points of Section 3.2, a number of factors need to be considered in the
design of a carbon pricing instrument. This includes the “desired” or “necessary” price to achieve the
goal of the instrument. A benchmark that can be considered to assess the level of ambition of the
instrument is the carbon pricing range identified by the High-Level Commission on Carbon Prices68.
The Commission, which is chaired by Nobel Laureates Joseph Stiglitz and Nicholas Stern, concluded
that the explicit carbon-price level required to meet the goals of the Paris Agreement is of 40-
80USD/tCO2e by 2020. It may therefore be noted that few jurisdictions currently have a carbon price
which is consistent with the proposed range.
It was also mentioned in Chapter 2 and in sections 3.1 and 3.2 the potential of carbon pricing
instruments as revenue generation mechanisms. In 2017, approx. 33 billion USD were collected by
governments through these instruments, with these funds raised mostly through the auctioning of
allowances in emissions trading systems or the payment of carbons taxes.
Carbon pricing and the Paris Agreement
A growing number of Parties are considering the adoption of carbon pricing instruments as a means to
fulfil their mitigation pledges in the context of the Paris Agreement. In effect, more than 80 Parties have
mentioned carbon pricing on their Nationally Determined Contributions (NDCs), and the
implementation of such instruments is being considered at the domestic and international levels. In this
67 World Bank and Ecofys (2018), State and of Carbon Pricing 2018 (May), Ibid; E. Haites, Carbon taxes and greenhouse gas
emissions trading systems: what have we learned?, 2018, Climate Policy, https://doi.org/10.1080/14693062.2018.1492897
68 High-Level Commission on Carbon Prices, Report of the High-Level Commission on Carbon Prices, Ibid.

50
regard, Article 6 of the Paris Agreement recognizes the need for countries to voluntarily engage in
“cooperative approaches”, and even though no explicit reference is made to “carbon markets”, the text
does mention the use of “internationally transferred mitigation outcomes” to support Parties meeting
their voluntarily proposed targets as part of their NDCs (Article 6.2). Article 6 also refers to other
cooperative approaches, namely a mechanism for mitigation and sustainable development (Article 6.4)
and a non-market mechanism (Article 6.8). The detailed rules governing Article 6 are still under
development, but are expected to be finalized in the end of 2019 at COP-25 in Santiago, Chile.
Regardless of the outcomes of international climate change negotiations, several jurisdictions are
already cooperating on carbon pricing instruments. For instance, the EU ETS has been operating since
2005, covering the GHG emissions of more than 11,000 power plants and industrial facilities in 31
countries69. The Western Climate Initiative (WCI) links the carbon markets of three sub-national
jurisdictions in two different countries, i.e. those of California (USA), Quebec and Ontario70 (Canada).
These jurisdictions are also part of a more ambitious initiative, “Carbon Pricing in the Americas”, which
seeks coordination and harmonization on carbon pricing among several countries and sub-national
authorities in the American continent71. In addition to California, Quebec and Ontario, other partners to
this initiative are the Governments of Canada, Colombia, Costa Rica, Chile and Mexico, as well as the
States of Washington, Alberta, British Columbia and Nova Scotia. Members of the coalition have
committed to implementing carbon pricing as a central element of their economic and environmental
planning, and will collaborate in strengthening their MRV systems, which is recognized as a pillar for
the coordination of carbon markets.
Developments on carbon pricing in the Asian region
Considerable progress has been witnessed in the Asian continent on carbon pricing in recent years.
Amongst the most notable developments, the full operationalization of China’s national ETS expected
in 2020 will mark the establishment of the world’s largest ETS. This and other major developments in
the continent are briefly captured in the points that follow.
i) China’s national ETS and the regional ETS pilots
China’s national ETS was formally established in December 2017, with its development preceded by
seven pilot ETS programmes. These were implemented in the regions of Beijing, Chongqing,
Guangdong, Hubei, Shanghai, Shenzhen and Tianjin. In 2017, the region of Fujian voluntarily joined
the pilot programme. The scope of these pilots is restricted to emissions of CO2, with indirect
emissions from the production of electricity also included within the scope of the seven pilots. Nearly all
69 European Commission, EU Emissions Trading System (EU ETS), accessed November 2018, <https://ec.europa.eu/clima/
policies/ets_en>
70 The participation of Ontario on the WCI has been put into jeopardy following the election of the new Provincial Government, i n June 2018: see <https://news.ontario.ca/opd/en/2018/06/premier-designate-doug-ford-announces-an-end-to-ontarios-cap-and-
trade-carbon-tax.html?utm_source=ondemand&utm_medium=email&utm_campaign=m> 71 Paris Declaration on Carbon Pricing in the Americas, 2017, <https://www.ieta.org/resources/News/Press_Releases/2017/
Declaration%20on%20Carbon%20Pricing_FINAL.pdf>

51
the pilots cover the power sector, and the seven of them the industrial sector. In 2016, the Beijing,
Guangdong and Shenzhen pilots extended their coverage in order to also include the transport sector.
Another similarity among the seven pilots is that carbon offsets generated outside the pilot regions, in
particular developed under the framework of the CDM, can be used by regulated entities to meet part
of their compliance obligations. With regards to allowance allocation approaches, free allocation has
been the prevailing method, although in some pilots auctioning has been carried out for a relatively
small share of the allowances. The table below summarizes some of the main design features of the 7
pilot ETS.
ETS Feature Beijing Chongqing Guangdong Hubei Shanghai Shenzhen Tianjin
Launch of the scheme
November 2013
June 2014 December
2013 April 2014
November 2013
June 2013 December
2013
Number of emitters covered
947 237 244 236 368 811 109
Share of emissions covered
45% 40% 60% 35% 57% 40% 55%
Maximum use of offsets
5% of free allowances
8% of emissions
10% of emissions
10% of free allowances
1% of free allowances
10% of emissions
10% of emissions
Table 3.8 – Design features and main characteristics of China’s regional ETS pilots as of 2016.72
The seven pilots will be gradually integrated into the national ETS, in a process whose details are still
under discussion. The official launch of China’s national ETS in December 2017 was accompanied by
the release of a working plan which lays out a roadmap and specific targets for the development of the
system73. The roadmap will consist of three stages:
i) Infrastructure development: estimated to last for one year, this stage will consist in completing
the legal basis and supporting systems, such as the emissions registry, data reporting system
and capacity building.
ii) Simulated trading: during this stage the functionality of the different elements of the ETS will
be tested through simulated trading in order to gather lessons learned and identify
improvement opportunities.
iii) Expansion: the initial phase of the national ETS will only include the power sector. Depending
on results of the simulation phase, the scope will be gradually enlarged in order to include
seven additional sectors: aviation, building materials, chemicals, iron and steel, non-ferrous
metals, pulp and paper, and petrochemicals.
72 Source: Z. Deng et al., Effectiveness of pilot carbon emissions trading systems in China, 2018, Climate Policy,
https://doi.org/10.1080/14693062.2018.1438245. Share of emissions covered based on E. Haites, Carbon taxes and
greenhouse gas emissions trading systems: what have we learned?, 2018. Ibid. 73 Q. Guoqiang and H. Xiaochen, China’s National Carbon Market and Roadmap Ahead, 2018, in ICAP, Emissions Trading
Worldwide – International Carbon Action Partnership (ICAP) 2018 Status Report, 2018, pp. 18-20, <https://icapcarbonaction.
com/en/icap-status-report-2018>.
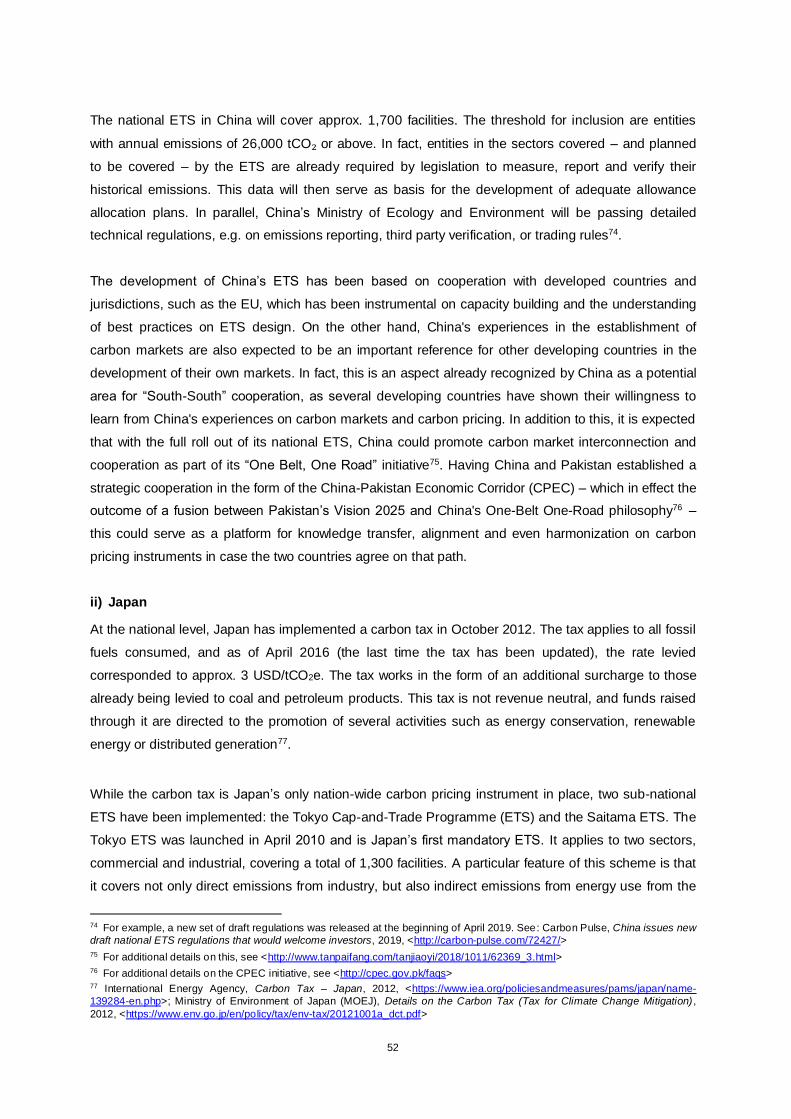
52
The national ETS in China will cover approx. 1,700 facilities. The threshold for inclusion are entities
with annual emissions of 26,000 tCO₂ or above. In fact, entities in the sectors covered – and planned
to be covered – by the ETS are already required by legislation to measure, report and verify their
historical emissions. This data will then serve as basis for the development of adequate allowance
allocation plans. In parallel, China’s Ministry of Ecology and Environment will be passing detailed
technical regulations, e.g. on emissions reporting, third party verification, or trading rules74.
The development of China’s ETS has been based on cooperation with developed countries and
jurisdictions, such as the EU, which has been instrumental on capacity building and the understanding
of best practices on ETS design. On the other hand, China's experiences in the establishment of
carbon markets are also expected to be an important reference for other developing countries in the
development of their own markets. In fact, this is an aspect already recognized by China as a potential
area for “South-South” cooperation, as several developing countries have shown their willingness to
learn from China's experiences on carbon markets and carbon pricing. In addition to this, it is expected
that with the full roll out of its national ETS, China could promote carbon market interconnection and
cooperation as part of its “One Belt, One Road” initiative75. Having China and Pakistan established a
strategic cooperation in the form of the China-Pakistan Economic Corridor (CPEC) – which in effect the
outcome of a fusion between Pakistan’s Vision 2025 and China's One-Belt One-Road philosophy76 –
this could serve as a platform for knowledge transfer, alignment and even harmonization on carbon
pricing instruments in case the two countries agree on that path.
ii) Japan
At the national level, Japan has implemented a carbon tax in October 2012. The tax applies to all fossil
fuels consumed, and as of April 2016 (the last time the tax has been updated), the rate levied
corresponded to approx. 3 USD/tCO2e. The tax works in the form of an additional surcharge to those
already being levied to coal and petroleum products. This tax is not revenue neutral, and funds raised
through it are directed to the promotion of several activities such as energy conservation, renewable
energy or distributed generation77.
While the carbon tax is Japan’s only nation-wide carbon pricing instrument in place, two sub-national
ETS have been implemented: the Tokyo Cap-and-Trade Programme (ETS) and the Saitama ETS. The
Tokyo ETS was launched in April 2010 and is Japan’s first mandatory ETS. It applies to two sectors,
commercial and industrial, covering a total of 1,300 facilities. A particular feature of this scheme is that
it covers not only direct emissions from industry, but also indirect emissions from energy use from the
74 For example, a new set of draft regulations was released at the beginning of April 2019. See: Carbon Pulse, China issues new
draft national ETS regulations that would welcome investors, 2019, <http://carbon-pulse.com/72427/>
75 For additional details on this, see <http://www.tanpaifang.com/tanjiaoyi/2018/1011/62369_3.html>
76 For additional details on the CPEC initiative, see <http://cpec.gov.pk/faqs> 77 International Energy Agency, Carbon Tax – Japan, 2012, <https://www.iea.org/policiesandmeasures/pams/japan/name-
139284-en.php>; Ministry of Environment of Japan (MOEJ), Details on the Carbon Tax (Tax for Climate Change Mitigation) ,
2012, <https://www.env.go.jp/en/policy/tax/env-tax/20121001a_dct.pdf>

53
commercial sector. Tokyo’s ETS is bilaterally linked with Saitama’s ETS, which was established in April
2011. Similarly to Tokyo’s, it also covers the commercial and industrial sectors, and eligible facilities
are those with an energy consumption of more than 1,500 kL of crude oil equivalent per year78.
iii) Rep. Korea ETS
Republic of Korea’s national ETS (KETS) was launched in January 2015. The programme covers 68%
of national GHG emissions, encompassing nearly 600 of the country’s largest emitters. The scope of
the KETS includes both direct emissions and indirect emissions from electricity consumption. During
the first phase of the ETS (2015-2017), allowances were allocated for free based on historical GHG
emissions, but in phase two (2018-2020) auctioning was introduced.
iv) Kazakhstan
Kazakhstan was the first country in Asia to implement an ETS. The Kazakhstan ETS was launched in
2013, and it covers CO2 emissions from power generation and a number of industrial sectors. After its
two first phases (phase I: 2013; phase II: 2014-2015), the programme was suspended in order to
address some challenges that had been experienced, such as on allowance allocation methods, low
transaction volumes and price volatility. The ETS was relaunched in 2018 after a suspension of two
years, during which amendments were made to the allowance allocation procedures, MRV, and
operating rules. This marked the start of a third phase, which will run up until the end of 2020. As of
early 2019, the ETS covered emissions from 129 companies, corresponding to 229 installations, with
the threshold for inclusion being 20,000 tCO2e/year79.
v) South-East Asia
A number of carbon pricing initiatives are currently under development in some South-East Asian
countries. Among these, Singapore is the one at the most advanced stage, with a carbon tax having
entered into effect from 1 January 2019 onwards. The tax applies to the largest GHG emitters in the
power generation and industrial sectors, covering approximately 80% of national GHG emissions. In
the first five years of the programme, the tax levied will be of 5 Singaporean dollars per tCO2e (approx.
3.6 USD/ tCO2e). A specific feature of this programme is that the carbon tax will take the form of a
“fixed-price credit-based” mechanism under which emitters pay the carbon tax by surrendering carbon
credits equivalent to their carbon tax liability. These carbon credits can only be bought from
Singapore’s National Environment Agency – the public body overseeing the implementation of the
78 ICAP, Emissions Trading Worldwide – International Carbon Action Partnership (ICAP) 2018 Status Report, 2018, pp. 18-20, <https://icapcarbonaction. com/en/icap-status-report-2018>. M. Wakabayashi and O. Kimura, The impact of the Tokyo
Metropolitan Emissions Trading Scheme on reducing greenhouse gas emissions: findings from a facility-based study, 2018,
Climate Policy, https://doi.org/10.1080/14693062.2018.1437018. 79 World Bank and Vivid Economics, State and of Carbon Pricing 2017 (November), 2017, World Bank, Washington, DC. Doi:
10.1596/978-1-4648-1218-7; USAID, EDF and IETA, Kazakhstan: An Emissions Trading Case Study, 2015, <https://www.ieta.org/resources/Resources/Case_Studies_Worlds_Carbon_Markets/2016/Kazakhstan_Case_Study_2016.pdf>. ICAP, Emissions Trading Worldwide – International Carbon Action Partnership (ICAP) 2019 Status Report, 2019,
<https://icapcarbonaction.com/en/icap-status-report-2019>

54
programme – at the pre-determined tax rate. This system architecture was conceived in a way as to
enable the transition into a linked ETS, in case the national government intends to do so in the future80.
In Thailand, the establishment of a domestic carbon market is one of the mitigation options identified
in national policies and strategies. In effect, Thailand has been exploring carbon market mechanisms
since 2010, with a number of initiatives being developed, which include two domestic carbon offset
programmes81 and the development of the Thailand Voluntary Emissions Trading Scheme (so-called
“Thailand V-ETS”). The Thailand V-ETS is a pilot project developed by the Thailand Greenhouse Gas
Management Organization, a public organization established under the Ministry of Natural Resources
and Environment. As a pilot initiative, participation is voluntary, and so far companies from the
following industries have joined: petrochemicals, cement, iron & steel, pulp & paper, glass, refineries,
ceramics, plastics, and food & feed industries. Two phases have been so far implemented: phase I
(2015-2017) was intended to develop sector-specific MRV guidelines and test their implementation, as
well as the design of certain ETS features such as cap setting and allowance allocation. Phase 2
(2018-2020) involves getting the participating companies becoming familiar with the practice of permit
trading through an online platform.
At the same time, Thailand is a participant to the Partnership for Market Readiness (PMR) programme
of the World Bank, where its goal is the design and implementation of a domestic market mechanism
to reduce energy consumption and GHG emissions attributed to the energy and the industrial
processes sectors. Also as part of the PMR, in the second half of 2018 Thailand was conducting a
study to model, through econometric methods, the impacts to the economy of different carbon pricing
instruments, with a carbon tax and a national ETS being the options considered. All these initiatives
are providing Thailand with experience on carbon market mechanisms, and are expected to inform the
choice of a carbon pricing instrument and the formulation of a Climate Change Act for approval of the
Cabinet in 2020.
Indonesia is another country where recent progress has been observed in the development of carbon
pricing instruments. In fact, Pakistan and Indonesia share some commonalities on a few macro-level
elements, as both have populations above 200 million people and comparable levels of economic
development (the two rank as lower-middle income countries). Indonesia has not adopted any carbon
pricing instrument yet, but the national government recognizes the potential role these instruments can
play in support of national mitigation targets. In particular, a government regulation issued in 2017 on
environment economic instruments lays out the policy basis for the introduction of carbon pricing in
Indonesia, while setting a mandate for the establishment of a national ETS by 2024.
80 Singapore Statues Online, Carbon Pricing Act 2018, 2018, <https://sso.agc.gov.sg/Acts-Supp/23-2018/Published/
20180601?DocDate=20180601> 81 One of them is the Thailand Carbon Offset Programme (T-COP), which enables participants to voluntarily offset their carbon
footprint. The other is the Thailand Verified Emissions Reduction programme (T-VERs), a scheme similar to the CDM but
functioning as a domestic GHG crediting mechanism.

55
Set in this context, Indonesia has been considering different options and design architectures for the
introduction of a carbon pricing instrument and the development of a domestic carbon market. In
particular, four options have been considered by the government of Indonesia: i) an ETS for the power
generation and industrial sectors; ii) an energy efficiency certificate system for the industrial sector; iii)
a cap-and-tax system for the industrial sector; and iv) a carbon offset mechanism. These options were
considered the most adequately aligned with the specific circumstances of Indonesia and its policy
framework. For example, an economy-wide carbon tax was excluded on the grounds that it would be
particularly challenging to implement in Indonesia, as it would require strong political backing and a
lengthy approval process through Parliament. As of December 2018, Indonesia had opted for
considering a thorough assessment of option i), the development of a domestic ETS in the scope of
which power generation and industries would be included. This assessment was being carried out by
an international consultancy company as part of Indonesia’s PMR programme, with expected next
steps including the launch of a piloting stage.
While Singapore, Thailand and Indonesia rank as the most advanced jurisdictions in South-East Asia
with respect to the introduction of CPIs, other countries in the region are also considering such
instruments. In Vietnam a number of “readiness” activities are being carried out in the context of the
PMR programme. These include the setup of an MRV system for the steel and waste sectors, which
would be the basis for piloting a credit-based mechanism. The Philippines has been assessing
carbon pricing options for a number of years, and recently abandoned plans for the introduction of a
carbon tax, suggesting that an ETS would be the instrument of choice for pricing GHG emissions82.
The number of countries in South-East Asia considering carbon pricing instruments suggest there is a
potential for synergies and the alignment of approaches. This has been recognized by the ASEAN
Secretariat, and one of the initial steps being taken in this direction is the assessment of opportunities
for aligning MRV processes among these countries83.
vi) South-Asia
Progress in the adoption of carbon pricing initiatives in South Asian countries is not as advanced as in
other parts of the Asian continent, but a few notable developments need to be noted.
Bangladesh, for example, has considered the introduction of a carbon tax to fossil fuels, which was
expected to be legislated in June 2017. The national government eventually backtracked in the
introduction of the tax due to the lack of a broader political support as well as opposition from energy
and transportation groups84. An election in 2018 also increased the risk perceived by politicians in
82 Carbon Pulse, Philippines ditches carbon tax plans, 2018, <https://carbon-pulse.com/63073/> 83 UNFCCC, ASEAN Countries Join Forces for Climate Action, 2017, <https://unfccc.int/news/asean-countries-join-forces-for-
climate-action> 84 Climate Home News, Bangladesh backtracks on carbon tax proposal ahead of election year, 2017, <http://www.climate changenews.com/2017/06/02/bangladesh-backtracks-carbon-tax-proposal-ahead-election/>; Reuters, Climate-threatened
Bangladesh to impose carbon tax in June, 2017, <https://www.reuters.com/article/us-bangladesh-climatechange-carbontax-
idUSKBN18J00V>

56
pushing forward a tax that was seen as unpopular. On the other hand, interest in the adoption of a
carbon tax does not seem to have completely waned, as can be attested by recent research work by
the World Bank and UK Aid85.
Sri Lanka intends to build on experiences gained in market-based instruments, namely the CDM and
its domestic offset programme, the Sri Lanka Carbon Crediting Scheme (SLCCS), to lay out the
ground for the introduction of carbon pricing mechanisms. In particular, Sri Lanka is assessing the
development of a new carbon pricing instrument which can complement the SLCCS, such as an ETS
or carbon tax. Sri Lanka formally joined the PMR programme in 2016 as a participant country, and has
been engaged since then on a number of “readiness” activities. As part of these, a scoping study to
assess suitable carbon pricing options for Sri Lanka was underway and expected to be finalized in May
2019. As part of the assessment, two sectors were being considered for carbon pricing coverage:
energy and transport86. A carbon pricing instrument is not expected to be fully implemented in less
than 4 to 5 years from the study conclusion. In addition to this, as of 1 January 2019, a “carbon tax” for
the transport sector had come into force. This consists of a charge levied on vehicles according to their
engine capacity. Although not technically a tax – because it targets the technology and not the type of
fuel – it is referred as such.
India has been levying a carbon tax on coal since 2010, as part of the so-called “Clean Environment
Cess”. The tax applies to both imported and domestically produced coal. The implementation of the tax
was intended to meet certain objectives, such as to raise funds to finance the use of clean energy
technologies and the reduction of pollution levels associated with increasing industrialization and
urbanization. To this end, the revenue raised through the tax goes into a National Clean Energy Fund.
The cess was replaced in July 2017 by the “Goods and Service Tax Compensation Cess”, but the levy
charged on coal remained at the same level of the cess, at 400 Indian rupees per metric ton of coal
consumed (approx. 5.7 USD per metric ton of coal). This corresponds to an effective carbon price of
around 3.2 USD per tonne of CO287.
This tax on coal is the only explicit carbon pricing instrument currently in place in India. Nevertheless,
India has implemented a number of other instruments that implicitly put a price on GHG emissions, in
addition to some extensive experience on market-based mechanisms. The most successful among
these has been the Perform Achieve Trade (PAT) system, a mandatory market-based trading
instrument which aims to reduce energy consumption patterns in energy-intensive enterprises. The
scheme is based in the issuance and trading of energy saving certificates, which serves as an
85 See World Bank, Policy Note on Options for a Carbon Tax in Bangladesh, 2018, <http://documents.worldbank.org/curated/en/ 721381535709573696/Policy-Note-on-Options-for-a-Carbon-Tax-in-Bangladesh> and S. Ahmed and B. Khondker, Towards a
Carbon Tax in Bangladesh, 2018, <http://www.greengrowthknowledge.org/sites/default/files/downloads/resource/
EDGG%2BPaper%2B9%2BTowards%2Ba%2BCarbon%2BTax%2Bin%2BBangladesh.pdf> 86 PMR, The PMR activities in Sri Lanka, 2018, <https://www.thepmr.org/country/sri-lanka>
87 This is based on the assumption that one ton of India’s coal produces 1.782 ton of CO2. For additional details see: PMR, Carbon Tax Guide: A Handbook for Policy Makers (Vol.2). Appendix: Carbon Tax Case Studies, 2017,
<http://documents.worldbank.org/curated/en/799761535605686418/Appendix-Carbon-Tax-Case-Studies>.

57
incentive to reach or surpass the mandatory targets. The certificates are equivalent to 1 ton of oil
equivalent of energy savings, and are issued based on quantified energy savings verified by an
accredited energy auditor. In essence, the programme functions in a similar way to a cap-and-trade
mechanism for GHG emission reductions, with the difference that the units traded are energy savings
certificates instead of carbon allowances 88 . Another noteworthy experience from India is the
Renewable Energy Certificate (REC) mechanism, whereby utility companies are mandated to supply a
percentage of the electricity sold to end-user consumers from renewable energy sources. Targets are
set at the discretion of each State, and utilities are mandated to demonstrate their compliance through
the surrender of the certificates, which can be traded among regulated entities89.
Other relevant experiences – carbon pricing in Canada
The experiences on carbon pricing outlined above pertain to jurisdictions that, just like Pakistan, are
located in the Asian continent or rank as developing countries. There is, nonetheless, an experience
from outside the region with a developed country, Canada, that should be known and considered by
policymakers in Pakistan. Not only are Canada’s experiences pointed out by many as global good
practices on carbon pricing, but its institutional set-up also strongly resonates with that of Pakistan: a
federal system whereby a number of powers and responsibilities are delegated to provinces.
With regards to carbon pricing instruments, the Canadian province of British Columbia was amongst
the first sub-national jurisdictions worldwide to have adopted such mechanisms. British Columbia
introduced a carbon tax in 2008, which is widely considered as a “textbook” example of an economy-
wide, “revenue-neutral” carbon tax. The tax applies to all businesses and individuals purchasing fuel in
the province. Initially, the tax was set at C$10 per tCO2e (approx. 10.2 USD/tCO2e), reaching
C$30/tCO2e (29.4 USD/tCO2e) in 2012.90 Levying the tax was accompanied by cuts in other taxes
charged to citizens and businesses, and hence its “revenue neutrality” was assured.
The British Columbia tax is considered a successful case-study of a carbon pricing mechanism for
several reasons. First of all because the tax did not increase the overall tax burden and was promoted
as a “tax shift”.91 Secondly, the tax had no discernible overall economic impact, as the economy of
British Columbia grew faster than the average of Canadian provinces (despite other provinces not
pricing GHG emissions). Additionally, the tax did have a slightly positive net impact on low-income
households, addressing concerns that the poorest could be the most impacted (negatively) by a
88 International Energy Agency, Market based instruments for Energy Efficiency, 2017, IEA Paris. 89 S. Gupta and P. Purohit, Renewable energy certificate mechanism in India: A preliminary assessment, 2013, Renewable and
Sustainable Energy Reviews 22 (380-392), https://doi.org/10.1016/j.rser.2013.01.044. 90 Partnership for Market Readiness (PMR), Carbon Tax Guide: A Handbook for Policy Makers, 2017, Ibid.
91 See for example: N. Rivers and B. Schaufele, Salience of Carbon Taxes in the Gasoline Market, 2012,
<https://papers.ssrn.com/sol3/papers.cfm?abstract_id=2131468>

58
carbon tax. Lastly, studies have estimated that the tax has reduced GHG emissions in British Columbia
by 5-15%, showcasing its effectiveness as a mitigation instrument92.
For the Canadian provinces that have not introduced a carbon pricing mechanism on their own, a
federally crafted mechanism applies. This mechanism was designed to support Canada meet its GHG
emission reduction target of 30% below 2005 levels by 2030. This so-called “Pan-Canadian
Framework” sets a federal benchmark for pricing GHG emissions with minimum stringency levels that
must be followed by all provinces and territories. Three main options are available for compliance
purposes: i) the adoption of a carbon tax comparable in scope to that of British Columbia; ii) a
combination of a carbon tax on fuels with an intensity-based “baseline-and-credit” system for industrial
emitters; and iii) a broad cap-an-trade system with similar coverage to the carbon tax of British
Columbia. A federal “backstop system” applies to the provinces that do not comply with the benchmark
or that prefer this system to one crafted on their own. This system has two components, consisting of a
regulatory charge on fuels and an output based system applying to industrial facilities. Both
components have associated an initial carbon price of C$20/tCO2e (approx. 15 USD), which will
increase by C$10 tCO2e (approx. 7.6 USD) per year until reaching C$50/tCO2e (approx. 39 USD) in
2022. The proceeds from the carbon pricing system are returned to the provinces where the individuals
or businesses are based93.
The Pan-Canadian framework could be an inspiration to Pakistan, as it provides a reference of how the
federal government and different provinces can interact in the implementation of a carbon pricing
system. In the case of Canada, the federal government sets the stringency of the programme and
minimum benchmarks, while provinces are given a certain level of flexibility in achieving compliance.
92 Partnership for Market Readiness (PMR), Carbon Tax Guide: A Handbook for Policy Makers, 2017, Ibid.
93 ICAP, Emissions Trading Worldwide – International Carbon Action Partnership (ICAP) 2019 Status Report, 2019, Ibid.

59
4. Analysis of the national context of Pakistan
To have an appropriate understanding of the specific circumstances of Pakistan is essential to assess
how a carbon pricing instrument could be designed to fit the national context. The chapter starts with
an overview of Pakistan’s socio-economic context (Section 4.1), and is followed by an assessment of
the national policy framework (Section 4.2). In particular, these sections analyse existing policy
documents on climate change and discuss to what extent they support – and could be supported – by
the introduction of a carbon pricing instrument. Section 4.3 presents an overview of the different
economic sectors of Pakistan, which are analysed in relation to the five main sectors of the IPCC for
the reporting of GHG emissions: energy, industrial processes, agriculture, land-use change and
forestry, and waste. Section 4.4 provides an analysis of stakeholders that could play a role in the
adoption of a carbon pricing instrument in Pakistan, while Section 4.5 summarizes the findings of the
chapter with a SWOT analysis – Strengths, Weaknesses, Opportunities and Threats – and a readiness
assessment of Pakistan.
4.1 Socio-economic context
Pakistan is a country located in South Asia, having borders with India, China, Afghanistan and Iran.
Pakistan ranks as the eighth most populous country in the world and, according to the Pakistan Bureau
of Statistics (PBS), the national population in 2017 was estimated at 207.8 million94, having increased
at an average rate of 2.4% since 1998. As noted in UNDP’s second National Human Development
Report, Pakistan exemplifies a classic case of a “youth bulge”, as two-thirds of its population are under
30 years of age95. Another macro-level trend observed is that the country is quickly urbanizing. While
the majority of the population is still rural (approx. 63.5% of the total, according to the 2017 census), it
is estimated that Pakistan is urbanizing at an annual rate of 3%96, amongst the fastest in South-Asia.
Rapid urbanization has been changing the landscape of human settlements, with significant social,
economic and environmental implications.
In fiscal year (FY) 2017-18, Pakistan’s Gross Domestic Product (GDP) stood at 313.2 billion USD,
corresponding to a GDP per capita of 1,558 USD. Its Gross National Income (GNI) – which takes into
account income sources generated abroad such as remittances – was at 328.7 billion USD in the
same fiscal year. With these levels of economic development, the World Bank ranks Pakistan as a
lower-middle income country. As can be observed from the figures displayed in the table below, GDP
has exhibited an upward trajectory over the 2013 to 2018 period. In real terms, GDP growth has
averaged 4.8% on annual basis, which compares with growth rates below 3% in the 2008-2013
94 PBS, Provisional Summary of Results of 6th Population and Housing Census-2017, 2017, <http://www.pbs.gov.pk/content/
provisional-summary-results-6th-population-and-housing-census-2017-0> 95 UNDP, Pakistan National Human Development Report, 2017, <https://www.un.org.pk/undp-pakistan-launches-the-pakistan-
national-human-development-report-2017-unleashing-the-potential-of-a-young-pakistan/> 96 D. Mustafa and A. Sawas, Urbanization and Political Change in Pakistan: exploring the known unknowns, 2013, Third World
Quarterly (34), pp.1293-1304, <https://doi.org/ 10.1080/01436597.2013.824657>

60
period97. This robust economic growth in recent years is explained, among other aspects, by a
relatively stable political environment, the development of major infrastructure projects, and low
interest rates98.
FY 2013-14 2014-15 2015-16 2016-17 2017-18
GDP (market prices, billion Rs) 25,169 27,443 29,076 31,963 34,396
GDP (market prices, billion USD) 244.7 270.9 278.9 305.3 313.2
GNI (market prices, billion Rs) 26,597 29,118 30,858 33,707 36,214
GNI (market prices, billion USD) 258.6 287.5 296.0 321.9 329.7
GDP per capita (market prices, USD) 1,314 1,427 1,441 1,548 1,558
GNI per capita (market prices, USD) 1,389 1,514 1,529 1,632 1,640
Exports (billion USD) 25.1 23.7 20.8 20.4 23.3
Imports (billion USD) 45.0 45.9 44.7 52.9 60.9
Exchange rate (1 USD = Rs) 102.86 101.29 104.24 104.7 109.85
Table 4.1 – Economic indicators of Pakistan99.
Pakistan’s economy, however, exhibits a number of vulnerabilities. Among these, a current account
deficit of 12 billion USD, which is keeping Pakistan’s balance of payments under considerable stress.
Additionally, and as can be observed from the table above, the value of imports has exceeded exports
by a wide margin, with this trade deficit expected to widen with the steady growth in imports. Inflation is
another economic indicator of concern. Historically, inflation in Pakistan has exhibited a pattern of
volatility, even though in 2016 it hit a multi-decade low of 2.9%. Other challenges to economic growth
have their root in the energy sector, with demand for electricity largely exceeding supply, leading to
supressed demand where needs are not met or not adequately met. While significant progress has
been made in recent years to improve electricity supply, in 2013 it was estimated that power shortages
were cutting short GDP growth in up to 2%.100 Issues related to the energy sector are further analysed
in Section 4.3.1.
Figure 4.1 below displays the distribution of GDP of different economic sectors in Pakistan from FY
2010-11 onwards. It may be observed that, over these years, the services sector has contributed the
most to GDP, followed by agriculture and industry, respectively. The share of the services sector has
been gradually increasing, accounting for 57% of the GDP in 2017-18. On the other hand, agriculture
97 Ministry of Finance, Pakistan Economic Survey 2017-18, 2018, <http://www.finance.gov.pk/survey_1718.html>
98 Ibid.
99 Source: Pakistan Bureau of Statistics (PBS). For GDP and GNI figures: <http://www.pbs.gov.pk/sites/default/ files//tables/Table-4.pdf>; exchange rates: <http://www.pbs.gov.pk/content/table-2-national-accounts-main-aggregates-current-
prices>; Export and import figures: <http://www.pbs.gov.pk/sites/default/files//tables/14.01_0.pdf> 100 ADB, Asian Development Outlook 2013 – Pakistan, 2013, <https://www.adb.org/sites/default/files/publication/30205/
ado2013-pakistan.pdf>

61
is still the major source of employment in Pakistan, employing an estimated 38.5% of the labour
force101. In recent years, the official unemployment rate stood at 6%.
26% 25% 25% 25% 25% 25% 24% 24%
21% 22% 21% 21% 20% 19% 19% 19%
53% 53% 54% 54% 55% 56% 57% 57%
2 0 1 0 - 1 1 2 0 1 1 - 1 2 2 0 1 2 - 1 3 2 0 1 3 - 1 4 2 0 1 4 - 1 5 2 0 1 5 - 1 6 2 0 1 6 - 1 7 2 0 1 7 - 1 8
Agriculture Industry Services
Figure 4.1 – Distribution of gross domestic product (GDP) across economic sectors in Pakistan102.
Notwithstanding the economic progress witnessed over the last decade, in order to fulfil the goal
enshrined in Pakistan’s strategic Vision for 2025 of progressing from a lower-middle income to an
upper-middle income country, GDP needs to grow at a rate of least 7% on an annual basis between
2018 and 2025.103 Vision 2025 is based on seven pillars for driving growth and development. The first
pillar is the development of human and social capital, including on poverty alleviation and job creation,
especially to the youth. The other pillars are: ii) sustained indigenous inclusive growth; iii) democratic
governance, institutional reform, and modernization of the public sector; iv) energy, food, and water
security; v) private sector-led growth; vi) development of a knowledge economy; and vii) modernization
of infrastructure and strengthening regional connectivity.
Additionally, in 2016 the Parliament of Pakistan adopted the UN’s Sustainable Development Goals
(SDGs) as its own national development goals. A national framework for the SDGs has been prepared
by Pakistan’s Planning Commission. The framework lays out tentative targets for SDG implementation,
which were defined in consultation with Provincial Governments.
For Pakistan, some SDGs and targets are more important than others. In the national framework, the
targets are prioritized in accordance to Pakistan’s specific national circumstances, with three major
tiers – or “categories” – identified 104 : Category-I refers to goals that require immediate policy
101 PBS, Percentage distribution of employed persons 10 years of age and over by major sectors of employment, sex, area, province and Pakistan, 2017-18, 2018, <http://www.pbs.gov.pk/sites/default/files//Labour%20Force/publications/lfs2017_18/
TABLE-21_perc_R.pdf> 102 PBS, Gross Domestic Product of Pakistan (at current basic prices), 2018, <http://www.pbs.gov.pk/sites/default/files/
tables/Table-4.pdf> 103 Ministry of Planning, Development & Reform, Pakistan Vision 2025, 2014, <https://www.pc.gov.pk/uploads/vision2025/
Pakistan-Vision-2025.pdf> 104 For further details, see <https://www.pc.gov.pk/uploads/report/National_SDGs_Framework_-_NEC_2018.pdf>

62
intervention. Ensuring food security through sustainable agriculture, improved nutrition and access to
sustainable forms of energy are amongst the top priorities. Category-II refers to goals that require
relatively longer timeframes and consistent policy support, and include poverty reduction and the
empowerment of women. Category-III clusters together goals that have longer gestation periods and
which require major institutional reforms for the achievement of desired outcomes. Among these are
the goals related to climate change.
4.2 Policy framework and analysis of climate change sector
Pakistan is a federal state composed of four Provinces (Balochistan, Khyber Pakhtunkhwa, Punjab,
and Sindh), two Autonomous Territories (Azad Jammu and Kashmir, Gilgit-Baltistan), and one federal
territory (Islamabad). The Constitution Eighteenth (Amendment) Act, 2010, brought a redefinition of the
governance structure of Pakistan by making more explicit the roles of the federation and its federating
units. In particular, the Amendment devolved significant powers and responsibilities to sub-national
governments, including on matters related to environmental pollution and climate change.
Despite this new governance structure, the cross-cutting nature of climate change and the need for
national coordination on a number of issues, namely the implementation of Multilateral Environment
Agreements, led to the establishment of the Ministry of Climate Change (MOCC) in 2012. MOCC is
the federal body for all issues related to climate change and the environment. Among its roles and
responsibilities, MOCC has the mandate for formulating national policies, strategies, plans,
programmes and legislation on climate change.
Concerns over climate change permeate and are present in several development policies and plans of
Pakistan. Adaptation is the main national priority on climate change, given Pakistan’s vulnerability to its
adverse impacts as well as its status as a relatively low emitter of greenhouse gases (GHG), especially
on a per capita basis. In effect, the Global Climate Risk Index compiled by GermanWatch105 ranks
Pakistan as one of the ten most affected countries by climate change, as had been mentioned before
in the introduction chapter of the study. Concurrently with this reality, Vision 2025 recognizes that
climate change is one of the most important “exogenous” challenges affecting Pakistan, highlighting its
impact on food, water and energy security. It may be noted, too, that Pakistan’s Nationally Determined
Contribution (NDC) has its foundation on this vision.
While adaptation takes precedence over mitigation, Pakistan acknowledges its role as a “responsible
member” of the international community in combating climate change and the importance of adopting
mitigation efforts domestically. This is reflected on major policy documents on climate change issued
by the government, in particular the National Climate Change Policy (2012), the Pakistan’s Intended
Nationally Determined Contribution (2015), and the Pakistan Climate Change Act (2016). A brief
105 German Watch, Global Climate Risk Index 2018, 2018. Ibid.

63
account of these documents is provided in Point 4.2.1 below, which is followed by a discussion on how
they lay out a basis for considering the introduction of a carbon pricing instrument in Pakistan (Point
4.2.2). Next it is analysed the GHG emissions profile of Pakistan (in Point 4.2.3) and the national
experiences on market-based approaches and climate finance (Point 4.2.4).
4.2.1 National Policy Framework on Climate Change
Below is provided an overview of the main national policy documents on climate change in Pakistan:
National Climate Change Policy (2012)
The National Climate Change Policy (NCCP)106 is guided by the overarching goal of mainstreaming
climate change considerations across economic and social development priorities. Several objectives
are laid out in support of this goal, on aspects as diverse as inter-ministerial coordination, the
development of institutional capacities, or access to climate finance. The policy also identifies a
number of sectoral measures for the implementation of mitigation actions, which are organized in
relation to seven areas: i) energy, ii) energy efficiency and conservation, iii) transport, iv) urban
planning, v) industries, vi) agriculture and livestock, and vii) forestry. The measures put forth in the
NCCP provide a general framework for the development of specific national action plans. In order to
support the implementation of actions plans and track progress in implementation, the NCCP requires
the establishment of implementation committees at the federal and provincial levels. Provincial
Committees are recognized as key actors in the implementation of the climate change agenda
introduced by the NCCP, which resonates with the enhanced roles of Provinces on environment
related issues following the Eighteenth Amendment to the Constitution.
The Federal Government developed an Action Plan to support the implementation of the NCCP, which
later took the shape of a Framework for Implementation of Climate Change Policy (2014-2030).107
This document provides further directions to federal and provincial ministries, departments and
agencies to the development of their own implementation plans. This framework builds on the NCCP
by setting more concrete objectives and proposing strategic actions, which are classified either as
priorities, short-term actions, medium-term actions, or long-term actions. As discussed further below,
this policy document establishes a solid basis for the development of carbon pricing instruments in
Pakistan.
Nationally Determined Contribution (2016)
Pakistan ratified the Paris Agreement in November 2016 and, in the same month, submitted its
Intended Nationally Determined Contribution (or PAK-INDC)108. On its NDC109 Pakistan presents
106 MOCC, National Climate Change Policy, 2012, <http://www.gcisc.org.pk/National_Climate_Change_Policy_2012.pdf> 107 MOCC, Framework for Implementation of Climate Change Policy, 2013, <http://www.gcisc.org.pk/Framework%20
for%20Implementation%20of%20CC%20Policy.pdf> 108 UNFCCC, Pakistan’s Intended Nationally Determined Contribution (PAK-INDC), 2016, Ibid.

64
updated figures of its GHG emissions, with inventory data from year 2015, and an estimation of
forecasted progress until 2030. In this regard, it may be noted that, for the period considered, Pakistan
estimates GHG emissions to increase by almost four-fold, from the 405 MtCO2e reported in 2015 to
1,603 MtCO2e in 2030. Based on these projections, the share of emissions from the energy sector is
expected to increase from 46% to 56%. Conversely, emissions from the agriculture sector are
projected to decrease from 43% to 29% over the same period. In 2030, combined emissions from
energy and the Industrial Processes and Product Use (IPPU) sectors are projected to correspond to
64% of the total.
The NDC also states that, in light of the economic development goals of Pakistan and the
corresponding increase in the demand for energy services, GHG emissions are expected to peak far
beyond 2030. Recognizing there is a significant potential for mitigation opportunities in the country,
Pakistan expresses the intention of reducing its emissions in up to 20% of its 2030 projected levels
conditional on the availability of international support. To achieve this target, total abatement costs are
estimated at 40 billion USD. The NDC does not specify sectoral targets.
The NDC puts forth a number of measures in support of this mitigation target. These are ranked as
high, medium and low priority measures. It may also be noted that Pakistan is a member country of the
NDC Partnership, which is providing technical assistance to Pakistan on NDC implementation110.
Pakistan Climate Change Act (2016)
The Pakistan Climate Change Act111 was passed by the National Assembly in 2017 to support
Pakistan meeting its obligations as part of international agreements on climate change112. The Act sets
a basis for the adoption of comprehensive policies, plans, programmes, projects and other measures
on mitigation and adaptation. To that end, the Act formally establishes three institutions: the Pakistan
Climate Change Council, the Pakistan Climate Change Authority, and the Pakistan Climate
Change Fund.
The Council is an administrative authority vested with the responsibilities of executing the Act, in
particular of enforcing, coordinating and monitoring implementation. The Authority will operate under
the guidance of the Council, having as its functions and roles, inter alia, the design of policies, plans,
programmes and other measures on climate change, including mechanisms for implementation. The
Authority will also identify and oversee the transfer of technologies which are appropriate to the
domestic context, while strengthening capacity-building of both governmental and non-governmental
109 As Pakistan has deposited its ratification instrument of the Paris Agreement, henceforth Pakistan’s INDC is simply referred
as NDC. 110 Additional information on the NDC Partnership activities in Pakistan may be found in: <https://ndcpartnership.org/sites/all/
themes/ndcp_v2/docs/country-engagement/countries/NCDP_Outlook_Pakistan_v6a.pdf> 111 National Assembly, Pakistan Climate Change Act, 2017, <http://www.na.gov.pk/uploads/documents/1485513841_966.pdf>
112 Agreements explicitly referred to in the Act are the United Nations Framework Convention on Climate Change, the Kyoto
Protocol and the Paris Agreement.

65
stakeholders. Both the Council and Authority will coordinate, monitor and supervise implementation of
the NCCP and Sustainable Development Goals.
The Pakistan Climate Change Fund was established as a vehicle through which financial support can
be channelled to the execution of programmes and projects on adaptation and mitigation, provided
they are aligned with the eligibility criteria defined by the Council. The Fund will be managed by the
Pakistan Climate Change Authority and, as defined in the Act, funds received shall be in the form of
grants and donations. On the other hand, the wording of the Act suggests that the Fund is not eligible
to be financed through loans.
4.2.2 National framework on climate change and synergies with carbon pricing
As seen in the point above, Pakistan has developed specific policies and legislation on climate change,
which provide a fairly robust framework for the implementation of specific initiatives on both adaptation
and mitigation. Climate change policies of Pakistan do not explicitly make reference to carbon pricing
instruments. However, these policies provide a solid basis for their introduction, including of some of
the components required for their operationalization, in particular the MRV of GHG emissions at the
installation/entity level. Annex I presents a detailed analysis of how policy elements found in these
documents, namely the NCCP and its framework of implementation, could be entry points for carbon
pricing in Pakistan. In a nutshell, they are in the form of:
i) Explicit reference to carbon pricing instruments – the NCCP makes explicit reference to a
carbon tax as part of mitigation measures in the energy sector. Here, a carbon tax is proposed for
consideration on the use of environmentally detrimental energy generation from fossil fuels.113
The implementation framework of the policy also refers to the introduction of polluter pays/carbon
tax as part of a green fiscal reform, which is identified as a medium-term priority114.
ii) Incentive schemes to support mitigation actions – both the NCCP and the framework for
implementation of the policy, on several instances, call for the introduction of incentive schemes
that can support the reduction of GHG emissions. While these incentives are formulated in a
generic manner in the documents (e.g. “economic incentives” to promote the upgrade of industrial
processes and technologies “financial incentives” for commercial transport systems to reduce
emissions, etc.)115, they clearly provide the context for the introduction of a carbon pricing
instrument. In both NCCP and its implementation framework, these incentive schemes are
proposed as measures on power generation, energy efficiency, industrial development and the
transport sector, often framed as part of a “green fiscal reform”.
113 Policy measure i) of the NCCP, pp. 23. Ibid.
114 As Action 3.2.2 of the Objective 3 “to reduce total energy demand through conservation and efficiency”, pp. 68. Ibid.
115 See pp. 27 of the NCCP as part of policy measures in the industrial sector, and pp. 71 of the Implementation Framework of
the NCCP, Action 1.6.1 under the strategy for supporting reducing emissions in the transport sector. Ibid.

66
iii) Support to market-based mechanisms – policy documents on climate change are supportive of
market-based instruments and carbon financing mechanisms. For example, Action 3.3.3 of the
implementation framework116, explicitly refers to emissions trading as a means of supporting
energy efficiency gains in the private sector. As part of Action 3.2.5117, it is identified as short-term
priority the development of fiscal reforms to introduce a “carbon credit market”. The CDM and
other voluntary schemes are also identified as carbon financing opportunities that could be
leveraged and further developed in Pakistan (e.g. as part of Action 1.8.1 on mitigation activities in
the transport sector of the implementation framework)118. These policy measures clearly lay a
foundation for the introduction of an ETS as well as other flexible mechanisms that can support
compliance obligations (e.g. in the form of an offset mechanism).
iv) Establishment of support elements required for a carbon pricing instrument – as noted in
Chapter 3, CPIs require a number of supporting elements that can function as the backbone of
their operation. A key element among these is the existence of an MRV framework for tracking
GHG emissions at the company or installation level. The need to develop an MRV system is, for
instance, recognized as a short-term priority in the implementation framework of the NCCP119, as
well as a specific policy measure of the NCCP addressing industries120.
In addition to the above, it needs to be noted the possible synergies between the introduction of CPIs
and the new institutional set up laid out by the Pakistan Climate Change Act. Among these, the
constitution of the Pakistan Climate Change Fund, which could support – and be supported by a – CPI.
For example, revenue raised by a CPI could be used to partially or fully finance the Fund.
Subsequently, these funds could be redistributed and invested on different activities. For example, to
finance adaptation projects or to directly compensate participants that could be negatively affected by
the introduction of a carbon pricing instrument, such as industries at risk of carbon leakage or low-
income households in the margins of energy poverty. Some of these aspects are further developed in
chapters 5 and 6 of the study.
The introduction of carbon pricing instruments is also strongly backed by national policies that are
broader in scope than those specifically focusing on climate change. For instance, the National
Sustainable Development Strategy (2012)121 has set as one of its strategic goals the internalization of
environmental costs through pricing mechanisms. As another example, the National Environmental
116 In pp. 69 of the Implementation Framework, under strategy 3.3 for enacting and enforcing legislation and standards on
energy conservation. Ibid. 117 In pp. 68 of the Implementation Framework, under strategy 3.2 for implementing “green fiscal reforms” in different sectors of
the economy. Ibid. 118 In pp. 72 of the Implementation Framework, as part of the strategy to secure financing for technology innovations in the
transport sector. Ibid.
119 In pp. 68, as part of Action 3.2.6 of the Implementation Framework, under the overarching objective of fostering energy
efficiency and conservation. Ibid.
120 In pp. 27 of the NCCP. Ibid 121 M. Amin Aslam Khan, National Sustainable Development Strategy: Pakistan’s pathway to a sustainable & resilient future,
2012, <http://www.sbi.gos.pk/pdf/Legal%20Framework/canada/2012%20-%20National%20Sustainable%20Development%20
Strategy,%202012.pdf>

67
Policy (2005) builds a strong case for the introduction of economic and market-based instruments to
foster the adoption of environmentally-sound approaches, even if short of making explicit reference to
climate change122.
4.2.3 Greenhouse Gas Emissions Profile of Pakistan
The latest official figures on GHG emission of Pakistan were reported in the PAK-INDC. They pertain
to emissions in year 2015, which totalled 405 MtCO2e. The energy sector is the major contributor
overall (46% of total emissions), followed by agriculture (43%), IPPU (5.4%), waste (3.0%), and the
land use change & forestry sector (2.6%). As can be observed in the graph of Figure 4.2, emissions in
Pakistan have more than doubled in the 1994-2015 period, growing at a compound annual growth rate
(CAGR) of 3.9%. As per the NDC, emission levels are expected to increase four-fold from 2015 to
2030, which corresponds to a CAGR of 9.6% over that period. These are the only officially published
figures on the GHG emissions trajectory of Pakistan.
0
50
100
150
200
250
300
350
400
450
1994 2008 2012 2015
Energy Agriculture IPPU LUCF Waste
MtCO2-eq
405
46%
43%
5.4%
2.6%
3%
182
330
374
Figure 4.2 – Greenhouse gas emissions of Pakistan for years where these are available. Source: PAK-INDC.
GHG emissions of year 2015 correspond to those reported in the national GHG inventory for FY 2014-
15. These figures were estimated based on the Revised Guidelines of the IPCC from 1996 through the
adoption of a Tier 1 approach123. In this way, calculations were made using default emission factors
found in IPCC guidelines, which were multiplied by activity data collected from national statistics. The
main sources of data are the Pakistan Year Book 2014-15, the Agricultural Statistics of Pakistan, and
the Pakistan Economic Survey 2014-15. The GHGs included are CO2, CH4, and N2O emitted from
122 Government of Pakistan Ministry of Environment, National Environmental Policy, 2005, <https://www.mowr.gov.pk/wp-
content/uploads/2018/05/National-Environmental-Policy-2005.pdf> 123 IPCC, Revised 1996 IPCC Guidelines for National Greenhouse Gas Inventories, 1996, <https://www.ipcc-
nggip.iges.or.jp/public/gl/invs1.html>

68
anthropogenic sources. On the way forward, Pakistan intends to gradually transition to Tier 2
approaches124.
The preparation of national GHG inventories is the responsibility of the Global Change Impact Studies
Centre (GCISC), established under the Ministry of Climate Change of Pakistan. Inventories have been
prepared in an infrequent manner, with one official submission to the UNFCCC made so far. This
submission was part of Pakistan’s Initial Communication on Climate Change125, with inventory data
from 1994. The preparation of the Second National Communication was initiated in January 2016, and
completion is expected in the second semester of 2019. It will present inventory data from 2015. To
date, Pakistan has not completed any Biennial Update Report (BUR), but the preparation of the first
BUR is slated to begin later in 2019, with completion expected in late 2020.
A more detailed analysis of national GHG emissions in 2015 is presented below, with a focus on the
three major contributing sectors: energy, agriculture and IPPU. With regards to energy sector
emissions, it may be noted the relatively balanced contribution of its major sub-sectors, which are
energy industries (27%), transport (22%), manufacturing industries (20%), and “other sectors” (23%).
The latter group encompasses energy-related emissions from the residential sector, commerce and
institutions, as well as from agriculture, forestry and fishing activities.
Energy Sector GHG Emissions, 2015(186.6 MtCO2e)
Manufacturing &
construction
Energy
Industries
Fugitive
emissions
Transport
Other
Sectors 23%
22%
27%
20%
7%
Figure 4.3 – Breakdown of energy sector emissions in Pakistan, FY 2014-15. Source: GCISC
The figure below displays the emissions breakdown for IPPU and agriculture. With regards to IPPU,
three sub-sectors contribute to emissions: mineral products, chemical industry and metal production.
As can be observed, the largest contribution is from mineral products, corresponding to 79% of IPPU
emissions. With regards to agriculture, two major sub-sectors contribute to emissions: agricultural soils
124 For example, GCISC is planning to develop Tier 2 approaches for the estimation of emissions from rice cultivation. 125 Government of Islamic Republic of Pakistan, Ministry of Environment, Pakistan’s Initial Communication on Climate Change,
2003, <https://unfccc.int/sites/default/files/resource/PNC-Final_Version_11-11-03.pdf>

69
and enteric fermentation126, corresponding to 44.5% and 42.3%, respectively. It should be noted, too,
that emissions from enteric fermentation are due to the release of methane, while the gas emitted from
agricultural soils is N2O, whose greenhouse gas potential over a 100-year timeframe is 310 higher than
that of CO2.
Emissions from IPPU, 2015(21.9 MtCO2e)
Chemical
Industry
Metal
Production Mineral
Products
17%
79%
4%
Emissions from Agriculture, 2015(174.2 MtCO2e)
Manure
Management
Enteric
Fermentation
Agricultural
Soils
Rice Cultivation
& Burning
44.5%
42.3%
6.7%6.5%
Figure 4.4 – Emissions from IPPU and Agriculture in Pakistan, FY 2014-2015. Source: GCISC.
With regards to the MRV of GHG emissions, in Pakistan these processes are limited to the preparation
of the national inventory, where some MRV-related processes are conducted by GCISC. These
include, inter alia, the establishment of a data management system and QA/QC procedures to check
data quality and emissions calculations. At present, there is no MRV framework at the facility or
company level, even though the NCCP lays out the ambition of developing such systems.
4.2.4 Experiences of Pakistan with market-based approaches and climate finance
Pakistan has been a host of Clean Development Mechanism (CDM) projects since 2006, when it
registered its first project, an N2O abatement activity in a nitric acid plant in Multan. As of February
2019, Pakistan has granted host country approval to 76 project activities. Out of these, 37 had been
registered by the CDM Executive Board. GHG emission reductions from registered project activities
have amounted to 3.79 MtCO2e per year127. As a whole, registered projects in Pakistan account for
less than 0.5% of all CDM project activities registered worldwide. Nevertheless, these CDM projects
could be understood as a good first evidence of the existence of a reasonable potential for low-cost
mitigation opportunities in Pakistan.
The majority of CDM projects in Pakistan are in the energy sector. As can be seen in Figure 4.5 below,
these are projects on energy efficiency and renewable energy. Pakistan is also host to four CDM
Programme of Activities (PoA), which consist of initiatives on solar PV, compact fluorescent lamps,
126 Enteric fermentation is the digestive process which allows ruminants such as goats, cows or sheep to digest feeds such as
grass, which has as by-product the emissions of methane. 127 S. Ayaz, Status of CDM in Pakistan and institutional arrangements, 2018, <https://unfccc.int/files/na/application/pdf/03._
saadullah_ayaz_cdm_presentation.pdf>

70
biogas plants and energy-connected renewable energies. As of February 2019, none of these
initiatives was reported to have been issued CERs.
13
10
4
19
3
23
Renewable Wind
Renewable Hydro
Renewable solar
Renewable Industrial
Efficiency Domestic
Efficiency Industrial
Figure 4.5 – Breakdown of CDM projects in the energy sector with host country approval in Pakistan. Figures in the pie chart indicate number of projects.
Pakistan’s Designated National Authority for the CDM is the Ministry of Climate Change. In 2004, a
CDM Cell was established to support the Ministry assessing CDM projects prior to being granted host
country approval. It also promoted awareness raising and capacity building on CDM across the
country.
Apart from the CDM, few other initiatives have been developed in Pakistan involving market-based
mechanisms. For example, as of February 2019 four project activities were registered by the Voluntary
Carbon Standard (VCS)128. The Gold Standard also had four activities in Pakistan, some of which
registered under the CDM (e.g. a solar PV Programme of Activities)129.
Pakistan has been an active proponent of Nationally Appropriate Mitigation Action (NAMA)
programmes. Seven such programmes130 were registered in the NAMA registry database hosted by
the UNFCCC. All of these NAMAs consist of project concepts seeking international support for
implementation. For example, the Waste Sector NAMA was jointly developed by MOCC, the
Alternative Energy Development Board (AEDB), UN-Habitat and UN-ESCAP, and in 2014 an
application had been submitted for funding from the UK/German NAMA Facility. None of these
programmes had been able to successfully raise funding and, consequently, in recent years interest on
NAMA development has gradually eroded. The table below displays a brief overview of the NAMA
programmes that have been developed in Pakistan, as these also provide an indication of national
mitigation priorities. Energy efficiency, renewable energy deployment and waste management are the
sectors where these NAMAs have been proposed. Sectoral policies and programmes are analyzed in
more detail in the next section.
128 VERRA, Project Database, accessed January 2019, <https://www.vcsprojectdatabase.org/#/projects> 129Markit, Project Registry, accessed January 2019, <https://mer.markit.com/br-reg/public/index.jsp?entity =project&sort=project
_name&dir=ASC&start=0&acronym=GS&limit=15&additionalCertificationId=&categoryId =100000000000001&name=
&standardId=100000000000032> 130 UNFCCC, NAMA Registry, accessed January 2019, <https://www4.unfccc.int/sites/PublicNAMA/SitePages/Country.aspx?
CountryId=131>

71
NAMA Programme Sector/sub-
sector Overview
Accelerating the Market Transformation to Energy Efficient Lighting
Energy efficiency in buildings
The NAMA aims to support the development and implementation of a National Efficient Lighting Strategy, including the development of minimum energy
performance standards, MRV systems, conduct of awareness campaigns, etc.
Energy Efficient Lighting in Residential,
Commercial, Industrial, and Outdoor Sectors of Pakistan
Energy efficiency
The project aims to contribute to energy security and
GHG emission reductions through energy efficient lighting in several sectors: residential, commercial, industrial and “outdoors”.
Strategizing for Grid Strengthening /
Improvement for evacuation of power from Wind Power Projects
Renewable
energy
The objective of the programme is to prepare a master plan and strategy to support the development of wind
power projects and the capacity of the national power grid to cope with an intermittent source of electricity.
Strategizing for Grid Strengthening /
Improvement for evacuation of power from Solar Power Projects
Renewable energy
Same objective of programme above, with a focus on solar instead of wind power.
Supporting Mechanisms for Promoting
Distributed Generation
Renewable
energy
This NAMA aims to support establishing a regulatory
regime for distributed generation in Pakistan, which would include enhanced capacities on net metering.
Bio-energy generation and greenhouse-gases mitigation though organic-waste utilization
Waste management
The overarching goal of the project is to develop and
support disseminating approaches through which organic feedstocks, in particular waste water and agricultural waste, can be converted into energy while
reducing GHG emissions.
Waste Sector NAMA in Pakistan Waste
management
The aim of the programme is to reduce GHG emissions from urban waste through the development of integrated
municipal solid waste management approaches, with a focus on waste-to-energy. The centrepiece of the NAMA
is the establishment of a revolving fund to support private sector investment in waste treatment facilities
Development and Installation of Carbon
Dioxide Sequestration Technologies in Pakistan
Energy
production
This NAMA aims to develop and install carbon capture
and storage technologies in natural gas fields and coal deposits.
Table 4.1 – NAMA programmes developed in Pakistan. Source: NAMA Registry.
4.3 Sectoral analysis
4.3.1 Energy
The energy sector is the largest contributor to GHG emissions in Pakistan, with its share forecasted to
increase from 46% in 2015 to 56% in 2030, as stated in the NDC. The sector is of strategic importance
to Pakistan, as the reliable supply of energy is a pillar to sustain the levels of economic growth stated
in development plans. Efforts to promote sustainable energy in Pakistan face two main hurdles: the
lack of access to sustainable energy sources and products (energy poverty); and an imbalance
between supply and demand in the electricity sector, which has led to power shortages. An overview of
the sector is provided in this section with respect to: a) energy mix; b) analysis by source of energy; c)
electricity sector; and d) energy access.

72
a) Energy mix
Primary energy supply of Pakistan in FY 2016-17 totalled 79.6 million toe131. Supply of primary
energy is dominated by two major sources, natural gas and oil, which accounted for 37.9% and 34.4%
of the total, respectively. This was followed by hydro 9.7%, coal (8.1%) and LNG imports (5.6%). The
graph of Figure 4.6 presents the breakdown of primary energy supply in Pakistan over a five-year
period.
0
10
20
30
40
50
60
70
80
90
2012-13 2013-14 2014-15 2015-16 2016-17
Oil Gas LNG Imports LPG Coal Hydro Nuclear Other electricity
Million toe
79.58
0.9%
2.6%
48.2%
73.9770.26
66.8564.59
32.5%
11.0%
6.0%
46.3%
34.4%
11.4%
5.4%
42.7%
35.5%
11.0%
7.0%
41.2%
34.2%
11.2%
6.9%
37.9%
34.4%
9.7%
8.1%
5.6%3.3%
2.1%
Figure 4.6 – Total primary energy supply, Pakistan, FY 2012-13 to FY 2016-17. “Other electricity” includes
electricity generated from other renewables and electricity imports. Source: Pakistan Energy Yearbook 2017
From the graph above it may be noted:
The growth in primary energy supply in the period under analysis, with a CAGR of 4.2%. From
FY 2015-16 to FY 2016-17, the annual growth was even higher, at 7.6%;
The dominant share of fossil fuels in the energy mix, accounting for 87.3% of the total primary
energy supply in FY 2016-17;
The sharp decline in the share of natural gas in the energy mix, from 48.2% to 37.9% in just
five years, due to the depletion of domestic resources. This decline has been partly offset by
imports of LNG, which in FY 2016-17 were responsible for 5.6% of total primary energy supply.
It may be noted that the import of LNG started in FY 2014-15;
The relatively small share of coal in primary energy supply, although exhibiting a steady
increase in the 5-year period under analysis;
The share of “emissions free” energy sources has remained relatively stable over this period,
even though the share of hydropower has declined. The share of other renewables such as
131 Ministry of Energy (Petroleum Division) and Hydrocarbon Development Institute of Pakistan, Pakistan Energy Yearbook 2017,
2018, Ministry of Energy (Petroleum Division)

73
wind, solar PV or biomass is still marginal, accounting for less than 1% of total primary energy
supply.
Pakistan is a net importer of energy: in FY 2016-17 42.9% of the primary energy consumed was
sourced from abroad. In the same FY, major energy imports were petroleum products (45.3%), crude
oil (26.2%), coal (13.5%) and natural gas (13.1%)132. This dependency on external supplies of energy
is a risk to Pakistan’s energy security, making the country vulnerable to supply disruptions and
fluctuations of international prices.
Final energy consumption in FY 2016-17 totalled 50.1 million toe. Compared with the figure for primary
energy supply on that year, it can be observed that a significant share is lost from supply to final
consumption. This is mostly ascribed to losses in conversion devices, transmission and distribution
networks133. Final energy consumption figures, displayed in Figure 4.7a), show that the share of the
different sources is in line with those of primary energy, with the remark that the weight of coal is
higher (12.2%). Figure 4.7b) shows that industry, transport and the residential sector are the major
sources of final energy consumption, accounting for 35.8%, 33.9% and 22.6% of the total, respectively.
It may be noted, too, that even though agriculture is a major economic sector and source of
employment, it only accounts for 1.5% of final energy consumption.
34.0%
12.2%
15.5%2.6%
35.7%Natural Gas
Coal
Electricity
LPG
Oil
35.8%
33.9%
22.6%
3.7%2.4% 1.5%
Industrial
Transport
Domestic
Commercial
Other Gov.
Agriculture
Figure 4.7a) – Final energy consumption per source, Pakistan, FY 2016-17. Source: Pakistan Energy Yearbook 2017
Figure 4.7b) – Final energy consumption per economic sector, Pakistan, FY 2016-17. Source: Pakistan Energy Yearbook 2017
b) Analysis by source of energy
Natural gas has been the major source of primary supply in Pakistan, which was driven by the
existence of abundant indigenous reserves, mostly concentrated in the provinces of Sindh and
Balochistan. This made the government support the development and utilization of this resource, for
example through the establishment of an extensive network of pipelines and the promotion of CNG as
a transport fuel. However, the production of natural gas from indigenous resources peaked in 2008,
132 Energy Yearbook 2017, energy balance, pp.5. Ibid.
133 Only a small fraction of this “energy loss” is due to use in the energy sector, e.g. for the operation of power plants (appro x.
3%)

74
prompting the government to impose a ban to the establishment of new CNG filling stations. This
decline in domestic natural gas production has been partly offset with imports of LNG, which started in
2015 upon the commissioning of the first LNG re-gasification terminal. Power generation, industry and
residential sectors are the major consumers of natural gas in Pakistan (see Table 4.2 below).
Sector Gas consumption
(mmcfd)
Regasified LNG
(mmcfd)
Total
(mmcfd) Share
Power generation 980 116 1.096 30.0%
Domestic 801 - 801 21.9%
Commercial 89 - 89 2.4%
Transport (CNG) 150 43 193 5.3%
Fertilizer 611 64 675 18.5%
Industry (general) 613 187 800 21.9%
Total 3,244 310 3.654 100%
Table 4.2 – Average daily consumption of natural gas in Pakistan per sector (1 July 2016 to 28 February 2017).
Source: Pakistan Economic Survey 2016-17.
With regards to oil and petroleum products, current domestic production does not suffice to meet
demand. For example, in FY 2016-17 crude oil supplies from abroad met 68.5% of demand, whereas
oil products were mostly imported134. Middle East countries, in particular Saudi Arabia, are the major
suppliers of crude and petroleum products. The oil import bill in FY 2016-17 totalled 9.1 billion USD,
which represented an increase of 23% in relation to the previous FY135. To put into perspective, this
corresponded to 3% of the GDP on that FY. Transport and power generation are the major sources of
oil consumption in final energy, corresponding to a share of 57% and 33%, respectively, in 2017136.
These sectors are analysed in more detail below.
In Pakistan, coal is mostly consumed in heavy industries, such as steel and cement, and in power
generation. In FY 2016-17, on an energy basis 74.4% of coal was consumed in cement production,
19.7% in brick kilns and 5.9% in power generation137. Pakistan is an importer of coal, which is sourced
from countries such as Australia or Indonesia. Nonetheless, Pakistan is endowed with abundant
indigenous resources. The majority of domestic coal is produced in Balochistan and Sindh. The largest
reserves are those of the Thar coalfield, Sindh, which is considered of strategic importance to
Pakistan. Several projects for harnessing Thar coal are at different stages of development, a few of
which in the scope of the China-Pakistan Economic Corridor (CPEC) initiative138.
Pakistan is also endowed with abundant renewable energy resources. Large hydro is, by far, the
largest renewable source of energy deployed in Pakistan, mostly in Northern areas. Nonetheless, it is
134 Pakistan Energy Yearbook 2017, energy balance, pp.5. Ibid.
135 Pakistan Energy Yearbook 2017, Ibid. This increase was a result of higher international oil prices and an increase in the
import of petroleum products. 136 Ministry of Finance, Pakistan Economic Survey 2017-18, 2018. Ibid.
137 On a mass basis, the share of coal consumed is higher in brick manufacturing, which suggests the use of low-grade coals
and less efficient conversion processes than the other industries. 138 Ministry of Finance, Pakistan Economic Survey 2017-18, 2018. Ibid.

75
estimated that only approx. 15% of the country’s hydro potential of more than 40,000 MW has been
exploited139. The same applies to other renewable sources: despite recent developments on solar PV,
wind and biomass, the potential in Pakistan is still largely untapped. With regards to solar energy, the
resource potential exists all over the country, but is more significant in the southern and southwestern
parts of the country140. Wind power is also found to be an abundant resource in Sindh and Balochistan.
Just the Gharo-Keti Bandar wind corridor, for example, has a technical potential of 50 GW, and in fact
all installed wind power capacity in Pakistan is located along this corridor141. The biomass potential has
also been studied for Pakistan, and here as well there is a significant margin for developments142.
c) Electricity sector
As of February 2018, Pakistan’s installed power generation capacity totalled 29,944 MW143. This
represents an increase of 29.5% in relation to FY 2012-13, when installed capacity was 22,812 MW.
Indeed, the accentuated growth observed over this period reflects the urgent need, duly recognized by
the Government of Pakistan, of addressing an imbalance between the demand and supply of
electricity. Figure 4.8 below displays the installed capacity and how it has evolved over the years in
Pakistan.
Figure 4.8 – Installed power generation capacity in Pakistan in MW, from FY 2012-13 to 2016-17. Source: Pakistan Energy Yearbook 2017.
139 Private Power & Infrastructure Board, Hydel Potential in Pakistan, 2013, <https://www.nepra.org.pk/Policies/Hydel%20
Potential%20in%20Pakistan.pdf> 140 It may also be noted that the worst irradiation at any part in Pakistan is equal or more than the best irradiation at any part of Germany. Source: ESMAP, Renewable Energy Resource Mapping in Pakistan, accessed January 2019 ,
<http://esmap.org/node/3058> 141 Irfan Mirza et al., Assessment of Wind Potential in Kalar Kahar Region by Comparing On-Site Data with NREL Wind
Resource Map of Pakistan, 2015, <https://doi.org/10.1007/978-3-319-16033-7_4>
142 Word Bank, Biomass resource mapping in Pakistan, 2013, <http://documents.worldbank.org/curated/en/104071469
432331115/Biomass-resource-mapping-in-Pakistan-final-report-on-biomass-atlas> 143 Pakistan Energy Yearbook 2017. Ibid.

76
From the graph, it may be noted that in FY 2016-17 the installed capacity in Pakistan consisted of
60.8% thermal, 23.8% hydropower, 4.1% renewables (wind, solar PV and bagasse) and 3.6% nuclear.
Nonetheless, the figures on generation capacity do not exactly match those related to the power
generated over the same FY, which totalled 123,118 GWh. This can be understood in light of aspects
such as fuel availability144, capacity factor of the power plants (i.e. the number of operating hours per
year of the facilities), grid capacity or electricity imports. The graph in the figure below presents the
contribution per technology/fuel to power generation.
33.6%
32.1%
26.1%
5.7%
2.2% 0.2%
Natural gas
Oil
Hydro
Nuclear
Renewables
Coal
Figure 4.9 – Electricity generated in FY 2016-17, breakdown per fuel/technology. Source: Pakistan Energy
Yearbook 2017.
An observation from the figure above is that the contribution of coal to power generation is still
marginal, at 0.2%. On the other hand, and according to estimates of NEPRA, the national electricity
regulator, installed capacity of coal-fired power plants connected to the NTDC grid are planned to
increase by more than ten-fold to 8,232 MW by June 2021, and up to 12,163 MW in 2025,
corresponding to 18.0% and 19.6% of the total installed capacity in Pakistan on those years,
respectively145.
The graphs of Figure 4.10 display the share of electricity consumption per sector and per region. It can
be seen that the bulk of power consumption is in the domestic and industrial sector, with a share of
51% and 25%, respectively. This appears to suggest that the introduction of a carbon pricing
instrument applied uniformly to all sectors would mostly affect households and families. An implication
is that in the design of such instruments there is a need to ensure that final consumers are not
disproportionally or unfairly affected by higher electricity prices. It may also be noted that electricity
consumption on a per capita basis in Pakistan is one of the lowest in the world (see Figure 4.11),
which indicates that as the economy grows and populations become wealthier, this is accompanied by
a higher demand for energy services, including power. With regards to regions, it can be noted that the
Punjab and Sindh account for the bulk of electricity consumption in Pakistan, with a combined share of
84.1% of the total.
144 For example, the declining availability of natural gas has led to that existing power plants operating below capacity (see
<https://energypedia.info/wiki/Pakistan_Energy_Situation#Energy_Sources>) 145 NEPRA, NEPRA State of Industry Report, 2017, <https://www.nepra.org.pk/industryreports.htm>

77
25.1%
51.0%
5.3%
9.7%
8.2%
0.8%
Industrial
Domestic
Bulk supplies
Agriculture
Commercial
St.Light Others
63.7%20.4%
10.3%
4.6%1.2%
Punjab
Sindh
KPK
Balochistan
AJK
Figure 4.10a) – Electricity consumption by sector, 2016-
17. Only includes data from public utilities.
Figure 4.10b) – Electricity consumption by region, 2016-
17. Only includes data from public utilities.
0.17 0.29 0.35 0.5 0.630.92
1.62
3.15
4.28
5.03
7.15
7.97
0
1
2
3
4
5
6
7
8
9
Nepal Myanmar Bangladesh Pakistan Sri Lanka India Vietnam Iran China UK France Japan
MWh/capita
Figure 4.11 – Annual electricity consumption per capita. Source: International Energy Agency (2019)146.
The power sector has traditionally been dominated by State actors, only recently opening up to private
investment. At the federal level, the Power Division, Ministry of Energy, is the entity responsible for the
overall development of the sector including policy formulation. This Ministry was established in August
2017 by assuming as its two administrative divisions the power and oil & gas sections of the previously
existing ministries, the Ministry of Water and Power and the Ministry of Petroleum and Natural
Resources, respectively. Other federal-level entities with a stake in the power sector are:
i) NEPRA – established in 1997, it is the independent regulator for the sector, with a mandate to
ensure transparency, competitiveness and commercially oriented power market operations.
NEPRA also has the mandate of setting tariffs for the power sector and the issuance of
licenses in generation, transmission and distribution.
146 IEA, IEA World Energy Balances 2018, 2019, <https://webstore.iea.org/world-energy-balances-2018>

78
ii) Alternative Energy Development Board (AEDB) – established as an autonomous body
under the Ministry of Energy, it has the mandate of promoting and facilitating the exploitation of
renewable energy resources. It also develops national strategies, policies and plans on
renewable energy, and facilitates private sector participation in this field.
iii) Private Power & Infrastructure Board (PPIB) – also established as an autonomous entity
under the Ministry of Energy, it acts as a “one-stop” facilitator on behalf of the federal
government to support private-sector participation in power generation for non-renewable
technologies and large hydropower.
Power generation assets are, on their majority, owned and managed by state-owned entities. The
Water and Power Development Authority (WAPDA), a semi-autonomous entity under the
administrative control of the Federal Government, is responsible for the development and operation of
water infrastructure projects, including hydropower plants. State-owned thermal generation assets are
distributed among four generation companies (so called “GENCOs”), and they are managed by
another state-owned entity, the Pakistan Electric Power Company (PEPCO). K-Electric is the only
vertically integrated company operating in Pakistan, and in 2017 it owned and operated 2,295 MW of
thermal generation assets. K-Electric serves Karachi and it used to be a public sector company
operating under the name KESC (Karachi Electric Supply Corporation). It was privatized in 2005, and
currently the government holds a 22% stake.
The remainder thermal capacity is owned by a number of independent power producers (IPPs). As of
30 June 2017, there were 33 IPPs in operation in Pakistan147. Lastly, the four existent nuclear power
plants in Pakistan are under the management of the Pakistan Atomic Energy Commission (PAEC).
The contribution of these entities to power generation is presented in FY 2016-17 in Figure 4.12
below.
8.4%
43.0%
15.7%
6.2%
5.6%
2.0%
5.9%
1.1% 5.8%
1.1% 1.2% 2.5% 1.3%K-Electric
WAPDA
Other IPPs
KAPCO
HUBCO
Rousch
UCH&UCH II
Atlas Power
PAEC
Nishat Power
TNB Liberty
Habeli Bahdur Shah PP
AES Lalpir
Figure 4.12 – Breakdown of electricity generation per company, FY 2016-17.
147 Issues related to the development of IPPs are dealt with by the Private Power & Infrastructure Board (PPIB), which operates
under the Ministry of Energy (Power Division).

79
With regards to the transmission of electricity, there are two companies in Pakistan engaged on these
activities: the National Transmission Distribution Company (NTDC) and K-Electric. NTDC is
responsible for the operation, construction and maintenance of power transmissions lines and grid
stations all over Pakistan except for the Karachi Metropolitan Area, which is managed by K-Electric.
NTDC is under the control of PEPCO. The Government of Sindh also established the Sindh
Transmission and Dispatch Company, having assets transmitting electricity from Nooriabad to Karachi.
The distribution of electricity (i.e. at 132 kV and below) is managed by ten distribution companies
(DISCOs). They purchase electricity from generators, which is subsequently sold to customers on their
respective areas. All DISCOs are owned by the Government and are under the control of PEPCO, with
the exception of K-Electric which, as noted above, has its own distribution wing and is privately-
owned148.
All power generation assets connected to the NTDC system sell their electricity to the Central Power
Purchasing Agency (CPPA). CPPA is a state-owned entity which is responsible for procuring power
from GENCOs, IPPs and hydropower facilities. CPPA subsequently sells the electricity purchased to
DISCOs at the tariff set by NEPRA149. The current institutional arrangements for the power sector of
Pakistan are illustrated in the figure below:
Figure 4.13 – Organizational structure of the electricity sector, Pakistan150.
148 This excludes the Bahria Town Power Ltd, a DISCO established by the private sector to distribute electricity to consumers of
Bahria Town in Islamabad/Rawalpindi.
149 Upon its establishment, CPPA assumed the business previously held by NTDC of purchasing power and reselling it to
DISCOs. 150 Source: Government of Pakistan, Policy for Development of Renewable Energy for Power Generation, 2006.

80
In 2018, the national Parliament passed the Regulation of Generation, Transmission and Distribution of
Electric Power (Amendment) Act (2018)151, which puts forth a number of reforms to Pakistan’s
electricity sector with the aim of supporting the creation of a competitive market regime. To this end,
the Law formally introduces the establishment of new entities such as those of “market operator”,
“system operator” or “energy trader”.
The main policy document governing the power sector is the National Power Policy 2013152. The
policy was developed by the then Ministry of Water and Power153, and it provides the overall direction
to developments in the sector. Its overall aim is to enhance the efficiency of the system as a whole,
from generation to distribution, in a sustainable and affordable manner. It was intended to address four
challenges, identified below, which had led to an energy crisis:
i) The growing gap between power supply and demand, with the latter significantly outstripping
the first. This supply-demand gap had led to load-shedding of 12-16 hours nationwide on
average;
ii) High costs associated with the generation of electricity due to an increasing dependence of
fuel imports;
iii) High inefficiencies due to power loss from transmission and distribution (23-25%);
iv) High-level of subsidies and “circular debt” as a result of inefficiencies, energy theft and high
costs of generation.
In order to address these challenges, the policy lays out a number of targets. These include
decreasing the supply-demand gap to zero by 2017, reducing generation costs from Rs.12 per kWh to
Rs.10 per kWh by 2017, and to decrease transmission and distribution losses to 16% by 2017 from a
baseline of 23-25%. The policy stems on the principles of efficiency, competition and sustainability.
Since the policy was issued, Pakistan has made progress on these objectives. Among these, subsidies
to power tariffs have been consistently reduced, from Rs. 464 billion (2.3% of the GDP) in 2012 to Rs.
217 billion (0.7% of the GDP) in 2016154. The government has also made significant additions to
installed power generation capacity, as has been seen above.
One of the reforms introduced by the policy is the set-up of a new design architecture to support the
transition from the “single buyer” model into a competitive energy market. The overarching strategy is
151 National Assembly, Regulation of Generation, Transmission and Distribution of Electric Power Act, 1997, <http://www.na.gov.
pk/uploads/documents/1511254649_724.pdf> 152 Government of Pakistan, National Power Policy, 2013, <http://www.ppib.gov.pk/National%20Power%20Policy%202013.pdf>
153 The Ministry of Water and Power was dissolved in August 2017; the Power Division of this ministry was moved into the
Ministry of Energy. 154 Finance Division – Government of Pakistan, Economic and Social Survey 2017-18, 2018, <http://www.finance.gov.pk/survey/
chapters_18/Economic_Survey_2017_18.pdf>

81
to foster efficiency through competition in generation and retail, while leaving the “natural monopolies”
of transmission and distribution activities as regulated businesses. A first step towards this transition
was the establishment of a market operator, a function which was taken by the Central Power
Purchasing Agency (CPPA). Other priorities of the National Power Policy are the use of indigenous
resources, such as Thar coal, hydro and other renewable sources, and the promotion of energy
efficiency.
Three other policies at the federal-level are currently in effect in the context of which power projects
may be developed in Pakistan. They are briefly summarized in the table below:
Policy Description
Policy for Development of Renewable Energy for Power Generation (2006)155
This is Pakistan’s first energy policy exclusively aimed at
promoting renewable energy power projects;
With this policy, AEDB offers project initiation permits to private-sector investors developing projects using the following technologies: solar, wind, small-scale hydropower,
bagasse, biomass and waste-to-energy;
All renewable energy power projects in Pakistan are
developed under this policy.
National Policy for Power Co-Generation by Sugar Industry (2008)156
Policy specifically developed for power generation from the
sugar industry using bagasse and/or coal as fuel;
It provides similar incentive schemes for IPPs as the
renewable energy policy above.
Power Generation Policy (2015)157
The policy covers the development of new thermal and large
hydropower projects (above 50 MW), in both the public and private sectors, by laying out a framework for project
development.
Table 4.3 – Overview of federal policies on the power sector for Pakistan.
As seen above, high-subsidy levels and the resulting “circular debt” (see Box 4.1 below) are amongst
the main challenges faced by Pakistan in the power sector, and as will be discussed further in the
study, also has an impact on the introduction of carbon pricing instruments, in particular the
mechanism through which the actual costs of providing electricity are reflected in end-user bills. The
Government of Pakistan provides several subsidies to electricity consumption, the largest being the so-
called Tariff Differential Subsidy (TDS). The TDS is the difference between the “allowable costs”
incurred by electricity utilities, which are determined through regulation by NEPRA, and the electricity
tariff paid by consumers158. In FY 2012-13, the TDS corresponded to 96% of all subsidies paid159.
155 Government of Pakistan, Policy for Development of Renewable Energy for Power Generation, 2006, <https://www.aedb.org/
Documents/Policy/REpolicy.pdf> 156 Government of Pakistan, National Policy for Power Co-Generation by Sugar Industry and Guidelines for Investors, 2008,
<http://www.ppib.gov.pk/Co-Generation%20Policy%202008.pdf> 157 Gazette of Pakistan, Power Generation Policy 2015, 2015, <http://www.ppib.gov.pk/Power%20Policy%202015.pdf>
158 The tariff setting mechanism works as follows: among all DISCOs, NEPRA identifies the one with the lowest distribution tariff and calculates the different consumer tariffs based on that company’s cost and revenue records. Subsequently, all DISCOs are
instructed to charge these tariffs on a uniform national basis, with these being reimbursed the difference between their costs and

82
There are four main categories of consumers in Pakistan: residential, commercial, industrial and
agricultural. There is another “special” category of consumers, consisting of those that draw electricity
from the system in bulk and supply/consume electricity as per their usage. The tariff charged and the
subsidy level are set in relation to the consumer category and the consumption level. For example, the
power tariff for residential consumers is based on “slabs” of electricity consumption per household. A
highly subsidized tariff is provided to households that have a consumption of up to 50 kWh per month.
This “lifeline” slab is aimed at enabling the access to electricity by the poorest strata of the
population160. In FY 2012-13, half of electricity subsidies were disbursed to households, one quarter to
industries, and the remainder to agriculture and the commercial sector. According to research of the
World Bank, in FY 2014-15 the cost of residential electricity subsidies in Pakistan amounted to approx.
0.8% of GDP, roughly the same as the national expenditure with public health161. The reduction of
electricity subsidies to national industries has also been hindered out of concerns over their
international competitiveness162.
Box 4.1: Circular Debt in the Pakistan power sector
Although there is no legal definition of “circular debt”, the expression is used to designate the financial shortfall that hinders the power purchaser, CPPA, to pay power supply companies. This shortfall is mainly due to:
i) The difference between the actual costs of providing electricity and the revenue generated by DISCOs (which is based on the tariff determined by NEPRA);
ii) Delays or non-payment of subsidies by the national government;
iii) Delays in the determination of tariffs by NEPRA and in the notification by the national government;
iv) Poor revenue collection by DISCOs, which is further compounded by significant transmission & distribution losses and theft.
The inability of DISCOs to make full payments to CPPA spills over through the whole energy supply chain, resulting in the inability of generating companies to pay for fuel supplies and reduced investments in the sector. This has led to extended periods of load shedding, with adverse consequences to the economy and the society as a whole. The government’s policy is to limit and reduce the circular debt on a sustainable basis, as expressed in the National Power Tariff and Subsidy Guidelines (2014). Sources: National Power Tariff and Subsidy Policy Guidelines (2014)163; The Causes and Impacts of Power
Sector Circular Debit in Pakistan (2013)164
the set tariff as a subsidy. For example, if the lowest determined distribution tariff was Rs 10/kWh and the tariff for an average
DISCO Rs. 11/kWh, the government would reimburse the average DISCO the difference of Rs 1 per kWh as subsidy. 159 T. Walker et al., Reforming Electricity Subsidies in Pakistan: Measures to Protect the Poor, 2014, Washington, DC: World
Bank
160 However, a study conducted by the World Bank (2014, ibid.) has shown that electricity consumption is not directly aligned with overall welfare in Pakistan, with richer households benefiting disproportionately from subsidies. According to the same study,
only 28% of electricity subsidies reach the poor 161 World Bank, Residential Electricity Subsidies in Pakistan: Targeting, Welfare Impacts, and Options for Reform, 2017,
Washington, DC: World Bank 162 Tribune, PM blocks move to increase electricity tariff for industries, accessed February 2019, <https://tribune.com.pk/story/
1684287/2-pm-blocks-move-increase-electricity-tariff-industries/>
163 <http://climateinfo.pk/frontend/web/attachments/data-type/MoWP%20(2014)%20National%20power%20tariff%20guidelines%
20(1).pdf>

83
The promotion of energy efficiency is one of the priorities identified in the National Power Policy.
Indeed, energy intensity figures of Pakistan suggest that there is a significant potential for tapping on
energy efficiency and conservation opportunities, as can be observed from Figure 4.14. These
opportunities exist not only along the electricity value chain, as emphasized in the policy, but in the
energy sector as a whole. For example, the use of traditional biomass for heating and cooking
purposes, which is the main fuel used by a large part of the populations, is highly inefficient165.
0.65
0.6
0.51
0.45
0.42
0.350.34
0.310.3
0.240.22
0.150.13 0.13
0.09
0
0.1
0.2
0.3
0.4
0.5
0.6
0.7
Nepal Uzbekistan Iran Russia Pakistan India Thailand China SaudiArabia
Bangladesh Indonesia Sri Lanka Brazil USA Singapore
toe/thousand 2005 USD
Figure 4.14 – Energy intensity of selected countries, in total primary energy supply in 2016 (toe) per GDP in
thousand 2005 USD. Source: IEA (2019).
The main policy document at the federal level on energy efficiency is the National Energy Efficiency
and Conservation Act 2016.166 Recognizing the major role of energy efficiency, the Act lays out the
institutional set-up and mechanisms to effectively harness energy efficiency opportunities in Pakistan.
Among these is the establishment of a National Energy Efficiency and Conservation Authority
(NEECA), which is tasked, inter alia, with the mandate of coordinating energy conservation policies at
the federal level, the preparation of regulations, and the recommendation of energy consumption
standards. The Act provides the legal basis to the enforcement of measures on energy efficiency and
conservation. For instance, it introduces the concepts of “designated consumer” and lays out a
framework for the conduct of energy audits to energy intensive entities.
164 <http://climateinfo.pk/frontend/web/attachments/data-type/USAID%20(2013)%20The%20Causes%20and%20Impacts%
20of%20Power%20Sector%20Circular%20Debt.pdf> 165 For example, natural gas used in a conventional combustion boiler can have an efficiency as high as 84%, while traditional
biomass used for cooking has efficiencies as low as 8-15%. 166 The Gazette of Pakistan, National Energy Efficiency and Conservation Act, 2016, 2016, <http://www.na.gov.pk/uploads/
documents/1472205962_638.pdf>

84
d) Energy Access
The provision of universal access to modern forms of energy is one of the United Nations Sustainable
Development Goals (SDGs)167. It is also identified as a Category-I priority in the national framework for
SDGs, as noted in Section 4.1. A quick snapshot on the status quo of Pakistan on the two main
dimensions usually considered when analysing energy access – access to electricity and access to
clean cooking fuels – is provided below.
With regards to the first, according to estimates of the IEA168, 52 million people in Pakistan did not
have access to electricity in 2017. The rate of access was higher in urban areas (90% of the urban
population) than in rural areas (64% of the rural population). It may also be noted that among
developing Asian countries, and in absolute terms, Pakistan has the second largest population without
access to electricity (see Figure 4.15 below).
351
168
5233
23 14
91%87%
74% 80%
56%
95%
0%
10%
20%
30%
40%
50%
60%
70%
80%
90%
100%
0
50
100
150
200
250
300
350
400
Total Dev.Asia
India Pakistan Bangladesh Myanmar Indonesia
Pop. without electricity access Rate of access
Figure 4.15 – Population without electricity access (millions) and rate of access (in %) in developing Asian
countries in 2017. Source: IEA (2019)
In Pakistan, 130 million people lacked access to clean cooking facilities, relying instead on traditional
biomass, kerosene or coal as their primary cooking fuel in 2017.169 In a similar fashion to other
countries where energy access is not universal, the share of the population without access to clean
cooking is higher than those without electricity.
As can be seen from these energy access figures, a significant share of the country’s population is
found to be in a state of “energy poverty”. The government is therefore hard pressed to cater to the
167 Sustainable Development Goal 7 is to ensure access to affordable, reliable, sustainable and modern energy for all:
<https://sustainabledevelopment.un.org/sdg7> 168 IEA, Sustainable Development Goal 7: access to electricity, 2019, <https://www.iea.org/sdg/electricity/>
169 IEA, Sustainable Development Goal 7: access to clean cooking, 2019, <https://www.iea.org/sdg/cooking/>
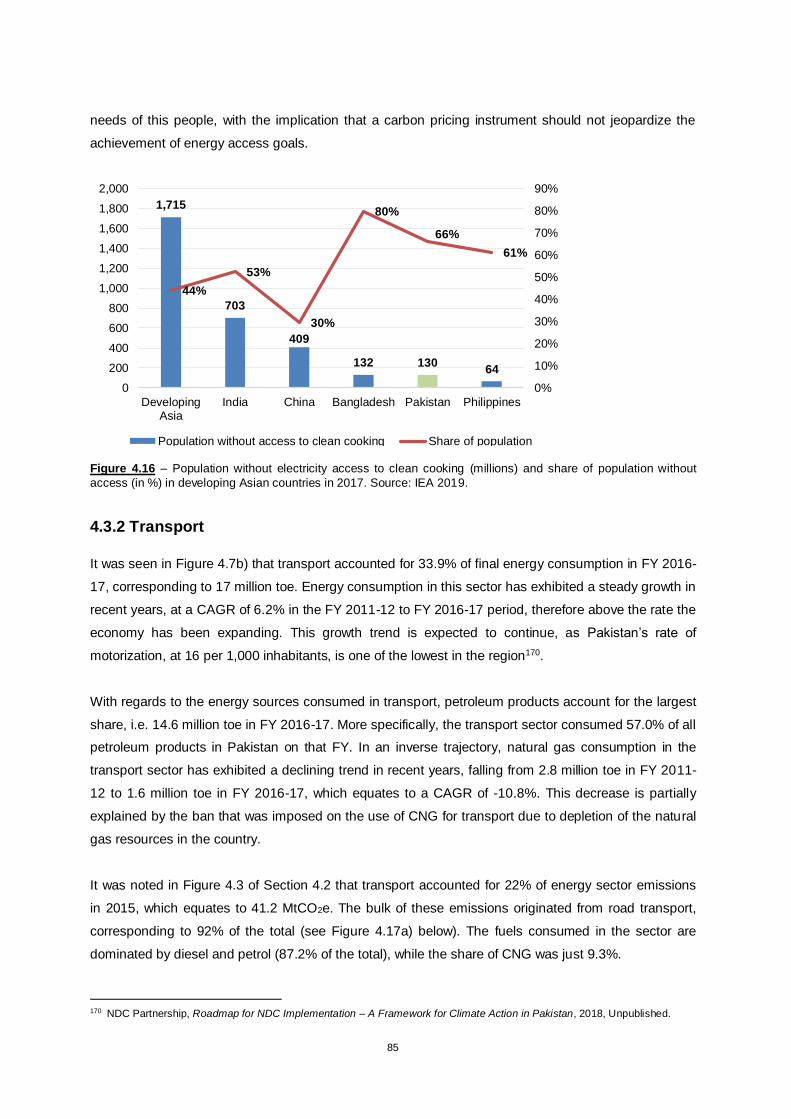
85
needs of this people, with the implication that a carbon pricing instrument should not jeopardize the
achievement of energy access goals.
1,715
703
409
132 13064
44%
53%
30%
80%
66%
61%
0%
10%
20%
30%
40%
50%
60%
70%
80%
90%
0
200
400
600
800
1,000
1,200
1,400
1,600
1,800
2,000
DevelopingAsia
India China Bangladesh Pakistan Philippines
Population without access to clean cooking Share of population
Figure 4.16 – Population without electricity access to clean cooking (millions) and share of population without
access (in %) in developing Asian countries in 2017. Source: IEA 2019.
4.3.2 Transport
It was seen in Figure 4.7b) that transport accounted for 33.9% of final energy consumption in FY 2016-
17, corresponding to 17 million toe. Energy consumption in this sector has exhibited a steady growth in
recent years, at a CAGR of 6.2% in the FY 2011-12 to FY 2016-17 period, therefore above the rate the
economy has been expanding. This growth trend is expected to continue, as Pakistan’s rate of
motorization, at 16 per 1,000 inhabitants, is one of the lowest in the region170.
With regards to the energy sources consumed in transport, petroleum products account for the largest
share, i.e. 14.6 million toe in FY 2016-17. More specifically, the transport sector consumed 57.0% of all
petroleum products in Pakistan on that FY. In an inverse trajectory, natural gas consumption in the
transport sector has exhibited a declining trend in recent years, falling from 2.8 million toe in FY 2011-
12 to 1.6 million toe in FY 2016-17, which equates to a CAGR of -10.8%. This decrease is partially
explained by the ban that was imposed on the use of CNG for transport due to depletion of the natural
gas resources in the country.
It was noted in Figure 4.3 of Section 4.2 that transport accounted for 22% of energy sector emissions
in 2015, which equates to 41.2 MtCO2e. The bulk of these emissions originated from road transport,
corresponding to 92% of the total (see Figure 4.17a) below). The fuels consumed in the sector are
dominated by diesel and petrol (87.2% of the total), while the share of CNG was just 9.3%.
170 NDC Partnership, Roadmap for NDC Implementation – A Framework for Climate Action in Pakistan, 2018, Unpublished.

86
Aviation Rail
Road 92%
1%2%
5%Navigation
46.0%
41.2%
9.3%
3.0%0.5%
Diesel
Petrol
CNG
Aviation fuel
Others
Figure 4.17a) – GHG emissions from transport, 2015.
Source: GCISC
Figure 4.17b) – Share of fuels consumed in transport
sector in FY 2017-18. Source: Energy Yearbook 2017
As road transport accounts for the largest share of emissions in Pakistan, it is worth taking a closer
look into developments in this segment. In particular, it should be noted that the number of road
vehicles in Pakistan has evolved from 2.71 million in 1990 to 4.7 million in 2000 and to 18.1 million in
2015. This means that in the 1990-2015 period road vehicles increased by more than six-fold in
Pakistan. In this respect, two-wheelers are the dominant vehicle type (more than 12 million units in
2015), followed by light-duty vehicles such as cars, jeeps and taxis.
In Pakistan, fuel prices roughly follow international oil price trends even though they are centrally
administrated by federal government agencies. For instance, the price of petroleum and oil products at
the exit of the refinery (so called “ex-depot” or “ex-refinery”) is capped so as not to exceed the Pakistan
State Oil’s average import price of the preceding two weeks. Ex-refinery prices include the following
components: i) an “import parity” price, ii) the “Inland Freight Equalization Margin”, iii) a distribution
margin, iv) dealers’ commission, and v) a “Petroleum Levy” set by the government. Retail prices are
determined by adding a general sales tax at a rate of 17%171, which is a major source of government
revenue. The Oil and Gas Regulatory Authority (OGRA) monitors the prices of petroleum and oil
products and may intervene in the market172.
Natural gas prices are determined based on a different method. In this case, OGRA plays a central
role in price setting. This is based in the determination of revenue requirements by gas utilities, which
takes into consideration the costs incurred with the purchase and distribution of gas, investments in the
transmission and distribution infrastructure, distribution losses173, and a prescribed rate of return.
Based on the revenue requirements calculation, OGRA makes a recommendation to the government
on the prescribed price for gas utilities. Subsequently, the government determines consumer prices for
the different sectors (domestic, commercial, power generation, general industries and CNG) after
171 FBR, Notification (Sales Tax), 2018, <http://download1.fbr.gov.pk/SROs/2018123123123532770NewDoc2018-12-
3120.32.19_1.pdf> 172 State Bank of Pakistan, Estimating Elasticity of Transport Fuel Demand in Pakistan, 2018, <https://www.researchgate.net/
publication/328631291_Estimating_Elasticity_of_Transport_Fuel_Demand_in_Pakistan> 173 Distribution losses are an issue of contention between OGRA and some gas utilities, as these are considerably high in
relation to global standards and, accordingly, have an impact on end-user prices.

87
including different taxes and levies. These consist of i) a sales tax (set at a rate of 17%), ii) the Gas
Infrastructure Development Cess (GIDC), and iii) a Natural Gas Development Surcharge (NGDS)
levied to CNG consumers.
The charges and taxes on petroleum, oil products and natural gas are administrated and collected by
different government bodies. While the Federal Board of Revenue (FBR) is the major collecting
agency, taxes related to fossil fuels (i.e. the Petroleum Levy, the Gas Infrastructure Development
Cess, and the Natural Gas Development Surcharge) are managed by the Ministry of Energy
(Petroleum Division). It should be noted that petroleum products contribute to a significant share of the
sales tax revenue collected in Pakistan. For example, in FY 2014-15, 43.9% of the sales tax revenue
raised from the domestic sector was due to the consumption of petroleum products, which was by far
the largest commodity contributing to this tax174. In the same FY, natural gas consumption contributed
to 4.3% of the sales tax (domestic). At the import stage, petroleum products also contributed to the
highest share of the sales tax, of 29.8%175. Box 4.2 provides a snapshot of the Petroleum Levy – also
designated as Petroleum Development Levy (PDL) – which is the charge exacted to petroleum
products resembling the most to a tax on negative externalities resulting from the consumption of these
products.
Box 4.2: Petroleum (Development) Levy in Pakistan
Pakistan introduced a levy on petroleum products in 1961, under the Petroleum Products (Petroleum Levy) (Amendment) Act, 2011. Since then, a surcharge is exacted to the consumption of such products, which is updated on a regular basis. As of 1 January 2018, “maximum” levy rates were set for a number of products, which consisted of 8 Rs/litre for high speed diesel oil (HSDO), 10 Rs/litre for motor gasoline, 6 Rs/litre for superior kerosene oil (KSO) and 3 Rs/litre for light diesel oil (LDO). Based on estimates of the authors176, had this surcharge been determined solely based on the carbon emission potential of these fuels, this would equate to a “shadow” carbon price of 26 USD/tCO2 for HSDO, 38.6 USD/ tCO2 for motor gasoline, 21 USD/ tCO2 for KSO and 9.8 USD/ tCO2 for LDO. This suggests that the determination of a levy such as this could be associated with the carbon emission potential of the fuels. Sources: Petroleum Products (Petroleum Levy) (Amendment) Act, 2011.177
The main policy document guiding future developments in Pakistan’s transport sector is the National
Transport Policy, which was approved by the National Government in June 2018178. With regards to
passenger transport by road, the Policy lays out as a priority the enhanced usage of non-motorized
174 FBR, FBR Biannual Review, Vol. 14, No.2, January-June 2014-15, 2015, <http://download1.fbr.gov.pk/Docs/20151271
5123128159Bi-AnnualJanuary-June2014-15(1stDraft)mailfromSecy.SPRS.pdf> 175 On this FY, 42% of federal tax receipts were due to a sales tax. More than half of this was due to sales tax on imports while
the remainder originated from the domestic sector. So it is in relation to this domestic collection that petroleum products contributed to 43.9%. 176 The estimate was made based on fuel emission factors and NCV of fuels taken from IPCC Guidelines for National
Greenhouse Gas Inventories. 177 Gazette of Pakistan, Amendment of Petroleum Products (Petroleum Levy) Ordinance, 1961, 2011, <http://www.senate.gov.
pk/uploads/documents/1363074572_505.pdf>
178 The Nation, National Transport Policy 2018 approved, accessed February 2019, <https://nation.com.pk/02-Jun-
2018/national-transport-policy-2018-approved>

88
vehicles and public transport. The provision of public transport services and the integration to other
modes is identified as a top priority. For freight transport, the policy also envisages fostering a shift
from road to other modes, in particular rail. More recently, as of June 2019, the government
announced it has been working on a policy to support the introduction of electric vehicles. One of the
main motivations for this policy is to tackle local air pollution, and amongst the targets of the policy is
the conversion of 90% of vehicles to electric by 2040179.
4.3.3 Industry
In section 4.3.1 it was observed that industry was the sector accounting for the largest share of final
energy consumption, or 35.8% of the total, equating to 17.9 million toe in FY 2016-17. In the six-year
period from FY 2011-12 to FY 2016-17, energy consumption in the energy sector increased at a CAGR
of 3.6%. As can be observed in the graph of the figure below, natural gas (44%) and coal (34%) are
the major sources of energy consumption in industry, followed by oil and electricity.
11.0%
44.0%34.0%
11.0%Oil
Natural Gas
Coal
Electricity
Figure 4.18 – Breakdown of final energy consumption in the industrial sector by energy source. Source: Energy
Yearbook 2017
With regards to natural gas, the major consumers in the industrial sector are “general industries” and
fertilizer producers. In the latter, natural gas is consumed both as feedstock and in the form of fuel.
With respect to coal, consumption is led by cement production facilities and brick kilns, which was
noted already in Section 4.3.1. This suggests that these industries are amongst the major GHG
emitters of Pakistan180.
Pakistan’s industrial structure has not significantly changed over the past three decades. In fact, the
country has been gradually de-industrializing and losing competitiveness vis-à-vis some international
peers such as Bangladesh, Sri Lanka or Vietnam, which is reflected in the stagnant or declining
contribution of the industrial sector to national GDP (see Figure 4.1). Major industries in Pakistan181
include textiles, fertilizer production, sugar mills, cement production, steel production and large petro-
179 Gulf News, Pakistan to introduce electric vehicles to fight air pollution, 2019, <https://gulfnews.com/world/asia/pakistan/
pakistan-to-introduce-electric-vehicles-to-fight-air-pollution-1.64528723>
180 This is confirmed by the sub-study conducted as part of this study on the potential for the establishment of an ETS in
Pakistan. 181 MOCC, Framework for Implementation of Climate Change Policy (2014-2030), 2013. Ibid

89
chemical plants. These industries are important contributors to the national economy but also
responsible for a significant share of national GHG emissions (approx. 6% of the total, including both
direct, indirect and process-related emissions)182.
The textile and garment industry has, historically, been one of the major drivers of the national
economy, and currently accounts for approx. 60% of national exports. The industry also contributes to
approx. 25% of industrial value-added and is a source of employment to around 40% of the industrial
labour force. According to Pakistan’s NDC, textiles are also an important contributor of national GHG
emissions, either directly (through captive power or heat generation) or indirectly (as purchasers of
power or heat).
The fertilizer industry is considered of vital importance to Pakistan, as fertilizers are a key input to
agricultural practice. According to recent data183, the total installed production capacity of fertilizer is of
approx. 9 million tonnes per year, which is produced by 20 facilities, half of them consisting of urea
plants. Fertilizer production facilities are typically large-scale and, as noted above, are also major
energy consumers and emitters of GHG. Acknowledging the mitigation potential from these industries,
an initiative to recover process heat in a fertilizer facility in Multan was registered as a large-scale CDM
project in 2009, holding the potential of reducing 119,481 tCO2e per year184.
The sugar industry is the second largest in Pakistan, employing more than 1.5 million people and
positioning Pakistan amongst the ten largest sugar producers in the world. The majority of sugar mill
facilities are located in Punjab and Sindh Provinces, and a share of the production is for export
markets185. Some by-products from sugar production also have commercial value, such as molasses
and bagasse. The first can serve as feedstock for the production of ethanol, which can be used as a
transport fuel. Bagasse can be used for different purposes, but in Pakistan it has often been used as a
fuel for power and/or heat generation. In early 2018, six sugar mills were generating power from
bagasse, with a cumulative installed capacity of approx. 200 MW186.
The cement industry is another major contributor to national GDP and, as of early 2019, 32 facilities
were reported187 to be in operation across the country, mostly around the largest population centres.
All of these facilities consisted of integrated plants, with the processes of clinkerization and grinding
taking place within the same industrial premises. The majority of cement produced in Pakistan is aimed
at supplying the national market, while a smaller share is exported (in FY 2017-18 this amounted to
182 Ibid. 183 Economic and Social Survey 2017-18. Ibid. 184 UNFCCC, Project 2687 : Pakarab Fertiliser Co-generation Power Project, accessed February 2019, <https://cdm.unfccc.int/
Projects/DB/TUEV-SUED1244760042.66/view> 185 The Lahore Chamber of Commerce & Industry, Overview of Sugar Industry in Pakistan, 2013, <http://www.lcci.com.pk/
rnd_reports/Sugar%20Sector%20(LCCI).pdf>
186 Economic and Social Survey 2017-18. Ibid. 187 Cemnet, Cement Plants located in Pakistan, accessed March 2019, <https://www.cemnet.com/global-cement-
report/country/pakistan>

90
10% of the total national production). The production of cement is expected to increase over the
coming years, driven by a growing population, urbanization, and major infrastructure projects
developed under the China-Pakistan Economic Corridor (CPEC) initiative188 . Concurrently, GHG
emissions from this sector are also expected to increase.
Other industries of relevance in Pakistan, in particular with regards to their contribution to GHG
emissions, are the following:
The petrochemicals industry in Pakistan is dominated by six major and two small refineries189.
Expansions are planned in the sector, including by both national and international companies190.
For global standards, Pakistan is a relatively small steel producer, with most of national demand
being met through imports191. The state-owned Pakistan Steel Mills Corporation is the major
steel production facility in the country and is based in Karachi.
Brick production is estimated to contribute to 1.5% of Pakistan’s GDP, with approx. 20,000
brick kilns in operation nationwide. Brick kilns are a major source of air pollution in Pakistan, not
only due to the emissions of CO2 – as coal is the most common fuel used in brick production –
but also of local pollutants such as black carbon and particulate matter192 . Due to their
contribution to air pollution, traditional brick kilns have been forced to shut down for extended
periods of time193.
Glass manufacturing is an energy intensive industry, with approx. 35 production facilities
estimated to be in operation in Pakistan, mostly in Punjab194.
Alongside textile production, leather manufacturing is another important industry of Pakistan,
with an estimated 800 tanneries operating in the country195. Whereas data on GHG emissions
due to the operation of tanneries is not available, major environment-related concerns with these
industries pertain to the discharge of effluents with limited or no treatment196.
188 Global Village Space, Pakistan’s World of Cement: Opportunities and Challenges, accessed March 2019,
<https://www.globalvillagespace.com/pakistans-world-of-cement-opportunities-and-challenges/>
189 Economic and Social Survey 2017-18. Ibid.
190 See for example: <https://economictimes.indiatimes.com/news/international/world-news/china-to-invest-4-billion-in-pakistan-to-develop-petrochemical-complex/articleshow/60100460.cms> or <https://nation.com.pk/22-Jan-2017/pakistan-to-set-up-plant-
to-produce-petrochemical-feedstock> 191 Pakistan & Gulf Economist, Growth Prospects for Pakistan’s Cement and Steel Industry, accessed March 2019,
<http://www.pakistaneconomist.com/2017/09/11/growth-prospects-pakistans-cement-steel-industries/> 192 CCAC, Pakistan moves toward environmentally friendly and cost-effective brick kilns, accessed March 2019,
<http://ccacoalition.org/en/news/pakistan-moves-toward-environmentally-friendly-and-cost-effective-brick-kilns> 193 Dawn, 70-day closure of brick kilns begins ahead of approaching smog, accessed March 2019, <https://www.dawn.
com/news/1440148> 194 Pakistan Institute of Trade and Development, Glass Industry, <http://www.pitad.org.pk/Publications/24-
Pakistan%20India%20Trade%20Liberalization%20Sectoral%20Study%20on%20 Glass%20Industry.pdf> 195 Pakistan & Gulf Economist, Leather Industry Review, accessed March 2019, <http://www.pakistaneconomist.com/2017/
12/25/leather-industry-review/> 196 Sanchez-Triana et al., Green Industrial Growth: Mainstreaming Environmental Sustainability in Pakistan’s Industrial Sector,
2012, Washington, DC: World Bank

91
As a final note, industrial development is expected to be given a boost in coming years, as in the
context of the CPEC initiative nine industrial zones are planned to be set-up in Pakistan197.
4.3.4 Agriculture and Forestry
The agriculture sector is the second largest contributor to national GHG emissions in Pakistan, as was
shown in Figure 4.2. A breakdown of emissions from agriculture was also displayed in Figure 4.4,
where it was noted that the two major contributors are nitrous oxide emitted from agricultural soils
(44.5%) and methane emitted from enteric fermentation processes (42.3%). It should be noted that all
GHG emissions due to fossil fuel use in agriculture sector are covered as part of energy sector
emissions.
Pakistan’s NDC already indicates a number of policy options to reduce emissions from the agricultural
sector, including on the two abovementioned major contributors. Nitrous oxide emissions from
agriculture are due to the use of nitrogen fertilizers in soils and, in this regard, the NDC indicates as a
medium-level policy priority a more efficient use of chemical fertilizers as a means of reducing these
emissions198. With respect to emissions from enteric fermentation, the NDC indicates as a medium-
level priority the introduction of new dietary regimes for livestock as a way of reducing emissions from
these activities. The NDC also recognizes the adoption of ruminant production systems with higher
productivity as a mitigation option, although this policy measure is assigned a low priority-level due to
high costs and uncertainties related to their emissions reduction potential. Nonetheless, research and
empirical work conducted by the Food and Agriculture Organization (FAO) in South-Asian countries
such as Bangladesh or Sri Lanka indicate there are low-cost strategies that countries can pursue to
reduce emissions from enteric fermentation199.
It needs to be noted that emissions from these GHG producing activities – nitrous oxide from fertilizer
application, methane emissions due to enteric fermentation – have seldom been directly targeted or
included in the scope of a carbon pricing scheme. Reasons for this include methodological issues in
accurately quantifying these emissions200, challenges in obtaining reliable and accurate data201, and
the inadequacy of an explicit price on carbon as an incentive for emission reductions202. Nonetheless,
197 Xinhua, Pakistan to set up nine industrial zones under CPEC: Minister, accessed March 2019, <http://www.xinhuanet.com/
english/2018-05/07/c_137160374.htm> 198 There are other approaches which can support the reduction of nitrous oxide emissions, such as the minimization of tillage for cropping or the prevention of waterlogging (see, for example, <https://www.agric.wa.gov.au/climate-change/reducing-nitrous-
oxide-emissions-agricultural-soils>)
199 For Sri Lanka see <http://www.fao.org/3/a-i7673e.pdf>; for Bangladesh see <http://www.fao.org/3/a-i6822e.pdf> 200 For instance, in the case of N2O emissions, these are the result of microbial activities from adding nitrogen into soils, as a side product of nitrification and denitrification processes. While emissions are proportional to the quantities of nitrogen added,
these tend to be highly variable in space in time depending on a number of environmental parameters, such as temperature, soi l
pH, water content in soils, etc. 201 Obtaining this data, at the level of emissions, for instance in the case of ruminants, can entail high transaction costs,
especially when activities are highly dispersed (e.g. if ruminant ownership is restricted to small family holdings).
202 In the case of enteric fermentation, incentives for reducing methane emissions are usually better linked with livestock (e.g. in
the form of meat of milk productivity rather than a focus on methane emission reductions).

92
a few jurisdictions worldwide have allowed the quantification of emission reductions from these
activities for use as compliance instruments in the scope of a broader carbon pricing system. For
instance, in Canada’s Alberta Province, farmers are allowed to quantify emission reductions from dairy
cattle activities, which are eligible as offsets in the scope of Alberta’s Offset System203. Another
example is the Swiss Carbon Offset Programme, which enables the generation of carbon offsets from
reduced nitrous oxide emissions from fertilizer use. These can subsequently be sold and traded
although only within Switzerland.204
Emissions from land use change and forestry (LUCF) accounted for the smallest share of national
GHG emissions in 2015, of just 2.6% of Pakistan’s total. As per the GHG inventory, these are due to
the release of CO2 from changes in forests and other woody biomass stocks. According to the NDC,
forest cover in Pakistan corresponds to 5% of the total land area, which is significantly below the 12%
recommended by the UN, thereby qualifying it as a “low forest cover” country. On the other hand, it is
expected that Pakistan can become a net sink in the long run in view of aggressive plans for
reforestation. These include initiatives such as the Khyber Pakhtunkhwa Province’s “Billion Tree
Tsunami”, and the Green Pakistan Programme at the federal level, which aims to plant 100 million
trees in five years across the country205. It should be noted as well that there is significant interest in
associating forestry activities with climate finance and crediting mechanisms206.
In addition, the Government of Pakistan has been working on REDD+ readiness activities since June
2015, based on funding provided by the Forest Carbon Partnership Facility (FCPF) of the World Bank.
These readiness activities are grouped into four components: i) REDD organization and management,
ii) REDD+ strategy preparation, iii) emission level/reference levels, and iv) designing of monitoring
systems for forests and safeguards207. Specific activities that could be associated, directly or indirectly,
with carbon pricing instruments are the establishment of an MRV framework for REDD+ activities and
the testing of a “Payments for Environment Services” scheme. At the time this study was prepared,
work on these elements was still in early stages of development.
4.3.5 Waste Management
As a share of national GHG emissions, those resulting from waste management activities have been
relatively stable over the years. In 1994 they accounted for 2.5% of the total, decreasing in 2008 to
1.8%, but then increasing to 2.8% in 2012 and to 3.0% in 2015. Based on the projections made in
Pakistan’s NDC, GHG emissions from waste are expected to increase to 5.6% as a share of the
national total in 2030.
203 See for example <https://www1.agric.gov.ab.ca/$Department/deptdocs.nsf/all/cl14149>
204 See for example <https://www.firstclimate.com/en/climate-friendly-fertilizer-program/>
205 See for example <https://www.weforum.org/agenda/2018/07/pakistan-s-billion-tree-tsunami-is-astonishing/>
206 Based on consultations with stakeholders in Pakistan. 207 Forest Carbon Partnership, Pakistan, accessed March 2019, <https://www.forestcarbonpartnership.org/pakistan>
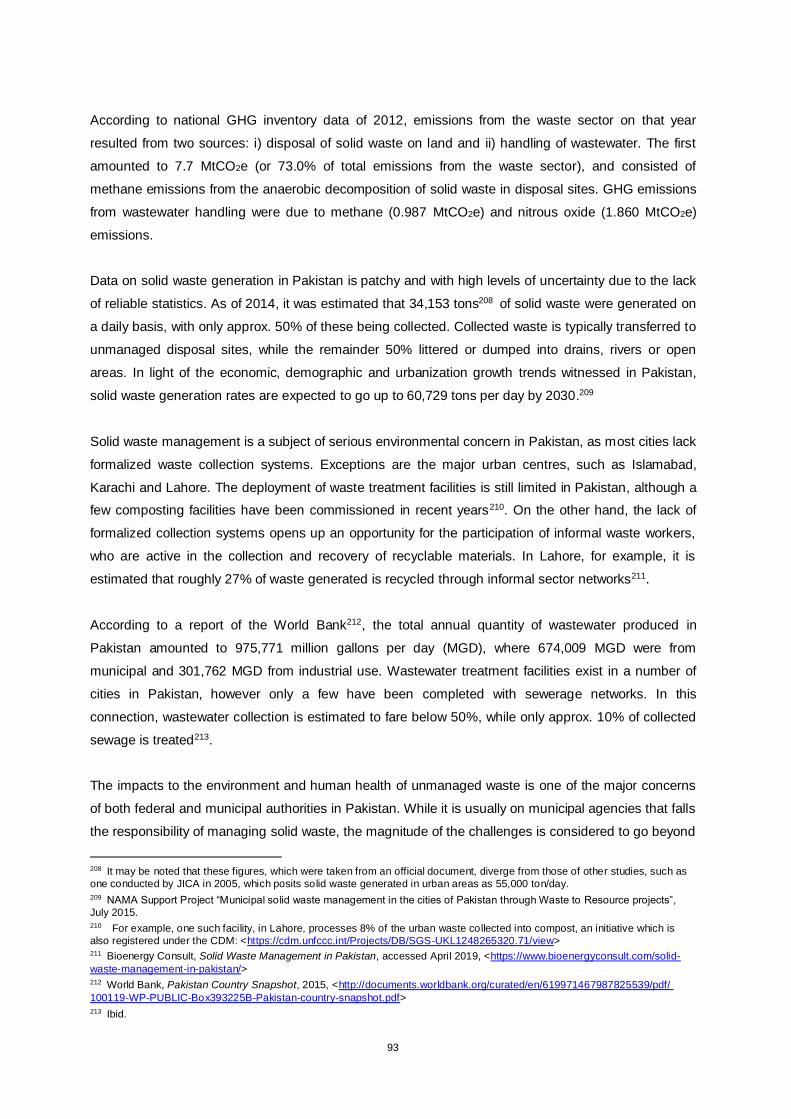
93
According to national GHG inventory data of 2012, emissions from the waste sector on that year
resulted from two sources: i) disposal of solid waste on land and ii) handling of wastewater. The first
amounted to 7.7 MtCO2e (or 73.0% of total emissions from the waste sector), and consisted of
methane emissions from the anaerobic decomposition of solid waste in disposal sites. GHG emissions
from wastewater handling were due to methane (0.987 MtCO2e) and nitrous oxide (1.860 MtCO2e)
emissions.
Data on solid waste generation in Pakistan is patchy and with high levels of uncertainty due to the lack
of reliable statistics. As of 2014, it was estimated that 34,153 tons208 of solid waste were generated on
a daily basis, with only approx. 50% of these being collected. Collected waste is typically transferred to
unmanaged disposal sites, while the remainder 50% littered or dumped into drains, rivers or open
areas. In light of the economic, demographic and urbanization growth trends witnessed in Pakistan,
solid waste generation rates are expected to go up to 60,729 tons per day by 2030.209
Solid waste management is a subject of serious environmental concern in Pakistan, as most cities lack
formalized waste collection systems. Exceptions are the major urban centres, such as Islamabad,
Karachi and Lahore. The deployment of waste treatment facilities is still limited in Pakistan, although a
few composting facilities have been commissioned in recent years210. On the other hand, the lack of
formalized collection systems opens up an opportunity for the participation of informal waste workers,
who are active in the collection and recovery of recyclable materials. In Lahore, for example, it is
estimated that roughly 27% of waste generated is recycled through informal sector networks211.
According to a report of the World Bank212, the total annual quantity of wastewater produced in
Pakistan amounted to 975,771 million gallons per day (MGD), where 674,009 MGD were from
municipal and 301,762 MGD from industrial use. Wastewater treatment facilities exist in a number of
cities in Pakistan, however only a few have been completed with sewerage networks. In this
connection, wastewater collection is estimated to fare below 50%, while only approx. 10% of collected
sewage is treated213.
The impacts to the environment and human health of unmanaged waste is one of the major concerns
of both federal and municipal authorities in Pakistan. While it is usually on municipal agencies that falls
the responsibility of managing solid waste, the magnitude of the challenges is considered to go beyond
208 It may be noted that these figures, which were taken from an official document, diverge from those of other studies, such as
one conducted by JICA in 2005, which posits solid waste generated in urban areas as 55,000 ton/day.
209 NAMA Support Project “Municipal solid waste management in the cities of Pakistan through Waste to Resource projects”,
July 2015. 210 For example, one such facility, in Lahore, processes 8% of the urban waste collected into compost, an initiative which is
also registered under the CDM: <https://cdm.unfccc.int/Projects/DB/SGS-UKL1248265320.71/view> 211 Bioenergy Consult, Solid Waste Management in Pakistan, accessed April 2019, <https://www.bioenergyconsult.com/solid-
waste-management-in-pakistan/> 212 World Bank, Pakistan Country Snapshot, 2015, <http://documents.worldbank.org/curated/en/619971467987825539/pdf/
100119-WP-PUBLIC-Box393225B-Pakistan-country-snapshot.pdf> 213 Ibid.

94
their abilities. Pakistan has been trying to address these challenges through policy and legislation.
More recently, in October 2018, Prime-Minister Imran Khan launched the five-year campaign “Clean
and Green Pakistan”, with a vision to drive a nationwide cleanliness movement by the people of
Pakistan. The programme envisages addressing five components: tree plantation, solid waste
management, liquid waste management & hygiene, total sanitation and safe water (see Box 4.3).
Major policy and regulatory frameworks dealing with solid waste management in Pakistan are outlined
in Table 4.4 below.
Policy Year Overview
Pakistan
Environmental Protection Act
1997 Provides a framework for establishing federal and provincial Environmental Protection Agencies (EPAs).
National
Environmental Policy 2005
Provides an overarching framework for addressing the environmental issues
faced by Pakistan. These include natural disasters, climate change, the lack of proper waste management approaches, etc. On solid waste management, it provides a number of directions, as follows:
- The reduction, recycling and re-use of municipal and industrial solid waste;
- The development and enforcement of rules and regulations for proper management of municipal, industrial, hazardous and hospital waste;
- The use of waste as resources for energy generation.
Solid Waste Management Guidelines
2005
These guidelines were formulated by the Pakistan EPA, with the support of
JICA and UNDP, to foster the reduction, collection, and disposal of solid waste. The document also provides action plans for defining the strategies and measures for solid waste management.
National Climate Change Policy (NCCP)
2012
The NCCP provides a set of policy measures targeting the waste sector, in
particular:
- Legislate and enforce industrial and domestic waste management
practices;
- Reduce and control solid waste;
- Install plants to generate power from “municipal waste”;
- Ensure separate collection, disposal and re-use of recyclable, composite
and bio-degradable waste;
- Make installation of wastewater treatment plants an integral part of all
sewerage schemes;
- Ensure recycling of wastewater through proper treatment and its reuse.
Table 4.4 – Key policies and regulations on solid waste and wastewater management in Pakistan.
Box 4.3: The Clean and Green Pakistan Movement
The Prime Minister of Pakistan launched the Clean and Green Pakistan Movement on October 13, 2018. The movement is focused on behavioural change and institutional strengthening, and has the following main components: tree plantation, solid waste management, liquid waste management and hygiene, sanitation and safe water. The Ministry of Climate Change has been designated as the focal institution for partnering with the public and the private sector in implementing the initiative. The overall emphasis of the campaign is on behavioural change, while some of the strategies that will be pursued under this initiative are: i) the creation of an enabling environment through the passing of new legislation and regulations; ii) developing and implementing effective municipal and

95
industrial waste management systems; and iii) developing an effective monitoring and reporting system to track progress in implementation. Source: Own elaboration based on consultations in Pakistan.
4.4 Stakeholders Analysis
When considering the introduction and development of a carbon pricing instrument (CPI) in Pakistan, a
number of actors would need to be involved, directly or indirectly. The table below identifies these
stakeholders, briefly indicating their potential role in the context of a carbon pricing framework:
Stakeholders Name Sector Current Function Potential Role
Ministry of Climate Change
Federal Ministry Design and implementation of policies and regulations on climate change.
Overall design of the CPI; alignment of CPI with national policies and NDC; implementation oversight; inter-ministerial coordination, etc.
Ministry of Energy (Power Division)
Federal Ministry Design and implementation of policies and regulations in the power sector.
The introduction of a CPI would likely have an impact on companies operating in the electricity sector and, as such, its development should involve this ministry/division.
Ministry of Finance,
Revenue and Economic Affairs
Federal Ministry
Handles with issues related to financial legislation, financial institutions, capital markets, centre and the overall state finances.
Ensuring the CPI is aligned with Pakistan’s financial and revenue generation instruments and policies.
Federal Bureau of
Revenue Federal agency
Enforcement of fiscal laws and revenue collection.
Design and operationalization of the revenue generation mechanism associated with the CPI, especially if in the form of a carbon tax.
Ministry of Industries and Production
Federal Ministry
Formulation and implementation of policies on industrial development and production.
In the context of CPI design, ensure synergies with other industrial development policies and as a mechanism to support industrial competitiveness.
Ministry of Foreign
Affairs Federal Ministry Foreign policy of Pakistan.
In ensuring alignment between the CPI and progress in international climate negotiations as well as linkages with the CPIs of other jurisdictions.
Ministry of Planning
Development and Reforms
Federal Ministry Responsible for Pakistan’s economic planning and development policies.
Seeking alignment with other planning and development policies of Pakistan, as well as synergies with the CPEC initiative, including potential linkages with the China national ETS.
Pakistan Environmental Protection Agency (PAK-EPA)
Federal agency
Protection of the human health and the environment through the preparation and enforcement of regulation based on laws passed by the Parliament.
Support MOCC in designing and implementing the selected CPI, particularly in the technical, operational and regulatory components; in ensuring synergies with environment-related regulations, such as the emission of local pollutants.

96
EPAs – Provincial Provincial agencies
Enforcement of national regulations on human health at the environment at the provincial level
Support the implementation of the CPI at the provincial level (e.g. on MRV or in ensuring compliance of industries with the CPI) in articulation with Provincial Committees.
Pakistan Climate
Change Authority Federal agency
Design of policies, plans, programmes and other measures on climate change in Pakistan
Could function as a “regulator” and the technical arm of MOCC in the scope of a CPI. Alignment with roles and responsibilities of PAK-EPA would need to be ensured.
Pakistan Climate Change Fund
Federal agency Provision of funds to climate change-related activities in Pakistan.
Could act as a recipient and distributor of funds raised from a CPI.
AEDB Federal agency Promotion and execution of alternative energy projects.
Use of revenue generated from a CPI to support renewable energy projects.
NEECA Federal agency Promotion and execution of energy efficiency projects.
Use of revenue generated from a CPI to support energy efficiency projects; the development of energy management / energy auditing procedures could go hand in hand with the development of an MRV framework for a CPI.
GENCOs Public entities Government-owned power generation companies.
As their activities would be impacted by the CPI, they would need to be involved in the design (e.g. in the MRV of emissions), piloting and implementation of the selected instrument.
IPPs Private companies Private-owned power generation companies.
As their activities would be impacted by the CPI, they would need to be involved in the design (e.g. in the MRV of emissions), piloting and implementation of the selected instrument.
PEPCO Public entity Management company for DISCOs, GENCOs and NTDC.
Involvement in consultations and in the design of the mechanism for introducing the CPI.
K-Electric Private company Fully integrate electricity company.
As their activities would be impacted by the CPI, they would need to be involved in the design (e.g. in the MRV of emissions) and implementation of the selected instrument.
CPPA Public entity Clearing house for sale and purchase of electricity.
The carbon price “pass-through” to electricity consumers, in case power generation is included as part of a carbon pricing instrument, would likely have to involve CPPA.
Federation of Pakistan Chambers of Commerce
& Industry
Business association
Business association representing commerce and industry
To support communications on carbon pricing, consultations, knowledge sharing and capacity building on carbon pricing among industries.
Industry Associations
(e.g. cement, textiles, sugar mills, etc.)
Business association(s)
Business associations representing different industries
To support communications on carbon pricing, knowledge sharing and capacity building among specific sectors, in case they are included in the scope of the CPI.
Table 4.5 – Stakeholders to consider in the context of a carbon pricing instrument in Pakistan, including potential
roles.

97
4.5 SWOT analysis and readiness assessment to carbon pricing
Based on the analysis of the national context and the different elements required for carbon pricing,
this section reflects on the readiness status of Pakistan concerning the introduction of carbon pricing
instruments. It presents a SWOT analysis – which condensates the main strengths, weaknesses,
opportunities and threats for the introduction of a carbon pricing instrument in relation to the specific
national circumstances of Pakistan – and is followed by the outlining of a framework where a set of
“readiness” elements are analysed and discussed.
SWOT ANALYSIS
Strengths:
o Climate change recognized as a national priority in federal policies and strategies;
o Robust policy framework at the federal level on climate change, including on mitigation, which is
fully supportive of the introduction of a carbon pricing instrument;
o Robust policy framework at the federal level on areas that could directly benefit from carbon
pricing instruments, namely renewable energy and energy efficiency and conservation;
o The existence of taxes and charges that put a price on negative externalities (e.g. the Petroleum
Development Levy), indicating there is already some experience in the adoption of “polluter
pays” principles in Pakistan;
o Overall positive experience obtained from the implementation of CDM activities in Pakistan,
which suggests the existence of low-cost mitigation opportunities as well as some level of
familiarity with market-based mechanisms;
o High level of interest among several federal agencies on carbon pricing, suggesting there is a
strong scope for grooming a generation of government officials who could become “national
champions” on this subject.
Weaknesses:
o Carbon pricing not recognized as a priority in Pakistan, despite the interest of different
stakeholders on this topic and its specific instruments;
o Limited awareness, especially among businesses and the general public, about climate change
and the need to curb emission of GHGs;
o Limited capacities and resources of government agencies to the development and
implementation of climate change mitigation instruments, especially at the provincial level;
o Lack of an institutional and legal framework for the adoption of carbon pricing instruments,
particularly if an emissions trading system becomes (one of) the selected instrument(s);

98
o Limited availability of data on GHG emissions at the facility level, including on energy
consumption, which is of key relevance to the design and set up of a carbon pricing instrument;
o Limited experience of companies in the reporting of emissions (MRV), which is an important
component for the development of a carbon pricing instrument.
Opportunities:
o A carbon pricing instrument could trigger low GHG emission reduction opportunities while at the
same time generating benefits in several other areas (“co-benefits), such as a reduction in the
emission of air pollutants, reduced energy dependency or an increase in the share of renewable
energies;
o The re-emergence of global carbon markets, especially in the scope of Article 6 of the Paris
Agreement, and the perspective of establishing linkages with the carbon pricing systems of other
jurisdictions globally;
o The potential for regional cooperation on carbon pricing instruments, namely with China, a
strategic partner of Pakistan in the context of the CPEC initiative, which is expected to
operationalize its national ETS in early 2020;
o As a revenue generation mechanism, a carbon pricing instrument could be the basis for raising
additional funds to the government;
o The set-up of new federal institutions focused on climate change following the passing of the
Climate Change Act (2016), in particular the Pakistan Climate Change Authority and the
Pakistan Climate Change Fund; the latter could be a vehicle to support the collection and
distribution of revenues raised by a carbon pricing instrument to specific climate change
activities;
o The instrumental role played by Provinces in the implementation of environment-related policy
and regulation, profiling them as ideal candidates for the piloting of carbon pricing instruments;
o The gradual liberalization of the electricity sector in Pakistan and the reduction of subsidies paid
to electricity consumption, which could go hand-in-hand with the adoption of market-based
instruments such as carbon pricing;
o Relatively high levels of energy intensity in Pakistan suggest there is an opportunity for
improvements on energy efficiency and conservation, with the potential for net economic
benefits, which could be triggered by the introduction of a carbon pricing instrument;
o The existing policy framework for energy efficiency, laying out the legal basis for the conduct of
energy audits, which could serve as foundation for obtaining GHG emissions data of major
emitters as well as the establishment of an MRV framework in association with a carbon pricing
instrument;
o The existence of industry clusters in Pakistan – e.g. textiles and garment, sugar mills or cement
production – which could be potentially interested in being part of a carbon pricing instrument, for

99
example as a means to foster energy efficiency, technological upgrades, innovation or emissions
reporting;
o The increasing pressure on industries exposed to international competition and international
markets, such as the European Union, for the reporting of emissions and the adoption of
measures to reduce carbon footprints;
o The adoption of a carbon pricing instrument would send a clear signal that Pakistan is prepared
to combat climate change, giving it more visibility in international platforms and potentially
supporting the country in better accessing climate financing opportunities.
Threats:
o The limited and imperfect understanding about carbon pricing concepts among many
stakeholders (including government agencies, businesses and the general public), potentially
leading to misconceptions about these instruments, especially on their negative impacts to the
economy and the poor;
o Expected initial resistance of industries and other interest groups to the introduction of carbon
pricing, given the novelty of the concept and the perspective of an additional cost that needs to
be borne by the companies in question;
o General perception of the limited “fiscal space” for introducing additional charges on businesses
or the average citizen, either as the result of a carbon tax or an ETS;
o The ambitious economic growth goals and the urgency of making quick progress in certain
development indicators – e.g. provision of jobs, poverty eradication and universal access to
modern energy services – may overshadow the potential for exploring low-carbon options and
instruments on their support, namely carbon pricing;
o Challenges in the enforcement of regulation and legislation, especially on environment and
pollution control issues, which could jeopardize the effectiveness of a carbon pricing instrument
in case adopted.
An aspect standing out from the SWOT analysis concerns the sheer number of opportunities
associated with the adoption of carbon pricing in Pakistan. In effect, the potential for exploring some of
these opportunities should form the basis for the Government of Pakistan to consider taking further
steps towards the development of a carbon pricing instrument.
It may be noted, on the other hand, that some of the most noteworthy challenges on carbon pricing
derive from the novelty of the concept, in particular the negative overtones associated with the
imposition of a price on something (in this case, GHG emissions). In this respect, it is underscored the
importance of engaging in dialogue, appropriately communicating and sensitizing stakeholders about
the actual implications of carbon pricing, in particular its benefits and costs.

100
The table below discusses Pakistan’s readiness status vis-à-vis the introduction of carbon pricing
instruments taking into account ten “readiness elements”. For each of these elements, three readiness
levels are considered to assess Pakistan’s status: high ( ), medium ( ) and low ( ).
Readiness element Readiness
Status Rationale and observations
Policy Framework – national level
Pakistan’s policy framework at the national level is fully supportive of the introduction of carbon pricing approaches, in particular the National Climate Change Policy, its implementation framework and the Pakistan Climate Change Act.
Policy Framework: sub-
national level
The Eighteenth Amendment to the Constitution devolved responsibilities to Provinces and Autonomous Territories, with the implication that the implementation of national policies related to environmental protection, including climate change, is at the discretion of sub-national authorities. With regards to climate change mitigation instruments, such as carbon pricing, no steps have been taken yet by sub-national authorities to support their implementation at the federal or city level.
Institutional set-up & governance
The passing into law of the Pakistan Climate Change Act brings clarity to institutional roles and functions on climate change issues, introducing certain institutional bodies (e.g. the Pakistan Climate Change Authority and the Pakistan Climate Change Fund), which could play a role in the design and operationalization of a carbon pricing instrument.
Regulatory Framework
A regulatory framework would need to be established from scratch for the purposes of setting-up and operationalizing a carbon pricing instrument in Pakistan.
NDC development & emission projections
Pakistan has laid out a GHG emission reduction target as part of its NDC, which can serve as a basis in relation to which a carbon pricing instrument could be designed.
GHG inventory
The preparation of a GHG inventory is a first step to quantify GHG emissions occurring within the boundaries of Pakistan. Capacities established at this level, which already exist and are in the process of being further improved, can serve as a basis for the establishment of an MRV infrastructure at the facility level.
MRV
Pakistan lacks an MRV framework for tracking emissions at the entity/entity level, which would need to be established in the context of a carbon pricing instrument, especially in case the national Government opts for developing an ETS.
Data & Registries
There is a generalized lack of data on GHG emissions, including registries, which could be essential for the introduction of a carbon pricing instruments (e.g. in tracking progress in implementation, definition of benchmarks, etc.)
Stakeholder engagement & communication
Stakeholder engagement and communication are essential elements for the success of a carbon pricing instrument. While there is a growing awareness in Pakistan on this topic, especially among officials at the federal level, further efforts are required to engage other stakeholders, namely industry groups, the private sector, and sub-national authorities.

101
Technical capacities and capacity building needs
While there is no dearth of technical and qualified individuals in Pakistan, specific competencies would need to be developed in order to fully implement and operate a carbon pricing instrument.
Table 4.6 – Readiness assessment of Pakistan on the introduction of carbon pricing instruments.
All in all, it can be concluded that the level of Pakistan’s “readiness” for the introduction of carbon
pricing is medium/low. The main gaps are on regulatory and technical aspects such as on the need for
developing an MRV framework and coming up with an institutional set-up that can support the
operationalization of carbon pricing instruments. Capacity building, awareness raising and stakeholder
engagement are other areas that would need to be addressed in case carbon pricing is to be
developed in Pakistan.

102
5. Design Options for Carbon Pricing in Pakistan
This chapter proposes and discusses a set of carbon pricing options for the consideration of the
Government of Pakistan. The analysis is based on the two main approaches that exist for putting a
price on carbon emissions and which were discussed in Chapter 3: cap-and-trade and carbon taxation.
While these were the main carbon pricing modalities considered, a set of “hybrid” approaches are also
suggested and briefly discussed.
This analysis takes into account the specific circumstances of Pakistan, in particular the fact that the
country is a relatively small GHG emitter – especially when considered on a per capita basis – and that
the introduction of a carbon pricing instrument should not put at risk social and economic development
goals, the international competitiveness of companies based in Pakistan, and the access of the
population to modern, affordable and reliable sources of energy. In effect, the underlying premise of
this analysis is that a carbon pricing instrument should support and reinforce these goals to the extent
possible. In this regard, the principle of “fairness” – which prescribes that the costs and benefits of
carbon pricing should be distributed equally while avoiding a disproportionate burden on the most
vulnerable groups – was taken as a foundation of the analysis.
The chapter starts with a discussion of options for the establishment of an emissions trading system in
Pakistan (Section 5.1), is followed by an assessment of carbon taxation modalities (Section 5.2),
hybrid approaches (Section 5.3), and wraps-up with a summary of the main features of the options
discussed (Section 5.4).
5.1 Cap-and-trade / Emissions trading
The set-up of a cap-and-trade / emissions trading system (ETS) is one of the three main approaches
that exist for explicitly pricing GHG emissions, as seen in Chapter 3. In the context of Pakistan, a
carbon pricing instrument in the form of an ETS could be introduced so as to fit into national
circumstances and trigger the generation of multiple benefits. In particular, as an opportunity to:
Accelerate the deployment of cleaner forms of energy and energy efficiency, which hold a
significant untapped potential in Pakistan;
Increase energy security by favouring the efficient use of fossil fuel resources and expansion of
renewable power generation;
Increase the country attractiveness to international investments on environmentally sound
technologies;
Generate revenue from the sale of allowances;
Track GHG emissions at the point where they occur, providing a basis of support to monitor
progress in the implementation of NDC goals;

103
Address the emissions of local air pollutants, as these often go hand-in-hand with the emissions
of GHGs;
The establishment of linkages with the carbon pricing instruments of other jurisdictions and
cooperative approaches under Article 6.2 of the Paris Agreement, with the remark that the use
of tradable emission units offers a quick pathway to the trading of emission rights.
The points that follow discuss key design elements of an ETS that policymakers in Pakistan would
need to consider in case they opt for the establishment of such mechanism for pricing GHG emissions.
Recommendations are made for each of these elements, which are as follows: a) sector coverage; b)
gas coverage; c) emissions scope; d) point of regulation; e) setting the emissions cap; f) allowance
allocation; g) reporting obligation; h) threshold for ETS inclusion; i) MRV of emissions; j) use of offsets;
k) revenue utilization; l) linkages with other systems; m) potential for co-benefits. The
recommendations are partly based on a “sub-study” that was prepared in complement to the present
one and which assessed in more detail the potential for an ETS in Pakistan.
a) Sector coverage
One of the first decisions to be made when designing an ETS pertains to the sectors to include under
its scope. At the outset, two main criteria can be considered. The first is the contribution of different
economic sectors to national GHG emissions. As an ETS is, first and foremost, an instrument to
support the reduction of GHG emissions, sectors usually prioritized are those accounting for the largest
share of national emissions. Moreover, as the operation of an ETS will imply costs to both the regulator
and regulated entities, the most cost-effective emission abatement opportunities tend to be found on
these sectors.
Secondly, the effectiveness of an ETS strongly hinges on the ability to measure and monitor GHG
emissions with a “reasonable” level of accuracy, which implies the setting-up of a system to measure,
report and verify (MRV) emissions. This will also bring costs to ETS participants, and therefore
targeting sectors dominated by a small number of large emitters tends to be preferable to those
composed of many small and dispersed emission sources, taking into account a cost-benefit balance.
With regards to the emissions profile of Pakistan, it was noted in Section 4.2 that the energy and
agriculture sectors contributed to 89% of national GHG emissions in 2015, with a share of 46% and
43%, respectively. As per the projections of the PAK-INDC, their combined contribution is expected to
remain significant by 2030, with a share of 56% for energy and 29% to agriculture. This inevitably
makes both sectors candidates for inclusion in the scope of an ETS in Pakistan. Nonetheless, a more
granular analysis is required in order to adequately ascertain their adequacy for ETS inclusion.
In the case of energy-related emissions, it was noted in Figure 4.3, Section 4.2, that the sub-sectoral
breakdown was as follows: 27% from energy industries (essentially on power generation), 22% from

104
transport, 20% from energy consumption in manufacturing industries and construction, 23% from
“other” sectors and 7% from fugitive emissions. Among these sub-sectors, large emitters usually
include power generation facilities and stationary units that are large energy consumers in industry and
manufacturing, rendering them “suitable” candidates for a potential inclusion within an ETS. Pakistan is
not an exception, and research and analysis conducted for this study214 found that as of early 2019
there were:
47 power generation units in operation, corresponding to 21,508 MW of installed capacity and
with an emissions volume estimated at 60.4 MtCO2e per year. If, in addition to these, it is taken
into account the existence of 3 power plants under construction and 5 in the planning pipeline,
emissions in 2023 are estimated at 102.5 MtCO2e;
28 cement manufacturing units in operation, 6 under construction and 1 planned. Current
emissions are estimated at 38.2 MtCO2e, which can go up to 47.5 MtCO2e if the 7 facilities in
the development pipeline enter into operation;
10 steel mills in different stages of operation, corresponding to 2.5 MtCO2e of annual emissions,
with the note that this is a conservative estimate given the number of discussed and planned
projects for expanding the industry;
11 fertilizer production facilities in operation, estimated to generate 6.8 MtCO2e;
8 refineries in operation, with estimated emissions of 5.4 MtCO2e per year and a total of 8.3
MtCO2e if those in the development pipeline enter into operation;
5 glass production facilities, estimated to generate 0.46 MtCO2e;
5 paper and pulp facilities, corresponding to 0.2 MtCO2e.
These figures pertain, mostly, to “large” GHG emitters and, as such, do not include sub-sectors that
are major contributors to GHG emissions but which are composed of more dispersed emission
sources. These also exclude sub-sectors or activities with respect to which data was not found, such
as textile and garment production, sugar mills and brick kilns.
With regards to “other sectors”, this category encompasses energy-related emissions from activities as
diverse as energy consumption in commercial and institutional buildings, agriculture, forestry and
fishing. In the absence of more granular data, it is uncertain the extent to which these sectors could be
brought under the umbrella of an ETS.
The second largest source of energy-related emissions is from transport activities. However, most
ETS deployed worldwide do not cover this sector. There are several reason for this. One of them is the
low short-run mitigation potential of the sector due to the low elasticity of demand of fuel consumers,
214 More detailed findings are presented in the sub-study that was carried out in parallel to the one here presented, as noted at
the beginning of this section.

105
particularly on road transport, which accounts for 92% of transport emissions in Pakistan. This means
that a relatively high increase in fuel prices will not result in major changes in fuel consumption,
implying that achieving emission reductions primarily through the carbon price signal introduced by an
ETS would likely not be effective. This appears to be the case of Pakistan, as suggested by a study of
the State Bank of Pakistan,215 whose results show that fuel demands are generally inelastic in the
short run, although relatively elastic in the long run. In effect, certain policies might be more effective in
the reduction of transport sector emissions, such as vehicle emission standards, high fuel taxes or
even “innovative” policies of free public transportation which are currently being developed in several
jurisdictions and municipalities worldwide.
Some jurisdictions that have included road transport as part of an ETS, such as California, did it as a
means of complementing existing policies and regulations. In such cases, road transport often plays
the role of “net contributor” to mitigation action where carbon pricing on road transportation funds
mitigation activities in sectors where GHG reductions are more cost-effective, such as the power
sector. In this regard, an inclusion of the road transportation sector is not recommended for Pakistan
as this would likely increase the complexity of the scheme while contributing little to offering additional
mitigation potential. Decision-makers may however wish to consider the potential for the transportation
sector to contribute to the funding of mitigation action for the following reasons: i) a financial
contribution from the sector, especially domestic air travel, would not have a major impact on the
poorest households as their users are found in higher income categories; ii) such measure would
achieve more fairness between sectors; iii) having a contribution from the transportation sector would
accordingly reduce the net cost for large-scale emitters which could be included under an ETS.
Lastly, with regards to fugitive emissions, which account for 7% of energy sector emissions, these are
rarely included in the scope of an ETS216. Jurisdictions that have covered these emissions as part of a
carbon pricing instrument, have instead opted for a carbon tax (e.g. South Africa). As such, this not a
priority sector suggested for inclusion in an ETS in Pakistan.
With respect to emissions from the agriculture sector, it was noted in Section 4.2 that they originate
from four main sources: enteric fermentation of ruminants in the form of methane, the release of
nitrous oxide from the utilization of chemical fertilizer in soils, manure management, and rice
cultivation. In spite of their important contribution to national GHG emissions, this sector does not rank
as the most amenable for inclusion in the scope of an ETS. This is ascribed to a number of reasons, in
particular: i) the fact that a majority of these emissions originates from many small and diffuse sources
(e.g. this is the case of enteric fermentation), implying high costs with the MRV of emissions; ii) the
scarcity of means and instruments to measure GHG emissions from farms; and iii) the risk of a “non-
permanent” mitigation effect in soil sequestration projects or initiatives. Concurrent with this, to date no
215 State Bank of Pakistan, Estimating Elasticity of Transport Fuel Demand in Pakistan, 2018, Ibid.
216 See for example ICAP, Emissions Trading Worldwide – International Carbon Action Partnership (ICAP) 2018 Status Report,
2018, Ibid.

106
ETS systems exist that have included agriculture within their scope. The only exception to note is the
New Zealand ETS, where the inclusion of emissions from this sector has been under consideration for
years217. On the other hand, in a number of jurisdictions agriculture has been considered a potential
source of emission offsets, as noted in Point 4.3.4, with the remark that in such circumstances the
sector is not under the cap of an ETS218.
With regards to the three other IPCC sectors and their potential inclusion in the scope of an ETS:
Industrial Processes and Product Use (IPPU): they account for 5.4% of national emissions,
which mostly occur in mineral and chemical production industries. Some of these industries
could be candidates for inclusion under an ETS in Pakistan, especially in cases where these
facilities also contribute to energy-related emissions;
Land use and forestry: Forestry activities are not recommended as a priority for ETS inclusion
in Pakistan, in particular due to the following reasons: i) their relatively small contribution to
national emissions (just 2.6% of the national total in 2015); ii) issues associated with carbon
leakage219 and permanence220; and iii) the administrative complexity of the sector with regards
to the monitoring of emissions, which requires a comprehensive monitoring system throughout
the lifetime of a forest. In effect, forestry has rarely been included under the cap of an ETS cap,
the only noteworthy exception being the New Zealand ETS;
Waste management: emissions from this sector have also been rarely covered by an ETS221.
Reasons for this include the fact they tend to be relatively small in relation to the national total,
and also due to methodological issues associated with the quantification of these emissions, in
particular in relation to the decomposition of methane in landfill sites, which occurs over a long
period of time. During this period, technologies or procedures to handle waste may change, and
therefore emission factors may not adequately capture the emissions actually taking place. In
view of this, the sector is not recommended as priority for inclusion under an ETS in Pakistan.
The table below summarizes the analysis and recommendations for sectoral coverage for an ETS in
Pakistan, whereby different sectors and sub-sectors are analysed in relation to four priority levels. This
assessment also builds on the analysis presented in the sub-study that was prepared on the potential
for an ETS in Pakistan.
217 As recently as March 2019, the New Zealand Government reaffirmed its interest in including this sector in the national ETS. See: Carbon Pulse, Minister gives clearest indication yet that NZ gvt wants agriculture in ETS, accessed April 2019,
<http://carbon-pulse.com/71097/?utm_source=CP+Daily&utm_campaign=25355a40fd-CPdaily15032019&utm_medi um=email&
utm_term=0_a9d8834f72-25355a40fd-36319493> 218 As is the case of some jurisdictions worldwide, even if just a few, such as Alberta Province’s Carbon Competitive Incentive
Regulation or Australia’s Emissions Reduction Fund and Safeguard Mechanism. 219 It occurs when tree plantation or the forest protection activity is (partly) “counteracted” by another activity elsewhere which
results in extra emissions.
220 This is the case, for example, when a forest planted or protected over a certain period of time is the subject of clearance at
some point in the future.
221 ETS including the waste sector are those of the Republic of Korea and New Zealand.

107
Sector / subsector Recommendation for ETS inclusion
Rationale and observations
Power Generation Recommended inclusion
Ind
us
try
Cement Recommended inclusion
Fertilizers
Depending on the feasibility/complexity, a later
inclusion could be considered
Iron and Steel
Depending on the feasibility/complexity, a later
inclusion could be considered
Refineries
Depending on the feasibility/complexity, a later
inclusion could be considered
Fugitive
emissions (others)
To be excluded if these emissions are not related to a specific emitting facility
To be potentially considered as “recipient sector” to receive funding for mitigation (direct funding or through the use of offsets)
Paper and pulp Recommended inclusion
Glass Recommended inclusion (see specific sub-study
on the feasibility of an ETS in Pakistan)
Food processing
To be first excluded given the variety of processes used
Possibility to add the sector in later phases
To be potentially considered as “recipient sector” to receive funding for mitigation (direct funding or through the use of offsets)
Brick
production
Need for further analysis due to the dispersed and informal nature of the sector
To be potentially considered as “recipient sector” to receive funding for mitigation (direct funding or through the use of offsets)
Sugar mills Major consumers of energy and significant
contributors to GHG emissions (directly and/or indirectly). There is however the need of a more detailed analysis due to the lack of data on emissions at the facility level
Textile and
garment
Automotive
Suggested exclusion as emissions from these sectors are expected to be mostly in terms of “indirect emissions” from the use of purchased electricity. Such emissions would already be covered under “power sector” emissions
To be potentially considered as “recipient sector” to receive funding for mitigation (direct funding or through the use of offsets)
Buildings
Residential
Commercial
Transport Road transportation
Suggested exclusion given the limited mitigation potential and low price elasticity of GHG emissions
To be considered as potential source of funding for an ETS through other carbon pricing instruments (e.g. tax)

108
Domestic aviation
Could also be considered as potential source of funding for an ETS
International aviation
Suggested exclusion as an international approach called the Carbon Offsetting and Reduction Scheme for International Aviation (CORSIA) was put in place under the International Civil Aviation Organization (ICAO)
International
shipping
Suggested exclusion as discussions on a global GHG emissions reduction scheme for the sector have started at the International Maritime Organization (IMO)
Forest and land-use change
Suggested exclusion due to non-permanence, complexity and the small share of emissions
Agriculture
Suggested exclusion due to the dispersed nature of the sector and its complexity
To be potentially considered as “recipient sector” to receive funding for mitigation (direct funding or through the use of offsets)
Wastes
To be potentially considered as “recipient sector” to receive funding for mitigation (direct funding or through the use of offsets)
Table 5.1: Summary of sectors and sub-sectors for inclusion as part of ETS in Pakistan. Legend:
( ) High priority for inclusion in an ETS
( ) High priority but possible delay
( ) Medium priority
( ) Low priority
In conclusion, overall priority sectors for sector coverage are those that include a high number of large-
scale emitters and exhibit a large emission reduction potential. Additionally, ETS inclusion could be
made in phases, starting with sectors which offer the most favourable trade-off between coverage and
simplicity of inclusion while considering constraints in resources and capacities, especially regarding
MRV. For this reason, the priority at the start of an ETS would be the coverage of emissions from
power generation and cement. Depending on how fast the domestic capacity and infrastructure could
be developed, other meaningful industrial sectors for inclusion could be fertilizer production, iron and
steel, pulp and paper, glass and refineries.
b) Gas coverage
As noted in the point above, priority sectors for inclusion within an ETS in Pakistan are power
generation and energy consumption in industries. As emissions from these sectors mostly consist of
CO2, this is the gas prioritized for coverage within an ETS cap.
c) Emissions scope
For facilities covered under an ETS and for the purposes of GHG emissions monitoring and reporting,
the accounting boundaries can be considered along three dimensions or “scopes”: i) Scope 1 pertains

109
to direct emissions from owned or controlled sources of the facility; ii) Scope 2 emissions are those
indirectly generated by the facility through purchased energy (e.g. in the form of electricity and/or heat);
iii) Scope 3 emissions correspond to all indirect emissions that occur in the value chain of the reporting
facility, including both upstream and downstream emissions, and which are not included under scope 2
emissions222.
As the recommended sectors for ETS coverage are power generation and energy consumption in
certain industries, these would correspond to direct emissions, i.e. Scope 1. The inclusion of Scope 2
emissions could be considered in case the ETS is expanded to include energy consumers, which
would be the case for example of buildings or institutions. However, the coverage of both direct and
indirect emissions would imply a double counting risk, i.e. that the same GHG unit is priced twice, both
at the point of generation and consumption. There are a few examples of ETS where this has been the
case. For instance, the Korean ETS has implemented compliance obligations for both direct emissions
at the point of electricity generation and indirect emissions at the point of electricity consumption223.
From a regulatory standpoint, this was to ensure that the signal introduced by the carbon price is
factored in both at the levels of production and consumption. The Thailand V-ETS scheme (mentioned
in Section 3.3) is another example where direct and indirect emissions are covered as part on an ETS,
even if this is a scheme still in the piloting stage. But in that case, the motivation for including Scope 2
emissions was the fact that the power generation sector was not covered as part of the ETS scheme.
Overall, the inclusion of indirect emissions in an ETS involves a high complexity in design given the
risk of double counting. Therefore, a domestic ETS in Pakistan is recommended to only focus on direct
emissions.
d) Point of regulation
The point of regulation for the sectors recommended for ETS inclusion is at the point where GHG
emissions take place, i.e. at the installation/entity level. This would imply the set-up of an MRV system
at the facility level as a way of assuring, with low levels of uncertainty, that 1 ton of CO2e emitted
corresponds to 1 ton of CO2e reported, i.e. requiring one emission allowance to be surrendered for
compliance. Aspects related to the MRV system are further elaborated in point i) below.
e) Setting the emissions cap
Due to the large uncertainties on future economic growth and, in particular, in industrial output, an ETS
in Pakistan would need to be based on an adjustable cap based on the product output (e.g. electricity
generated, cement produced, tonnes of carbon intensive good produced/processed). In other words, a
“double-adjustment” would need to be considered whereby:
222 For additional details on emissions scope, see for example <https://ghgprotocol.org/sites/default/files/standards_supporting/
FAQ.pdf> 223 PMR, Emissions Trading in Practice: A Handbook on Design and Implementation , 2016, Washington, DC: World Bank.

110
The cap-size would be adjusted to the actual production of entities covered (intensity-based
cap);
The stringency of the cap would be adjusted over time in relation to the level of ambition
expected by the ETS (in number of allowances distributed per tonne of product).
Given the early stages of consideration of a national ETS in Pakistan, details on this design parameter
are recommended for further analysis in follow-up phases, which are discussed in Chapter 6.
f) Allowance allocation
The procedures for allowance allocation could be differentiated by sector. In particular, sectors
exposed to international competitiveness224 could receive free allowances to cover almost or all of
their compliance needs, either through grandfathering, benchmarking or a mix of both (see Point
3.2.5). To ease the impact to participating industries in the form of increased production costs, in a first
phase of the ETS the allocation of allowances could be based partly on “grandfathering” and partly on
benchmarking (e.g. allocation based in relation to the 70% best performing facilities). On the other
hand, sectors not (or less) exposed to international competition could bear the bulk of the compliance
effort. Nonetheless, just as the point above, this is a design element to be assessed in more detail as
part of subsequent activities to this study.
g) Reporting obligation
The “reporting obligation” pertains to the level at which GHG emissions are regulated, i.e. the entity
which is formally liable to comply with ETS regulations, for instance the reporting of emissions or the
surrender of units as part of the ETS compliance process. In this regard, two main options are usually
considered: at the company level and at the plant or installation level225. To have the reporting
obligation at the company level entails, in principle, lower administrative costs as the company would
not need to report emissions from every single facility in a separate manner. On the other hand, this
option may turn out to be impractical if more than one company has a stake in the same installation.
An initial recommendation for Pakistan, in the case the country decides to move forward with an ETS,
is that the reporting obligation is at the installation level. The main reason for this is that the
assessment conducted as part of this study on the ETS potential of Pakistan found that an estimated
140 facilities could take part in such system, which suggests that reporting at the entity level would not
entail overwhelming administrative costs, both for the regulator and the covered entities.
224 A list of industries deemed exposed to international competitiveness could be based on EU’s most recent assessment, which
can be found in <https://ec.europa.eu/info/law/better-regulation/initiatives/ares-2017-5046070_en> 225 A third option may also be considered, which is to have the reporting obligation at the company level for a specific production
line or process. However, this is the option entailing higher administrative costs and is also the least popular among ETS
systems implemented worldwide.

111
h) Threshold for ETS inclusion
A number of indicators may be used to establish a threshold in relation to which entities within the
sector covered are eligible for inclusion under the ETS. Among ETS systems in operation globally, the
most common indicator is the volume of GHG emitted by the facility, typically expressed in
tCO2e/year226. The higher the eligibility threshold, the lower the administrative costs for the regulator
but also the lower the number of facilities covered. This would imply a reduced diversity in participants
as well as an overall lower share of emissions covered in relation to the national total. In this line of
reasoning, the choice of threshold strongly depends on the national circumstances and composition of
the covered sectors in terms of the size distribution of existing and planned installations. Thus, this is a
decision that should be made based on an inventory of facilities and their emission levels. In the
absence of emissions data, the definition of emissions thresholds could be made by proxy based on
energy consumption levels, type of fuels consumed and the use of emission factors.
Global experience on ETS systems suggests that a volume of emissions of 25,000 tCO2e/year per
facility could be taken as reference. For example, The EU ETS defines three categories of installations
based on the emissions level: Category A ≤ 50,000 tCO2e/year; Category B: 50,000 to 500,000
tCO2e/year; Category C: > 500,000 tCO2e/year. The EU ETS also defines as a sub-set of Category A
facilities emitting less than 25,000 tCO2e/year, which qualify as installations with “low-emissions”. In
the EU ETS, the higher the category, the more stringent the emissions quantification methods. As
another example, the China national ETS, which is scheduled to become fully operational in 2020, has
as inclusion threshold of 26,000 tCO2e/year (equating to a total energy consumption of more than
10,000 ton of standard coal)227.
i) MRV of emissions
The establishment of a framework to the monitoring, reporting and verification (MRV) of GHG
emissions is an essential component of an ETS. At present, no such framework(s) exists in Pakistan228
and thus the need of setting it up from scratch. For the effective design and implementation of an MRV
system at the facility level for the purposes of an ETS in Pakistan, it is recommended that:
Global good-practices are considered and adapted to the specific circumstances of Pakistan, in
particular of those ETS that could be linked up with that of Pakistan in the mid to long run (see
point m) below);
226 Other criteria for inclusion are, for example, the energy consumption level, production capacity, etc. 227 T. Stoerk et al., China’s national carbon emissions trading scheme: lessons from the pilot emission trading schemes,
academic literature, and known policy details, 2019, Climate Policy, 19(4), pp. 472-486, DOI: 10.1080/14693062.2019.1568959
228 As noted in Point 4.2.3, procedures for the MRV of emissions exist in Pakistan, to a certain extent, for the preparation of the national GHG inventory. MRV blueprints have also been developed for some sectors, e.g. as part of NAMA programmes that
have been proposed in Pakistan. However, based on the findings of this research such frameworks are either at an initial level of
development or have not been piloted/implemented.

112
Synergies are sought with other policies and initiatives on climate change in Pakistan, e.g. the
development of an MRV system to track progress on NDC implementation;
MRV development goes in tandem with those of other systems that may be indirectly related to
GHG emissions, such as in the context of programmes on energy efficiency and conservation229
or initiatives to curb the emissions of local pollutants (e.g. NOx, SO2 or particulate matter).
j) Use of offsets
An ETS in Pakistan could include flexibility instruments to support covered entities meeting their
compliance obligations, in particular in the form of offset credits generated from sectors not covered by
the ETS. It is recommended that limits are set in the amount of offsets that may be purchased by an
entity under the cap, as this encourages “in-house” reductions instead of their occurrence elsewhere.
For instance, the California ETS allows the use of up to 8% of a company’s compliance quota in the
form of offsets. As another example, all seven ETS pilots in China accept a number of offsets, which
vary from 5-10% of the total allowances. Conversely, during its first phase the New Zealand ETS
allowed the unlimited use of international offsets (e.g. from the CDM or JI), which made domestic
companies meeting their compliance obligations mostly through purchased offsets. As in such
circumstances emission reductions would be achieved not domestically but elsewhere, international
offsets were no longer allowed in the New Zealand ETS after the end of its first phase230.
Sectors to consider as a source of offsets are those identified as medium or low priority for ETS
inclusion. Among these, preliminary suggestions are emission reduction units from forestry and waste
management activities. While they tend to be less prone to ETS inclusion, both sectors are well
identified as national priorities and the potential for offset generation could function as an additional
stimulus to the development of specific initiatives (in the case of forestry as part of REDD or REDD+, in
the case of waste management in the scope of the Green Clean Pakistan Initiative or the waste-sector
NAMA). They could also be a potential source of demand for credits generated from CDM projects in
Pakistan. Even though the agriculture sector is a major contributor to Pakistan’s GHG emissions, their
consideration as a potential source of offsets is not recommended as an immediate priority for the
same reasons pointed out above on their non-inclusion as part of an ETS cap. On the other hand,
successful experiences of other jurisdictions on this topic (e.g. Australia231 or Canada’s Province of
Alberta), could inspire future developments.
229 Singapore, for example, developed its MRV framework at the installation level based on requirements that already for tracking energy consumption patterns of large facilities, most of which also turned out to be amongst t he largest emitters in the
country. 230 See, for example: ICAP, Emissions Trading Worldwide – International Carbon Action Partnership (ICAP) 2019 Status Report,
2019, Ibid. 231 See, for example: Carbon Pulse, First soil carbon credits could unlock millions of offset supply in Australia, accessed April
2019, <http://carbon-pulse.com/70986/?utm_source=CP+Daily&utm_campaign=38d80a7748-CPdaily14032019&utm_medium
=email&utm_term=0_a9d8834f72-38d80a7748-36319493>

113
Other system flexibility instruments that could be considered include the banking and borrowing of
allowances, the establishment of a market stability reserve, and the definition of allowance price
floors/ceilings. The assessment of these instruments should, however, be part of follow-up work in
case Pakistan decides to move forward with an ETS design.
k) Revenue utilization
In the event of a domestic ETS being adopted in Pakistan, it is likely that in initial stages of
development allowances could be allocated free of charge to covered entities. This would, in fact, be
consistent with the experiences of most ETS developed globally. On the other hand, as the ETS
matures and participants gain experience, auctioning would be expected to gradually replace the free
allocation of allowances. This would imply that an additional source of revenue is made available to the
government. To have an idea of the revenue generation potential of an ETS, in a scenario where 120
of the largest emitting facilities in Pakistan are included in the scope of an ETS cap, if 10% of the
allowances in the system are auctioned at a conservative price of 2.5 USD per unit, this could generate
a revenue of 42 million USD per year232.
In this context, an option suggested for the consideration of MOCC is to use the proceeds from the
auctioning of allowances as a funding source to the recently established Pakistan Climate Change
Fund. This is based on the assumption that the utilization of the resources raised by the Fund would be
utilized mainly to support climate-related interventions, either mitigation or adaptation, and would
therefore be in line with the main motivation for putting a price on emissions: i.e. to factor in on
decision making processes the negative externalities of emitting GHGs.
In alternative or in complement, revenue raised could be used to compensate groups or individuals at
risk of being disproportionally affected by the carbon pricing instrument. This would be the case, for
example, if poor households are affected by an increase in electricity prices as a result of the carbon
price introduced through the ETS233. In this respect, a way of compensating these groups could be
through direct cash payments as a means of ensuring the “revenue neutrality” of the ETS (See Section
3.2 for additional details on this). One such mechanism in Pakistan is the Benazir Income Support
Programme234.
232 These findings are part of the sub-study on the ETS potential in Pakistan, where different revenue generation scenarios were
analyzed.
233 It should be noted that this is not, however, expected in the initial stages of development of an ETS in Pakistan. Among the reasons for this is the fact that power generation prices are regulated by NEPRA, which suggests that the carbon pricing “pass-
through” could be “controlled” by the regulator. Therefore, the most vulnerable end-users could be protected from an increase in
power prices solely ascribed to the introduction of a carbon pricing instrument.
234 See <http://bisp.gov.pk/>

114
l) Linkages with other systems
The development of an ETS in Pakistan should take into account, from early stages, the possibility of
linkages with other systems. As noted in Point 3.2.1, linking occurs when an ETS allows covered
entities to use allowances or credits issued in other ETS systems for compliance purposes.
Based on empirical evidence, most ETS links have been established between systems located in
jurisdictions with similar socio-economic development patterns and allowance prices235. In this context,
the potential for linkages for an ETS established in Pakistan should first be considered at the regional
level. As examined in Section 3.3, among countries of SAARC the consideration of carbon pricing
instruments is still in early stages, just like Pakistan, and plans for emissions trading systems are also
in their infancy.
Broadening the geographical scope, the country emerging as the most evident candidate for a
potential ETS linkage is China. Not only is China finalizing arrangements for the operational launch of
its national ETS, but the country is also a strategic partner to Pakistan in the scope of the CPEC
initiative. In effect, CPEC could serve as a platform for initial knowledge sharing on ETS design
including lessons learned from almost ten years of China’s experiences. Some of these resonate with
the specific circumstances of Pakistan, for instance the fact that power prices are regulated and the
roles assigned to Provinces on ETS implementation236.
m) Co-benefits from an ETS
In addition to reducing the emissions of GHG, climate change mitigation actions can yield multiple
additional benefits, also known as “co-benefits”, as discussed in Section 2.5. One of the major such
benefits is associated with the reduction of air pollution, which is a major challenge for many cities
around the world, including Pakistan. In effect, the development of emissions trading schemes was
initially driven by the need to control the released of local air pollutants in the 1970s237. Following the
agreement on the Kyoto Protocol in 1997, the reduction of GHG emissions became the driving
motivation for the development of emissions trading in many jurisdictions worldwide.
Nevertheless, in some jurisdictions the development of an ETS has also been associated with the
potential of curbing the emissions of local pollutants, such as nitrogen oxides (NOx), sulphur oxide
(SO2) and particulate matter (PM). This could also be the case of Pakistan. Indeed, Pakistan’s urban
air pollution has consistently fared amongst the most severe in the world, with significant impacts on
human health and the economy as whole238. For example, Pakistan’s PM10 (particulate matter of less
235 Source: “Emissions Trading in Practice: A Handbook on Design and Implementation” (2016), Ibid. 236 See for example X. Li et al., The economic impact of carbon pricing with regulated electricity prices in China – An application
of a computable general equilibrium approach, 2014, Energy Policy (75), pp. 46-56
237 For a comprehensive historical background on emissions trading, see for example: T. James & P. Fusaro, Energy and
Emissions Markets: Collision or Converge?, 2007, Wiley & Sons
238 World Bank, Cleaning Pakistan’s Air: Policy Options to Address the Cost of Outdoor Air Pollution, 2014. Ibid.

115
than 10 microns) concentration levels are found to be amongst the highest in the world, even
significantly higher than neighbouring countries239. This is reflected in the number of deaths attributable
to air pollution, with Pakistan being one of the most affected countries at a global scale (see Figure 5.1
below).
Figure 5.1 – Deaths attributable to ambient air pollution (age-standardized), 2012. Source: World Health
Organization240.
There is therefore much to gain in Pakistan from reducing GHG emissions just based on the “co-
benefits” generated from reduced local air pollutants. In this connection, the development of an ETS
should be considered in tandem with synergies with ongoing and planned initiatives to air pollution,
namely the Pakistan Clean Air Programme (PCAP) (which has been approved by the Pakistan
Environmental Protection Council in 2005) and the National Environmental Quality Standards for
ambient air quality. Other opportunities for synergies could be in the scope of the “Clean and Green
Pakistan” initiative, which was launched by the current government in October 2018 and mentioned in
Section 4.3.5.
According to the PCAP, in Pakistan the major sources of air pollution are emissions from vehicles,
industry, solid waste and natural dust241. With the commissioning of coal-fired power plants and those
in the development pipeline, it is expected that the power generation sector could also become a major
contributor to air pollution. This suggests there is potential for air pollution reduction co-benefits in case
the industrial sector and power generation are included as part of an ETS. While specific figures for
Pakistan have not been found, a study conducted by the Grantham Research Institute on Climate
239 Ibid. 240 World Health Organization, WHO Global Ambient Air Quality Database (update 2018), accessed March 2019,
<https://www.who.int/airpollution/data/en/> 241 Government of Pakistan Ministry of Environment Local Government and Rural Development, Pakistan Clean Air Programme,
2005, <http://environment.gov.pk/images/environmentalissues/ PAKISTANCLEANAIRPROGRAMME.pdf>

116
Change and Environment and referred to in Chapter 2, has estimated that health co-benefits resulting
from the reduction of local pollutant emissions could be conservatively put at 50 USD/tCO2 in a
developing country242. This is consistent with findings from other studies, which indicate that costs to
health from the exposure to ambient PM2.5 (particulate matter of less than 2.5 microns) have amounted
to approx. 70 USD/tCO2 in China and 50 USD/tCO2 in India243. On the other hand, it has been
estimated that the direct costs associated with outdoor air pollution in Pakistan in 2005 were estimated
at 1.1% of the GDP244.
In addition to air pollution there are other co-benefits that could be harnessed alongside GHG emission
reductions. A study conducted by the World Bank in 2018 indicates that in energy and industry, the
largest co-benefits come from replacing fossil fuels with renewable energy, improvements on energy
efficiency, and from upgrading coal via coal washing and briquetting. For transport, co-benefits can be
identified on a set of combined interventions, which include a greater use of public transport and
improvements in vehicle fuel efficiency.245 As an energy-import country, it may be added that in the
case of Pakistan, improvements on energy efficiency and a shift to renewables reduces the reliance on
fossil fuel imports which result in economic and energy security benefits.
Table 5.2 below summarizes the main design elements recommended for the establishment of an
emissions trading system in Pakistan.
Design Element
Recommended option for Pakistan
Rationale and other observations
Sector Coverage
Gradual introduction of sectors within the ETS cap, in a phased manner, with priority given to:
- Power generation
- Stationary energy utilization in industries
- Priority sectors for coverage pertain to those significantly contributing to national emissions and with well-identified large emitters
- Sub-sectors considered of high priority for inclusion are power
generation, cement sector, paper and pulp, and glass production;
- Sub-sectors with medium priority for inclusion are fertilizer production, iron and steel and refineries;
- Low-priority for ETS inclusion: waste management, domestic aviation.
- Excluded sectors/sub-sectors for ETS inclusion: agriculture, forestry and transport.
Gas Coverage
CO2
- CO2 is the major GHG emitted from the power generation and industry sectors and therefore the recommended priority for ETS coverage.
242 LSE and Grantham Research Institute on Climate Change and the Environment, Multiple benefits from climate change
mitigation, 2017, Ibid.
243 Ibid. 244 Tribune, Some 20,000 premature deaths linked to air pollution, accessed March 2019, <https://tribune.com.pk/story/
1620862/1-20000-premature-deaths-linked-air-pollution/> 245 See for example L. Ortolano, Local and Regional Pollution Reduction Co-Benefits from Climate Change Mitigation
Interventions, 2018, <https://ieg.worldbankgroup.org/sites/default/files/Data/reports/wp_localandregionalpollution.pdf>

117
Emissions scope
Direct emissions only (Scope 1)
- This is based on the assumption that emissions from power generation are covered under the ETS. The inclusion of Scope 2 emissions would likely result in double-counting and therefore undermine the environmental integrity of the system.
Emissions cap
Adjustable cap
- Adjustable cap based on actual production (e.g. electricity,
cement, steel, etc.), i.e. intensity-based;
- Stringency adjusted over time in relation to the level of ambition desired in terms of GHG emission reductions.
Allowance allocation
At the beginning of the programme, based on free allocation of allowances and benchmarking
- Free allocation and benchmarking are especially recommended to sectors that are most exposed to international competition.
Point of regulation
Direct emitters
- At the point where GHGs are released into the atmosphere;
- This implies the development of a MRV system to track emissions at the facility level.
Reporting obligation
Facility level
- The number of eligible emitters under an ETS in Pakistan, estimated to be at least 140 facilities, indicates that administrative costs with the system would be manageable if the reporting obligation is at the facility level.
Threshold for ETS inclusion
Indicative threshold: 20,000 to 25,000 tCO2e per year
- Choice of inclusion threshold should be based on an inventory of the facilities to be included under the ETS, including their estimated level of emissions. The threshold range suggested is observed in several ETS systems worldwide and could serve for future reference.
MRV of emissions
MRV at the facility level
- To be set-up based on: i) international good practice; ii) in alignment with other MRV frameworks being considered or under development in Pakistan; iii) in consideration with those developed for ETS with which the one in Pakistan could be linked with.
Use of offsets
Recommended for consideration up to a relatively small share of compliance obligations (less than 10% of total)
- Only domestic offsets to be considered;
- Forestry and waste management activities recommended as initial priorities for offset eligibility;
- Potential to create demand for credits for CDM projects developed in Pakistan.
Revenue utilization
As a funding source of the Pakistan Climate Change Fund
- The Pakistan Climate Change Fund was set up as part of the Pakistan Climate Change Act to finance mitigation and adaptation projects developed in Pakistan, and therefore it appears as an adequate vehicle to the use of the proceedings raised by a carbon pricing instrument. Nonetheless, other options could be considered as well.
Linkages with other systems
To be considered since initial stages of ETS development, in particular the China national ETS and its pilots
- In view of the strategic partnership between China and Pakistan in the context of CPEC and the opportunity of leveraging China’s know-how on ETS systems and potential synergies;
- Linkages to be also considered with other jurisdictions in the SAARC region currently considering carbon pricing instruments in view of the relatively similar levels of socio-economic development with Pakistan.
Potential for co-benefits
High, in particular the reduction of local pollutants
- The development of an ETS in Pakistan should go hand-in-hand with the potential for harnessing co-benefits, especially those associated with the reduction of local air pollutants. Therefore, synergies should be considered with air pollution policies and programmes:
- Other co-benefits expected are on increased energy security, improved energy efficiency, and as other socio-economic

118
benefits (e.g. creation of green jobs, technology transfer, etc.).
Table 5.2 – Recommended design elements for the establishment of a domestic emissions trading system (ETS)
in Pakistan. It excludes design elements that would require a more thorough analysis/assessment of this option (e.g. price setting mechanism, use of flexibility instruments to support compliance of covered entities, etc.)
5.2 Carbon taxation
The introduction of a carbon tax in any jurisdiction needs to be framed within its broader socio-
economic and fiscal context. Pakistan is not an exception, and prior to analysing possible design
options for a carbon tax, it is important to understand the opportunities and challenges associated with
any such option. With regards to the opportunities:
A tax has been recognized in different national policy documents as an instrument that could be
deployed to foster the reduction of GHG emissions as well as other co-benefits. For example,
the National Climate Change Policy (2012) explicitly refers to the consideration of a carbon tax on
the use of environmentally detrimental energy generation from fossil fuels;
Existence of taxes that already price externalities in Pakistan, for instance the Petroleum
Development Levy (PDL) currently charged on petroleum products;
Existence of institutional structures, namely fiscal, which could enable a relatively quick and
smooth introduction of a new tax in Pakistan (e.g. through the Federal Board of Revenue or the
Ministry of Finance);
The ease and flexibility of the instrument, which can be swiftly introduced and readjusted based
on the results achieved;
Carbon taxes have been considered and introduced by other jurisdictions in the region (e.g. the
Clean Environment Cess in India which is in effect a tax on coal), and could serve as
references for Pakistan to introduce a tax of its own;
As a country that has faced budgetary constraints in its recent history246, the introduction of a
carbon tax could bring additional revenues to the government247.
The main challenges anticipated with the introduction of a carbon tax in Pakistan, some of them
already identified in the SWOT analysis presented in Section 4.5, include the following:
Low support base and general resistance to the introduction of taxes, charges or levies of any
kind. More so in a context where it is perceived that the reduction of GHG emissions should not
246 See for example: Hindustan Times, Cash-strapped Pakistan to receive $ 2.1 billion loan from China by March 25 , accessed
April 2019, <https://www.hindustantimes.com/world-news/cash-strapped-pakistan-to-receive-2-1-billion-loan-from-china-by-
march-25/story-8k0BZOiOx73yOivxYzMu0M.html>
247 In fact, an environmental tax such as one on carbon emissions could also be motivated, first and foremost, by a need to increase taxation or the tax basis. See, for example, the support programme being negotiated by the Government of Pakistan with the International Monetary Fund: Dawn, Managing a slow economy, accessed April 2019, <https://www.dawn.com/news/
1475328>

119
be a priority of Pakistan in light of its historically low contribution to climate change and the low
volume of emissions per capita vis-à-vis those of other jurisdictions;
Difficulties to establish consensus within different government bodies and agencies on the
opportunities and potential benefits from adopting a carbon tax in Pakistan. Furthermore, the
introduction of such type of tax has been attempted before without success;
The declining international competitiveness of several industries in Pakistan (e.g. textile and
garments, sugar production, etc.), possibly accentuating the challenges of introducing an
additional tax which could further imperil the competitiveness of these firms;
Concerns related to the “fairness” of a tax on carbon emissions, i.e. the risk and perception that
it may disproportionally affect poor households and hinder the access to essential energy
services;
A general wariness on how revenue raised through taxation is used and reinvested by the
government – at federal or provincial level – which is usually a success factor for the
acceptability of a carbon tax.
Having these considerations into account as well as international developments on carbon taxation,
especially in the region, the merits and feasibility of the following carbon tax options are evaluated in
the context of Pakistan:
i) Adjustment of the Petroleum Development Levy to a carbon tax;
ii) Economy-wide carbon tax;
iii) Introduction of a tax on coal.
They are briefly discussed in the points that follow.
5.2.1 Adjustment of the Petroleum Development Levy to a carbon tax
This option would consist in the gradual adjustment of tax that already exists on some fossil fuels, the
Petroleum (Development) Levy (PDL), into a carbon tax, whereby the charge levied would be based on
the carbon emission potential of the fuels covered (i.e. petroleum products). As observed in Box 4.2,
Point 4.3.2, the PDL implicitly introduces a “shadow” price on carbon emissions in Pakistan, even
though the levy was not designed for that specific purpose. This is an option whose implementation
could be relatively smooth and “low-risk”, as it would build on already existing fiscal structures and
therefore involve low administrative costs.
In its current form, the PDL only covers petroleum products which are mostly consumed in the road
transport sector. However, in the case of a transition towards a carbon tax, it could be considered an
expansion of its scope of coverage (e.g. fuel for domestic travel, coal, CNG or natural gas). This would

120
in fact imply a replacement of the PDL altogether for a broader carbon tax, and a renaming of the levy
could then be considered.
In addition, this carbon pricing option has a significant revenue generation potential. For example,
assuming an increase of 1 Rs. per litre in the PDL applied to both high-speed diesel (HSD) and motor
gasoline and taking into account the quantity of fuels consumed in FY 2016-17 in the transport sector,
a revenue of 124 million USD would have been generated solely based on this “marginal” increase248.
One of the challenges associated with this carbon pricing option is on the extent to which it could
effectively instil a change of end-user behaviours towards less carbon intensive fuels, especially in the
transport sector, where demand is typically inelastic249. As was noted in Chapter 3, this is one of the
shortcomings of opting for a carbon tax: the predictability in price signal is counterbalanced by the
uncertainty of its environmental outcome (i.e. on the emission reductions achieved).
Another possible challenge with this option is the limited “fiscal space” for imposing a tax that, in
essence, targets fuels used in road transport. In Section 4.3.2 it was shown that road vehicles are, by
and large, the main form of transport in Pakistan, and setting the tax at levels perceived as high by the
average citizen and businesses could risk a negative public reaction 250 . A recently proposed
amendment to the PDL in its current form can provide an illustration of these risks: the Finance Bill of
2018 proposed a significant increase in the levy to a fixed rate of Rs. 30 per litre on petroleum
products. However, the Senate Standing Committee on Finance considered the proposed change to
be too high and instead recommended the PDL to be only increased by 30% in relation to the
previously existing rates251.
Another issue related to this option concerns the existence of possible conflicting priorities in the
taxation of fuels. This is exemplified by the trade-offs between the utilization of petrol and diesel. While
petrol releases less substances contributing to local air pollution, especially particulate matter and
nitrogen oxides, the CO2 emitted per km driven in a diesel car is lower than one that runs on petrol252.
The regulator may be then faced with the dilemma of which environmental impact category to prioritize:
if local pollution or climate change. Nevertheless, a possibility that could be considered is to set a
single tax that could address simultaneously all these pollutants.
248 Quantities of HSD and motor gasoline taken from the Pakistan Energy Yearbook 2017. Calculation based on the calorific
value, density and quantifies of these fuels consumed in FY 2016-17. 249 See for example: State Bank of Pakistan, Estimating Elasticity of Transport Fuel Demand in Pakistan, 2018, Ibid.
250 In this regard, it may be noted that the “yellow jacket” movement in France was triggered by the decision of the government
of France of passing a carbon tax to transport fuels. 251 Business Recorder, Senate panel recommends cut in petroleum levy, accessed March 2019, <https://fp.brecorder.com/
2018/05/20180504368228/>
252 For a discussion on this see: <http://theconversation.com/fact-check-are-diesel-cars-really-more-polluting-than-petrol-cars-
76241>

121
In case the Government of Pakistan decides to further explore this option, one of the design elements
that would need to be considered is the level at which to set the tax rate. Among the approaches that
are usually considered for this purpose253, the one with the highest likelihood of acceptance among
government institutions likely to be involved in the process (e.g. FBR) would be to determine the tax
rate for the different fuels in a way as to ensure that the revenue currently collected through the PDL is
maintained at current levels. An alternative to this option would be to take as basis the rates presently
levied through the PDL for each different fuel, and consider a gradual increase in the levy in order to
better reflect the carbon intensity of the fuels covered. The proceeds from this additional charge could
subsequently be channelled to a specific purpose vehicle, such as the Pakistan Climate Change Fund,
as a means of ensuring they would be reinvested on climate change activities.
As a final remark, this is a carbon taxation option whose rationale could be considered or applied to
any other tax currently levied to fossil fuels in Pakistan (e.g. the general sales tax).
5.2.2 Economy-wide carbon tax
This option would consist in the introduction of a tax on GHG emissions that would equally apply to
businesses and end-users alike. Such option could be considered in a similar way to the carbon tax
that has been in effect since 2008 in the Province of British Columbia, Canada, and which is
considered a “textbook”254 example of a broad-based, economy-wide, carbon tax (analysed in Section
3.3). This tax is paid by all businesses and individuals purchasing or using fuel in that province. It is
charged “downstream”, i.e. at the point of purchase by end-users.
An instrument conceptualized along these lines would not only support the ultimate purpose of carbon
pricing – to explicitly introduce an economic signal in the form of a price on GHG emissions – but also
enable the government to obtain an additional source of income through the levying of the tax. To
provide an idea of the revenue generation potential of an economy-wide carbon tax deployed in
Pakistan, if assumed it could be equally applied to GHG emissions from the energy and IPPU sectors
in 2015 with a tax rate ranging from 1 to 5 USD/tCO2e, this would correspond to a revenue generation
of 29.2 to 146.0 billion Rs., which is equivalent to 0.6% to 3.0% of the federal budget for FY 2018-
19255.
The main challenge anticipated with the adoption of a tax of this type would be on the expected
opposition and low level of acceptability by the different stakeholders involved, in particular business
253 Four basic approaches can be considered for setting a carbon tax rate: i) the social cost of carbon approach; ii) the abatement target approach; iii) the revenue target approach; and iv) the benchmarking approach. In the case of Pakistan and f or this carbon tax option, this would consist of the third option. Source: Partnership for Market Readiness (PMR), Carbon Tax
Guide: A Handbook for Policy Makers, 2017, World Bank. Ibid.
254 PMR, Carbon Tax Guide: A Handbook for Policy Makers. Appendix: Carbon Tax Case Studies, 2017, Ibid. 255 The calculation assumed: i) 208.5 MtCO2e emitted in 2015 from the energy and IPPU sectors; ii) a federal budget of
4,888,645 million Rs. for FY 2018-19 (see http://finance.gov.pk/budget/Explanatory_Memorandum_2018_19.pdf); and iii) an
exchange rate of 140 Rs. per USD.

122
entities and the general public. More so in the context of the declining competitiveness of some
industries vis-à-vis international peers and the general perception that the existing taxation regime is
already too onerous to taxpayers in Pakistan. In fact, this is an experience that is not entirely new to
the country, as there have been at least two different attempts to introduce a carbon tax in Pakistan, in
2013 and 2017, respectively. Both have been unsuccessful256.
Nevertheless, if the Federal Government opts for such instrument, key success factors in design will
be in ensuring it does not disproportionally affect the most vulnerable strata of the population, that the
competitiveness of companies is not jeopardized, and that the proceeds from the tax can be returned
to those most “negatively” affected by it. In particular, revenue neutrality should be considered to the
extent possible, whereby the introduction of the carbon tax would be matched by a decrease in other
existing taxes. In this connection, to effectively and transparently communicate the rationale and
specific “workings” of the tax could be a springboard for obtaining broader support for it. On all these
aspects, international good practice should also be taken as reference in design, particularly the
experiences of Canada’s Province of British Columbia mentioned above.
One final observation to note the potential for designing an economy-wide carbon tax in tandem with a
tax on local pollutants (e.g. PM2.5 or nitrogen oxides). An example in point is Chile, which introduced a
carbon tax in 2014, although applying to power generation only, that is levied alongside a tax on SO2,
NOx, and particulate matter emissions for the same sources.
5.2.3 Carbon tax on coal
Coal is the most carbon intensive fossil fuel, and while its consumption is still relatively small in
Pakistan (accounting for 8.1% of total primary energy supply in FY 2016-17), its share has been
steadily increasing in recent years, as discussed in Point 4.3.1. Pakistan has been a net importer of
coal, but it is endowed with significant indigenous resources, which are considered of strategic national
importance, namely those of the Thar coalfield in Sindh Province. Several projects for harnessing
these resources are at different stages of development, which suggests that the share of coal in the
energy mix could significantly increase in coming years.
It is against this background that the introduction of a tax to specifically target the consumption of coal
could be considered in Pakistan. There is also some experience among regional peers in a tax of this
type, for instance India, which has been taxing coal since 2010 as part of its Clean Environment
Cess257. In India’s case, and as noted in Section 3.3, the implementation of this tax was intended to
256 The first attempt consisted in a levy of 0.10 Rs/kWh charged to electricity generated from thermal power plants. The second
consisted of a carbon cess whose proceeds would be used to support R&D in renewable energies. Both attempts failed due to the lack of political support. This information was obtained in the course of consultation meetings carried out in Pakistan in
October 2018 and April 2019.
257 The Cess was replaced by the “Goods and Service Tax Compensation Cess” in July 2017. For further details, see
<https://www.iisd.org/sites/default/files/publications/stories-g20-india-en.pdf>

123
meet certain objectives, such as the reduction in pollution levels or the raising of funds to support the
uptake of clean energy technologies.
A levy of this type could be considered as well in Pakistan. From a technical perspective, its
introduction could be relatively easy and entail low administrative costs, especially if charged
“upstream”, i.e. at the points of coal production and import. On the other hand, given the relatively
small share of coal on energy consumption in Pakistan, a tax on coal on a standalone basis would
likely be insufficient to instil the necessary change towards low-carbon development. Nevertheless, a
tax in this form could support curbing the growth, stabilizing or even decreasing the consumption of
coal in Pakistan. Levying a tax on coal could also bring an additional source of revenue to the
government. For example, if taken as reference the tax currently levied in India (approx. 5.7 USD per
metric ton of coal258) and the consumption of coal in Pakistan in FY 2016-17 (which corresponded to
11.2 million ton), a revenue of 63.8 million USD could have been generated on that FY.
5.3 Hybrid approaches
In addition to the carbon pricing options analyzed in the points above, this section briefly discusses
three “hybrid” approaches that could be considered in the context of Pakistan. While none of these are
recommended priorities to Pakistan on the way forward, these are identified and discussed below in
light of international trends but also due to the interest observed among several jurisdictions worldwide,
including in Asia, on hybrid approaches. These are as follows259:
Hybrid approach 1: development of a domestic offset mechanism with the national government
acting as the main buyer of the emission reduction units generated. This would be a mechanism
conceptualized along the lines of Australia’s Emissions Reduction Fund (ERF) and safeguard
mechanism. Through the ERF, companies, NGOs, sub-national governments and other actors are
encouraged to develop projects that result in the reduction of GHG emissions, thereby generating
Australian Carbon Credit Units (ACCUs). These are then sold to the Australian Government through
the ERF by means of a reverse auction. The safeguard mechanism applies to facilities emitting more
than 100,000 tCO2e per year, and aims to ensure that emissions reductions purchased by the
Government are not offset by significant increases in emissions above business-as-usual levels
elsewhere in the economy. For that purpose, the safeguard mechanism applies absolute emissions
baselines for the facilities covered, which cannot be exceeded, unless the “excess” can be offset by
the purchase of Australian Carbon Credit Units (ACCUs)260. Indonesia has also considered a similar
mechanism (excluding the safeguard mechanism) as one of the four market-based instruments that
could be adopted in the national context (see Section 3.3 for additional details), even if it has
258 PMR, Carbon Tax Guide: A Handbook for Policy Makers. Appendix: Carbon Tax Case Studies, 2017, Ibid.
259 It should be noted nonetheless that some of the hybrid approaches outlined in Point 3.1.2 have in fact been discussed as
part of the ETS and carbon tax options of the points above (e.g. ETS + offsets) 260 See for example IETA, Australia: a Direct Action Case Study, 2016, <https://www.ieta.org/resources/Resources/
Case_Studies_Worlds_Carbon_Markets/2016/Australia_Case_Study_092016.pdf>

124
eventually opted for the development of a domestic ETS. This “hybrid” approach could also be
considered in the context of Pakistan as a way of stimulating GHG abatement projects, which could
then be used to support the country meetings its NDC targets. The main drawback anticipated is the
assumption that the national government would be the main buyer of emission reductions units from
eligible projects, which could be difficult to materialize in the context of a “cash-strapped” country such
as Pakistan.
Hybrid approach 2: Introduction of a carbon tax to the power generation and industrial sectors,
as an introductory or transition stage to a floating price of emissions determined through
market forces as part of an ETS. Chile provides a good example of this approach. Chile started with
a carbon tax only targeting emissions from power generation facilities at a fixed price of 5 USD/tCO2e
(the price was determined based on international benchmarking due to a lack of consensus on the
“social cost” of carbon). Chile is currently considering the use of offsets for compliance purposes as
well as the possibility of establishing an ETS for the energy sector261. This approach would also
resonate with that of Australia’s now defunct Carbon Pricing Mechanism (2012-2014). The mechanism
was supposed to be implemented in two stages: in the first one, which was to run from 2012 to 2015, a
fixed carbon price was to be in place. In the second, the carbon price would be let to float based on a
cap set on emissions. The mechanism did not enter into force due a change in government, and was
replaced by the Direct Action Plan, which was the basis for the development of the ERF mechanism
mentioned above.
Hybrid approach 3: creation of an energy efficiency certificate system for the industrial sector.
This would consist in the establishment of a market where energy saving certificates would be traded
among the covered entities. Such mechanism would stimulate energy efficiency and conservation
improvements in those entities, which would lead to the reduction of GHG emissions. This design
option does not, however, explicitly put a price on carbon emissions. Additionally, the most energy
efficient facilities do not necessarily correspond to the least carbon intensive, which results on an
undetermined environmental outcome in terms of GHG emission reductions. An example of this
approach which is considered an international good practice is India’s Perform, Achieve, Trade (PAT)
programme, and was mentioned in Section 3.3. A system such as this was also one of the four market
based instruments initially considered in Indonesia for putting a price on carbon emissions (eventually,
this option was not pursued by the Indonesian government).
5.4 Summary
Table 5.3 below summarizes the different carbon pricing options discussed above. More specifically, it
summarizes their merits, challenges, and potential for alignment with other initiatives. These options
261 See: ICAP, Emissions Trading Worldwide – International Carbon Action Partnership (ICAP) 2019 Status Report, 2019,Ibid. and Carbon Pulse, Chile seen allowing unlimited offsets for expanded CO2 tax, may add RECs, accessed April 2019,
<http://carbon-pulse.com/70849/?utm_source=CP+Daily&utm_campaign=53fa3d3f54-CPdaily12032019&utm
_medium=email&utm_term=0_a9d8834f72-53fa3d3f54-36319493>

125
are also ranked qualitatively with regards to their level of political feasibility, technical feasibility,
corporate sector acceptance, public acceptance, and overall expected impact in terms of GHG
emission reductions. For these aspects, five levels of assessment are considered: very low, low,
medium, high and very high.
This summary is the basis for the discussion and recommendations to the Government of Pakistan on
the way forward provided in Chapter 6.

126
Mechanism /Instrument
Main Design Features Main Pros Main Cons
Potential for
synergies
Political
feasibility
Technical
feasibility
Corporate
acceptance
Public
acceptance
Expected
impact
Domestic emissions
trading scheme
- Initial targeted sectors: power generation, stationary energy utilization in industries and IPPU
- Possibility of future expansion to other sectors
- Possibility for offset use in sectors not covered by the emissions cap (e.g. agriculture, waste management and forestry)
- Certainty in emissions reductions based on the cap defined and opportunity to directly link with NDC targets
- Source of revenue to the government once allowances are auctioned
- Strong potential for linkages with international markets and other ETS in the region, especially China
- Risks related to competitiveness and carbon leakage are relatively easy to manage (e.g. through free allocation of allowances)
- More difficult to understand by government institutions, businesses and other stakeholders involved
- MRV required at facility level
- High costs of development and implementation
- Need for setting up from scratch all operational, administrative and legal infrastructure (e.g. registries, legal documents, etc.)
- Strong need for capacity building and expected long lead times for full implementation
- Opportunities under the CPEC and future linkages with the China national ETS
- The set-up of an MRV system at the facility level that could be aligned with that for tracking NDC progress
- Strong potential for co-benefits associated with the reduction of local pollutants from the entities covered
- Synergies with the newly established structures under the Climate Change Act
Medium Medium Medium Medium High
Carbon tax on petroleum-based fuels based on
Petroleum Development
Levy
- Adjustment of PDL to reflect carbon content/ emission potential of different fossil fuels
- Potential for expansion coverage to other fuels
- Coverage of the transport sector, which is a significant contributor to GHG emissions in Pakistan and expected to increase
- Smooth introduction of a mechanism to price emissions without major disruptions on already existing structures
- Relatively low administrative costs
- Risk of low influence in changing end-use behaviours towards less carbon-intensive fuels (for the transport sector, demand is relatively inelastic)
- Fuels currently covered by the levy correspond to a relatively small fraction of national emissions as they essentially target the transport sector
- Proceeds from the tax liked to be used for purposes other than climate change mitigation or adaptation if FBR remains the entity
- In general limited, but with the potential for expansion to include other fuels
- Possibility of considering a tax to the emissions of other pollutants (e.g. local pollutants such as PM or nitrogen oxides) Medium High Medium Medium Low

127
Mechanism /Instrument
Main Design Features Main Pros Main Cons
Potential for
synergies
Political
feasibility
Technical
feasibility
Corporate
acceptance
Public
acceptance
Expected
impact
collecting the tax
Economy-wide carbon tax
- Introduction of an economy-wide instrument putting a price on CO2 emissions that would equally apply to businesses and households
- The point of regulation would be downstream (i.e. at the point of fuel purchase)
- Ease of understanding for all stakeholders involved
- Low implementation costs
- Creation of revenue source due to price certainty
- Can be based on existing institutional structures
- General resistance among different government agencies, industries and the general public to a tax
- Risk of the poorest being disproportionally affected by the tax
- Emission reduction outcomes depend on how high the tax is set
- Difficulties in managing carbon leakage effects
- Potential for synergies with the imposition of a tax that may be levied on the emission of local pollutants
Very Low
High Very Low Low High
Carbon tax on coal
- A tax on coal to be charged upstream in the value chain (i.e. at the point of production or import)
- Ease of implementation
- New revenue source created
- Could be based on existing administrative infrastructures
- Relatively small contribution of coal to national GHG emissions
- Expected opposition from mining groups and possible perception of “conflict” with energy security concerns by directly impacting domestic resources of the Thar
- N/A: the tax should be considered alongside other carbon pricing instruments
Medium High Medium Medium Low
Domestic offset mechanism
- Development of a domestic offset mechanism with the national government acting as the main buyer of the units generated
- Creation of demand for emission reduction units in Pakistan
- Potential for covering practically all major emitting sectors
- Difficulties in having the government as the main buyer of reductions due to budgetary constraints
- Major emitters and carbon intensive industries not compelled or obliged to achieve emission reductions
- GHG emission mitigation outcome not predictable
- With the CDM, CORSIA, ETS overseas and other collaborative opportunities under Article 6 of the Paris Agreement
Medium High Very High High Low /
Medium

128
Mechanism /Instrument
Main Design Features Main Pros Main Cons
Potential for
synergies
Political
feasibility
Technical
feasibility
Corporate
acceptance
Public
acceptance
Expected
impact
Transition from carbon tax to
ETS
- A fixed price on carbon would serve as a prelude for the establishment of an ETS with a floating price
- Would enable the collection of revenue by the government from initial stages
- Certainty on carbon price
- Opportunity to obtain actual data on GHG emissions of covered facilities
- Expected resistance from different covered industries due to the imposition of a tax (in this case, on carbon emissions)
- Potential for synergies with the imposition of a tax that may be levied on the emission of local pollutants Low Medium Low Medium High
Energy efficiency certificate
mechanism
- Creation of an energy efficiency certificate system for the industrial sector
- Predictability on energy conservation outcomes once mechanism is set up
- Generally not major resistance from industries
- Uncertainty on GHG emission reduction outcomes as it implicitly prices carbon emissions
- Only one sector covered, industry, which accounts for a relatively small fraction of national emissions
- Most efficient facilities may not be the least carbon intensive
- Potential for policy overlap
- Should be considered in tandem with policies and developments on energy efficiency
Medium Medium High High Undeter-
mined
Table 5.3 – Carbon pricing options for the consideration of the Government of Pakistan

129
6. Recommendations and Way Forward
This study assessed the potential for the adoption of carbon pricing approaches in Pakistan. The
assessment was based on a review of existing approaches and international good practice from more
than 15 years of experience in the design and implementation of such instruments. As part of the
study, the specific national circumstances of Pakistan were also considered and assessed in detail.
The assessment confirmed the potential for carbon pricing in Pakistan, whose adoption could unlock
several opportunities and result in a number of benefits. A price signal on GHG emissions could
trigger investments in low-carbon technologies, particularly on renewable energies and energy
efficiency & conservation, which would also support Pakistan reducing its dependency on energy
imports. Carbon pricing could stimulate technology innovation, spur international technology transfer,
and boost the competitiveness of companies in Pakistan. There is, as well, a significant potential for
tapping several co-benefits from GHG emission reductions. Among these, the reduction of local air
pollutants, such as particulate matter or nitrogen oxides. In developing countries such as Pakistan, co-
benefits from reduced air pollution alone are estimated, conservatively, to be in the tune of 50 USD per
tCO2e abated, mostly in the form of a reduction in mortality and healthcare costs due to poor air
quality. A carbon pricing instrument could also be an important source of revenue to the government: if
a fixed price of 1-5 USD per tCO2e was charged to all emissions from the energy and IPPU sectors
reported in 2015, this would generate a revenue of 29.2 to 146.0 billion Rs., which equates to 0.6-3.0%
of the FY 2018-19 federal budget. Last but not least, a carbon pricing instrument could provide a
robust platform for managing emissions and support implementing the NDC.
In light of the benefits and opportunities identified in this study, it is recommended that the Government
of Pakistan can take further steps towards the development of a carbon pricing instrument.
Recommended steps in the short-run would essentially consist of “readiness” activities, with a focus on
those that could be articulated with ongoing work by government agencies (e.g. the conduct of energy
audits to major consumers of energy) or areas already identified as priorities to the government (e.g.
NDC implementation or the MRV of emissions). These aspects are developed in further detail below.
Recommendation 1: the Government of Pakistan is recommended to take further steps to
develop a carbon pricing instrument, focusing first on “readiness” activities and the exploration of
possible synergies with other areas considered as priorities, which could establish a solid
foundation for the introduction of these instruments in the future and build the necessary
momentum for their acceptability among different stakeholders.
Figure 6.1 summarizes the sectorial recommendations on carbon pricing instruments to Pakistan
having as basis the sectorial breakdown of the IPCC. In this respect, it may be noted that:

130
The energy and industrial processes and product use (IPPU) sectors are the most suitable
to the introduction of a carbon pricing instrument;
Agriculture and forestry are not particularly amenable to carbon pricing in light of issues
related to the dispersed nature of emissions from these sectors, methodological difficulties in
the MRV of emissions, and risks of carbon leakage; on the other hand, these sectors could be
considered for potential inclusion in a carbon pricing scheme as a source of offsets;
Emissions from waste management activities are seldom targeted in the form of an explicit
price on GHG emissions, especially in light of the relatively small contribution of these
emissions to the national total, as is Pakistan’s case. On the other hand, the sector could be a
source of offsets;
Within the energy and IPPU categories, certain sub-sectors are more prone to ETS inclusion,
others to carbon taxation, and some to both options.
Energy
46%
Power Generation
Industries
Transport
Others
IPPU
5.4%
Agriculture
43%
LULUCF
2.6%
Waste
3.0%
Adequate to both ETS and carbon tax
Adequate to both ETS and carbon tax
More adequate to carbon tax but potential
for inclusion in ETS also exists (transport)
Other sub-sectors on a case-to-case basis
Not amenable to explicit carbon pricing
Possibility of associating offset
mechanism
Adequacy of carbon pricingSub-sectorIPCC Sector
Figure 6.1 – Recommended carbon pricing options at the sectoral level.
Recommendation 2: Emissions from the use of energy and industrial production are
recommended as initial priorities for inclusion under the scope of a carbon pricing instrument in
Pakistan. While emissions from agriculture, forestry and waste management activities are not
recommended as priorities, these sectors could be considered as a source of offsets for use as
compliance instruments in the scope of a broader, economy-wide, carbon pricing system.

131
The matrix presented in Figure 6.2 maps out the carbon pricing options discussed in Chapter 5 in
relation to their expected impacts and risks. The dimension “impact” pertains to the potential of the
instrument to foster GHG emission reductions and indicates how broad is the scope for emissions
coverage. The dimension “risk” reflects the level of acceptability of the instrument as well as potential
challenges in implementation, as per the summary displayed in Table 5.3 at the end of the previous
chapter.
IMPACT
Low High
Domestic
ETS
RIS
K
Hig
hL
ow Carbon tax based
on existing levy
(PDL)
Economy-wide
carbon tax
Carbon tax on
coal
Domestic offset
mechanism
Transition from
carbon tax to
domestic ETS
Energy savings
certificate
mechanism
Figure 6.2 – Impacts and risks of carbon pricing options identified for Pakistan. Each green balloon identifies an
option explicitly putting a price on GHG emissions. The option identified in light red pertains to the only instrument which does not explicitly price GHG emissions; as such, the impact of the instrument is considered “undetermined” and is therefore indicated in the form of a range along the horizontal axis.
It can be seen from the matrix above that the domestic ETS option is the one exhibiting the most
favourable impact/risk balance. Therefore, it is the carbon pricing instrument recommended as priority
to the Government of Pakistan on the way forward. The development of a domestic ETS could,
nonetheless, be complemented by other carbon pricing instruments, especially for sectors/activities
that are not covered under the ETS scope.
Recommendation 3: The development of a domestic Emissions Trading System (ETS), which
could cover large-scale emitters in sectors with a high mitigation potential, is the recommended
carbon pricing option for Pakistan. An ETS could be developed on a standalone basis or in
articulation with other carbon pricing instruments provided that they complement each other and
the double-counting of emissions is avoided.
All carbon tax options considered exhibit an unbalanced relation between expected impacts and risks.
For example, an economy-wide carbon tax could be relatively easy to implement from a technical
perspective, especially if based on tax collection systems that already exist in Pakistan, and in case of

132
its application “upstream”, e.g. at the point of fuel extraction or import. This would enable the regulator
to only focus on a few control points while at the same time ensuring a wide coverage of the
instrument, and hence its expected broader impact. A carbon tax could also become a relevant source
of income to the government, especially in the context of a “cash-constrained” country such as
Pakistan.
In spite of these potential benefits, the level of support for an economy-wide carbon tax – among
government institutions, the corporate sector and the general public – is expected to be particularly low
in Pakistan. This is especially so in a context of declining competitiveness of some industries vis-à-vis
international peers and the general perception that the existing taxation regime is already too onerous
to taxpayers. Therefore, the introduction of an economy-wide carbon tax is not recommended as a
priority for Pakistan. Nevertheless, there is an opportunity for such design option, particularly if framed
as part of a broad fiscal programme aimed at increasing tax collection in Pakistan. But even on this
scenario, it is likely that the proceeds from the tax would revert to budgetary priorities other than
climate change, such as a reduction in the national fiscal deficit. This could dent the prospects of a
“revenue neutral” instrument and jeopardize the perception of the public about the “fairness” of the tax.
In case the national government opts for an economy-wide carbon tax, key success factors in design
will be in ensuring it does not disproportionally affect the most vulnerable strata of the population, that
the competitiveness of companies targeted is not jeopardized, and that the proceeds from the tax are
returned to those most affected by it while seeking revenue neutrality to the extent possible. In this
respect, it is strongly recommended that international good practice can be taken as reference, namely
the experiences of Canada’s Province of British Columbia on their economy-wide carbon tax, which
were briefly introduced in Section 3.3.
Recommendation 4: From a technical standpoint, an economy-wide carbon tax in Pakistan could
be implemented in relatively quick fashion. However, this option is unlikely to gain much support
either from government agencies, the business sector or the general public. Therefore, the option
is not recommended as a priority for Pakistan. Nevertheless, in case the government decides to
further explore it, it is recommended that international good practice can be considered in design,
particularly the experiences of Canada’s Province of British Columbia. Key learnings from these
experiences are in ensuring the revenue neutrality of the instrument and on how to safeguard the
most vulnerable from any potential undesired effects of the tax.
With regards to other opportunities for the introduction of a carbon tax in Pakistan, the matrix of Figure
6.2 indicates as a low-risk option the gradual adjustment of an already existing tax, the Petroleum
Development Levy (PDL), so as to reflect the carbon content/emissions potential of the fuels covered.
This option would build on already existing fiscal structures and involve relatively low administrative
costs. This levy could subsequently be expanded to other fuels.

133
One of the main challenges associated with this option would be on its effectiveness in instilling a
change of end-user behaviours towards less carbon intensive fuels, especially in the transport sector,
where demand is usually inelastic. This is one of the shortcomings usually pointed out to a carbon tax
of any sort: the predictability in revenue generation is counterbalanced by the uncertainty on its
environmental outcome (i.e. on the emission reductions achieved). Overall, the anticipated impact of
this option in terms of GHG emission reductions and behaviour change to low-carbon options is
expected to be relatively limited, unless the tax is set at a significantly high rate, which on the other
hand could limit its acceptability potential. Nonetheless, a tax along these lines could be a relatively
straightforward and swift way of kick-starting a carbon pricing scheme in Pakistan. Subsequently, the
scheme could be subject to adjustments in order to make it more stringent (i.e. higher prices), broader
in scope (i.e. more fuels or sources of emissions covered) and/or aligned with the development of a
domestic ETS, in case the government intends to further explore such option.
Recommendation 5: The development of a carbon tax based on an already existing levy,
particularly the Petroleum (Development) Levy (PDL) that is levied on some petroleum-based
transport fuels, is an option recommended to the consideration of Pakistan’s government. This
option could be made operational in a relatively quick fashion and with anticipated low-levels of
resistance from the public or the business sector. A carbon tax of this type is recommended for
development in tandem with a domestic ETS, on the one hand as a short-term option to price
GHG emissions from certain sources; on the other as a means of covering a sector of challenging
inclusion in the scope of an ETS: transport.
With regards to the other options considered in this study, they are not recommended as priorities to
the Government of Pakistan. A carbon tax on coal would cover a relatively small share of national
GHG emissions, and would in itself be insufficient to steer Pakistan towards low-carbon development.
It could, on the other hand, play a role in stabilizing or contribute to a gradual reduction in coal
consumption. Therefore, this option should not be totally discarded on the way forward.
The development of a domestic offset scheme whereby the national government would act as the main
buyer of emission reduction units generated from eligible projects, was another option considered in
this study and displayed in Figure 6.2. This option is, however, not recommended as a priority, given
the anticipated challenges in setting-up a scheme along these lines in the context of a “cash-
constrained” country such as Pakistan.
The development of an energy savings certificate scheme for industries was also analyzed in this
study, with the remark that it was the only mechanism among those considered that does not explicitly
price GHG emissions. This option is not recommended as a priority for Pakistan since it would require
an MRV infrastructure similar to that of an ETS but have the downsides of a system not expressed in
tCO2e, in particular: i) the system would reward the most energy efficient participants instead of the
134
least carbon intensive facilities; and ii) participation in cooperative climate action under Article 6 of the
Paris Agreement would be more complex, if possible at all.
In view of the specific domestic circumstances of Pakistan, this study identified the following general
characteristics for a carbon pricing system in Pakistan:
i) The system that is established can provide a durable and robust infrastructure for supporting the
achievement of domestic policy objectives and successive NDCs, which can be adjusted and
expanded over time;
ii) The price signal introduced by the system mobilizes sectors with strong mitigation potential,
while coverage of the instrument(s) is broad enough and expandable over time;
iii) The system, in its overall architecture, recognizes the necessary differentiated treatment of
sectors, in particular between those that can be “contributors” and others which could be
“recipients” of funding;
iv) Impacts of the system are low or manageable, i.e. minimal or non-existing to low-income
households, while impacts on industries exposed to international competition can be mitigated or
minimized;
v) The system is able to deliver several co-benefits, especially in terms of reduced pollution and
improved air quality, increased energy security and improved trade balance, and generated
investments;
vi) The system can, if desired, be a source of revenues;
vii) The system is built, as much as possible, on already existing infrastructure while leveraging
synergies with ongoing or planned initiatives; this is especially the case of the MRV framework,
whose development could be based, for example, on energy auditing or energy management
procedures;
viii) The system ideally positions Pakistan for participation in cooperative mitigation action under
Article 6 of the Paris Agreement, whereby the system: a) is based or expressed in tCO2e to
ensure strong tradability; b) is open and geared towards attracting international
investments/funding in mitigation action; and c) positions Pakistan as a prime source of
mitigation units.
In light of the above, the recommended course of action for Pakistan is the consideration of a
combination of carbon pricing instruments consisting, on one hand, in the establishment of a
domestic ETS in the mid to long-run; on the other, the consideration of options that could be
quickly implemented, namely the gradual adjustment/adaptation of the Petroleum Development Levy
to reflect the carbon intensity of fuels. This architecture would be based on both existing and emerging
institutional arrangements in Pakistan. The architecture of a system set up along these lines would
look as follows:

135
Offsets
Pakistan Climate
Change Fund
Petroleum Development Levy
External buyers of units
(Parties, CORSIA, international
climate funds, etc.)Domestic ETS
Retirement/ cancellation of units for NDC achievement
$
$
$
Free allocation of allowances
Allowances sold or auctioned
Emission reductions
outside the ETS
$
International fundingMRV
ETS Authority
(e.g. Pakistan Climate Change Authority) $
$
Funding(e.g. soft loans to
facilitate the implementation of
measures)
Other measures (e.g. to Provinces,
on adaptation)
Figure 6.3 – Proposed architecture for carbon pricing instruments in Pakistan. Note: role of provinces in the proposed architecture not reflected in the figure.
Financial flows associated with allowances or credit units
Flow of units (in the form of allowances or credits)
Other financial flows
The recommended design features for a domestic ETS in Pakistan were discussed in Section 5.1 and
summarized in Table 5.2, Section 5.2.1. Nevertheless, a key aim of the ETS would be to open up the
vast mitigation potential of Pakistan to external buyers/funders, either by selling emission units or by
linkages with other ETS as part of cooperative action under Article 6 of the Paris Agreement. With
regards to the features of the other system components, the following recommendations are made:
The establishment of an “ETS authority” that could fulfil the functions of “ETS regulator”. This
authority would be the focal agency for coordination purposes and ETS implementation, whose
activities would include, inter alia, ensuring compliance and the enforcement of provisions, the
set-up of the MRV framework, or the definition of allowance allocation method(s). The
Authority would also be responsible for ensuring that emission reductions achieved through
the ETS would be duly accounted when reporting progress in NDC achievements while at the
same time avoiding double counting. It is recommended that the Pakistan Climate Change
Authority could take the roles and responsibilities proposed for this ETS authority;
A central role to be played by Pakistan’s Climate Change Fund both as recipient and
distributor of funds raised from carbon pricing. On one hand, these funds would be generated

136
by the “carbon component” levied through the PDL and, on the other, as a result of the
auctioning of allowances under the ETS in case this allowance allocation method is
operationalized;
The proceeds raised by the Climate Change Fund could be distributed back to the companies
covered by the ETS, for example in the form of soft loans or grants to support initiatives on
energy efficiency or renewable energy generation, or in order to provide direct financial
compensation for carbon leakage risks (if any). These funds could be allocated for other
purposes as well, for instance to fund climate change adaptation measures, in the form of
cash-transfers to compensate low-income households (e.g. through their electricity bills) at risk
of being negatively affected by the carbon pricing instrument(s), and/or for redistribution to
Provinces;
Units generated domestically, either from the ETS itself or in the form of offsets, could be
purchased by external buyers, for instance from other ETS linked with that of Pakistan (e.g.
the China national ETS), CORSIA, international climate funds or even through collaborative
mechanisms in the context of Article 6 of the Paris Agreement;
International funding could be channelled to the ETS in the form of grants (e.g. to support
Pakistan setting-up the ETS system, capacity building, etc.) or private-led investments in
sectors covered by the ETS.
Recommendation 6: The architectural set-up recommended for carbon pricing instruments in
Pakistan is based on a mid-to-long term ambition of setting-up a domestic ETS, complemented in
the short-run with a carbon tax based on – or pegged to – the Petroleum Development Levy. This
architecture would allow a fairly extensive coverage of national GHG emissions (approx. 27% of
total GHG managed under an ETS, while approx. 10% through the Petroleum Development
Levy), enable a high degree of flexibility to ETS participants, and boost the attractiveness of
Pakistan as a host of investments in mitigation actions and as a potential source of emission
reduction units for use in international carbon markets.
Recommendation 7: Recommended design elements for a domestic ETS in Pakistan are: i) the
set-up of the system in a phased approach, with priority sectors for inclusion being power
generation, cement, and other industrial sectors that could benefit from or show willingness to an
early inclusion; ii) flexibility in design and compliance options, for instance with respect to cap
setting, allowance allocation and use of offsets; and iii) the consideration for synergies and
alignment with developments in the China national ETS in light of the strategic partnership among
the two countries.
Recommendation 8: Pakistan could implement an ETS which considers the need to minimize
the economic impact on participants exposed to international competition while at the same time

137
maximizing environmental integrity and investment certainty, in particular by preventing the over-
allocation of allowances. To do so, the following solutions are proposed: i) a flexible output-based
cap, and ii) a “generous” distribution of free emission allowances to cover a substantial share of
compliance needs.
Recommendation 9: Pakistan’s Climate Change Fund and Climate Change Authority are
recommended to play key roles as part of the system architecture proposed for Pakistan on
carbon pricing. In particular, the Authority is recommended to fulfil the functions of ETS regulator,
while the Fund as the entity responsible for receiving and distributing the proceeds raised from the
carbon pricing instruments. In particular, the Fund could manage/disburse funding levied
nationally and received internationally to facilitate the implementation of measures.
Even though not reflected in Figure 6.3, Provinces are expected to play a key role in
operationalizing the proposed institutional set-up for carbon pricing. While specific details are
expected to emerge in the context of follow-up activities, including consultations, it is recommended
that:
i) Provinces can pass legal instruments to enable ETS participation of the industries registered
and/or operating from the province;
ii) Province-level EPAs can support data collection on GHG emissions at the facility level and
the set-up of the MRV framework established in the scope of the ETS (which could include
the delegation of responsibilities from the “ETS authority”);
iii) Provinces can benefit from the proceeds raised by the carbon pricing instrument, either
directly (e.g. through cash-transfers from the Pakistan Climate Change Fund, for subsequent
application on climate-related activities in the province), or indirectly (e.g. through direct
financial support provided by the Climate Change Fund to companies based in the Province);
iv) Specific roles can be considered for Provincial Committees given that, according to the
National Climate Change Policy (2012), these are recognized as key actors in the
implementation of the climate change agenda introduced by the policy.
Recommendation 10: It is recommended that Provinces are strongly engaged in the process of
setting-up the proposed carbon pricing architecture, as they are expected to be instrumental in
fostering ETS participation of companies based in the respective provinces, in operationalizing the
MRV system, and as ultimate beneficiaries of the funds raised from the carbon pricing
instruments.
The establishment of a domestic ETS is the option expected to result in the highest overall benefit, in
particular with respect to the flexibility allowed to all participants to the system (e.g. on cap-setting,

138
mechanisms to compensate industries exposed to international competition, etc.), as an opportunity for
linkages with the systems of other jurisdictions, in particular China, and in the multiple co-benefits this
option could yield, for instance in the form of technological innovation, private-sector investments, and
reduced emissions of local pollutants.
However, the set-up of an ETS in Pakistan requires a long-term vision. This is due, on the one hand, to
the need to familiarize and acquaint a wide range of stakeholders to a new concept, with some level of
complexity. On the other, to take account of expected long lead times in order to set up the necessary
elements for an ETS, which would include the establishment of governing bodies and the technical
infrastructure for MRV. In this connection, it is recommended that Pakistan considers engaging as
soon as possible in preparatory activities for establishing a domestic ETS, with a focus on
large-scale emitters.
Recommendation 11: Engage as soon as possible in the preparation of an ETS in Pakistan, with
a focus on large-scale emitters and the conduct of “readiness” activities.
In order to operationalize this vision, it is recommended as immediate next step the development of a
detailed roadmap for carrying out these “preparedness” (“readiness”) activities. This is one of the
activities included under a first phase of recommended actions on the way forward. Recommended
follow-up opportunities and activities have been structured in three phases, as follows:
Phase I as an awareness raising and stakeholder sensitization stage, which would also serve
to detail the scope of follow-up activities for implementation under Phase II;
Phase II as a preparedness (“readiness”) and capacity building stage;
Phase III as a stage for piloting activities and the full roll-out of the domestic ETS system.
Phase I, which is suggested to be titled as an “awareness, sensitization and definition” stage, could be
initiated immediately after the endorsement of this study by the Government of Pakistan. It assumes
the government would be willing to further explore the potential for carbon pricing, even if not
committing to the adoption of any specific instrument in the future. The first goal of this phase would be
to build a momentum for carbon pricing by reaching out to a number of key stakeholders, especially to
Provinces and business groups. The findings and recommendations of this study would be shared with
these stakeholders, whereas these consultations could be opportunities to provide basic training on
carbon pricing concepts and the identification of possible candidates (e.g. a province, a specific sector,
a specific company) for the piloting/implementation of activities in subsequent phases.
Phase I would also be an opportunity to seek alignment and synergies with other initiatives associated
with carbon pricing being prioritized in Pakistan, such as developments related to the NDC or the
operationalization of the Pakistan Climate Change Fund and the Pakistan Climate Change Authority.

139
Other activities recommended on this phase are the conduct of exploratory discussions for a potential
China-Pakistan collaboration on carbon pricing, and the discussion of “short-term” options for carbon
pricing based on already existing taxes such as the PDL. This phase is expected to take between 9 to
12 months for full completion. Table 6.1. below elaborates on these activities.
Activity Rationale and observations
1.1 Consultations with federal agencies
Consultations would be necessary in order to discuss in detail and find agreement among federal level agencies on the carbon pricing instrument(s) and the overall architecture for Pakistan.
1.2 Consultations with Provinces
Consultations primarily aimed at presenting the findings and recommendations of this study. Consultations could also be an opportunity to provide initial training and capacity building on carbon pricing to these stakeholders. Other aims of the consultations are to discuss the role of Provinces in the context of the carbon pricing architecture proposed as well as opportunities for follow-up activities involving the Provinces, for instance on additional capacity building, piloting activities, etc.
Consultations expected to be carried out for 1-2 days in each provincial capital.
1.3 Consultations with
industries and the private sector
Consultations primarily aimed at presenting the findings and recommendations of this study. As a second aim, the consultations would serve as an opportunity to identify industrial or business sectors that could be interested in being part of initial stages of a carbon pricing instrument (i.e. for readiness activities, piloting, capacity building, etc.).
These consultations could be accompanied by basic training on carbon pricing concepts focusing on the potential benefits of an early engagement of industries or businesses on follow-up activities.
Consultations could serve as an initial step to obtain more detailed data about the sectors shortlisted for potential involvement or piloting (e.g. on energy consumption).
Consultations could be carried out in parallel with those of Provinces (i.e.
assuming certain industrial clusters are located in specific Provinces).
Possible entry points for engaging companies are industrial associations.
1.4 Assessment of “short-
term” options on carbon pricing based on existing taxes, namely the PDL
This activity would consist of exploring in further detail the possibility of
developing a carbon pricing instrument based on an already existing tax, such as the PDL.
This activity could involve the following steps and outputs:
i) Discussions led by MOCC with key stakeholders on this option and their endorsement (e.g. with FBR, Ministry of Finance, etc.);
ii) In case of endorsement, conduct of study on specific modalities for this carbon pricing option (e.g. the methodology for determining the carbon price proposed, the necessary steps to get approval and implement the proposed tax);
iii) Conduct of a technical workshop to present findings of the study and provision of final recommendations. The implementation of recommended carbon pricing modality(ies), if any, would supersede the duration of Phase I and could be included in the scope of Phase II.
1.5 Exploratory discussions on
China-Pakistan collaboration on carbon pricing
These discussions could be initiated in the framework of the CPEC initiative,
and include the following:
i) Knowledge sharing on the development process and design features of the China national ETS and its provincial pilots (e.g. in the form of policy dialogues, workshops, field visits, etc.);
ii) Identification of areas for knowledge transfer and potential synergies between China’s national ETS and a domestic ETS developed in Pakistan (e.g. in terms of sectoral coverage, institutional architecture of the system, model for federal/province integration, legal instruments developed, MRV

140
framework, etc.);
iii) Shortlisting of areas for future cooperation.
Outputs from this activity could be framed in the form of a roadmap for collaboration and the identification of specific activities for joint development in the future.
1.6 Assessment of synergies
with other national initiatives related to carbon pricing*
The assessment would consider in detail the potential for synergies between
carbon pricing and the following initiatives:
i) Priority areas or actions under the NDC, in particular the articulation between mitigation target(s) and the ambition level envisaged with the carbon pricing instrument;
ii) The establishment and operationalization of the Pakistan Climate Change Authority and the Pakistan Climate Change Fund and expected roles they could play in the scope of a carbon pricing instrument;
iii) Articulation of carbon pricing with other national policies, especially those in the areas directly impacted by the instrument to be adopted, namely climate change, energy, industrial development and environment protection;
iv) The conduct of energy audits to major energy consumers in certain sectors, as a basis for the collection of sectoral level data on GHG emissions and the establishment of an MRV system for a carbon pricing instrument;
v) Existing MRV processes and systems, in particular those related to the preparation of the national GHG inventory, including the already existing capacities of the Global Change Impact Studies Centre (GCISC), MOCC;
vi) Forestry activities and the potential for crediting emission reductions from these;
vii) Liberalization of the electricity sector and the gradual establishment of a market-oriented architecture, which could be aligned with market-based instruments such as carbon pricing;
viii) Competitiveness of companies exposed to international markets, and the voluntary reporting of GHG emissions by the private sector;
ix) The revenue raising potential of a carbon pricing instrument in the context of fiscal reforms in Pakistan;
The main output of this activity could consist of a document outlining how the
carbon pricing instrument selected could be aligned with these initiatives.
1.7 Preparation of detailed roadmap for domestic ETS development
This would consist of a detailed roadmap for ETS development, with the definition of activities to be implemented as part of Phase 2;
Outcomes of the activities identified above to be considered in the preparation of this roadmap, in particular with regards to provinces or industries/sub-sectors that could take a lead in the setting-up of the ETS;
This activity could also include the preparation of preliminary draft
rules/principles for a domestic ETS, which could then be proposed for consultations.
1.8 Preparation of a communication plan on carbon pricing
A communication plan could be important to address concerns about carbon pricing among several stakeholders, given that this is still a new concept in Pakistan and prone to misconceptions.
Table 6.1 – Recommended activities for Phase I: “Awareness, sensitization and definition”.
* This assessment could simply consist of an update of the present study by incorporating any new developments
or additional data that is obtained.
The detailed roadmap prepared under Activity 1.6 as noted in the table above would provide the basis
for the activities to be conducted in Phase II. Activities of Phase II could be carried out regardless of
whether a decision is made by the Government of Pakistan to adopt a carbon pricing instrument, in

141
particular an ETS. In fact, the outcomes of this phase could be used as additional elements to support
the final decision making process.
Regardless of the decision, carrying out these activities would contribute to the collection of more
granular data on GHG emissions, enable a more robust tracking of the evolution of GHG emissions in
sectors covered, and provide the opportunity to improve Pakistan’s MRV framework as a whole. On
the other hand, and as indicated under activity 1.7, this phase could also include the preparation of
preliminary draft principles/rules for a domestic ETS, in case there is sufficient initial support for this
option. Initial ETS draft regulations could then provide a basis for subsequent developments of the
system and better shape activities in the scope of Phase II.
Activities to be carried out as part of Phase II are expected to include (but not be restricted to) the
following:
Preparation of a list/inventory of major emitters in the energy and industrial sectors of Pakistan
with the goal of assessing their levels of GHG emissions, determine emissions intensity per sub-
sector (e.g. cement manufacturing, textiles, etc.) and come up with emissions benchmarks;
Upon completion of the inventory and for the sectors shortlisted for ETS inclusion, assess and
recommend options for setting an emissions cap and an approach for allowance allocation;
Based on economic modelling tools (e.g. computable general equilibrium models), assess the
impacts to the economy of different carbon prices in sectors to be included under an ETS;
Based on economic modelling tools, assess different scenarios for allowance supply and demand
in the ETS system as well as the “expected” price range. Based on the results, provide
recommendations for considering “market management” elements, such as the introduction of a
price ceiling and price floor, allowance reserve or the banking of allowances;
Assess the risks of carbon leakage associated with the adoption of an ETS, with a focus on the
sectors most exposed to international competition (e.g. textiles, cement manufacturing, etc.) and,
if required, approaches for minimizing them;
Based on: i) the recommendations of this study, ii) the ETS systems with which to consider
establishing linkages, and iii) future developments in the context of Article 6 of the Paris
Agreement, come up with the specific/detailed design elements of a domestic ETS, in particular
the following:
o The institutional arrangements and specific roles and responsibilities of all participants
involved, including federal and provincial governments, the ETS “Authority”, the Pakistan
Climate Change Fund, and the establishment of a market operator;
o The legal and regulatory instruments that would need to be adopted by the government
(both federal and sub-national) to operationalize the ETS, prioritizing in particular
requirements to establish the MRV infrastructure;

142
o The MRV system to be established, which should include an MRV law/regulation, the
development of specific monitoring and reporting guidelines (e.g. methodologies for the
calculation of emissions, reporting templates, etc.), the set-up of a database for MRV of
facilities, the development of a framework for accrediting third party verifiers, and
considering the establishment of an “MRV Division” (to which staff would need to be
recruited and trained), etc.;
o Definition of the sectors, sub-sectors and activities that could be eligible as offset suppliers
to the ETS, including the recommendation of accounting methodologies;
o Processes and procedures for integration with other initiatives developed in Pakistan on
climate change, namely the reporting requirements to the international community on the
progress in the NDC implementation, BUR and NC preparation, etc.;
The setting-up of an emissions registry to track unit holdings of participants, the achievements of
the system, and the potential of exporting units to third parties, including internationally;
A training and capacity building programme for stakeholders involved.
It is expected that Phase II could take 24 to 36 months for full completion. The outcomes of this phase
would also serve as basis for defining in detail the activities to be implemented in Phase III. A key
element of Phase II would be the establishment of the MRV infrastructure required for the ETS system.
In this regard, it should be noted that this is a component where donor support, both technical and
financial, would be required.
Phase III could be split into two sub-phases: i) the conduct of piloting activities, and ii) the full roll-out of
the system. Prior to initiating piloting activities, some institutional structures would need to be in place,
such as the functions of the ETS regulator, the definition of roles for provincial EPAs, and the
establishment of an emissions registry. In fact, piloting could be initiated before completion of all the
activities proposed for Phase II, as soon as certain design elements are established. Piloting activities
could consist of completing an MRV cycle for a number of facilities (which could involve, for example,
one year of continuous monitoring of emission), the testing of the emissions registry, and allowance
trading.
As a final remark, the transition from piloting to full ETS implementation would require the formal
adoption of the instrument into national law, as this would be the means to ensure compliance among
the entities covered.
Recommendation 12: A stage of awareness, sensitization and scope definition is recommended
to be carried out as an immediate follow-up to this study. This phase would be carried out over a
period of 9-12 months, and would aim at obtaining a broader support for the introduction of carbon
pricing instruments in Pakistan through a consultative process, identify possible partners for
subsequent activities, and chart out a detailed plan for a “preparedness”, capacity building and

143
piloting phase. In case of strong support for an ETS in Pakistan, an outcome of this follow-up
phase could also be the preparation of preliminary draft rules/principles for a domestic ETS.
Recommendation 13: If sufficient agreement on establishing a domestic ETS can be attained,
prioritize the timely development of an adequate MRV infrastructure on large-scale emitters as a
necessary foundation for the system, noting that exact rules on how a domestic ETS would
operate can be elaborated in parallel.

144
Annex I – Analysis of policy documents of Pakistan and their support to the introduction of carbon pricing instruments
Policy Document
Policy element Rationale/Opportunity for CPI support
Nati
on
al
Clim
ate
Ch
an
ge P
oli
cy (
2012)
5.1.i) Consider introducing carbon tax on the use of environmentally detrimental energy generation from fossil fuels (p.23, policy measures on Energy)
- Explicit reference to a CPI, in the form of a carbon tax
5.1.j) Promote and provide incentives for activities required for increasing the energy-mix and switching to low-carbon fossil fuels (…) (p.23, policy measures on
Energy)
- A CPI is a price signal that, if set a sufficiently high level, holds the potential for triggering this switch to low-carbon
technologies, including fossil-fuel based
5.1.g) Ensure that new coal-fired power stations perform at high-efficiency level and
are designed in such a way that they can be easily retro-fitted for Carbon Dioxide Capture and Storage (CCS) (p.23, policy measures on Energy)
- A CPI, on a standalone or coupled with well-designed policies
on energy efficiency, can provide an incentive to stimulate the uptake of high-efficiency equipment as well as CCS
5.2.b) Examine the gradual introduction of “Green Fiscal Reforms” in different sectors of the economy, including energy, water and waste/sewage, to achieve the
objectives of carbon emission reductions (p.24, policy measures on Energy Efficiency and Conservation)
- The introduction of a CPI in the form of a carbon tax could be a component of the green fiscal reform referred to on this policy
measure
5.3.I.g) Support the private transport sector by providing incentives for reducing emissions and environmentally friendly transport services (p.25, policy measures on Road Transport)
- Incentives for reducing emissions can be in the form of a CPI,
both in the form of an economic price signal to the economy, and as a revenue generation mechanism that could fund mitigation activities in the sector
5.3.I.h) Promote the development and adoption of environmentally friendly transport
technologies and efficient management techniques (p.25, policy measures on Road Transport)
- The uptake of low-emissions, environmentally friendly transport technologies could be stimulated, in part, through the
introduction of a CPI, which would contribute to factoring into decision-making processes the negative externalities associated with GHG emissions
5.3.I.i) Promote greater use of Compressed Natural Gas (CNG) in the transport sector to the extent consistent with the availability of CNG in the market (p.25,
policy measures on Road Transport)
- The introduction of CNG in Pakistan was possible due to the introduction of a set of price incentives, which enabled the creation of a levelled-playing field with other transport fuels,
such as diesel. In future, such incentives could be linked with a price on CO2 emissions, explicitly or implicitly

145
5.3.II.a) Encourage the national airline to give due consideration to new fuel efficient
aircrafts, causing minimum carbon emissions (…) (p.25, policy measures on Aviation Transport)
- A CPI could trigger this switch to new fuel efficient aircrafts, with
the remark that the introduction of such instrument should be alignment with developments in the context of CORSIA
5.5.a) Incorporate economic incentives to promote emission-reduction by upgrading industrial processes and technologies (p.27, policy measures in Industry)
- A CPI would qualify as an economic incentive for the consideration of policymakers
5.5.b) Prepare voluntary “Corporate Social Responsibility” (CSR) guidelines and encourage the corporate sector to create a CSR fund to cover carbon emission
reduction efforts in industrial sector (p.27, policy measures in Industry)
- The CSR fund suggested could be linked with carbon emission
reduction units in the context of a national carbon market
5.5.d) Promote the use of energy efficient motors in the industrial sector (p.27,
policy measures in Industry)
- Energy efficiency in industrial equipment could be stimulated
with a CPI, in conjunction with other policy measures on energy efficiency
5.5.f) Develop capacity to monitor and estimate emissions locally for each industry (p.27, policy measures in Industry)
- This policy measure refers to the need of establishing MRV frameworks at the industry level, which is a stepping stone for a
well-functioning CPI
- The perspective of introducing a CPI could also function as a
stimulus to the quicker development of an MRV framework
5.6.e) Promote development of biogas and manure digester for methane reduction and energy production through CDM support (p.28, policy measures in Agriculture
and Livestock)
- Emission reduction units, alike CERs issued in the framework of the CDM, could be developed/issued as part of a domestic ETS in Pakistan and used as compliance instruments for covered
facilities
5.7.h) Establish linkages with regulated and voluntary carbon markets to
promote and encourage forestry mitigation projects in Pakistan (p.29, policy measures on Carbon Sequestration and Forestry)
- The development of an ETS could facilitate the establishment of
the linkages referred in this policy measure on both regulated and voluntary carbon markets
6.I.j) Identify national institutional needs to develop the capacity for carbon trading
(p.31, policy measures on Capacity Building)
- One of the core functions of an ETS is carbon trading, whose capacities would need to be develop in case Pakistan opts for
such design option
6.II.l) Develop an institutionalized system to measure and monitor GHG emissions from various sectors including trans-boundary pollution and maintain a database on
this; (p.33, policy measures on Capacity Enhancement)
- This policy measure refers to the development of an MRV framework in Pakistan, which could support – and be supported
by – the development of a CPI such as an ETS

146
Fra
mew
ork
fo
r Im
ple
men
tati
on
of
Cli
mate
Ch
an
ge P
olicy
(2014-2
030)
Objective: To develop and obtain clean energy technologies and uses to achieve low carbon growth in the energy sector.
Action 2.3.1: Design economic incentives and feasible options for energy-mix and fuel switching program to low-carbon fossil fuels and other sources, ensuring flexible, reliable innovative strategies and technologies that reduce emissions
(medium-term priority)
- Economic incentives to consider can include CPIs, such as a carbon tax or an ETS
Objective: To reduce total energy demand through conservation and efficiency
Action 3.1.2: Provide economic incentives to conserve energy in the form of
replacing high energy consuming machineries with energy efficient machineries in the industrial sector (medium-term priority)
- Similarly to Action 2.3.1, economic incentives can be in the form of CPIs, such as a carbon tax or an ETS
Action 3.1.3: Develop new strategies for the transport sector to encourage both fuel conservation and fuel efficiency (short-term priority)
- These strategies could be entry points for the introduction of CPIs
Action 3.1.4: Provide subsidy for promotion of low energy consuming devices for
house hold and commercial uses such as energy saver lights (immediate priority)
- These subsidies could be financed through revenue generated
from a CPI
Action 3.2.1: Design financial incentives for carbon emission reduction plans by improving efficiency of the carbon fuel based machines and engines (short-term
priority)
- These financial incentives could be financed through revenue
generated by a CPI or linked with a CPI itself
Action 3.2.2: Develop Green Fiscal Reforms for introduction of polluter
pays/carbon tax (medium-term priority)
- A CPI, in the form of a carbon tax, explicitly referred as part of
this action
Action 3.2.3: Plan Green Fiscal Reforms for providing subsidies for: renewable
technology transfer; local innovations of renewable technology; efficiency improvement for carbon fossil fuel based technologies; (medium-term priority)
- The introduction of a CPI in the form of a carbon tax could be a
component of the green fiscal reform referred as part of this policy action
Action 3.2.5: Develop fiscal reforms for the introduction of carbon credit market (shot-term priority)
- This policy action explicitly refers to carbon markets
Action 3.2.6: Develop GHG emissions “Monitoring, Reporting and Verification System”(MRV) capacity (short-term priority)
- The development of MRV at the installation level is essential to the introduction of a CPI
Action 3.3.3: Provide market based incentives, such as emission trading credits to private energy producers to help reduced carbon emissions (short-term priority)
- This reference clearly suggests the establishment of an ETS as an incentive scheme
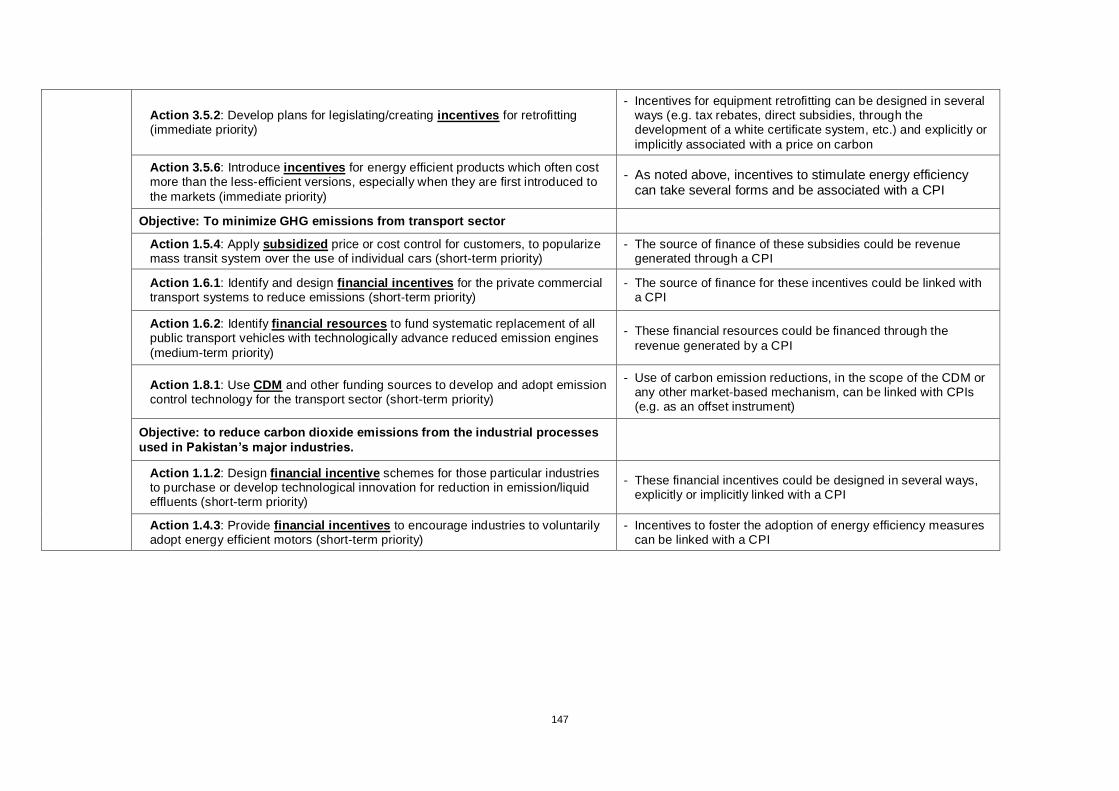
147
Action 3.5.2: Develop plans for legislating/creating incentives for retrofitting (immediate priority)
- Incentives for equipment retrofitting can be designed in several ways (e.g. tax rebates, direct subsidies, through the development of a white certificate system, etc.) and explicitly or
implicitly associated with a price on carbon
Action 3.5.6: Introduce incentives for energy efficient products which often cost more than the less-efficient versions, especially when they are first introduced to
the markets (immediate priority)
- As noted above, incentives to stimulate energy efficiency can take several forms and be associated with a CPI
Objective: To minimize GHG emissions from transport sector
Action 1.5.4: Apply subsidized price or cost control for customers, to popularize mass transit system over the use of individual cars (short-term priority)
- The source of finance of these subsidies could be revenue generated through a CPI
Action 1.6.1: Identify and design financial incentives for the private commercial transport systems to reduce emissions (short-term priority)
- The source of finance for these incentives could be linked with a CPI
Action 1.6.2: Identify financial resources to fund systematic replacement of all public transport vehicles with technologically advance reduced emission engines
(medium-term priority)
- These financial resources could be financed through the
revenue generated by a CPI
Action 1.8.1: Use CDM and other funding sources to develop and adopt emission control technology for the transport sector (short-term priority)
- Use of carbon emission reductions, in the scope of the CDM or any other market-based mechanism, can be linked with CPIs (e.g. as an offset instrument)
Objective: to reduce carbon dioxide emissions from the industrial processes
used in Pakistan’s major industries.
Action 1.1.2: Design financial incentive schemes for those particular industries to purchase or develop technological innovation for reduction in emission/liquid effluents (short-term priority)
- These financial incentives could be designed in several ways, explicitly or implicitly linked with a CPI
Action 1.4.3: Provide financial incentives to encourage industries to voluntarily adopt energy efficient motors (short-term priority)
- Incentives to foster the adoption of energy efficiency measures can be linked with a CPI