study on the strategic usage of coal in the eas region: a
TRANSCRIPT
Study on the Strategic Usage of Coal in the EAS Region: A Technical Potential Map and Update of the First-Year
Study
edited by
Yasuo Otaka
Han Phoumin

© Economic Research Institute for ASEAN and East Asia, 2015
ERIA Research Project FY2014 No. 36 Published September 2015
All rights reserved. No part of this publication may be reproduced, stored in a retrieval system, or transmitted in any form by any means electronic or mechanical without prior written notice to and permission from ERIA.
The findings, interpretations, and conclusions expressed herein do not necessarily reflect the views and policies of the Economic Research Institute for ASEAN and East Asia, its Governing Board, Academic Advisory Council, or the Institutions and governments they represent.
iii
Contents
List of Tables iv List of Figures v
List of Abbreviation vi Chapter 1 Introduction 1
Chapter 2 Review of the First Study 5 Chapter 3 Impact of Shale Gas on the Coal Market 21 Chapter 4 Economic Benefits of the Introduction of Clean Coal
Technology in the East Asia Summit Region 25
Chapter 5 The Development of Technological Potential Map for Clean
Coal Technology Dissemination in the East Asia Summit Region
35
Chapter 6 Conclusion 49
Chapter 7 Policy Recommendations for the Strategic Usage of Coal 51
References 55

iv
List of Tables
Table 4-1 General Assumptions for Cost–Benefit Analysis 26 Table 5-1 Generation Cost by Boiler Type and Coal Price 37 Table 5-3 Regulations of Coal-Fired Power Stations 41 Table 5-4 Environmental Guideline: Environmental Standard Targets
and Applicable Technologies 44
Table 5-5 Cost Impact Analysis of the Decline of Plant Load Factor and Plant Efficiency
46
v
List of Figures
Figure 2-1 Estimate of Coal-Fired Power Plant in the East Asia Summit Region
5
Figure 2-2 Origin of Primary Energy Imports in the East Asia Summit Region
6
Figure 2-3 Recoverable Coal Reserves in the World 7 Figure 2-4 Flow of Steam Coal (2011 estimate) 8 Figure 2-5 Steam Coal Demand Forecast in Asia 9 Figure 2-7 Comparison of Coal and Natural Gas Prices 11 Figure 2-8 Thermal Efficiency of Coal-Fired Power Stations in Asia,
Germany, and the United States 12
Figure 2-9 Minimisation of Capital Outflow 14 Figure 2-10 Relationship between Power Plant Efficiency and CO2
Emissions 16
Figure 2-11 CO2 Emission and Reduction Estimates in Coal-Fired Power Plants
17
Figure 2-12 Investment and Development Benefits 18 Figure 2-13 Job Creation Benefits 20 Figure 3-1 Impact of Shale Gas Development 21 Figure 3-2 Coal Consumption and Shale Gas Production Trends in the
United States 22
Figure 3-3 Coal Consumption and Imports in OECD Europe 23 Figure 3-4 Coal Demand Forecasts for ASEAN, India, and OECD Europe 24 Figure 4-1 Breakdown of Levelised Cost of Electricity (LCOE) 27 Figure 4-2 Breakdown of EPC Costs 28 Figure 4-3 Calculation of O&M Costs 29 Figure 4-4 Average Monthly Coal Prices in Indonesia (2009–2014) 30 Figure 4-5 Calculation of Desulphurisation and Denitrification Costs 32 Figure 4-6 Sensitivity Analysis: Overview of Results 33 Figure 4-7 Sensitivity Analysis: Cost Breakdown Comparison at Per Coal
Prices Scenario 34
Figure 5-1 The Technological Potential Map 35 Figure 5-2 Technological Guidelines: Country Characteristics and
Technology Focus 38
Figure 5-3 Thermal Efficiency History and Road Map 39 Figure 5-4 Comparison of SOx and NOx Emission Standards from
Coal-Fired Power Stations 42
Figure 5-5 Thermal Efficiency of Coal-Fired Power Plants in Japan and Asia
45
Figure 7-1 CO2 Emissions from Fossil Fuel Power Plants 52 Figure 7-2 Road Map for Each Country Group in the East Asia Summit
Region 54

vi
List of Abbreviations and Acronyms
A-USC
BAU
Btu
advanced ultra super critical
business as usual
British thermal unit
CCS carbon dioxide capture and storage
CCT
CO2
clean coal technology
carbon dioxide
EAS
EPC
East Asia Summit
Engineering, procurement, and construction
ERIA
GW
GWh
Economic Research Institute for ASEAN and East Asia
gigawatt
gigawatt-hour
IEA International Energy Agency
IGCC integrated coal gasification combined cycle
IGFC
IRR
Kcal
Kg
kWh
LCOE
integrated gasification fuel cell
internal rate of return
kilocalorie
kilogram
kilowatt-hour
levelised cost of electricity
LNG
MT
NOx
OECD
O&M
liquefied natural gas
metric tonne
nitrogen oxide
Organisation for Economic Co-operation and
Development
operation and maintenance
SC
SOx
TWh
super critical
sulphur oxide
terawatt-hour
USC ultra super critical

1
Chapter 1
Introduction
1.1. Background and Objectives
Alongside economic development, electricity demand in the East Asia Summit (EAS)
region is rapidly increasing. It is thought that thermal power generation, through a
combination of coal and gas, will continue to play a central role to satisfy such demand,. As
coal is cost competitive in terms of calorific value compared with gas, and large quantities
of coal are produced in the EAS region, it is anticipated that coal-fired power generation as
the main source of power will increase on a broad scale. In the region, Australia, Indonesia,
China, India, and Viet Nam produce large quantities of coal; other energy sources such as
gas are partially imported from outside the region. The magnification of the usage of coal
in the EAS region has the merit of enhancing energy security.
However, with the increase in coal demand, notably that of China and India, the
supply and demand relationship of coal has become tight in recent years. For the
sustainable usage of coal, the dissemination of clean coal technology (CCT) for clean and
efficient usage of coal in the region is thus of pressing importance. In addition, in order to
facilitate the economic development within the region, a cost-effective and sustainable
electricity supply system with CCT at its heart should be promoted. While the necessity for
CCT has been recognised, the use of inefficient technology is still widespread. If this
situation continues, valuable coal resources will be wasted, environmental impact will not
be sufficiently reduced, and sustainability will be harmed.
The first-year project of this study has been completed and has focused on the
economic return from the investments in different types of coal technologies. Its major
findings were that investments in CCTs with high efficiency will bring high returns, including
savings on coal utilisation. However, the upfront cost investment on CCTs remains barriers
for developing countries to afford these technologies.
The second-year project will focus on updating the information from the first-year
study and on laying out a technological potential map as part of the process to facilitate the
2
deployment and dissemination of CCT. This study will essentially suggest a feasible
efficiency level, an environmental performance, and a maintenance criterion for each
technology so that countries in the region will be able to select and introduce the best
technologies based on their individual situation. At the same time, this study will propose
appropriate measures so that these technologies can be realised. Upon the completion of
this proposed research, a practical technological potential map including the above-
mentioned items will be developed so that policymakers from each country are able to
introduce the technologies swiftly.
1.2. Methodologies of the Project
This research is a continuation of the first-year study. During the second-year study,
the road map for the strategic usage of coal in the EAS region will be updated and five
guidelines on the technological potential map will be formulated.
(1) Reconfirmation of the importance of coal in the EAS region
Based on the results of the analysis on the trend of energy demand, the political
positioning of coal in the EAS region, and features of coal resources and their importance,
the contribution of the enhanced use of coal towards improving energy security in the EAS
region, and the importance of disseminating CCT for the continuous utilisation of coal were
outlined in a previous study. In this current study, these analyses will be reconsidered by
updating numbers and data based on latest trends. In addition, the impact of shale gas
development, which has had a decreasing effect on natural gas prices, will be considered
in comparison with coal prices.
(2) Economic benefits of the introduction of CCT in the EAS region
Four anticipated benefits of the introduction of CCT—the minimisation of capital
outflow from the EAS region, environmental impact reduction benefits of CCT,
development and investment benefits of CCT, and job creation benefits of CCT—were taken
up in the previous study. Cost analysis and cost–benefit analysis for CCT introduction will
be studied this year. Sensitivity analysis for ultra-super critical (USC), super critical (SC), and
subcritical coal-fired power plants will be conducted by assuming capital cost and coal price.

3
(3) The development of a technological potential map for CCT dissemination in the EAS
region
The outline and concept of a technical potential map for the introduction of CCT
were discussed in the previous study. This year, the necessary guidelines included in the
technological potential map will be studied and formulated.
At the Working Group meeting in Jakarta, the present conditions and policies
regarding the promotion of CCT were heard and the nature of the technological potential
map was considered.

5
Chapter 2
Review of the First Study
This chapter is a review of the first-year study. However, data is updated based on
latest trends.
2-1. The Importance of Coal in the East Asia Summit Region
2-1-1. The trends of energy demand and the political positioning of coal
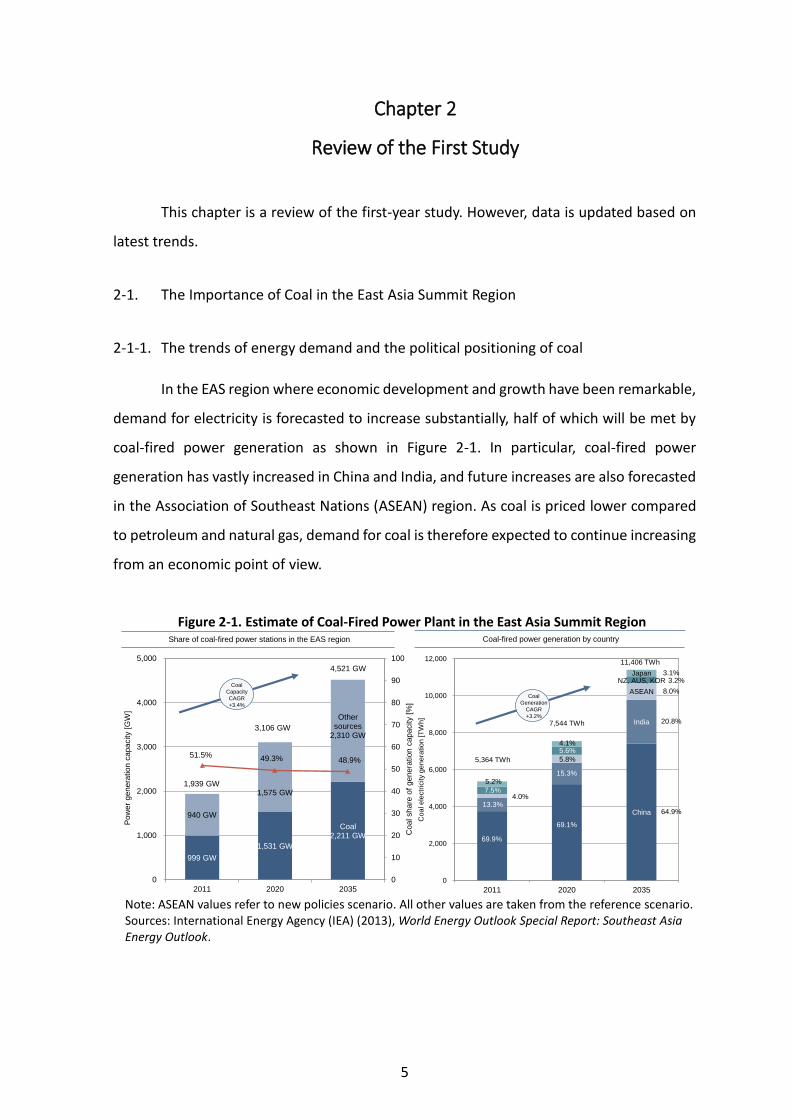
In the EAS region where economic development and growth have been remarkable,
demand for electricity is forecasted to increase substantially, half of which will be met by
coal-fired power generation as shown in Figure 2-1. In particular, coal-fired power
generation has vastly increased in China and India, and future increases are also forecasted
in the Association of Southeast Nations (ASEAN) region. As coal is priced lower compared
to petroleum and natural gas, demand for coal is therefore expected to continue increasing
from an economic point of view.
Figure 2-1. Estimate of Coal-Fired Power Plant in the East Asia Summit Region
Note: ASEAN values refer to new policies scenario. All other values are taken from the reference scenario. Sources: International Energy Agency (IEA) (2013), World Energy Outlook Special Report: Southeast Asia Energy Outlook.
999 GW
1,531 GW
Coal2,211 GW
940 GW
1,575 GW
Othersources
2,310 GW
0
10
20
30
40
50
60
70
80
90
100
0
1,000
2,000
3,000
4,000
5,000
2011 2020 2035
Coal share
of
genera
tion c
apacity
[%]
Pow
er
genera
tion c
apacity
[GW
]
51.5% 49.3% 48.9%
1,939 GW
3,106 GW
4,521 GW
China
India
ASEAN
NZ, AUS, KORJapan
0
2,000
4,000
6,000
8,000
10,000
12,000
2011 2020 2035
Coa
l e
lectr
icity g
en
era
tio
n [T
Wh
]
69.9%
69.1%
64.9%13.3%
15.3%
20.8%
4.0%
5.8%
8.0%
7.5%
5.6%
3.2%
5.2%
4.1%
3.1%
5,364 TWh
7,544 TWh
11,406 TWh
Share of coal-fired power stations in the EAS region Coal-fired power generation by country
Coal
Capacity
CAGR
+3.4%
Coal
Generation
CAGR
+3.2%
6
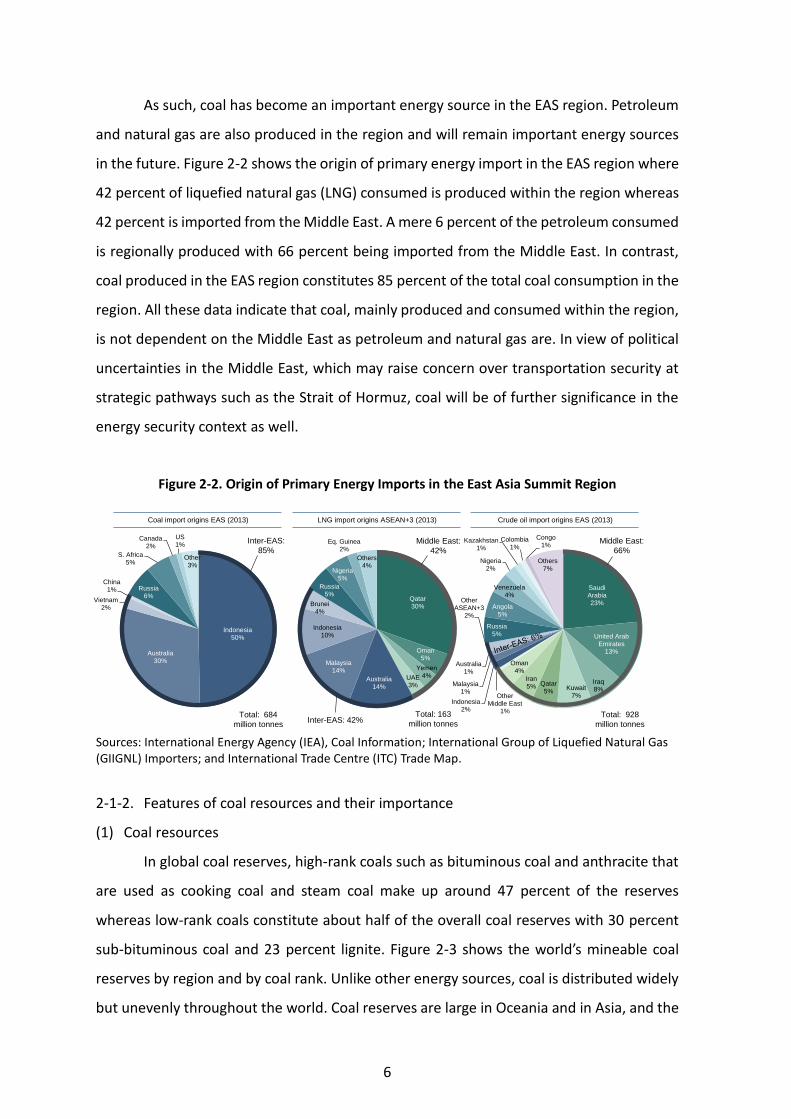
As such, coal has become an important energy source in the EAS region. Petroleum
and natural gas are also produced in the region and will remain important energy sources
in the future. Figure 2-2 shows the origin of primary energy import in the EAS region where
42 percent of liquefied natural gas (LNG) consumed is produced within the region whereas
42 percent is imported from the Middle East. A mere 6 percent of the petroleum consumed
is regionally produced with 66 percent being imported from the Middle East. In contrast,
coal produced in the EAS region constitutes 85 percent of the total coal consumption in the
region. All these data indicate that coal, mainly produced and consumed within the region,
is not dependent on the Middle East as petroleum and natural gas are. In view of political
uncertainties in the Middle East, which may raise concern over transportation security at
strategic pathways such as the Strait of Hormuz, coal will be of further significance in the
energy security context as well.
Figure 2-2. Origin of Primary Energy Imports in the East Asia Summit Region
Sources: International Energy Agency (IEA), Coal Information; International Group of Liquefied Natural Gas (GIIGNL) Importers; and International Trade Centre (ITC) Trade Map.
2-1-2. Features of coal resources and their importance
(1) Coal resources
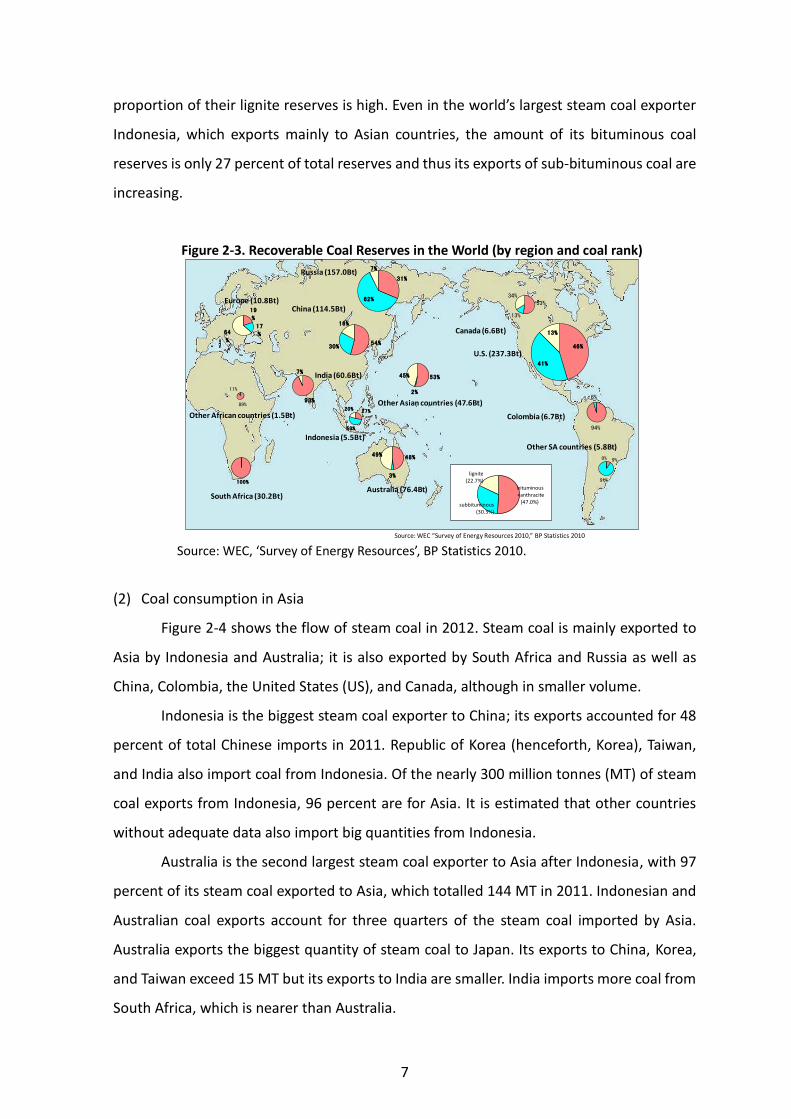
In global coal reserves, high-rank coals such as bituminous coal and anthracite that
are used as cooking coal and steam coal make up around 47 percent of the reserves
whereas low-rank coals constitute about half of the overall coal reserves with 30 percent
sub-bituminous coal and 23 percent lignite. Figure 2-3 shows the world’s mineable coal
reserves by region and by coal rank. Unlike other energy sources, coal is distributed widely
but unevenly throughout the world. Coal reserves are large in Oceania and in Asia, and the
Qatar30%
Oman5%
Yemen4%UAE
3%Australia
14%
Malaysia14%
Indonesia10%
Brunei4%
Russia5%
Nigeria5%
Eq. Guinea2%
Others4%
Indonesia50%
Australia30%
Vietnam2%
China1% Russia
6%
S. Africa5%
Canada2%
US1%
Other3%
Saudi Arabia23%
United Arab Emirates
13%
Iraq8%Kuwait
7%
Qatar5%
Iran5%
Oman4%
Other Middle East
1%
Indonesia2%
Malaysia1%
Australia 1%
Other ASEAN+3
2%
Russia5%
Angola5%
Venezuela4%
Nigeria2%
Kazakhstan1%
Colombia1%
Congo1%
Others7%
Coal import origins EAS (2013) LNG import origins ASEAN+3 (2013) Crude oil import origins EAS (2013)
Middle East:
42%
Total: 684
million tonnes
Total: 163
million tonnesInter-EAS: 42%
Inter-EAS:
85%
Total: 928
million tonnes
Middle East:
66%
7
proportion of their lignite reserves is high. Even in the world’s largest steam coal exporter
Indonesia, which exports mainly to Asian countries, the amount of its bituminous coal
reserves is only 27 percent of total reserves and thus its exports of sub-bituminous coal are
increasing.
Figure 2-3. Recoverable Coal Reserves in the World (by region and coal rank)
Source: WEC, ‘Survey of Energy Resources’, BP Statistics 2010.
(2) Coal consumption in Asia
Figure 2-4 shows the flow of steam coal in 2012. Steam coal is mainly exported to
Asia by Indonesia and Australia; it is also exported by South Africa and Russia as well as
China, Colombia, the United States (US), and Canada, although in smaller volume.
Indonesia is the biggest steam coal exporter to China; its exports accounted for 48
percent of total Chinese imports in 2011. Republic of Korea (henceforth, Korea), Taiwan,
and India also import coal from Indonesia. Of the nearly 300 million tonnes (MT) of steam
coal exports from Indonesia, 96 percent are for Asia. It is estimated that other countries
without adequate data also import big quantities from Indonesia.
Australia is the second largest steam coal exporter to Asia after Indonesia, with 97
percent of its steam coal exported to Asia, which totalled 144 MT in 2011. Indonesian and
Australian coal exports account for three quarters of the steam coal imported by Asia.
Australia exports the biggest quantity of steam coal to Japan. Its exports to China, Korea,
and Taiwan exceed 15 MT but its exports to India are smaller. India imports more coal from
South Africa, which is nearer than Australia.
Source: WEC “Survey of Energy Resources 2010,” BP Statistics 2010
94%
6%
9%
91%
0%
100%
South Africa (30.2Bt)
46%
41%
13%
U.S. (237.3Bt)
89%
11%
Other African countries (1.5Bt)
Canada (6.6Bt)
Colombia (6.7Bt)
Other SA countries (5.8Bt)
93%
7%
54%30%
16%
China (114.5Bt)
India (60.6Bt)
Indonesia (5.5Bt)
53%
2%
45%
Other Asian countries (47.6Bt)
31%
62%
7%Russia (157.0Bt)
19
%
17
%64
%
Europe (10.8Bt)
48%
3%
49%
Australia (76.4Bt)
27%
53%
20%
53%
13%
34%
bituminous+anthracite
(47.0%)
lignite (22.7%)
subbituminous (30.3%)

8
Other Asian countries import mostly from Indonesia. According to forecasts of
future coal demand, demand for energy and, in particular, electricity is expected to increase
substantially as a result of the economic growth in Asia; thus, many new coal-fired power
plants are being planned. Coal consumption for power generation is forecasted to increase
in Asia. In Viet Nam, where anthracite used to be widespread, a plan for a new plant to be
fired on blended coal, or anthracite with imported Indonesian coal, is in progress.
Figure 2-4. Flow of Steam Coal (2011 estimate)
Note: The above figure does not show flows of less than 3 MT. The blue-coloured numbers show an increase relative to the previous year and the red-coloured numbers show a decrease relative to the previous year. North America as an importer includes Mexico. Source: International Energy Agency (IEA,) Coal Information 2012.
(3) Consideration on future coal demand and supply
Demand for steam coal in Asia will increase at an annual growth rate of 2.4 percent
from 2010 to 2035, and will increase by 1.8 times from 3,730 MT to 6,652 MT during the
same period. Figure 2-5 shows a steam coal demand forecast in Asia. Steam coal demand
in China will not show such a rapid growth as it did during the 2000s. But as the demand
for electricity is expected to increase with economic growth in the future, the demand for
power generation should likewise increase. The demand in India for steam coal will increase
at an annual growth rate of 3.7 percent to 2035 due to a rapid increase in demand for power
generation. India is expected to consume up to 1,297 MT in 2035, which is a 2.5-fold
increase relative to 2010. ASEAN countries are expected to use cheap coal power in order
to meet the increasing demand for power generation; hence, coal demand will increase.
80.1Mt
Other Asia477.4Mt
OECD Europe181.5Mt
Other Europe39.7Mt
Latin America21.1Mt
22.2Mt
10.0MtMt
3.9Mt
74.2Mt262.2Mt
37.9Mt
6.8Mt
OECD Europe181.5Mt
18.9Mt
50.4Mt
56.9Mt
3.1Mt
17.7Mt
10.0Mt
China10.6Mt
Russia109.4Mt
23.9Mt
9.8Mt
South Africa71.7Mt
7.8Mt
7.3Mt
8.1Mt
5.5Mt
10.8Mt
9.6MtIndonesia308.9Mt
6.7Mt
Africa/Middle East21.4Mt
North America23.5Mt
3.5Mt
USA34.1Mt
Colombia75.4Mt
Japan121.5Mt
Canada5.9Mt
Australia144.1Mt
3.4Mt

9
Specifically, Indonesia is building a coal power generation station using low-rank coal
produced domestically. Its steam coal demand will be close to 100 MT in 2020 and further
increase to 190 MT in 2035. Steam coal demand in Viet Nam will increase to 132 MT in
2035 with the addition of coal power. The consumption of steam coal in other countries
will increase by two to three times in 2035. On the contrary, Japan, Korea, and Taiwan,
which have widely used steam coal for power generation, will still experience increases in
their demand but their growth is expected to slow down.
Figure 2-5. Steam Coal Demand Forecast in Asia
Source: Actual data is from International Energy Agency (IEA) and forecast is by Japan International Cooperation Agency (JICA).
Most of these increases in coal demand in the region are expected to be addressed
by Indonesia. Having abundant low-rank coal with low ash and low sulphur content that
offer advantages in both price and environmental compliance, Indonesia expects its low-
rank coal export to further increase in the future. Such trend has shed light on low-rank
coals that used to be regarded as non-marketable; China and India have been importing
low-rank coals with fuel efficiency mass lower than 4,000 kilocalorie/kilogram (kcal/kg),
which have now entered the market.
Korea has been expediting low-rank coal utilisation and expansion. Likewise, it has
expedited measures such as combustion improvement through blending with high-rank
coal and high efficiency clean coal technology (CCT) such as ultra super critical (USC) in
consideration of high moisture and low calorific value that low-rank coals carry.
Indonesia, the major coal supplier in the region, in recent years saw a steady
economic growth after having gone through the impact of the global financial crisis, which
has boosted its own energy demand. Indonesia was once a member of the Organization of
0
1,000
2,000
3,000
4,000
5,000
6,000
7,000
19
80
19
85
19
90
19
95
20
00
20
05
20
10
20
15
20
20
20
25
20
30
20
35
Others
India
China
(million tons)
0
100
200
300
400
500
600
700
800
900
1,000
19
80
19
85
19
90
19
95
20
00
20
05
20
10
20
15
20
20
20
25
20
30
20
35
Others
Hongkong
Vietnam
Thailand
Philippines
Malaysia
Indonesia
Taiwan
Korea
Japan
(million tons)
10
the Petroleum Exporting Countries (OPEC) as a major oil and gas producer; however, it has
shifted its energy policy towards the effective use of domestically abundant and available
energy source (i.e. coal) in view of gradually depleting oil and gas resources. To meet the
increasing demand for electricity, it is planning to build many new large-scale, coal-fired
power plants, which require a continuous supply of coal. More than 80 percent of
Indonesia’s produced coal is exported and the rest is for domestic consumption. With a
surging domestic demand by the power sector, coal export in the coming years may see a
sluggish growth as the policy to prioritise domestic supply to meet domestic demand has
come into force. It may come up as a common agenda that Asia needs a concerted
coordination towards a balanced regional demand and supply.
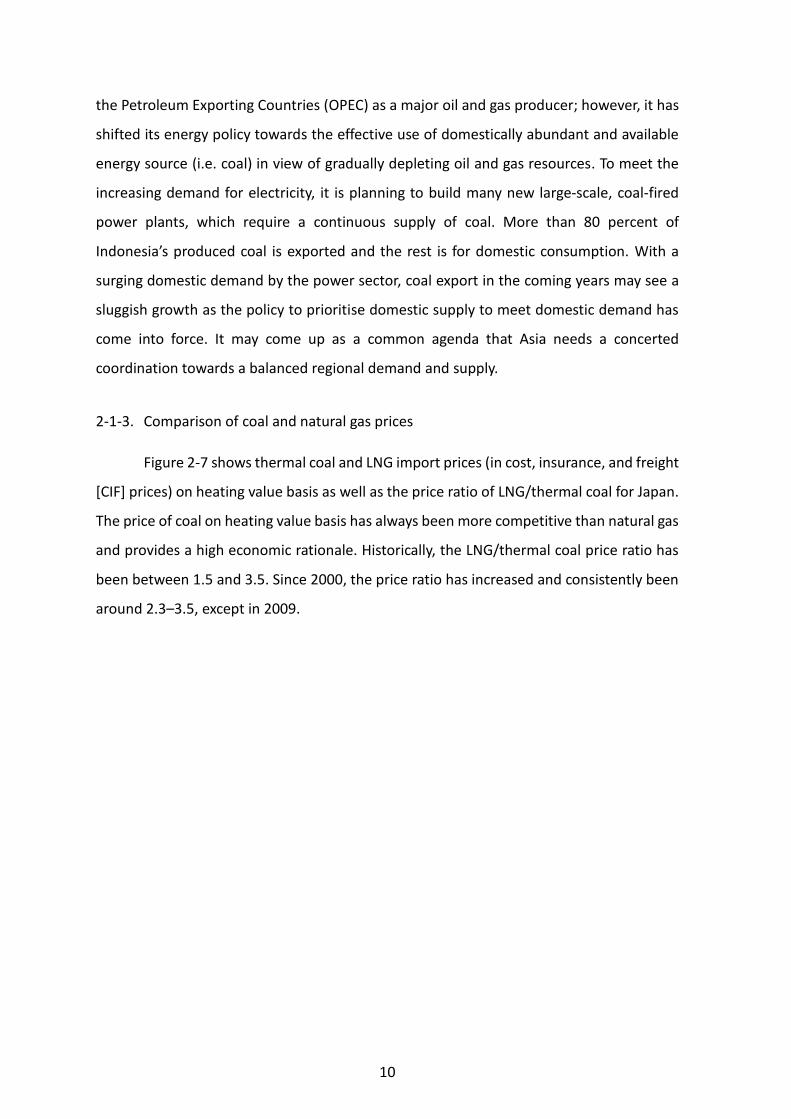
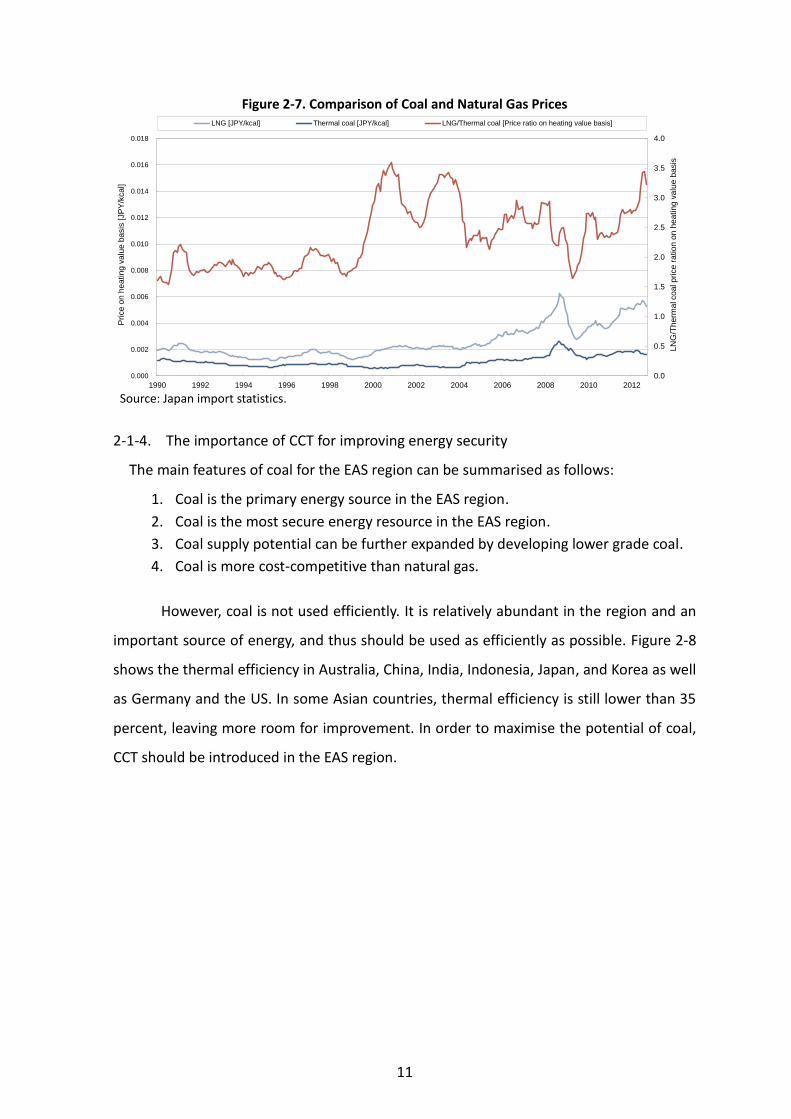
2-1-3. Comparison of coal and natural gas prices
Figure 2-7 shows thermal coal and LNG import prices (in cost, insurance, and freight
[CIF] prices) on heating value basis as well as the price ratio of LNG/thermal coal for Japan.
The price of coal on heating value basis has always been more competitive than natural gas
and provides a high economic rationale. Historically, the LNG/thermal coal price ratio has
been between 1.5 and 3.5. Since 2000, the price ratio has increased and consistently been
around 2.3–3.5, except in 2009.
11
Figure 2-7. Comparison of Coal and Natural Gas Prices
Source: Japan import statistics.
2-1-4. The importance of CCT for improving energy security
The main features of coal for the EAS region can be summarised as follows:
1. Coal is the primary energy source in the EAS region.
2. Coal is the most secure energy resource in the EAS region.
3. Coal supply potential can be further expanded by developing lower grade coal.
4. Coal is more cost-competitive than natural gas.
However, coal is not used efficiently. It is relatively abundant in the region and an
important source of energy, and thus should be used as efficiently as possible. Figure 2-8
shows the thermal efficiency in Australia, China, India, Indonesia, Japan, and Korea as well
as Germany and the US. In some Asian countries, thermal efficiency is still lower than 35
percent, leaving more room for improvement. In order to maximise the potential of coal,
CCT should be introduced in the EAS region.
0.0
0.5
1.0
1.5
2.0
2.5
3.0
3.5
4.0
0.000
0.002
0.004
0.006
0.008
0.010
0.012
0.014
0.016
0.018
1990 1992 1994 1996 1998 2000 2002 2004 2006 2008 2010 2012
LN
G/T
herm
al c
oal price
ration o
n h
eatin
g v
alu
e b
asis
Price o
n h
eatin
g v
alu
e b
asis
[JP
Y/k
cal]
LNG [JPY/kcal] Thermal coal [JPY/kcal] LNG/Thermal coal [Price ratio on heating value basis]

12
Figure 2-8. Thermal Efficiency of Coal-Fired Power Stations in Asia, Germany, and the United States
Source: International Energy Agency (IEA), 2011, Energy Balances of Organisation for Economic Co- operation and Development (OECD) Countries, Energy Balances of Non-OECD Countries.
2-2. Economic Benefits of CCT Introduction in the East Asia Summit Region
2-2-1. Application benefits of the introduction of CCT in East Asia
(1) Minimisation of capital outflow
According to forecasts in the ERIA research project titled ‘Analysis on Energy Saving
Potential in East Asia’ (hereinafter referred to as ERIA energy savings research project’),
coal is expected to remain as the main source of electricity generation; yet electricity
generation by natural gas is also expected to increase. If we assume that natural gas–fired
power stations can be replaced by coal-fired power stations, then capital outflow can be
avoided because coal is a self-sufficient natural resource in the EAS region.
Figure 2-9 displays the avoided capital outflow when new natural gas–fired power
stations are replaced with coal-fired power stations. According to the ERIA energy savings
research project, natural gas–fired power generation will increase by 2,300 terawatt-hours
(TWh) from 981 TWh/year in 2010 to 3,281 TWh/year in 2035. Based on assumptions from
the ERIA energy savings research project, the thermal efficiency of natural gas–fired power
stations is expected to increase from 44.1 percent in 2010 to 46.6 percent in 2035. In British
thermal unit (Btu), this means that natural gas consumption per year in 2035 will be 16.4
quadrillion Btu higher than in 2010.1 As analysed in the previous section, 26.1 percent of
1 The output in terawatt-hours (TWh) divided by thermal efficiency is equal to input in TWh. The conversion of
TWh to British thermal unit (Btu) is based on the IEA conversion rate of 1 TWh = 3412141.1565 million Btu
(MMBtu).
20%
25%
30%
35%
40%
45%
1991 1993 1995 1997 1999 2001 2003 2005 2007 2009
Avera
ge t
herm
al efificie
ncy,
LH
V [
%]
Australia China India Indonesia Japan Korea Germany United States
13
natural gas consumed in the EAS region cannot be supplied within the region (estimated
value in 2013) and therefore needs to be imported from outside the region, resulting in
capital outflow. At the assumed price of US$15.85/MMBtu (the LNG import price to Japan,
January 2013), capital outflow in 2010 would have been US$31.4 billion. Under the given
assumptions, capital outflow would be US$99.2 billion in 2035. Therefore, the increase in
imports from outside the EAS region is expected to increase capital outflow up to around
US$67.9 billion until 2035.
Capital outflow can be reduced by replacing natural gas–fired power stations with
coal-fired power stations. If we assume that all new natural gas–fired power stations can
be replaced by coal-fired power stations, the additional amount of coal required to
generate 2,300 TWh is around 758 MT per year2. From the utilities’ point of view, at the
assumed price of US$117.57/tonne (Thermal coal import price to Japan, January 2013), the
expected total cost for 758 MT of thermal coal would be US$89.1 billion. The total cost for
16.4 quadrillion Btu required to generate 2,300 TWh would be US$260.4 billion (at
US$15.85/MMBtu). In short, disregarding the origin of natural resources, the total savings
for utilities would be US$171.3 billion.
If we assume that all additional coal can be produced in the EAS region, savings due
to minimisation of capital outflow would be US$67.9 billion.
2 The amount of coal necessary was calculated by dividing 2,300 TWh by the thermal efficiency, which was
assumed at 43.5 percent (USC-type boiler thermal efficiency ranges from 41.5 percent–45 percent). With 1
TWh = 859845227.86 megacalorie (Mcal), and using the heating value of American Petroleum Institute (API)
6 Newcastle thermal coal at 6,000 kcal/kg, around 758 MT are necessary to generate 2,300 TWh.

14
Figure 2-9. Minimisation of Capital Outflow
Note: The definition of capital outflow is: 1 – Production (EAS region)/Consumption (EAS region). The price of natural gas assumed in this graph is US$15.85/MMBtu (LNG import price in Japan, January 2013) Sources: Compiled from the Economic Research Institute for ASEAN and East Asia (ERIA) Energy Savings Research Project; International Energy Agency (IEA) Coal Information; IEA Natural Gas Information; Japan import statistics.
(2) Environment impact reduction
Compared to other primary energy sources such as petroleum and natural gas, coal
contains more sulphur, nitrogen, and ash. These components are emitted as sulphur oxide
(SOx), nitrogen oxide (NOx), or particulate matter due to coal combustion, thereby exerting
a negative impact on the environment. As the carbon content in coal is higher than that in
petroleum or natural gas, emissions of carbon dioxide (CO2)—one of the gases that cause
global warming—are also higher than other primary energy sources. As a result, reducing
and removing such components that have an impact on the environment need to be
considered in coal utilisation.
Sulphur Oxide, Nitrogen Oxide, Particulate Matter
In the past when there were small-scale coal-fired power plants and other
combustion facilities only, emissions from coal combustion did not affect the environment
much. But the situation is now quite different due to the high and extensive growth of the
economy, and energy demand and consumption. These resulted in significant negative
impact on the natural environment and on public health caused by acid rain and particulate
4,809
Coal, 10,706
Coal increase by natural gas replacement,
2,300
Natural gas, 981
Nuclear, 1,429
Hydro, 2,231
Others, 1,366
0
5,000
10,000
15,000
20,000
25,000
2005 2010 2015 2020 2025 2030 2035
To
tal g
en
era
tio
n in
EA
S r
eg
ion
[T
Wh/a
]
4,809
Coal, 10,706
Natural gas (2010), 981
Natural gas increase, 2,300
Nuclear, 1,429
Hydro, 2,231
Others, 1,366
0
5,000
10,000
15,000
20,000
25,000
2005 2010 2015 2020 2025 2030 2035
Tota
l g
en
era
tion
in E
AS
reg
ion
[T
Wh/a
]
EAS electricity generation forecast by fuel, BAU case [TWh] Natural gas is replaced by coal scenario
2010-
2035
increase
Capital
outflow
outside EAS
Gas generation
replaced by
coal
Import
dependence
Capital
outflow
outside EAS
USD
67.9
billion
2,300
TWh
Self-
sufficient
No
increaseReplacement
by coal
Forecast Forecast
Gas
generation
increase
Import
dependence
2,300
TWh26.1%
Gas demand
increase
16.4
Quad
Btu
Coal demand
increase
758 MT
15
matters emitted along with large amounts of SOx and NOx.
Asian countries saw rapid economic development in recent years, which has
brought about industrial and environmental pollution including air and water, all of which
have become huge social issues. In addressing these issues, streamlining relevant
regulations and dissemination of key technologies are the major common agenda in the
region.
In Japan, denitrification equipment has become standard, aside from
desulphurisation equipment, to reduce NOx emissions. The desulphurisation equipment
used to be uncommon in coal-fired power plants in the Asia region because coal with low
sulphur content was then used and the number of coal-fired power plants used to be
relatively small. Recently built coal-fired power plants have desulphurisation equipment
while denitrification equipment is yet to be a standard. NOx has two types: fuel NOx is
generated by the nitrogen in the coal whereas thermal NOx is formed by the nitrogen in
the air during combustion. Thermal NOx can be reduced by using a low NOx burner, hence,
it has become widespread. However, to further reduce NOx in the future, the installation
of denitrification equipment is indispensable.
In summary, to mitigate the environmental impact caused by an increase in coal
consumption in the future, the installation of high-efficiency desulphurisation,
denitrification, and dust-collecting equipment in coal-fired power plants should be required.
Carbon Dioxide
With higher carbon content than petroleum and natural gas, coal upon combustion
generates the biggest amount of CO2 per unit among all primary energy sources. The ratio
of CO2 emitted by coal, petroleum, and natural gas is 5:4:3; the amount of CO2 emissions
per kilowatt-hour (kWh) in a coal-fired power plant is twice than in a natural gas–fired
power plant. It is necessary, therefore, to reduce the amount of coal used and improve the
efficiency of coal-fired power plants to reduce CO2 emissions. However, by using high
efficiency CCT such as USC, integrated gasification combined cycle (IGCC) and integrated
gasification fuel cell (IGFC), it is possible to reduce CO2 emissions to the level similar to that
of a petroleum-fired power plants or even less.
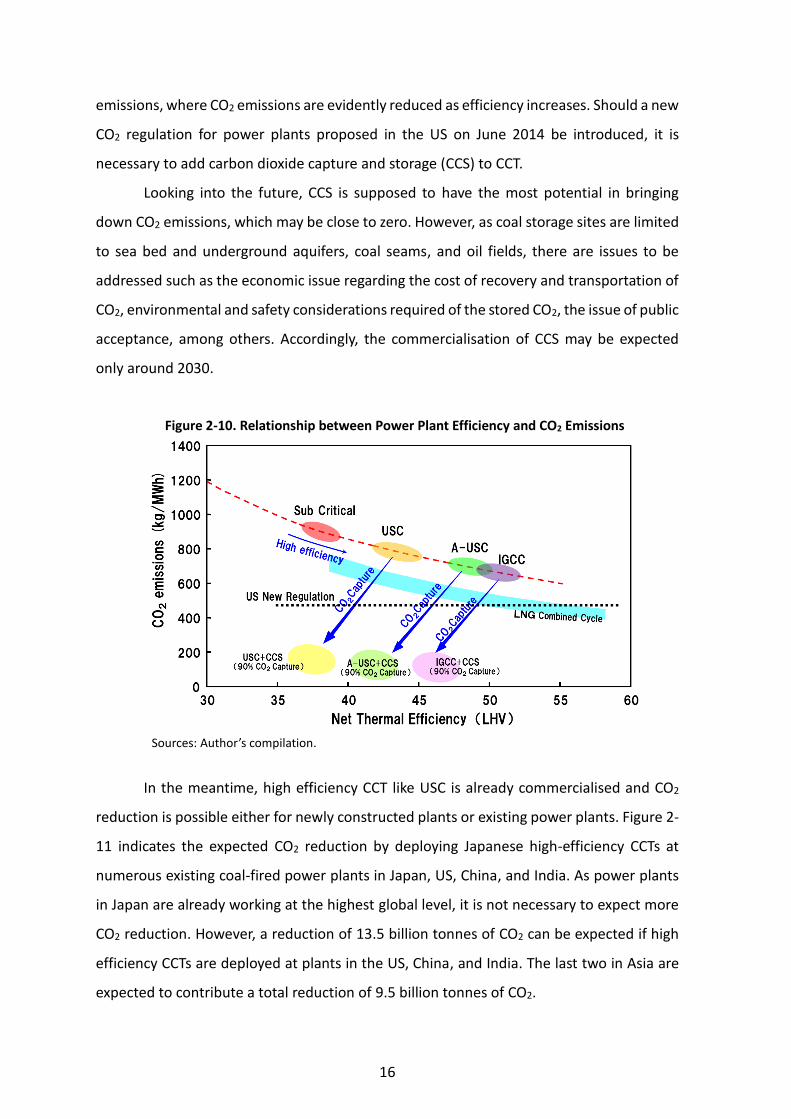
Figure 2-10 shows the connection between power generation efficiency and CO2
16
emissions, where CO2 emissions are evidently reduced as efficiency increases. Should a new
CO2 regulation for power plants proposed in the US on June 2014 be introduced, it is
necessary to add carbon dioxide capture and storage (CCS) to CCT.
Looking into the future, CCS is supposed to have the most potential in bringing
down CO2 emissions, which may be close to zero. However, as coal storage sites are limited
to sea bed and underground aquifers, coal seams, and oil fields, there are issues to be
addressed such as the economic issue regarding the cost of recovery and transportation of
CO2, environmental and safety considerations required of the stored CO2, the issue of public
acceptance, among others. Accordingly, the commercialisation of CCS may be expected
only around 2030.
Figure 2-10. Relationship between Power Plant Efficiency and CO2 Emissions
Sources: Author’s compilation.
In the meantime, high efficiency CCT like USC is already commercialised and CO2
reduction is possible either for newly constructed plants or existing power plants. Figure 2-
11 indicates the expected CO2 reduction by deploying Japanese high-efficiency CCTs at
numerous existing coal-fired power plants in Japan, US, China, and India. As power plants
in Japan are already working at the highest global level, it is not necessary to expect more
CO2 reduction. However, a reduction of 13.5 billion tonnes of CO2 can be expected if high
efficiency CCTs are deployed at plants in the US, China, and India. The last two in Asia are
expected to contribute a total reduction of 9.5 billion tonnes of CO2.

17
As discussed, high efficiency CCT utilisation at coal-fired power plants will cause
considerable effects on CO2 reduction. It is highly recommended that CCT be applied to
incoming coal-fired power plants at new sites as well as in newly replaced coal-fired power
plants under a replacement plan of existing power plants in the region.
Figure 2-11. CO2 Emission and Reduction Estimates in Coal-Fired Power Plants
Sources: International Energy Agency (IEA) (2009), World Energy Outlook; Ecofys (2010), International Comparison of Fossil Power Efficiency and CO2 Intensity.
2-2-2. Development and investment benefits
The increase in coal-fired power generation will provide ample investment
opportunities within the EAS region. The investment benefits for the EAS region are
assumed to be concentrated in new coal-fired power stations and new coal mines. In this
section, the investment benefits for coal-fired power stations and coal mines are quantified.
In reality, other investment opportunities associated with coal-fired power station
development such as investment in infrastructure will also arise.
Figure 2-12 displays the investment opportunities in coal-fired power stations and
coal mine development based on forecasts in the business as usual (BAU) case of the ERIA
energy savings research project on energy saving potential in the EAS region. In the BAU
case, electricity generated from coal per year is forecasted to increase by 5,897 TWh from
2010 to 2035. By 2035, this would require an estimated 898 gigawatt (GW) of new coal-
fired capacity across the EAS region, assuming operation at 75 percent. The costs associated
with utilising USC-type boilers are estimated at US$1.692 billion/GW to US$1.911
Source: IEA World Energy Outlook 2009,
Ecofys International Comparison of Fossil Power Ef f iciency and CO2 Intensity 2010
18
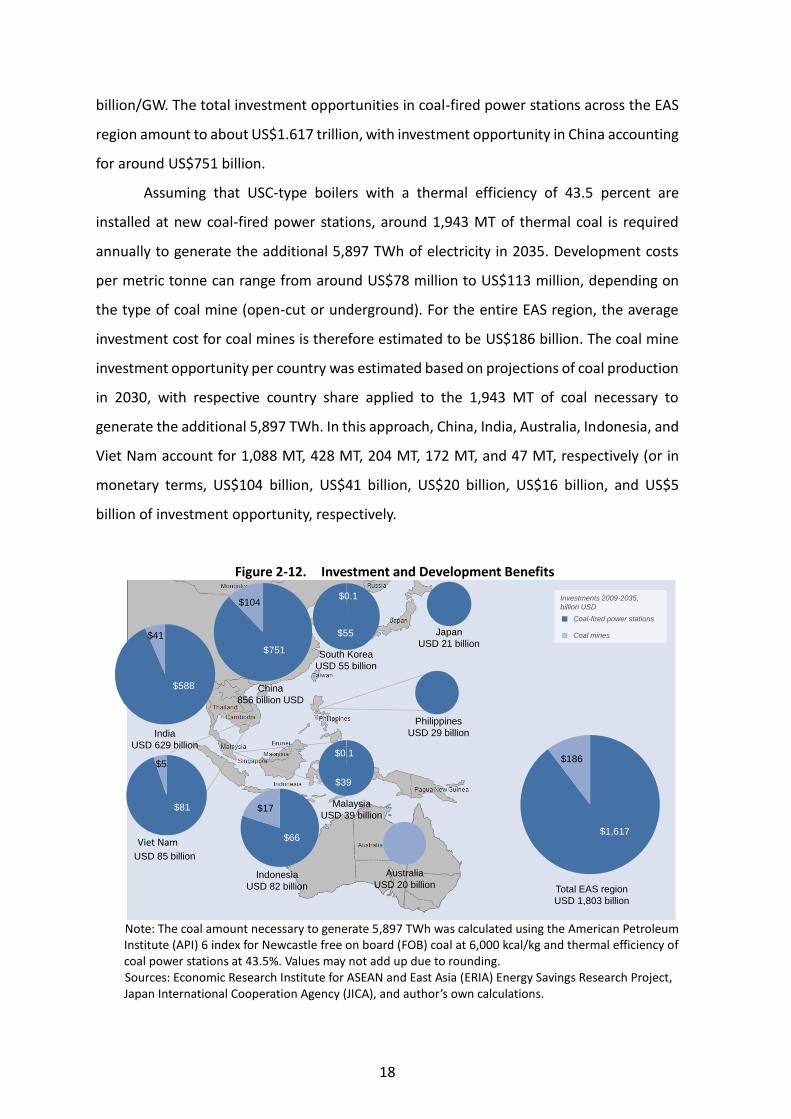
billion/GW. The total investment opportunities in coal-fired power stations across the EAS
region amount to about US$1.617 trillion, with investment opportunity in China accounting
for around US$751 billion.
Assuming that USC-type boilers with a thermal efficiency of 43.5 percent are
installed at new coal-fired power stations, around 1,943 MT of thermal coal is required
annually to generate the additional 5,897 TWh of electricity in 2035. Development costs
per metric tonne can range from around US$78 million to US$113 million, depending on
the type of coal mine (open-cut or underground). For the entire EAS region, the average
investment cost for coal mines is therefore estimated to be US$186 billion. The coal mine
investment opportunity per country was estimated based on projections of coal production
in 2030, with respective country share applied to the 1,943 MT of coal necessary to
generate the additional 5,897 TWh. In this approach, China, India, Australia, Indonesia, and
Viet Nam account for 1,088 MT, 428 MT, 204 MT, 172 MT, and 47 MT, respectively (or in
monetary terms, US$104 billion, US$41 billion, US$20 billion, US$16 billion, and US$5
billion of investment opportunity, respectively.
Figure 2-12. Investment and Development Benefits
Note: The coal amount necessary to generate 5,897 TWh was calculated using the American Petroleum Institute (API) 6 index for Newcastle free on board (FOB) coal at 6,000 kcal/kg and thermal efficiency of coal power stations at 43.5%. Values may not add up due to rounding. Sources: Economic Research Institute for ASEAN and East Asia (ERIA) Energy Savings Research Project, Japan International Cooperation Agency (JICA), and author’s own calculations.
Coal-fired power stations
Coal mines
Investments 2009-2035,
billion USD
Japan
USD 21 billion
Vietnam
USD 85 billion
South Korea
USD 55 billion
Indonesia
USD 82 billion
Australia
USD 20 billion Total EAS region
USD 1,803 billion
Malaysia
USD 39 billion
Philippines
USD 29 billionIndia
USD 629 billion
China
856 billion USD
$17
$66
$55
$0.1
$39
$0.1$5
$81
$104
$751
$41
$588
$186
$1,617Viet Nam
19
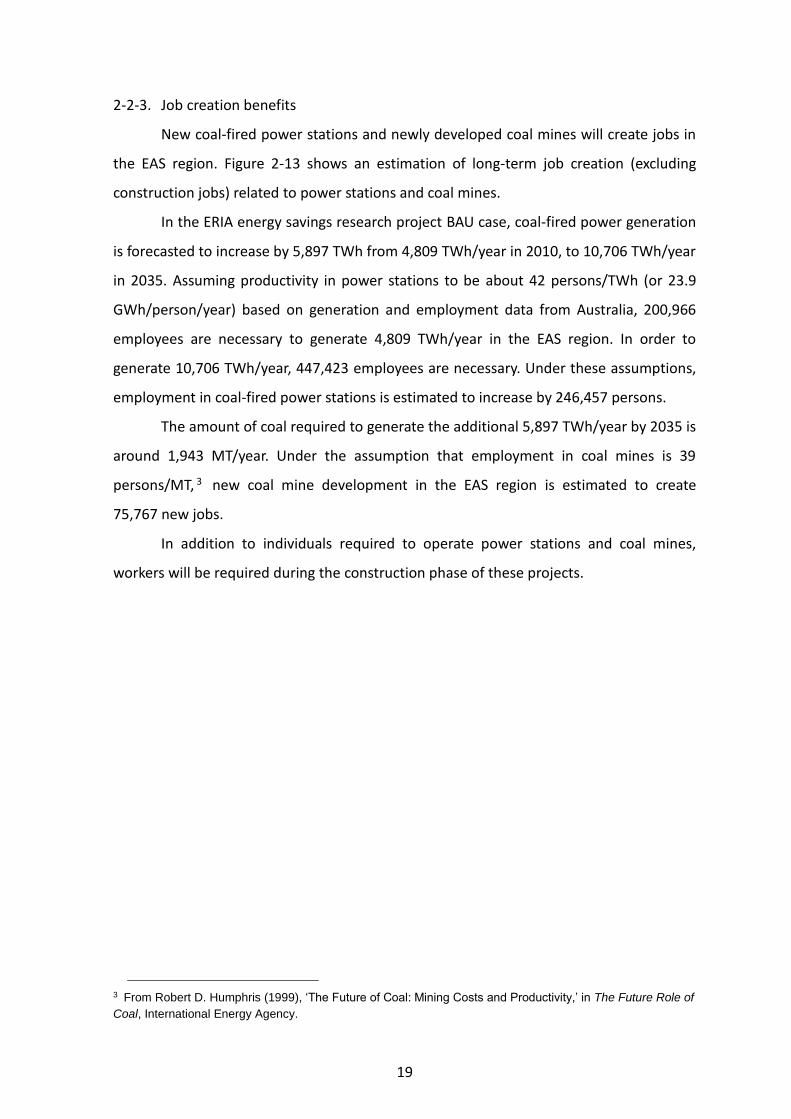
2-2-3. Job creation benefits
New coal-fired power stations and newly developed coal mines will create jobs in
the EAS region. Figure 2-13 shows an estimation of long-term job creation (excluding
construction jobs) related to power stations and coal mines.
In the ERIA energy savings research project BAU case, coal-fired power generation
is forecasted to increase by 5,897 TWh from 4,809 TWh/year in 2010, to 10,706 TWh/year
in 2035. Assuming productivity in power stations to be about 42 persons/TWh (or 23.9
GWh/person/year) based on generation and employment data from Australia, 200,966
employees are necessary to generate 4,809 TWh/year in the EAS region. In order to
generate 10,706 TWh/year, 447,423 employees are necessary. Under these assumptions,
employment in coal-fired power stations is estimated to increase by 246,457 persons.
The amount of coal required to generate the additional 5,897 TWh/year by 2035 is
around 1,943 MT/year. Under the assumption that employment in coal mines is 39
persons/MT, 3 new coal mine development in the EAS region is estimated to create
75,767 new jobs.
In addition to individuals required to operate power stations and coal mines,
workers will be required during the construction phase of these projects.
3 From Robert D. Humphris (1999), ‘The Future of Coal: Mining Costs and Productivity,’ in The Future Role of
Coal, International Energy Agency.
20
Figure 2-13. Job Creation Benefits
Note: Generation productivity is calculated as total generation excluding off-grid generation in Australia/number of employees in the power generation sector in Australia for FY 2006–2007. It was applied to the 2009 coal demand necessary for coal-fired power generation and to the 2035 coal-fired power generation to estimate the total number of employees in the EAS region. The coal mining productivity value was taken from Robert D. Humphris, ‘The Future of Coal: Mining Costs and Productivity’ from International Energy Agency (IEA) (1999), ‘The Future Role of Coal,” and applied to increased annual amount of coal required in 2035. Sources: Compiled from the ERIA Energy Savings Research Project; Bureau of Statistics, Australia; Department of Resources, Energy, and Tourism, Australia; and author’s calculations.
4,809
Coal increase,8,197
Natural gas, 981
Nuclear, 1,429 Hydro, 2,231
Others, 1,366
0
5,000
10,000
15,000
20,000
25,000
2005 2010 2015 2020 2025 2030 2035
To
tal g
en
era
tio
n in
EA
S r
eg
ion
[T
Wh/a
]
4,809
Coal increase,5,897
Natural gas, 3,281
Nuclear, 1,429
Hydro, 2,231Others, 1,366
0
5,000
10,000
15,000
20,000
25,000
2005 2010 2015 2020 2025 2030 2035
To
tal g
en
era
tio
n in
EA
S r
eg
ion
[T
Wh/a
]
Electricity generation EAS region BAU case Electricity generation EAS region natural gas replacement case
2009 -
2035
Coal
generation
increase
Employment
per TWh
Job creation
in power
stations
Coal
demand
increaseJob creation
in coal mines
5,897
TWh
42
persons246,457
persons1,943
MT
Employment
in coal mines
75,767
persons
105,315
persons2,700
MT
8,197
TWh
42
persons342,568
persons
BAU
case
Gas
replacem
ent case
Employment
per MT
39
persons
39
persons
Forecast Forecast
21
Chapter 3
Impact of Shale Gas on the Coal Market
This chapter analyses how shale gas development in the United States (US) can
affect international coal markets.
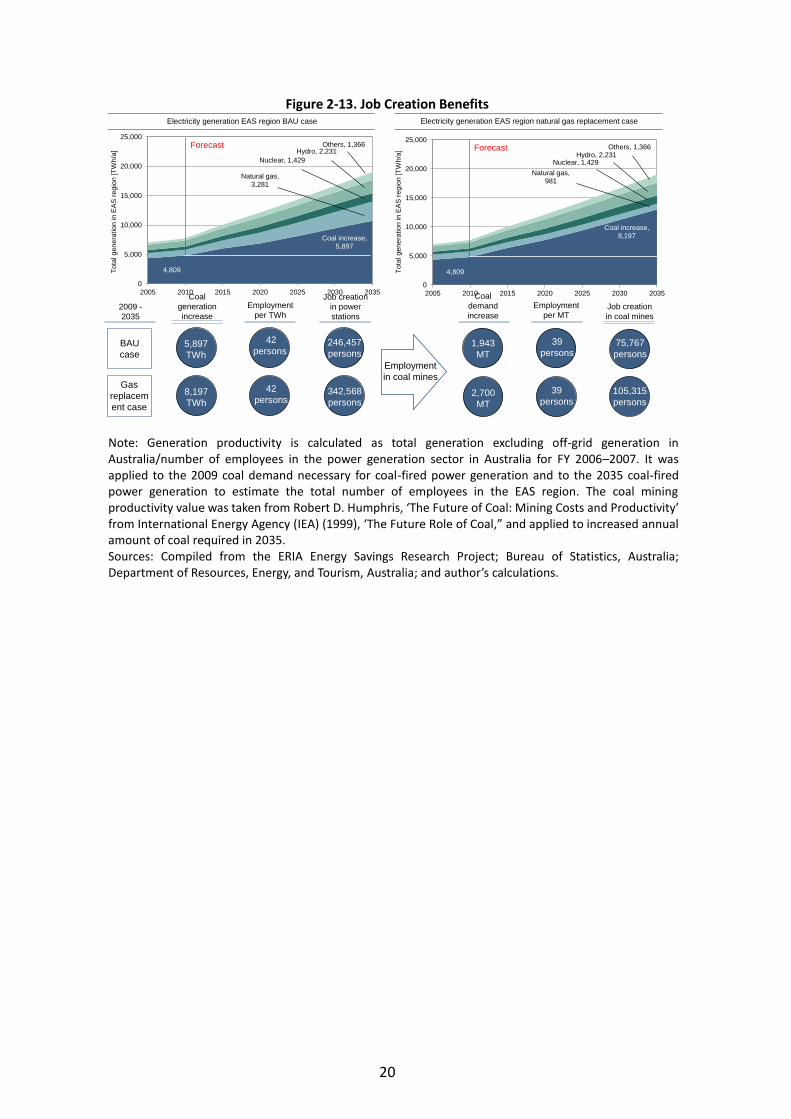
3-1. Shale Gas Impact Mechanism
The impact of shale gas development in the US is illustrated in Figure 3-1: (1) US
coal is directed at the European market; (2) an oversupply is expected in the European
market; (3) trade flows, particularly from South Africa, are diverted to India; and (4) excess
coal supply is directed at Asia.
Figure 3-1. Impact of Shale Gas Development
Source: Economic Research Institute for ASEAN and East Asia (ERIA) Energy Savings Research Project.
(1) US coal enters the European market
Figure 3-2 shows how shale gas development in the US concurred with a decrease
in domestic thermal coal demand. Between 2007 and 2012, shale gas production increased
from 1.29 trillion cubic feet (Tcf) to 10.37 Tcf. This corresponds to a compound annual
growth rate (CAGR) of 41.5 percent. At the same time, coal consumption decreased from
934.6 MT to 730.7 MT, which corresponds to a CAGR of -3.5 percent.
The rise in cost-effective natural gas supply in the US particularly affects coal from
the high-cost Appalachian basins. To maintain production levels, coal from these regions is
1. US coal is directed
at European market
2. This causes
oversupply in Europe
3. Trade flows are
diverted to India
4. Excess supply is
directed at Asia

22
increasingly aimed at export markets, particularly in Europe where it is mainly competitive.
Figure 3-2. Coal Consumption and Shale Gas Production Trends in the United States
Source: International Energy Agency (IEA) Coal Information and Energy Information Administration (EIA) statistics.
(2) Oversupply in Europe
US coal has to compete with Colombian and South African coal on a relatively
saturated European market. As a result, oversupply in the European market is expected in
the future.
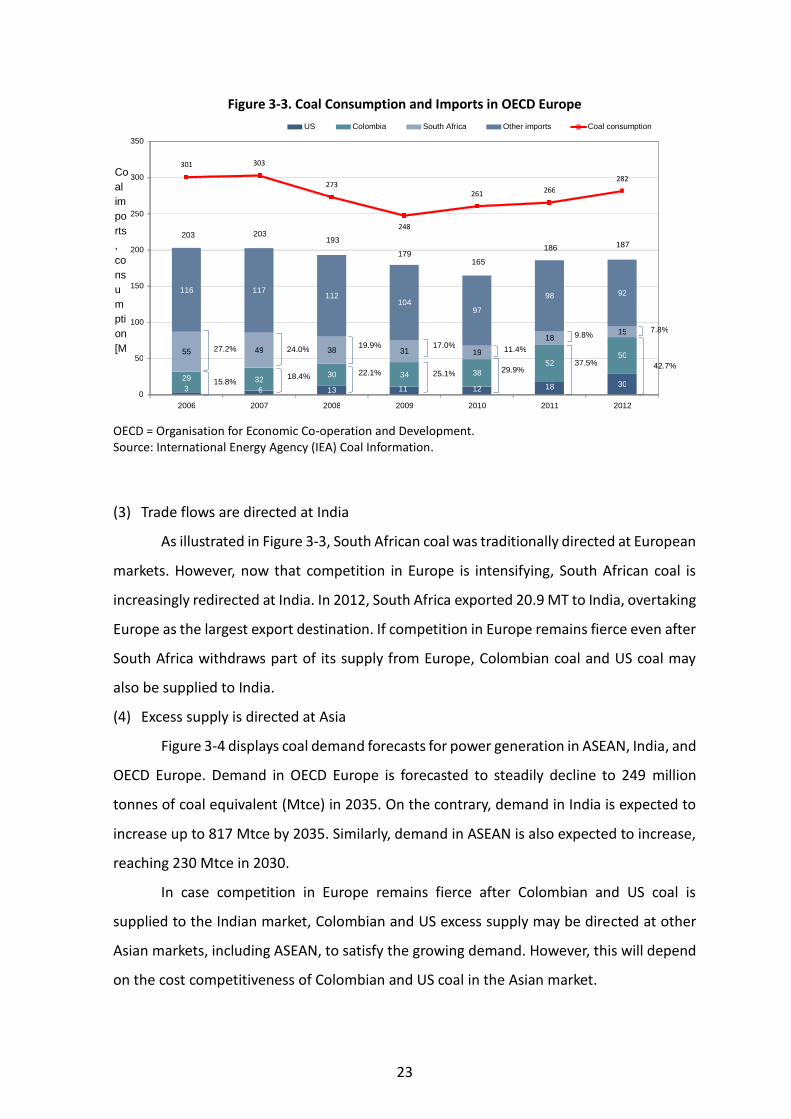
Figure 3-3 shows thermal coal consumption and imports by origin for the
Organisation for Economic Co-operation and Development (OECD) Europe between 2006
and 2012. During this period, coal consumption peaked in 2007 and reached 308 MT. After
a significant decrease in coal consumption in 2009 to 248 MT, consumption started to
recover in 2010. However, consumption did not attain pre-financial crisis levels by 2012 and
reached only 282 MT.
Total imports generally followed consumption trends but import origins are
changing. In 2006, South Africa was one of the major coal suppliers to Europe, accounting
for 27.2 percent of total imports. By 2012, South Africa’s share has shrunk to 7.8 percent.
On the contrary, imports from Colombia and the US have steadily risen. While Colombia’s
share in 2006 was only 14.1 percent, it increased to 26.9 percent in 2012. On the other
hand, US share increased from 1.7 percent in 2006 to 15.9 percent in 2012.
Shale
CAGR
+41.5%
Coal
CAGR
-3.5%920.4 934.6 931.3
839.3862.3
826.1
730.7
1.29
2.12
3.11
5.34
7.99
10.37
0
2
4
6
8
10
12
0
200
400
600
800
1,000
2006 2007 2008 2009 2010 2011 2012
Sh
ale
ga
s p
rod
uction [
tcf]
Coa
l co
nsu
mptio
n [M
T]
Coal consumption Shale gas production
Coal CAGR-3.5%
ShaleCAGR+41.5%
23
Figure 3-3. Coal Consumption and Imports in OECD Europe
OECD = Organisation for Economic Co-operation and Development. Source: International Energy Agency (IEA) Coal Information.
(3) Trade flows are directed at India
As illustrated in Figure 3-3, South African coal was traditionally directed at European
markets. However, now that competition in Europe is intensifying, South African coal is
increasingly redirected at India. In 2012, South Africa exported 20.9 MT to India, overtaking
Europe as the largest export destination. If competition in Europe remains fierce even after
South Africa withdraws part of its supply from Europe, Colombian coal and US coal may
also be supplied to India.
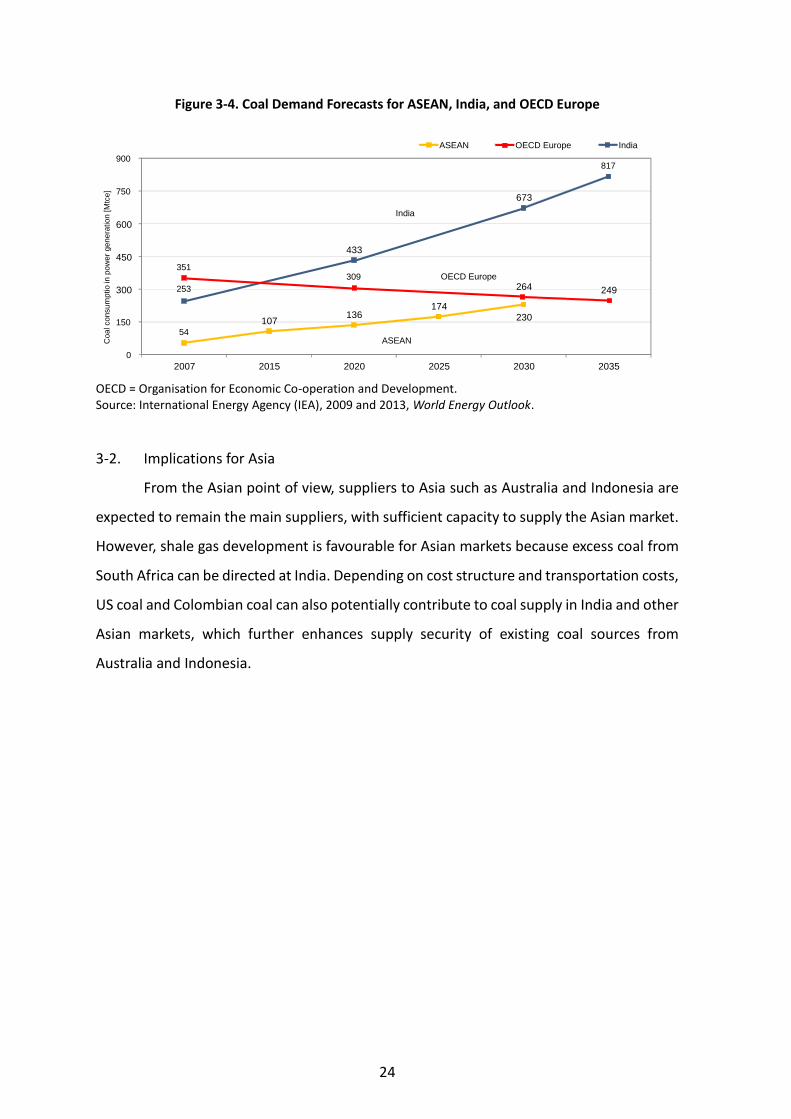
(4) Excess supply is directed at Asia
Figure 3-4 displays coal demand forecasts for power generation in ASEAN, India, and
OECD Europe. Demand in OECD Europe is forecasted to steadily decline to 249 million
tonnes of coal equivalent (Mtce) in 2035. On the contrary, demand in India is expected to
increase up to 817 Mtce by 2035. Similarly, demand in ASEAN is also expected to increase,
reaching 230 Mtce in 2030.
In case competition in Europe remains fierce after Colombian and US coal is
supplied to the Indian market, Colombian and US excess supply may be directed at other
Asian markets, including ASEAN, to satisfy the growing demand. However, this will depend
on the cost competitiveness of Colombian and US coal in the Asian market.
3 6 13 11 12 18 30 29 32 30 34 38 52
50 55 49 38 31 19 18 15
116 117 112
104 97
98 92
301 303
273
248
261 266 282
0
50
100
150
200
250
300
350
2006 2007 2008 2009 2010 2011 2012
Co
al
im
po
rts
,
co
ns
u
m
pti
on
[M
T]
US Colombia South Africa Other imports Coal consumption
203 203 193
179 165
186 187
27.2% 24.0%
15.8% 18.4%
19.9%
22.1%
17.0%
25.1%
11.4%
29.9%
9.8%
37.5%
7.8%
42.7%
24
Figure 3-4. Coal Demand Forecasts for ASEAN, India, and OECD Europe
OECD = Organisation for Economic Co-operation and Development. Source: International Energy Agency (IEA), 2009 and 2013, World Energy Outlook.
3-2. Implications for Asia
From the Asian point of view, suppliers to Asia such as Australia and Indonesia are
expected to remain the main suppliers, with sufficient capacity to supply the Asian market.
However, shale gas development is favourable for Asian markets because excess coal from
South Africa can be directed at India. Depending on cost structure and transportation costs,
US coal and Colombian coal can also potentially contribute to coal supply in India and other
Asian markets, which further enhances supply security of existing coal sources from
Australia and Indonesia.
54
107 136
174 230
351 309
264 249 253
433
673
817
0
150
300
450
600
750
900
2007 2015 2020 2025 2030 2035
Co
al co
nsu
mp
tio
in p
ow
er
gen
era
tio
n [
Mtc
e]
ASEAN OECD Europe India
ASEAN
OECD Europe
India

25
Chapter 4
Economic Benefits of the Introduction of Clean Coal Technology in
the East Asia Summit Region
4-1. Cost–benefit Analysis of USC
This chapter covers a cost–benefit analysis of ultra-supercritical (USC), supercritical
(SC), and subcritical coal-fired power plants. In this analysis, levelised cost of electricity
(LCOE) is calculated for three different coal prices.
This section outlines the general assumptions of the cost–benefit analysis. Section
4.2 explains the methodology of each cost component while Section 4.3 shows the results
of the cost–benefit analysis.
4-1-1. General assumptions for cost–benefit analysis
This section outlines the general assumptions for power plant specifications and
coal properties used in this analysis. These are summarised in Table 4-1.
Plant capacity is set at 1,000 megawatt (MW). For cash flow calculation purpose,
operation is set at 25 years with an average of utilisation rate of 80 percent. Total annual
generation is therefore 7,008 gigawatt-hours (GWh). Thermal efficiencies are set at 42.1
percent (USC), 41.1 percent (SC), and 38.2 percent (subcritical). Thermal efficiencies are
taken from New Energy and Industrial Technology Development Organization (NEDO) study
titled ‘Promotion of High-Efficiency Coal-Fired Power Stations in Indonesia’ in 2014
Coal specifications are set as follows: calorific value is 4,000 kcal/kg and CO2
emissions, adjusted from the Intergovernmental Panel on Climate Change (IPCC) default
emission factors, are 1.43 kg-CO2/kg-coal.

26
Table 4-1. General Assumptions for Cost–Benefit Analysis
Source: Author’s assumption and calculation.
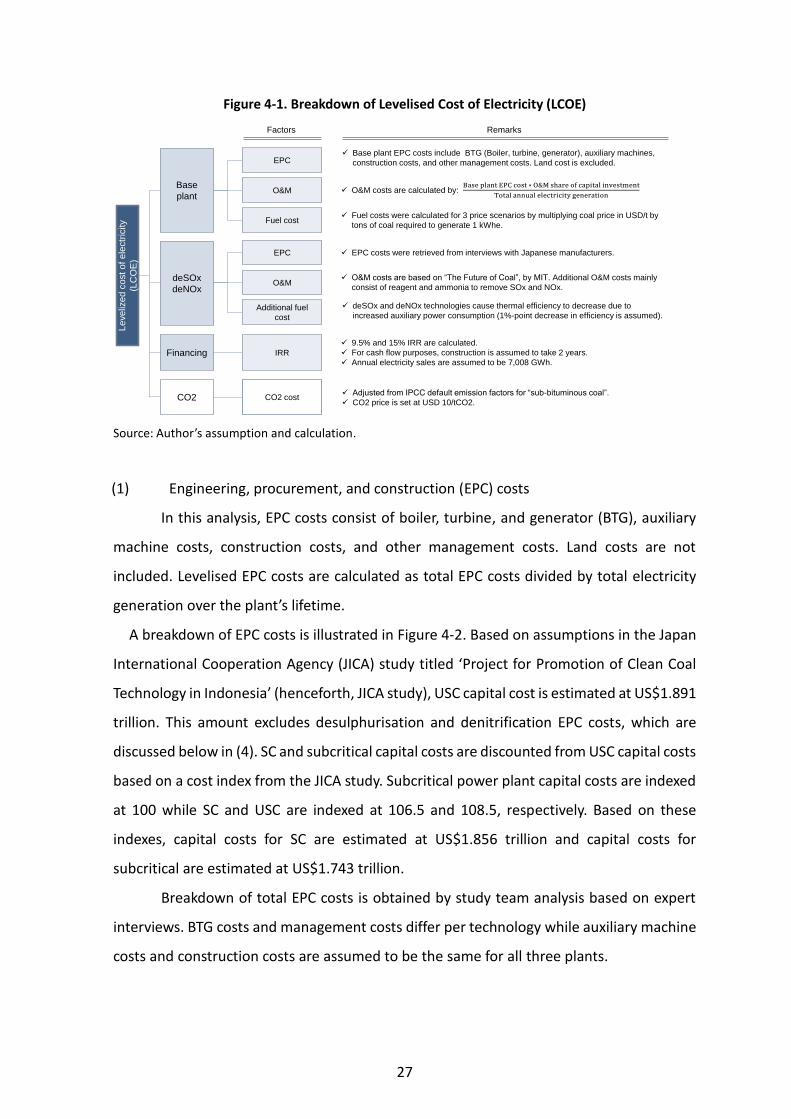
4-1-2. Cost components and calculation methodologies
This section explains the calculation methodologies for cost components included
in this analysis. A breakdown of LCOE is illustrated in Figure 4-1.
For the purpose of this analysis, LCOE consists of base plant costs, desulphurisation
and denitrification costs, and financing costs. CO2 emission costs are also calculated.
Base plant costs are divided into following costs: (1) engineering, procurement, and
construction (EPC); (2) operation and maintenance (O&M); and (3) fuel costs.
Similarly, desulphurisation and denitrification also consist of: (1) EPC costs; (2) O&M
costs; and (3) costs of additional fuel requirements.
Financing costs are calculated to generate 9.5 percent of internal rate of return (IRR)
and 15 percent IRR. Plant construction is assumed to take two years. To calculate cash flows
over operation, electricity sales are set equal to annual generation at 7,008 GWh for a
period of 25 years, as mentioned in section 0.
CO2 emission costs were calculated at US$10/tonne (t)-CO2.
Values Remarks
Plant
Capacity 1,000 MW
Operation 25 years For cash flow purposes
Operation rate 80%
Thermal
efficiencies42.1% (USC), 41.1% (SC), 38.2% (subcritical)
LHV value from NEDO study “Promotion of high-
efficiency coal-fired power stations in Indonesia”
Annual generation 7,008 GWh
Coal
specifications
Heating value 4,000 kcal/kg
CO2 emissions 1.43 kg-CO2/kg coalBased on IPCC 2006 default emission factors for
stationary combustion in the energy sector.
27
Figure 4-1. Breakdown of Levelised Cost of Electricity (LCOE)
Source: Author’s assumption and calculation.
(1) Engineering, procurement, and construction (EPC) costs
In this analysis, EPC costs consist of boiler, turbine, and generator (BTG), auxiliary
machine costs, construction costs, and other management costs. Land costs are not
included. Levelised EPC costs are calculated as total EPC costs divided by total electricity
generation over the plant’s lifetime.
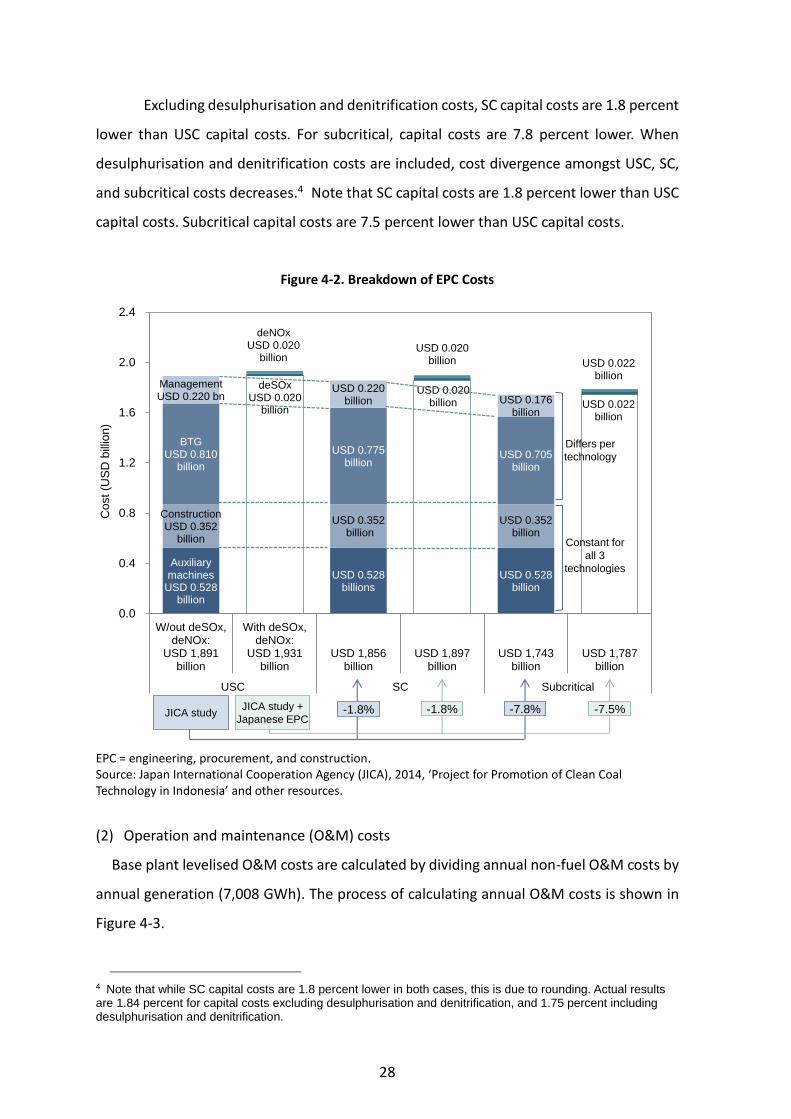
A breakdown of EPC costs is illustrated in Figure 4-2. Based on assumptions in the Japan
International Cooperation Agency (JICA) study titled ‘Project for Promotion of Clean Coal
Technology in Indonesia’ (henceforth, JICA study), USC capital cost is estimated at US$1.891
trillion. This amount excludes desulphurisation and denitrification EPC costs, which are
discussed below in (4). SC and subcritical capital costs are discounted from USC capital costs
based on a cost index from the JICA study. Subcritical power plant capital costs are indexed
at 100 while SC and USC are indexed at 106.5 and 108.5, respectively. Based on these
indexes, capital costs for SC are estimated at US$1.856 trillion and capital costs for
subcritical are estimated at US$1.743 trillion.
Breakdown of total EPC costs is obtained by study team analysis based on expert
interviews. BTG costs and management costs differ per technology while auxiliary machine
costs and construction costs are assumed to be the same for all three plants.
Le
ve
lize
d c
ost o
f e
lectr
icity
(LC
OE
)
O&M
EPC
Base
plant
CO2 cost
Remarks
Base plant EPC costs include BTG (Boiler, turbine, generator), auxiliary machines,
construction costs, and other management costs. Land cost is excluded.
EPC costs were retrieved from interviews with Japanese manufacturers.
Factors
Fuel cost
Adjusted from IPCC default emission factors for “sub-bituminous coal”.
CO2 price is set at USD 10/tCO2.
IRR
O&M
EPC
Additional fuel
cost
Fuel costs were calculated for 3 price scenarios by multiplying coal price in USD/t by
tons of coal required to generate 1 kWhe.
O&M costs are calculated by:
O&M costs are based on “The Future of Coal”, by MIT. Additional O&M costs mainly
consist of reagent and ammonia to remove SOx and NOx.
deSOx and deNOx technologies cause thermal efficiency to decrease due to
increased auxiliary power consumption (1%-point decrease in efficiency is assumed).
9.5% and 15% IRR are calculated.
For cash flow purposes, construction is assumed to take 2 years.
Annual electricity sales are assumed to be 7,008 GWh. Financing
deSOx
deNOx
CO2
28
Excluding desulphurisation and denitrification costs, SC capital costs are 1.8 percent
lower than USC capital costs. For subcritical, capital costs are 7.8 percent lower. When
desulphurisation and denitrification costs are included, cost divergence amongst USC, SC,
and subcritical costs decreases.4 Note that SC capital costs are 1.8 percent lower than USC
capital costs. Subcritical capital costs are 7.5 percent lower than USC capital costs.
Figure 4-2. Breakdown of EPC Costs
EPC = engineering, procurement, and construction. Source: Japan International Cooperation Agency (JICA), 2014, ‘Project for Promotion of Clean Coal Technology in Indonesia’ and other resources.
(2) Operation and maintenance (O&M) costs
Base plant levelised O&M costs are calculated by dividing annual non-fuel O&M costs by
annual generation (7,008 GWh). The process of calculating annual O&M costs is shown in
Figure 4-3.
4 Note that while SC capital costs are 1.8 percent lower in both cases, this is due to rounding. Actual results are 1.84 percent for capital costs excluding desulphurisation and denitrification, and 1.75 percent including desulphurisation and denitrification.
Auxiliarymachines
USD 0.528billion
USD 0.528billions
USD 0.528billion
ConstructionUSD 0.352
billion
USD 0.352billion
USD 0.352billion
BTGUSD 0.810
billion
USD 0.775billion
USD 0.705billion
ManagementUSD 0.220 bn
USD 0.220billion USD 0.176
billion
deSOxUSD 0.020
billion
USD 0.020billion USD 0.022
billion
deNOxUSD 0.020
billionUSD 0.020
billion USD 0.022billion
0.0
0.4
0.8
1.2
1.6
2.0
2.4
W/out deSOx,deNOx:
USD 1,891billion
With deSOx,deNOx:
USD 1,931billion
USD 1,856billion
USD 1,897billion
USD 1,743billion
USD 1,787billion
USC SC Subcritical
Co
st
(US
D b
illio
n)
-1.8% -7.8%-1.8% -7.5%
Constant for
all 3
technologies
JICA studyJICA study +
Japanese EPC
Differs per
technology
29
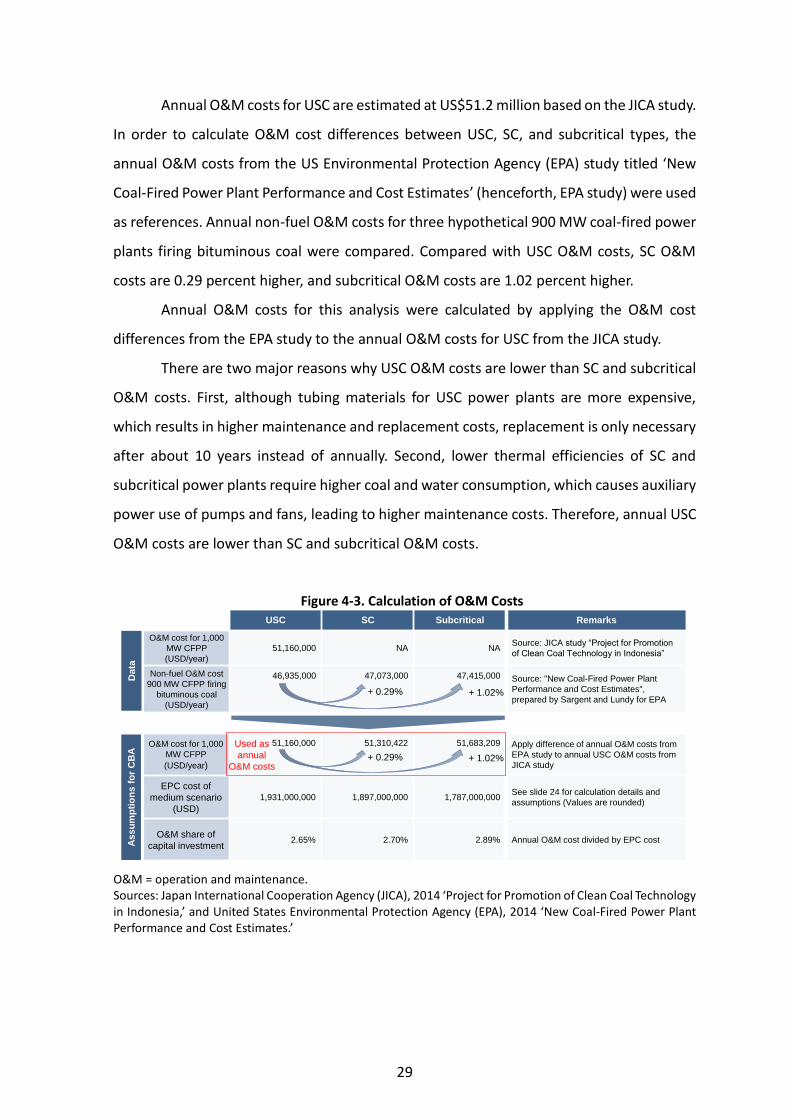
Annual O&M costs for USC are estimated at US$51.2 million based on the JICA study.
In order to calculate O&M cost differences between USC, SC, and subcritical types, the
annual O&M costs from the US Environmental Protection Agency (EPA) study titled ‘New
Coal-Fired Power Plant Performance and Cost Estimates’ (henceforth, EPA study) were used
as references. Annual non-fuel O&M costs for three hypothetical 900 MW coal-fired power
plants firing bituminous coal were compared. Compared with USC O&M costs, SC O&M
costs are 0.29 percent higher, and subcritical O&M costs are 1.02 percent higher.
Annual O&M costs for this analysis were calculated by applying the O&M cost
differences from the EPA study to the annual O&M costs for USC from the JICA study.
There are two major reasons why USC O&M costs are lower than SC and subcritical
O&M costs. First, although tubing materials for USC power plants are more expensive,
which results in higher maintenance and replacement costs, replacement is only necessary
after about 10 years instead of annually. Second, lower thermal efficiencies of SC and
subcritical power plants require higher coal and water consumption, which causes auxiliary
power use of pumps and fans, leading to higher maintenance costs. Therefore, annual USC
O&M costs are lower than SC and subcritical O&M costs.
Figure 4-3. Calculation of O&M Costs
O&M = operation and maintenance. Sources: Japan International Cooperation Agency (JICA), 2014 ‘Project for Promotion of Clean Coal Technology in Indonesia,’ and United States Environmental Protection Agency (EPA), 2014 ‘New Coal-Fired Power Plant Performance and Cost Estimates.’
USC SC Subcritical Remarks
O&M cost for 1,000
MW CFPP
(USD/year)
51,160,000 NA NASource: JICA study “Project for Promotion
of Clean Coal Technology in Indonesia”
Non-fuel O&M cost
900 MW CFPP firing
bituminous coal
(USD/year)
46,935,000 47,073,000 47,415,000 Source: "New Coal-Fired Power Plant
Performance and Cost Estimates",
prepared by Sargent and Lundy for EPA+ 0.29% + 1.02%
O&M cost for 1,000
MW CFPP
(USD/year)
51,160,000 51,310,422 51,683,209 Apply difference of annual O&M costs from
EPA study to annual USC O&M costs from
JICA study
EPC cost of
medium scenario
(USD)
1,931,000,000 1,897,000,000 1,787,000,000See slide 24 for calculation details and
assumptions (Values are rounded)
O&M share of
capital investment2.65% 2.70% 2.89% Annual O&M cost divided by EPC cost
+ 0.29% + 1.02%
Da
taA
ss
um
pti
on
s f
or
CB
A
Used as
annual
O&M costs

30
(3) Fuel Costs
In this cost–benefit analysis, LCOEs are calculated for three coal price scenarios.
Figure 4-4 displays coal prices for Indonesia’s most common markers where 4,200 kcal/kg
coal prices (from EcoCoal) are used as a reference to decide the price scenarios. From 2009
up to the first quarter of 2014, coal prices for 4,200 kcal/kg coal ranged from US$35/t to
US$63/t.
Based on this price range, price scenarios of US$40/t (low scenario), US$50/t
(medium scenario), and US$60/t (high scenario) were chosen.
Levelised fuel costs are then calculated by converting the required weight of coal to
generate one kilowatt-hour (kWh) of electricity into kcal and multiplying the result by the
price of coal per tonne.
Figure 4-4. Average Monthly Coal Prices in Indonesia (2009–2014)
Source: Directorate General of Minerals and Coal, Ministry of Energy and Mineral Resources, Indonesia.
(4) Desulphurisation and denitrification costs
Desulphurisation and denitrification costs consist of three components: EPC costs,
O&M costs and additional fuel requirements. In the final results, these three components
are aggregated to form deSOx and deNOx costs. A breakdown of these values and
calculations is illustrated in Figure 4-5, and explained below.
Desulphurisation
EPC costs for a 1,000 MW-capacity desulphurisation facility retrieved from
interviews with Japanese manufacturers were estimated at US$20 million. This value is
0
20
40
60
80
100
120
140
160
Jan Apr Jul Oct Jan Apr Jul Oct Jan Apr Jul Oct Jan Apr Jul Oct Jan Apr Jul Oct Jan Apr
Co
al p
rice
(U
SD
/to
n)
7,000 Kcal 6,700 Kcal 6,150 Kcal 5,700 Kcal 5,400 Kcal 5,000 Kcal 4,400 Kcal 4,200 Kcal
2010 2011 2012 20132009 2014
4,200 kcal/kg
31
assumed as EPC cost for USC. EPC costs for SC and subcritical are assumed to increase
accordingly due to higher coal consumption at 2.4 percent and 10.2 percent, respectively.
As a result, EPC costs for desulphurisation at an SC power plant are estimated at US$20.5
million. Similarly, for a subcritical power plant, EPC costs are estimated at US$22.0 million.
O&M costs for desulphurisation are based on a study by the Massachusetts Institute
of Technology (MIT) titled ‘The Future of Coal’ (henceforth, MIT study). In the study, O&M
costs at an SC power plant are estimated at US$0.22/kWh. Similar to EPC costs, O&M costs
are adjusted according to difference in coal consumption. For USC, O&M costs are
estimated at US$0.21/kWh, and for subcritical, O&M costs are estimated at US$0.24/kWh.
Denitrification
EPC costs for a 1,000 MW-capacity denitrification facility retrieved from interviews
with Japanese manufacturers were estimated at US$20 million. Using the same calculations
from the desulphurisation facilities, EPC costs for a denitrification unit are estimated at
US$20.5 million for an SC power plant and US$22.0 million for a subcritical plant.
O&M costs for denitrification are also based on the MIT study. In an SC power plant,
estimate is at US$0.10/kWh. Again, O&M costs are adjusted according to difference in coal
consumption. For USC, O&M costs are estimated at US$0.10/kWh, and for subcritical, O&M
costs are estimated at US$0.11/kWh.
Additional fuel costs
Installation of desulphurisation and denitrification units reduces thermal efficiency.
Based on a study for the European Commission titled ‘Efficiency and Capture-Readiness of
New Fossil Power Plants in the EU,’ this reduction of thermal efficiency is set at one percent.
Additional fuel costs associated with desulphurisation and denitrification are calculated as
levelised fuel costs at reduced thermal efficiency less levelised fuel costs from (3) above.
The total additional fuel costs for both desulphurisation and denitrification are estimated
at US$0.07/kWh for USC, US$0.08/kWh for SC, and US$0.09/kWh for subcritical. These
values are assumed to be evenly allocated among desulphurisation and denitrification.

32
Figure 4-5. Calculation Desulphurisation and Denitrification Costs
Source: Massachusetts Institute of Technology (MIT), 2013, ‘The Future of Coal.’
(5) Financing costs
Financing cost is calculated to generate 9.5 to 15 percent IRR. For cash flow
calculation purposes, the following assumptions were made: Plant construction takes two
years. Cash flow is calculated for 25 years of operation with annual electricity sales equal
to annual generation at 7,008 GWh.
Financing cost is defined as generation cost that includes non-fuel O&M cost, fuel
cost, desulphurisation costs, and denitrification costs less the price of electricity required
to generate 9.5 and 15.0 percent IRR, respectively.
(6) Carbon dioxide costs
CO2 emissions are adjusted from the IPCC default emission factors for stationary
sources in the energy sector. Of the four coal types listed, the sub-bituminous coal’s heating
value of 4,514 kcal/kg is closest to the assumed heating value used in this analysis.
Therefore, default CO2 emission factors of sub-bituminous coal were selected and adjusted
to a 4,000 kcal/kg calorific value. This results in 1.43 kg-CO2/kg-coal. Coal requirements to
generate one kWh of electricity are multiplied by this emission factor to obtain levelised
CO2 emissions per kWh.
CO2 emission cost is then set at US$10/t-CO2. This results in the following levelised
CO2 emission costs: US$0.73/kWh for USC, US$0.75/kWh for SC, and US$0.80/kWh for
USC SC Subcritical Remarks
Capital cost /1,000
MW (USD)
20,000,000 20,487,000 22,042,000 USC: Actual EPC value from Japanese manufacturer
SC: Japanese EPC value + 2.4% (higher coal demand)
Sub: Japanese EPC value + 10.2% (higher coal demand)
SC O&M costs
(USDcents/kWe)
NA 0.22 NA
Source: “The Future of Coal”, MIT.
O&M costs without
efficiency decrease
(USDcents/kWh)
0.22 0.22 0.24 MIT report value is used for SC.
USC and Subcritical values are adjusted according to coal
consumption
Capital cost /1,000
MW (USD)
20,000,000 20,486,000 22,042,000 USC: Actual EPC value from Japanese manufacturer
SC: Japanese EPC value + 2.4% (higher coal demand)
Sub: Japanese EPC value + 10.2% (higher coal demand)
SC O&M costs
(USDcents/kWh)
NA 0.10 NA
Source: “The Future of Coal”, MIT.
O&M costs without
efficiency decrease
(USDcents/kWh)
0.10 0.10 0.11 MIT report value is used for SC.
USC and Subcritical values are adjusted according to coal
consumption
Additional fuel costs
A 1%-point decrease in thermal efficiency is assumed.
Additional fuel costs were allocated evenly among deSOx
and deNOx costs.
+ 2.4% + 10.2%
de
SO
xd
eN
Ox
+ 2.4% + 10.2%
- 2.4% + 7.6%
Used as
deSOx
O&M costs
Used as
deNOx
O&M costs - 2.4% + 7.6%
(Fuel cost at reduced thermal efficiency) –
(Fuel cost at average thermal efficiency)Bo
th
33
subcritical.
However, as no CO2 price is currently implemented, CO2 emission cost is not
weighed heavily in this analysis, and mainly included as a reference.
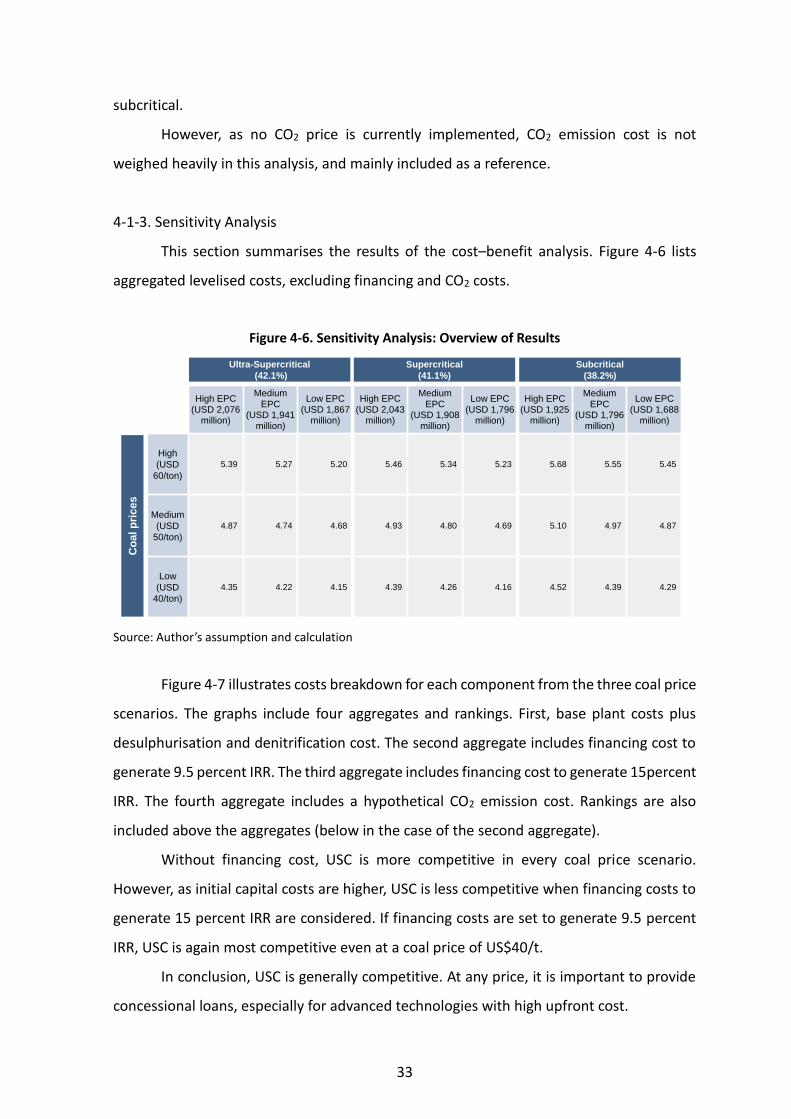
4-1-3. Sensitivity Analysis
This section summarises the results of the cost–benefit analysis. Figure 4-6 lists
aggregated levelised costs, excluding financing and CO2 costs.
Figure 4-6. Sensitivity Analysis: Overview of Results
Source: Author’s assumption and calculation
Figure 4-7 illustrates costs breakdown for each component from the three coal price
scenarios. The graphs include four aggregates and rankings. First, base plant costs plus
desulphurisation and denitrification cost. The second aggregate includes financing cost to
generate 9.5 percent IRR. The third aggregate includes financing cost to generate 15percent
IRR. The fourth aggregate includes a hypothetical CO2 emission cost. Rankings are also
included above the aggregates (below in the case of the second aggregate).
Without financing cost, USC is more competitive in every coal price scenario.
However, as initial capital costs are higher, USC is less competitive when financing costs to
generate 15 percent IRR are considered. If financing costs are set to generate 9.5 percent
IRR, USC is again most competitive even at a coal price of US$40/t.
In conclusion, USC is generally competitive. At any price, it is important to provide
concessional loans, especially for advanced technologies with high upfront cost.
High EPC(USD 2,076
million)
Medium EPC
(USD 1,941 million)
Low EPC(USD 1,867
million)
High EPC(USD 2,043
million)
Medium EPC
(USD 1,908 million)
Low EPC(USD 1,796
million)
High EPC(USD 1,925
million)
Medium EPC
(USD 1,796 million)
Low EPC(USD 1,688
million)
High
(USD
60/ton)
5.39 5.27 5.20 5.46 5.34 5.23 5.68 5.55 5.45
Medium
(USD
50/ton)
4.87 4.74 4.68 4.93 4.80 4.69 5.10 4.97 4.87
Low
(USD
40/ton)
4.35 4.22 4.15 4.39 4.26 4.16 4.52 4.39 4.29
Co
al p
rices
Ultra-Supercritical
(42.1%)
Subcritical
(38.2%)
Supercritical
(41.1%)

34
Figure 4-7. Sensitivity Analysis: Cost Breakdown Comparison at Per Coal Prices Scenario
Source: Author’s assumption and calculation.
1.08 1.06 0.990.71 0.72 0.72
3.06 3.14 3.380.26 0.27 0.29
0.15 0.150.172.02 1.99 1.88
1.50 1.47 1.380.73 0.75 0.80
0
2
4
6
8
10
12
14
EPC O&M Fuel deSOxdeNOx
FC CO2 EPC O&M Fuel deSOxdeNOx
FC CO2 EPC O&M Fuel deSOxdeNOx
FC CO2
US
Dce
nts
/kW
h
1.08 1.06 0.990.71 0.72 0.72
2.55 2.62 2.810.26 0.27 0.29
0.15 0.15 0.172.01 1.98 1.86
0.73 0.75 0.801.50 1.47 1.39
0
2
4
6
8
10
12
14
EPC O&M Fuel deSOxdeNOx
FC CO2 EPC O&M Fuel deSOxdeNOx
FC Co2 EPC O&M Fuel deSOxdeNOx
FC CO2
US
Dce
nts
/kW
h
1.08 1.06 0.990.71 0.72 0.72
2.04 2.09 2.250.26 0.27 0.29
0.15 0.15 0.172.00 1.97 1.84
1.50 1.47 1.390.73 0.75 0.80
0
2
4
6
8
10
12
14
EPC O&M Fuelcost
deSOx deNOx
Financingcost
CO2 EPC O&M Fuelcost
deSOxdeNOx
Financingcost
CO2 EPC O&M Fuelcost
deSOx deNOx
Financecost
CO2
US
Dcents
/kW
h
US
D 6
0/t
on
US
D 5
0/t
on
US
D 4
0/t
on
USC SC Subcritical
5.27 5.34 5.55
4.76 4.81 5.17
4.25 4.29 4.43
8.79 8.80 8.81
8.27 8.26 8.24
7.75 7.73 7.66
9.52 9.55 9.61
9.00 9.01 9.04
8.48 8.48 8.46
21 3
21 3
21 3
21 3
23 1
23 1
21 1
21 3
11 2
7.29
6.77
6.25
7.33
6.79
6.26
7.43
6.85
6.27
21 3
21 3
21 3

35
Chapter 5
The Development of Technological Potential Map for Clean Coal
Technology Dissemination in the East Asia Summit Region
In order to stimulate investments in highly advanced generation technologies
appropriately, several technological potential maps need to be formulated, respecting the
different stages of economic development across East Asia Summit (EAS) member countries.
Figure 5-1 shows the necessary guidelines which need to be included in the technological
potential map. By providing a technological potential map that defines feasible efficiency
levels as well as environmental performance and maintenance criteria of clean coal
technology (CCT), EAS member countries are able to select and introduce the best CCT
appropriate for their current stage of development.
Upon the completion of this research, a ‘practical’ technological potential map
including the above-mentioned items will have been developed.
Figure 5-1. The Technological Potential Map
Source: Author’s proposed road map.
Technological
potential map
Technical
Guideline
Maintenance
Guideline
Efficiency
Guideline
Bidding
Guideline
Environmental
Guideline

36
5-1. Technological Guidelines
5-1-1. Factors impacting technological guidelines
The cost–benefit analysis results provide useful insights to setting technological
guidelines for EAS countries. Table 5-1 displays results from the section on sensitivity
analysis, which shows that ultra super critical (USC) is the most cost-competitive in almost
every scenario. However, two important observations relevant to setting technological
guidelines can be made, namely, the impact of coal prices and the impact of financing cost.
Fuel costs account for the largest share of total generation cost. As fuel costs are
solely determined by coal prices, it is important to consider coal supply in EAS countries
when setting technological guidelines. Countries with high domestic coal supply can
typically procure coal at a much lower price than countries dependent on coal imports. For
the former, cost divergence of USC and subcritical is smaller compared to coal-importing
countries. As a result, USC may not be viable.
Financing costs also account for a significant share of total generation cost,
depending on internal rate of return (IRR). In this analysis, two IRRs were included. Results
show that USC loses cost-competitiveness when IRR is higher. For example, at coal prices
of USS50/ton, USC is most cost-competitive (at US$6.77/kWh) when IRR is 9 percent.
However, when IRR is increased to 15 percent, USC is less cost-competitive (at
US$8.27/kWh) than super critical (SC) and subcritical. Therefore, USC may be less viable in
countries which do not have access to low-interest loans.
A third factor, although not directly observed in the cost–benefit analysis is
electricity demand and grid capacity. Large USC units may not be viable for countries where
electricity demand is relatively low. In addition, if electricity demand is low, there may not
be enough grid capacity to accommodate a USC unit. Instead, a smaller SC unit may be
more suitable.
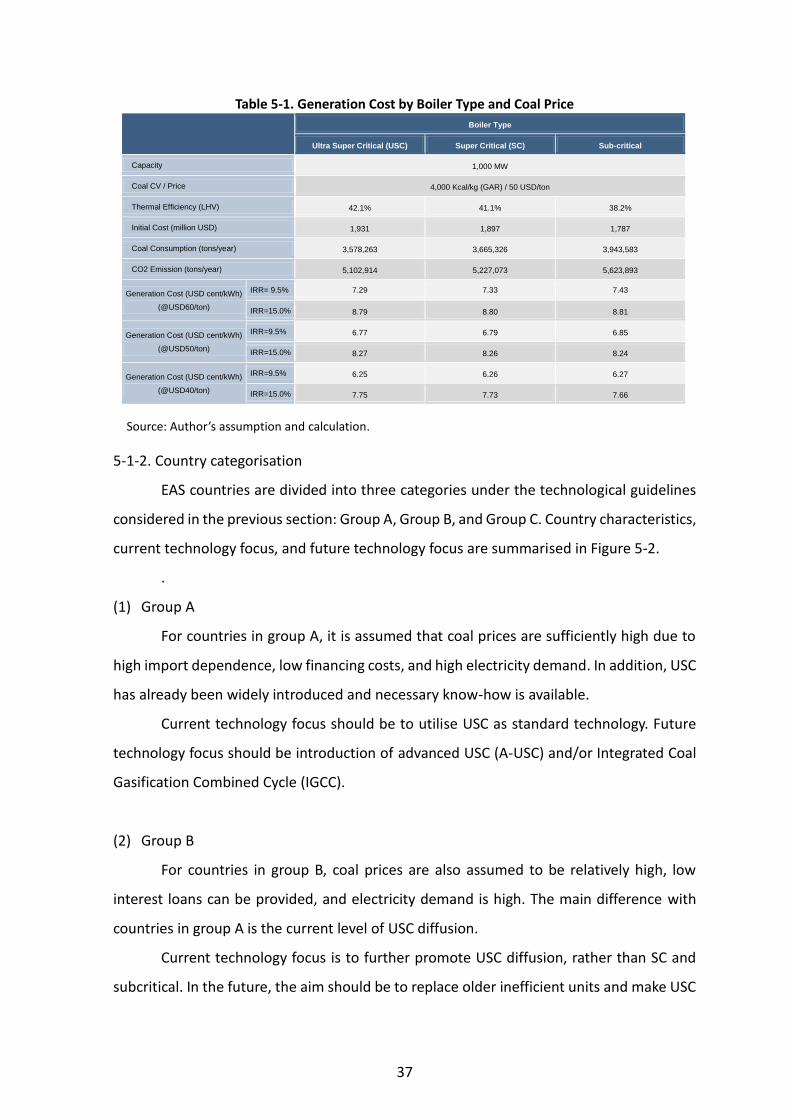
37
Table 5-1. Generation Cost by Boiler Type and Coal Price
Source: Author’s assumption and calculation.
5-1-2. Country categorisation
EAS countries are divided into three categories under the technological guidelines
considered in the previous section: Group A, Group B, and Group C. Country characteristics,
current technology focus, and future technology focus are summarised in Figure 5-2.
.
(1) Group A
For countries in group A, it is assumed that coal prices are sufficiently high due to
high import dependence, low financing costs, and high electricity demand. In addition, USC
has already been widely introduced and necessary know-how is available.
Current technology focus should be to utilise USC as standard technology. Future
technology focus should be introduction of advanced USC (A-USC) and/or Integrated Coal
Gasification Combined Cycle (IGCC).
(2) Group B
For countries in group B, coal prices are also assumed to be relatively high, low
interest loans can be provided, and electricity demand is high. The main difference with
countries in group A is the current level of USC diffusion.
Current technology focus is to further promote USC diffusion, rather than SC and
subcritical. In the future, the aim should be to replace older inefficient units and make USC
Boiler Type
Ultra Super Critical (USC) Super Critical (SC) Sub-critical
Capacity 1,000 MW
Coal CV / Price 4,000 Kcal/kg (GAR) / 50 USD/ton
Thermal Efficiency (LHV) 42.1% 41.1% 38.2%
Initial Cost (million USD) 1,931 1,897 1,787
Coal Consumption (tons/year) 3,578,263 3,665,326 3,943,583
CO2 Emission (tons/year) 5,102,914 5,227,073 5,623,893
Generation Cost (USD cent/kWh)
(@USD60/ton)
IRR= 9.5% 7.29 7.33 7.43
IRR=15.0% 8.79 8.80 8.81
Generation Cost (USD cent/kWh)
(@USD50/ton)
IRR=9.5% 6.77 6.79 6.85
IRR=15.0% 8.27 8.26 8.24
Generation Cost (USD cent/kWh)
(@USD40/ton)
IRR=9.5% 6.25 6.26 6.27
IRR=15.0% 7.75 7.73 7.66
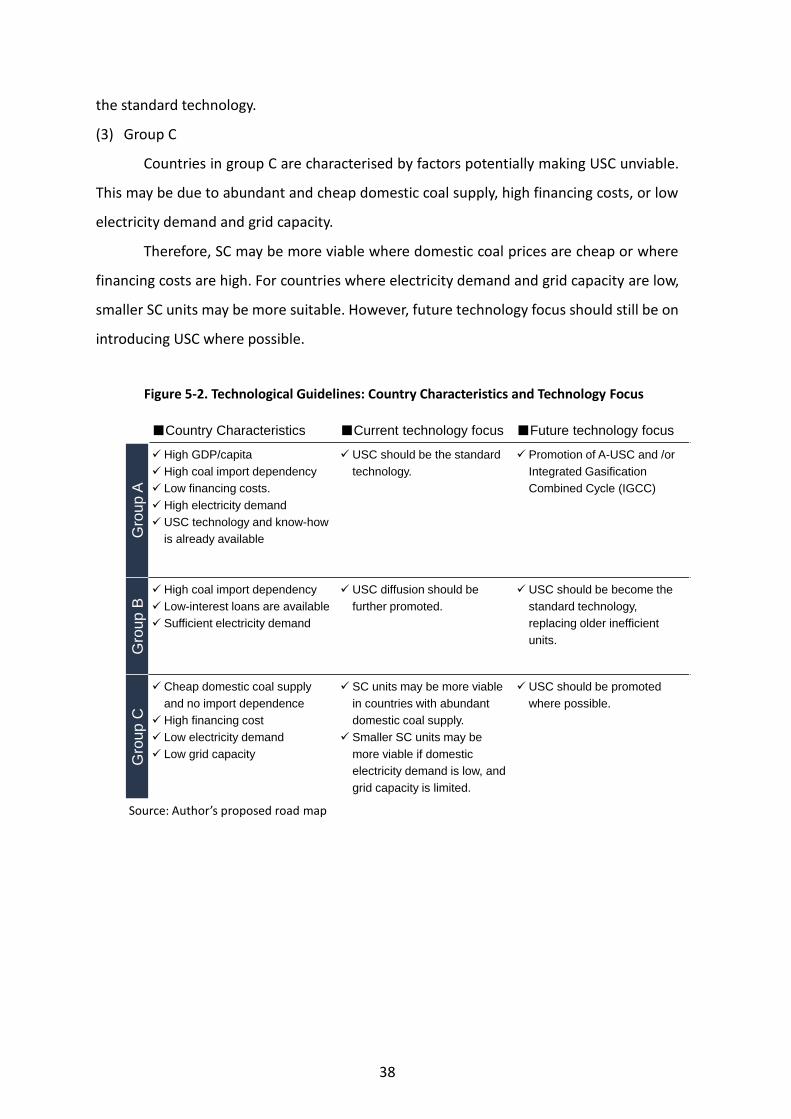
38
the standard technology.
(3) Group C
Countries in group C are characterised by factors potentially making USC unviable.
This may be due to abundant and cheap domestic coal supply, high financing costs, or low
electricity demand and grid capacity.
Therefore, SC may be more viable where domestic coal prices are cheap or where
financing costs are high. For countries where electricity demand and grid capacity are low,
smaller SC units may be more suitable. However, future technology focus should still be on
introducing USC where possible.
Figure 5-2. Technological Guidelines: Country Characteristics and Technology Focus
Source: Author’s proposed road map
■Country Characteristics ■Current technology focus ■Future technology focus
Gro
up
A
High GDP/capita
High coal import dependency
Low financing costs.
High electricity demand
USC technology and know-how
is already available
USC should be the standard
technology.
Promotion of A-USC and /or
Integrated Gasification
Combined Cycle (IGCC)
Gro
up
B
High coal import dependency
Low-interest loans are available
Sufficient electricity demand
USC diffusion should be
further promoted.
USC should be become the
standard technology,
replacing older inefficient
units.
Gro
up
C
Cheap domestic coal supply
and no import dependence
High financing cost
Low electricity demand
Low grid capacity
SC units may be more viable
in countries with abundant
domestic coal supply.
Smaller SC units may be
more viable if domestic
electricity demand is low, and
grid capacity is limited.
USC should be promoted
where possible.
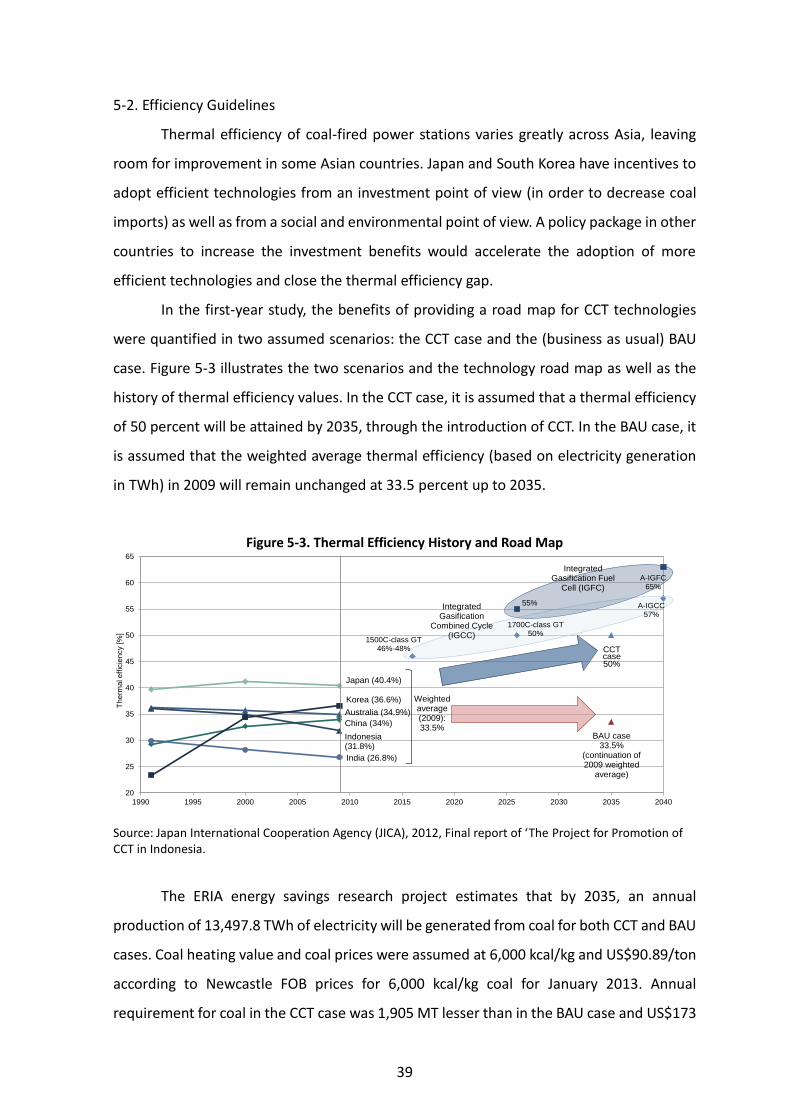
39
5-2. Efficiency Guidelines
Thermal efficiency of coal-fired power stations varies greatly across Asia, leaving
room for improvement in some Asian countries. Japan and South Korea have incentives to
adopt efficient technologies from an investment point of view (in order to decrease coal
imports) as well as from a social and environmental point of view. A policy package in other
countries to increase the investment benefits would accelerate the adoption of more
efficient technologies and close the thermal efficiency gap.
In the first-year study, the benefits of providing a road map for CCT technologies
were quantified in two assumed scenarios: the CCT case and the (business as usual) BAU
case. Figure 5-3 illustrates the two scenarios and the technology road map as well as the
history of thermal efficiency values. In the CCT case, it is assumed that a thermal efficiency
of 50 percent will be attained by 2035, through the introduction of CCT. In the BAU case, it
is assumed that the weighted average thermal efficiency (based on electricity generation
in TWh) in 2009 will remain unchanged at 33.5 percent up to 2035.
Figure 5-3. Thermal Efficiency History and Road Map
Source: Japan International Cooperation Agency (JICA), 2012, Final report of ‘The Project for Promotion of CCT in Indonesia.
The ERIA energy savings research project estimates that by 2035, an annual
production of 13,497.8 TWh of electricity will be generated from coal for both CCT and BAU
cases. Coal heating value and coal prices were assumed at 6,000 kcal/kg and US$90.89/ton
according to Newcastle FOB prices for 6,000 kcal/kg coal for January 2013. Annual
requirement for coal in the CCT case was 1,905 MT lesser than in the BAU case and US$173
20
25
30
35
40
45
50
55
60
65
1990 1995 2000 2005 2010 2015 2020 2025 2030 2035 2040
Th
erm
al e
ffic
iency
[%]
Japan (40.4%)
Korea (36.6%)
India (26.8%)
Indonesia (31.8%)
China (34%)
Australia (34.9%)
CCT case50%
BAU case33.5%
(continuation of 2009 weighted
average)
Integrated Gasification
Combined Cycle (IGCC)
Integrated Gasification Fuel
Cell (IGFC)
Weighted average (2009):33.5%
1500C-class GT46%-48%
1700C-class GT50%
A-IGCC57%
A-IGFC65%
55%

40
billion in coal procurement costs were saved per year in the CCT case. Moreover, the
reduction of coal necessary for power generation will reduce CO2 emissions. Assuming that
2.30 kg–CO2/kg-coal was emitted, a massive 4.39 billion tons of CO2 emissions can be
avoided annually.
In addition, coal consumption and CO2 emission of USC, SC, and subcritical plant
were estimated. A higher efficiency plant has less coal consumption and CO2 emissions than
lower efficiency plant.
Therefore, plant efficiency should be considered in the introduction and promotion
of CCT from both economic and environmental views.
5-3. Environmental Guidelines
5-3-1. Environmental standards
Table 5-3 gives an overview of regulations related to coal-fired power stations in
various countries in the EAS region with the European Union (EU) and the US as references.
Environmental regulations on emissions from coal-fired power stations are already in place
in most countries. The main difference is the stringency of the emission regulations with
developing countries often having less stringent regulations compared to developed
countries.
On the contrary, regulations on the thermal efficiency of coal-fired power
generators generally have not been implemented in either the developing countries or
developed countries. In liberalised markets such as Europe (and US, to some extent, and
depending on the state), the economic rationale for efficient technologies is set by the
market and therefore the most efficient and economical technologies are usually deployed.
In Asia, most markets remain regulated and coordination of policies is necessary to
promote the deployment of more advanced generation technologies.
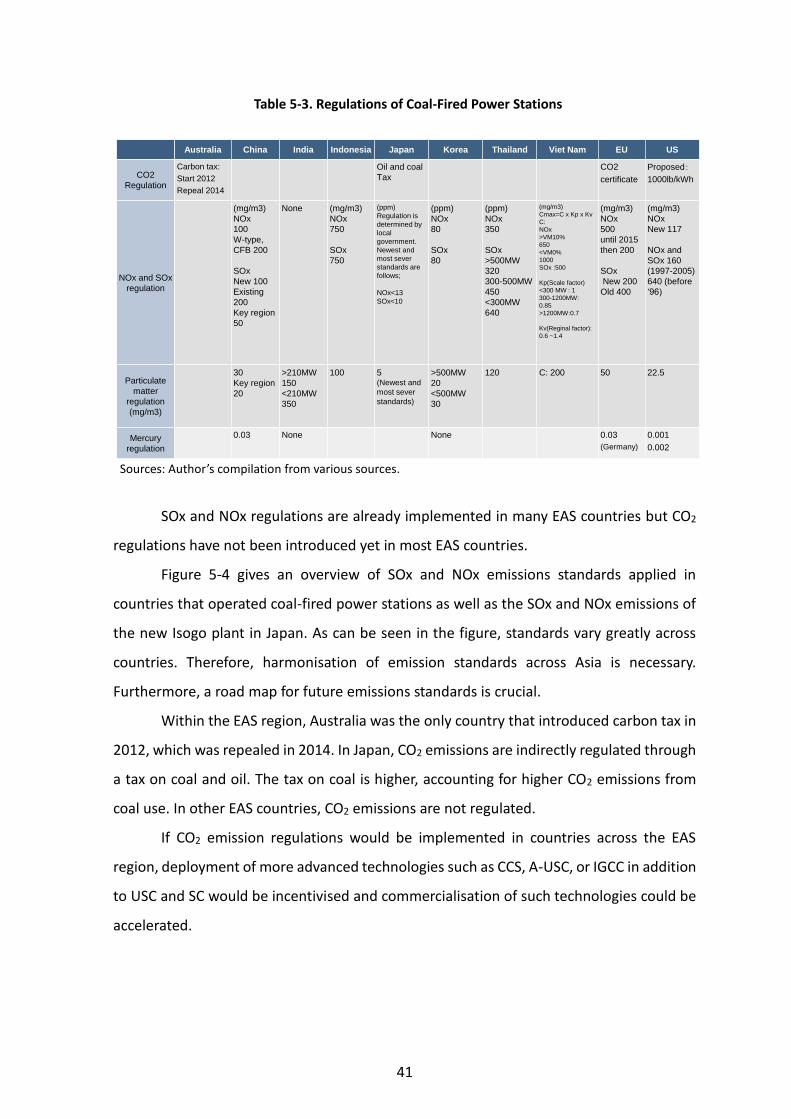
41
Table 5-3. Regulations of Coal-Fired Power Stations
Sources: Author’s compilation from various sources.
SOx and NOx regulations are already implemented in many EAS countries but CO2
regulations have not been introduced yet in most EAS countries.
Figure 5-4 gives an overview of SOx and NOx emissions standards applied in
countries that operated coal-fired power stations as well as the SOx and NOx emissions of
the new Isogo plant in Japan. As can be seen in the figure, standards vary greatly across
countries. Therefore, harmonisation of emission standards across Asia is necessary.
Furthermore, a road map for future emissions standards is crucial.
Within the EAS region, Australia was the only country that introduced carbon tax in
2012, which was repealed in 2014. In Japan, CO2 emissions are indirectly regulated through
a tax on coal and oil. The tax on coal is higher, accounting for higher CO2 emissions from
coal use. In other EAS countries, CO2 emissions are not regulated.
If CO2 emission regulations would be implemented in countries across the EAS
region, deployment of more advanced technologies such as CCS, A-USC, or IGCC in addition
to USC and SC would be incentivised and commercialisation of such technologies could be
accelerated.
Australia China India Indonesia Japan Korea Thailand Viet Nam EU US
CO2
Regulation
Carbon tax:
Start 2012
Repeal 2014
Oil and coal
Tax
CO2
certificate
Proposed:
1000lb/kWh
NOx and SOx
regulation
(mg/m3)
NOx
100
W-type,
CFB 200
SOx
New 100
Existing
200
Key region
50
None (mg/m3)
NOx
750
SOx
750
(ppm)
Regulation is
determined by
local
government.
Newest and
most sever
standards are
follows;
NOx<13
SOx<10
(ppm)
NOx
80
SOx
80
(ppm)
NOx
350
SOx
>500MW
320
300-500MW
450
<300MW
640
(mg/m3)
Cmax=C x Kp x Kv
C:
NOx
>VM10%
650
<VM0%
1000
SOx :500
Kp(Scale factor)
<300 MW : 1
300-1200MW:
0.85
>1200MW:0.7
Kv(Reginal factor):
0.6 ~1.4
(mg/m3)
NOx
500
until 2015
then 200
SOx
New 200
Old 400
(mg/m3)
NOx
New 117
NOx and
SOx 160
(1997-2005)
640 (before
‘96)
Particulate
matter
regulation
(mg/m3)
30
Key region
20
>210MW
150
<210MW
350
100 5(Newest and
most sever
standards)
>500MW
20
<500MW
30
120 C: 200 50 22.5
Mercury
regulation
0.03 None None 0.03
(Germany)
0.001
0.002
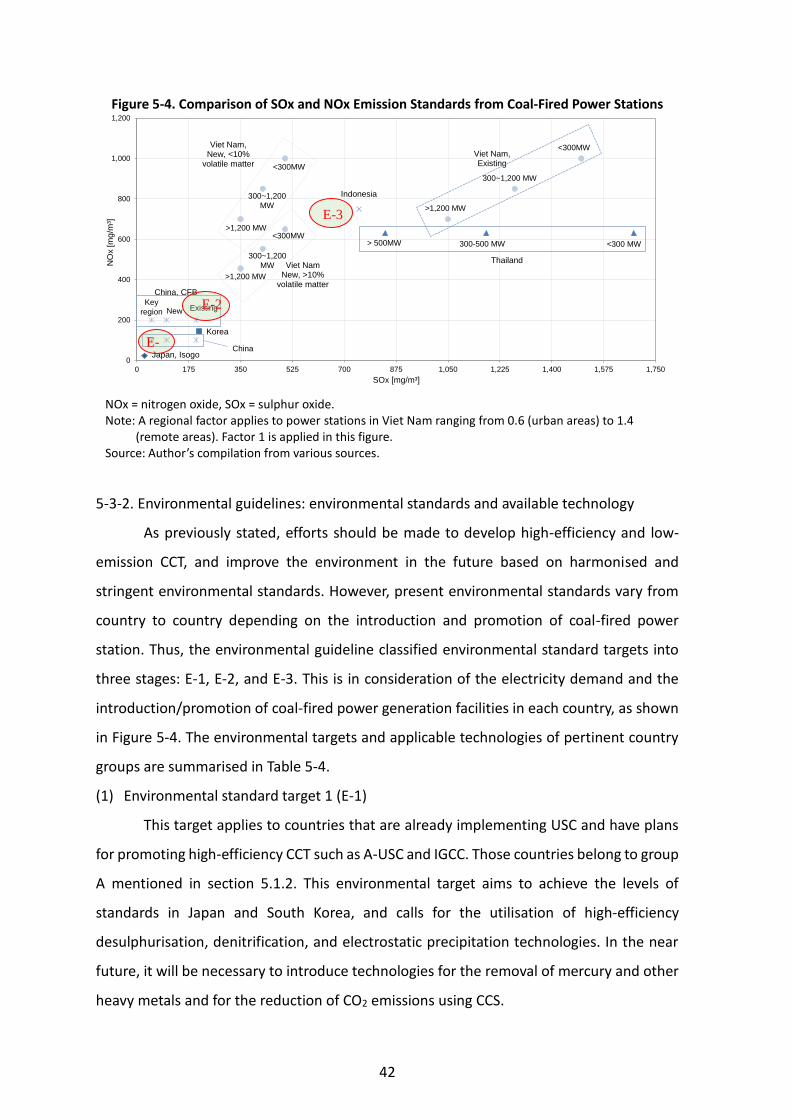
42
Figure 5-4. Comparison of SOx and NOx Emission Standards from Coal-Fired Power Stations
NOx = nitrogen oxide, SOx = sulphur oxide. Note: A regional factor applies to power stations in Viet Nam ranging from 0.6 (urban areas) to 1.4
(remote areas). Factor 1 is applied in this figure. Source: Author’s compilation from various sources.
5-3-2. Environmental guidelines: environmental standards and available technology
As previously stated, efforts should be made to develop high-efficiency and low-
emission CCT, and improve the environment in the future based on harmonised and
stringent environmental standards. However, present environmental standards vary from
country to country depending on the introduction and promotion of coal-fired power
station. Thus, the environmental guideline classified environmental standard targets into
three stages: E-1, E-2, and E-3. This is in consideration of the electricity demand and the
introduction/promotion of coal-fired power generation facilities in each country, as shown
in Figure 5-4. The environmental targets and applicable technologies of pertinent country
groups are summarised in Table 5-4.
(1) Environmental standard target 1 (E-1)
This target applies to countries that are already implementing USC and have plans
for promoting high-efficiency CCT such as A-USC and IGCC. Those countries belong to group
A mentioned in section 5.1.2. This environmental target aims to achieve the levels of
standards in Japan and South Korea, and calls for the utilisation of high-efficiency
desulphurisation, denitrification, and electrostatic precipitation technologies. In the near
future, it will be necessary to introduce technologies for the removal of mercury and other
heavy metals and for the reduction of CO2 emissions using CCS.
Korea
0
200
400
600
800
1,000
1,200
0 175 350 525 700 875 1,050 1,225 1,400 1,575 1,750
NO
x [
mg
/m³]
SOx [mg/m³]
China, CFB
Japan, Isogo
Indonesia
ThailandViet Nam
New, >10% volatile matter
Viet Nam, New, <10%
volatile matter
Viet Nam, Existing
> 500MW 300-500 MW <300 MW<300MW
300~1,200
MW
>1,200 MW
<300MW
300~1,200
MW
>1,200 MW
<300MW
300~1,200 MW
>1,200 MW
China
New ExistingKey
region
E-3
E-
12
E-2
43
(2) Environmental standard target 2 (E-2)
This target is for countries belonging to group B that are already operating coal-fired
power plant and have implemented or are planning to implement SC and/or USC. Further
deployment of USC is expected in those countries in the future. The environmental target
is to attain the level of standard in China where USC has been utilised and is being promoted.
Although desulphurisation, denitrification, and electrostatic precipitation technologies are
required to achieve the target, it is desirable to design facilities that meet the standards
with a large margin. In view of CO2 emissions reduction in the future, these countries should
consider introduction of CCS-ready power stations.
(3) Environmental standard target 3 (E-3)
This target is applicable to countries in group C that have no coal-fired power plants but
only have small-scale coal-fired power plants. However, increases in demand for electricity
are expected to spur the introduction of SC or USC in those countries. The environmental
target is to achieve the environmental standards in Thailand and Indonesia where coal-fired
power plants are already in use. Thus, desulphurisation and electrostatic precipitation
facilities are required. Although it is desirable to use denitrification facilities for NOx
reduction, employment of boilers equipped with low-NOx burners can provide the
necessary performance.
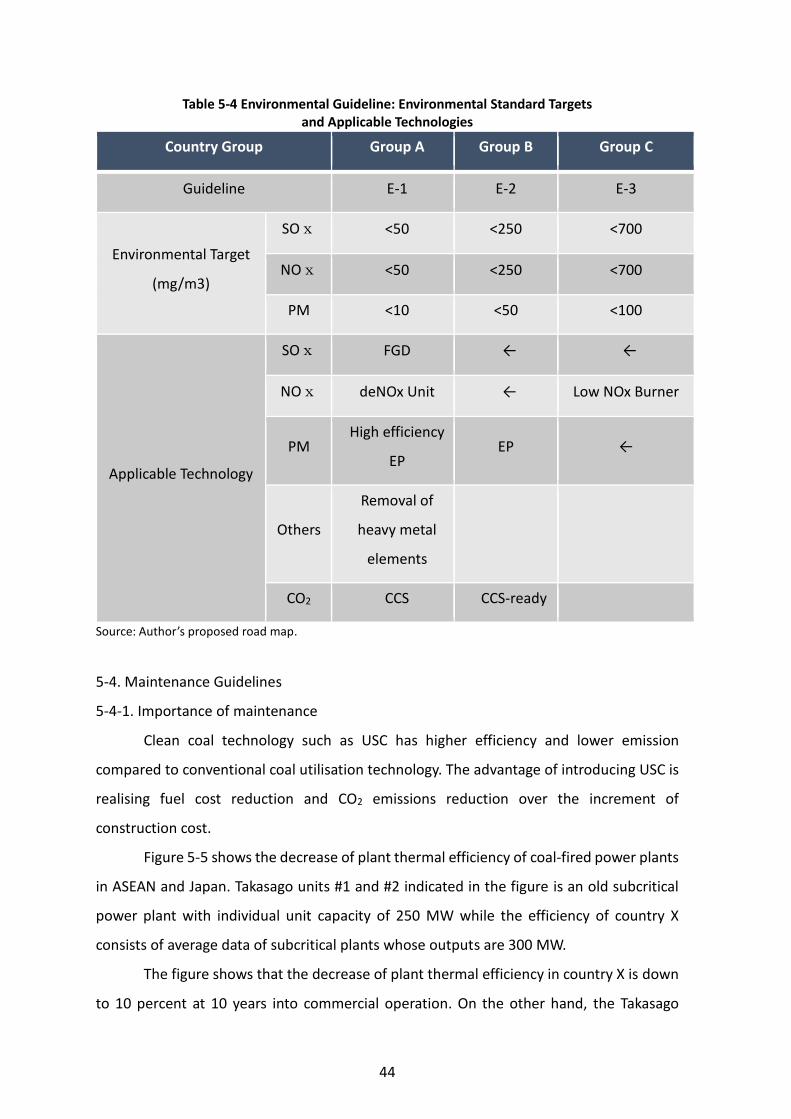
44
Table 5-4 Environmental Guideline: Environmental Standard Targets and Applicable Technologies
Country Group Group A Group B Group C
Guideline E-1 E-2 E-3
Environmental Target
(mg/m3)
SOx <50 <250 <700
NOx <50 <250 <700
PM <10 <50 <100
Applicable Technology
SOx FGD ← ←
NOx deNOx Unit ← Low NOx Burner
PM High efficiency
EP EP ←
Others
Removal of
heavy metal
elements
CO2 CCS CCS-ready
Source: Author’s proposed road map.
5-4. Maintenance Guidelines
5-4-1. Importance of maintenance
Clean coal technology such as USC has higher efficiency and lower emission
compared to conventional coal utilisation technology. The advantage of introducing USC is
realising fuel cost reduction and CO2 emissions reduction over the increment of
construction cost.
Figure 5-5 shows the decrease of plant thermal efficiency of coal-fired power plants
in ASEAN and Japan. Takasago units #1 and #2 indicated in the figure is an old subcritical
power plant with individual unit capacity of 250 MW while the efficiency of country X
consists of average data of subcritical plants whose outputs are 300 MW.
The figure shows that the decrease of plant thermal efficiency in country X is down
to 10 percent at 10 years into commercial operation. On the other hand, the Takasago
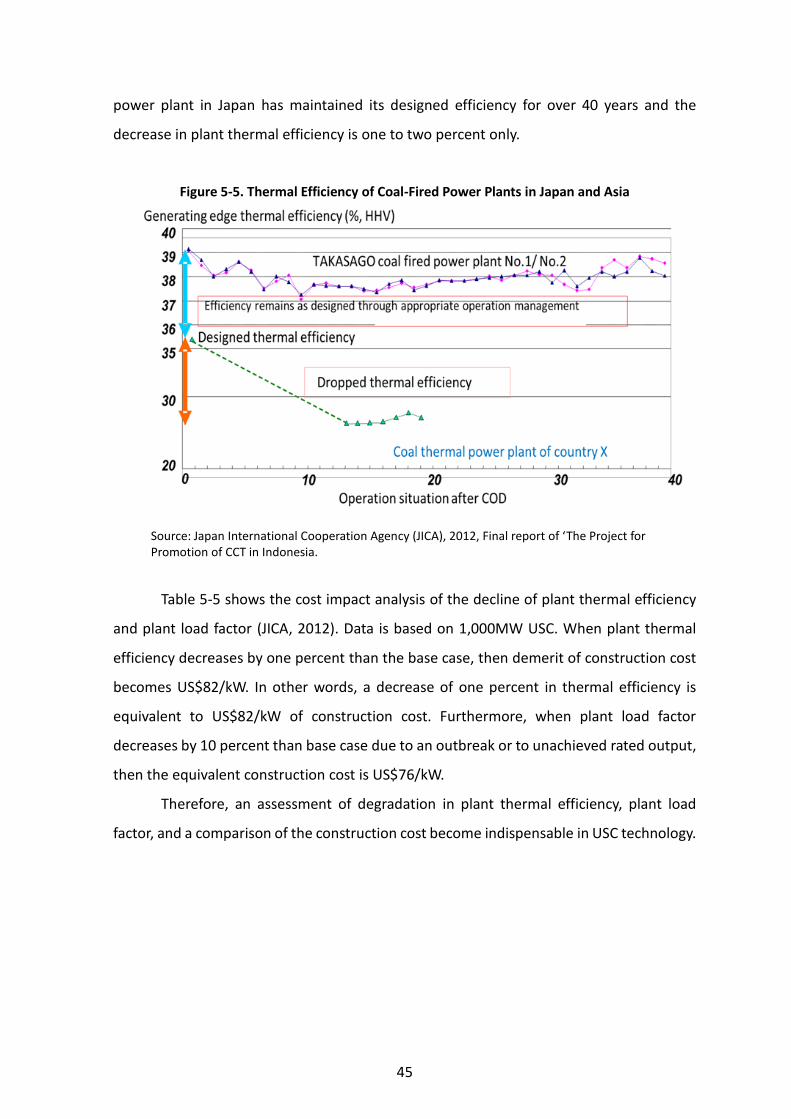
45
power plant in Japan has maintained its designed efficiency for over 40 years and the
decrease in plant thermal efficiency is one to two percent only.
Figure 5-5. Thermal Efficiency of Coal-Fired Power Plants in Japan and Asia
Source: Japan International Cooperation Agency (JICA), 2012, Final report of ‘The Project for Promotion of CCT in Indonesia.
Table 5-5 shows the cost impact analysis of the decline of plant thermal efficiency
and plant load factor (JICA, 2012). Data is based on 1,000MW USC. When plant thermal
efficiency decreases by one percent than the base case, then demerit of construction cost
becomes US$82/kW. In other words, a decrease of one percent in thermal efficiency is
equivalent to US$82/kW of construction cost. Furthermore, when plant load factor
decreases by 10 percent than base case due to an outbreak or to unachieved rated output,
then the equivalent construction cost is US$76/kW.
Therefore, an assessment of degradation in plant thermal efficiency, plant load
factor, and a comparison of the construction cost become indispensable in USC technology.
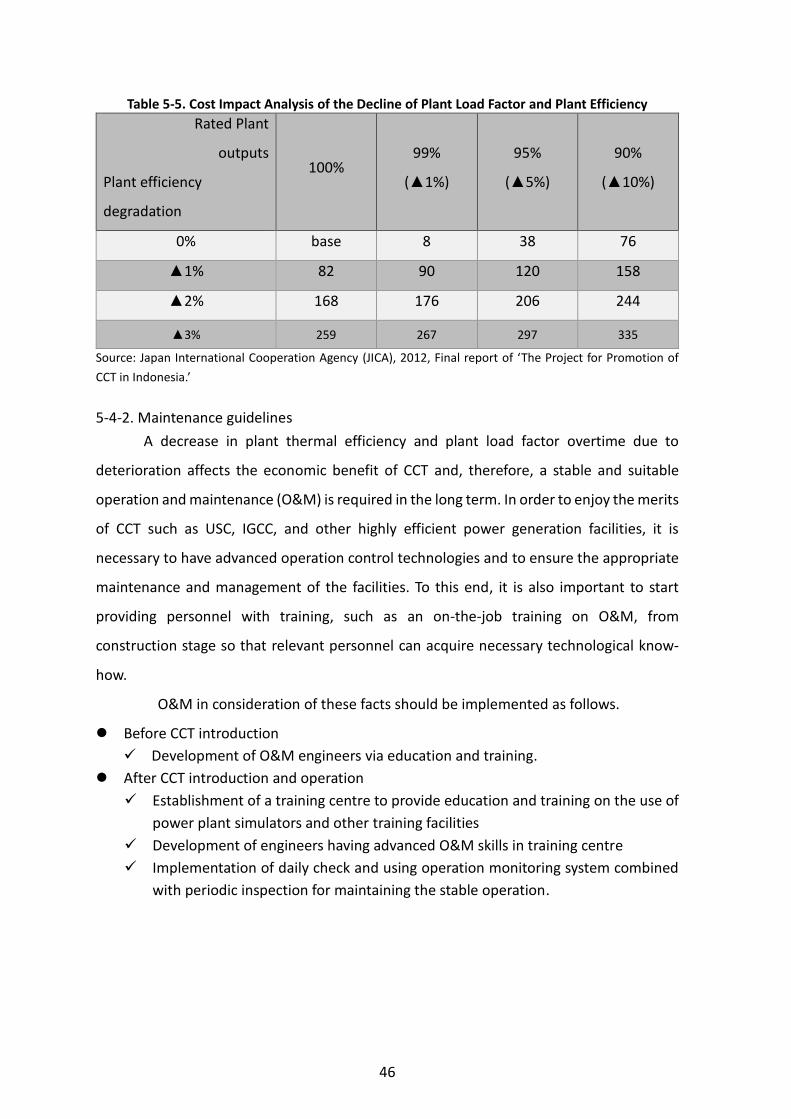
46
Table 5-5. Cost Impact Analysis of the Decline of Plant Load Factor and Plant Efficiency
Rated Plant
outputs
Plant efficiency
degradation
100% 99%
(▲1%)
95%
(▲5%)
90%
(▲10%)
0% base 8 38 76
▲1% 82 90 120 158
▲2% 168 176 206 244
▲3% 259 267 297 335
Source: Japan International Cooperation Agency (JICA), 2012, Final report of ‘The Project for Promotion of
CCT in Indonesia.’
5-4-2. Maintenance guidelines
A decrease in plant thermal efficiency and plant load factor overtime due to
deterioration affects the economic benefit of CCT and, therefore, a stable and suitable
operation and maintenance (O&M) is required in the long term. In order to enjoy the merits
of CCT such as USC, IGCC, and other highly efficient power generation facilities, it is
necessary to have advanced operation control technologies and to ensure the appropriate
maintenance and management of the facilities. To this end, it is also important to start
providing personnel with training, such as an on-the-job training on O&M, from
construction stage so that relevant personnel can acquire necessary technological know-
how.
O&M in consideration of these facts should be implemented as follows.
Before CCT introduction
Development of O&M engineers via education and training.
After CCT introduction and operation
Establishment of a training centre to provide education and training on the use of
power plant simulators and other training facilities
Development of engineers having advanced O&M skills in training centre
Implementation of daily check and using operation monitoring system combined
with periodic inspection for maintaining the stable operation.
47
5-5. Bidding Guidelines
A bidding system is generally used to select the contractor for a large-scale public
facility such as a power plant from the standpoint of fairness. In a bidding process, the
bidding winner is determined based on the results of examination of bidders' proposal
documents including cost estimations, details of design, and construction plan based on
designated technical specifications of the facility as well as the bidders' past track records.
However, the highest priority is often placed on the assessment of cost estimations.
Therefore, if a bidder with insufficient engineering capability wins a bid, various problems
can result and hinder the smooth execution of the project.
Indonesia experienced considerable delay of the two-phased national Fast Track
Power (FTP) Development Program, which was caused by prolonged period of construction,
mechanical troubles during commissioning or post-commercial operational date (COD). A
bidding policy with overwhelming priority on proposed cost rather than on technical
appropriateness of a proposal is observed to be blamed for the situation that has
ultimately affected the entire power supply security.
Seemingly high-priced, CCT is excellent in terms of efficiency and economy, and will
be able to provide a sustainable and high-efficiency operation of a power plant.
In closing, bids should consider the details and other guidelines listed below:
Apart from cost/price, technology to be employed and technical specification
(including efficiency) should be accounted for.
A minimum one-year performance guarantee period should be imposed so that
troubles during commissioning or post-COD period may be addressed.
A training centre with power plant operation simulator in combination with O&M
training at construction phase is recommended.
Cost evaluation is better conducted only after technology assessment for both
independent power producer (IPP) and private–public partnerships (PPP) projects.

49
Chapter 6
Conclusion
In this study, the importance of coal and the benefits from clean coal technology
(CCT) are discussed. In addition, a practical technological potential map is considered and
formulated. In summary:
(1) Coal is least dependent on imports from outside the EAS region.
Among fossil fuels, coal is least dependent on import from outside the EAS region,
specifically the Middle East. About 31 percent of natural gas imports and 68 percent
of oil import is from the Middle East.
(2) Coal has always been more affordable than natural gas and oil in terms of heating
value.
Historically, coal has always been around 1.5–3.5 times less expensive than natural
gas. Furthermore, coal prices are less volatile than natural gas or oil prices.
(3) Strategic use of low-rank coal creates opportunities to access half of coal reserves
in Asia.
About half of Asia’s coal reserves are low-rank coals. These reserves are largely
undeveloped but have high potential that would increase coal supply in Asia.
(4) Expansion of shale gas production has an impact on the Asian coal market.
Coals from other regions such as South Africa, US, and Colombia can potentially
contribute to coal supply in Asian markets through the expansion of shale gas
development, which can further enhance supply from existing coal sources such as
Australia and Indonesia.
50
(5) Investment opportunities and job creation in coal-fired power plants and coal mines
are possible.
An estimated 898 GW generated from a coal-fired power plant and worth a staggering
US$1.692 trillion, and 1,943 MT coal per year worth around US$300 billion in
development cost will provide ample investment opportunity. Furthermore, the
operation of power stations and coal mines provide jobs to 246,000 and 75,000
workers, respectively. Additionally, jobs in construction jobs and in other sectors not
quantified in this study can be created.
(6) EAS countries shall consider using more low-rank coals through high efficiency CCT.
Power plants fired by low-rank coals have lower thermal efficiency due to low coal
quality; however, CCT achieves high thermal efficiency and reduced CO2 emission
compared with conventional power plant. Ultra super critical (USC) is cost-
competitive but loses cost-competitiveness when the internal rate of return (IRR) is
increased. Therefore, financial support such as low-interest loans should be provided
to promote USC.
(7) A practical technological potential map for CCT dissemination in EAS region is
developed.
A concrete structure for the technological potential map for the advancement of CCT
is developed so that it can be quickly introduced to each EAS country.

51
Chapter 7
Policy Recommendations for the Strategic Usage of Coal
7-1. Clean Coal Technology for Strategic Usage of Coal
Economic development and growth in the EAS region have been remarkable and
demand for electricity is forecasted to increase substantially. In the EAS region, coal is the
more secure and affordable energy resource compared to oil and gas as its reserve is
abundant. Therefore, coal-fired power generation will continue to play a central role in
meeting an increasing electricity demand.
However, half of the regional coal resources are defined as low-rank coals. Low-rank
coal has limited use and low utilisation efficiency because of high moisture content and low
heating value. In addition, it contains higher carbon content than oil and gas because coal
upon combustion generates the biggest amount of CO2 per unit among all primary energy
sources. Considering such conditions, the introduction of clean coal technology (CCT)—
which is high efficiency, low emission, and available to low-rank coal—is indispensable. The
advantages of introducing high-efficiency CCT are fuel cost reduction and CO2 emission
reduction more than the increment of construction cost. Furthermore, based on low
emission in CCT, applicability to credit mechanism such as the joint crediting mechanism
can be considered.
In June 2013, US President Barack Obama announced ‘The President’s Climate
Action Plan,’ and upon receiving this plan, the US Environmental Protection Agency
proposed a new regulation on CO2 emission for power plant at 1,000 lb/kWh (453.6 g/kWh).
As shown in Figure 7-1, it is impossible for fossil fuel power plants to sustain this regulation
with the exception of gas-combined cycle power plant. Therefore, it will be necessary for
coal-fired power plants to adopt CCS (carbon dioxide capture and storage) technology and
high efficiency CCT in the future.
On the other hand, coal-fired power plants will continue to increase in the EAS
region as mentioned above. According to an IEA report titled ‘21st Century Coal: Advanced
Technology and Global Energy Solution’, an estimated 59 gigatons (GT) of reduced CO2
emissions from coal power plant could have been achieved had new coal units over the
past 50 years used the highest efficiency technology available when built. Therefore, high
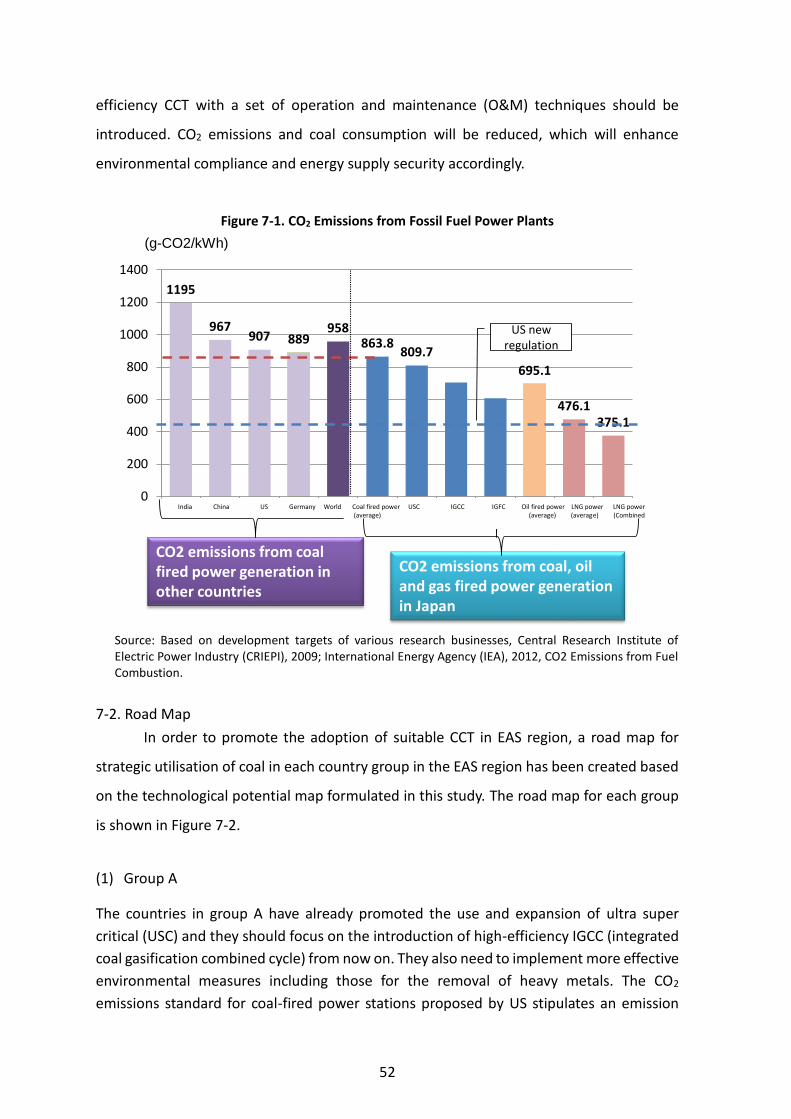
52
efficiency CCT with a set of operation and maintenance (O&M) techniques should be
introduced. CO2 emissions and coal consumption will be reduced, which will enhance
environmental compliance and energy supply security accordingly.
Figure 7-1. CO2 Emissions from Fossil Fuel Power Plants
Source: Based on development targets of various research businesses, Central Research Institute of Electric Power Industry (CRIEPI), 2009; International Energy Agency (IEA), 2012, CO2 Emissions from Fuel Combustion.
7-2. Road Map
In order to promote the adoption of suitable CCT in EAS region, a road map for
strategic utilisation of coal in each country group in the EAS region has been created based
on the technological potential map formulated in this study. The road map for each group
is shown in Figure 7-2.
(1) Group A
The countries in group A have already promoted the use and expansion of ultra super
critical (USC) and they should focus on the introduction of high-efficiency IGCC (integrated
coal gasification combined cycle) from now on. They also need to implement more effective
environmental measures including those for the removal of heavy metals. The CO2
emissions standard for coal-fired power stations proposed by US stipulates an emission
1195
967907 889
958863.8
809.7
695.1
476.1375.1
0
200
400
600
800
1000
1200
1400
インド 中国 米国 ドイツ 世界 石炭火力
(日本平均)
USC IGCC IGFC 石油火力
(日本平均)
LNG火力
(汽力)
LNG火力
(複合平均)
CO2 emissions from coal fired power generation in other countries
CO2 emissions from coal, oil and gas fired power generation in Japan
(g-CO2/kWh)
Coal fired power USC IGCC IGFC Oil fired power LNG power LNG power (average) (average) (average) (Combined
India China US Germany World
US new regulation

53
level of 1,000 lb/kWh, which is a level not achievable by USC or IGCC. Therefore, there is a
need to consider the application of CCS, which is currently under development, by 2025.
(2) Group B
Countries in Group B have coal-fired power stations that are already in operation
and will soon introduce or plan to introduce USC. The promotion of USC is expected in the
future. Because these countries’ current environmental standards are not sufficient for
future environmental protection, more stringent environmental regulations should be put
into force. Utilisation of high-efficiency CCT such as IGCC should be planned for the period
2020–2025 or later. Regarding their existing power generation facilities and newly
constructed power stations, appropriate operation and maintenance for maintaining
power generation efficiency will contribute to the reduction in operating costs, effective
utilisation of resources, and improvement of environmental protection.
(3) Group C
In these countries, only small-scale thermal power stations are operating but
relatively large power stations will be needed in the future as their economies continue to
develop and increase the demand for electricity. Those countries will need to introduce SC
or USC and set appropriate environmental standards for power stations exceeding 600 MW
in capacity. More stringent environmental standards should be established in line with the
progress of CCT promotion. At the time of introducing CCT, efforts should be made for
providing advance education and training on equipment operation and maintenance to
foster capable engineers, and ensure stable operation and maintenance of facilities.

54
Figure 7-2. Road Map for Each Country Group in the East Asia Summit Region
Source: Author’s proposed road map.
55
References
Ecofys (2010), International Comparison of Fossil Power Efficiency and CO2 Intensity. Netherlands: Ecofys.
International Energy Agency (IEA) (2013), World Energy Outlook, Special Report: Southeast Asia Energy Outlook. Paris: IEA.
International Energy Agency (IEA) (2012), Coal Information. Paris: IEA.
International Energy Agency (IEA) (2011), Energy Balances of OECD/Non-OECD Countries. Paris: IEA.
International Energy Agency (IEA) (2011), Energy Balances of Non-OECD Countries. Paris: IEA.
International Energy Agency (IEA) (2009), World Energy Outlook. Paris: IEA.
Humphris, R. (1999), ‘The Future of Coal: Mining Costs and Productivity,’ in The Future Role of Coal, Paris: IEA.
New Energy and Industrial Technology Development Organization (NEDO) (2014), ‘Promotion of High-Efficiency Coal-Fired Power Stations in Indonesia.’
Japan International Cooperation Agency (JICA) (2014), ‘Project for Promotion of Clean Coal Technology in Indonesia’. Tokyo: JICA.
United States Environmental Protection Agency (EPA) (2014), ‘New Coal-Fired Power Plant Performance and Cost Estimates.’ Washington, DC: EPA.
European Commission (2014), Efficiency and Capture-Readiness of New Fossil Power Plants in the EU.’ Brussels: European Commission.
Massachusetts Institute of Technology (MIT) (2013), ‘The Future of Coal.’ Massachusetts, US: MIT.
Japan International Cooperation Agency (JICA) (2014), Final Report of ‘The Project for Promotion of CCT in Indonesia.’ Tokyo: JICA.
