study on the structure of safety performance indicators for - easts
TRANSCRIPT
Study on the Structure of Safety Performance Indicators for Airline
Companies
Sunghoon KIM a, Simon OH
b, Jonghae SUH
c, Kyungsoo YU
d, and Hawsoo YEO
e
a,b,c Department of Civil and Environmental Engineering, Korea Advanced Institute
of Science and Technology, Daejeon, 305-701, Korea a E-mail: [email protected]
b E-mail: [email protected]
c E-mail: [email protected]
d Office of Civil Aviation, Ministry of Land, Transport and Maritime Affairs,
Gwacheon, 427-040, Korea; E-mail: [email protected] e Same as the first author; E-mail: [email protected]
Abstract: Safety performance measurement of an airline company is the objective evidence
providing how well the organization is executing its own safety management system (SMS),
which should cooperate deeply with State safety program (SSP). In order to appropriately
measure the safety performances of airline companies, studies on building an appropriate
structure of safety performance indicators (SPIs) is required as the first step. This study
reviews on the definition and required characteristics of SPIs, structures of SPIs guided in
some fields other than aviation, and recommendations from the ICAO about safety
performance measurement. Then, a structure of SPIs expressing safety performance in flight
operation of an airline is proposed. It has a hierarchical structure that is composed with “event
level SPIs,” “flight phase level SPIs,” and an “organizational level SPI.” Some
recommendations on selecting the lists of both event and flight phase level indicators are
provided as well.
Keywords: Safety Performance Indicator, Safety Performance Target, Safety Performance
Measurement, Safety Management System, State Safety Program
1. INTRODUCTION
1.1 Background of State Safety Program and Safety Performance Indicator
As a part of the incredible progress of civilization towards globalization in twentieth century,
air transportation has been glaringly developed with continuous increase of air traffic.
However, due to the physically limited airspace and increase in the complexity of aviation
system, the increase of air traffic during the recent decades has caused the increase of
congestion rate, as well as the increase of number of accidents. Despite the improvements in
both technical factors (e.g. jet engines, radar, and etc.) and human factors (e.g. crew resource
management, line-oriented flight training, and etc.), the accident rate in air transportation
during the recent years did not show much of declining trend. The global aviation accident
rate was 4.8% in 2008, whereas the rate was 4.2% in 2007. Moreover, the accident rate was
4.2% in 2011, which was the same value with the one recorded in 2007 (ICAO, 2012a).
Regarding this matter, the International Civil Aviation Organization (ICAO) considered the
absence of a proactive management system in terms of organizational safety as one of the
main reasons for the non-declining air traffic accident rate. Since the value of accident rate is
docx Proceedings of the Eastern Asia Society for Transportation Studies, Vol.9, 2013
the quantitative evidence representing the safety level, the non-declining accident rate showed
the necessity of an effort for effectively promoting the level of safety under limited resources.
As a solution for promoting level of safety in air transportation, ICAO has given its
signatories a suggestion to implement State Safety Program (SSP) through the first edition of
Safety Management Manual (ICAO Doc 9859, 2006). According to the document, the
standards in safety programs of many states have significant differences, and it recommended
that States have to consider the safety performance of each of their own aviation systems. A
few years later, ICAO issued the second edition of the document with more detailed concepts
related to safety management (ICAO Doc 9859, 2009). In this document, an SSP is defined as
“an integrated set of regulations and activities aimed at improving safety” related to the air
transportation system of a State. In other words, it is a settling process for “a management
system for the management of safety by the State” in the purpose of striving safety promotion
in air transportation system.
The program consists of four main components: State safety policy and objectives, State
safety risk management, State safety assurance, and State safety promotion. To achieve State
safety promotion, the program’s role is to provide a platform with State safety policy and
objectives, which ensure domestic aviation service providers (e.g. airline companies, air
traffic controllers, airport operators) with State’s safety risk management and safety assurance.
Based on these four main components, the main objective of the program is to accomplish an
“Acceptable Level of Safety (ALoS)” in aviation service providers. ALoS can be viewed as a
tool for addressing safety risks in specific operation contexts in a complex system like air
transportation, and it is expressed with the combination of safety measurement and safety
performance measurement. Safety measurements are quantified values of selected “high-
consequence events” like accident rates or serious incident rates. Safety performance
measurements are quantified values of selected “low-consequence processes” like number of
foreign object debris (FOD) events per number of ramp operations (ICAO Doc 9859, 2009).
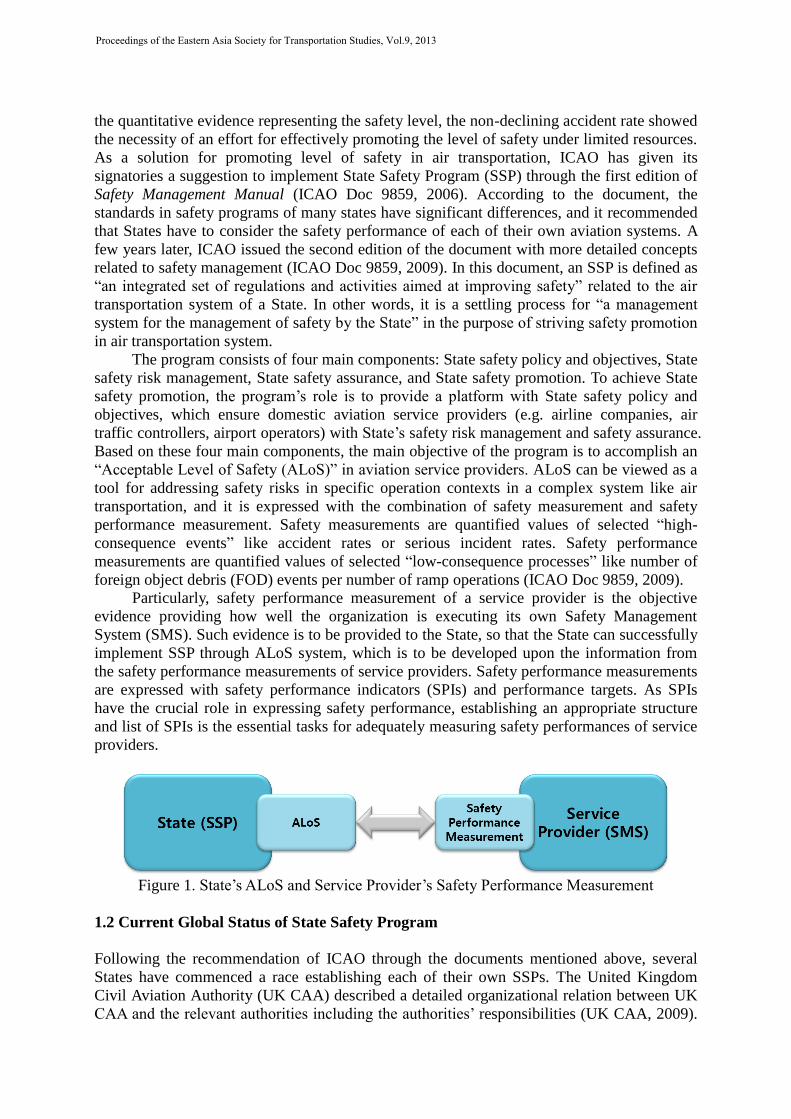
Particularly, safety performance measurement of a service provider is the objective
evidence providing how well the organization is executing its own Safety Management
System (SMS). Such evidence is to be provided to the State, so that the State can successfully
implement SSP through ALoS system, which is to be developed upon the information from
the safety performance measurements of service providers. Safety performance measurements
are expressed with safety performance indicators (SPIs) and performance targets. As SPIs
have the crucial role in expressing safety performance, establishing an appropriate structure
and list of SPIs is the essential tasks for adequately measuring safety performances of service
providers.
Figure 1. State’s ALoS and Service Provider’s Safety Performance Measurement
1.2 Current Global Status of State Safety Program
Following the recommendation of ICAO through the documents mentioned above, several
States have commenced a race establishing each of their own SSPs. The United Kingdom
Civil Aviation Authority (UK CAA) described a detailed organizational relation between UK
CAA and the relevant authorities including the authorities’ responsibilities (UK CAA, 2009).
Proceedings of the Eastern Asia Society for Transportation Studies, Vol.9, 2013

The safety objectives are supported, and the enforcement policy is discussed based on the four
main SSP components. They also issued the Safety Plan (UK CAA, 2010), and this plan
explains how to mitigate the risks in line with ICAO recommendation. They have not yet
established detailed ALoS, however, created safety indicators and targets to monitor the
frequency of accidents. The safety indicators are continuously tracked, and they determine the
upper limit through the statistical forecast. They have well-organized safety activity regarding
safety promotion both in internal and external training.
In the United States, the Federal Aviation Authority (FAA) is responsible for the SSP,
which they call as internal Safety Management System (SMS). This program is implemented
by the affiliated organizations: the Air Traffic Organization (ATO), the Office of Aviation
Safety (AVS), and the Office of Airports (ARP). Each of AVS and ATO published safety
materials for the SMS (FAA, 2007; FAA 2008a). The cooperation of these SMSs completes
the state safety program in the US. The framework from the orders are similar with ICAO
standard, however, the US SSP (internal SMS) incorporates a service provider (ATO) within
the SSP, which is not a part of the ICAO SSP (FAA, 2008b).
Transport Canada (TC) manages the entire area covering civil aviation and aviation
safety. TC is responsible for the implementation of SMS by monitoring the aviation safety. TC
recommended the service providers to improve the safety level on the safety components,
including safety management planning, documentation, safety oversight, training, quality
assurance program, and emergency response plan (Transport Canada, 2008). Netherland
(DEGAS, 2009), Belgium (Federale Overheidsdienst Mobiliteite en Vervoer, 2009), and
Australia (Australian Government, 2009) also developed and issued each of their own
documents for the implementation of SSP to improve their safety. All these guidance materials
contain strategic plans, which cover the four main components of ICAO SSP framework.
1.3 Objective of the Study
As mentioned in the previous subsection, several States have shown some efforts in
implementing SSP. However, since it is only the beginning phase of implementation, their
standards and approaches for establishing such process are somewhat different from each
other. Furthermore, a clear way of expressing ALoS is not generally settled, yet. In order to
properly measure safety performances of aviation service providers for developing a State’s
ALoS, studies on building an appropriate structure of SPIs is required as the first step.
Therefore, in terms of properly measuring safety performance, the main objective of this
study is to develop a general method for building an appropriate structure of SPIs for airline
companies, who are sorted as the ones of aviation service providers. This paper particularly
focuses on the SPIs for flight operation processes of airline companies. Such measure through
an appropriate structure of SPIs should contain clear and objective information on the status
of an organization’s SMS. Then, the information shall be useful for a State to successfully
implement SSP.
This study paper is organized as follows. Section 2 reviews the definition of SPI with
required characteristics, as well as the examples of SPIs being used in other fields. Section 3
proposes a new a structure of SPIs, which is built upon the review on suggestions provided by
ICAO in terms of appropriately measuring safety performance. This section also includes
some recommendations on selecting SPI lists for further application, including some
examples. Then, the paper is concluded with the summary and further suggestions that are
related to this study.
Proceedings of the Eastern Asia Society for Transportation Studies, Vol.9, 2013

2. REVIEWS ON THE STRUCTURE OF SAFETY PERFORMANCE INDICATORS
2.1 Definition of Safety Performance Indicator and Required Characteristics
There are various definitions on SPIs by different types of operational facilities or
organizations, such as chemical-related industries, nuclear power plants, and etc. Particularly
in aviation, an SPI is a short-term measure used for expressing the level of achievement in
safety performance of a system (ICAO Doc 9859, 2006; ICAO Doc, 2009). In other words,
SPIs enable aviation service providers to measure their short-term level of achievement in
safety performance, so that they can set up long-term performance targets corresponding to
the achievement level. The difference of an SPI from a Safety Indicator (SI) is that it
quantifies the outcome value of a selected low-level consequence process, whereas an SI
quantifies the outcome of a selected high-level consequence event. SPIs should be simple and
realistic, so that they can be appropriate for the application to ALoS, which is to be
determined by service providers’ supervisor (State government). In general, SPIs are
expressed with the frequency of event occurrences that are negatively effective to a system,
and particularly in aviation, SPIs are to measure low-level consequence events that occurs
during operation process exclusively from high-level consequence events like accidents and
serious incidents.
Even though it is relatively an old concept, the required conditions for a good safety
performance measure provided by Rockwell (1959) are still being discussed. A good SPI
should be quantifiable, appropriately representative, as less as variable, environmentally
sensible, consistent with benefits, and clearly understandable. One of such conditions is that
a good indicator must be quantifiable (Øien et al., 2011). On this specific required
characteristic for a good indicator, Roelen and Klompstra (2012) mentioned that quantifying
the SPIs in some performance areas (e.g. safety culture) are challengeable, because such
performances basically cannot be measured objectively by observation. They also raised a
question wondering if an indicator is reliable enough to represent the exact level of safety
performance of an organization. Regardless such challenges, even if the difficulties in
appropriately quantifying SPIs and representing the exact performance level of an
organization were solved, there still exists another essential condition to be fulfilled. A good
SPI should be understood well by those who are responsible for using its information. Both
the persons in the charges of service providers and regulators (State government) have the
responsibility of making decisions on each of their safety-related tasks using the information
from SPIs. However, the organizations particularly in aviation field consist of various types of
processes, such as airport operation, air traffic control, aircraft operation, passenger service,
and maintenance. In terms of both SSP and SMS, these various operation processes require a
large number of SPIs, thus, there are difficulties in the way of helping the decision makers
clearly understand the information from the large number of SPIs at a glance. Therefore, in
order to present a list of highly reliable and well comprehensive SPIs to both service
providers and regulators, building an appropriate structure of SPIs is one of the main required
task.
2.2 Safety Performance Indicator Frameworks in Other Fields
Before we begin with constructing a structure of SPIs, relevant efforts in some fields other
than aviation are reviewed. As the first example, the Health and Safety Executive (HSE) has
issued a guidance material, the Developing process safety indicators (HSE, 2006), which has
the purpose of assisting major hazard-related organizations that wish to develop performance
Proceedings of the Eastern Asia Society for Transportation Studies, Vol.9, 2013

indicators for improved assurance in terms of controlling major hazard risks. Regarding such
purpose, they provide the concept of “dual assurance,” which is the composite of “lagging
indicator” and “leading indicator” for each risk control system (Ale, 2009; Hopkins, 2009;
HSE, 2006). According to their concept, “lagging indicators show when a desired safety
outcome has failed, or has not been achieved.” These indicators only measure the outcome
(failure) of processes, so the safety performance in the processes can be judged through the
measure. However, they do not represent any indications on the effort of risk management. On
the other hand, leading indicators “require a routine systematic check that key actions or
activities are undertaken as intended.” Unlike the former, the measures through leading
indicators enable an organization to examine the processes which may lead to failures. These
indicators are related to preventing negative outcomes of organizational processes, so they can
be called as the proactive measures. HSE constructed the dual assurance mechanism for risk
control system, by adding the two types of indicators to the “Swiss Cheese Model (Reason,
1997).” As shown in Figure 2, during an organizational process, a possible accident has a
hypothetical trajectory from hazard to actual occurrence (harm or damage). The leading
indicators are regarded as the barriers preventing the accident (or incident) to progress
towards the next level of damage risk. The lagging indicators are regarded as the holes in the
barriers, meaning that the accident (or incident) has progressed further through these holes.
Figure 2. Dual assurance: leading and lagging indicators for risk control systems (HSE, 2006)
The material also provides a “step-by-step” guide for chemical and major hazard
industries in terms of monitoring and controlling risk in organizational processes. There are
total six steps to measure performance as in Table 1. Out of these steps, particularly in step 2,
they suggest to decide on the scope of performance indicators, whether indicators are at
organization, site, or facility level. Then the indicators have a hierarchical structure as in
Figure 3. Organization level indicators provide information of overall level of safety
performance reflecting the safety performance of all facilities of an organization. Site level
indicators provide lower level information reflecting the safety performance of all facilities of
a site, while facility level indicators provides individual information reflecting the
performance of a single facility. Using this guidance, the HSE expects the chemical and major
hazard industries to monitor safety performance more systematically with the information of
organization level indicators, which are systematically gathered from lower level indicators.
Proceedings of the Eastern Asia Society for Transportation Studies, Vol.9, 2013
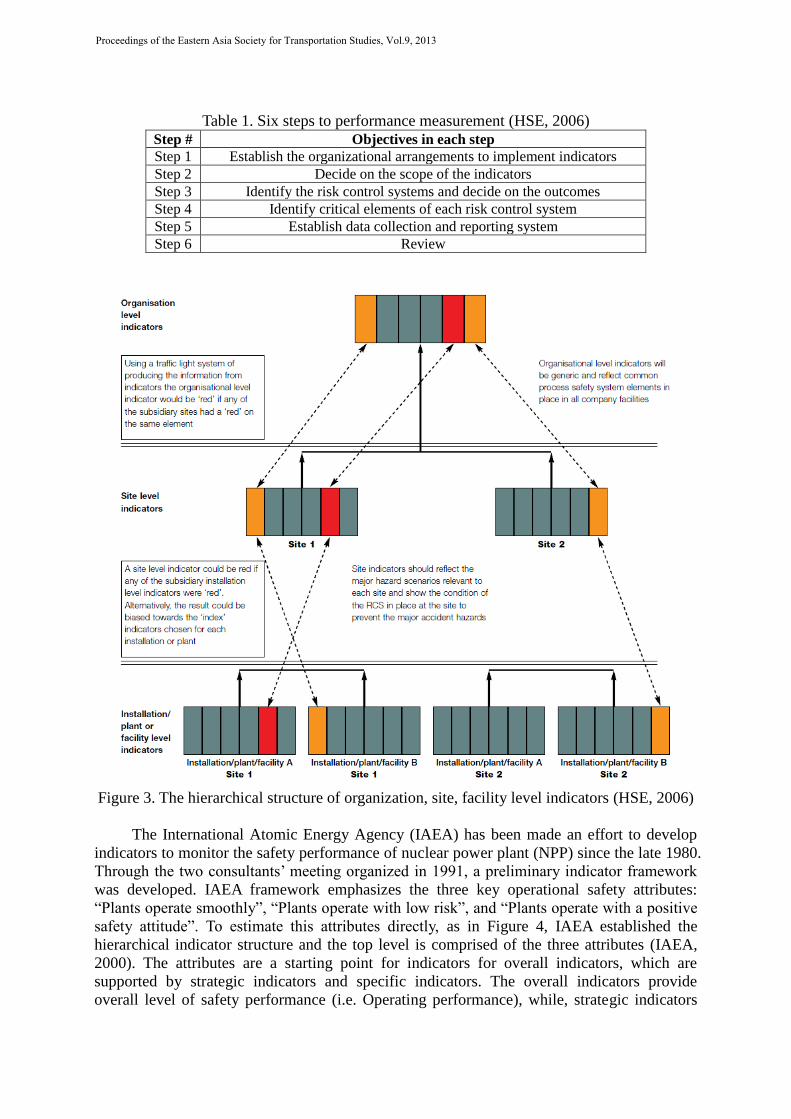
Table 1. Six steps to performance measurement (HSE, 2006)
Step # Objectives in each step
Step 1 Establish the organizational arrangements to implement indicators
Step 2 Decide on the scope of the indicators
Step 3 Identify the risk control systems and decide on the outcomes
Step 4 Identify critical elements of each risk control system
Step 5 Establish data collection and reporting system
Step 6 Review
Figure 3. The hierarchical structure of organization, site, facility level indicators (HSE, 2006)
The International Atomic Energy Agency (IAEA) has been made an effort to develop
indicators to monitor the safety performance of nuclear power plant (NPP) since the late 1980.
Through the two consultants’ meeting organized in 1991, a preliminary indicator framework
was developed. IAEA framework emphasizes the three key operational safety attributes:
“Plants operate smoothly”, “Plants operate with low risk”, and “Plants operate with a positive
safety attitude”. To estimate this attributes directly, as in Figure 4, IAEA established the
hierarchical indicator structure and the top level is comprised of the three attributes (IAEA,
2000). The attributes are a starting point for indicators for overall indicators, which are
supported by strategic indicators and specific indicators. The overall indicators provide
overall level of safety performance (i.e. Operating performance), while, strategic indicators
Proceedings of the Eastern Asia Society for Transportation Studies, Vol.9, 2013

provide lower level of information (i.e. Forced power reductions and outages) taking a role as
a bridge between overall and specific indicators. Specific indicators (i.e. Number of forced
power reductions and outages due to internal causes) provide detailed information by
representing quantifiable performance. IAEA expects to monitor safety performance more
systematically with the operational safety performance indicators. The SPI characterizes with
quantitative attributes linking the indicator and safety directly, means that the operators can
trace the reason of malfunction with the indicators.
Figure 4. Safety performance indicator framework (IAEA, 2000)
Figure 5. Process Safety Indicator Pyramid (API, 2010)
There also have been some efforts of the chemical-related industries and organizations
for developing safety indicators to monitor and improve safety performance since the mid
1990’s. A series of documents and guidelines have been issued to the industries that are
related to refinery and petrochemicals. The Organization for Economic Cooperation and
Development (OECD) issued the second edition of Guidance on Developing Safety
Performance Indicators (OECD, 2008), is carried out by Working Group on Chemical
Proceedings of the Eastern Asia Society for Transportation Studies, Vol.9, 2013

Accidents (WGCA). As the reaction on the fire explosion occurred at BP Texas City Refinery
in 2005, the Report of the BP US Refineries Independent Safety Review Panel recommended
that an integrated set of lagging and leading performance indicators should be developed,
implemented, maintained, and periodically updated for more effectively monitoring the
process safety performance (BP, 2007). Recently, the Center for Chemical Process Safety
(CCPS) provided the recommendations on safety indicators in a form of process safety
metrics, through the guidance called Process Safety Leading and Lagging Metrics (CCPS,
2011). Currently, the related industries primarily adopt the guidelines provided by CCPS,
HSE, and American Petroleum Institute (API). Similarly with the HSE’s guidance (HSE,
2006), the API uses the concept of Swiss Cheese Model (Reason, 1997), as well as the
accident pyramid model (API, 2010). This model uses a pyramid and divides indicators into
four groups of tiers depending on their impact within the pyramid, as shown in Figure 5. It
describes the flow of lagging and leading indicators in terms of process safety, and provides a
logical differentiation among indicators.
As presented above, there are two terms that are occasionally mentioned: lagging
indicator and leading indicator. Lagging indicators measure the outcome (failure) of processes,
so the safety performance in the processes can be judged through the measure, but they do not
represent any indications on the effort of risk management. Leading indicators enable an
organization to examine the processes which may lead to failures, and they are related to
preventing negative outcomes of organizational processes. The concepts of these two terms
are to be included in SPI structure, but there is no clear explanation on the scope of these
concepts within the structure. They only provide such concepts without describing exactly
how to select indicators related to these concepts. It is assumed to be because of that there are
still discussions on whether or not the logic separating indicators into lagging and leading
indicators is correct (Ale, 2009; Bellamy, 2009; Hopkins, 2009; Wreathall, 2009). Therefore,
these concepts should be clarified thoroughly or vanished completely, when someone tries to
use them related to an organization’s safety performance and risk management.
We can also see that there is a common feature in the SPI structures in different types of
organizations. It is that all of them have hierarchical structures that are composed with
different levels of indicators. Each structure aims to express the overall safety performance in
an organization’s operation process with a single value of the indicator at the highest level in
the structure. Such indicator contains information that is systematically gathered from lower
level indicators. The process expressing the overall safety performance of a complicatedly
structured organization with a single value seems to be a reasonable way to ease the
monitoring process on performance changes.
3. STRUCTURE OF SAFETY PERFORMANCE INDICATORS
3.1 ICAO Recommendation on Safety Performance Measurement
To achieve State safety promotion, the SSP’s role is to provide a platform with State safety
policy and objectives, which ensure domestic aviation service providers (e.g. airline
companies, air traffic controllers, airport operators) with State’s safety risk management and
safety assurance. Safety assurance, which is one of the four main components in both SSP and
SMS, must provide an indication of the level of safety performance of the system to
stakeholders. Safety performance measurement is also required in safety risk management by
providing feedback on safety performance “to complete the safety management cycle (ICAO
Doc 9859, 2009).”
Proceedings of the Eastern Asia Society for Transportation Studies, Vol.9, 2013

In the safety assurance concept, through a system operation (flight operation), safety
performance of the system is measured. Then, the information from such measurement is
shared to decision makers of a service provider, and they analyze to make decisions on which
remedial actions are required. Then, the required remedial actions are applied to operation.
Such analysis would lead to hazard identification, which is a partial process of safety risk
management. Safety risk management is a process that is designed to control hazards or risks
that are already identified through system analysis. If a new hazard is identified throughout
the process of measuring safety performance as part of safety assurance, then, the risk
management process shall be redesigned corresponding to the newly identified hazard.
The information from safety performance measurement is also shared to State along
with safety measurement. The combination of the two information sources, which represents
the status of a service provider’s SMS, is reflected to “mature ALoS.” The mature ALoS is the
transitioned one from “initial ALoS.” Initial ALoS is the one that is reflected by only safety
measurement, before the safety assurance is processed. As information on safety performance
measurement is gathered through the safety assurance process over certain period, then the
information is added to initial ALoS. This addition results the transition from initial ALoS to
mature ALoS. The combinations of the two information sources on all other service providers
in a State are also reflected to mature ALoS as in Figure 8, so that it can represent the safety
level of the State’s entire aviation system. Based on the information from mature ALoS, the
State also analyzes to identify which remedial actions that a specific service provider must
deliver, and then, the service provider must take the required actions instructed by the State in
addition to the internal remedial action. The concept of the entire process of safety assurance
for both State and service providers is presented in Figure 6. The figure also shows the
relationship between safety assurance and risk management processes. The process of risk
management in this figure is in a simplified form.
Figure 6. Safety assurance for both State and service providers
Proceedings of the Eastern Asia Society for Transportation Studies, Vol.9, 2013

Figure 7. Mature ALoS and Safety Performance Measurement
Figure 8. Mature ALoS representing the safety level of a State’s entire aviation system
Based on the concepts of both safety assurance and safety risk management, it is clear
that safety performance measurement is the core source of information that supports
stakeholders in making decisions on assuring safety and controlling risk. Safety performance
measurement is expressed with safety performance indicators (SPIs) and safety performance
targets, as presented in Figure 7. As already mentioned, an SPI is a short-term measure used
Proceedings of the Eastern Asia Society for Transportation Studies, Vol.9, 2013
for expressing the level of achievement in safety performance of a system. SPIs enable
aviation service providers to measure their short-term level of achievement in safety
performance, so that they can set up long-term performance targets corresponding to the
achievement level.
3.2 Proposing a Structure of Safety Performance Indicators for Airline Companies
Based on the reviews on the ICAO recommendation, SPIs in other fields, and required
characteristics, we propose a structure of SPIs representing the safety performance
particularly in flight operation of an airline company. We are proposing the SPI structure
particularly for flight operation, because what we are focusing on is the safety performance
measurement of airline companies only. Even though airlines’ responsibilities somewhat
partially involved in airport operation, air traffic control, and maintenance, what we need is
the exclusive information in safety performances of airlines. What airline companies are
independently responsible for are aircraft operation and passenger service. So, in this paper,
we regard the term, flight operation, as only the operation related to aircraft operation and
passenger services during flight procedures, exclusively from air traffic control, maintenance,
and etc.
As in the safety assurance concept presented in Figure 6, the information on safety
performance measurement of an airline’s flight operation should be continuously provided to
the stakeholders of both the airline and State. This continual provision of such information is
called continuous monitoring on safety performance measurement. Since such information
must be monitored by both the airline and State continuously, as already mentioned regarding
to the required characteristics of SPIs, the information should be as clear as possible and well-
representative. For clearly understandable information on safety performance, a structure of
safety performance indicators should be composed. Such structure should be able to reflect
the all individual indicator values and express with a single high-level indicator value by
integrating them. For well-representative information on safety performance, the structure
should hold as much as detailed information. It should possess information on “what” event
has happened, “who” are related to the event,” “where” the event takes place, and “when” the
event has happened. The information on “how” and “why” such event has happened should be
identified at the analysis stage in Figure 7. Identifying how and why an event has happened
are related to hazard identification, which is one of the processes in safety risk management.
As already mentioned in the review section, the common feature in the SPI structures in
different types of organizations is that, all of them have hierarchical structures. Each structure
aims to express the overall safety performance in an organization’s operation process with a
single value of the indicator at the highest level in the structure, and such indicator contains
information that is systematically gathered from lower level indicators. The process
expressing the overall safety performance with a single value seems to be a reasonable way to
ease the monitoring process on performance changes of the entire organization.
Like the other fields, the aviation field can also use such hierarchical structure of SPIs.
In the case of airline’s operation, the entire operational status can be positioned in the highest
level of the hierarchical structure. Flight operation is usually classified by flight phases, and
thus, flight phases can be placed as the highest level. Each event during operation occurs at
specific flight phase, so, events during operation can be placed at the bottom of the structure.
Based on such idea of using the hierarchical structure, the proposed structure consists of
three levels of indicators as shown in Figure 9. It shows a hierarchical structure with “event
level” SPIs,” “flight phase level SPIs,” and an “organizational level SPI.” The event level
SPIs represent quantified values of each individual low-level consequence event at
Proceedings of the Eastern Asia Society for Transportation Studies, Vol.9, 2013

corresponding flight phase. Then, a flight phase level SPI provides individual information
reflecting the quantified values of the event level SPIs under the specific flight phase. The
organizational level SPI reflects the quantified safety performance values of all phases of
flight operation, so that it can provide clear information with a single quantified value
expressing overall safety performance of an organization.
The event level SPIs shall imply specific information on “what” events have occurred
and “who” are related to the events. There are always people who have responsibilities in
each event. In the case of an airline company’s flight operation, these people are aircraft
operators, cabin crew, or any other personals related to such operation. The flight phase level
SPIs shall imply specific information on “where” the events take places and “when” the
events have happened, along with the reflection of information on event level SPIs. A flight
phase may sound like that it represents only when (at which process) a specific event has
occurred, but, actually, it also represents where such event takes place. Particularly in aviation,
the flight phases are categorized based on physical spaces, such as taxiway, runway, midair,
and terminal control area (TMA). Midair space is also viewed separately by specific altitudes.
Thus, flight phase level SPIs implies information on both when and where certain event has
happened. The organizational level SPI, which expresses overall safety performance of an
organization with all indicator values under it, then shall imply the information of the four Ws
(where, when, what, and who). So, this organizational level SPI can appropriately represent
the overall safety performance.
Figure 9. The safety performance indicator structure for flight operation of an airline company
This structure is designed to ease the procedure of tracking down the origin of a
problem in safety performance. During daily normal operation, both the airline and State can
continuously monitor only the single value of organizational level SPI. If the value changes
negatively, further from intended value (performance target), then the managers can access the
detailed structure to track down the origin of safety performance degradation. This process of
tracking down the origin is related to identifying a new hazard during flight operation, so that
it can lead to an improvement in safety risk management process. So, such structure becomes
the bridge connecting the safety assurance and safety risk management processes. Each
indicator in the structure should possess information on not only the present performance
value, but also the past values, so that it can give information on the trend showing how the
safety performance value has been changed over certain time period.
Proceedings of the Eastern Asia Society for Transportation Studies, Vol.9, 2013
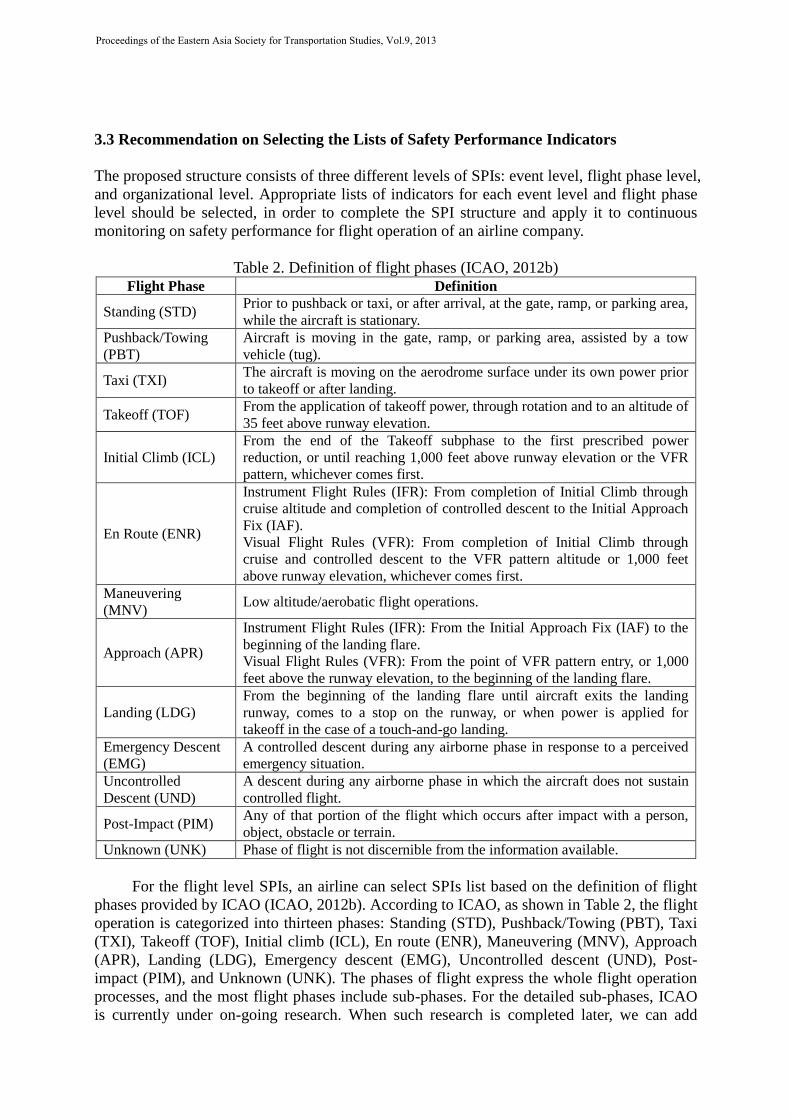
3.3 Recommendation on Selecting the Lists of Safety Performance Indicators
The proposed structure consists of three different levels of SPIs: event level, flight phase level,
and organizational level. Appropriate lists of indicators for each event level and flight phase
level should be selected, in order to complete the SPI structure and apply it to continuous
monitoring on safety performance for flight operation of an airline company.
Table 2. Definition of flight phases (ICAO, 2012b)
Flight Phase Definition
Standing (STD) Prior to pushback or taxi, or after arrival, at the gate, ramp, or parking area,
while the aircraft is stationary.
Pushback/Towing
(PBT)
Aircraft is moving in the gate, ramp, or parking area, assisted by a tow
vehicle (tug).
Taxi (TXI) The aircraft is moving on the aerodrome surface under its own power prior
to takeoff or after landing.
Takeoff (TOF) From the application of takeoff power, through rotation and to an altitude of
35 feet above runway elevation.
Initial Climb (ICL)
From the end of the Takeoff subphase to the first prescribed power
reduction, or until reaching 1,000 feet above runway elevation or the VFR
pattern, whichever comes first.
En Route (ENR)
Instrument Flight Rules (IFR): From completion of Initial Climb through
cruise altitude and completion of controlled descent to the Initial Approach
Fix (IAF).
Visual Flight Rules (VFR): From completion of Initial Climb through
cruise and controlled descent to the VFR pattern altitude or 1,000 feet
above runway elevation, whichever comes first.
Maneuvering
(MNV) Low altitude/aerobatic flight operations.
Approach (APR)
Instrument Flight Rules (IFR): From the Initial Approach Fix (IAF) to the
beginning of the landing flare.
Visual Flight Rules (VFR): From the point of VFR pattern entry, or 1,000
feet above the runway elevation, to the beginning of the landing flare.
Landing (LDG)
From the beginning of the landing flare until aircraft exits the landing
runway, comes to a stop on the runway, or when power is applied for
takeoff in the case of a touch-and-go landing.
Emergency Descent
(EMG)
A controlled descent during any airborne phase in response to a perceived
emergency situation.
Uncontrolled
Descent (UND)
A descent during any airborne phase in which the aircraft does not sustain
controlled flight.
Post-Impact (PIM) Any of that portion of the flight which occurs after impact with a person,
object, obstacle or terrain.
Unknown (UNK) Phase of flight is not discernible from the information available.
For the flight level SPIs, an airline can select SPIs list based on the definition of flight
phases provided by ICAO (ICAO, 2012b). According to ICAO, as shown in Table 2, the flight
operation is categorized into thirteen phases: Standing (STD), Pushback/Towing (PBT), Taxi
(TXI), Takeoff (TOF), Initial climb (ICL), En route (ENR), Maneuvering (MNV), Approach
(APR), Landing (LDG), Emergency descent (EMG), Uncontrolled descent (UND), Post-
impact (PIM), and Unknown (UNK). The phases of flight express the whole flight operation
processes, and the most flight phases include sub-phases. For the detailed sub-phases, ICAO
is currently under on-going research. When such research is completed later, we can add
Proceedings of the Eastern Asia Society for Transportation Studies, Vol.9, 2013

another level of indicators into the SPI structure corresponding to the addition of the list of
sub-phases. As the whole process of flight operation flows according to the each flight phase,
the proposed SPI structure would support the safety performance managers to evaluate the
performance and led them to set the mitigation strategy for each flight phase.
The flight phase level can be selected as the following examples.
• weekly low-level consequence events rate during takeoff phase (per 1000 takeoff
trials)
• weekly low-level consequence events rate during landing phase (per 1000 landing
trials)
• monthly low-level consequence events rate during en route phase (per 1000 flight
hours)
For the event level SPIs, an airline can select SPIs list based on the definition of
aviation occurrence categories provided by ICAO (ICAO, 2011). According to ICAO, the
aviation occurrences are categorized into total thirty-four terms. The list includes abnormal
runway contact (ARC), controlled flight into or toward terrain (CFIT), fuel related (FUEL),
ground collision (GCOL), runway excursion (RE), runway incursion (RI), turbulence
encounter (TURB), undershoot/overshoot (USOS), and etc. Some of these aviation
occurrences in the list are regarded as high-level consequence events, and some of them are
not related to airline’s responsibility. So, airlines should select the event level SPIs
considering whether an occurrence represent low-level consequence event, as the ICAO
suggestion on safety performance measurement (ICAO Doc 9859, 2009). Also, the list should
be selected regarding the airline companies’ responsibilities, because not all of the aviation
occurrences are related to airlines’ flight operations. For example, the persons who manage an
airfield as a part of airport operation have the responsibility in increasing number of foreign
object debris (FOD) event occurrences, thus, this type of event should be excluded from
airlines’ safety performance indicator. Inappropriate selection in the absence of consideration
in the responsibility may result an airline company’s safety performance degradation, even
though an event occurrence is not their fault. Therefore, airline companies should fully
consider if a selected indicator is related to their exclusive responsibilities during flight
operation, in order to prevent false alarm on their safety performance.
The event level can be selected as the following examples.
• weekly rate of route deviation during en route phase (per 1000 flight hours)
• monthly rate of pilot’s violation against climbing procedure during initial climb
phase (per 1000 flight hours)
• monthly rate of flight crew or passenger’s minor injury rate during landing phase
(per 1000 landing trials)
4. CONLUSION
Safety performance measurement of an aviation service provider is the objective evidence
providing how well the organization is executing its own safety management system (SMS),
which should be deeply cooperated with State safety program (SSP). In order to adequately
measure safety performances of aviation service providers for successfully implementing both
Proceedings of the Eastern Asia Society for Transportation Studies, Vol.9, 2013

SMS and SSP, studies on building an appropriate structure of safety performance indicators
(SPIs) is required as the first step.
This study has reviewed on the definition and required characteristics of SPIs, including
how SPIs are structured and used in some fields other than aviation. The recommendations
from the International Civil Aviation Organization (ICAO) about safety performance
measurement also have been reviewed. Then, a structure of SPIs representing the safety
performance particularly in flight operation of an airline is proposed in this study. The SPI
structure aims particularly at flight operation, because what we are focusing on is the safety
performance measurements of airline companies only. The proposed structure consists of
three levels of indicators, and it shows a hierarchical structure with “event level SPIs,” “flight
phase level SPIs,” and an “organizational level SPI.” Some recommendations on selecting
both event level and flight phase level indicators are provided as well, using ICAO definitions
on occurrences and flight phases.
Since the characteristics of aviation operations differ from the ones of the other fields, it
may not be appropriate to directly compare the newly proposed structure of the SPIs for
aviation field with the ones of the other fields. Still, there is a contribution of this study under
a given specific fact. As mentioned earlier, there is no country or air company that has clearly
declared their own safety performance indicators in the field of aviation, yet. The proposed
structure gives contribution to that it builds the fundamentals of establishing the safety
performance indicators for airline companies for the first time, with the reflection of the
recommendation from ICAO that is issued just recently. In other words, the proposed
structure gives contribution to generalizing the way of measuring an airline’s safety
performance, for the first time. Another contribution is that such structure is designed to
possess information that is as clear as possible and well-representative. This will ease the
monitoring process of safety performance for both airlines and State.
The proposed structure has a limitation due to the absence of hazard concept. Even
though hazard controlling performance should be reflected to safety performance
measurement as well, for now, this issue is not considered to be added into the structure due to
the practical issue. The processes of hazard identification and control are difficult to be
considered in SPI structure. To identify the element that potentially harms safety in a system,
many researchers introduced hazard analysis methods (Cagno et al., 2002; Kirmse, 2001;
Leveson, 2004). However, those hazard analysis methods have a limitation on identifying
hazardous scenarios involving human error. Furthermore, it is currently impossible that those
who daily operate within a system can fully recognize some hazards. Some will miss to
recognize some hazards even though they clearly exist around them. So, through the current
hazard analysis methods, it is hard to get practical information related to potential hazard in
the safety management system. So, this issue of hazard control is excluded from the proposed
SPI structure, for now. Thus, it is suggested for the further related studies to consider this
matter as well. Furthermore, this paper proposed just the sense of how SPIs should be
structured, without providing how to aggregate the values of the lower level indicators into a
higher level indicator value. This aggregating procedure is essential to show the feasibility of
the whole idea of the newly proposed SPI structure. To prove the feasibility of the proposed
structure, such method explaining how to aggregate and evaluate the indicators should also be
developed in further related studies. Then, the completed structure of SPIs with appropriate
lists and evaluating method for each indicator can represent the exact level of the safety
performance measurement. Such measurement will provide the information to the State on
how well an airline company is practicing its own SMS.
Proceedings of the Eastern Asia Society for Transportation Studies, Vol.9, 2013

ACKNOWLEDGEMENT
This research was supported by a grant (11 Aviation-Safety 06) from the Aviation Technology
Research Program funded by the Ministry of Land, Infrastructure and Transport of the Korean
government.
REFERENCES
Ale, B. (2009) More thinking about process safety indicators, Safety Science, 47, pages
470-471.
API (2010) Process Safety Performance Indicators for the Refining and Petrochemical
Industries, ANSI/API 754, First Edition.
Australian Government (2012) Australia’s State Aviation Safety Program.
Bellamy, L. J. (2009) Process safety indicators: Response to Andrew Hopkins. Safety
Science, 47(4), 472–473. doi:10.1016/j.ssci.2008.07.039
BP (2007) The report of the B.P.U.S. refineries independent safety review panel.
Cagno, E., Caron, F., and Mancini, M. (2002) Risk analysis in plant commissioning: the
Multilevel HAZOP, Reliability Engineering and System Safety, vol. 77, no. 3, pp. 309-
323.
CCPS (2011) Process safety leading and lagging metrics. Revised. New York: Center for
Chemical Process Safety – AIChE. http://www.aiche.org/ccps/.
UK CAA (2009) State Safety Programme for the United Kingdom, CAP 784.
UK CAA (2010) Civil Aviation Authority Safety Plan 2011 to 2013.
DEGAS (2009) State Safety Programme, DEGAS Advice 2009-059.
FAA (2007) Air Traffic Organization Safety Management System, Order 1000.37.
FAA (2008a) Aviation Safety (AVS) Safety Management System Requirements, Order
8000.367.
FAA (2008b) Safety Management System Guidance, Order 8000.369.
Federale Overheidsdienst Mobiliteite en Vervoer (2009) Besluit van de directeur-
generaal.
Hopkins, A. (2009) Thinking about process safety indicators. Safety Science, 47, pages
460-465.
HSE (2006) Developing process safety indicators: a step-by-step guide for chemical and
major hazard industries.
IAEA (2000) Operational safety performance indicators for nuclear power plants.
ICAO (2011) Aviation Occurrence Categories – Definitions and Usage Notes.
ICAO (2012a) 2012 Safety Report.
ICAO (2012b) Phase of Flight – Definitions and Usage Notes.
ICAO Doc 9859 (2006) Safety Management Manual (SMM), 1st Edition.
ICAO Doc 9859 (2009) Safety Management Manual (SMM), 2nd Edition.
Kirmse, D. (2001) Process Improvement Engineering: Hazard and Operability (HazOp)
Studies, University of Florida, Gainesville, FL.
Leveson, N. (2004) A new accident model for engineering safer systems, Safety Science,
vol.42, no. 4, pp. 237-270.
OECD (2008) Guidance on Developing Safety Performance Indicators, related to
Chemical Accident Prevention, Preparedness and Response, 2nd edition. Guidance for
industry.
Øien, K., Utne, I. B., Herrera, I. A. (2011) Building safety indicators: Part 1 – theoretical
Proceedings of the Eastern Asia Society for Transportation Studies, Vol.9, 2013

foundation, Safety Science, 29, pages 148-161.
Reason, J. T. (1997) Managing the risks of organizational accidents. (Vol. 6). Aldershot:
Ashgate.
Rockwell, T.H. (1959) Safety Performance measurement, Journal of Industrial
Engineering, Volume 10, pages 12-16.
Roelen, A. L. C., & Klompstra, M. B. (2012) The challenges in defining aviation safety
performance indicators, Preprint for PSAM 11 & ESREL 2012, 25 - 29 June 2012,
Helsinki, Finland
Transport Canada (2008) Guidance on Safety Management Systems Development
Wreathall, J. (2009) Leading? Lagging? Whatever! Safety Science, 47(4), 493–494.
doi:10.1016/j.ssci.2008.07.031
Proceedings of the Eastern Asia Society for Transportation Studies, Vol.9, 2013