study paper 1b intellectual property rights,...
TRANSCRIPT
Commission on Intellectual Property Rights
Study Paper 1b
Intellectual Property Rights, Technology and Economic Development:
Experiences of Asian Countries
Nagesh Kumar
Research and Information System for Developing Countries, Zone 4B India Habitat Centre, Lodi Road
New Delhi-110003 [email protected]
This report has been commissioned by the IPR Commission as a background paper. The views expressed are those of the author and do not
necessarily represent those of the Commission.
1
Intellectual Property Rights, Technology and Economic Development:
Experiences of Asian Countries
Executive Summary
There has been a lot of controversy on the role of intellectual property protection (IPP)
regime especially the patent system in fostering innovation, technology and industrial
development of a country. IPP is expected to encourage innovation by rewarding the
inventor. Strong IPP regime may also inhibit diffusion of knowledge and even technology
development in the countries that are technology followers. Countries have fine-tuned their
IPP regimes as per their developmental requirements. Against this backdrop, the on-going
attempt to harmonize and strengthen the IPP regimes worldwide, as a part of the TRIPs
Agreement, is widely seen to be adversely affecting the technological activity in developing
countries by choking the knowledge spillovers besides implications for the access and
affordability to lifesaving drugs by the poor. This paper critically reviews the literature on the
role of IPP regime with a particular reference to the Asian countries to draw policy options
for consideration by the Commission.
Patterns and Trends in Global Innovative Activity
The global technology generation or innovative activity is highly concentrated in a handful of
technologically advanced developed countries with just top ten countries accounting for as
much as 84 per cent of global R&D activity, 94 per cent of US, and 91 per cent of global
cross-border technological payments. Prominent among the emerging countries that are
beginning to obtain US patents in increasing numbers are Taiwan and South Korea. Therefore
these countries together with Japan make important cases for analyzing the role played by
IPRs in their technology development.
IPR Regime and Economic Development: The Evidence
IPR regime is likely to affect growth indirectly by encouraging the innovative activity that in
turn is the source of total factor productivity improvements. The IPR regime could also affect
the inflows of FDI, technology transfers and trade that might impinge on growth. The
relationship between IPR and development could be subject to the causality problem as
2
developed countries are likely to have stronger IPRs regime than the poorer ones. Studies have
found the relationship between IPR protection and level of development to be non-linear
suggesting that patent protection tends to decline in strength as economies move beyond the
poorest stage into a middle-income stage in which they have greater abilities to imitate new
technologies. Quantitative studies have also shown that universally imposed minimum standards
for patent protection are not likely to contribute to increased growth in countries below a certain
threshold in terms of level of development.
IPRs as Determinants of Innovative Activity
The existing empirical literature suggests that the effectiveness of patent protection varies from
industry to industry and inventive activity is sensitive to protection only in a few industries such
as chemical and pharmaceutical industries. A study of the impact of strengthening of
pharmaceutical patent protection in Italy since 1978 showed little or no impact on R&D
expenditures or on new inventions. Furthermore, R&D activity is found to be significantly
determined by absorption of spillovers of others’ R&D activity particularly in the case of
chemicals and electrical and electronics. The importance of foreign R&D spillovers as a
determinant of R&D activity could be even more critical in developing countries where much of
the R&D activity is of an adaptive nature. A number of studies have empirically demonstrated
the ability of rather weaker IPRs in stimulating domestic innovative activity in developing
countries. Theerefore, the evidence on the role of IPRs as a determinant of innovative activity is
quite weak. In fact stronger IPRs may actually affect the innovative activity adversely by
chocking the absorption of knowledge spillovers that are important determinants of innovative
activity.
IPRs, FDI Inflows, Technology Licensing and Trade
Stronger protection increases the revenue productivity of a firm’s intellectual property and
should help exporters by making counterfeiting more difficult as has been corroborated
empirically by studies. However, the effect of IPR strength on FDI and licensing is not that
straight forward. By reducing the transaction cost of transfer of knowledge by MNEs to foreign
countries, stronger protection may encourage arm’s length licensing of the knowledge and
reduce the need for undertaking FDI. On the other hand, it has been argued that poor IPR
regime tends to adversely affect the investment climate and hence the probability of MNE
investments. Empirical studies have generally shown that the strength of IPP promotes arm’s
length licensing but they have generally no significant effect on internalized technology transfers
3
viz. FDI. Even the location of R&D investments abroad by MNEs was found to be not
significantly affected by strength of IPP. Thus the contention that stronger norms of IPR
protection will facilitate greater inflows of FDI in the country is rather weak in either theoretical
or empirical terms.
IPRs and Economic and Technological Development in East Asia
The rapid growth at the rate of 5.5 per cent in per capita GDP sustained over the 1960-90 and
even more impressive growth rate exports in the East Asian economies, viz. Japan; South Korea,
Taiwan, Hong Kong and Singapore (first tier Asian nies), Malaysia, Thailand, and Indonesia
(second tier nies) and China, generally termed as the ‘East Asian Miracle’, has attracted a large
volume of literature. While some analysts have attempted to dismiss the East Asian achievement
as a result of factor accumulation along the production function, voluminous empirical evidence
is now available to corroborate that a substantial proportion of East Asian growth was
contributed by growth of total factor productivity (TFP) that has averaged between 2 to 4 per
cent per year over 1960-89 thus contributing over a third of the growth of output in these
countries. Furthermore, evidence is now available to confirm that the assimilation of foreign
technology was a ‘critical component of the Asian Miracle’. There seems to be a general
consensus that the East Asian success owes a lot, in general, to their ability to imitate, absorb,
assimilate, replicate or ‘duplicative imitation’ of foreign inventions. The existing evidence on
the role of IPRs regime in promoting growth is largely anecdotal. Although the literature is not
explicit in acknowledging its role, the soft IPP regime adopted by these countries in the period of
duplicative imitation or reverse engineering has played and important role in facilitating the firm
level technological learning as becomes clear from the case studies of Japan, Korea and Taiwan.
Japan
Japan is known to have greatly benefited from intellectual property generated in other developed
countries in the early stages its development. in Japan the patent protection has been designed
with an ultimate objective of contributing to the industrial development and not as an end by
itself and contains several features that have helped the absorption of spillovers of foreign
inventive activity by domestic enterprises. For instance, food, beverage, pharmaceutical products
and chemical compounds were excluded from the scope of patent protection until 1975 to
facilitate the process innovations. Japanese IPR system provides for utility models to encourage
minor adaptations or improvements over the imported machinery or equipment by domestic
inventors, and protection of industrial designs that only needed to demonstrate novelty and not
4
inventiveness. The utility models and industrial designs have allowed Japanese firms to receive
protection on technologies that were ‘only slightly modified from the original invention’. JPS
also employs the first-to-file principle rather than the first-to-invent principle incorporated in the
US law, pre-grant disclosure, compulsory license, and (until 1988) narrow claims. All these
features have been designed to favour adaptations by domestic enterprises. Almost all of the
utility models and industrial design have been granted to nationals. Quantitative studies have
confirmed that the weaker patent system employed by Japan has facilitated absorption, transfer
and diffusion of technology and contributed to the TFP growth during the period 1960-93. The
scope of patent system was expanded to cover chemical and pharmaceutical products only in
1975 to provide protection to technological capability that had developed adequately by then.
South Korea
South Korea adopted the patent legislation only in 1961. However, the scope of patenting did
not cover patenting of products and processes to manufacture food products, chemical
substances and pharmaceuticals. The US pressure pushed Korea to strengthen its IPR regime in
1986, and extend product patent protection to new chemical and pharmaceutical products, adopt
a comprehensive copyright law, and extend the patent term from 12 to 15 years. Korea has also
followed an IPR regime that facilitated adaptations and imitative duplication of foreign
technologies by domestic enterprises through utility models and industrial designs. That the soft
IPR regime adopted initially was a part of conscious policy of the government to facilitate
imitation by domestic enterprises has been documented well in the literature on Korean
technological capability.
Taiwan
Taiwan has also employed a weak IPR policy to facilitate local absorption of foreign
knowledge through reverse engineering on the lines of Japan and South Korea. In fact
Taiwan’s government seemed to openly encourage counterfeiting as strategy to develop local
industries until 1980s. Taiwan allowed patents on food, beverages, micro-organisms, and new
uses for products, only in 1994 under heavy US pressure. Like Japan and Korea, Taiwan also
provides for utility models and design patents.
To sum up, the East Asian countries have absorbed substantial amount of technological learning
under weak IPR protection regime during the early phases. Their patent regimes facilitated the
5
absorption of innovation and knowledge generated abroad by their indigenous firms. They have
also encouraged minor adaptations and incremental innovations on the foreign inventions by
domestic enterprises and developed a patent culture through utility models and design patents.
The other case that is viz. that of India, although following a weak patent regime since 1970, is
different in one crucial respect from the East Asian countries in that it did not provide an
encouragement to adaptive and minor inventive activity of domestic enterprises with utility
models and design patents. In the chemicals and pharmaceuticals it did not prove a constraint as
the process patents in the absence of product patents essentially served the purpose of
encouraging process adaptive activity of domestic firms. As a result, the domestic chemicals and
pharmaceutical industries have developed in their capabilities considerably over the past three
decades. However, in the engineering industries and others, there was not a mechanism for
encouraging minor adaptations of domestic firms. This difference could perhaps explain not so
encouraging performance of Indian enterprises in other industries. Furthermore, IPR regime is
only one of the determinants of the technological capability building. The domestic
technological effort in absorbing the foreign technologies and innovations in East Asian
countries has been vastly more substantive and has been sustained over a much longer period
compared to India that attempted to build capabilities with softer patent regime only since the
mid-1970s.
IPP Regime Change and Development of Local Capability: The Indian Case
India had inherited The Patents and Designs Act 1911 from the colonial times that provided
for protection of all inventions and a patent term of 16 years. However, a few domestic
chemical and pharmaceutical enterprises that tried to develop their own technology in the
1960s were prevented to work their technologies by foreign patent owners using broad and
vague provisions of the Patent Act. Under pressure from domestic industry, government
adopted a new Patents Act in 1970 that reduced the scope of patentability in food, chemicals
and pharmaceuticals to only processes and not products. The term of process patents was
reduced to 7 years in food, drugs and chemicals and to 14 years for other products. The
compulsory licenses could be issued after three years. It is by now widely recognized that the
1970 Act has facilitated the development of local technological capability in chemicals and
pharmaceutical industry by enabling the process development activity of domestic firms as
confirmed by a number of quantitative studies. The gradual build up of technological
capability of Indian enterprises is visible from a rising trend of residents in patent ownership
in India, and in terms of the ability of India to raise her share in the US patents. India ranked
6
seventh amongst all developing countries in terms of US patents obtained (ahead of Brazil,
China and Mexico) and fourth in the chemicals sector and in biotechnology (in 1998).
In particular, the rapid evolution of Indian pharmaceutical industry since the mid-1970s
highlights the fact that weak IPRs regime could be instrumental in building local capabilities
even in a poor country such as India. In 1970 much of the country’s pharmaceutical
consumption was met by imports and the bulk of domestic production of formulations was
dominated by MNE subsidiaries. By 1991, domestic firms accounted for 70 per cent of the bulk
drugs production and 80 per cent of formulations produced in the country. With their cost
effective process innovations, Indian companies have emerged as competitive suppliers in the
world of a large number of generic drugs. A steady growth of India’s exports of drugs and
pharmaceuticals has transformed the industry from being one being highly import dependent to
one that generates increasing export surplus for the country. The share of pharmaceuticals in
national exports has increased from 0.55 per cent in 1970-71 to over 4 per cent by the 1999/00.
India’s share in world exports of pharmaceuticals has risen by 2.5 times over the 1970 to 1998
period making her the second largest exporter of pharmaceuticals after China among developing
countries. Inter-firm comparisons show that domestic enterprises are more dynamic in terms of
growth of investment and output, export-orientation, R&D activity, technology purchases and
labour productivity compared to MNE subsidiaries. The development of process innovation
capability of Indian enterprises has enabled them to introduce newer medicines within a short
time lag of their introduction in the world market. The drug prices in India at a fraction of those
prevailing in the developed countries are among the cheapest in the world making them
affordable to poor masses. The technological capabilities of Indian companies and institutions
have attracted leading MNEs to start R&D joint ventures, commission contract research and set
up R&D centres.
Thus the Indian pharmaceutical industry has evolved from one dependent upon imports and
some formulation activity in the late sixties to one that is able to introduce some of the most
sophisticated products indigenously produced within a relatively short lag and at a fraction of
the cost, and export a growing proportion of its produce. It is a remarkable achievement
especially because it has been accomplished within two decades of the change of patent
regime. The case study of India, besides those of the East Asian countries, further highlights
the critical importance of fine-tuning and calibrating the IPR regime to the level of
development of the country.
7
Implications of the TRIPs Regime for Developing Countries
The full implementation of the TRIPs Agreement is likely to have an important bearing on the
patterns of development in developing countries. The process of acquisition of local
technological capability by developing countries is likely to suffer a set back. The strengthening
of IPRs regime may further limit the access of technology by developing country enterprises. A
number of local enterprises in developing countries will come under pressure to close down or
form alliances with larger firms, resulting in a concentration of the industry and dependence on
imports may go up. Drug prices are likely to go up upon introduction of product patents with
substantial welfare losses to developing countries. TRIPs will lead to a substantial increase in
flow of royalties and license fees from developing countries to developed countries. It is by no
means clear that strengthening of IPRs will increase inventive activity even in the developed
world especially for solving the problems and diseases faced by developing countries. A
strengthened IPP regime may actually slow down the pace of technological development by
stifling the flow of R&D spillovers that are important inputs in research.
Issues for National and International Action to Moderate the Adverse Effect
Among the policy responses that developing country governments can take at the national level
include exploiting the policy spaces available in the TRIPs Agreement fully. These include:
incorporating the provisions of compulsory licensing in the IPR legislation, incorporating the
research exception, early working exception or ‘Bolar’ provision, allowing parallel imports or
grey-market imports, incorporating breeders exceptions and farmers exceptions in sui generis
plant variety protection. In addition effective competition policy could help in dealing with
possible abuse of monopoly power by patent owners. Price controls could also be useful for
keeping prices of essential drugs under check. The experience of several East Asian countries
suggests that petty patents and industrial design patents could be effective means of
encouraging domestic enterprises to undertake minor adaptive innovations and foster a
innovation based rivalry among them. Finally, developing countries should resist the attempts
of developed countries to evolve TRIPs plus patent regime and ever-greening of patents.
Among the areas for international action include: building a consensus on the moratorium on
further strengthening of IPR regime, granting flexibility to low income developing countries
below a certain level of per capita income in implementing the provisions of TRIPs,
incorporating specific provisions for transfer of technology, and adopting differential pricing
8
strategies for developed and developing countries. Finally, one of the ways of compensating
the low income countries for the adverse effects of strengthened IPR regime is to provide
increased technical assistance and international R&D funding to local enterprises to help them
build local capabilities. One possibility in this respect could be that developed countries donate
(a substantial proportion of) technology license fees collected from low income countries to a
fund created in the respective countries to assist inventive activities of domestic enterprises.
Furthermore, the additional funding for research on tropical diseases recommended by CMH, for
instance, could be made available exclusively to eligible and competent institutions and
companies of low income countries to help moderate some of the adverse effects on the
inventive activity in these countries.
9
1. Introduction There has been a lot of controversy on the role of intellectual property protection (IPP)
regime especially the patent system in fostering innovation, technology and industrial
development of a country. IPP is expected to encourage innovation by rewarding the inventor
with the grant of monopoly rights over the commercial exploitation of their inventions for a
specified period. On the other hand, strong IPP regime may inhibit diffusion of knowledge
and even technology development in the countries that are technology followers. The history
suggests that countries have fine-tuned their IPP regimes as per their developmental
requirements. Typically, countries in Asia and in other regions have had softer IPP regimes in
the early stages of their development and these regimes have been strengthened as the
countries developed and became significant producers of innovations and new technology
themselves. In particular, some countries, such as India, have successfully developed cost-
effective processes to produce life saving drugs with softer patent regimes. This enabled the
national health system to provide affordable medicines to masses of poorer people.
Against this backdrop, the on-going attempt to harmonize and strengthen the IPP regimes
worldwide, as a part of the TRIPs Agreement, is widely seen to be adversely affecting the
technological activity in developing countries by choking the knowledge spillovers from
industrialized countries to developing countries. Furthermore, the implementation of the
provisions of TRIPs Agreement threatens the access and affordability of poor people to
lifesaving drugs by pushing up their prices. This has been highlighted by the recent
controversy regarding the availability of AIDS drugs in South Africa.
In this context, this paper critically reviews the literature on the role of IPP regime with a
particular reference to the Asian countries to draw policy options for consideration by the
Commission. The structure of the paper is as follows. Section 2 summarizes some global
patterns and trends in technology generation and transfer as a background for the analysis of
the paper. Section 3 presents a selective review of literature on relationships between IPRs,
technology and development from a developing country perspective. It covers empirical
literature on the role of IPP regime in influencing innovative activity, trade, FDI and
licensing activity specially in developing countries. Section 4 examines the evidence on the
role played by IPP regimes in technology and economic development in three East Asian
countries that are known for a rapid accumulation of technological capability viz. Japan,
South Korea and Taiwan. Section 5 presents a case study of a poorer country trying to build
10
technological capability especially in pharmaceutical industry to provide affordable
medicines to its poor masses with switchover from a strong to a weaker IPR regime as India
did in 1970. Section 6 summarizes the implications of the on-going attempts towards
standardization and harmonization of IPR regimes world-wide as a part of TRIPs Agreement
on technology and economic development in developing countries, in the light of above
evidence. Section 7 concludes the paper with some remarks on the policy options for national
IP regimes in developing countries and for the international community.
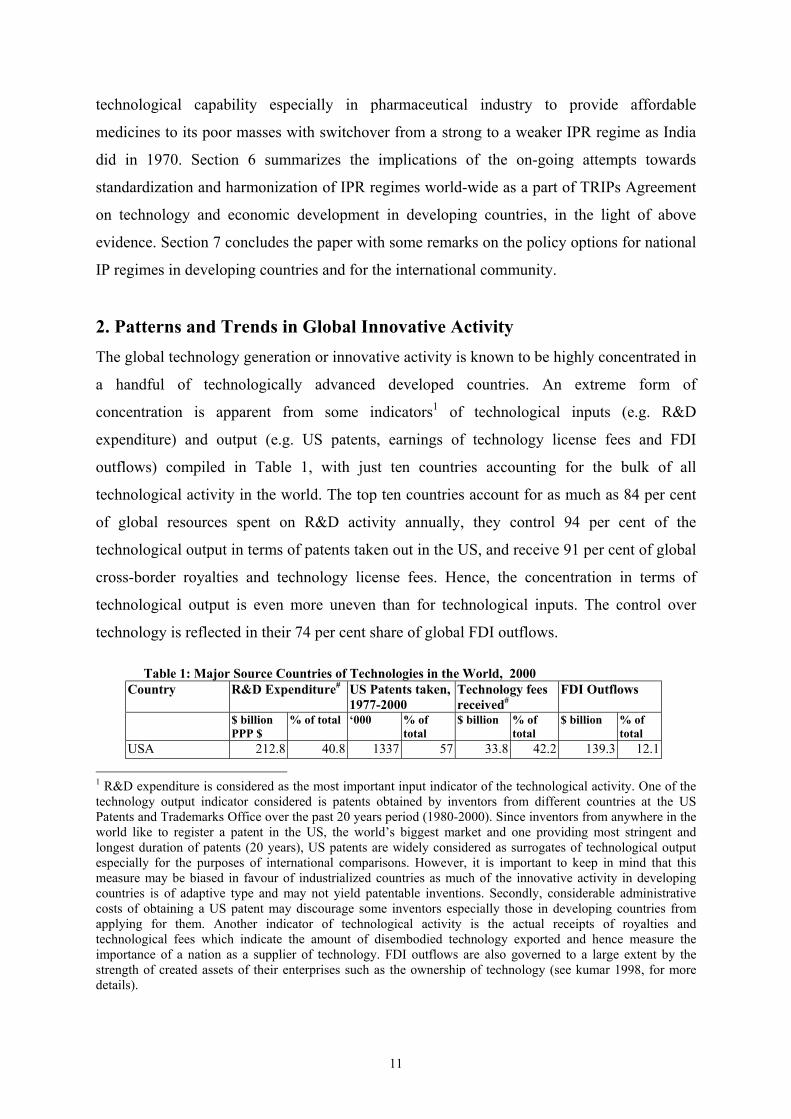
2. Patterns and Trends in Global Innovative Activity The global technology generation or innovative activity is known to be highly concentrated in
a handful of technologically advanced developed countries. An extreme form of
concentration is apparent from some indicators1 of technological inputs (e.g. R&D
expenditure) and output (e.g. US patents, earnings of technology license fees and FDI
outflows) compiled in Table 1, with just ten countries accounting for the bulk of all
technological activity in the world. The top ten countries account for as much as 84 per cent
of global resources spent on R&D activity annually, they control 94 per cent of the
technological output in terms of patents taken out in the US, and receive 91 per cent of global
cross-border royalties and technology license fees. Hence, the concentration in terms of
technological output is even more uneven than for technological inputs. The control over
technology is reflected in their 74 per cent share of global FDI outflows.
Table 1: Major Source Countries of Technologies in the World, 2000 Country R&D Expenditure# US Patents taken,
1977-2000 Technology fees received#
FDI Outflows
$ billion PPP $
% of total ‘000 % of total
$ billion % of total
$ billion % of total
USA 212.8 40.8 1337 57 33.8 42.2 139.3 12.1
1 R&D expenditure is considered as the most important input indicator of the technological activity. One of the technology output indicator considered is patents obtained by inventors from different countries at the US Patents and Trademarks Office over the past 20 years period (1980-2000). Since inventors from anywhere in the world like to register a patent in the US, the world’s biggest market and one providing most stringent and longest duration of patents (20 years), US patents are widely considered as surrogates of technological output especially for the purposes of international comparisons. However, it is important to keep in mind that this measure may be biased in favour of industrialized countries as much of the innovative activity in developing countries is of adaptive type and may not yield patentable inventions. Secondly, considerable administrative costs of obtaining a US patent may discourage some inventors especially those in developing countries from applying for them. Another indicator of technological activity is the actual receipts of royalties and technological fees which indicate the amount of disembodied technology exported and hence measure the importance of a nation as a supplier of technology. FDI outflows are also governed to a large extent by the strength of created assets of their enterprises such as the ownership of technology (see kumar 1998, for more details).
11
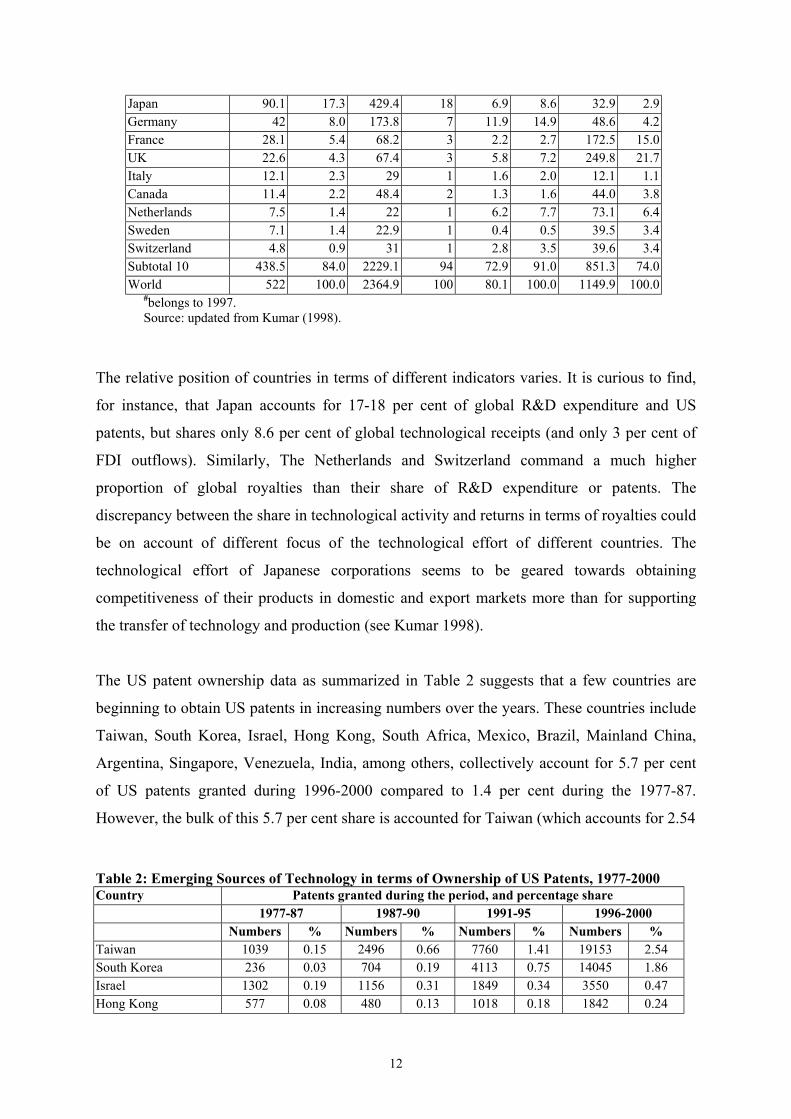
Japan 90.1 17.3 429.4 18 6.9 8.6 32.9 2.9 Germany 42 8.0 173.8 7 11.9 14.9 48.6 4.2 France 28.1 5.4 68.2 3 2.2 2.7 172.5 15.0 UK 22.6 4.3 67.4 3 5.8 7.2 249.8 21.7 Italy 12.1 2.3 29 1 1.6 2.0 12.1 1.1 Canada 11.4 2.2 48.4 2 1.3 1.6 44.0 3.8 Netherlands 7.5 1.4 22 1 6.2 7.7 73.1 6.4 Sweden 7.1 1.4 22.9 1 0.4 0.5 39.5 3.4 Switzerland 4.8 0.9 31 1 2.8 3.5 39.6 3.4 Subtotal 10 438.5 84.0 2229.1 94 72.9 91.0 851.3 74.0 World 522 100.0 2364.9 100 80.1 100.0 1149.9 100.0
#belongs to 1997. Source: updated from Kumar (1998).
The relative position of countries in terms of different indicators varies. It is curious to find,
for instance, that Japan accounts for 17-18 per cent of global R&D expenditure and US
patents, but shares only 8.6 per cent of global technological receipts (and only 3 per cent of
FDI outflows). Similarly, The Netherlands and Switzerland command a much higher
proportion of global royalties than their share of R&D expenditure or patents. The
discrepancy between the share in technological activity and returns in terms of royalties could
be on account of different focus of the technological effort of different countries. The
technological effort of Japanese corporations seems to be geared towards obtaining
competitiveness of their products in domestic and export markets more than for supporting
the transfer of technology and production (see Kumar 1998).
The US patent ownership data as summarized in Table 2 suggests that a few countries are
beginning to obtain US patents in increasing numbers over the years. These countries include
Taiwan, South Korea, Israel, Hong Kong, South Africa, Mexico, Brazil, Mainland China,
Argentina, Singapore, Venezuela, India, among others, collectively account for 5.7 per cent
of US patents granted during 1996-2000 compared to 1.4 per cent during the 1977-87.
However, the bulk of this 5.7 per cent share is accounted for Taiwan (which accounts for 2.54
Table 2: Emerging Sources of Technology in terms of Ownership of US Patents, 1977-2000 Country Patents granted during the period, and percentage share
1977-87 1987-90 1991-95 1996-2000 Numbers % Numbers % Numbers % Numbers %
Taiwan 1039 0.15 2496 0.66 7760 1.41 19153 2.54 South Korea 236 0.03 704 0.19 4113 0.75 14045 1.86 Israel 1302 0.19 1156 0.31 1849 0.34 3550 0.47 Hong Kong 577 0.08 480 0.13 1018 0.18 1842 0.24
12
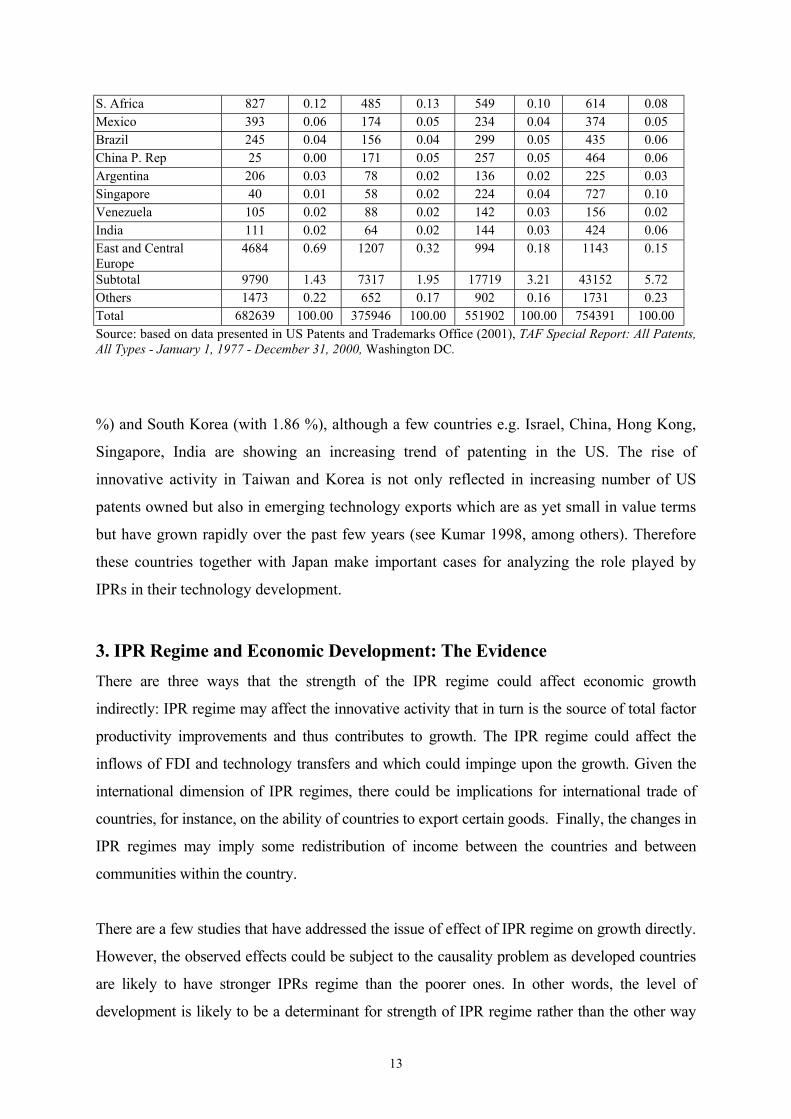
S. Africa 827 0.12 485 0.13 549 0.10 614 0.08 Mexico 393 0.06 174 0.05 234 0.04 374 0.05 Brazil 245 0.04 156 0.04 299 0.05 435 0.06 China P. Rep 25 0.00 171 0.05 257 0.05 464 0.06 Argentina 206 0.03 78 0.02 136 0.02 225 0.03 Singapore 40 0.01 58 0.02 224 0.04 727 0.10 Venezuela 105 0.02 88 0.02 142 0.03 156 0.02 India 111 0.02 64 0.02 144 0.03 424 0.06 East and Central Europe
4684 0.69 1207 0.32 994 0.18 1143 0.15
Subtotal 9790 1.43 7317 1.95 17719 3.21 43152 5.72 Others 1473 0.22 652 0.17 902 0.16 1731 0.23 Total 682639 100.00 375946 100.00 551902 100.00 754391 100.00 Source: based on data presented in US Patents and Trademarks Office (2001), TAF Special Report: All Patents, All Types - January 1, 1977 - December 31, 2000, Washington DC. %) and South Korea (with 1.86 %), although a few countries e.g. Israel, China, Hong Kong,
Singapore, India are showing an increasing trend of patenting in the US. The rise of
innovative activity in Taiwan and Korea is not only reflected in increasing number of US
patents owned but also in emerging technology exports which are as yet small in value terms
but have grown rapidly over the past few years (see Kumar 1998, among others). Therefore
these countries together with Japan make important cases for analyzing the role played by
IPRs in their technology development.
3. IPR Regime and Economic Development: The Evidence There are three ways that the strength of the IPR regime could affect economic growth
indirectly: IPR regime may affect the innovative activity that in turn is the source of total factor
productivity improvements and thus contributes to growth. The IPR regime could affect the
inflows of FDI and technology transfers and which could impinge upon the growth. Given the
international dimension of IPR regimes, there could be implications for international trade of
countries, for instance, on the ability of countries to export certain goods. Finally, the changes in
IPR regimes may imply some redistribution of income between the countries and between
communities within the country.
There are a few studies that have addressed the issue of effect of IPR regime on growth directly.
However, the observed effects could be subject to the causality problem as developed countries
are likely to have stronger IPRs regime than the poorer ones. In other words, the level of
development is likely to be a determinant for strength of IPR regime rather than the other way
13
round. Ginarte and Park (1997) in a study covering 110 countries for the period 1960-90
corroborated that either the level of economic development or factors correlated with it e.g. the
level of R&D activity, market environment, and international integration explain the strength of
patent protection provided by countries. Furthermore, Maskus and Penubarti (1995) find the
relationship between IPR protection and level of development to be non-linear suggesting that
patent protection tends to decline in strength as economies move beyond the poorest stage into a
middle-income stage in which they have greater abilities to imitate new technologies (for a
cross-section of 99 countries)2. Therefore, the finding of Gould and Gruben (1996) that found a
significant positive effect of the strength of patent protection (as measured by Rapp and Rozek,
1990) on growth of 79 countries (after controlling for investment rates and human capital
development) particularly for open economies could be subject to causality bias. The indirect
nature of the possible effect of IPRs on growth is also confirmed by Park and Ginarte (1997).
Thompson and Rushing (1996) empirically observe that universally imposed minimum
standards for patent protection are not likely to contribute to increased growth in developing
countries. However, stronger patent protection could contribute to economic growth rates once a
particular level of development has been achieved. In a further refinement to their earlier results,
Thampson and Rushing (1999) find that patent protection could be positively associated with
improvement in total factor productivity, and hence growth, in wealthy or developed countries.
Therefore, the IPR regime could affect economic growth and development through other
variables such as innovative activity, FDI inflows and technology transfers. In what follows the
evidence on the effect of IPR regime on innovative activity and FDI and technology transfer and
trade is reviewed.
IPRs as Determinants of Innovative Activity
The main argument offered in favour of tighter and more stringent laws to protect intellectual
property and patent rights is to provide better conditions for appropriability of innovations.
However, the existing empirical literature suggests [Cohen 1995, for review] that the
effectiveness of patent protection varies from industry to industry and is most effective only in
chemical and pharmaceutical industries. A study by Mansfield (1986) showed that around 65 per
cent of pharmaceutical and 30 per cent of chemical inventions would not have taken place but 2 Evenson (1992) refers to the emerging countries as ‘technology draft’ countries as they focus on technology imitation, reverse engineering, and adaptation.
14
for patent protection. In the case of most other industries patent protection was not important. In
the case of most of the engineering industries, and in particular, electrical & electronic goods,
and instruments etc. patent protection was not found to be essential for the introduction of
inventions. This finding was confirmed by most of the subsequent studies. For instance, a survey
conducted by Levin et al. (1987) showed that product patents were found to be highly effective
as means of appropriating returns only in five of 130 narrowly defined lines of businesses. These
five included drugs, organic chemicals, pesticides. Shankerman (1991) in an analysis of French
patent renewal data for the period 1969-72, concludes that while patents may be a significant
source of returns to innovative enterprises, they are not the major ones. The main reason for
limited effectiveness of patents is the ability of competitors to legally ‘invent around’ patents.
Gallini (1992) finds that longer patent life pushes the rivals to invent around the patent
inventions. Hence, optimal patent life are sufficiently short to discourage imitation. These
studies also revealed that secrecy to be more effective than patents in protecting process
innovations. Besides in the case of several high technology industries like aerospace and
industrial machinery the complexity of the products made reverse engineering very costly and
imitation difficult even without patent protection (Cohen 1995). Hall (1991) using a game
theoretic model of a R&D race to analyze the effect of weakening patents has on the timing and
profitability of R&D, found that in general, a second innovation (or inventing around) would
occur later than it would have if the IPR policy had not been weakened. Scherer and Weisburst
(1995) examined the impact of strengthening of pharmaceutical patent protection in Italy since
1978. They concluded that the regime change had little or no impact on the trend of inflation-
adjusted R&D expenditures or on the introduction of new chemical entities. Hence, they
expressed their scepticism on the prospect of the trend of lengthening of patent protection with
TRIPs Agreement in significantly raising innovative activity especially in developing countries.
Cohen and Levinthal (1989), in their comprehensive model explaining R&D intensity,
considered technological opportunity as well as appropriability as determinants and also
assessed the net impact of the spillovers of R&D. Technological opportunity is a function of
technological and research output in that area as well as the output of other R&D units which the
patent owners wish to protect by reducing the spillover effects. On the other hand the spillover
effect is one of the notable inputs to R&D. The analysis showed that the positive absorption
incentive associated with spillovers seemed to increase relative to the negative appropriability
incentive in the case of many industries. A more detailed analysis conducted to examine whether
the spillovers on balance actually encouraged R&D in some industries found that in the case of
15
chemicals and electrical and electronics, R&D intensities increased with spillovers. Therefore,
the available evidence does not indicate that further tightening of patent laws would increase
expenditures on R&D. On the contrary, strong patent laws could even hurt subsequent R&D
effort by restricting spillovers.
In this context it might also be useful to recall that Schumpeter had argued for a short-term
monopoly profits to encourage innovation and not for a legal institutionalized monopoly
position. He had emphasized that monopoly offered no cushion to sleep on and hence the
temporary state of monopoly resulting from the possession of a new technology. In the medium
and long term the firm would be subject to the threat of competition and the advent of better or
improved products from rivals. Hence, the need for the firm to safeguard its market position
through continuous innovative activities. It was this process that prevented the original creator of
a new technology from being complacent and prompted the monopolist to be constantly
creative. A legal protection as provided by the patent system for a rather longer term of twenty
years, therefore, erodes the threat of potential competition and hence, the need for continuous
improvement (see Kumar and Siddharthan 1997).
The importance of foreign R&D spillovers as a determinant of R&D activity could be even more
critical in developing countries where much of the R&D activity is of an adaptive nature. A
number of studies have empirically demonstrated the ability of rather weaker intellectual
property rights in stimulating domestic innovative activity in developing countries to absorb
spillovers of foreign R&D. Fikkert (1993) in a study of Indian enterprises found evidence of
their R&D activity absorbing considerable foreign R&D spillovers facilitated by weak Indian
patent regime. He suggested that a ‘weak patent regime may allow spillovers simultaneously to
promote R&D and to have a positive direct effect on productivity’ and concluded that the
adoption of a ‘stronger patent regime may not be optimal from either the short- or long-run
perspectives’. Similarly, Kumar and Saqib (1996) found Indian chemical industry enterprises to
be among the more innovative ones in the Indian industry. They attributed this to the weak
patent laws viz. absence of product patents in India which enabled Indian enterprises to
undertake alternative process development.
The importance of spillovers from innovative activity in developed countries for domestic
technological effort in developing countries facilitated by softer IPRs has also been corroborated
by other studies. Haksar (1995) estimated marginal products of R&D and technology imports
16
and their spillover effects using the Reserve Bank of India data for 642 Indian firms distributed
across 65 industries for 1975-1990 period. His finds both local R&D and disembodied
technology imports generating positive spillovers. In the pharmaceutical industry the return to
R&D were found to be particularly large and was explained in terms of highly successful
adaptive R&D effort of Indian firms directed at development of alternative processes of known
drugs made possible by the absence of patents on pharmaceutical products.
The above review of literature suggests that the evidence on the role of IPRs as a determinant of
innovative activity is quite weak. In fact stronger IPRs may actually affect the innovative
activity adversely by chocking the absorption of knowledge spillovers that are important
determinants of innovative activity. Mazzoleni and Nelson (1998) is a survey of theoretical and
empirical studies also conclude that ‘there is reason for concern that the present movement
towards stronger patent protection may hinder rather than stimulate technological and economic
progress.’
IPRs, FDI Inflows, Technology Licensing and Trade
There has been a considerable controversy on the role of intellectual property protection in
determining inward FDI flows and their effect on technology licensing and trade. In the OLI
theory of international operations of firm (see Dunning 1993, among others), exports, FDI and
arm’s length technology licensing are considered as alternative modes of servicing a foreign
market by firms. Stronger protection increases the value or revenue productivity of a firm’s
intellectual property such as technology, brand and trade names. Stronger protection should help
exporters by making imitation and counterfeiting more difficult. The favourable effect of
stronger IPRs in foreign countries on exports has generally been confirmed empirically by a
number of studies [see Ferrantino 1993, Mascus and Penubarti 1995, and Smith 2001]3.
However the effect of IPR strength on FDI and licensing is not that straight forward. By
reducing the transaction cost of transfer of knowledge by MNEs to foreign countries, stronger
protection may encourage arm’s length licensing of the knowledge and reduce the need for
undertaking FDI (see, for instance, Mascus 1998, Yang and Mascus 2001). On the other hand, it
has been argued that poor IPR regime tends to adversely affect the investment climate and hence
the probability of MNE investments (Mansfield, 1994). Relatively little empirical verification of
these contentions that has been made has generally shown an insignificant influence of the 3 However, Braga (1995) finds the effect of stronger IPRs on trade flows to be ambiguous. Mascus (1998) found a significant negative effect of foreign patent protection on exports of US parents shipped to their affiliates.
17
extent of IPP on inward FDI (see Correa 2000a, for a review). Frischtak (1989) and Bosworth
(1980) did not find a significant role of IPRs in influencing the pattern of FDI and technology
transfers respectively. Ferrantino (1993) found no discernible impact of a country's adherence
to IPR agreements on the arm's length exports or subsidiary sales (i.e. FDI) of US firms. But
subsidiaries in countries adhering to IPRs had a greater chance of sourcing more components
from the US than from the host countries. The affiliates in countries belonging to the Paris
Convention are also likely to have higher payments of royalties and licence fees than others.
The greater dependence on parents for sourcing components also creates greater potential for
transfer pricing. Since the 'U.S. is generally a low tax regime compared to LDCs, this
suggests that strong international IPRs may indirectly cause a diversion of tax revenue from
LDCs to the US treasury' (p.329). Kondo (1994) found no consistently significant
relationship between the strength of patent laws in terms of four alternative indicators and the
levels of and changes in US FDI in a sample of 33 countries over a 15 year period. Lee and
Mansfield (1996), on the other hand, in a sample of 14 countries (observations pooled over three
years) find the perceived weakness of intellectual property protection adversely affecting the
volume as well as the composition of US FDI inflows to the countries. However, given the small
size of sample, a rather subjective measurement of intellectual property regime (based on firm’s
perception), and low t-values of the coefficients, the findings could be considered only as
indicative unless replicated in larger samples. In a study covering 27 less developed countries for
the period 1975-90, Sayoum (1996) finds that IPR factors to be significant in explaining
variation in inward FDI and the effect was particularly strong for emerging countries. Mascus
(1998a) found that strength of patent protection had a negative effect on the sales and assets of
affiliates of US MNEs, although only the coefficient was statistically significant only in the
second case. However, the impact of patent protection affiliate sales and assets was positive and
significant in the case of developing countries sub-sample (out of a cross-section of 46 countries
for 1989-92 period).
Kumar (2000) examined the role of an index of the strength of patent protection (as measured by
Ginarte and Park 1997) in explaining the sales and value addition of affiliates of US and
Japanese affiliates in 74 countries in seven broad branches of industry and at three points of time
in the framework of an extended model of location of foreign production. The strength of patent
protection regime although with a positive sign never had a statistically significant coefficient
for affiliate sales or value added in the case of US MNEs. In the case of Japanese MNEs, the
results were sensitive to inclusion of dummy variables identifying the two tiers of Asian NIEs.
18
The coefficient of patent rights was not significantly different from zero in a full sample test
when the regional dummies are not included. When the Asian NIEs are separated with the
dummy variables, than the coefficient of patent rights becomes statistically significant with a
positive sign. This suggests that Japanese MNEs have tended to overlook the relatively weaker
IPR regime prevailing in the East and South East Asian countries for their outward investments.
Outside East and Southeast Asia, Japanese investments are concentrated in the European Union
and North America—countries having stronger IPR regime. Hence, one gets a positive
significant coefficient. In the sub-sample estimations for Japanese affiliate sales in developing
countries, patent rights variable comes up with a significant coefficient with a negative sign.
That could be explained in terms of high concentration of Japanese investment in developing
countries in those countries that have weaker IPR regime. The coefficient of the strength of
patent protection is never significantly different from zero while explaining the value added of
US and Japanese affiliates. The strength of patent regime does not appear to be a significant
factor in determining the patterns of US or Japanese FDI. Some further analysis of the same data
set at the level of seven broad sectors, currently in progress and reported in Kumar (2002b)
suggests that strength of patent protection does not influence the patterns of US affiliate sales in
any of the seven branches of manufacturing except the miscellaneous industry where it had a
significant but negative coefficient. Smith (2001) finds that foreign patent rights increase US
affiliate sales (i.e. FDI) as well as licenses. However, the effect is larger in the case of arm’
length licensing than for FDI. These conclusions are consistent with those of Yang and Mascus
(2001) who find that patent rights promote arm’s length trade and they have a less significant
effect on internalized technology transfers viz. FDI.
The issue of IPR protection links more directly with R&D activity in the context of globalization
of R&D activity of MNEs. MNEs may be apprehensive of locating their key R&D centres in
countries with weak patent regimes. However, where the overseas R&D is directed to local
adaptations and to providing other support to the local production of the MNE, and not directed
to new product development, the patent regime may not be of much consequence to it. Kumar
(1996) in a study explaining R&D intensity of affiliates of US MNEs in 54 countries in 1977,
1982, and 1989, found that strength of patent protection (Rapp and Rozek index) had a
significant positive influence on R&D intensity of affiliates located in developed countries and
has a negative coefficient in a developing country sub-sample which is not statistically
significant. Thus stronger patent protection does not appear to be a prerequisite even for R&D
investments by MNEs in developing countries. Kumar (1999) provides case study evidence
19
suggesting that MNEs have been locating R&D centres, R&D joint ventures and contracting
research in India in the field of chemicals and pharmaceuticals despite the patent regime not
recognizing product patents in these sectors. Therefore, availability of abundant trained low cost
human resources and scale of ongoing R&D in their own fields appear to be more important
considerations for location of R&D in developing countries than the strength of IPR regime.
These hypotheses were verified in a more recent study (Kumar 2001) that explained R&D
intensity of affiliates of US and Japanese MNEs in 74 countries in seven branches of industry
and at three points of time, 1982, 1989, and 1994. This study found that the strength of patent
protection (Ginarte and Park index) offered by the country remained statistically insignificant in
explaining R&D intensity of US and Japanese affiliates throughout. The bulk of the variation in
R&D intensity was explained by the abundance of R&D manpower and its relative cost, scale of
national technological effort and technological capability of the host country especially in the
field of the affiliate (Kumar 2001).
It would appear from the above that the contention that stronger norms of IPR protection will
facilitate greater inflows of FDI in the country is rather weak in either theoretical or empirical
terms. The theory suggests that stronger IPRs may tilt the balance between exports, FDI, and
licensing in favour of exports and arm’s length licensing. The empirical evidence has been
mixed generally supporting no strong effect of the strength of patent protection on FDI inflows,
their composition and even overseas R&D activity of MNEs. As Mascus (2000b) puts it, if
strong IPRs were able to provide sufficient incentives for firms to invest in a country, ‘recent
FDI flows to developing economies would have gone mainly to sub-Saharan Africa and Eastern
Europe. In contrast, China, Brazil and other high-growth, large-market developing economies
with weak protection would not have attracted nearly as much FDI’.
4. IPRs and Economic and Technological Development in East Asia The rapid and sustained growth and development in the East Asian economies, viz. Japan; South
Korea, Taiwan, Hong Kong and Singapore (first tier Asian nies), Malaysia, Thailand, and
Indonesia (second tier nies) and China, generally termed as the ‘East Asian Miracle’, has
attracted a large volume of literature [see for instance, World Bank 1993, Amsden 1989, Wade
1990, among many books and papers]. The growth rate of per capita income over the 1960-90
20
for these economies averaged over 5.5 per cent, making it the fastest growing region in the
world sustaining such rates of growth over such a long span of time. Japan and Asian nies have
been able to expand their share in world exports from 8 per cent in 1965 to 13 per cent in 1980
and 18 per cent in 1990, suggesting that their exports have expanded much faster than any other
region’s. Their share in world’s manufactured exports has grown from 11 to 21 per cent over the
same period. In particular rapid transformation of Korea and Taiwan from technologically
backward and poor economies into affluent and relatively modern economies by early 1990s has
been truly remarkable.
Some analysts have attempted to downplay the East Asian achievement as a result of factor
accumulation along the production function (see for instance, Krugman 1994, Young 1995)4.
However, since then a number of studies have corroborated that a substantial proportion of East
Asian growth was contributed by growth of total factor productivity (TFP) and it was not a result
of merely factor accumulation [see for instance, Singh and Trieu 1996, Nelson and Pack 1999,
Thomas and Wang 1996, Esterly 1994, Lau 1999, Pack and Page 1994, among others]. The total
factor productivity growth in Japan, Korea, Taiwan, Hong Kong and Thailand has averaged
between 2 to 4 per cent per year over 1960-89 thus contributing over a third of the growth of
output! (World Bank 1993: figure 1.11).
A large volume of literature has also been concerned with the explanation of the rapid TFP
growth in the East Asian countries. It is now widely accepted that the assimilation of foreign
technology was a ‘critical component of the Asian Miracle’ (Nelson and Pack 1999; also see
Westphal 2000, Kim 2000, Amsden 1989, Wade 1990, Hobday 1995, Lall 2000, among many
others). There seems to be a general consensus that the East Asian success owes a lot, in general,
to their ability to imitate, absorb, assimilate and replicate foreign innovations. Kim (2000)
highlights the role of ‘duplicative imitation’ in the Korean industries initially in the light
industries such as textiles, toys, consumer electronics in the 1960s and in such heavy industries
such as automobiles, steel, shipbuilding and machinery in the 1970s. Hobday (1995) provides
case studies of firm level learning in Korea as well as other East Asian countries. Singh and
4 A similar attempt to write off the success of East Asian countries was made following the East Asian crisis of 1997-98. However, all the countries recovered quickly from the crisis by 2000 (except for Indonesia). The crisis resulted from the lack of prudent norms governing the financial sector rather than from the lack of technological capabilities that have contributed to the TFP growth and in turn to the growth of output (see Nelson and Pack 1999).
21
Trieu (1996) provide econometric evidence suggesting that R&D expenditures in Japan, South
Korea and Taiwan have contributed to TFP growth.
The existing evidence on the role of IPRs regime in promoting growth is largely anecdotal.
Although the literature is not explicit in acknowledging its role, the soft intellectual property
protection regime adopted by these countries in the period of duplicative imitation or reverse
engineering has played and important role in facilitating the firm level technological learning.
Below we attempt to put together some evidence for Japan, Korea and Taiwan on the role weak
IPRs regime adopted by these countries have facilitated their technological and economic
development.
Japan Japan is known to have greatly benefited from intellectual property generated in other developed
countries in the early stages its development. In fact the two international treaties on the IPRs
viz. the Paris Convention (1883) for industrial property and the Berne Convention (1886) for
copyrights “were negotiated, in part because of frustration over alleged infringements in the
‘newly industrialising countries’ of the day, such as the United States and Japan” (Maskus
1998b: 347). Furthermore, in Japan the patent protection has been designed with an ultimate
objective of contributing to the ‘development of industry’ and not as an end by itself (Kotabe
1992). In tune with this objective it has contained several features that have helped the
absorption of spillovers of foreign inventive activity by domestic enterprises. For instance,
although Japanese Patent System (JPS) was established in 1885 by the Patent Monopoly
Ordinance that was replaced by the Patent Ordinance of 1888, the food, beverage,
pharmaceutical products and chemical compounds were excluded from the scope of patent
protection until 1975 to facilitate the process innovations. In 1905 the Utility Model Law was
introduced to provide protection to adaptations or improvements over the imported machinery or
equipment by domestic inventors that were considered too minor to be patented primarily. As
many as 99.9 per cent of utility models have been granted to Japanese nationals over the 1905-
79 period (Watanabe 1985:237). Furthermore, the JPS provides for protection of industrial
designs which only needed to demonstrate novelty and not inventiveness. The utility models and
industrial designs have allowed Japanese firms to receive protection on technologies that were
‘only slightly modified from the original invention’(Mascus and McDaniel 1999). JPS also
employs the first-to-file principle rather than the first-to-invent principle incorporated in the US
22
law, pre-grant disclosure that lays open or publishes the patent applications for inspection or
opposition for eighteen months, provides for compulsory license if a patent has not been worked
(i.e. used in manufacture) in Japan continuously for more than three years or in public interest,
and (until 1988) required the patent applications to be limited to a single narrow claim. All these
features have been designed to favour adpatations by domestic enterprises. That they have been
used to encourage technology adaptations by domestic entrepreneurs is clear from the fact that in
1980 Japan had awarded 49000 utility models to its nationals compared to just 533 to foreigners.
Similarly Japanese nationals were granted 31000 industrial design patents vis-à-vis 600 to
foreigners (Evenson 1991). There have also been complaints of discrimination by JPO and
foreign applicants appear to face longer pendency periods than do domestic applicants in Japan
(Kotabe 1992).
Mascus and McDaniel (1999) in a systematic quantitative study have found that the above
features namely utility models, design patents, compulsory licenses, first-to-apply, narrow
claims, among others, that make JPS considerably weaker than the US patent system, for
instance, have facilitated absorption, transfer and diffusion of technology by allowing reverse
engineering and contributed to the TFP growth during the period 1960-93. The scope of patent
system was expanded to cover chemical and pharmaceutical products only in 1975. Kotabe
(1992:150) attributes the regime change to the growing international pressure. However, it was
probably motivated by the realization that by 1970s, Japanese enterprises had developed their
technological capability adequately and hence needed protection for their own innovative
activity. In October 1970 the Japan Patent Association surveyed its member firms on whether
they favoured introduction of chemical product patents. About 60 per cent of the respondents
favoured product patents and only 9 per cent opposed. With this strong support from the
industry, the Japanese government began the process of amending Japanese patent law to
provide for product patents for chemicals and pharmaceuticals. The amendment was adopted by
the Diet in May 1975 and became effective from January 1976 (La Croix and Kawaura 1996).
South Korea South Korea adopted the patent legislation only in 1961. The Korean patent law was amended in
1981 to conform with the Paris Convention that provided for multiple claims for related
inventions in a single application. However, the scope of patenting did not cover patenting of
products and processes to manufacture food products, chemical substances and pharmaceuticals.
23
The US government initiated an investigation on Korea under Section 301 of the Trade Act
threatening trade sanctions on Korean exports for its failure to provide protection to US
products. That pushed Korea to strengthen its IPR regime. The revised patent, copyright, and
software legislation was passed by the National Assembly on 31 December 1986 and became
effective in July 1987 (US GAO 1987). The new law extended product patent protection to new
chemical and pharmaceutical products, adopted a comprehensive copyright law, and extended
copyright protection to computer software. The patent term was also extended from 12 to 15
years (La Croix and Kawaura 1996). Korea has also followed an IPR regime that facilitated
adaptations and imitative duplication of foreign technologies by domestic enterprises through
utility models and industrial designs. It is evident from the fact that 92 to 95 per cent of all utility
models and industrial designs have been granted to its nationals (WIPO statistics). The delibrate
softening of IPR regime by the government to facilitate imitation by domestic enterprises has
been acknowledged in the literature on Korean technological capability. Lee (2000:284), for
instance, observes that during the imitation stage, the ‘government tried to minimize IPR
protection to help domestic firms use foreign intellectual property. Laws and regulations were
formulated in such a way as to meet minimal international standards. Furthermore, enforcement
of the law was less than strict’. Kim (1997) provides highly illustrative case studies of several
industries documenting firm level successes in absorbing technology and other knowledge with
the help of duplicative imitation or reverse engineering and gradually emerging as innovators in
their own right. The softer patent regime adopted by the country facilitated this process of
reverse engineering. La Croix and Kawaura (1996) in an event study of the effect of the new
patent law on the market valuation of Korean pharmaceutical firms listed on the stock exchange
found a cumulative decline of –74 per cent over the 14 months period. Korea’s ability to absorb
foreign innovative activity through duplicative imitation has helped it to grow rapidly during the
1960-1980s. The real GDP expanded by 9.5 per cent per year during the 1965-1980 period and
by 8.6 per cent during 1980-87 period. Despite the new Patents Act of 1986 according product
patents for chemicals and pharmaceuticals, Korea continued on the priority watch list of the US
government under Special 301 till 1993 for enforcement concerns. In February 1993 Korea
launched a comprehensive new plan to strengthen IPRs protection and enforcement followed by
a new Patent Act in 1995. Nevertheless, Korea has often been regarded as being weak in
protecting IPRs (Suh 2000)
In view of the role played by soft patent regime in Korea’s development, Kim (2000) infers that
current trend of strengthening of IPR protection will pre-empt duplicative imitation of foreign
24
technologies by developing countries of today. Reverse engineering of foreign products for
duplicative imitation will be more difficult and costly for developing countries than it was for
Korea in the 1960s and 1970s. China, for instance, faces enormous pressure from the United
States to honour IPRs which Japan, Korea and Taiwan did not face in their early
industrialization stage’.
Taiwan Taiwan has also employed a weak IPR policy to facilitate local absorption of foreign
knowledge through reverse engineering on the lines of Japan and South Korea. In fact
Taiwan’s government seem to openly encourage counterfeiting as strategy to develop local
industries. In the mid-1980s an estimated 60 per cent of world’s pirated or counterfeit goods
were allegedly originating in Taiwan (Business Week, 16 Dec. 1985). Wade (1991:268-9)
documents a number of cases of government’s tacit approval of counterfeiting.
In a late 1970s case, several factories were found to be manufacturing circuit fuse breakers with forged Westinghouse and Mitsubishi labels. When Mitsubishi complained to the authorities, the firms were fined all of US$600. The government publicly denied that this was a serious case, while privately saying that "political factors" made it impossible to take tough action. Those political factors were the adamant opposition of most Taiwan firms and industry associations to any signs of tough enforcement, since they saw themselves as handsome beneficiaries of non-enforcement. And the government itself tended to view counterfeiting as a shortcut to industrial success. As recently as 1983 an unattributed government document entitled "Intellectual Property Rights Protection, a Republic of China Perspective," said with remarkable candor, "The R.O.C. government has viewed imitation as a necessary process in the evolution of human civilization and believed that commercial counterfeiting is an inevitable phenomenon in most developing countries. Local officials were cognizant of the negative aspects of counterfeiting although they made little effort to accommodate overseas interests or enhance domestic enforcement efforts when such aspects were seen to be outweighed by the positive development of the industrial base (Wade 1991: 268-9).
Lax treatment of IPRs in Taiwan attracted the attention of the US government. In March
1983, the US government instituted bilateral consultations on IPRs with Taiwan. As a result
of growing US pressure, Taiwan amended its copyright law in 1985 to strengthen penalties
for piracy, provide criteria for recognizing foreign firms’ standing before the Taiwanese
judiciary in copyright cases, and extend protection specifically to new media, including
software. This followed enactment of a new patent law in 1986 extending protection to
chemicals and pharmaceutical products [US GAO 1987]. However, these legislations and
their enforcement were considered inadequate by the US government. Under heavy pressure
25
from the US Taiwan promulgated its new Patent Law on January 21, 1994 that allows patents
on food, beverages, micro-organisms, and new uses for products, all of which were
previously excluded under the government’s social policy. In addition the duration for new
patents was extended from 15 years to 20 years. Like Japan and Korea, Taiwan also provides
for utility models (for 12 years duration under the new law) and design patents (term 10 years
under new law). However, many concerns have continued to remain. These include
elimination of imprisonment penalties for patent infringement while they continue for
violations of utility models and design patents primarily held by Taiwan nationals. There is a
provision for patent marking under which a patent owner who fails to mark the patent
certificate number on the patented article or packaging cannot claim damages from
infringement (http://www.state.gov/e/eb/rls/rpts/eptp).
Lessons from the East Asian Experience
To sum up this section, the East Asian countries viz. Japan, Korea and Taiwan have absorbed
substantial amount of technological learning under weak IPR protection regime during the early
phases. These patent regimes facilitated the absorption of innovation and knowledge generated
abroad by their indigenous firms. They have also encouraged minor adaptations and incremental
innovations on the foreign inventions by domestic enterprises and developed a patent culture
through utility models and design patents. As the local technological capabilities matured and
the domestic industry sought stronger protection for guarding their own inventions, the IPR
regime was strengthened in Japan in mid-1970s. In the other two countries, the IPR regime had
to be strengthened under US pressure. The other case that we examine in the following section,
viz. that of India, although following a weak patent regime since 1970, is different in one crucial
respect from the East Asian countries in that it did not provide an encouragement to adaptive and
minor inventive activity of domestic enterprises with utility models and design patents. In the
chemicals and pharmaceuticals it did not prove a constraint as the process patents in the absence
of product patents essentially served the purpose of encouraging process adaptive activity of
domestic firms. As a result, the domestic chemicals and pharmaceutical industries have
developed in their capabilities considerably over the past three decades. However, in the
engineering industries and others, there was not a mechanism for encouraging minor adaptations
of domestic firms. This difference could perhaps explain not so encouraging performance of
Indian enterprises in other industries (as observed by Mascus 1998b). Furthermore, IPR regime
is only one of the determinants of the technological capability building. The domestic
technological effort in absorbing the foreign technologies and innovations in East Asian
26
countries has been vastly more substantive and has been sustained over a much longer period
compared to India that attempted to build capabilities with softer patent regime only since the
mid-1970s. Before this India’s patent regime was comparable to those prevailing in the
developed countries.
5. Case of India India had inherited The Patents and Designs Act 1911 from the colonial times that provided
for protection of all inventions except those relating to atomic energy and a patent term of 16
years from the date of application. However, a few domestic chemical and pharmaceutical
enterprises that tried to develop their own technology in the 1960s ran into trouble with
foreign patent owners. A number of cases highlighted that foreign patent owners were neither
using their patents for domestic manufacture nor allowing them to be used by local firms5.
That led to a build-up of pressure in the late 1960s for a new patent law. Desai (1980) in a
questionnaire survey of 53 firms conducted in 1969 found that by and large foreign firms
were against any liberalization of patent laws, Indian firms were not against patents but
wanted greater access to patented know-how especially when patent owners not allowing
their patents to be used. The conflict of views was sharper in chemicals and pharmaceuticals
where patents had been used to prevent entry of Indian firms. Therefore, a new Patents Act
was adopted in 1970 that reduced the scope of patentability in food, chemicals and
pharmaceuticals to only processes and not products. Since virtually any chemical compound
5 Desai (1980) documents two of such cases. In one case Hoeshst prevented Unichem Laboratories
from producing tolbutamide using a technology licensed from Haffkine Institute of Bombay which had patented the process. The major difference was A handful of chemical and pharmaceutical firms which tried to develop their own technology ran into trouble with foreign patents in the sixties. In a case that became famous, ∗ Unichem Laboratories produced tolbutamide on licence from Haffkine Institute of Bombay which had patented the process. The major difference between the patents was that the Hoechst patent specified at a certain point that sulphur was to be eliminated from a thiouria 'in a conventional manner', and at another point that the elimination was to be done by 'a heavy metal oxide or a salt thereof'. The Haffkine Institute patent specified elimination by hydrogen peroxide. The judge disallowed the defendants' plea that the Hoechst patent was so general as to cover millions of products of which only 220 had been synthesized by Hoechst and still fewer pharmacologically tested, and ruled that the two patents referred to the same invention and that Unichem had infringed Hoechst's patent. In another instance aluminium phosphite, a concentrated fumigant, was patented and imported by a foreign firm. In the payments crisis on 1966 the Directorate-General of Technical Development asked the firm to produce it, but the firm said the process was too difficult to be tried in India. Thereupon Excel Industries produced the fumigant in 2.5 months and marketed it at half the cost of imports. The foreign firm then sent Excel a notice to cease infringement of its patent. After the Unichem judgment the Patents Office began to reject a larger proportion of applications on the grounds of vagueness or incompleteness. The proportion of examined applications so rejected went up from 5 per cent in 1968 to 11 and 16 per cent in the next two years. Chaudhuri (1984) documents many more such cases of foreign firms trying to undermine the building up of local production capability by domestic firms.
27
can be made by a variety of processes, the scope of patent protection was greatly reduced.
The term of process patents was reduced to 7 years in food, drugs and chemicals and to 14
years for other products. The compulsory licenses could be issued after three years.
The Indian Patents Act of 1970 has continued to govern the IPR regime in India over the past
30 years except for recent amendments brought to provide for exclusive marketing rights
(EMRs) in tune with India’s obligations under WTO’s TRIPs Agreement. India joined the
Paris Convention and the Patent Cooperation Treaty only in 1999. India has a ten years
transition to provide product patents viz. till the end of 2004. It is by now widely recognized
that the abolition of product patents in chemicals and pharmaceuticals has facilitated the
development of local technological capability in chemicals and pharmaceutical industry by
enabling the domestic firms in their process innovative activity. A number of quantitative
studies have shown that the innovative activity of Indian domestic enterprises was facilitated
by the softer patent regime under the 1970 Act (see Fikkert 1993, Haksar 1995, Kumar and
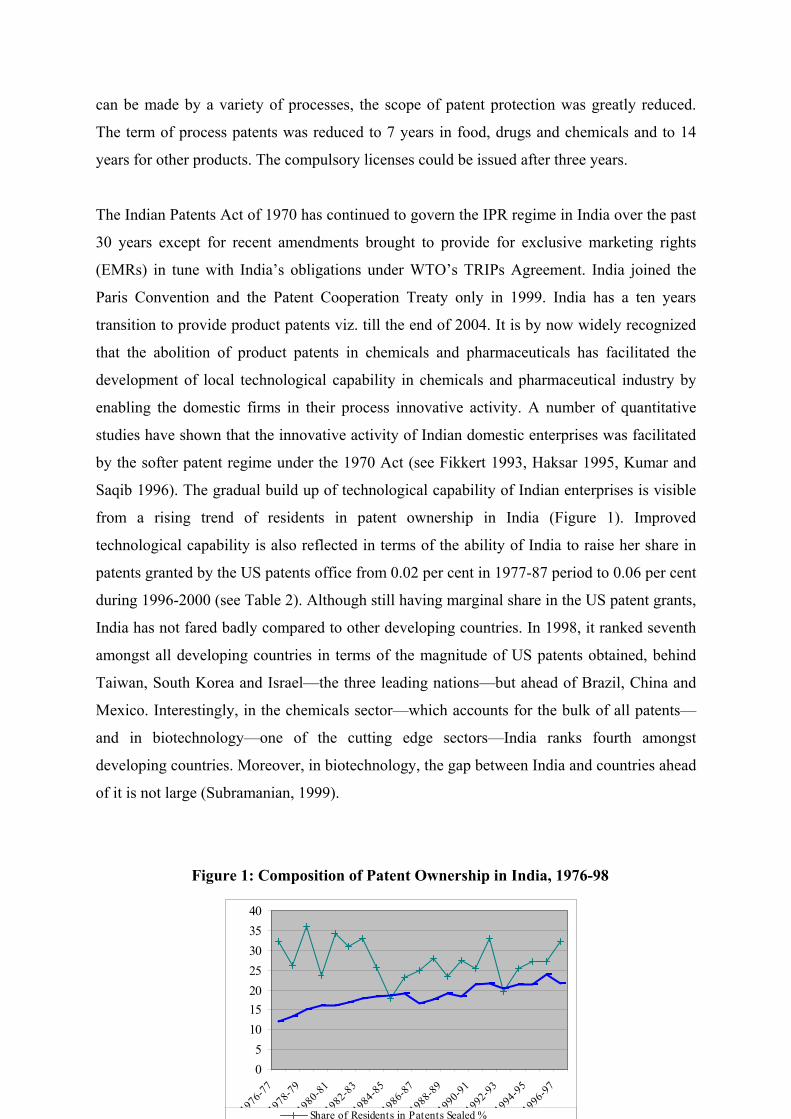
Saqib 1996). The gradual build up of technological capability of Indian enterprises is visible
from a rising trend of residents in patent ownership in India (Figure 1). Improved
technological capability is also reflected in terms of the ability of India to raise her share in
patents granted by the US patents office from 0.02 per cent in 1977-87 period to 0.06 per cent
during 1996-2000 (see Table 2). Although still having marginal share in the US patent grants,
India has not fared badly compared to other developing countries. In 1998, it ranked seventh
amongst all developing countries in terms of the magnitude of US patents obtained, behind
Taiwan, South Korea and Israel—the three leading nations—but ahead of Brazil, China and
Mexico. Interestingly, in the chemicals sector—which accounts for the bulk of all patents—
and in biotechnology—one of the cutting edge sectors—India ranks fourth amongst
developing countries. Moreover, in biotechnology, the gap between India and countries ahead
of it is not large (Subramanian, 1999).
Figure 1: Composition of Patent Ownership in India, 1976-98
2805
10152025303540
1976-77
1978-79
1980-81
1982-83
1984-85
1986-87
1988-89
1990-91
1992-93
1994-95
1996-97
Share of Residents in Patents Sealed %
Source: based on India, Department of Scientific and Industrial Research data
In particular, the rapid evolution of Indian pharmaceutical industry since the mid-1970s
highlights the fact that weak IPRs regime could be instrumental in building local capabilities
even in a poor country such as India. In what follows we take a look at some indicators of
evolution of technological capability of Indian pharmaceutical enterprises. In 1970 much of
the country’s pharmaceutical consumption was met by imports and the bulk of domestic
production of formulations was dominated by MNE subsidiaries. Of the top ten firms by
retail sales in 1970 only two were domestic firms and the others were MNE subsidiaries. In
1996 six of the top ten firms in the industry are Indian firms. By 1991, domestic firms
accounted for 70 per cent of the bulk drugs production and 80 per cent of formulations
produced in the country (Lanjouw 1998). The increasing technological capability is reflected in terms of rising exports of drugs and
pharmaceuticals. With their cost effective process innovations, Indian companies have
emerged as competitive suppliers in the world of a large number of generic drugs that are
now outside the patent protection. That has resulted in a steady growth of India’s exports of
drugs and pharmaceuticals. Thus the industry has evolved from being one being highly
import dependent to one that generates increasing export surplus for the country. The faster
growth of pharmaceutical exports has resulted in their share in India’s exports rising from
0.55 per cent in 1970-71 to over 4 per cent by the 1999/00 (Table 3). Emerging revealed
comparative advantage of India in pharmaceuticals is apparent from Table 4 which shows
that India’s share in world exports of pharmaceuticals has risen by 2.5 times while her share
in all merchandize exports has stagnated at about 0.6 per cent throughout the 1970 to 1998
period. India ranks second after China among developing countries in export of
pharmaceuticals and is ahead of such technologically advanced countries as Mexico, South
Korea, Brazil, Israel (Table 5).
Table 3: India’s Trade in Pharmaceutical Products, 1970-71 to 1999-2000 (Current prices) In Rs. Crores (10 millions)
Year Trade in medicinal and pharmaceutical products Pharmaceutical t % f
29
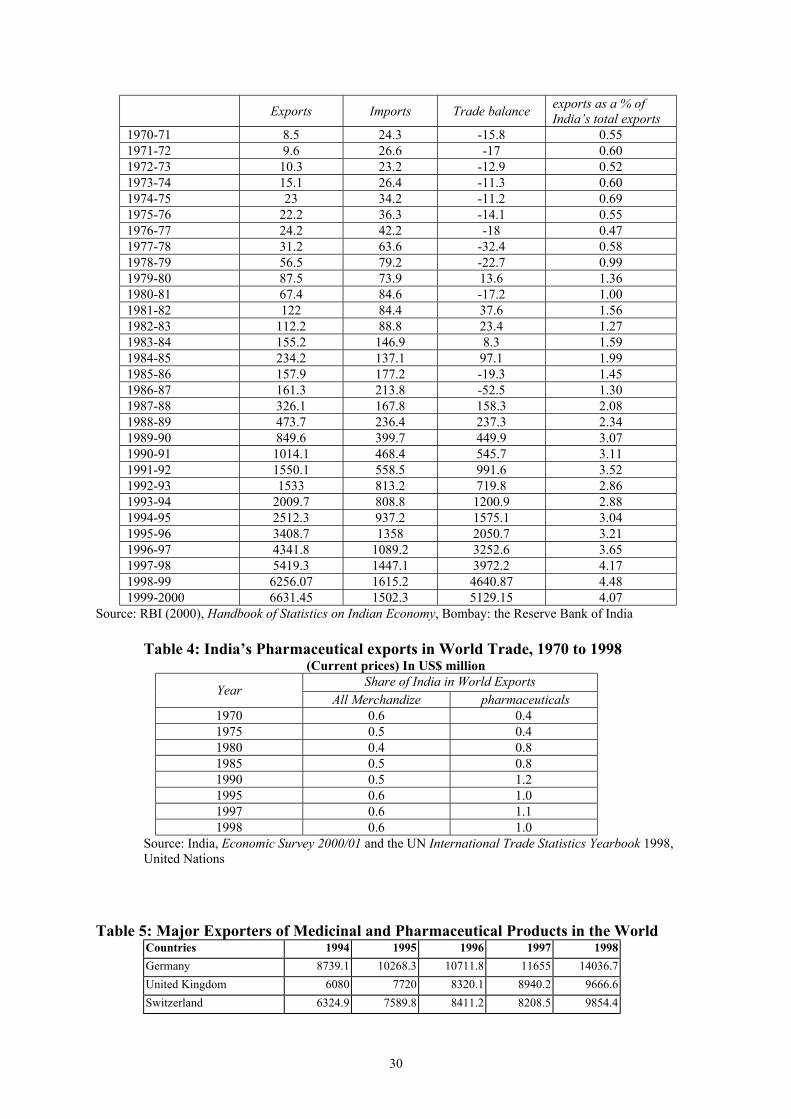
Exports Imports Trade balance exports as a % of India’s total exports
1970-71 8.5 24.3 -15.8 0.55 1971-72 9.6 26.6 -17 0.60 1972-73 10.3 23.2 -12.9 0.52 1973-74 15.1 26.4 -11.3 0.60 1974-75 23 34.2 -11.2 0.69 1975-76 22.2 36.3 -14.1 0.55 1976-77 24.2 42.2 -18 0.47 1977-78 31.2 63.6 -32.4 0.58 1978-79 56.5 79.2 -22.7 0.99 1979-80 87.5 73.9 13.6 1.36 1980-81 67.4 84.6 -17.2 1.00 1981-82 122 84.4 37.6 1.56 1982-83 112.2 88.8 23.4 1.27 1983-84 155.2 146.9 8.3 1.59 1984-85 234.2 137.1 97.1 1.99 1985-86 157.9 177.2 -19.3 1.45 1986-87 161.3 213.8 -52.5 1.30 1987-88 326.1 167.8 158.3 2.08 1988-89 473.7 236.4 237.3 2.34 1989-90 849.6 399.7 449.9 3.07 1990-91 1014.1 468.4 545.7 3.11 1991-92 1550.1 558.5 991.6 3.52 1992-93 1533 813.2 719.8 2.86 1993-94 2009.7 808.8 1200.9 2.88 1994-95 2512.3 937.2 1575.1 3.04 1995-96 3408.7 1358 2050.7 3.21 1996-97 4341.8 1089.2 3252.6 3.65 1997-98 5419.3 1447.1 3972.2 4.17 1998-99 6256.07 1615.2 4640.87 4.48 1999-2000 6631.45 1502.3 5129.15 4.07
Source: RBI (2000), Handbook of Statistics on Indian Economy, Bombay: the Reserve Bank of India Table 4: India’s Pharmaceutical exports in World Trade, 1970 to 1998
(Current prices) In US$ million Share of India in World Exports
Year All Merchandize pharmaceuticals
1970 0.6 0.4 1975 0.5 0.4 1980 0.4 0.8 1985 0.5 0.8 1990 0.5 1.2 1995 0.6 1.0 1997 0.6 1.1 1998 0.6 1.0
Source: India, Economic Survey 2000/01 and the UN International Trade Statistics Yearbook 1998, United Nations
Table 5: Major Exporters of Medicinal and Pharmaceutical Products in the World Countries 1994 1995 1996 1997 1998 Germany 8739.1 10268.3 10711.8 11655 14036.7 United Kingdom 6080 7720 8320.1 8940.2 9666.6 Switzerland 6324.9 7589.8 8411.2 8208.5 9854.4
30
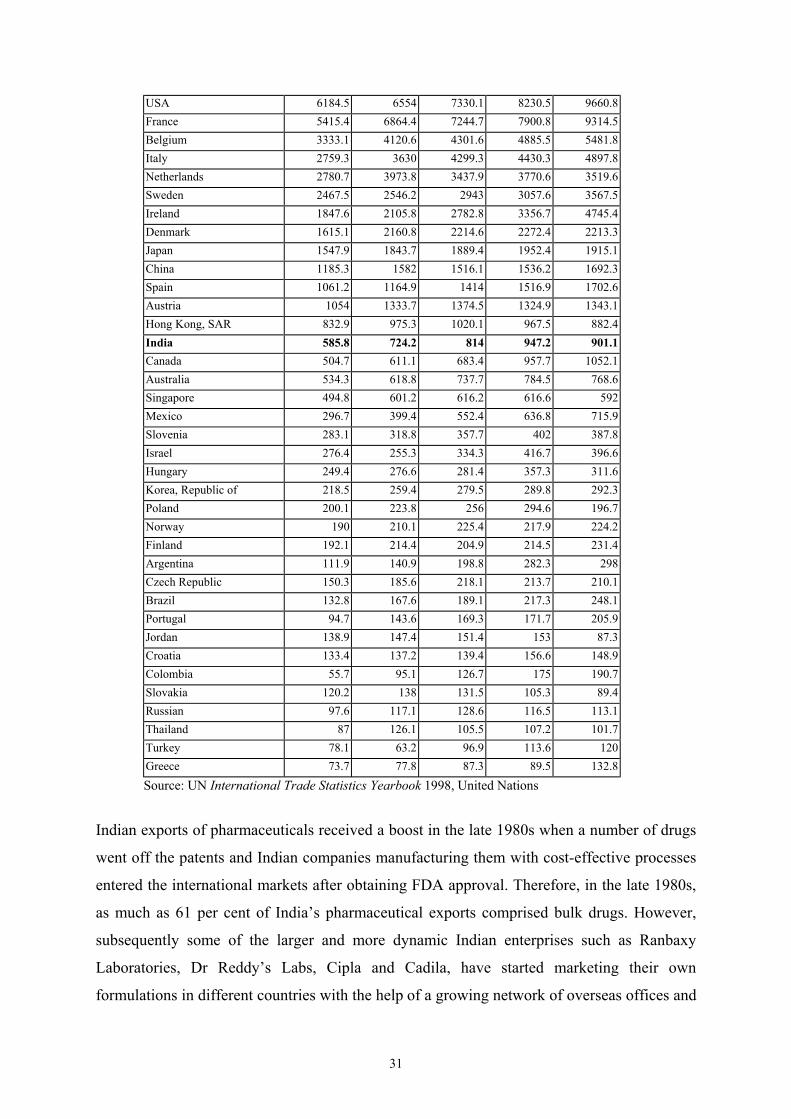
USA 6184.5 6554 7330.1 8230.5 9660.8 France 5415.4 6864.4 7244.7 7900.8 9314.5 Belgium 3333.1 4120.6 4301.6 4885.5 5481.8 Italy 2759.3 3630 4299.3 4430.3 4897.8 Netherlands 2780.7 3973.8 3437.9 3770.6 3519.6 Sweden 2467.5 2546.2 2943 3057.6 3567.5 Ireland 1847.6 2105.8 2782.8 3356.7 4745.4 Denmark 1615.1 2160.8 2214.6 2272.4 2213.3 Japan 1547.9 1843.7 1889.4 1952.4 1915.1 China 1185.3 1582 1516.1 1536.2 1692.3 Spain 1061.2 1164.9 1414 1516.9 1702.6 Austria 1054 1333.7 1374.5 1324.9 1343.1 Hong Kong, SAR 832.9 975.3 1020.1 967.5 882.4 India 585.8 724.2 814 947.2 901.1 Canada 504.7 611.1 683.4 957.7 1052.1 Australia 534.3 618.8 737.7 784.5 768.6 Singapore 494.8 601.2 616.2 616.6 592 Mexico 296.7 399.4 552.4 636.8 715.9 Slovenia 283.1 318.8 357.7 402 387.8 Israel 276.4 255.3 334.3 416.7 396.6 Hungary 249.4 276.6 281.4 357.3 311.6 Korea, Republic of 218.5 259.4 279.5 289.8 292.3 Poland 200.1 223.8 256 294.6 196.7 Norway 190 210.1 225.4 217.9 224.2 Finland 192.1 214.4 204.9 214.5 231.4 Argentina 111.9 140.9 198.8 282.3 298 Czech Republic 150.3 185.6 218.1 213.7 210.1 Brazil 132.8 167.6 189.1 217.3 248.1 Portugal 94.7 143.6 169.3 171.7 205.9 Jordan 138.9 147.4 151.4 153 87.3 Croatia 133.4 137.2 139.4 156.6 148.9 Colombia 55.7 95.1 126.7 175 190.7 Slovakia 120.2 138 131.5 105.3 89.4 Russian 97.6 117.1 128.6 116.5 113.1 Thailand 87 126.1 105.5 107.2 101.7 Turkey 78.1 63.2 96.9 113.6 120 Greece 73.7 77.8 87.3 89.5 132.8
Source: UN International Trade Statistics Yearbook 1998, United Nations
Indian exports of pharmaceuticals received a boost in the late 1980s when a number of drugs
went off the patents and Indian companies manufacturing them with cost-effective processes
entered the international markets after obtaining FDA approval. Therefore, in the late 1980s,
as much as 61 per cent of India’s pharmaceutical exports comprised bulk drugs. However,
subsequently some of the larger and more dynamic Indian enterprises such as Ranbaxy
Laboratories, Dr Reddy’s Labs, Cipla and Cadila, have started marketing their own
formulations in different countries with the help of a growing network of overseas offices and
31
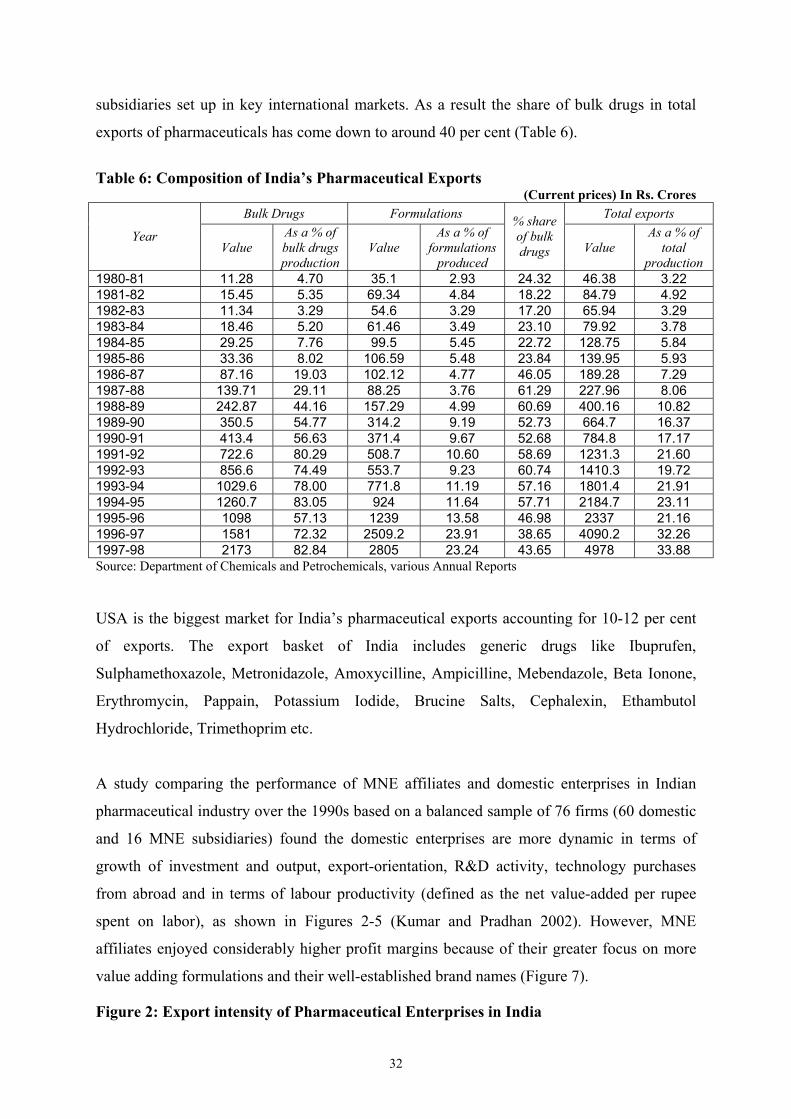
subsidiaries set up in key international markets. As a result the share of bulk drugs in total
exports of pharmaceuticals has come down to around 40 per cent (Table 6).
Table 6: Composition of India’s Pharmaceutical Exports
(Current prices) In Rs. Crores Bulk Drugs Formulations Total exports
Year Value
As a % of bulk drugs production
Value As a % of
formulations produced
% share of bulk drugs Value
As a % of total
production 1980-81 11.28 4.70 35.1 2.93 24.32 46.38 3.22 1981-82 15.45 5.35 69.34 4.84 18.22 84.79 4.92 1982-83 11.34 3.29 54.6 3.29 17.20 65.94 3.29 1983-84 18.46 5.20 61.46 3.49 23.10 79.92 3.78 1984-85 29.25 7.76 99.5 5.45 22.72 128.75 5.84 1985-86 33.36 8.02 106.59 5.48 23.84 139.95 5.93 1986-87 87.16 19.03 102.12 4.77 46.05 189.28 7.29 1987-88 139.71 29.11 88.25 3.76 61.29 227.96 8.06 1988-89 242.87 44.16 157.29 4.99 60.69 400.16 10.82 1989-90 350.5 54.77 314.2 9.19 52.73 664.7 16.37 1990-91 413.4 56.63 371.4 9.67 52.68 784.8 17.17 1991-92 722.6 80.29 508.7 10.60 58.69 1231.3 21.60 1992-93 856.6 74.49 553.7 9.23 60.74 1410.3 19.72 1993-94 1029.6 78.00 771.8 11.19 57.16 1801.4 21.91 1994-95 1260.7 83.05 924 11.64 57.71 2184.7 23.11 1995-96 1098 57.13 1239 13.58 46.98 2337 21.16 1996-97 1581 72.32 2509.2 23.91 38.65 4090.2 32.26 1997-98 2173 82.84 2805 23.24 43.65 4978 33.88 Source: Department of Chemicals and Petrochemicals, various Annual Reports
USA is the biggest market for India’s pharmaceutical exports accounting for 10-12 per cent
of exports. The export basket of India includes generic drugs like Ibuprufen,
Sulphamethoxazole, Metronidazole, Amoxycilline, Ampicilline, Mebendazole, Beta Ionone,
Erythromycin, Pappain, Potassium Iodide, Brucine Salts, Cephalexin, Ethambutol
Hydrochloride, Trimethoprim etc.
A study comparing the performance of MNE affiliates and domestic enterprises in Indian
pharmaceutical industry over the 1990s based on a balanced sample of 76 firms (60 domestic
and 16 MNE subsidiaries) found the domestic enterprises are more dynamic in terms of
growth of investment and output, export-orientation, R&D activity, technology purchases
from abroad and in terms of labour productivity (defined as the net value-added per rupee
spent on labor), as shown in Figures 2-5 (Kumar and Pradhan 2002). However, MNE
affiliates enjoyed considerably higher profit margins because of their greater focus on more
value adding formulations and their well-established brand names (Figure 7).
Figure 2: Export intensity of Pharmaceutical Enterprises in India
32
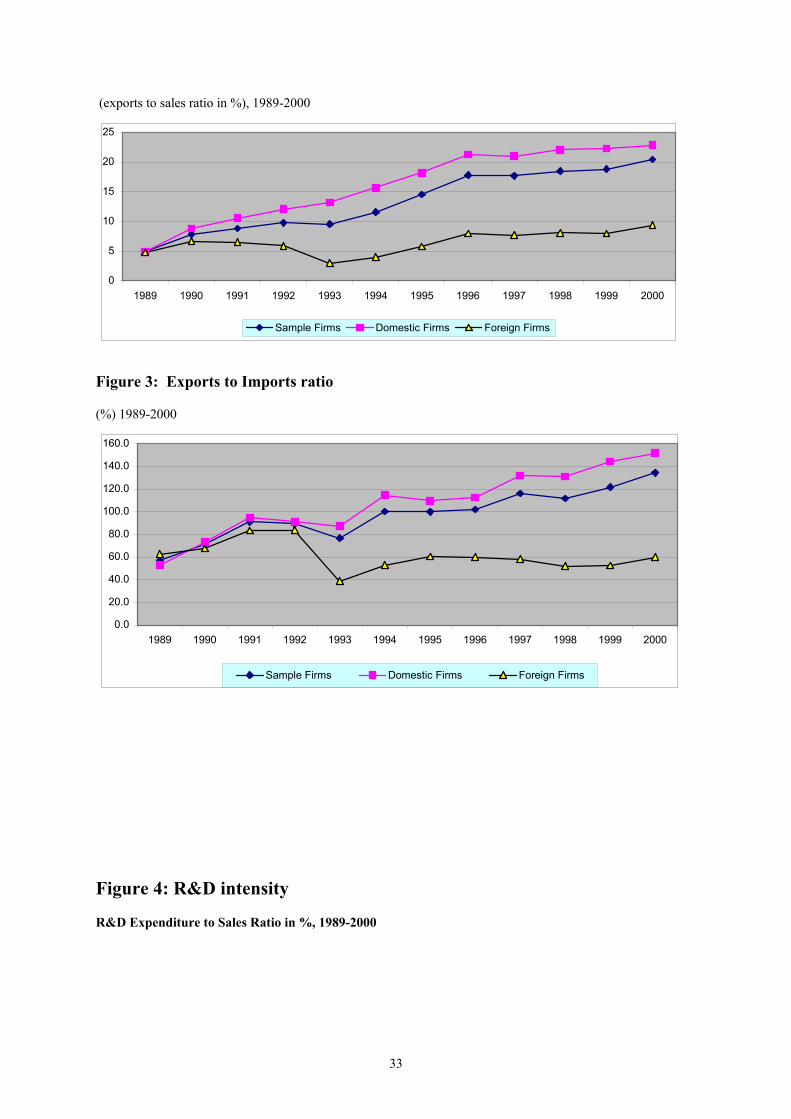
(exports to sales ratio in %), 1989-2000
0
5
10
15
20
25
1989 1990 1991 1992 1993 1994 1995 1996 1997 1998 1999 2000
Sample Firms Domestic Firms Foreign Firms
Figure 3: Exports to Imports ratio
(%) 1989-2000
0.0
20.0
40.0
60.0
80.0
100.0
120.0
140.0
160.0
1989 1990 1991 1992 1993 1994 1995 1996 1997 1998 1999 2000
Sample Firms Domestic Firms Foreign Firms
Figure 4: R&D intensity
R&D Expenditure to Sales Ratio in %, 1989-2000
33
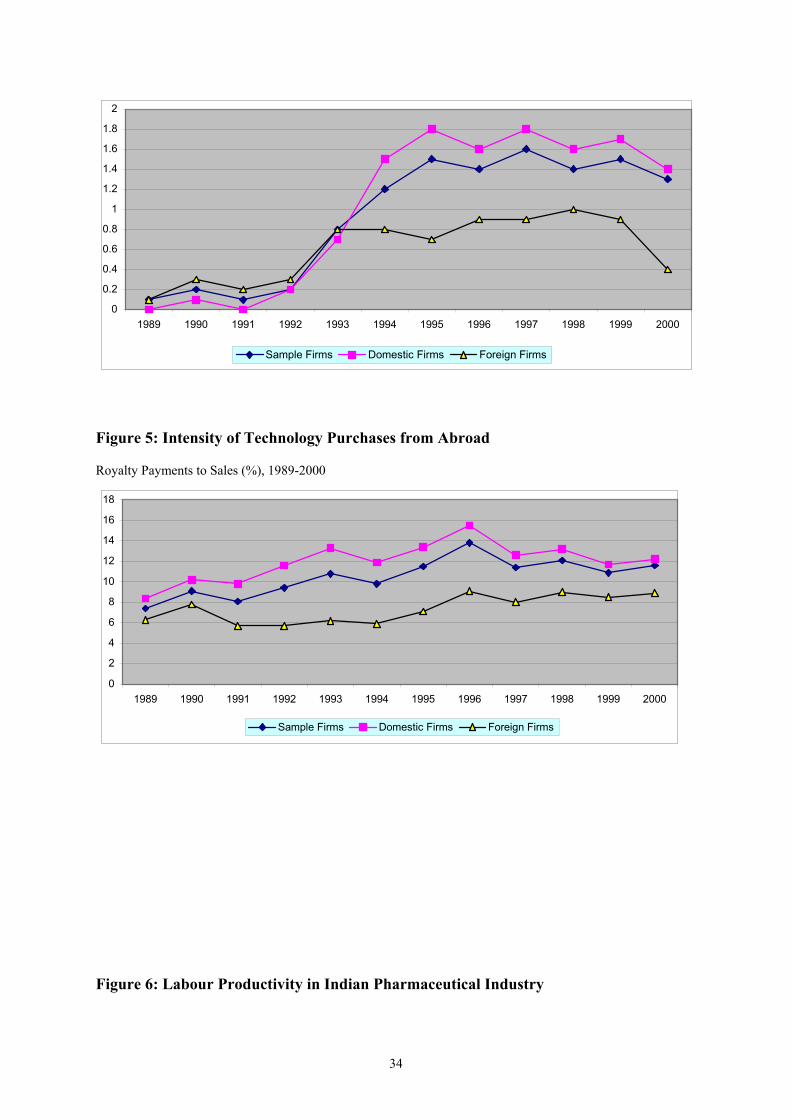
0
0.2
0.4
0.6
0.8
1
1.2
1.4
1.6
1.8
2
1989 1990 1991 1992 1993 1994 1995 1996 1997 1998 1999 2000
Sample Firms Domestic Firms Foreign Firms
Figure 5: Intensity of Technology Purchases from Abroad
Royalty Payments to Sales (%), 1989-2000
0
2
4
6
8
10
12
14
16
18
1989 1990 1991 1992 1993 1994 1995 1996 1997 1998 1999 2000
Sample Firms Domestic Firms Foreign Firms
Figure 6: Labour Productivity in Indian Pharmaceutical Industry
34
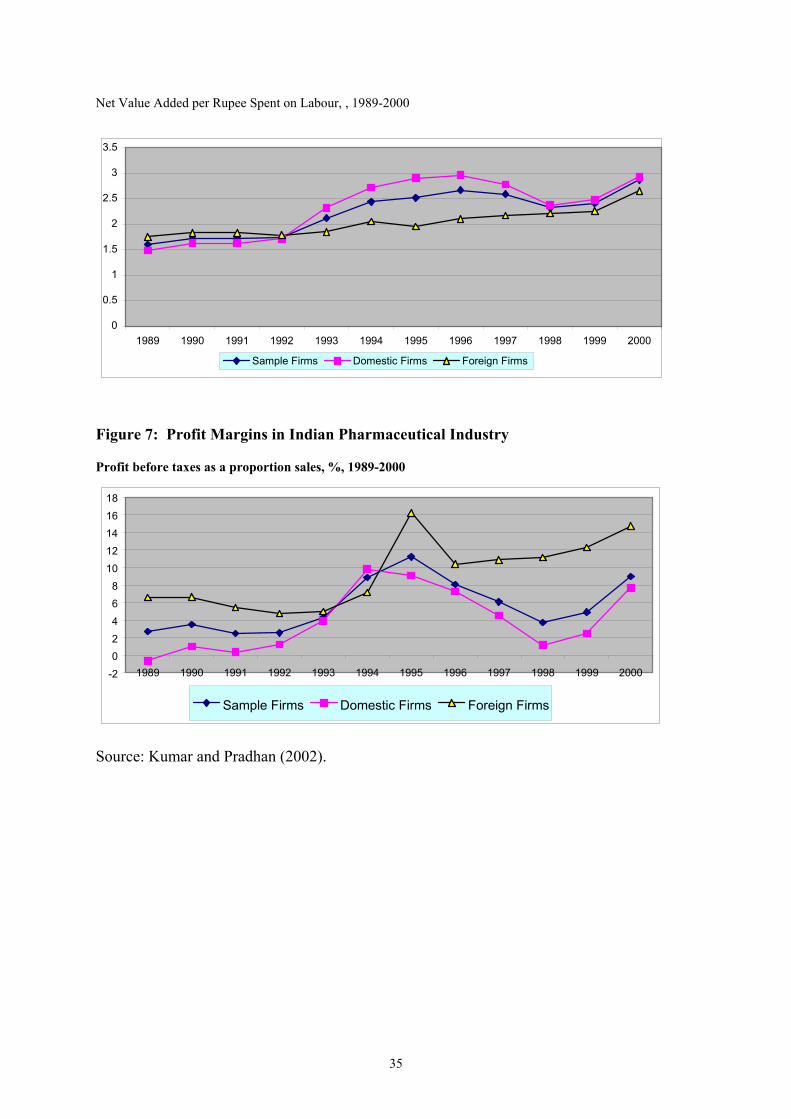
Net Value Added per Rupee Spent on Labour, , 1989-2000
0
0.5
1
1.5
2
2.5
3
3.5
1989 1990 1991 1992 1993 1994 1995 1996 1997 1998 1999 2000
Sample Firms Domestic Firms Foreign Firms
Figure 7: Profit Margins in Indian Pharmaceutical Industry
Profit before taxes as a proportion sales, %, 1989-2000
-202468
1012141618
1989 1990 1991 1992 1993 1994 1995 1996 1997 1998 1999 2000
Sample Firms Domestic Firms Foreign Firms
Source: Kumar and Pradhan (2002).
35
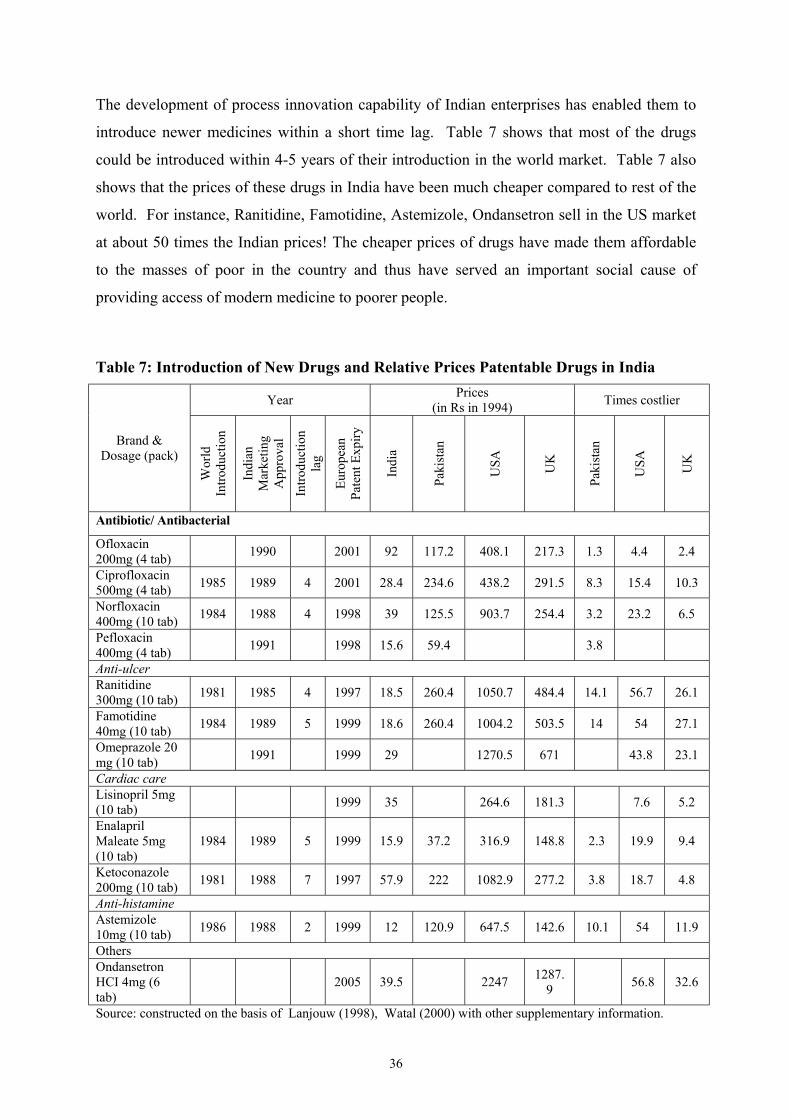
The development of process innovation capability of Indian enterprises has enabled them to
introduce newer medicines within a short time lag. Table 7 shows that most of the drugs
could be introduced within 4-5 years of their introduction in the world market. Table 7 also
shows that the prices of these drugs in India have been much cheaper compared to rest of the
world. For instance, Ranitidine, Famotidine, Astemizole, Ondansetron sell in the US market
at about 50 times the Indian prices! The cheaper prices of drugs have made them affordable
to the masses of poor in the country and thus have served an important social cause of
providing access of modern medicine to poorer people.
Table 7: Introduction of New Drugs and Relative Prices Patentable Drugs in India
Year Prices (in Rs in 1994) Times costlier
Brand & Dosage (pack)
Wor
ld
Intro
duct
ion
Indi
an
Mar
ketin
g A
ppro
val
Intro
duct
ion
lag
Euro
pean
Pa
tent
Exp
iry
Indi
a
Paki
stan
USA
UK
Paki
stan
USA
UK
Antibiotic/ Antibacterial
Ofloxacin 200mg (4 tab) 1990 2001 92 117.2 408.1 217.3 1.3 4.4 2.4
Ciprofloxacin 500mg (4 tab) 1985 1989 4 2001 28.4 234.6 438.2 291.5 8.3 15.4 10.3
Norfloxacin 400mg (10 tab) 1984 1988 4 1998 39 125.5 903.7 254.4 3.2 23.2 6.5
Pefloxacin 400mg (4 tab) 1991 1998 15.6 59.4 3.8
Anti-ulcer Ranitidine 300mg (10 tab) 1981 1985 4 1997 18.5 260.4 1050.7 484.4 14.1 56.7 26.1
Famotidine 40mg (10 tab) 1984 1989 5 1999 18.6 260.4 1004.2 503.5 14 54 27.1
Omeprazole 20 mg (10 tab) 1991 1999 29 1270.5 671 43.8 23.1
Cardiac care Lisinopril 5mg (10 tab) 1999 35 264.6 181.3 7.6 5.2
Enalapril Maleate 5mg (10 tab)
1984 1989 5 1999 15.9 37.2 316.9 148.8 2.3 19.9 9.4
Ketoconazole 200mg (10 tab) 1981 1988 7 1997 57.9 222 1082.9 277.2 3.8 18.7 4.8
Anti-histamine Astemizole 10mg (10 tab) 1986 1988 2 1999 12 120.9 647.5 142.6 10.1 54 11.9
Others Ondansetron HCI 4mg (6 tab)
2005 39.5 2247 1287.9 56.8 32.6
Source: constructed on the basis of Lanjouw (1998), Watal (2000) with other supplementary information.
36
The technological capabilities of Indian companies have grown to a point when leading MNEs
have started to take note of it. For instance, Eli Lilly established a joint venture with Ranbaxy in
the mid-1990s for development of a cost effective process for synthesis of Cefaclor, among
other products, taking advantage of the latter’s process development capabilities. Similarly,
Bayer contracted Ranbaxy to develop single doses formulations of its proprietary
Ciprofloxacine. A number of leading MNEs have also contracted Indian public funded R&D
institutions for synthesis of new molecules and process development. These include Abbot
Laboratories, Parke Davis, and Smith Kline and Beecham, among others, that have
commissioned Indian Institute for Chemical Technologies, Hyderabad and National Chemical
Laboratories, Pune (Kumar,1999, for more details). Astra (now Astra-Zeneca) has set up a full
fledged R&D centre in Bangalore to draw upon trained manpower and research infrastructure
available in the country, despite the fact that Indian patent regime does not provide product
patents.
Thus the Indian pharmaceutical industry has evolved from one dependent upon imports and
some formulation activity in the late sixties to one which is able to introduce some of the
most sophisticated products indigenously produced within a relatively short lag and at a
fraction of the cost, and export a growing proportion of its produce to emerge as a net foreign
exchange earner. It is a remarkable.achievement especially because it has been accomplished
within two decades of the change of patent regime. The case study of India, besides those of
the East Asian countries, further highlights the critical importance of fine-tuning and
calibrating the IPR regime to the level of development of the country.
6. Implications of the TRIPs Regime for Developing Countries The international environment with respect to intellectual property has changed considerably
with the conclusion of the TRIPs Agreement. The TRIPs Agreement accommodates the
demands of the industrialized countries for higher international standards of protection by
mandating the extension of patentability to virtually all fields of technology recognized in
developed country patent systems, by prolonging the patent protection for a uniform term of
twenty years, and by providing legal recognition of the patentee’s exclusive rights to import
the patented products. The patent rights are enjoyable without discrimination as to the place
of invention, the field of technology and whether products are imported or locally produced.
All the signatories to the trade negotiations are, therefore, obliged to harmonize their IPR
37
regime and to provide product patents for pharmaceuticals and chemicals. The coverage of
the patent protection has also been expanded by the provision for patents on micro-organisms
and protection of plant varieties either by patents or by an effective sui generis system or by any
combination thereof.
The full implementation of the TRIPs Agreement is likely to have an important bearing on the
patterns of development in developing countries. In what follows we briefly review some of the
important dimensions of these effects.
a) Local Technological Capability Building
The strengthening and harmonization of IPR regimes worldwide has considerable implications
for the process of acquisition of local technological capability by developing countries. The
provision of product patents on chemical and pharmaceutical products, for instance, would
adversely affect the process of innovative activity of the developing country enterprises in the
manufacture of chemicals covered by patents. The development of new chemical compounds is
generally beyond the capability of most developing country enterprises in view of the huge
resources involved. Therefore, they focus attention on process innovations for the known
chemicals and bulk drugs. This imitative duplication or reverse engineering activity is an
important source of learning in developing countries. Indeed, most industrialized countries of
today and newly industrialized countries encouraged local learning through soft patent laws and
the absence of product patents in chemicals in the early stages of their development as
highlighted earlier. It means that the poorer countries of today will not be able to benefit from an
important source of total factor productivity growth (viz. absorption of spillovers of foreign
inventions) that was available to countries that have developed already. In that respect the
TRIPs Agreement is highly inequitable.
The probability of stronger IPR regime encouraging innovative activity in developing countries
is very small. In fact the adoption of utility models or petty patents and design patents has a
greater potential in encouraging local technological activity rather than implementation of the
provisions of TRIPs in poorer countries.
b) Industrialization, Technology Transfers and Trade
Recent trends suggest a reversal of trend of the growing importance of arm’s length licensing as
a mode of technology transfer as MNEs prefer to internalize the technology transactions (see
38
Kumar 1998). The strengthening of IPRs regime may further limit the access of technology by
developing country enterprises. Kim (1997) provides a number of examples of Korean
corporations being denied technology licenses by patent holders in the Western world forcing
them to reverse engineer the products. A number of local enterprises in developing countries
will come under pressure to close down or form alliances with larger firms, resulting in a
concentration of the industry [World Bank 2002:137]. Dependence on imports may go up.
Mascus and Penubarti (1997) for instance, find that TRIPs could affect import volumes
significantly; e.g. in Mexico, the anticipated rise in manufactured imports could be of the
magnitude of $ 6.3 billion, amounting to 9.4 per cent of its real manufactured imports in 1995
(as cited in World Bank 2002:132).
c) Prices of Medicines and Loss of Consumer Welfare
A number of studies have examined the effect on prices of medicines after introduction of
product patents and have simulated welfare losses for consumers in developing countries. It is
widely believed that drug prices will go up upon introduction of product patents as happened in
China which introduced them in 1993 [May 2000:99; also see Lanjouw 1998, Scherer and Watal
2001, and Panagariya 1999]. Nogues (1993) finds the welfare losses to 6 developing countries
(Argentina, Brazil, India, Mexico, Korea and Taiwan) from introduction of product patents to be
between US$ 3.5 billion to $10.8 billion depending upon the assumptions. The gains to the
patent owners from such introduction would range between $ 2.9 billion to $ 14.4 billion. The
welfare loss to India could be between $ 1.4 billion to $ 4.2 billion in a year. Watal (2000)
simulates the likely increase in pharmaceutical prices and decrease in welfare in India with the
introduction of product patents in 22 existing pharmaceutical products and finds that weighted
mean drug price in India could increase between 26 per cent (for a linear demand function) to
242 per cent (with a constant elasticity-type demand function). An earlier study by Subramanian
(1994) had found the maximum price increase of 67 per cent for India following the introduction
of product patents. Fink (2000) finds the range of price increase between 182 to 225 per cent.
That suggests that introduction of product patents would affect prices of medicines significantly
and unless new drugs are more efficient, there will be a decline in the health levels of population
(May 2000). The recent case of huge differences between prices of HIV Aids drugs sold by
patent holders in South Africa and their generic substitutes just provides an further evidence to
the potential of price increases following the introduction of product patents. It may be argued
that the vast majority of drugs are out of patent protection and hence will not be affected. Yet the
39
AIDS drugs controversy shows that effective treatment for many of scourges of the day such as
cancer, cardiac failures, renal problems, among others, may be affected.
d) Income Transfers from Developing Countries
Given the near complete domination of developed countries on technology generation as evident
from the 95 per cent ownership of US patents (Table 1), the strengthening and harmonization of
IPRs regime will lead to a substantial increase in flow of royalties and license fees from
developing countries to developed countries. McCalman (1999) quantifies the impact of patent
harmonization finds that it has the capacity to generate large transfers of income between
countries, with US being the major beneficiary. World Bank (2002: Table 5.1) updates the
computations of McCalman and suggests that the net patent rents derived by the US (in 2000
US$) could add up to over $ 19 billion, to Germany $ 6.7 billion, and Japan $ 5.7 billion.
Among the developing countries, China could see an outflow of patent rents of the order of $5.1
billion, India $ 903 million, Israel $ 3.8 billion.
Furthermore, the extension of IPRs to plant varieties could further increase the outgo of royalties
for the breeder lines of the seed companies even though the basic raw material for the
development of these varieties, viz. genetic diversity which is largely found in developing
countries and is supposedly the work of generations of farmers in these countries, is generally
available to them free.
e) Impact on Global Technological Activity and Availability of Drugs
One of the arguments in favour of a stronger IPR regime is based on the premise that
expenditures on R&D were significantly determined by appropriability conditions. Hence,
ensuring adequate appropriability with more stringent IPR protection was deemed to be a
necessary condition for sustaining the pace of innovation in the global economy. The empirical
literature, however, does not support this presumption as patent protection was found to be
instrumental for only a small proportion of innovations. On the other hand, studies show that
spillover effects of R&D activity of other firms to be a lot more important in inducing firms to
undertake R&D compared to appropriability. The R&D outputs of other firms form valuable
inputs for the R&D efforts of these firms. Hence, tightening of IPRs is likely to affect innovative
activity adversely by stifling these spillovers. Therefore, it is by no means clear that
strengthening of IPRs will increase innovative activity even in the developed world especially
for solving the problems and diseases faced by developing countries. As World Bank (1999)
40
cautions ‘there is now a risk of excessively strict IPRs adversely affecting follow-on innovations
and actually slowing down the pace of (technological development)’. Furthermore, the research
priorities of MNEs are determined by the purchasing power and very little R&D is currently
done on tropical diseases (World Bank 2002). Unless some steps are taken by the international
community, such as those discussed by the recent report of WHO’s Commission on
Macroeconomics and Health (CMH), the pattern is not likely to change significantly in the
future.
7. Issues for National and International Action The preceding discussion suggests that the ongoing trend of strengthening and harmonization of
IPR regime is going to affect the process of development of poorer countries in a significant
manner by choking an important contributor of growth that has been variously described as
imitative duplication, reverse engineering or knowledge spillovers from abroad. It is also likely
to affect the prices of a large number of important drugs and thus affect the health systems in
poorer countries. It would lead to income transfers from poorer to richer countries. It is likely to
adversely affect the manufacturing activity in developing countries and may increase their
imports but does not guarantee increased in FDI inflows, access to technology or R&D
investments in tropical diseases. These challenges require a response at the national policy levels
as well as a response from the international community. In what follows, we outline some of the
policy responses that could help in moderating the adverse effects of TRIPs Agreement on
developing countries.
Policy Responses to be taken at the National Level
a) Incorporating the Provisions of Compulsory Licensing in the IPR Legislation
Developing countries should build adequate provisions for compulsory licensing in their IPR
legislation in order to safeguard them from possible abuses of monopoly power obtained by
patent owners. The compulsory licenses are permitted under Article 31 of the TRIPs Agreement.
The Agreement does not limit the grounds upon whch compulsory licenses may be granted and
only sets forth the conditions to be applied in the case of granting (see Correa 2000b). This
includes specification of grounds of compulsory licensing and the reasonable rates of licensing
fees (Scherer and Watal 2001, for a detailed analysis). Recent withdrawal of proceedings by the
US against Brazil’s compulsory licensing provisions show that intelligently crafted domestic
41
patent laws can meet national objectives and yet be TRIPs compatible (Raizada and Sayed
2001).
b) Incorporating the Research Exception
Developing countries could incorporate provisions allowing researchers to use a patented
invention for research, in order to understand the invention more fully. Experimentation on a
patented invention is clearly admissible as an exception to exclusive rights under Article 30
(Correa 2000b).
c) Early Working Exception or ‘Bolar’ Provision
It is possible to make provision for allowing manufacturers of generic drugs to use the patented
invention to obtain marketing approval without patent owner’s permission and before the
expiration of patent. This facilitates the generic manufacturers to market their products as soon
as the patent expires. This provision is sometimes called the regulatory exception or Bolar
provision under Article 8 (WTO 2001). The US, Canada, Australia, Israel and Argentina have
adopted Bolar exception in their patent legislation (see Correa 2000b).
d) Resisting the Attempts to Evolve TRIPs Plus Regime and Ever-greening of Patents
Developed countries are constantly putting pressure on developing countries to implement
stricter patent legislation than required under TRIPs, exclude compulsory licensing, parallel
imports provisions and include provisions that would result in increasing the life of the patent
(ever-greening), as well as grant data exclusivity to them. The TRIPs Agreement however, is
clear that a new use for an old formulation does not constitute an inventive step (Art. 27(1)).
Therefore, member countries are within their rights not to permit the practice of ever-greening of
patents.
e) Allowing Parallel Imports or Grey-Market Imports
Since ‘exhaustion of rights’ issue cannot be raised in the dispute settlement under TRIPs
Agreement, developing countries should allow parallel imports or grey-market imports. The
experience of several countries suggests that substantial costs savings could result from such
imports because of differential pricing strategy practiced by MNEs depending upon the extent of
competition in different markets.
f) Competition Policy
42
The patent system grants temporary monopolies to the firms that introduce innovations. The
national competition or antitrust policies are needed to prevent the build up of excessive
monopoly power of certain enterprises and to deal with possible abuse of monopoly power
emanating from patent protection. The TRIPs Agreement (Articles 8 and 40, Section 8)
explicitly provides for appropriate measures to prevent the abuse of IPRs or the resort to anti-
competitive practices (also see Roffe 1998). Apparently in the US, ‘compulsory licensing has
been specified as a remedy in more than 100 anti-trust cases making available some 40,000 to
50,000 patents at reasonable or no royalties’ (Scherer as cited in Nogues 1990).
g) Incorporating Breeders Exceptions and Farmers Exceptions in sui generis Plant Variety
Protection
TRIPs Agreement allows flexibility to the member countries to exclude plant varieties from the
scope of patent protection and instead opt for an effective sui generis system. In order to
minimize the adverse effect on the plant breeding programmes and protecting small and
marginal farmers from buying seeds who typically save them for the next crop, developing
countries could build provisions for exceptions for farmers and plant breeders. They should also
participate effectively in the mandated Reviews of the Agreement under Article 27.3(b) to
protect their interests.
h) Price Controls for Essential Drugs
To protect the poor masses from the price increases following the introduction of product
patents, governments may impose regulation of prices of essential drugs. To keep the price
controls effective, transparent formula for evolving them could be made providing for a
reasonable mark-up over the cost. Indian experience shows that price controls have proved to
be effective means of keeping prices of life saving essential drugs under check. However,
given the possibility of transfer pricing manipulation, there may be complications in
administering price controls for imported drugs.
i) Introduce Utility Models and Industrial Design Patents
The experience of several East Asian countries suggests that petty patents and industrial
design patents could be effective means of encouraging domestic enterprises to undertake
minor adaptive innovations and foster a innovation based rivalry among them.
Policy Responses at the International Level
43
The recent controversy concerning the HIV AIDS drugs in South Africa, among other
factors, has helped to focus attention of the international community on the possible adverse
effects of the implementation of TRIPs Agreement on poorer countries. Over the past year a
number of international initiatives have been taken to deal with the matter. These include
establishment of the Commission on Macroeconomics and Health by the WHO and
Commission on IPRs by the British Government. WHO and WTO organized a Workshop on
Differential Pricing and Financing of Essential Drugs at Hosbjor, April 2001. The Fourth
Ministerial Meeting in Doha in November 2001 adopted a Declaration on TRIPs Agreement
and Public Health. UNDP’s Human Development Report 2001 as well as World Bank’s
Global Economic Prospects 2002 reports focused on the IPRs and their impact for
developing countries. However, these initiatives are yet to lead to a concrete outcome
addressing the many problems that are raised by the TRIPs Agreement. In what follows we
summarize a few avenues for possible international action.
a) Moratorium on Further Strengthening of IPR Regime
There is tendency in some developed countries to treat provisions of TRIPs as the minimum
standards and are constantly attempting to evolve stronger norms through unilateral or
bilateral approaches. A consensus needs to be built on the need to put a moratorium on such
approaches for the next couple of decades or so.
b) Granting Flexibility to Developing Countries in Implementing the Provisions of TRIPs
Most of the adverse effects concerning TRIPs on poor countries arise not because of IPR
regimes but from the attempt to harmonize them across the countries at different levels of
development (Panagariaya 1999). Thhere is also a discussion whether TRIPs should
fundamentally belong to WTO (Mashelkar 2001). However, the least that could be done is
allowing flexibility to developing countries to implement the provisions of the Agreement as
and when their level of development has reached a certain stage. This could be achieved if a
consensus among the developed countries is built on the differential need of developing
countries for IPR regime6. A possible revision of TRIPs could incorporate a provision that
grants to developing countries a flexibility to implement the TRIPs obligations until they
reach a per capita income of the level of US$ 1000, for instance. Another possibility could be
to shorten the term of product patents applicable to low income countries. This way the 6 Barton 1999 and Sachs 1999 (as cited by Correa 1999) have acknowledged the need for a differential standard for developing countries. Mashelkar (2001) calls for ‘TRIPS Plus Equity and Ethics’.
44
Agreement would have incorporated development dimension. The Commission’s work could
be instrumental in building such a consensus.
c) Incorporating Specific Provisions for Transfer of Technology
The TRIPs Agreement pays an inadequate attention to the transfer of technology. Access to
technology is increasingly become difficult for developing countries, as observed earlier.
There is need for defining conditions, norms and practices for facilitating transfers of
technology for production of essential drugs and other critical inputs.
d) International Funding R&D Activity in Low Income Countries
One of the ways of compensating the low income countries for the adverse effects of
strengthened IPR regime is to provide increased technical assistance and R&D funding to local
enterprises to help them build local capabilities. One possibility in this respect could be that
developed countries donate (a substantial proportion of) technology license fees collected from
low income countries to a fund created in the respective countries to assist inventive activities of
domestic enterprises. Furthermore, there is need to address the issue of funding R&D on special
problems and tropical diseases that concern low income countries. It has been widely
acknowledged that global pharmaceutical industry has neglected research on tropical diseases
(WHO 2001). The CMH has recommended a donor commitment of $ 27 billion per annum for
the health needs of low-income countries including $ 3 billion per annum for R&D for diseases
of the poor. It is arguable that this funding of $ 3 billion could also help to moderate some
adverse effects on the inventive activity in low-income countries if it is awarded to institutions
and enterprises based in these countries. Therefore, an additional recommendation could be
made in conjunction with those of CMH that the funds would allocated to eligible and
competent institutions and companies of low income countries.
e) Differential Pricing
There has been a lot of discussion on the possibility of improving the access of poorer
countries to patented medicines through differential pricing (see WHO/WTO 2001). There
are a number of practical issues concerned with the differential pricing that need to be
resolved (see Mashelkar 2001). However, this is certainly one of the options to be explored.
45
References
Amsden, A.H. (1989), Asia’s Next Giant: South Korea and Late Industrialization, Oxford: Oxford University Press.
Bercovitz-Rodriguez, Alberto (1990) Historical trends in protection of technology in developed countries and their relevance for developing countries, United Nations: UNCTAD/ITP/TEC/18.
Bosworth, Derek L. (1980) ‘The Transfer of US Technology Abroad’, Research Policy, 9: 378-88. Cohen, W.M. and D.A. Levinthal (1989) ‘Innovation and Learning: The Two Faces of R&D’, The
Economic Journal, 99: 569-96. Cohen, W.M. (1995) ‘Empirical Studies of Innovative Activity’, in Paul Stoneman (ed.), Handbook of
the Economics of Innovation and Technological Change, Oxford: Blackwell; 182-264. Correa, Carlos (1997) 'The TRIPs Agreement: New Intellectual Standards for Intellectual Property:
Impact on Technology Flows and Innovation in Developing Countries', Science and Public Policy, 24(2):79-92.
Correa, Carlos (1999) Review of the TRIPS Agreement: Fostering the Transfer of Technology to Developing Countries, Third World Network (www.twnside.org.sg/title/foster.htm Correa, Carlos (2000a) 'Intellectual Property Rights, the WTO and Developing Countries, The TRIPS
Agreement and Policy Options, Zed Books: London and New York. Correa, Carlos (2000b) 'Reforming the Intellectual Property Rights System in Latin America', The
World Economy, Vol. 23(6), June 2000, pp. 851-872. Chamarik, Saneh and Susantha Goonatilake (eds) (1994) Technological Independence: The Asian
Experience, UNU: Tokya, New York, Paris. Desai, A.V. (1980) 'The Origin and Direction of Industrial R&D in India', Research Policy 9(Jan.
1980), pp. 74-96. Dutfield, Graham (2001) 'Intellectual Property Rights and Development' Policy Discussion Paper,
UNCTAD/ICTSD capacity building project on Intellectual Property Rights and Sustainable Development.
Easterly, William, Robert King, Ross Levine and Sergio Rebelo (1994) ‘Policy, Technology Adoption
and Growth’, NBER Working Paper No. 4681, March 1994. Easterly, William (1999) Explaining Miracles: growth Regressions Meet the Gang of Four
(forthcoming T. Ito and A. Krueger eds. NBER-East Asia Seminar Economics, Volume 4), PRE Paper World Bank.
Eaton, Jonathan and Samuel Kortum (1995) 'Trade in Ideas: Patenting and Productivity in the OECD',
NBER Working Paper No. 5049, NBER: Boston and Washington, D.C. Evenson, Robert E., (1991) Intellectual Property Rights, R&D, Inventions, Technology Purchase, and Piracy in Economic Development: An International Comparative Study, Yale University mimeo. Ferrantino, Milchael J. (1993) ‘The Effect of Intellectual Property Rights on International Trade and
Investment’, Weltwirtschaftliches Archive, 129: 300-31.
46
Fikkert, Brian (1993) An Open or Closed Technology Policy? The Effects of Technology Licensing, Foreign Direct Investment, and Technology Spillovers on R&D in Indian Industrial Sector Firms, Ph.D. Dissertation, Yale University.
Fink, Carsten (2000) How Stronger Patent Protection in India Might Affect the Behaviour of
Transnational Pharmaceutical Industries, Development Research Group, Washington DC., The World Bank.
Fransman, Martin and Kenneth King (eds) (1984) Technological Capability in the Third World, The
Macmillan Press, London. Frischtak, Claudio R. (1989) ‘The Protection of Intellectual Property Rights and Industrial Technology Development in Brazil’, Industry and Energy Working Papers 13, Washington DC: The World Bank. Frischtak, Claudio R. (1992) Harmonization vs. Differentiation in IPR Regimes, The World Bank,
Washington, D.C. Gallini, Nancy T. (1992) 'Patent Policy and Costly Imitation', Rand Journal of Economics 23(1), pp.
52-63. Ginarte, Juan C. and Walter G. Park (1997) 'Determinants of Patent Rights: A Cross-national Study',
Research Policy, 283-301, Gould, David M. and William C. Gruben (1996), Journal of Development Economics, Vol. 48(1996),
Federal Reserve Bank of Dallas, USA, pp. 323-350. Hall, Elizabeth A. (1991) 'The Impact of a Weakened Patent Policy on Development Incentives',
Quarterly Review of Economics and Business, 31(4), pp. 79-88. Haksar, Vikram (1995) ‘Externalities, Growth and Technology Transfer: Application to the Indian Manufacturing Sector, 1975-90’, Washington, DC: International Monetary Fund, mimeo. Hobday, Michael (1995) Innovation in East Asia: The Challenge to Japan, Edward Elgar Publishing
Limited, England and USA. Kim, Linsu (1997) Imitation to Innovation: The Dynamics of Korea's Technological Learning,
Harvard Business School Press, Boston, Massachusetts. Kim, Linsu (2000) 'The Dynamics of Technological Learning in Industrialization', UNU/INTECH
Discussion Papers, # 7, Forthcoming in International Social Science Journal, 2001, Kondo, Edson Kenji (1994) ‘Patent Laws and Foreign Direct Investment: An Empirical Investigation’, PhD dissertation, Boston, MA: Harvard University. Kotabe, Masaaki (1992) 'A Comparative Study of U.S. and Japanese Patent Systems' Journal of
International Business Studies, Vol. 23(1), pp. 147-168. Krugman, Paul (1994) The Myth of East Asian Miracle, Foreign Affairs. Kumar, Nagesh (1996) 'Intellectual Property Protection, Market Orientation and Location of Overseas
R&D Activities by Multinational Enterprises', World Development, 24(4), pp 673-688.
47
Kumar, Nagesh (1999) 'Multinational Enterprises, Overseas R&D Activity and the Global Technological Order', RIS Occasional Paper No. 56, RIS: New Delhi.
Kumar, Nagesh (2000) ‘Explaining the Geography and Depth of International Production: The Case
of US and Japanese Multinational Enterprises’, Weltwirtschaftliches Archiv 136(3):442-76. Kumar, Nagesh (2001) 'Determinants of Location of Overseas R&D Activity of Multinational
Enterprises: The Case of US and Japanese Corporations', Research Policy 30(2001), pp. 159-174.
Kumar, Nagesh (2002) The Quality of Foreign Direct Investment: Determinants and Implications of
WTO, New Delhi: Oxford University Press, forthcoming. Kumar, Nagesh (2002) IPRs and Foreign Direct Investment: Some Quantitative Explorations for US
and Japanese MNEs, New Delhi: Research and Information System for Developing Countries, forthcoming.
Kumar, Nagesh and Mohammed Saqib (1996) ‘Firm Size, Opportunities for Adaptation, and In-house
R&D Activity in Developing Countries: The Case of Indian Manufacturing’, Research Policy, 25(5): 712-22.
Kumar, Nagesh and N.S. Siddharthan (1997) Technology, Market Structure and Internationalization:
Issues and Policies for Developing Countries, UNU/INTECH, Routledge: New York, USA. Kumar, Nagesh and Jayaprakash Pradhan (2002) Reforms, TRIPs and Indian Pharmaceutical
Industry, New Delhi: Research and Information System for Developing Countries, La, Croix, Sumner J. and Akihiko Kawaura (1996) 'Product Patent Reform and its Impact on Korea's
Pharmaceutical Industry', International Economic Journal, 10(1), pp. 109-124. Lall, Sanjaya (1981) Developing Countries in the International Economy, The Macmillan Press,
London Lall, Sanjaya (2000) 'Technological Change and Industrialization In the Asian Newly Industrializing
Economies: Achievements and Challenges' in Kim, Linsu and Nelson Richard R., (eds.) Technology, Learning, and Innovation: Experiences of Newly Industrializing Economies, Cambridge University Press,pp. 13-68.
Lanjouw, Jean O. (1998) 'The Introduction of Pharmaceutical Product Patents in India: Heartless
Exploitation of the Poor and Suffering'? NBER Working Paper Series No. 6366, National Bureau of Economic Research, January 1998.
Lau, Lawrence J. (1999) 'The Sources of East Asian Economic Growth' in Ranis, Gustav, Sheng-
Cheng Hu and Yun-Peng Chu (eds.), The Political Economy of Comparative Development into the 21st Century. vol. 1, Edward Elgar, Cheltenham, U.K. pp. 45-74.
Lee, Jeong-Yeon and Edwin Mansfield (1996) 'Intellectual Property Protection and U.S. Foreign
Direct Investment' The Review of Economics and Statistics, Vol. LXXVIII, No. 2, May 1996. Lee, Won-Yong (2000) 'The Role of Science and Technology Policy in Korea's Industrial
Development' in Kim, Linsu and Nelson Richard R., Technology, Learning, and Innovation: Experiences of Newly Industrializing Economies, Cambridge University Press, pp. 269-290.
48
Levin, R.C, A.K. Klevorick, R.R. Nelson and S.G. Winter (1987) ‘Appropriating the returns from industrial R&D’, Brookings Papers on Economic Activity, 783-820.
Mansfield, Edwin (1986) 'Patents and Innovation: An Empirical Study' Management Science, Vol.
32(2), pp. 173-181, February 1986. Mashelkar, R.A. (2001) ‘Revisiting TRIPS: A Developing World Perspective’, RIS Digest, Vol. 18(1-
3), September 2001, pp. 1-8, New Delhi: RIS Maskus, Keith E. and Mohan Penubarti (1995) 'How Trade-related are Intellectual Property Rights?'
Journal of International Economics 39 (1995) 227-248. Maskus, Keith E. (1998a) 'The International Regulation of Intellectual Property', Weltwirtschaftliches
Archiv, 134(2), pp. 186-208. Maskus, Keith E. (1998b) 'Strengthening Intellectual Property Rights in Asia: Implications for
Australia', Australian Economic Papers 37(3). Maskus, Keith E. and Christine McDaniel (1999) 'Impacts of the Japanese Patent System on
Productivity Growth', Japan and the World Economy, Vol. 11(1999), pp. 557-574. Maskus, Keith E. (2000a) Intellectual Property Rights in the Global Economy, Institute for
International Economics, Washington, D.C. Maskus, Keith E. (2000b) 'Intellectual Property Rights and Foreign Direct Investment', Policy
Discussion Paper No. 0022, University of Adelaide, Australia. May, Christopher (2000) A Global Political Economy of Intellectual Property Rights: The new enclosures? London and New York: Routledge. Mazzoleni, Roberto and Nelson Richard R. (1998) 'The Benefits and Costs of Strong Patent
Protection: A Contribution to the Current Debate' Research Policy No. 27(3), July 1998, pp. 273-84.
McCalman, Philips (2001) ‘Reaping what you sow: An Empirical Analysis of International Patent
Harmonization’, Journal of International Economics 55:161-86. Nelson, Richard R. and Howard Pack (1999) 'The Asian Miracle and Modern Growth', The Economic
Journal, 109 (July): 416-436. Nogues, Julio (1990) 'Patents and Pharmaceuticals Drugs: Understanding the Pressures on Developing
Countries', Journal of World Trade 24(6): World Bank Washington, USA, pp. 81-104. Nogues, Julio J. (1993) 'Social Costs and Benefits of Introducing Patent Protection for Pharmaceutical
Drugs in Developing Countries', The Developing Economies, XXXI-1 (March 1993), The Institute of Developing Economies, Tokya, pp. 24-53.
Pack, Howard and Page, John M. Jr. (1994) Accumulation, Exports, and Growth in the High-
performing Asian Economies, Carnegie-Rochester Conference Series on Public Policy 40(1994) pp. 199-236.
Park, Walter G, and Ginarte, Juan Carlos (1997) 'Intellectual Property Rights and Economic Growth',
Contemporary Economic Policy 15(3), pp. 51-61, The World Bank.
49
Panagariya, Arvind (1999) TRIPs and the WTO: An Uneasy Marriage, Seminar presentation made at the WTO on July 20, 1999.
Raizada, B.K. and Javed Sayed (2002) 'IPR and Drugs and the Pharmaceutical Industry-Concerns for
Developing Countries', in Dasgupta, Amit and Bibek Devroy (eds.), Salvaging the WTO's Future: Doha and beyond, New delhi: Konark, pp. 275-289.
Rapp, Richard T. and Richard P. Rozek (1990) 'Benefits and Costs of Intellectual Property Protection
in Developing Countries', Journal of World Trade 24(5), Washington, D.C., pp. 75-102. Reichman, J.H. (1993) 'Implications of the Draft TRIPS Agreement for Developing Countries as
Competitors in an Integrated World Market', UNCTAD Discussion Paper No. 73, November 1993.
Roffe, Pedro (1998) ‘Control of Anti-competitive Practices in Contractual Licenses under the TRIPs Agreement’, in Correa, Carlos and A.A. Yusuf eds. Intellectual Property and International Trade: The TRIPS Agreement, London: Kluwer Law International. Saggi, Kamal (2000) Trade, Foreign Direct Investment, and International Technology Transfer: A
Survey, WT/WGTI/W/88, World Trade Organization, Working Group on the Relationship between Trade and Investment, Survey of Literature on Trade, Foreign Direct Investment and the Transfer of Technology.
Schankerman, M. (1991) ‘How Valuable is Patent Protection? Estimates by Technology Field Using
Patent Renewal Data’, NBER Working Paper No. 3780. Scherer, F.M. and Jayashree Watal (2001) Post-Trips Options for Access to Patented Medicines in
Developing Countries, CMH Working Paper No. WG4:1. Scherer, F.M. and S. Weisburst (1995) ‘Economic Effects of Strengthening Pharmaceutical Patent
Protection in Italy’, International Review of Industrial Property and Copyright Law, 26(6): 1020-4.
Seyoum, Belay (1996) ‘The Impact of Intellectual Property Rights on Foreign Direct Investment’,
Columbia Journal of World Business 31(1), pp. 50-59. Singh, Ajit (1995) 'How East Asia Grew So Fast?: Slow Progress Towards an Analytical Consensus,
RIS Occasional Paper No. 46, New Delhi: RIS. Singh, Nirvikar and Trieu (1996) 'The Role of R&D in Explaining Total Factor Productivity Growth
in Japan, South Korea, and Taiwan', Working Paper Series # 362, Department of Economics, University of California, Santa Cruz.
Smith, Pamela J. (2001) How Do Foreign Patent Rights Affect U.S. Exports, Affiliate Sales, and
Licenses?, Journal of International Economics, Vol. 55(2), pp. 411-439. Stoneman, Paul (ed.) (1995) Handbook of the Economics of Innovation and Technological Change,
Oxford UK & Cambridge USA: Blackwell Handbooks in Economics, Subramanian, A. (1994), ‘Putting Some Numbers on the TRIPs Pharmaceutical Debate’, International
Journal of Technology Management. Subramanian, A. (1999) India as User and Creator of Intellectual Property: The Challenges Post-
Seattle, paper presented at a conference WTO 2000, The World Bank, New Delhi,
50
Suh, Jongae (2000) Korea's Innovation System: Challenges and New Policy Agenda, UNU/INTECH DP. 2000-04, Maastricht.
Thompson, Mark A. and Rushing Frincis W. (1996) 'An Empirical Analysis of the Impact of Patent
Protection on Economic Growth', Journal of Economic Development 21(2), December 1996, pp. 61-79.
Thompson, Mark A. and Rushing, Francis W. (1999) ' An Empirical Analysis of the Impact of Patent
Protection on Economic Growth: An Extension', Journal of Economic Developmen 24(1), June 1999, pp. 67-76.
Thomas, Vinod and Yan Wang (1996) 'Distortions, Interventions, and Productivity Growth: Is East
Asia Different?, Economic Development and Cultural Change', pp. 265-288. UN (1964) 'The Role of Patents in the Transfer of Technology to Developing Countries,' Report of the
Secretary-General, New York: United Nations, Department of Economic and Social Affairs. UNCTAD (1975) The Role of the Patent System in the Transfer of Technology to Developing
Countries, New York: United Nations. UNCTAD (1996) Financial and Other Implications of the Implementation of the TRIPs Agreement
for Developing Countries, UNCTAD Secretariat. UNCTAD (1996) 'The TRIPs Agreement and Developing Countries, UNCTAD/ITE/1, United
Nations, pp. 1-4. UNDP (2001) Human Development Report, New York: United Nations Development Programme,
July 2001. US GAO (1987) International Trade: Strengthening Worldwide Protection of Intellectual Property
Rights, Report to Selected Congressional Subcommittees, GAO/NSIAD-87-65, April 1987. US Senate (1957) The Patent System and the Modern Economy, Study of the Subcommittee on
Patents, Trademarks, and Copyrights of the Committee on the Judiciary United States Senate: Eighty-Fourth Congress, Second Session, S. Rs. 167, Study No. 2, Washington DC
Vishwasrao, Sharmila (1993) 'Intellectual Property Rights and the Mode of Technology Transfer',
Journal of Development Economics 44 (1994) pp. 381-402. WTO (2001) TRIPs and Pharmaceutical Patents, World Trade Organization, April 2001. WHO (2001) Commission on Macroeconomics and Health: Report, Geneva: The World Health Organization, 20 December 2001. WHO/WTO (2001) Report of the Workshop on Differential Pricing and Financing of Essential Drugs, Hosbjor, Norway, 8-11 April. Wade, Robert (1990) Governing the Market: Economic Theory and the Role of Government in East
Asian Industrialization, Princeton, NJ: Princeton University Press, New Jersey. Watal, Jayashree (1998) 'The TRIPS Agreement and Developing Countries--Strong, Weak or
Balanced Protection?' The Journal of World Intellectual Property, Vol. 1, March 1998, pp. 282-307.
51
Watanabe, Susumu (1985) 'The Patent System and Indigenous Technology Development' in the Third World in James, Jeffrey and Susumu Watanabe (eds), Technology, Institutions and Government Policies, Macmillan series of ILO studies, Macmillan Press, London, pp. 217-257.
Watal, Jayashree (2000) 'Pharmaceutical Patents, Prices and Welfare Losses: Policy Options for India
Under the WTO TRIPS Agreement', The World Economy, Vol. 23, No. 5: 733-752. Watal, Jayashree (2001) Intellectual Property Rights in the WTO and Developing Countries, Oxford
University Press, New York. Westphal, Larry E.K' (2000) 'Industrialization Meets Globalization: Uncertain Reflections on East
Asian Experience', UNU/INTECH Discussion Paper # 8, Maastricht. World Bank, (1993) 'The East Asian Miracle: Economic Growth and Public Policy', A World Bank
Policy Research Report, Oxford University Press, New York. World Bank (1999) World Development Report 1998/9, Washington DC: the World Bank. World Bank (2002) Global Economic Prospects and Developing Countries 2002, Washington DC:
The World Bank. Young, Alwyn (1993) ‘Lessons from the East Asian NICS: A Contrarian View’, NBER Working
Paper No. 4482, October 1993, Cambridge. Young, Alwyn (1995) 'The Tyranny of Numbers: Confronting the Statistical Realities of the East
Asian Growth Experience', The Quarterly Journal of Economics, Vol. 110(3), pp. 641-680. Yang, Guifang and Keith E. Maskus 'Intellectual Property Rights and Licensing: An Econometric
Investigation', Weltwirtschaftliches Archiv, 137(1), 2001.
52