study progress, review of modeling framework and … seshu created date 4/19/2018 1:37:59 pm
TRANSCRIPT

Eve Halper
Water Resources Planner
Bureau of Reclamation
Project Team Meeting #8
April 2, 2018
Study Progress,
Review of
Modeling Framework
and Next Steps
Lower Santa Cruz River
Basin Study:

Benefits and Costs
Present Present
Future without
Additional Adaptation
Future with
Additional Adaptation
Project
imbalances
Step 1 Step 3
Adaptation
strategies
Trade-off
analysis
Step 4
Evaluate
Risks
Step 2
Study Process Overview
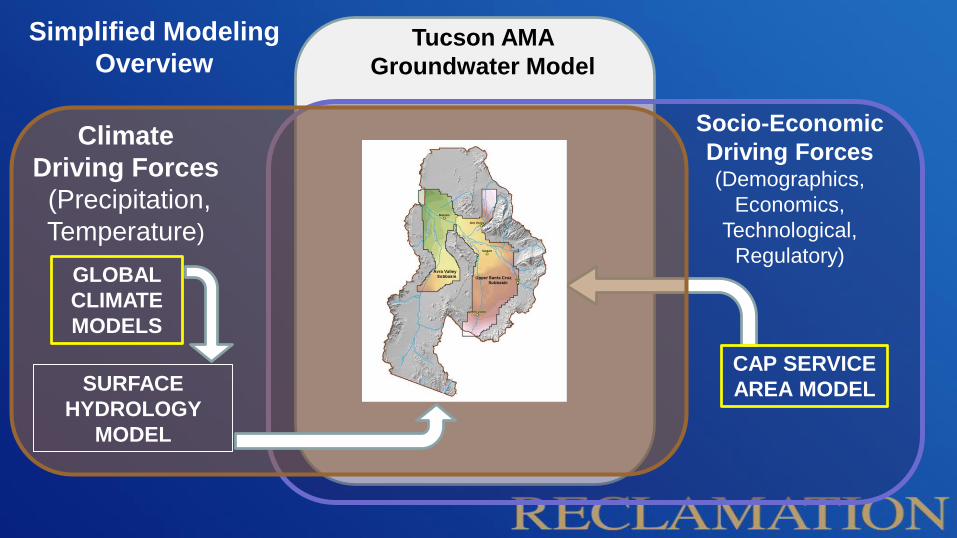
Tucson AMA
Groundwater Model
Socio-Economic
Driving Forces(Demographics,
Economics,
Technological,
Regulatory)
CAP SERVICE
AREA MODEL
Climate
Driving Forces
(Precipitation,
Temperature)
GLOBAL
CLIMATE
MODELS
SURFACE
HYDROLOGY
MODEL
Simplified Modeling
Overview

Now 2060
T, P
Basin Climate
Now 2060
T, P Worse Case /
Higher Risk
Future
Best Case /
Lower Risk
Future
Downscaled
Climate Projection
Global Climate
Model (GCM)
Which GCM(s) and Downscaling
Method(s) are appropriate for our Study?
Emissions Scenarios
Worse
Case /
Higher
Risk
Best
Case /
Lower
Risk
Emissions Scenarios
LSCR Basin Study
Climate Modeling Detail
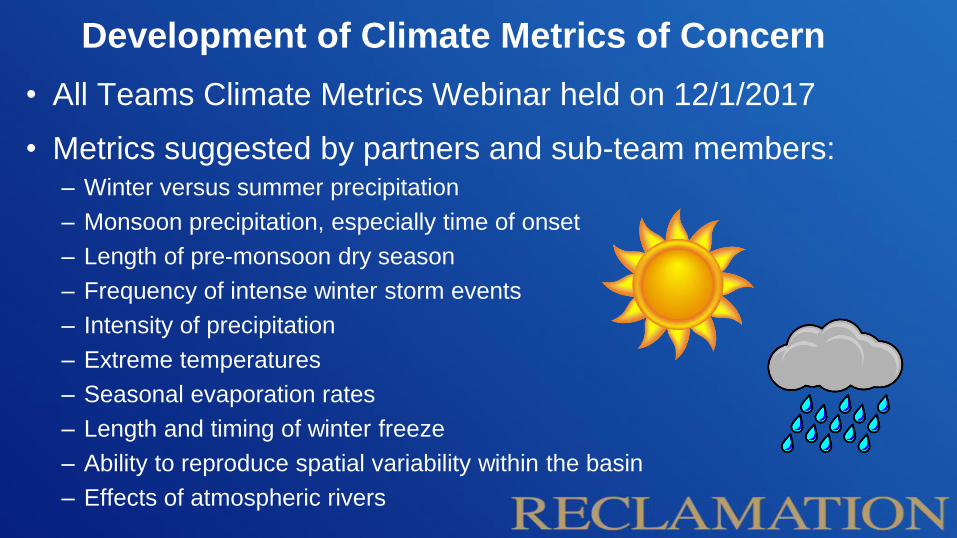
• All Teams Climate Metrics Webinar held on 12/1/2017
• Metrics suggested by partners and sub-team members:– Winter versus summer precipitation
– Monsoon precipitation, especially time of onset
– Length of pre-monsoon dry season
– Frequency of intense winter storm events
– Intensity of precipitation
– Extreme temperatures
– Seasonal evaporation rates
– Length and timing of winter freeze
– Ability to reproduce spatial variability within the basin
– Effects of atmospheric rivers
Development of Climate Metrics of Concern

Together these compose
the length of the dry season
• From partner / stakeholder input, UA / Reclamation Technical
Team selected 5 key metrics:
– Average monthly precipitation (winter vs. summer precipitation)
– Extreme precipitation events by month (precip intensity & frequency)
– Extreme monthly temperatures
– Date of Monsoon Onset
– Date of Last Winter Storm
Development of Climate Metrics of Concern, con’t

Tucson AMA
Groundwater Model
Socio-Economic
Driving Forces(Demographics,
Economics,
Technological,
Regulatory)
CAP SERVICE
AREA MODEL
Climate
Driving Forces
(Precipitation,
Temperature)
GLOBAL
CLIMATE
MODELS
SURFACE
HYDROLOGY
MODEL
Simplified Modeling
Overview Recap

This step is performed by
water providers within the
Demand Sub-teams
Total
Demand
per Unit
Time
Well
A
Well
B
Period 1 A1 B1
Period 2 A2 B2
Period 3 A3 B3
Demand Scenario X –
Example: Metro Water
Water
Provider
Total
Demand
per Unit
Time
Tucson Water Y(TW)
Metro Water Y(Metro)
Marana Water Y(Marana
Demand Scenario XCAP
Service
Area
Model
Demand Scenario
Driving Forces
Demand Scenario 2
Slow Compact Growth
.
Demand Scenario 3
Slow Outward Growth
.
Demand Scenario 1
Baseline
.
Demand Scenario 4
Rapid Outward Growth
.
Demand Scenario 5
Rapid Outward Growth Plus
Mining and no
Replenishment
Demand Scenario Summary
Low growth series:
condensed growth pattern,
no additional mines,
no overdraft in Green Valley
Medium growth series:
outward growth pattern,
new mine development,
replenish Green Valley
Medium growth series
High growth series:
outward growth pattern,
new mine development,
replenish Green Valley
High growth series:
outward growth pattern,
mining growth,
no replenishment in Green Valley
Municipal Demand:
Population Growth RateLow Series Medium Series Medium High Series High Series
Municipal Demand:
Infill vs. Outward GrowthIn-Fill/Redevelopment Slow Outward Official Projection Rapid Outward Rapid Outward
Municipal Demand:
Gallons Per Household Unit
Per Day
Decline faster than expected Decline as expected Decline as expectedNo change in current
GPHUDNo change in current GPHUD
Municipal Demand:
Additional recharge Year 2020 Year 2030
per current CAP-SAM
assumptionsYear 2030 Never
Municipal Demand:
Develop Ag Land or
Undeveloped Land
Low GPHUD development
tends to replace high water
use ag land.
CAP-SAM Baseline Official Projection
Higher GPHUD development
occurs on undeveloped land
before replacing agriculture
Higher GPHUD development
occurs on undeveloped land
before replacing agriculture
Agricultural Demand:
Consumptive Use (CU) Crop
Some ag areas convert to low
CU cropsNo change in CU crops Official Projection
Some ag areas convert to
higher CU crops
Some ag areas convert to higher
CU crops
Agricultural Demand:
Groundwater Savings
Projects
Highest savings start 2018 Highest savings start in
2018
per current CAP-SAM
assumptions
Half of highest savings start
in 2025 No savings
Industrial Demand:
Manufacturing
Slow economic growth and/or
greatly improved water use
efficiency
Moderate economic growth
within existing water service
areas, expected
improvements in efficiency
Official Projection
Rapid economic growth that
depends on groundwater,
minimal improvements in
efficiency
Rapid economic growth that
depends on groundwater,
minimal improvements in
efficiency
Industrial Demand:
MiningNo new mines New mine in 2020-2030 Official Projection
New mine in 2020-2030,
Existing mines expand
New mine in 2020,
Existing mines expand
Environment's Demand:
Riparian Evapotranspiration
Changes with climate and
availability of surface water
and shallow groundwater
Changes with climate and
availability of surface water
and shallow groundwater
Official Projection
Changes with climate and
availability of surface water
and shallow groundwater
Changes with climate and
availability of surface water and
shallow groundwater
Low Risk High Risk
CAP:SAM to Groundwater Model Detail

• Complete Evaluation of Climate Models for Best Case / Lower
Risk and Worse Case / Higher Risk Emissions Scenarios
• UA / Reclamation Technical Team will recommend the
downscaled projections to use for each case to Project Team
• Project Team can approve selection or ask for modifications
Next Steps - Climate

• When the combinations of climate and demand scenarios have been
selected, CAP staff will complete CAP:SAM model runs and provide
total demand values through time to water providers
• As part of the demand sub-teams’ activities, water providers will
develop information on which wells would be pumped through time
given the demand projected by the CAP:SAM
• This information will be provided to a groundwater modeler in
Reclamation’s Technical Service Center for input into the Tucson
Active Management Area Groundwater Model
Next Steps – CAP:SAM Results
• Reclamation’s Lower Colorado Regional Director approved request
• Memo has been forwarded to Reclamation’s Policy Office
• No word on when a response will be received
Update on Time Extension / Budget Request

Questions?